Global Population Demographics & Map Template for PowerPoint & Google Slides
Description
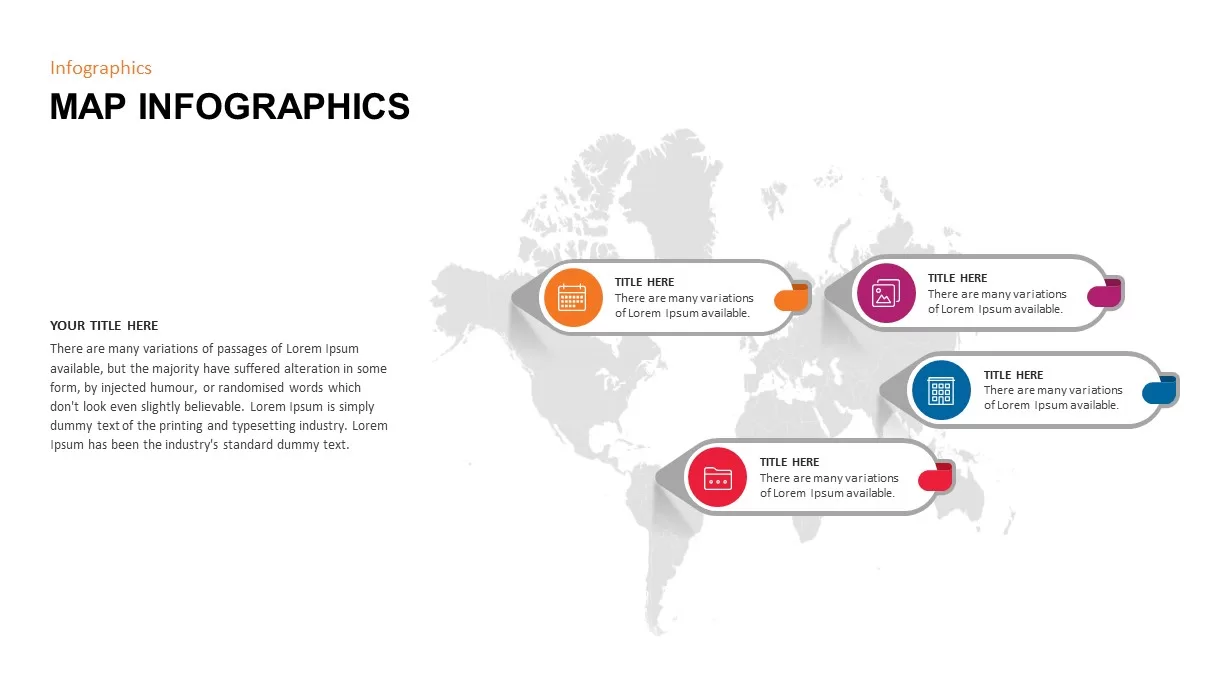
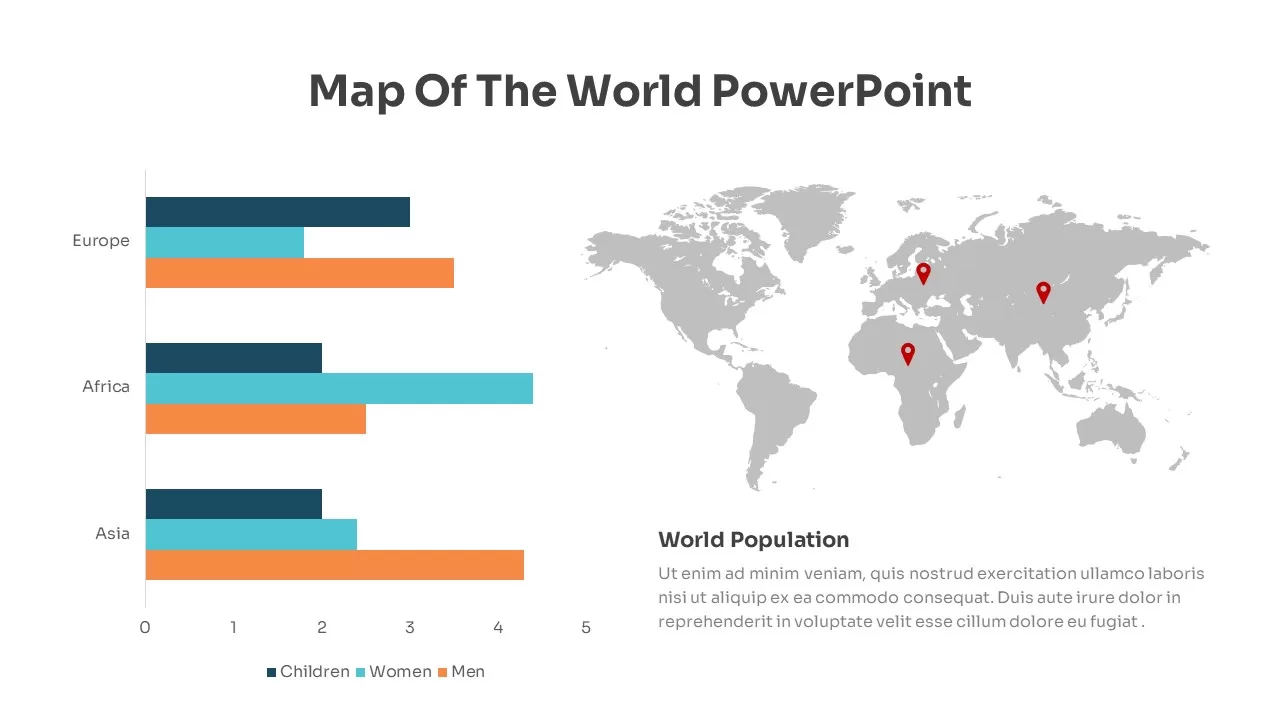
Visualize global population breakdowns with this dual infographic slide combining a bar chart and a world map. The left side features horizontal bars for Children, Women, and Men across key regions—Europe, Africa, and Asia—using distinct teal, cyan, and orange fills. On the right, a grayscale world map highlights three regional callouts with red pins and an editable “World Population” text block below for context.
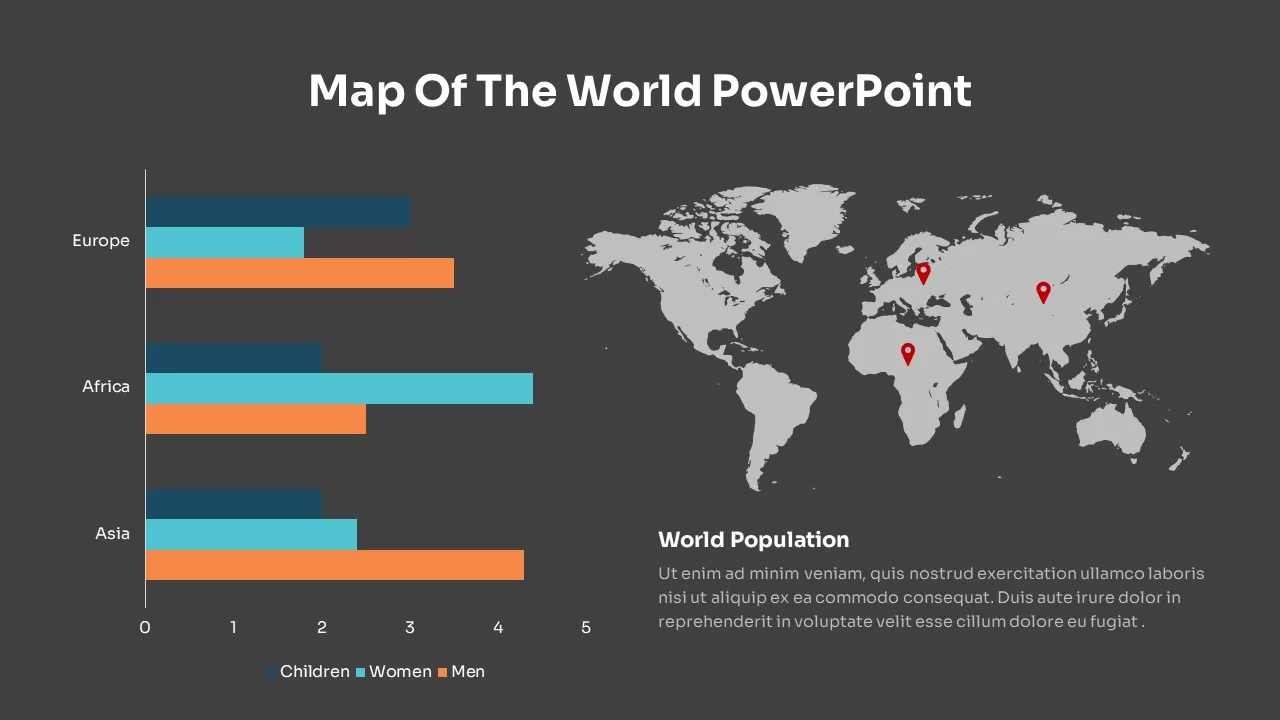
Built on master slides for both PowerPoint and Google Slides, every element is vector-based for seamless resizing, recoloring, and text updates. Swap out regional labels, adjust chart data, or relocate map pins without disrupting the layout. The light-theme default employs clean typography and subtle drop shadows, while an included dark-theme variant ensures high contrast in any setting.
Ideal for market-entry analyses, demographic presentations, and executive briefings, this template accelerates your storytelling. Duplicate the slide to compare multiple datasets, overlay additional callouts for emerging markets, or integrate into broader strategy decks. With intuitive placeholders and drag-and-drop elements, you can focus on insights rather than formatting.
Who is it for
Business analysts, market researchers, and strategy consultants will leverage this slide to present population metrics by region. Marketing directors, development planners, and executive teams benefit from clear, data-driven geographic visuals.
Other Uses
Beyond population data, repurpose the layout for sales-territory performance, regional revenue comparisons, or epidemiological trend mapping. Adjust bar labels and pin locations to suit any global dataset.
Login to download this file

Item ID
SB02485
Related Templates

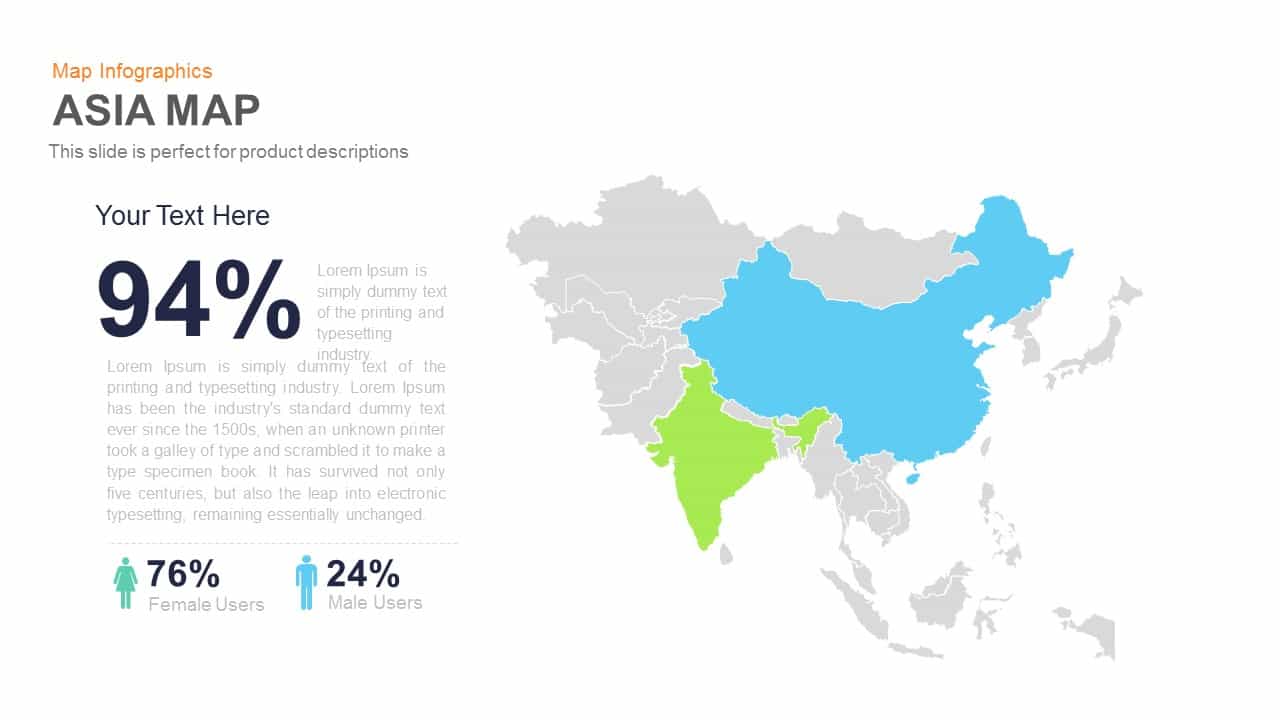
Asia Map Infographic with Demographics template for PowerPoint & Google Slides
World Maps
Premium
Interactive US Population Data Map Slide Template for PowerPoint & Google Slides
World Maps
Premium
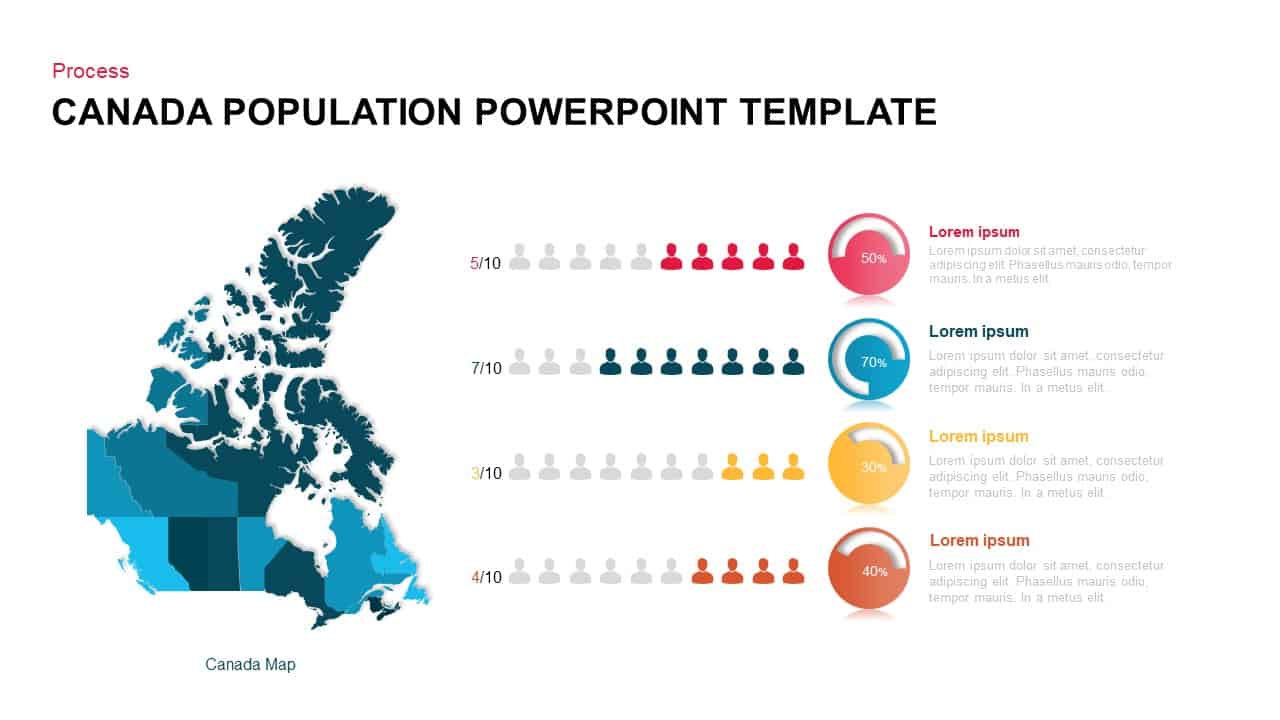
Canada Population Infographics Template for PowerPoint & Google Slides
World Maps
Premium
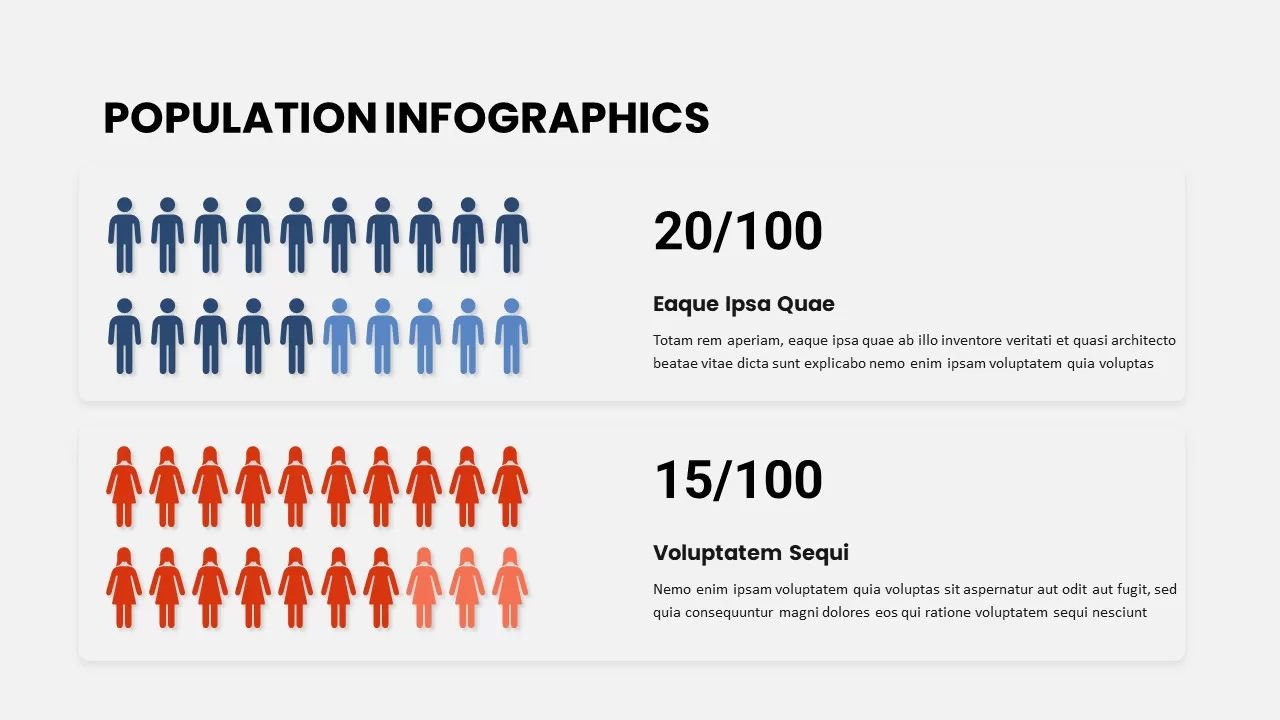
Population Infographics template for PowerPoint & Google Slides
Comparison
Premium
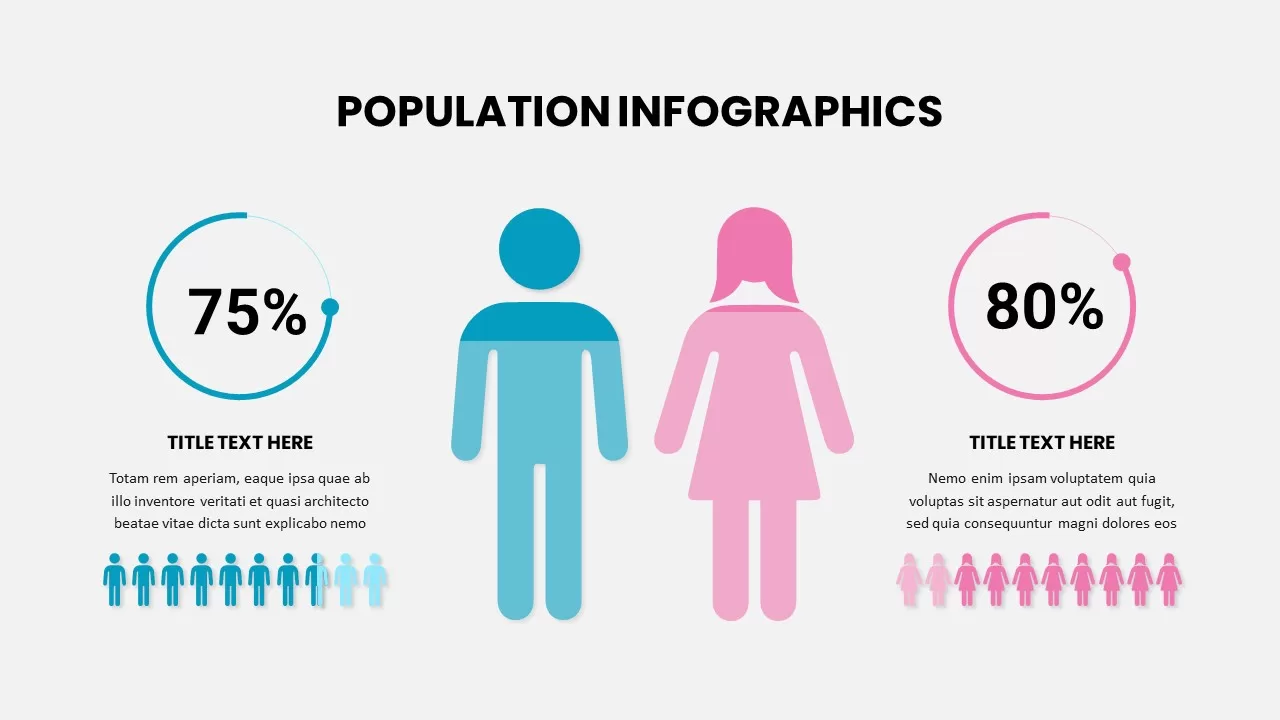
Population Infographic Template for PowerPoint & Google Slides
Comparison
Premium
Population Pyramid Chart Analysis Template for PowerPoint & Google Slides
Bar/Column
Premium
Population Age Distribution Pyramid Chart Template for PowerPoint & Google Slides
Pyramid
Premium

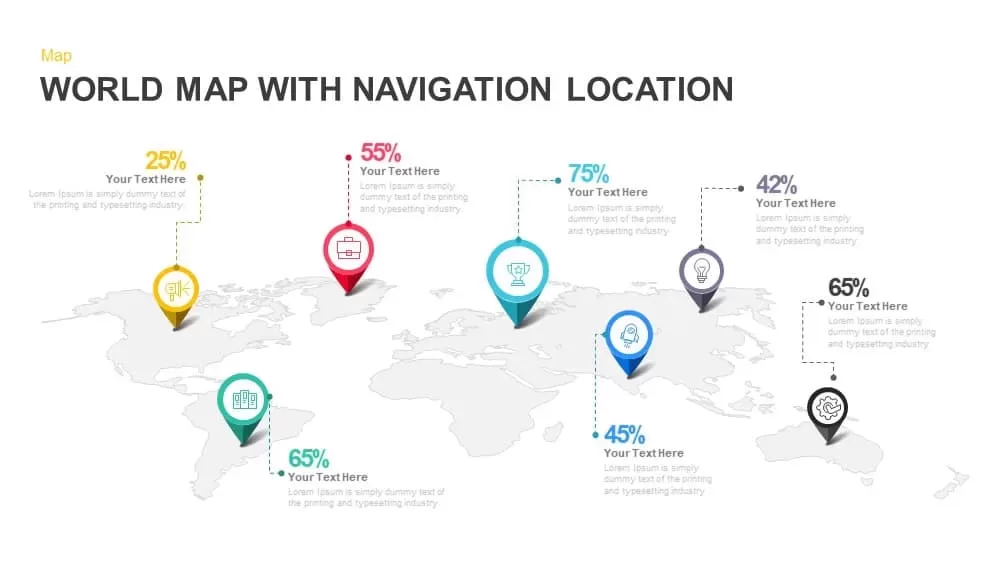
Global Map with Location Markers Template for PowerPoint & Google Slides
World Maps
Premium
Free Global Market Distribution Map Template for PowerPoint & Google Slides
World Maps
Free
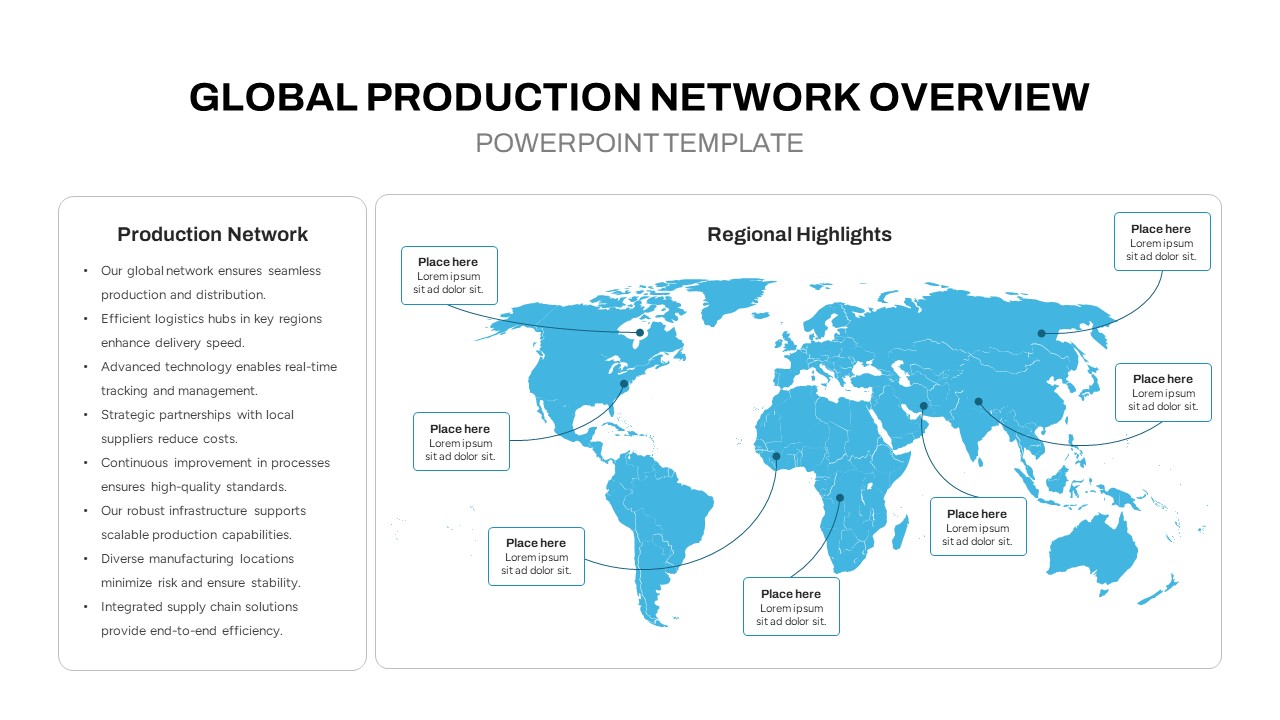
Global Production Network Overview Map Template for PowerPoint & Google Slides
World Maps
Premium
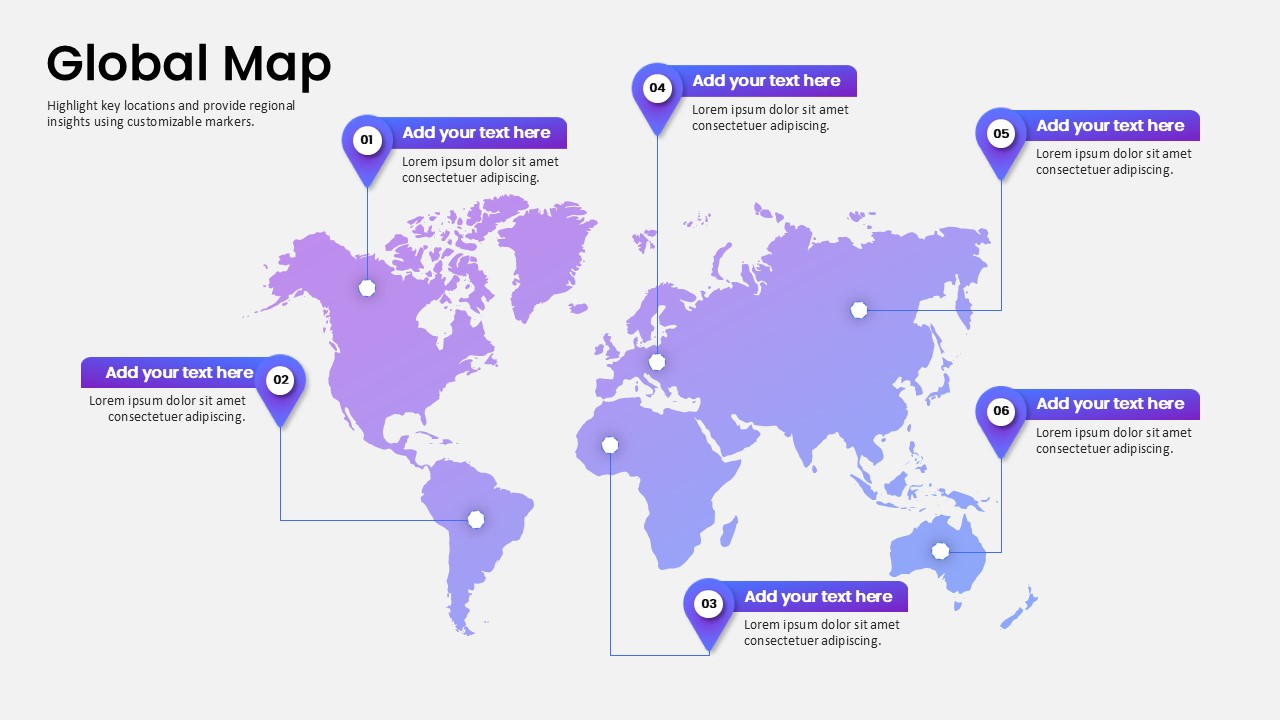
Global Map Highlighting Key Locations template for PowerPoint & Google Slides
World Maps
Premium
Global Map with Pinpoint Markers template for PowerPoint & Google Slides
Business
Premium
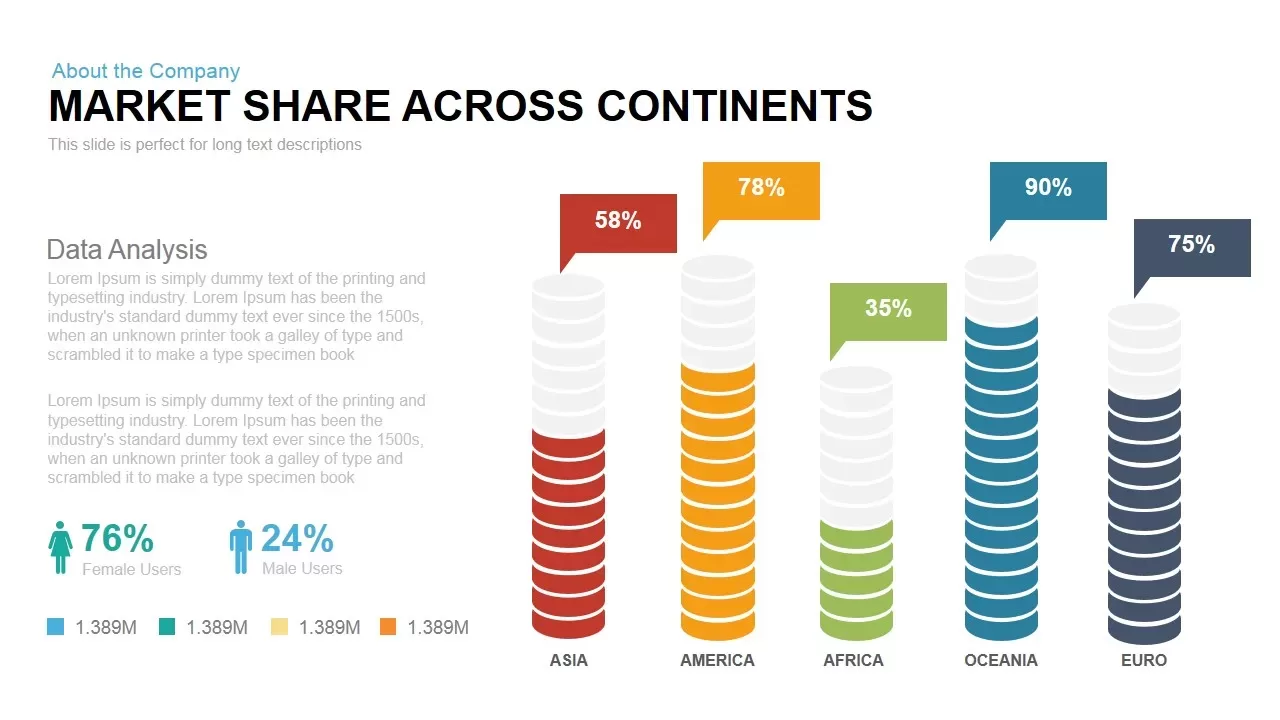
Global Market Share Cylinder Chart Template for PowerPoint & Google Slides
Bar/Column
Premium
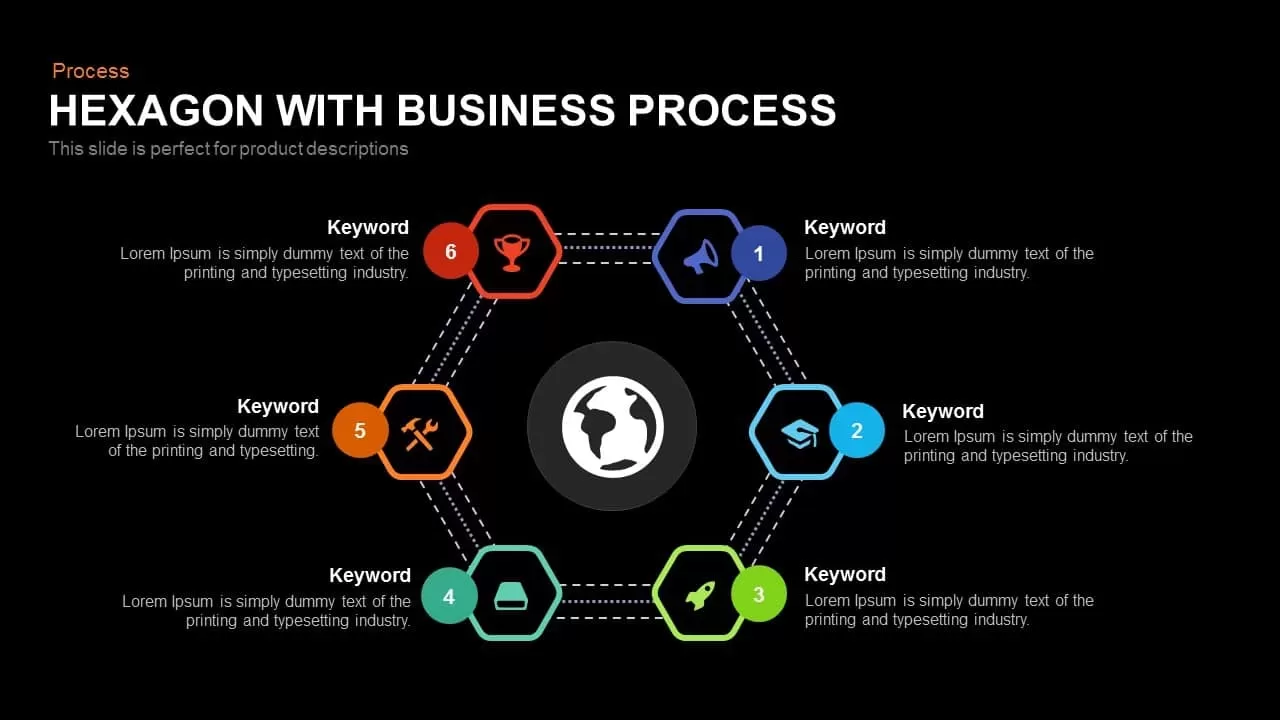
Global Hexagon Six-Step Business Process Template for PowerPoint & Google Slides
Process
Premium
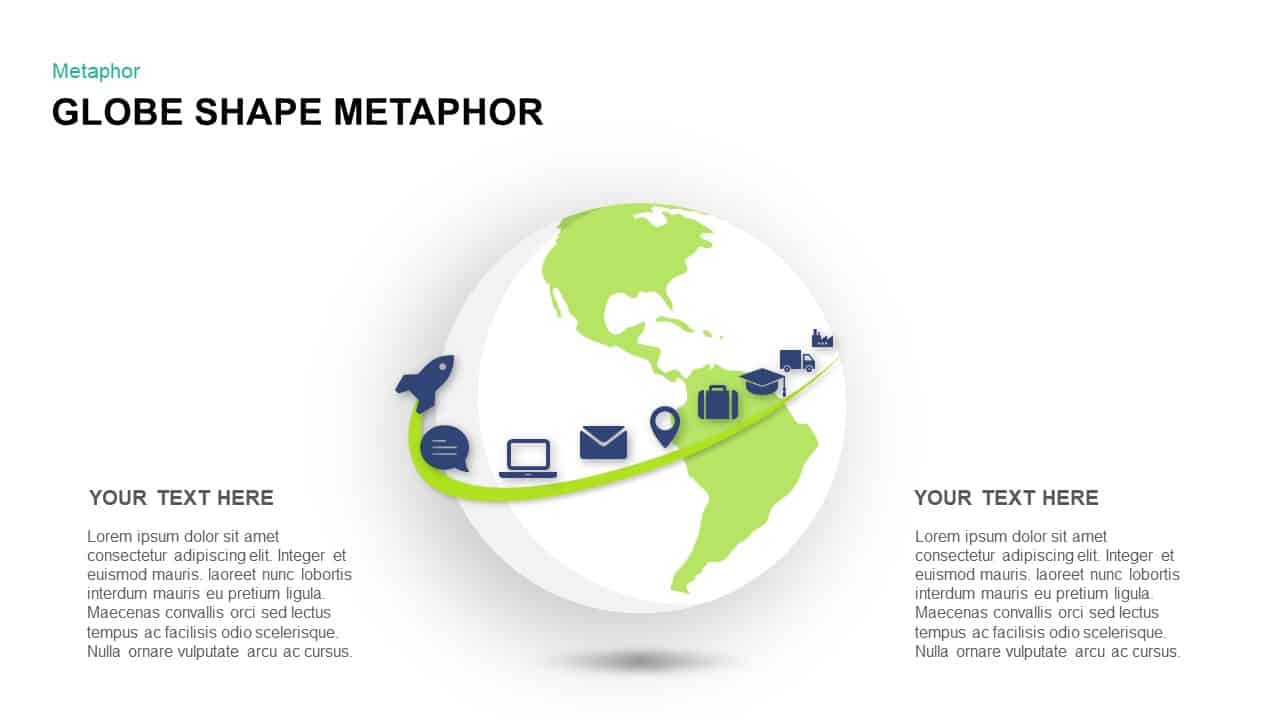
Global Business Pathway Metaphor Template for PowerPoint & Google Slides
Opportunities Challenges
Premium
Statistics & Global Metrics Infographic Template for PowerPoint & Google Slides
Bar/Column
Premium
Free Global Warming Infographic Comparison Template for PowerPoint & Google Slides
Comparison Chart
Free

Modern Global Travel Presentation Template for PowerPoint & Google Slides
Decks
Premium
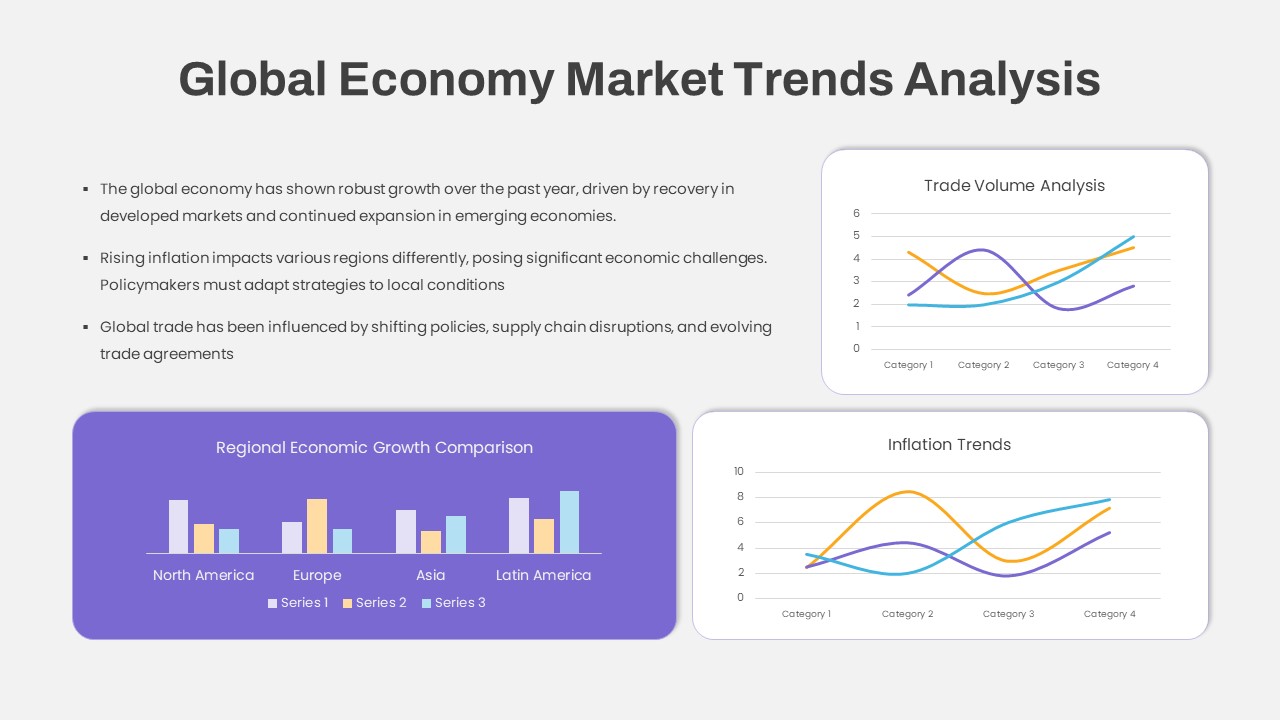
Global Economy Market Trends Analysis Template for PowerPoint & Google Slides
Comparison Chart
Premium
Free Dynamic Global Warming Presentation Template for PowerPoint & Google Slides
Pitch Deck
Free
Global Health Initiatives Presentation Template for PowerPoint & Google Slides
Health
Premium
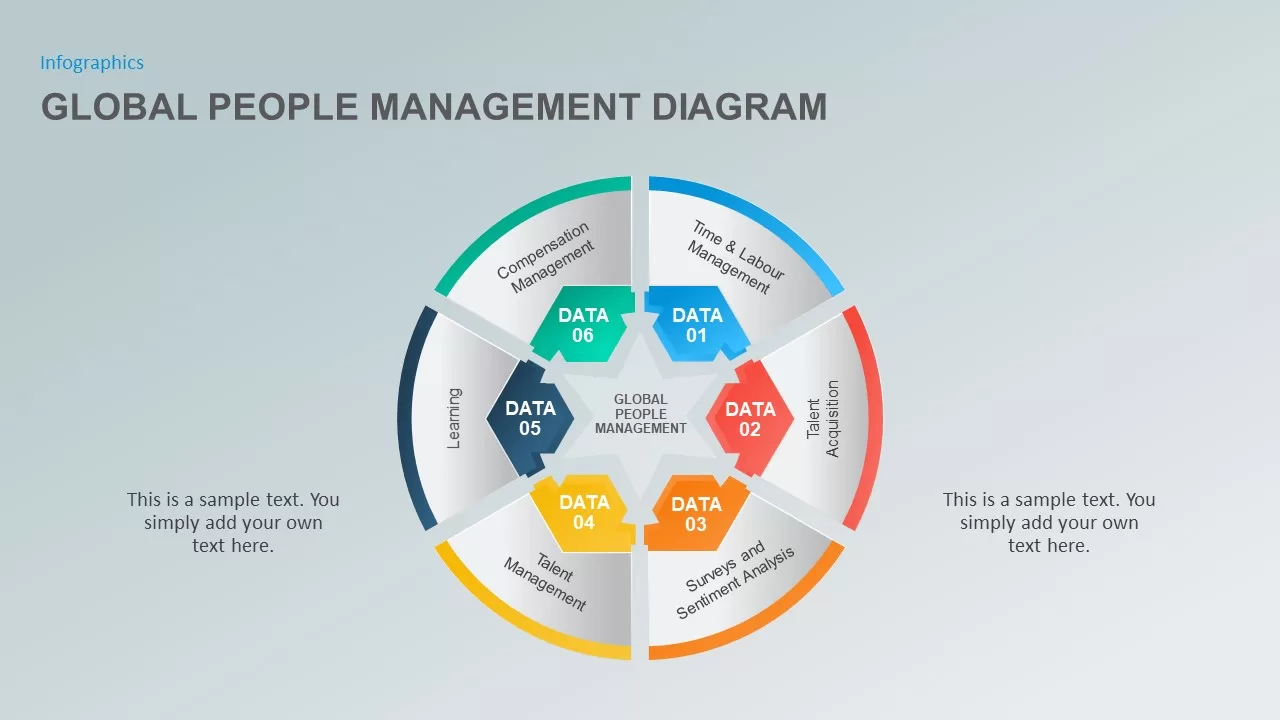
The Global People Management Diagram for PowerPoint & Google Slides
Business Models
Premium
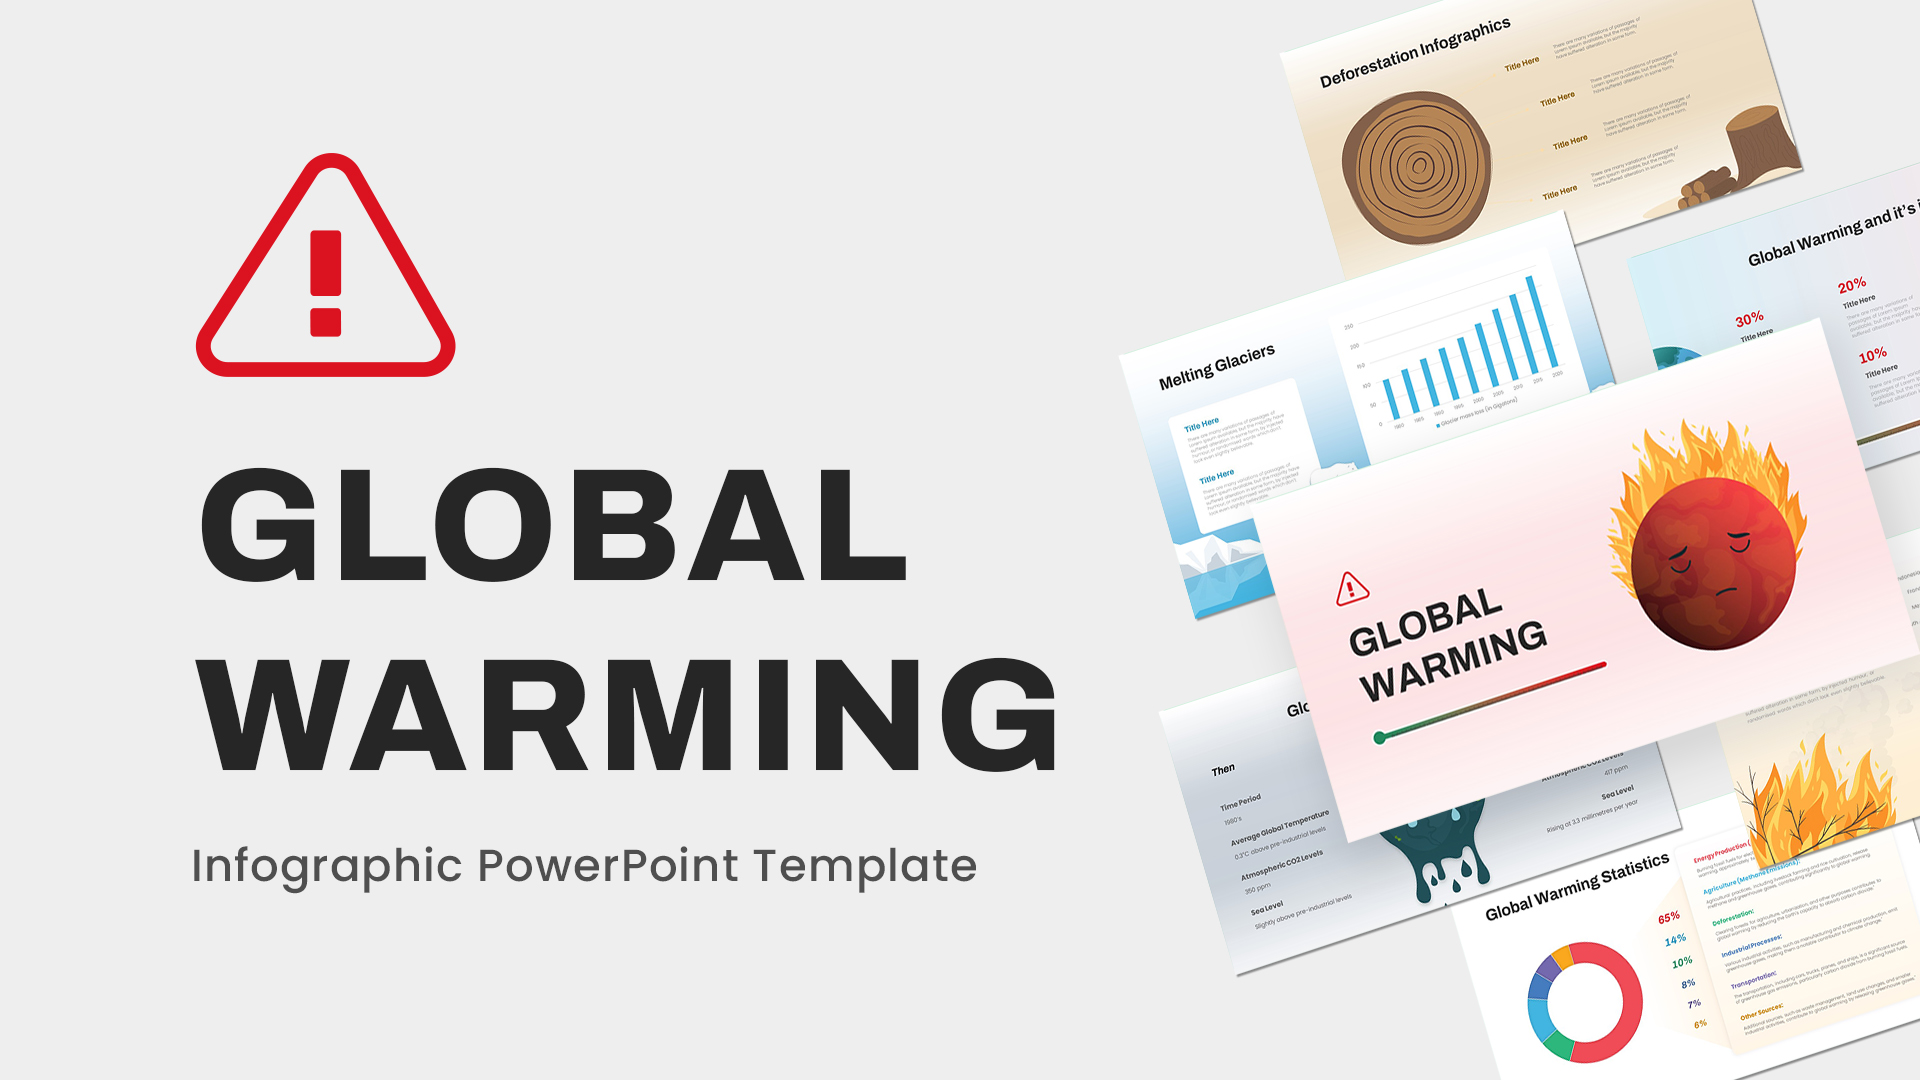
Global Warming Infographic for PowerPoint & Google Slides
Infographics
Premium
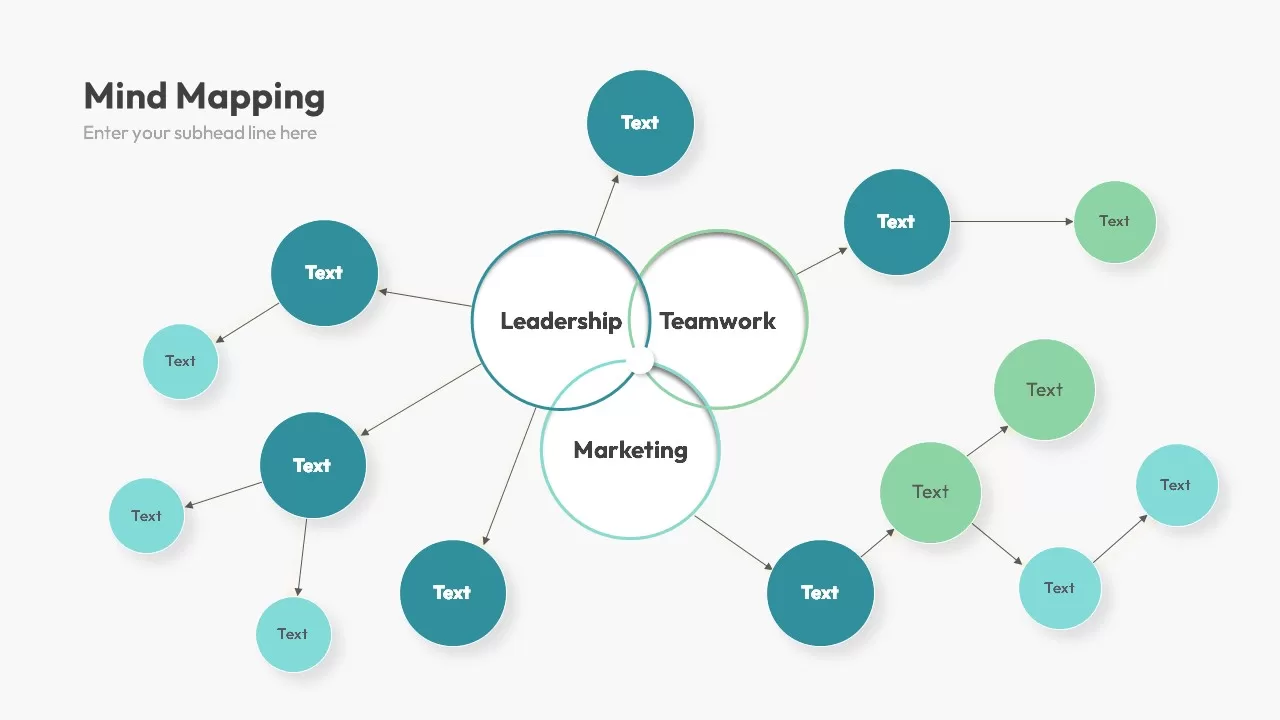
Mind Map PowerPoint template for PowerPoint & Google Slides
Mind Maps
Premium
Editable Colombia Map PowerPoint Template for PowerPoint & Google Slides
Business Models
Premium
World Map Data template for PowerPoint & Google Slides
World Maps
Premium
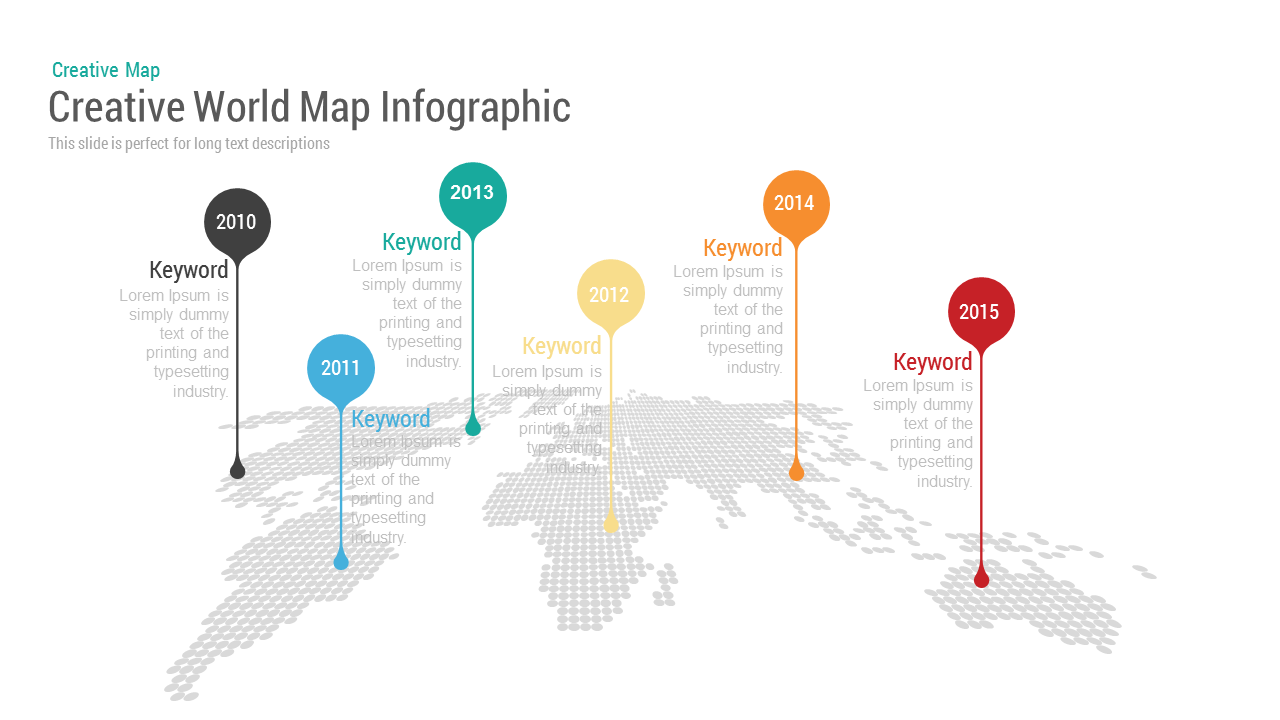
Creative World Map template for PowerPoint & Google Slides
World Maps
Premium
Africa Country Map Infographic Template for PowerPoint & Google Slides
World Maps
Premium
Asia Map with KPI Metrics and Legend Template for PowerPoint & Google Slides
World Maps
Premium
Diamond Mind Map Diagram Four Branches Template for PowerPoint & Google Slides
Mind Maps
Premium

Simple Multi-Branch Mind Map Template for PowerPoint & Google Slides
Mind Maps
Premium
Customizable USA Map With State Markers Template for PowerPoint & Google Slides
World Maps
Premium
Austria Map With State Markers Template for PowerPoint & Google Slides
World Maps
Premium
Argentina Province Map Markers Template for PowerPoint & Google Slides
World Maps
Premium
Venezuela Map with States and Regions Template for PowerPoint & Google Slides
World Maps
Premium
Azerbaijan Map with Provinces & Callouts Template for PowerPoint & Google Slides
World Maps
Premium
Road Map with Achievements Milestones Template for PowerPoint & Google Slides
Roadmap
Premium
Myanmar (Burma) Provincial Map Infographic Template for PowerPoint & Google Slides
Maps
Premium
Nepal Map with Zones Infographic Template for PowerPoint & Google Slides
Maps
Premium
North Korea Map with Provinces Infographic Pack Template for PowerPoint & Google Slides
Maps
Premium
Pakistan Provinces Map Infographic Pack Template for PowerPoint & Google Slides
Maps
Premium
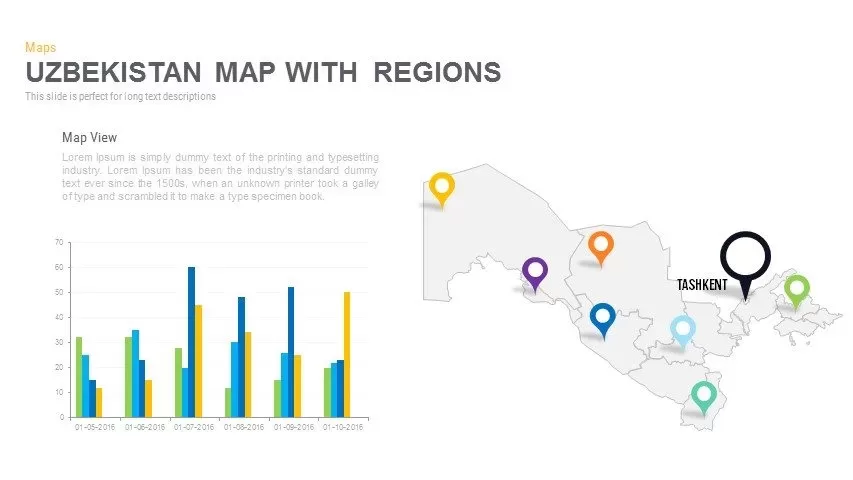
Uzbekistan Map with Regions Pack Template for PowerPoint & Google Slides
Maps
Premium
Vietnam Provinces Map Infographic Pack Template for PowerPoint & Google Slides
Maps
Premium
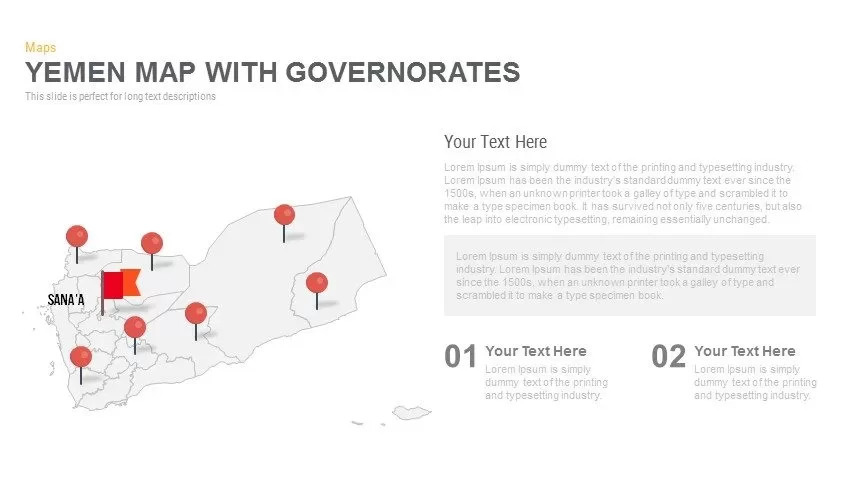
Yemen Governorates Infographic Map Template for PowerPoint & Google Slides
Maps
Premium
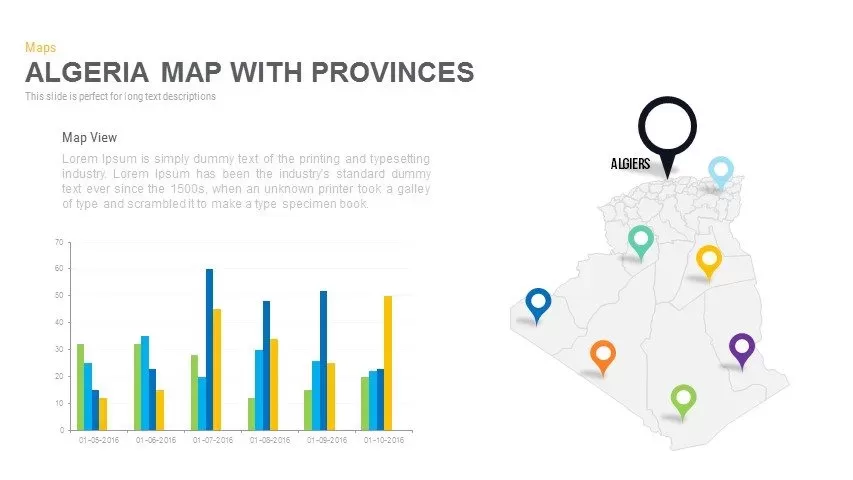
Algeria Map with Provinces Pack Template for PowerPoint & Google Slides
Maps
Premium
Angola Provinces Map Slide Pack Template for PowerPoint & Google Slides
World Maps
Premium
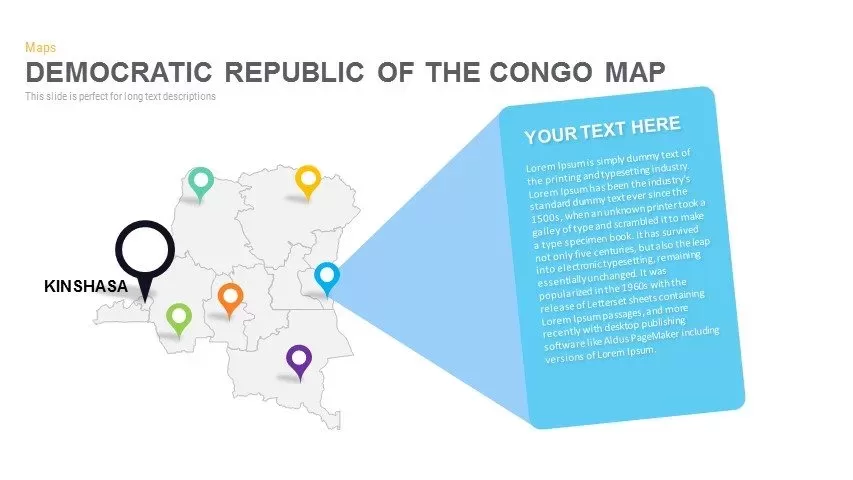
DR Congo Prefecture Map Slide Pack Template for PowerPoint & Google Slides
World Maps
Premium
Egypt Regional Map Slide Pack Template for PowerPoint & Google Slides
World Maps
Premium
Ethiopia Map with Regions Slide Pack Template for PowerPoint & Google Slides
World Maps
Premium
Iran Map with Provinces Slide Pack Template for PowerPoint & Google Slides
World Maps
Premium

Road Map Timeline Presentation template for PowerPoint & Google Slides
Roadmap
Premium

Multi-Cluster Mind Map Infographic Template for PowerPoint & Google Slides
Mind Maps
Premium
Mind Map Infographics template for PowerPoint & Google Slides
Mind Maps
Premium

Modern World Map Callout Infographic Template for PowerPoint & Google Slides
World Maps
Premium
Eight-Node Mind Map Infographic Diagram Template for PowerPoint & Google Slides
Mind Maps
Premium
Six-Stage Road Map Infographic Timeline Template for PowerPoint & Google Slides
Roadmap
Premium
Versatile Mind Map Infographic Template for PowerPoint & Google Slides
Mind Maps
Premium
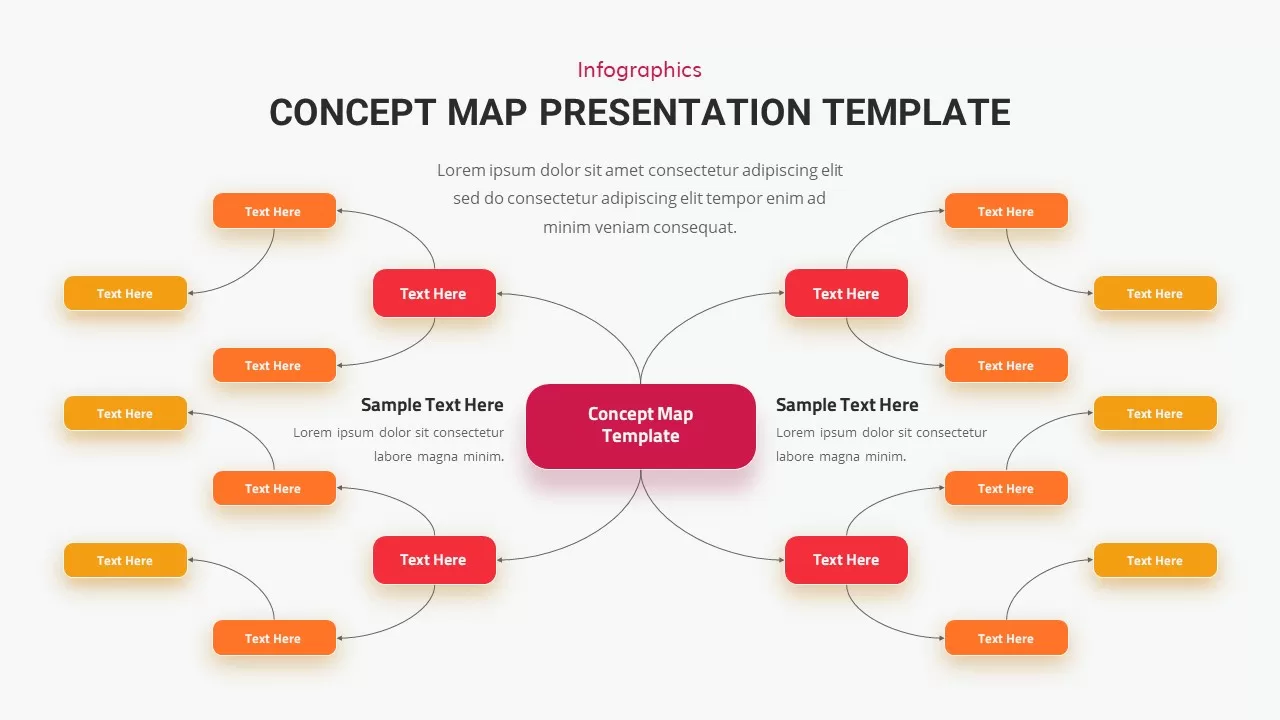
Concept Map Presentation Template for PowerPoint & Google Slides
Mind Maps
Premium
Structured Mind Map Infographic Diagram Template for PowerPoint & Google Slides
Mind Maps
Premium
Dual Topic Mind Map Infographic Template for PowerPoint & Google Slides
Mind Maps
Premium
Tri-Cluster Mind Map Infographic Template for PowerPoint & Google Slides
Mind Maps
Premium
Editable World Map Callout Infographic Template for PowerPoint & Google Slides
World Maps
Premium
Editable World Map Callout Infographic Template for PowerPoint & Google Slides
World Maps
Premium
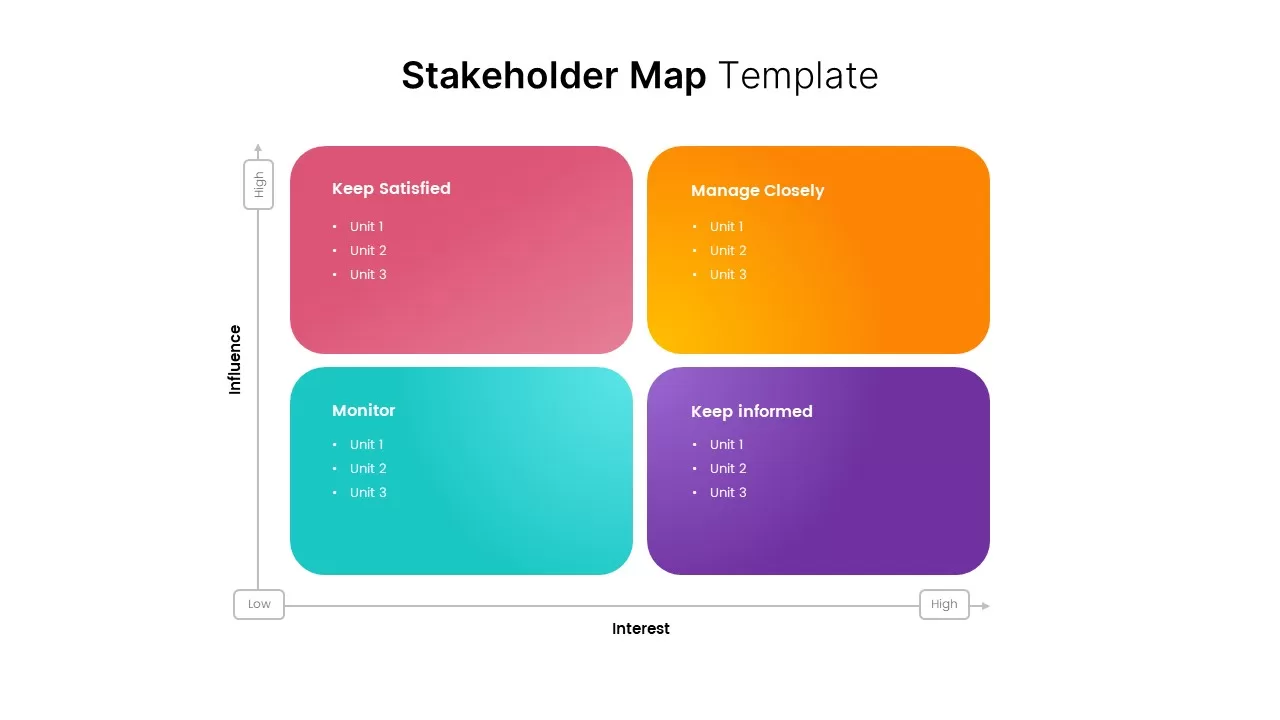
Stakeholder Map Template for PowerPoint & Google Slides
Business
Premium
Mind Map Template for PowerPoint & Google Slides
Mind Maps
Premium
Colorful Mind Map Template for PowerPoint & Google Slides
Mind Maps
Premium
Colorful Mind Map Template for PowerPoint & Google Slides
Mind Maps
Premium
North America Location Pin Map Overview Template for PowerPoint & Google Slides
World Maps
Premium
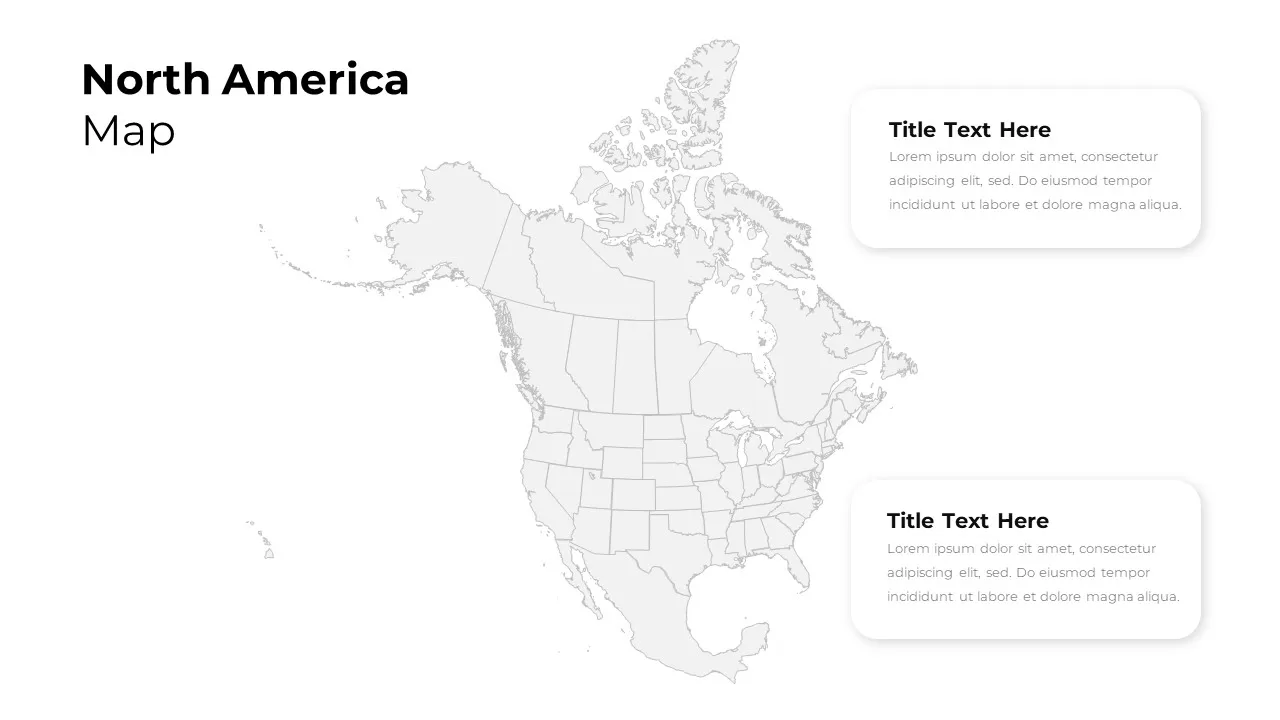
North America Map Infographic Slide Template for PowerPoint & Google Slides
World Maps
Premium
North America Regional Map Overview Template for PowerPoint & Google Slides
World Maps
Premium
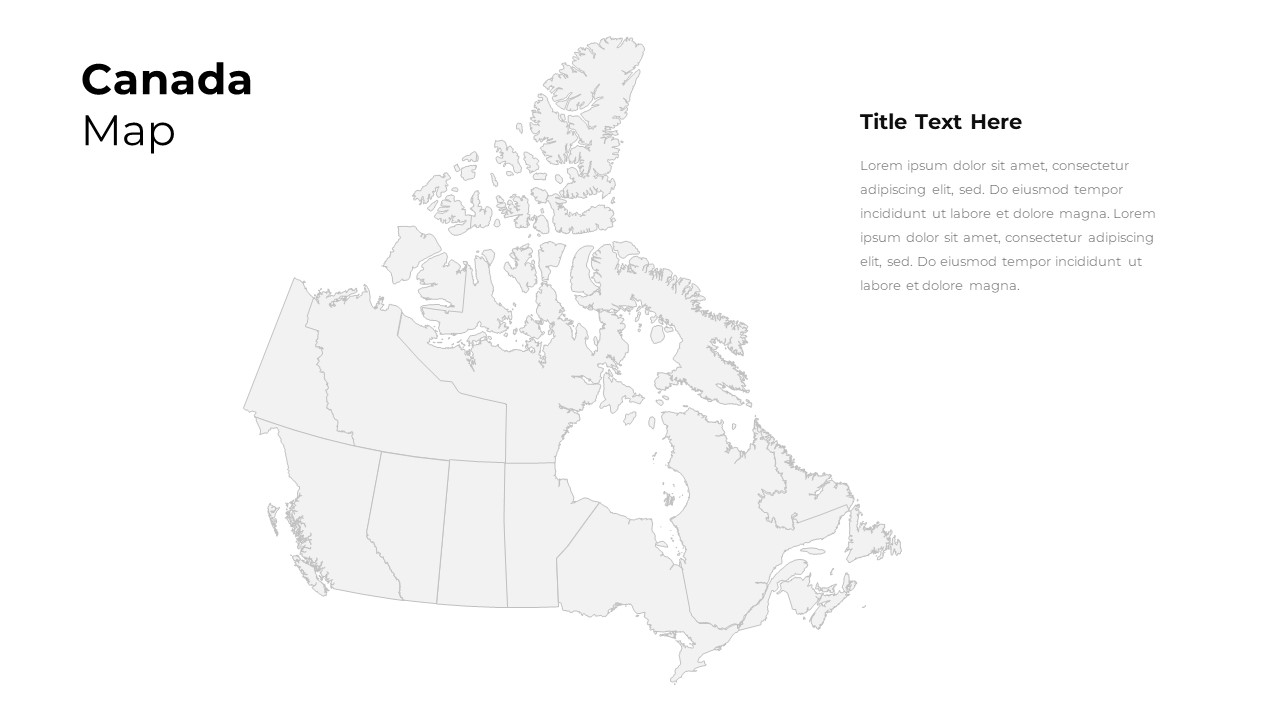
Customizable Canada Map Outline Template for PowerPoint & Google Slides
World Maps
Premium
Heat Map Risk Assessment Presentation Template for PowerPoint & Google Slides
Risk Management
Premium
Professional Risk Heat Map Visualization Template for PowerPoint & Google Slides
Risk Management
Premium
Professional Interactive Heat Map Matrix Template for PowerPoint & Google Slides
Comparison Chart
Premium
Heat Map Risk Matrix Dashboard Template for PowerPoint & Google Slides
Comparison Chart
Premium
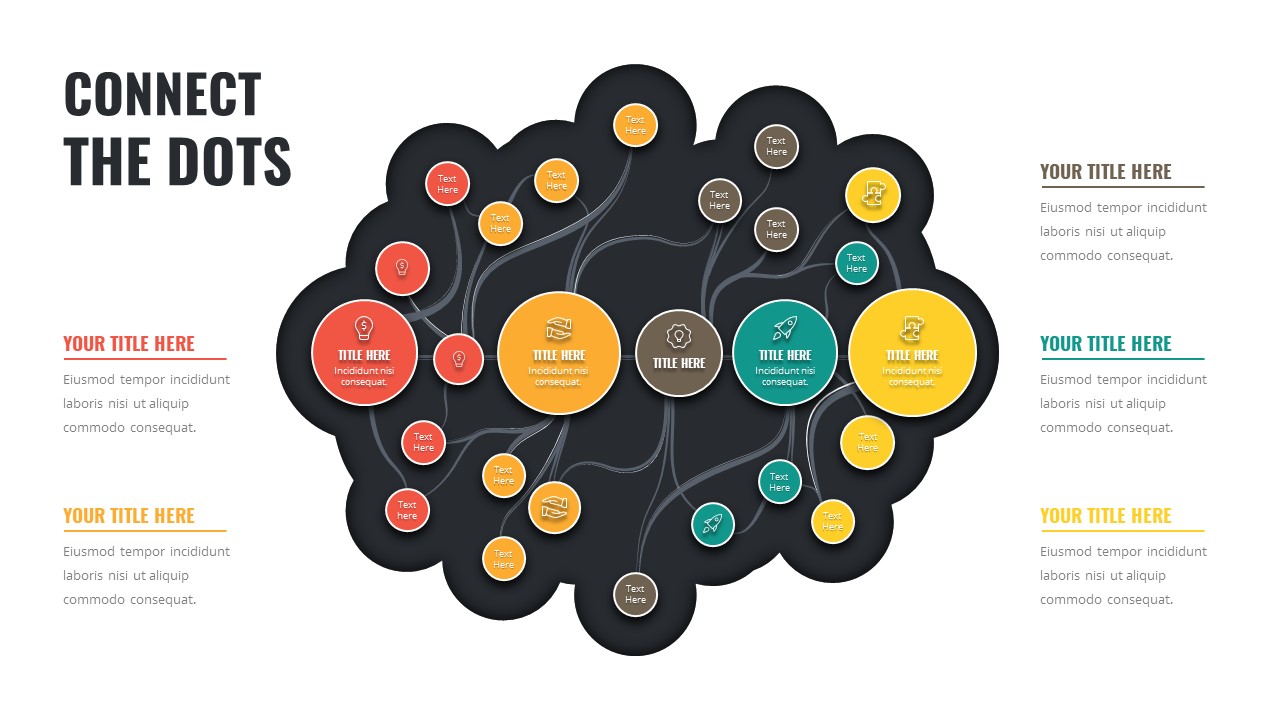
Connect the Dots Mind Map Diagram Template for PowerPoint & Google Slides
Mind Maps
Premium
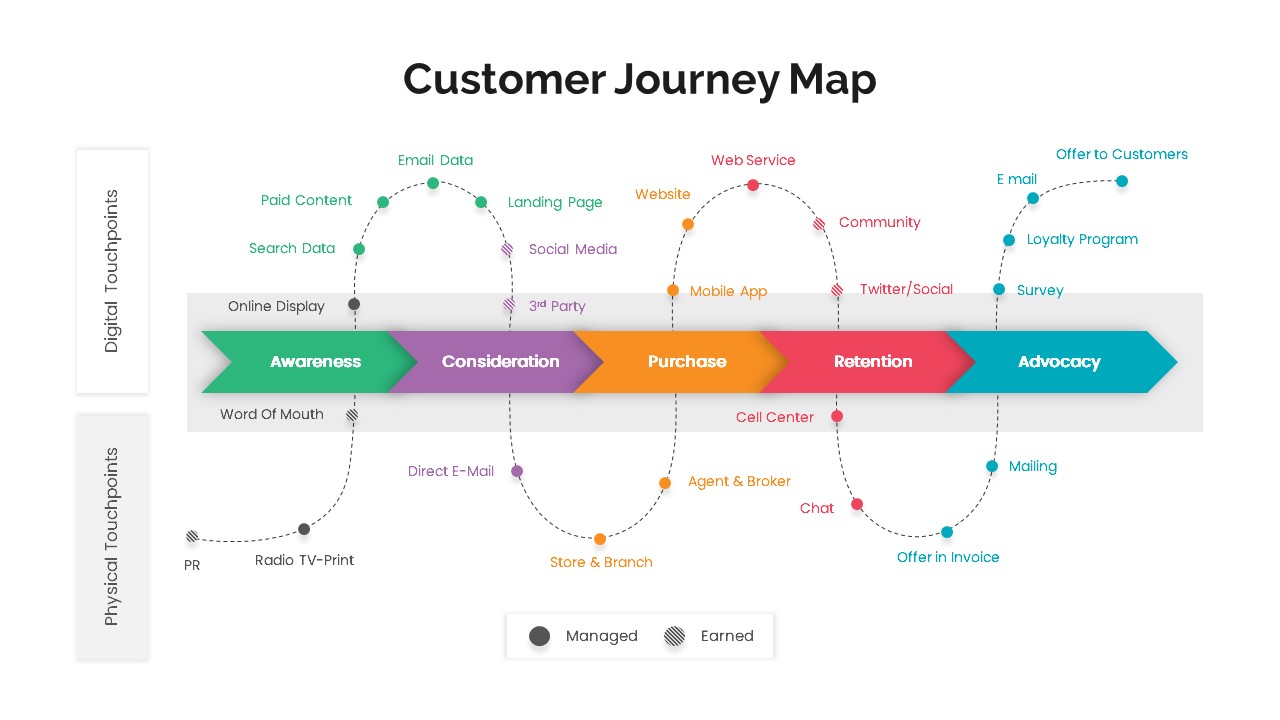
Versatile Customer Journey Map Template for PowerPoint & Google Slides
Customer Journey
Premium
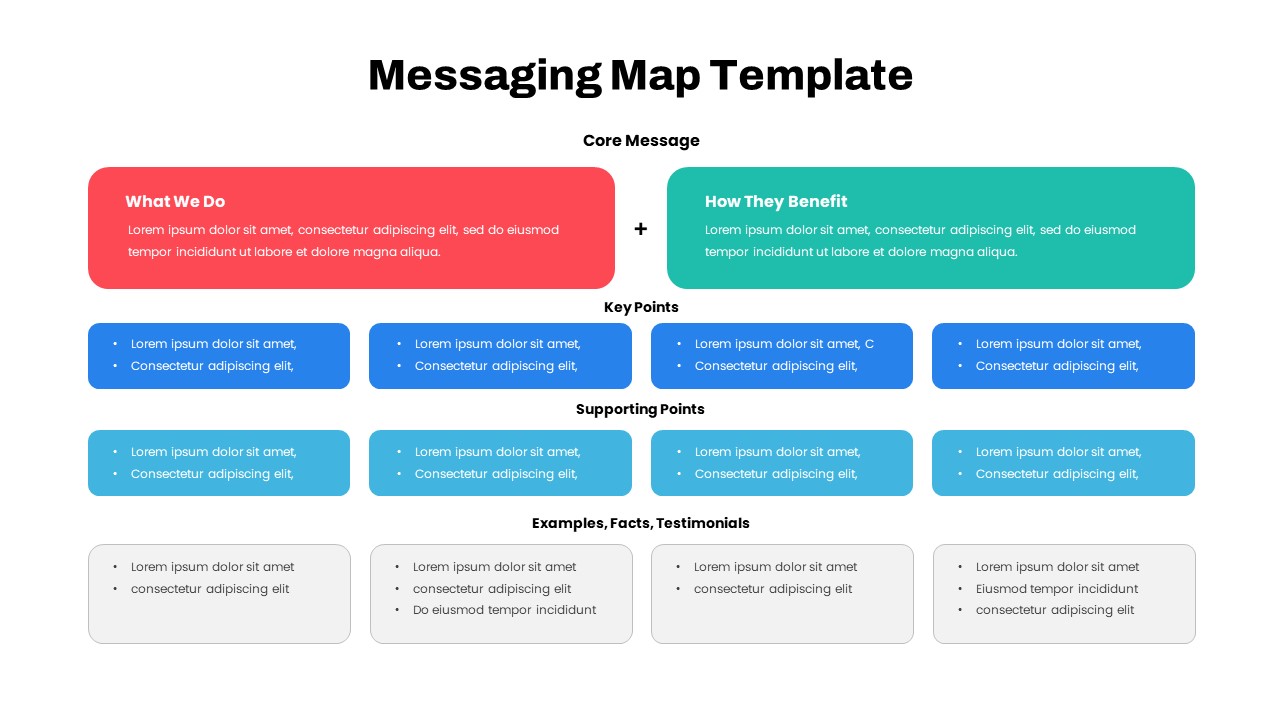
Comprehensive Messaging Map Framework Template for PowerPoint & Google Slides
Process
Premium
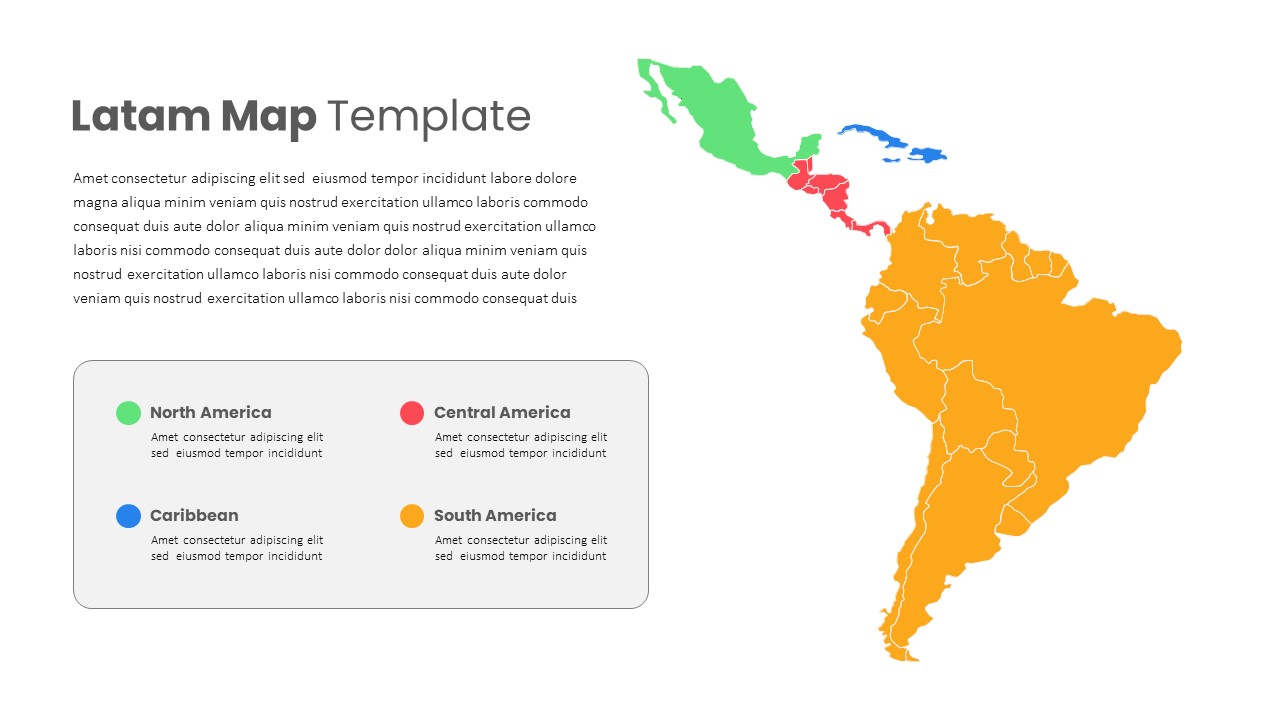
Latin America Regional Map Breakdown Template for PowerPoint & Google Slides
World Maps
Premium
Free Editable U.S. Map with Regional Metrics Template for PowerPoint & Google Slides
World Maps
Free
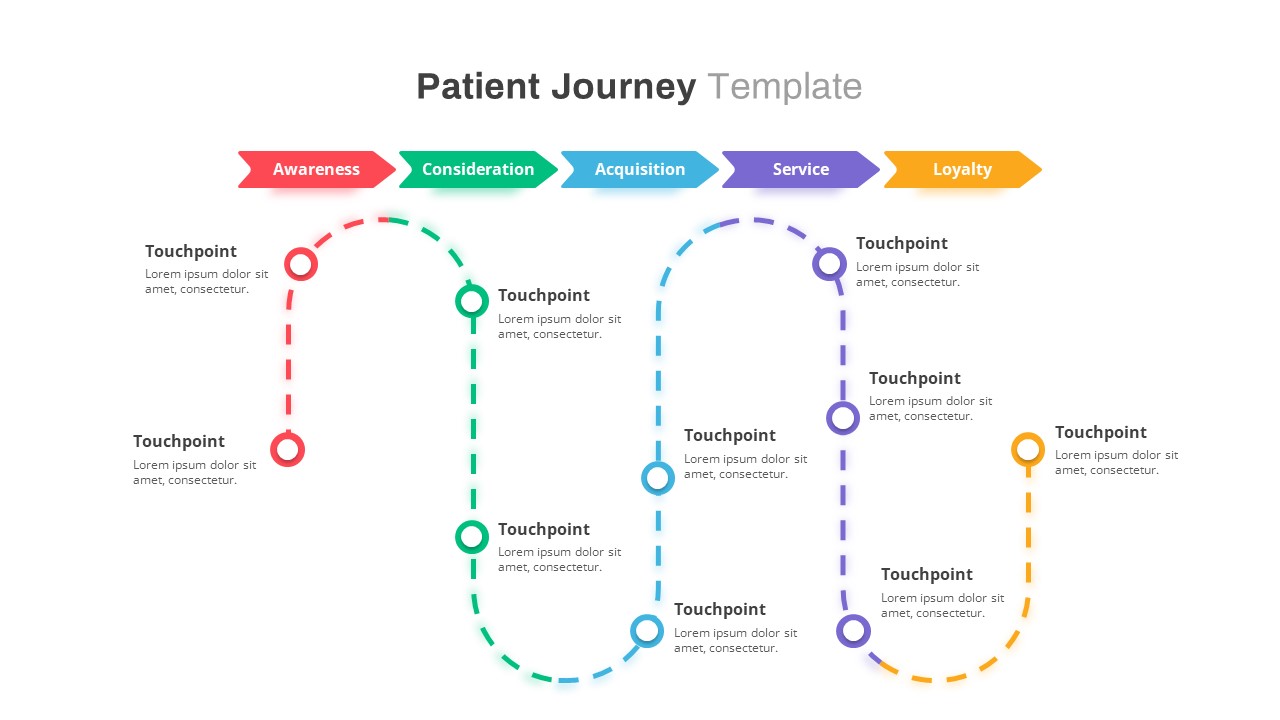
Healthcare Patient Journey Map Overview Template for PowerPoint & Google Slides
Health
Premium
UK Counties Map Data Visualization Template for PowerPoint & Google Slides
World Maps
Premium
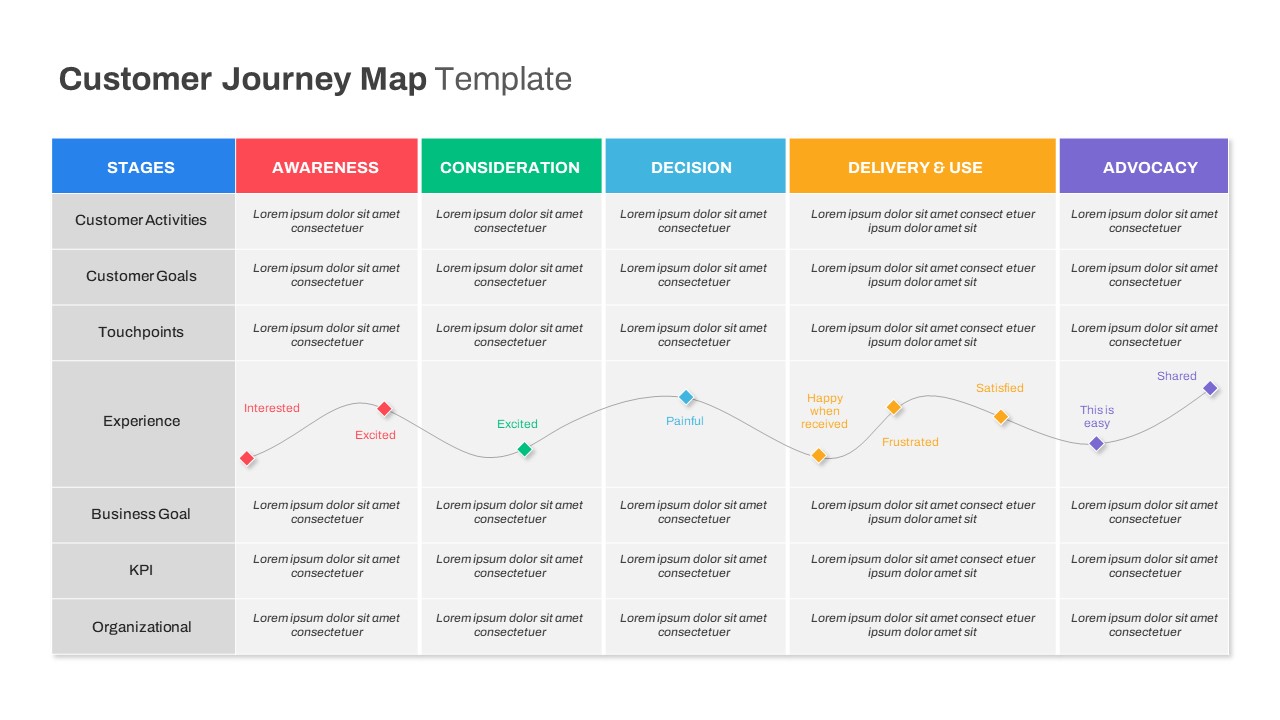
Comprehensive Customer Journey Map Template for PowerPoint & Google Slides
Customer Journey
Premium
Modern Custom Eight-Branch Mind Map Template for PowerPoint & Google Slides
Mind Maps
Premium
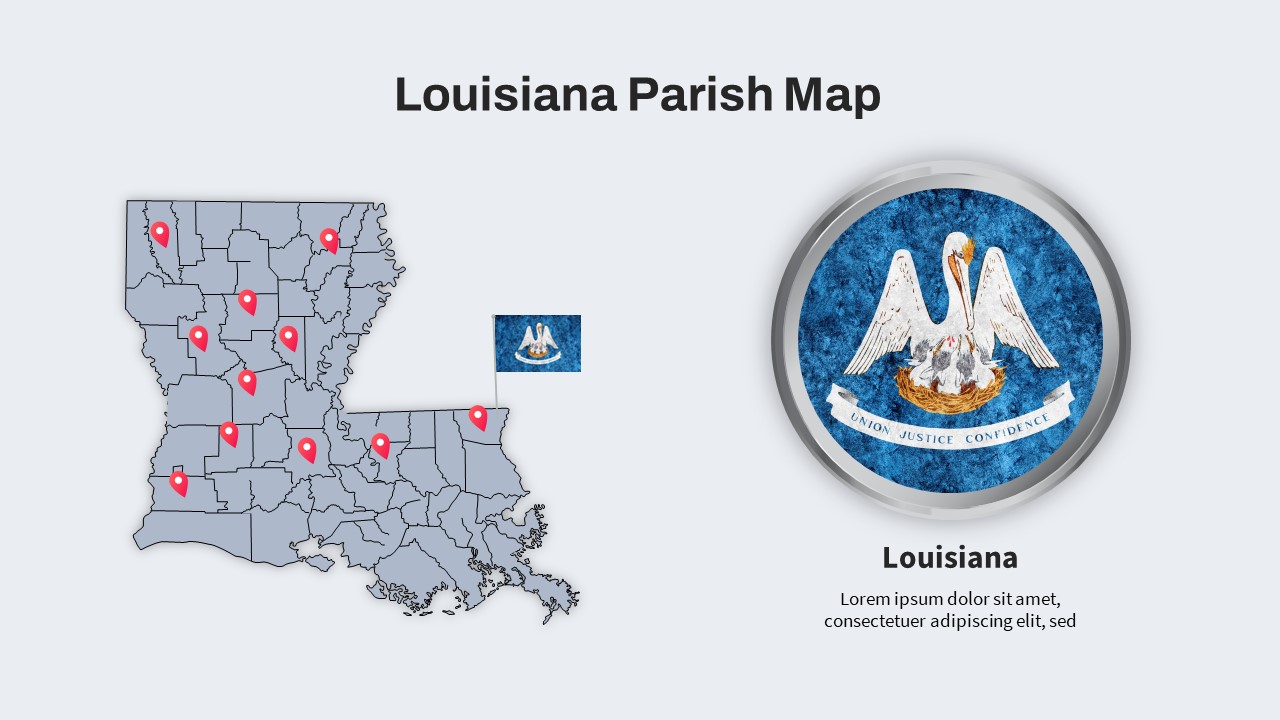
Louisiana Parish Map with Markers Template for PowerPoint & Google Slides
Maps
Premium
Colorful Multi-Branch Mind Map Slide Template for PowerPoint & Google Slides
Mind Maps
Premium
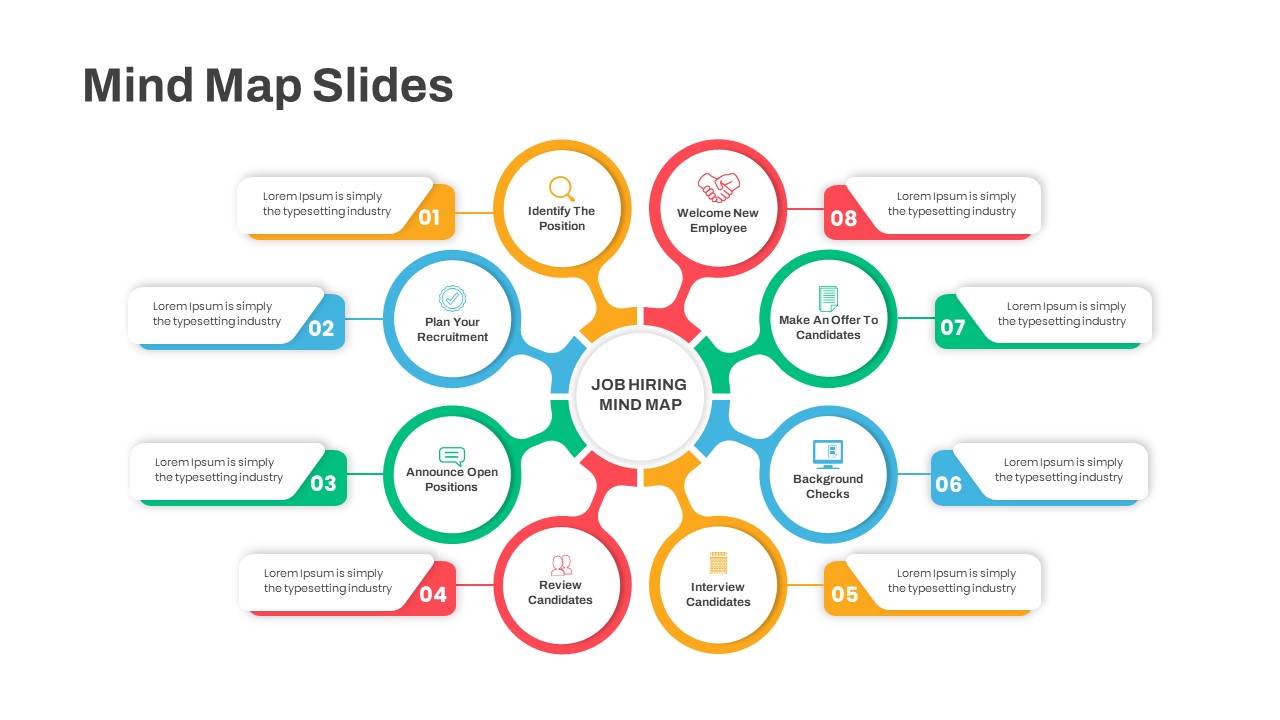
Eight-Step Job Hiring Mind Map Template for PowerPoint & Google Slides
Mind Maps
Premium
Michigan County Map with KPI Dashboard Template for PowerPoint & Google Slides
World Maps
Premium
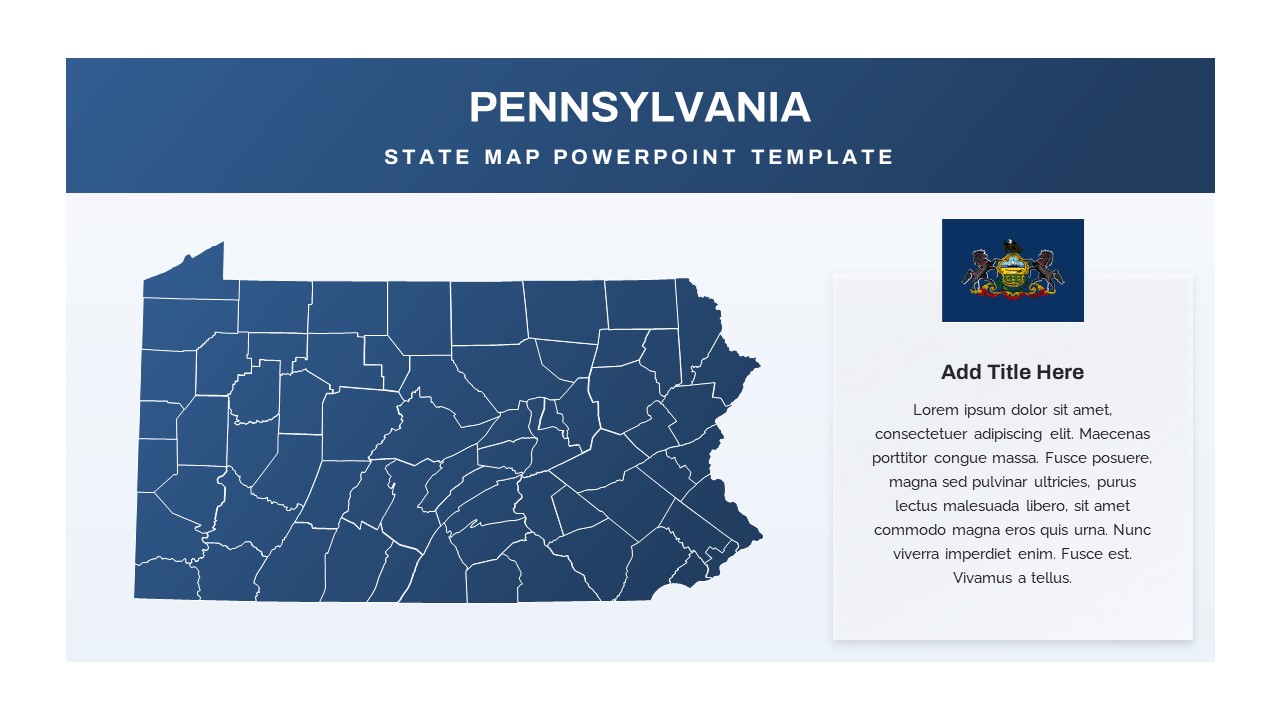
Pennsylvania State Map Diagram Template for PowerPoint & Google Slides
World Maps
Premium
Editable Ireland Map Infographic Slide Template for PowerPoint & Google Slides
World Maps
Free
European Union Map Infographic Template for PowerPoint & Google Slides
World Maps
Premium
Graphic Organizer & Double Bubble Map Template for PowerPoint & Google Slides
Maps
Premium
Syria Regional Data Map Infographic Template for PowerPoint & Google Slides
World Maps
Premium
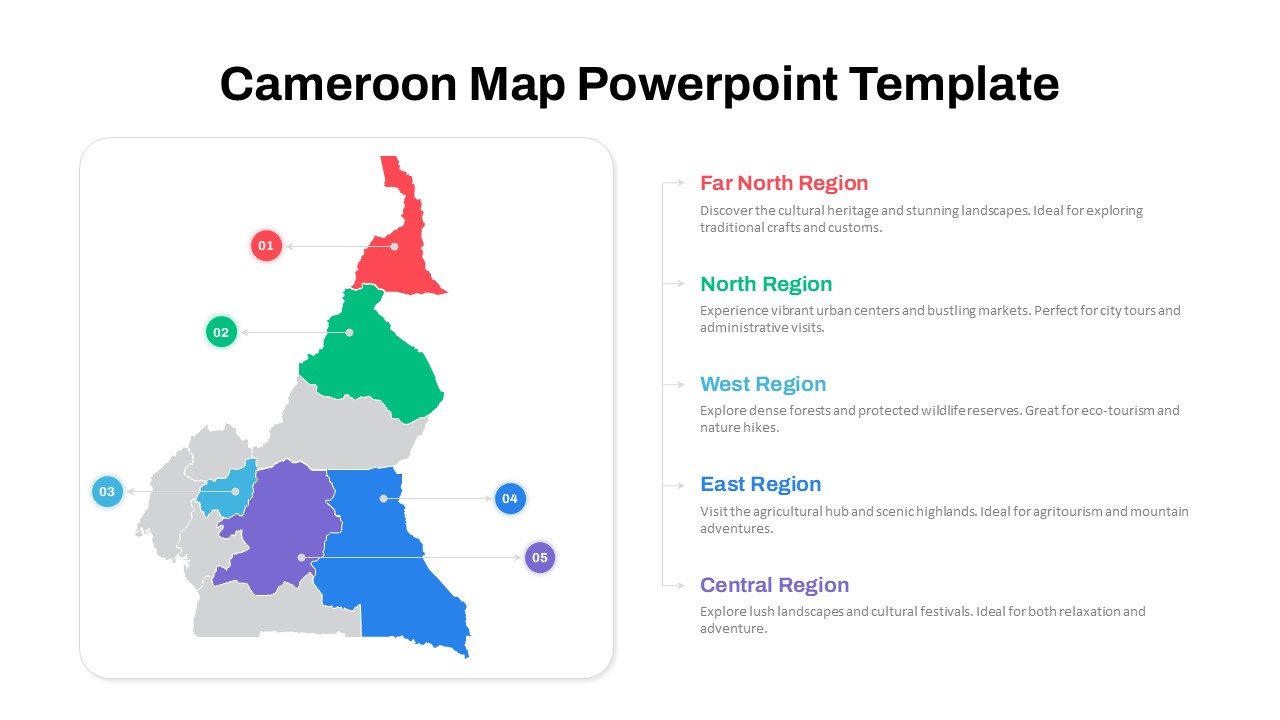
Numbered Cameroon Regional Map Slide Template for PowerPoint & Google Slides
World Maps
Premium
AI Mind Map & Hub-and-Spoke Diagram Template for PowerPoint & Google Slides
Mind Maps
Premium
Interactive Taiwan Map Highlight Template for PowerPoint & Google Slides
World Maps
Premium
South America Map template for PowerPoint & Google Slides
Maps
Premium
AI and Data Ecosystem Map Template for PowerPoint & Google Slides
AI
Premium
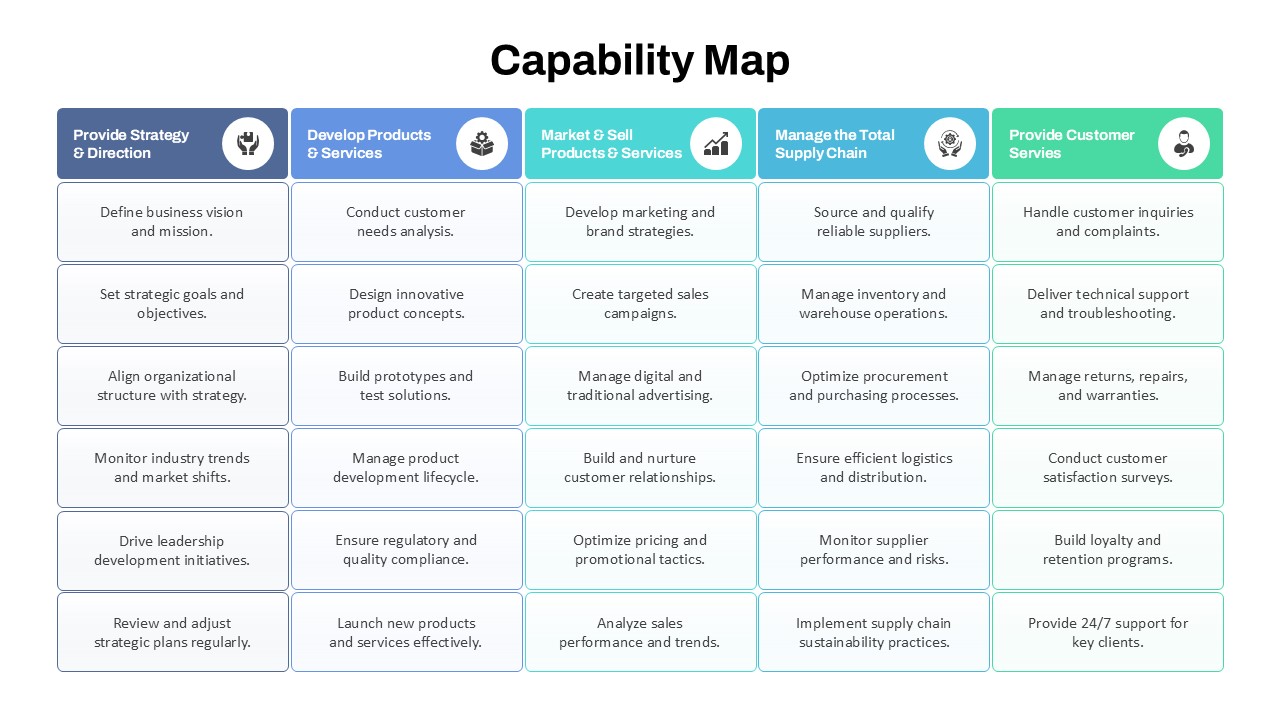
Capability Map Overview Template for PowerPoint & Google Slides
Business Strategy
Premium
Europe Map with Six Editable Points Template for PowerPoint & Google Slides
World Maps
Premium