Capacity Planning Circular Diagram Template for PowerPoint & Google Slides


Description
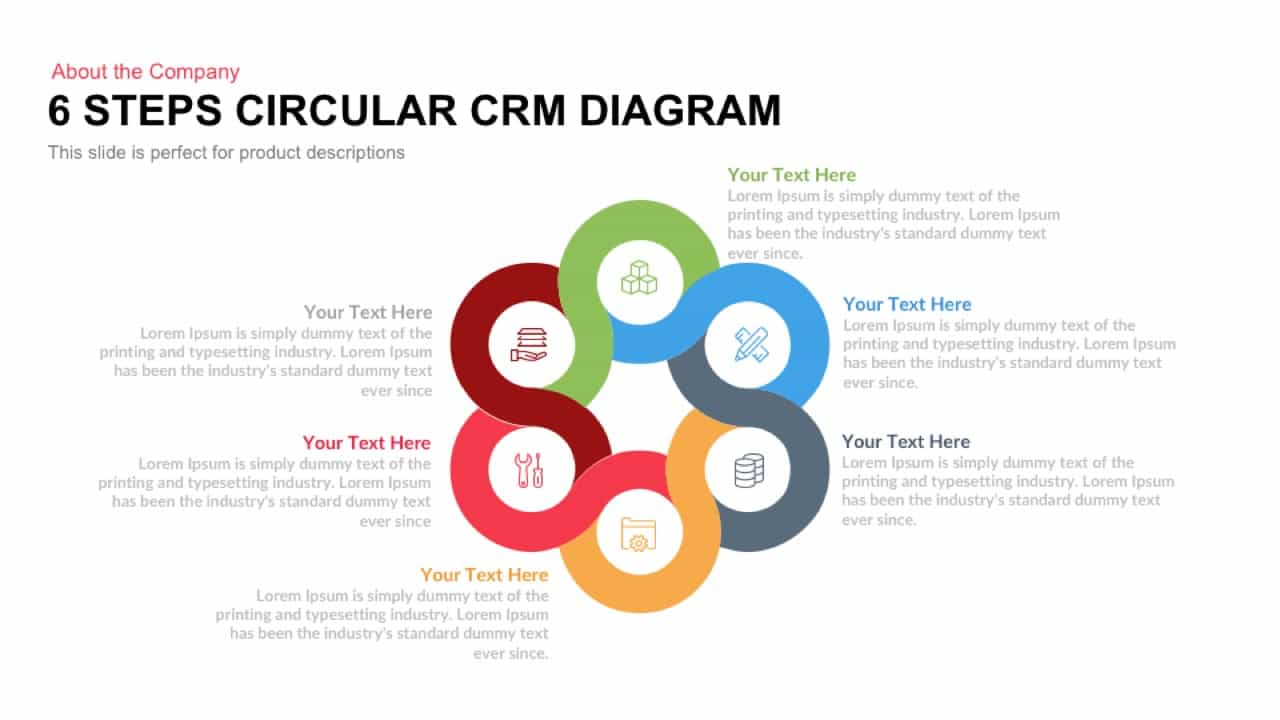
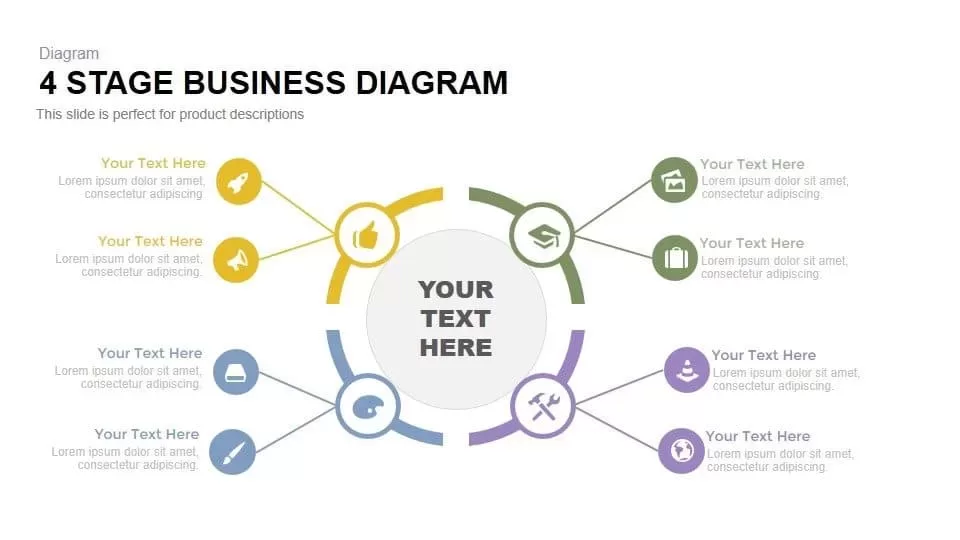
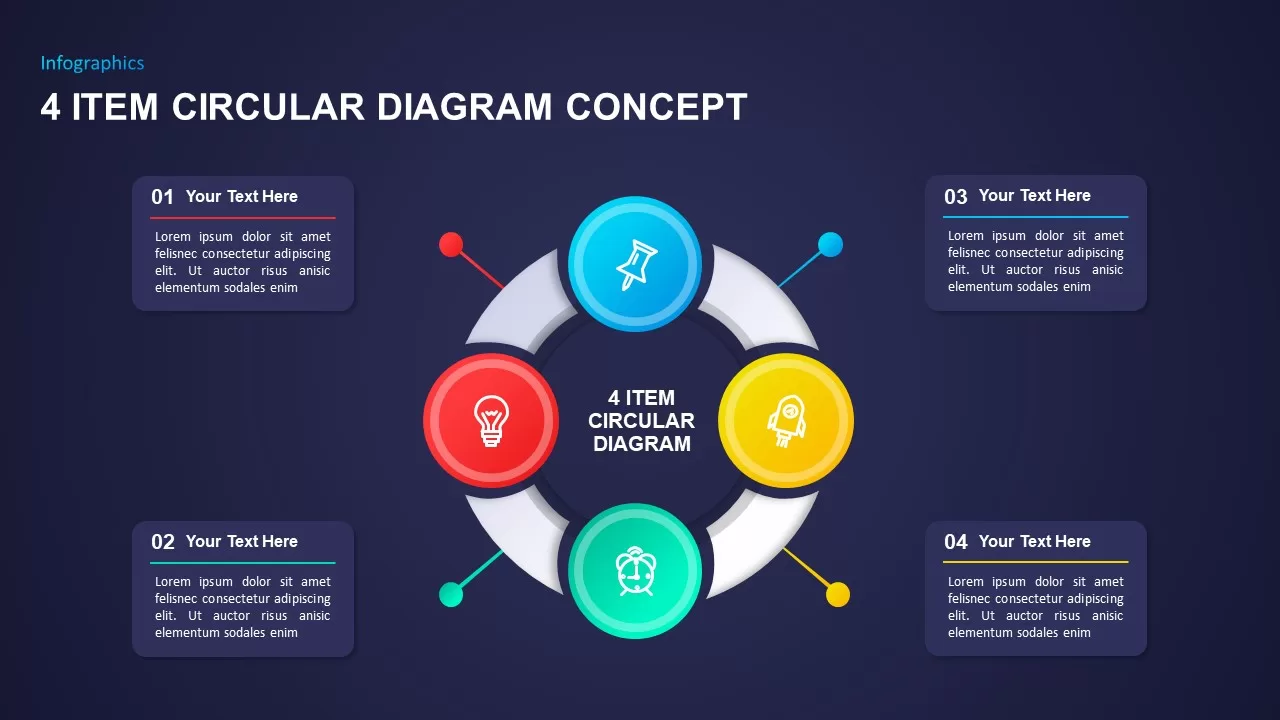
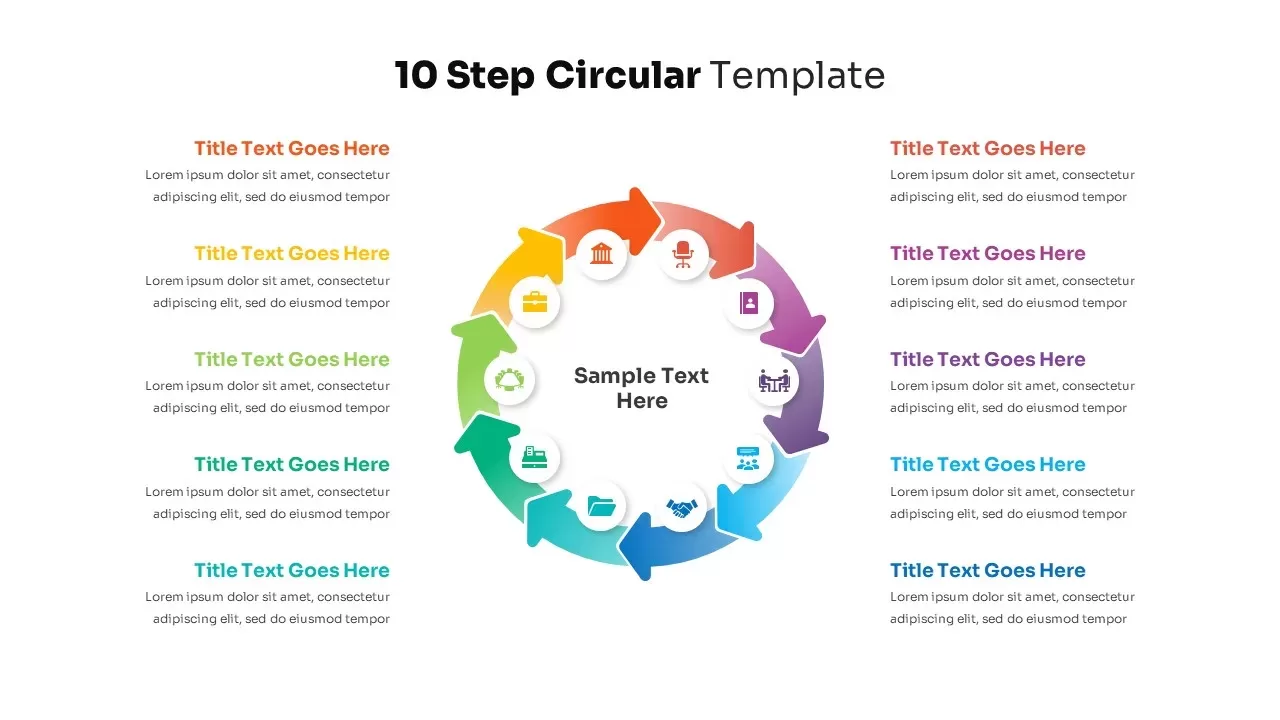
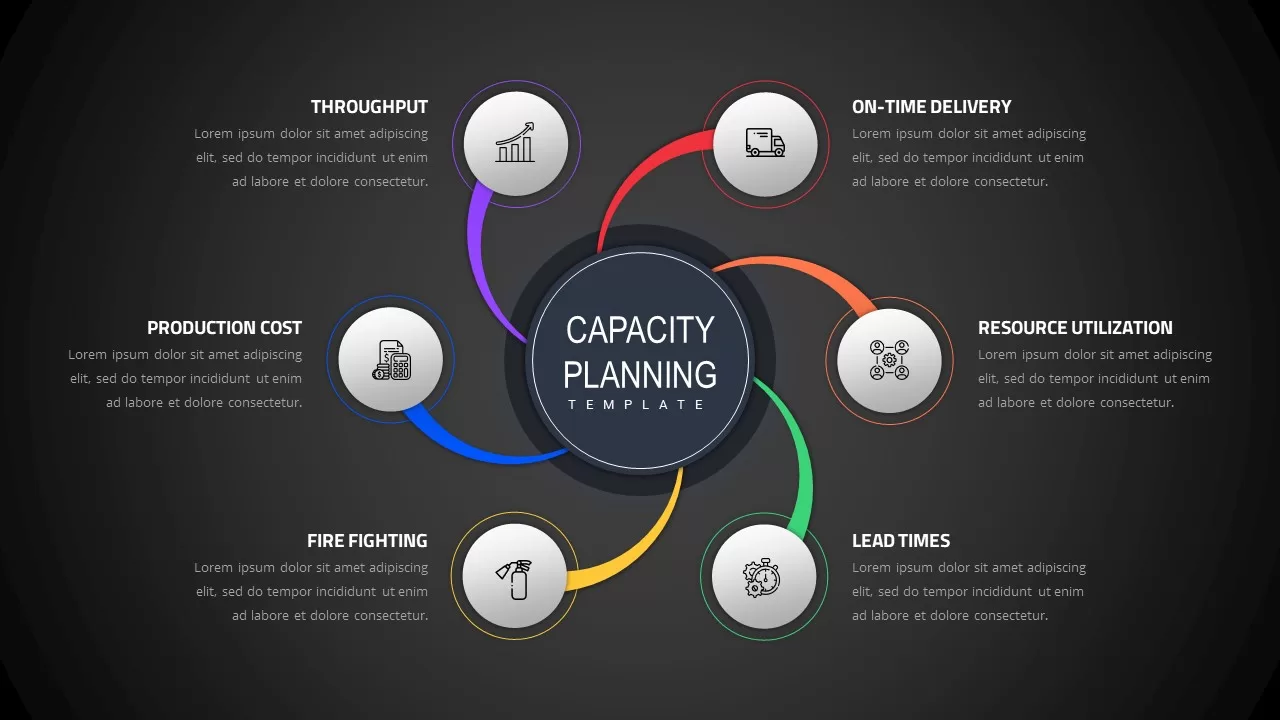
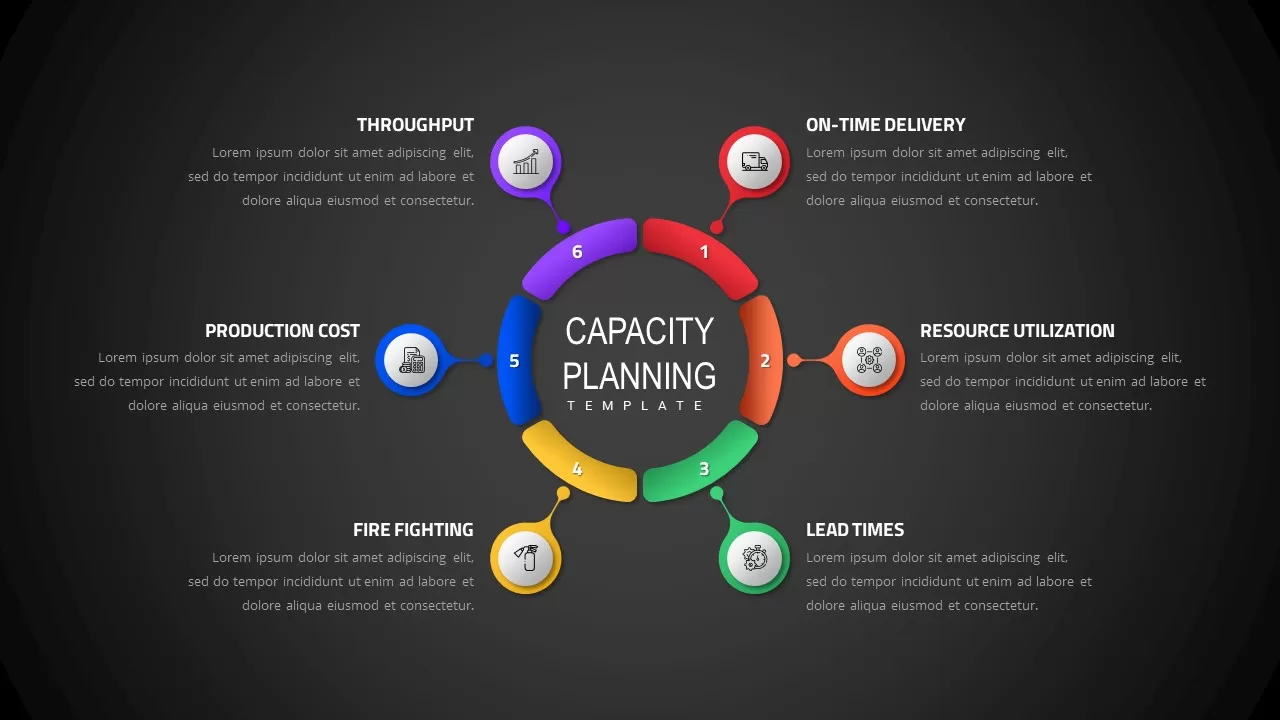
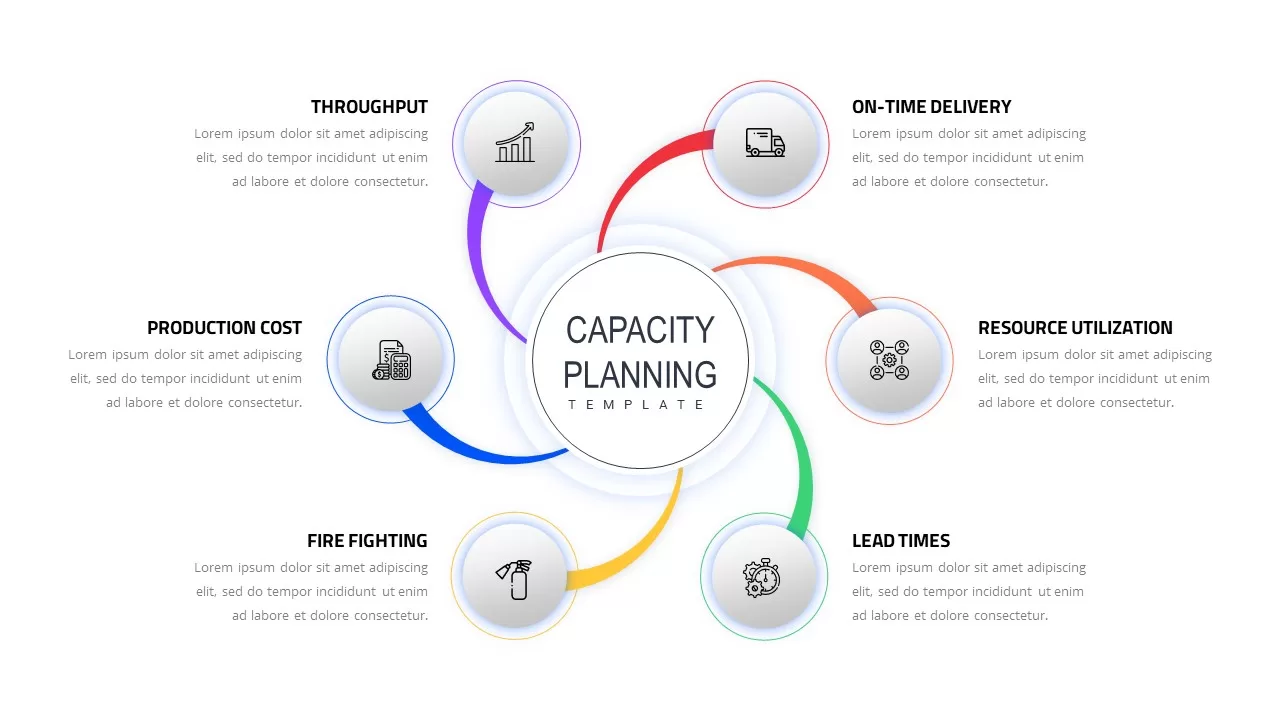
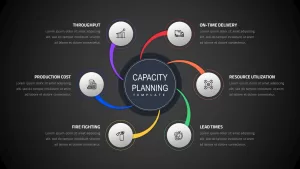
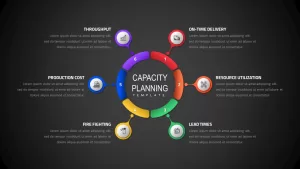
Leverage this circular Capacity Planning infographic to visualize critical performance factors—On-Time Delivery, Resource Utilization, Lead Times, Fire Fighting, Production Cost, and Throughput—in a dynamic six-segment ring layout. A bold central hub emphasizes the slide title, while color-coded arcs and connected icon markers guide viewers to key data points. The flat design aesthetic, paired with subtle drop shadows and crisp typography, delivers a modern, professional look that enhances audience engagement and comprehension.
This fully editable slide is optimized for rapid customization across PowerPoint and Google Slides. Slide masters allow seamless color adjustments, icon replacements, and typography changes to align with brand standards. Users can modify segment labels and descriptions, scale or reposition elements, and update data charts without disrupting the overall layout. Whether illustrating capacity strategies, supply chain bottlenecks, or manufacturing KPIs, this template adapts effortlessly to diverse narratives and presentation contexts.
Choose between light and dark background variants to complement your presentation mood. Both designs maintain high-resolution clarity and consistent formatting across operating systems and devices. Built-in master controls allow swift toggling between themes and color schemes without manual reformatting, ensuring seamless integration with existing slide decks and reinforcing brand consistency.
Ideal for operations managers, supply chain analysts, and production planners, this template facilitates strategic discussions around resource allocation and throughput optimization. Use it in boardroom briefings to highlight capacity constraints, in training sessions to teach planning methodologies, or in client proposals to showcase process improvement recommendations. Beyond capacity planning, repurpose the six-arced diagram to depict any cyclical process—project phases, quality control loops, or recurring business cycles—ensuring maximum versatility and impact.
Who is it for
Operations managers, supply chain analysts, production planners, and consultants will benefit from this slide when presenting capacity strategies, performance metrics, or process improvement plans.
Other Uses
Repurpose this six-segment circular diagram to illustrate project phases, quality assurance loops, risk management cycles, or any repeatable business process that requires clear, cyclical visualization.
Login to download this file
Add to favorites
Add to collection

Item ID
SB02117
Related Templates

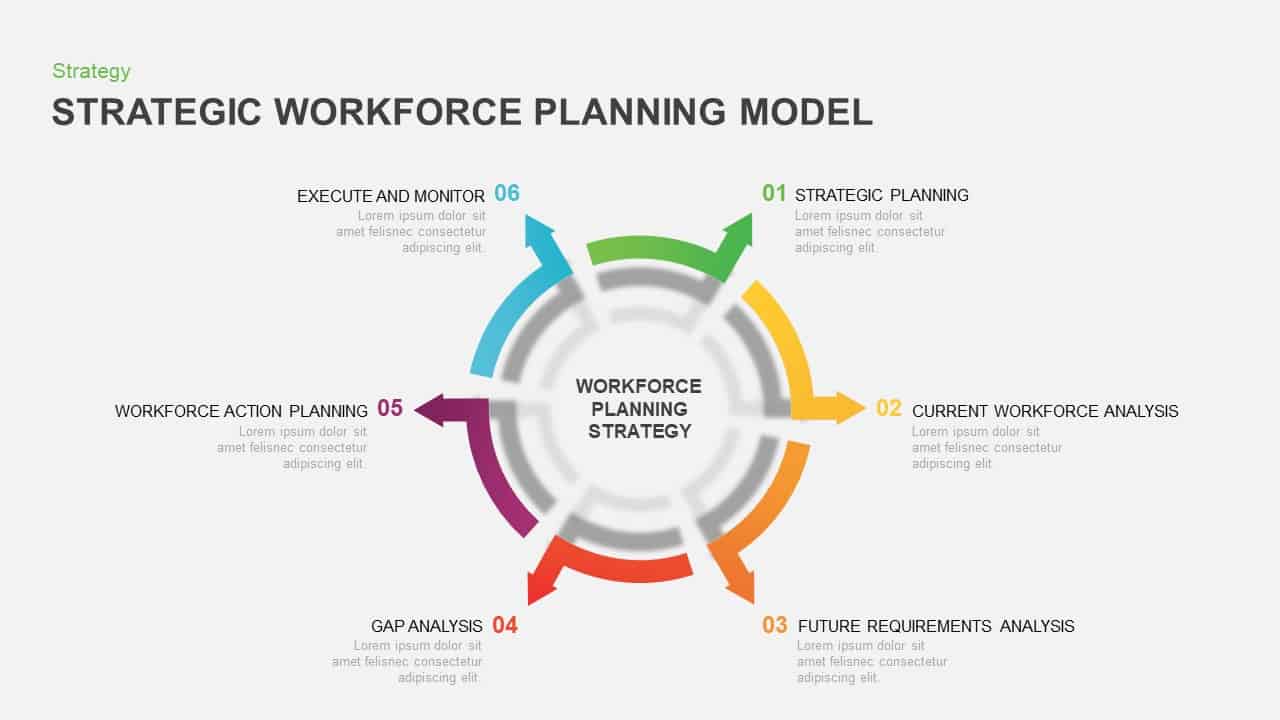
Strategic Workforce Planning Circular Template for PowerPoint & Google Slides
Circle
Premium
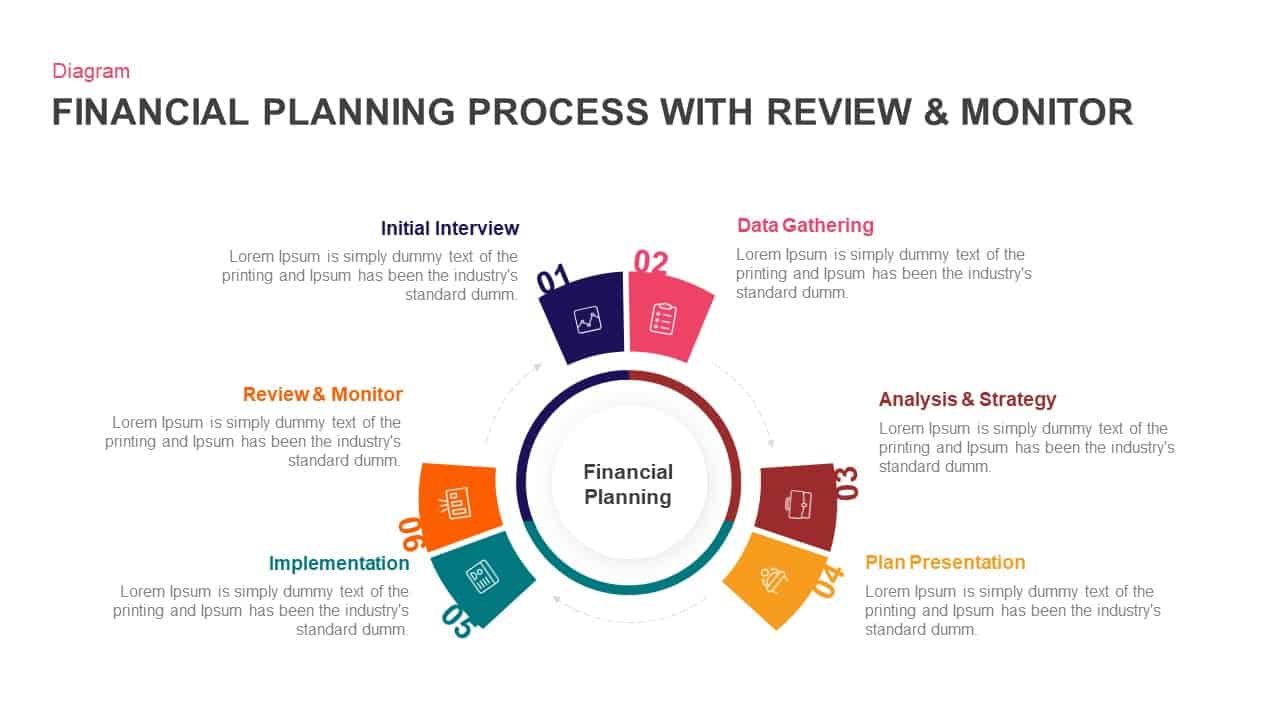
Financial Planning Circular Process Template for PowerPoint & Google Slides
Process
Premium
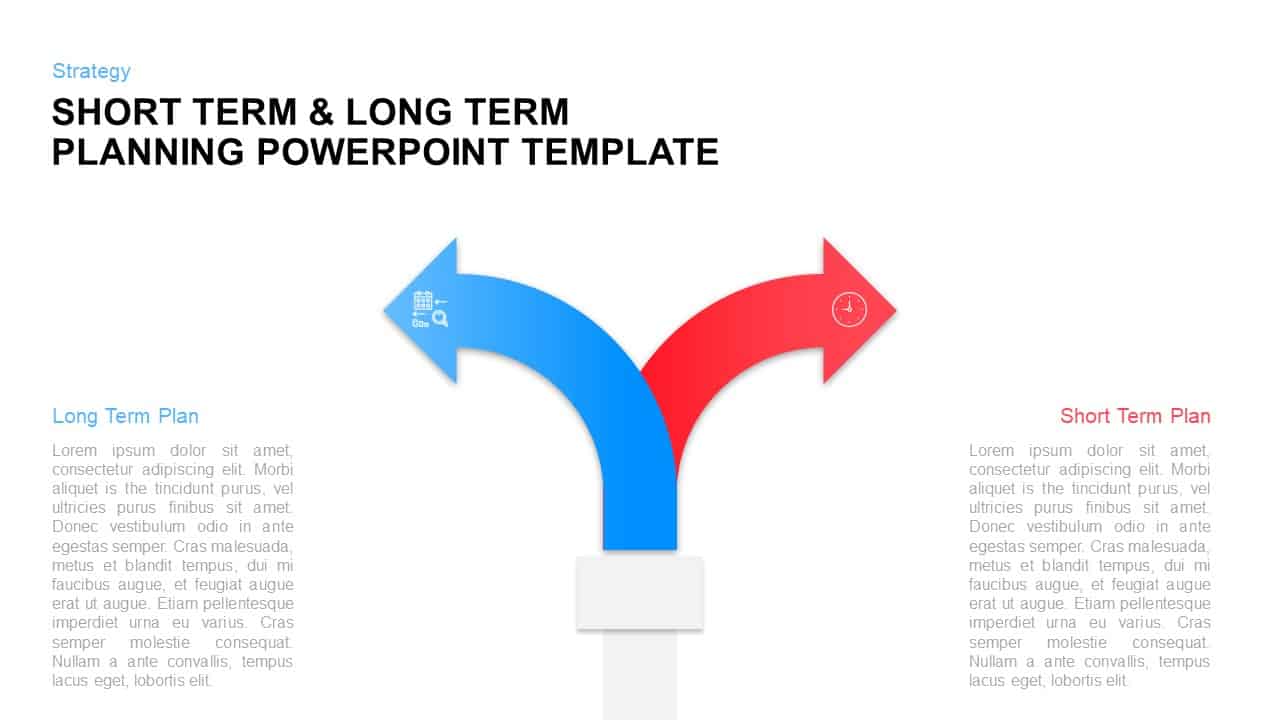
Long-Term vs Short-Term Planning Diagram Template for PowerPoint & Google Slides
Comparison
Premium
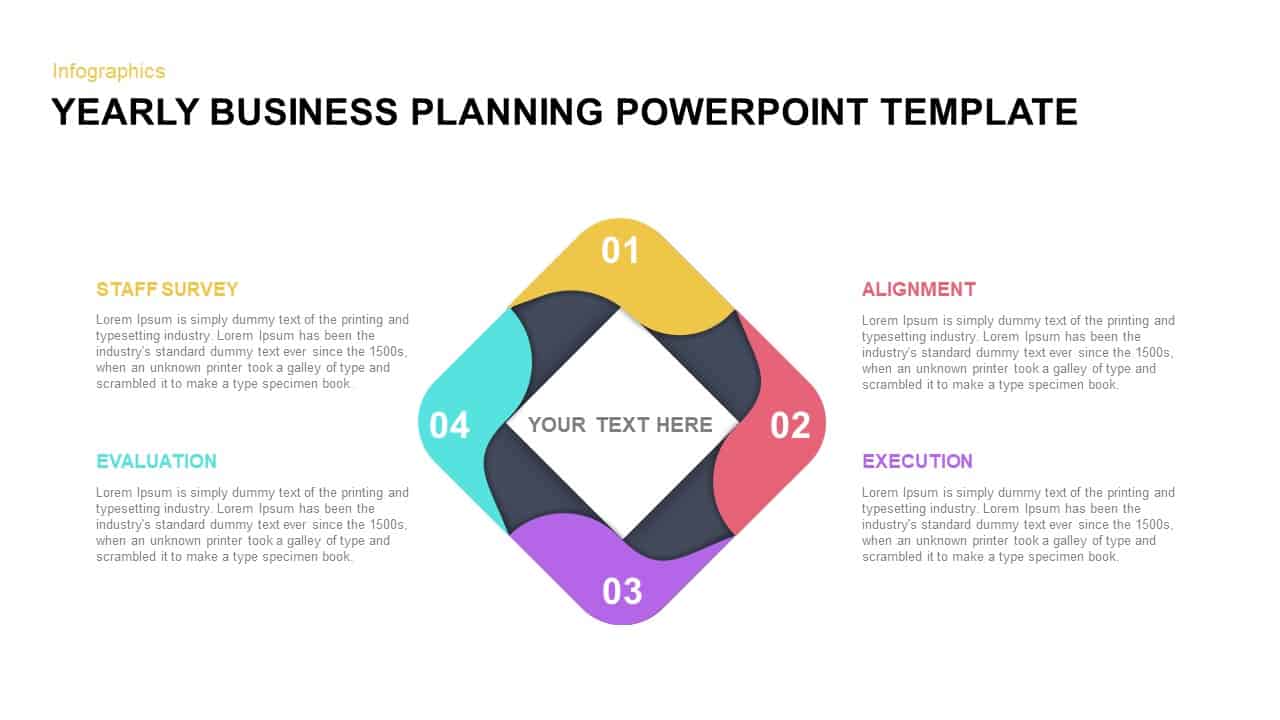
Yearly Business Planning Diamond Diagram Template for PowerPoint & Google Slides
Process
Premium

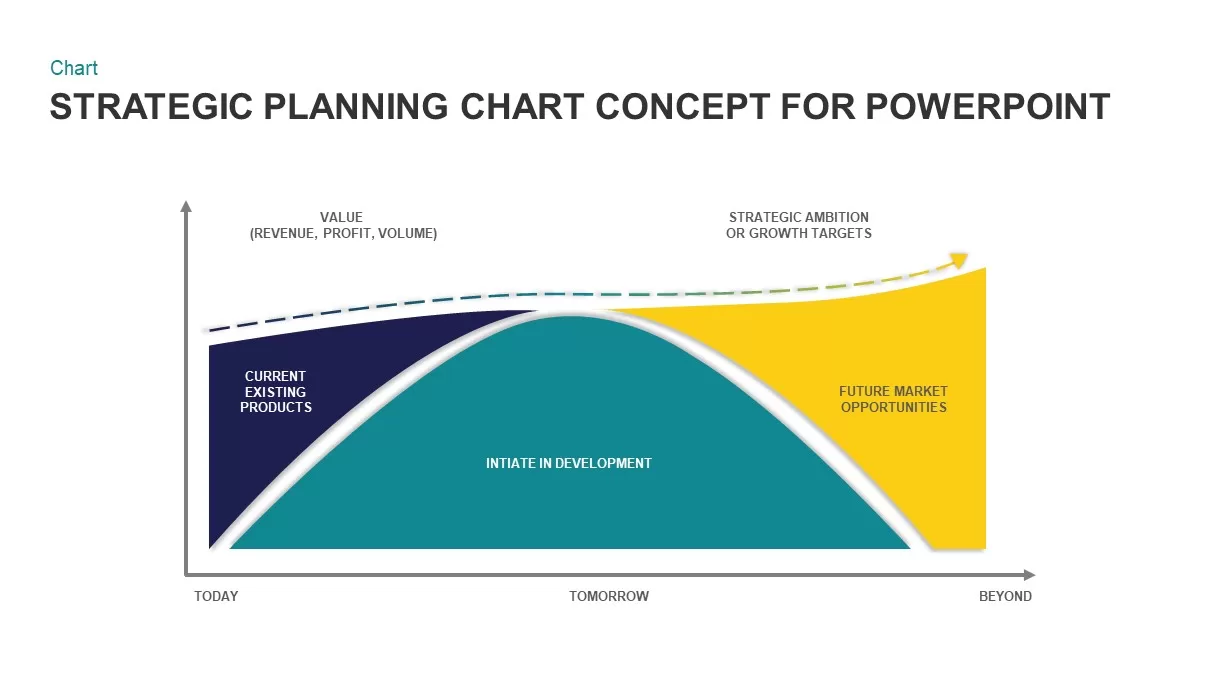
Strategic Planning Curve Diagram Template for PowerPoint & Google Slides
Charts
Premium
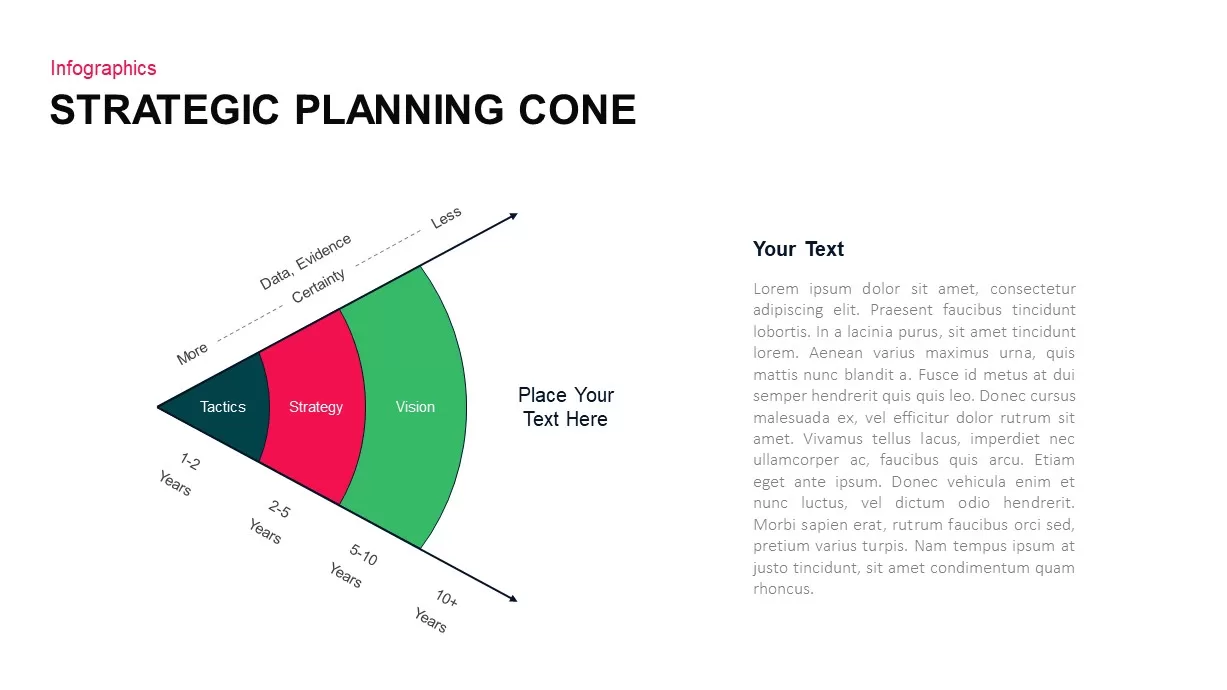
3-Part Strategic Planning Cone Diagram Template for PowerPoint & Google Slides
Process
Premium
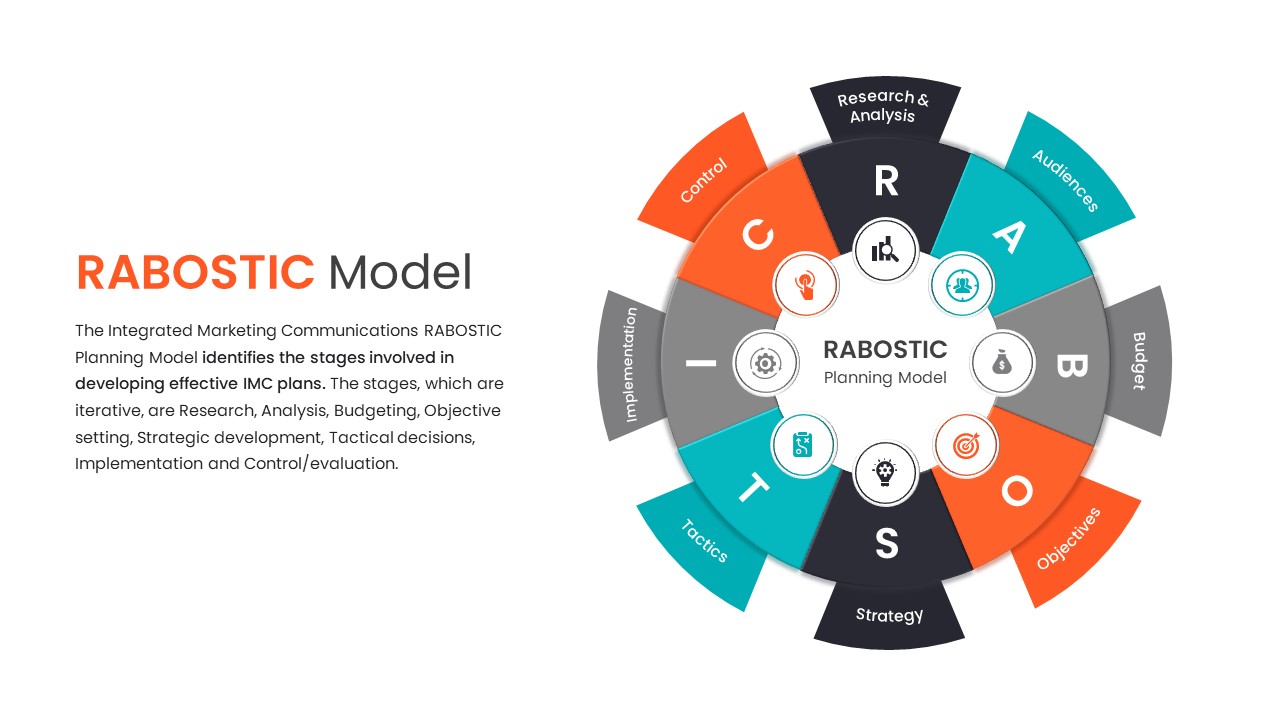
RABOSTIC IMC Planning Model Diagram Template for PowerPoint & Google Slides
Process
Premium
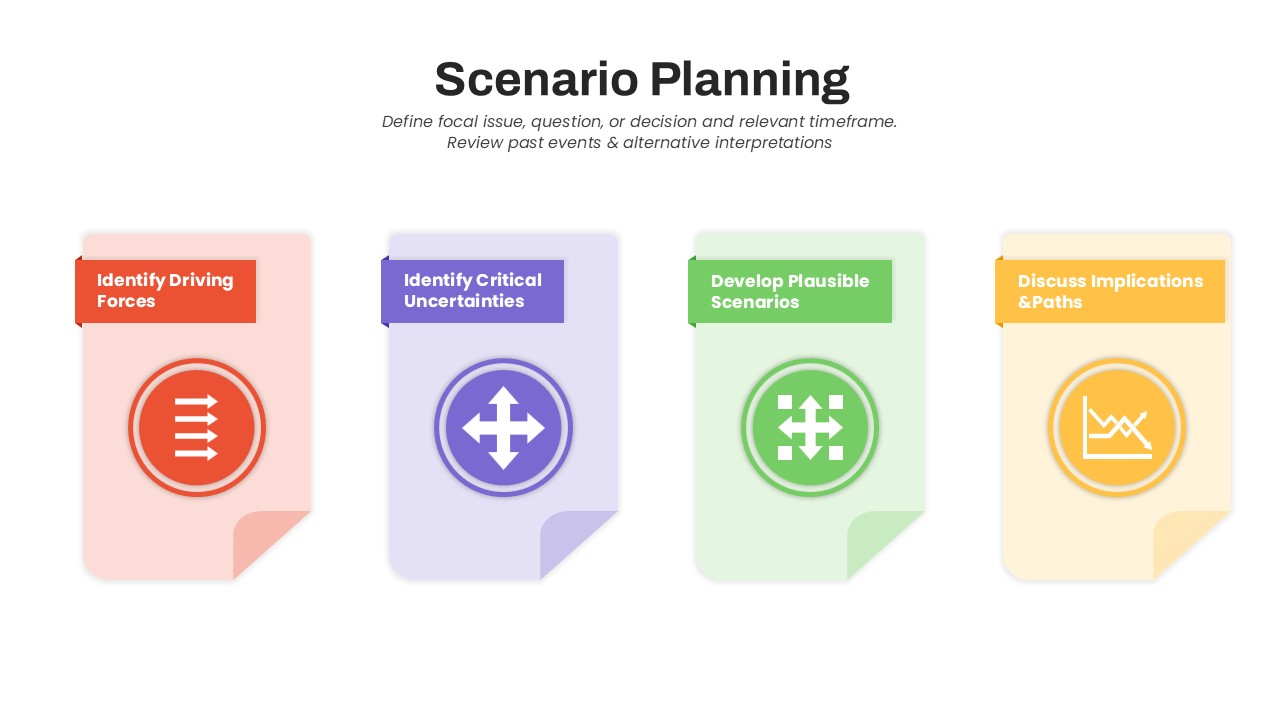
Scenario Planning Process Diagram Template for PowerPoint & Google Slides
Process
Premium
Sequential Arrow Timeline and Planning template for PowerPoint & Google Slides
Timeline
Premium

Planning Metaphor Flowchart Slide Template for PowerPoint & Google Slides
Process
Premium
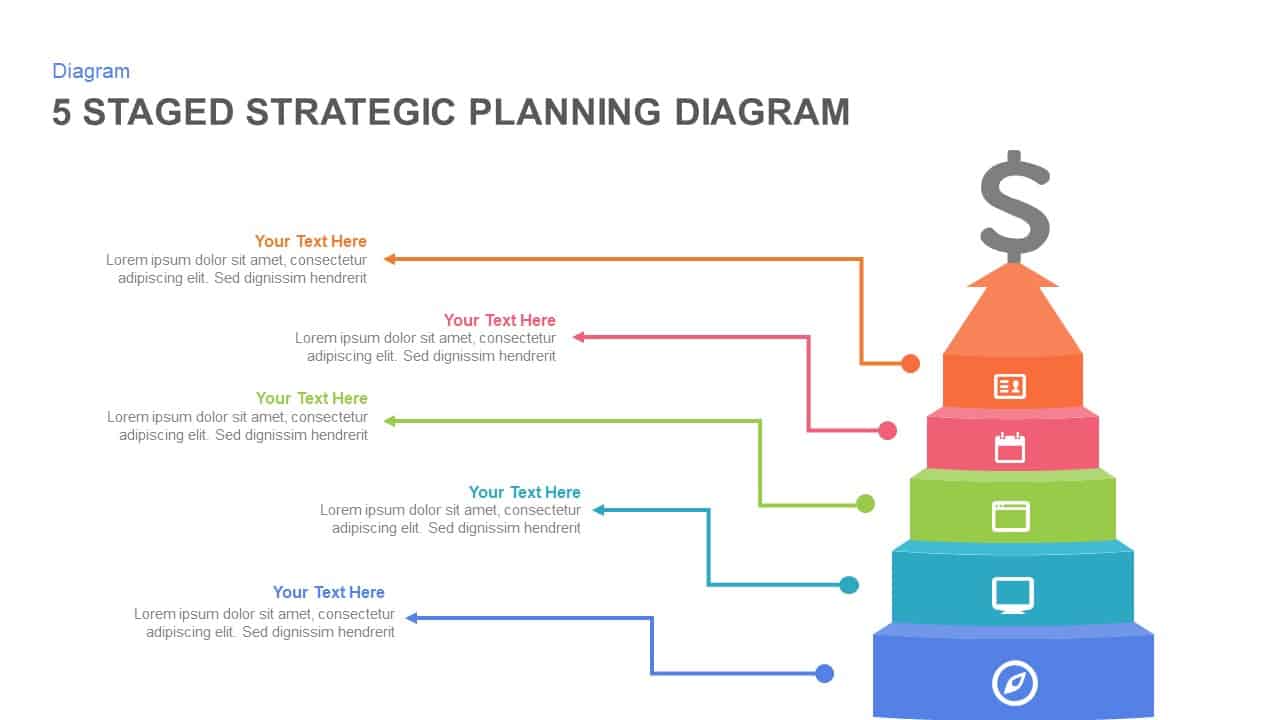
5-Stage Strategic Planning Pyramid Template for PowerPoint & Google Slides
Business Strategy
Premium
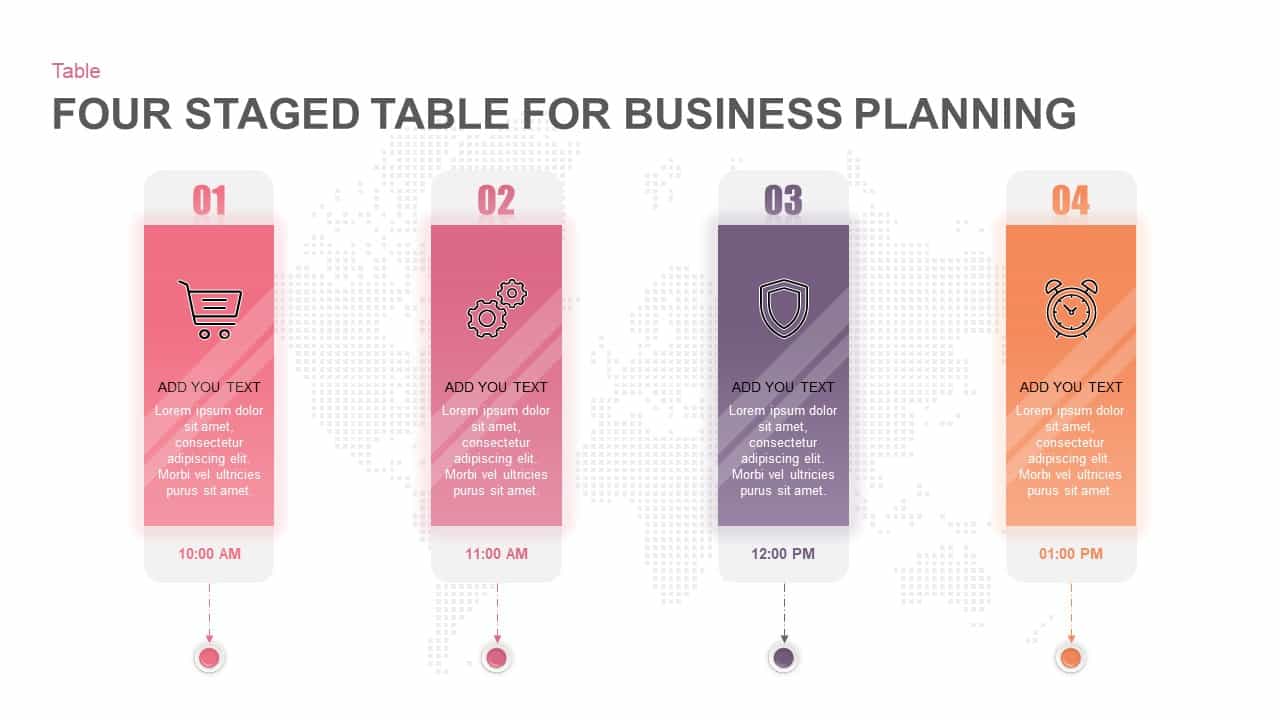
Four-Stage Business Planning Table Template for PowerPoint & Google Slides
Business Plan
Premium
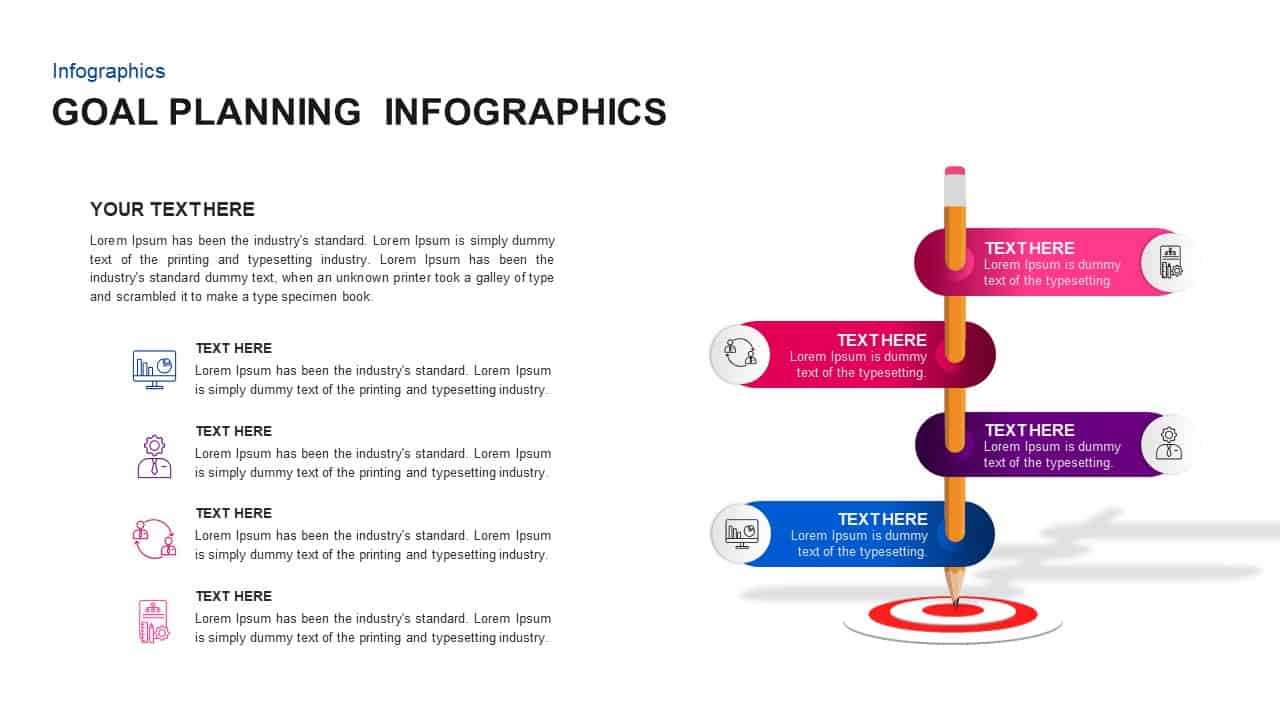
Goal Planning Ribbon Process Infographic Template for PowerPoint & Google Slides
Goals
Premium
SOAR Strategic Planning Infographic Template for PowerPoint & Google Slides
Process
Premium
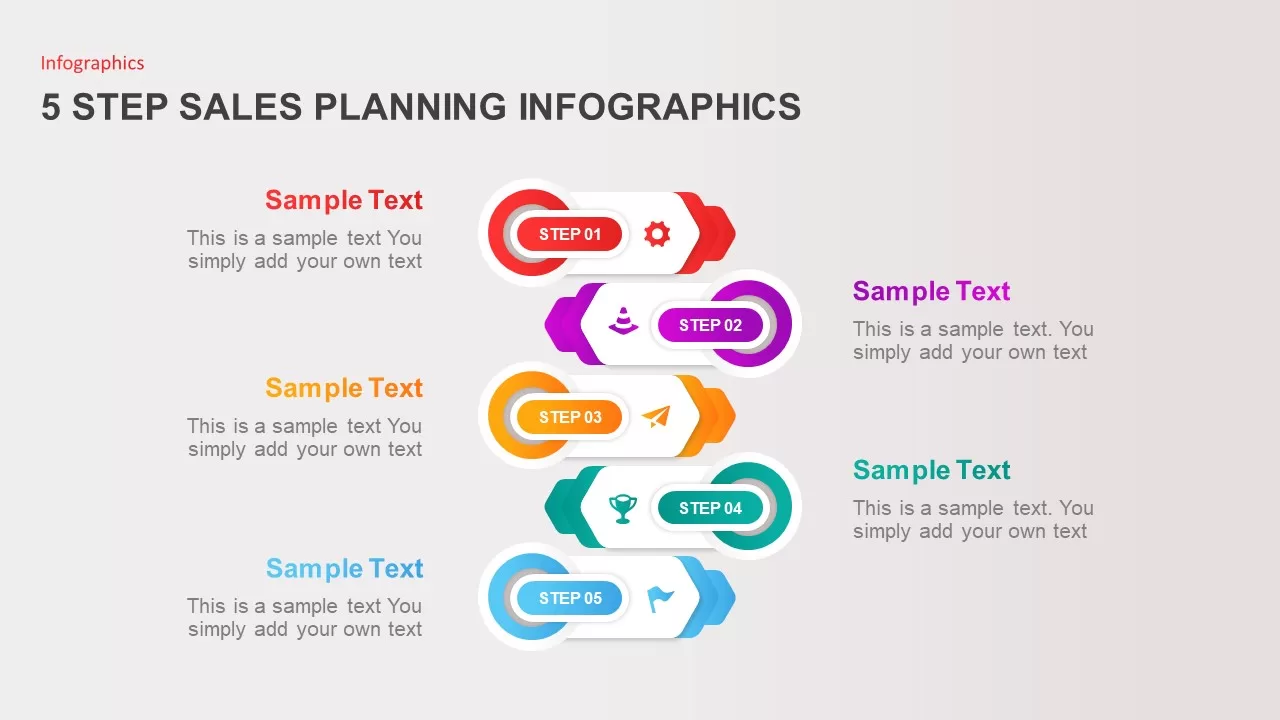
5 Step Sales Planning Infographics for PowerPoint & Google Slides
Infographics
Premium
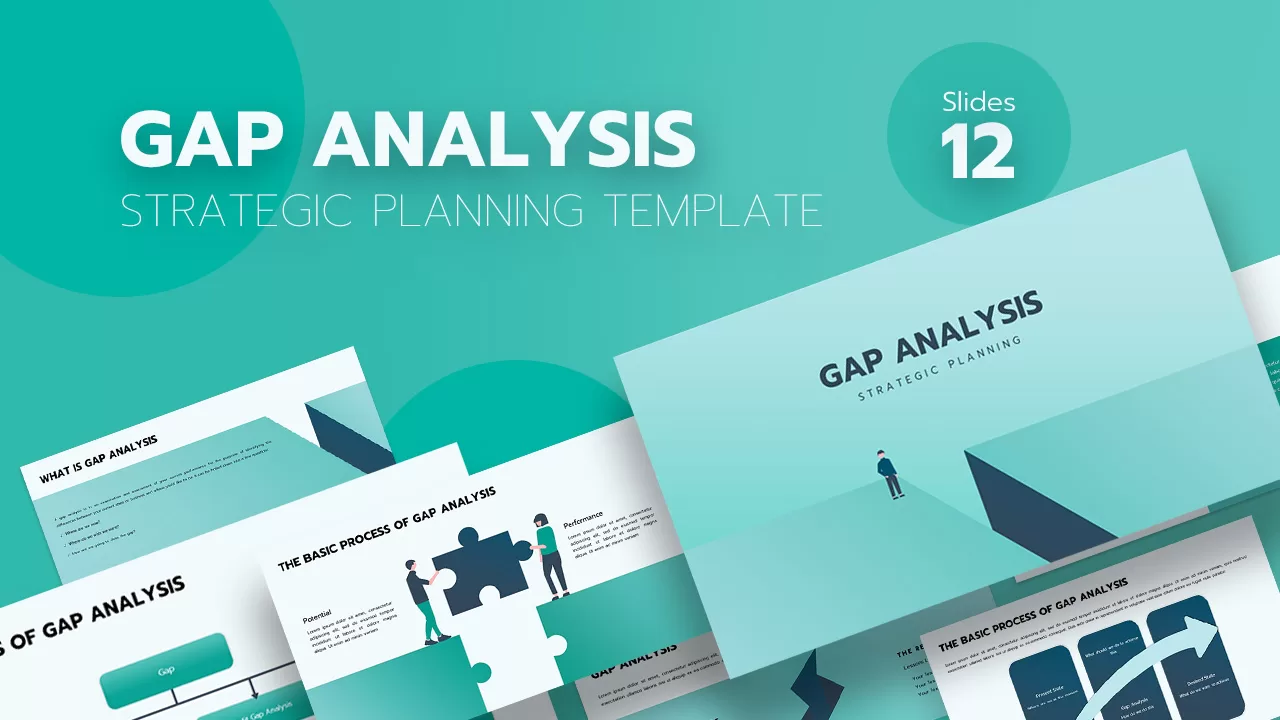
Gap Analysis Strategic Planning for PowerPoint & Google Slides
Business
Premium
SOSTAC Marketing Planning Model for PowerPoint & Google Slides
Business
Premium
Three-Phase Planning Gear Infographic Template for PowerPoint & Google Slides
Process
Premium
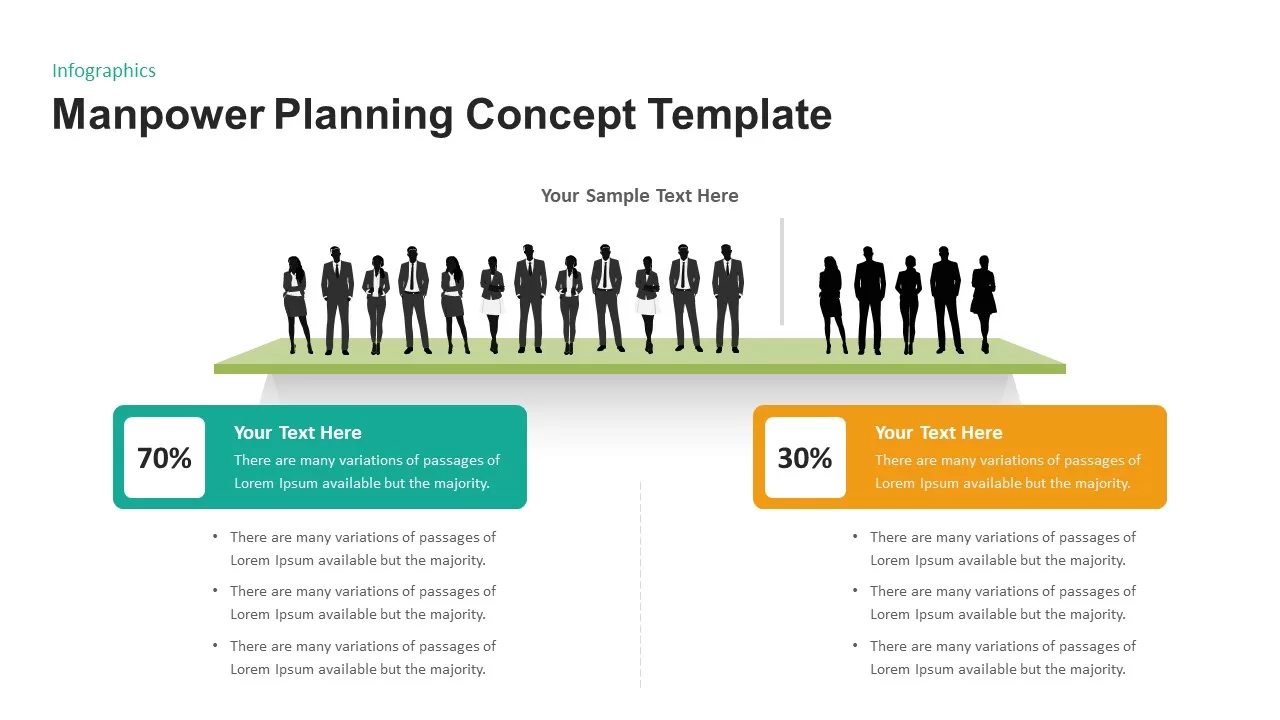
Manpower Planning Concept Comparison Template for PowerPoint & Google Slides
Comparison Chart
Premium
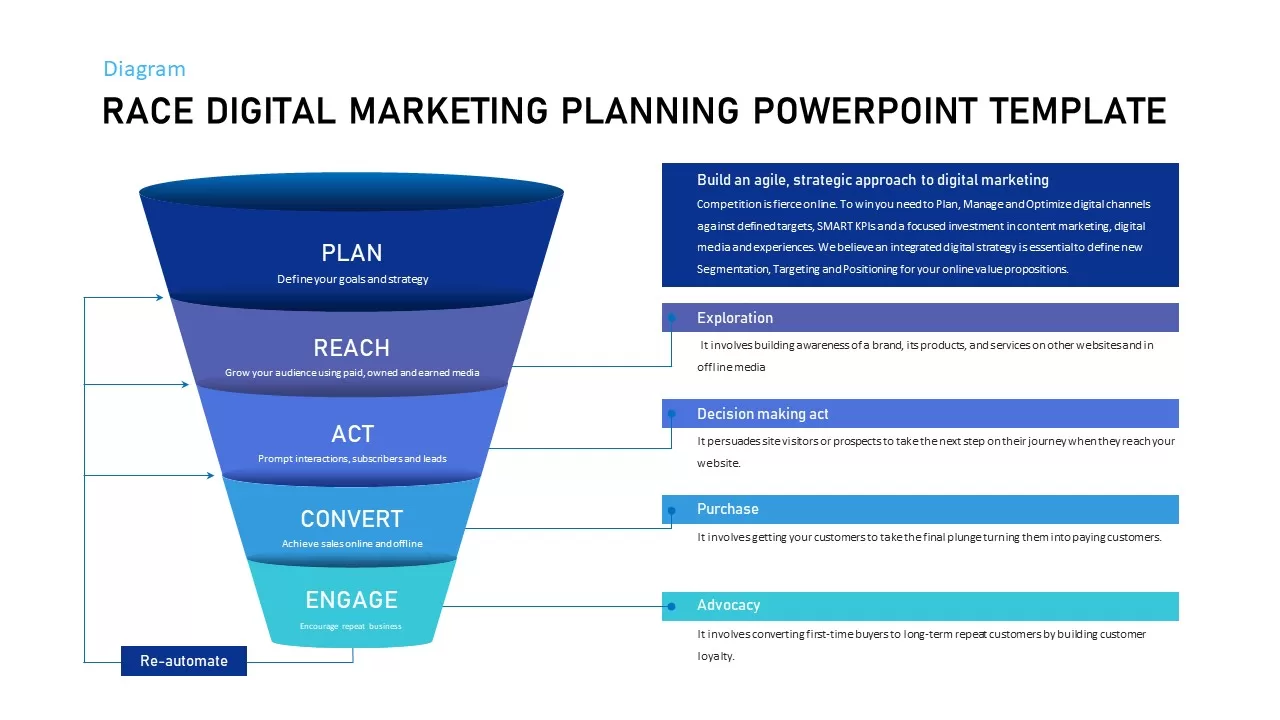
Race Digital Marketing Planning Templates for PowerPoint & Google Slides
Digital Marketing
Premium
5 Step Sales Planning Infographics Template for PowerPoint & Google Slides
Process
Premium
Gap Analysis Strategic Planning Template for PowerPoint & Google Slides
Gap
Premium
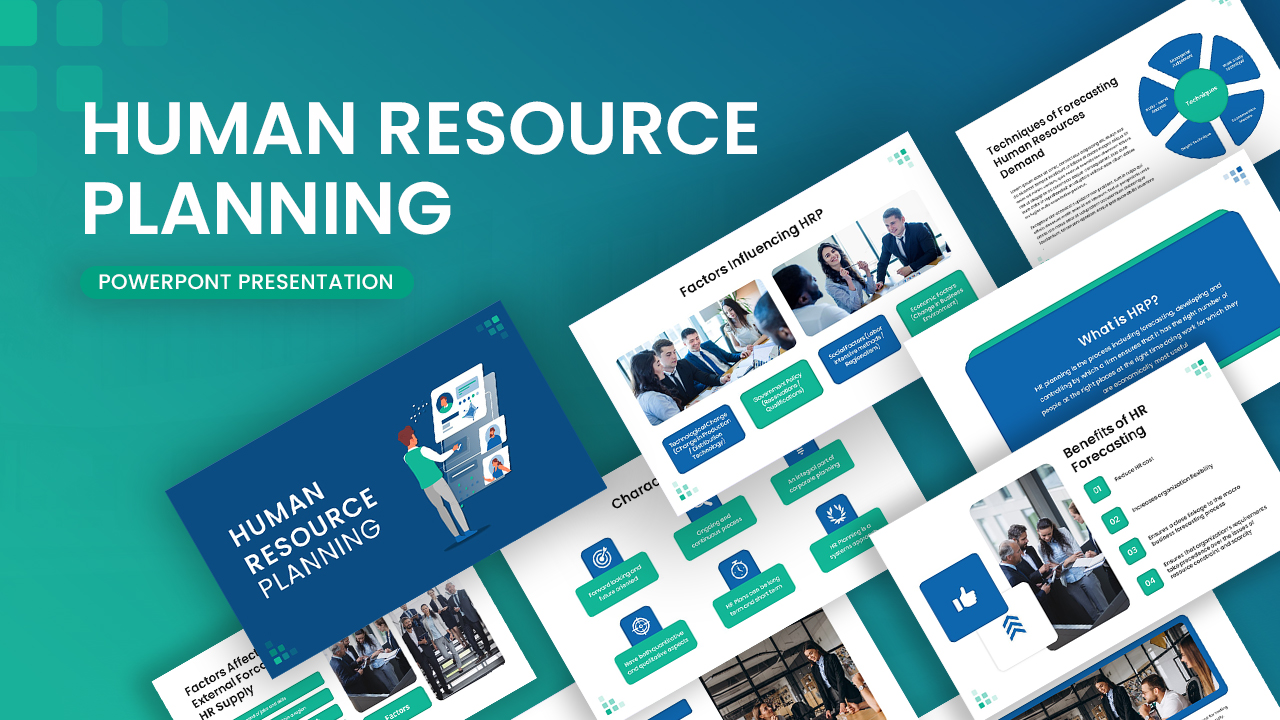
Human Resource Planning Template for PowerPoint & Google Slides
Decks
Premium
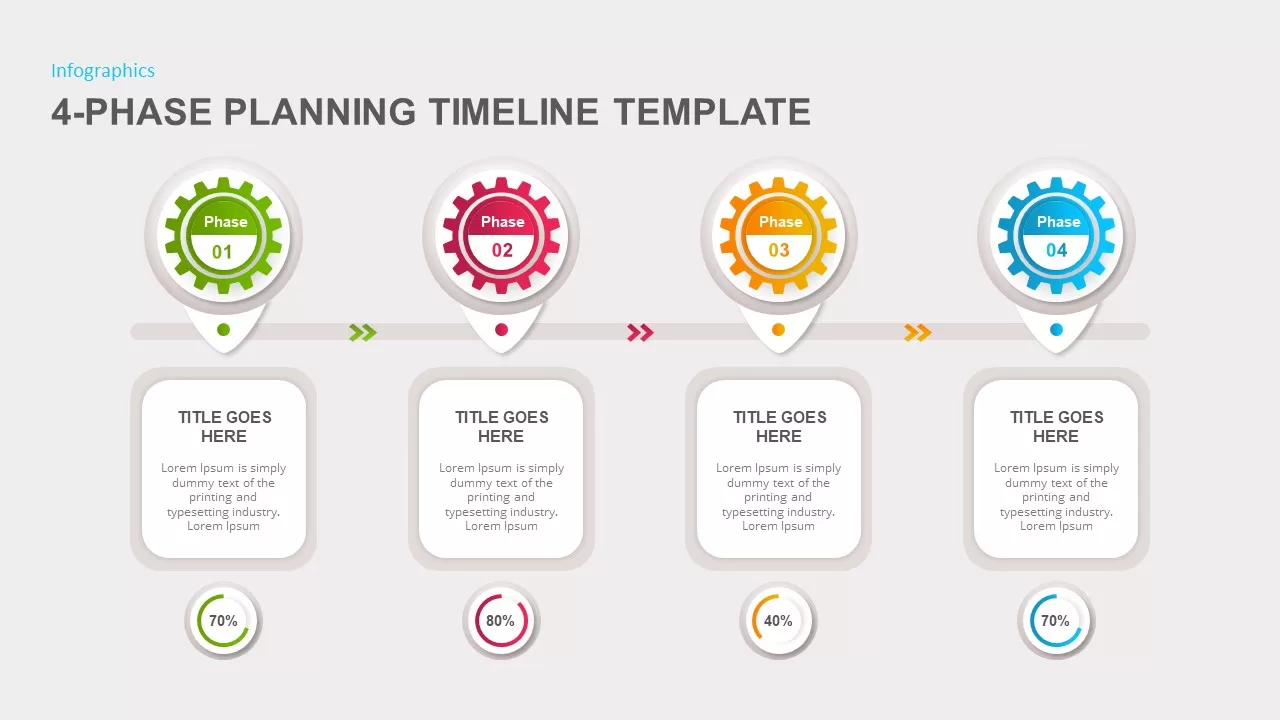
4-Phase Planning Timeline template for PowerPoint & Google Slides
Infographics
Premium
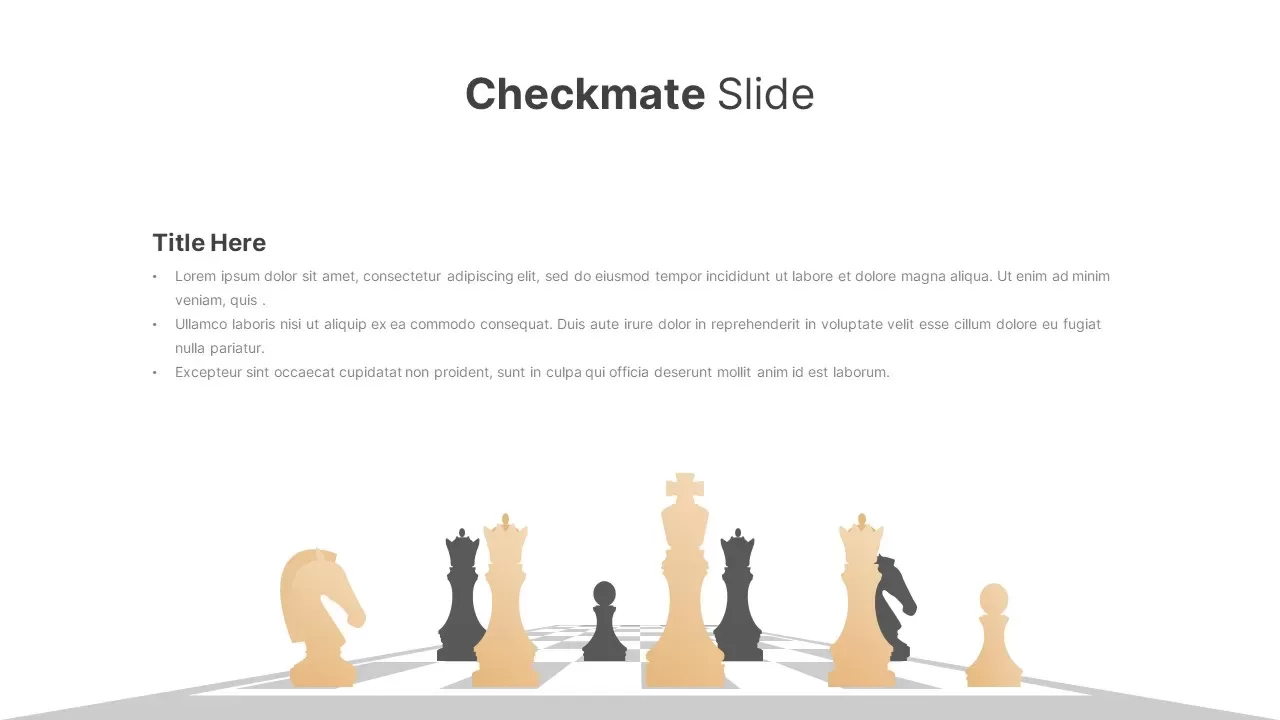
Strategic Checkmate Slide for Planning Template for PowerPoint & Google Slides
Business Report
Premium
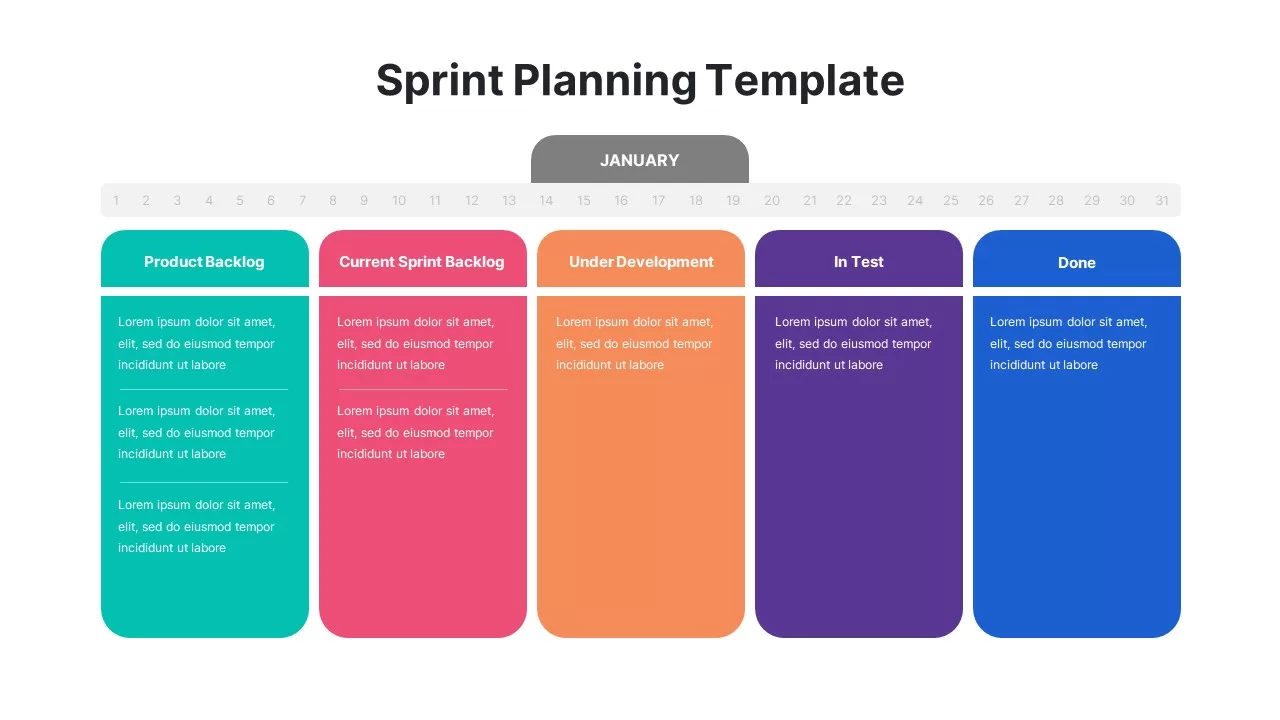
Sprint Planning Timeline & Backlog Cards Template for PowerPoint & Google Slides
Timeline
Premium
Comprehensive Resource Planning Table Template for PowerPoint & Google Slides
Project
Premium
Organic Strategic Planning Model Template for PowerPoint & Google Slides
Business Strategy
Premium
Issue-Based Strategic Planning Model Template for PowerPoint & Google Slides
Business Strategy
Premium
Real-Time Strategic Planning Pyramid Slide for PowerPoint & Google Slides
Business Strategy
Premium
Iterative Strategic Planning Cycle Template for PowerPoint & Google Slides
Business Strategy
Premium
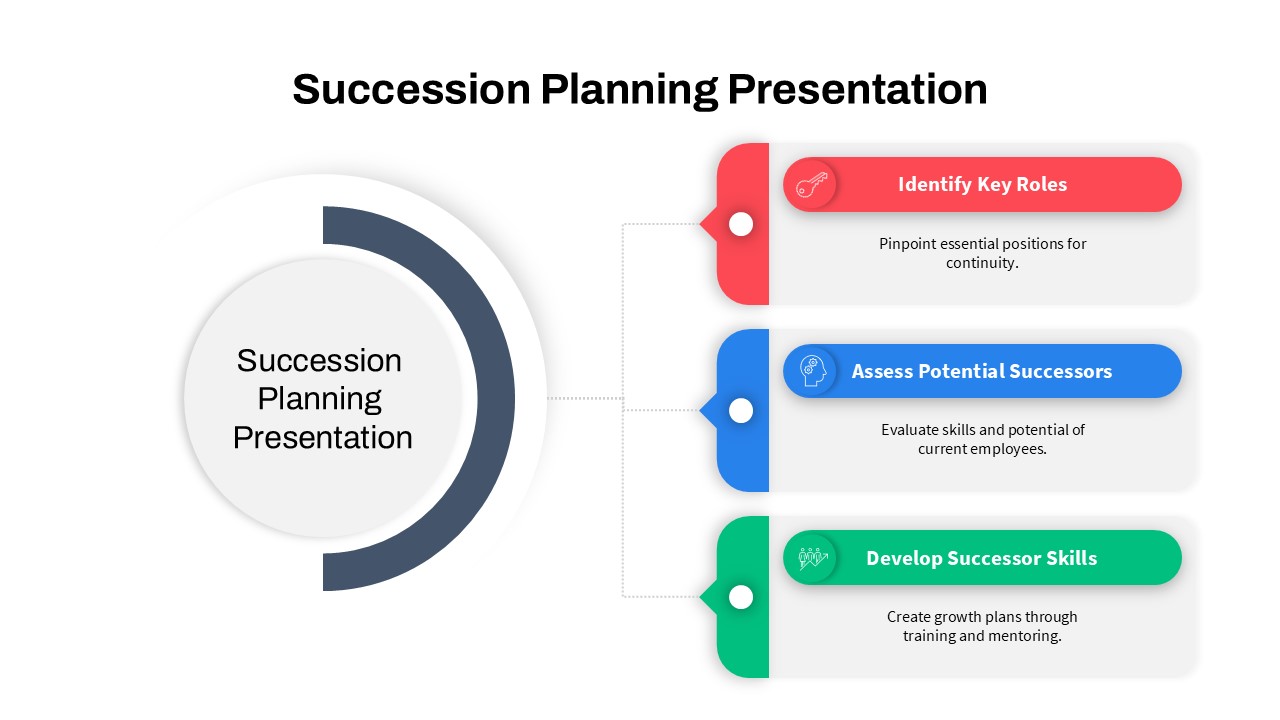
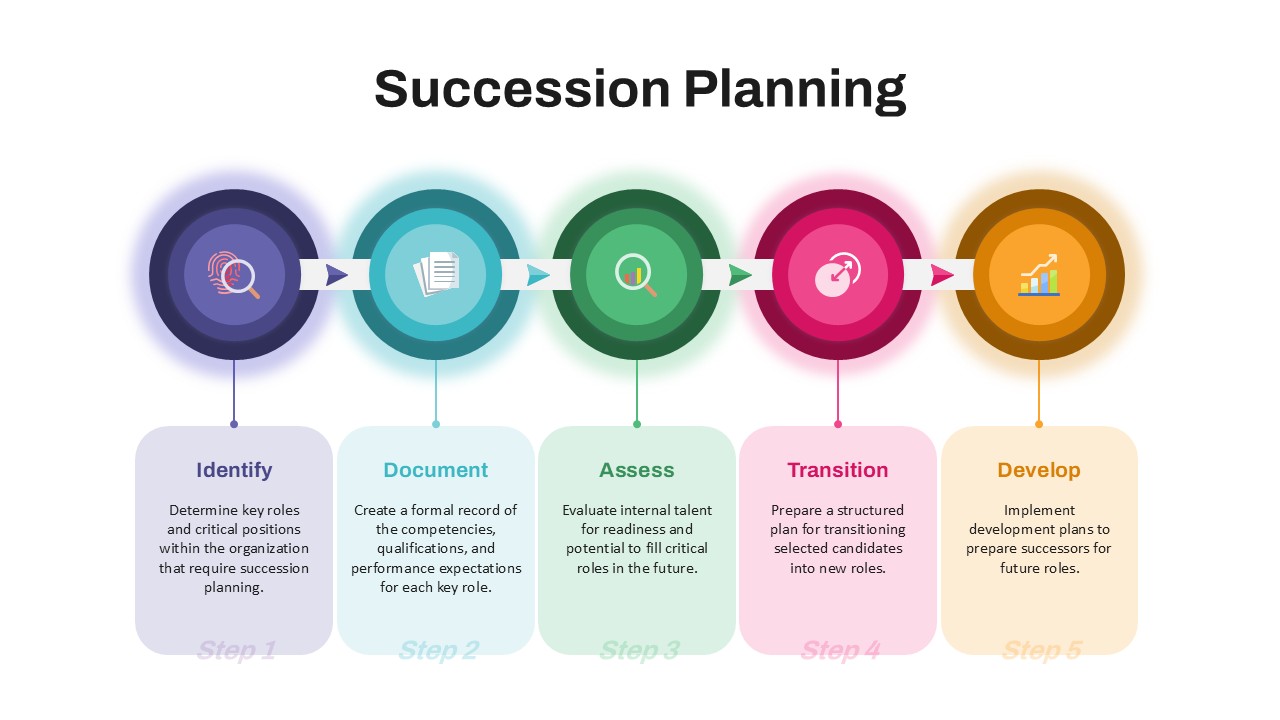
Succession Planning Presentation Template for PowerPoint & Google Slides
Company Profile
Premium
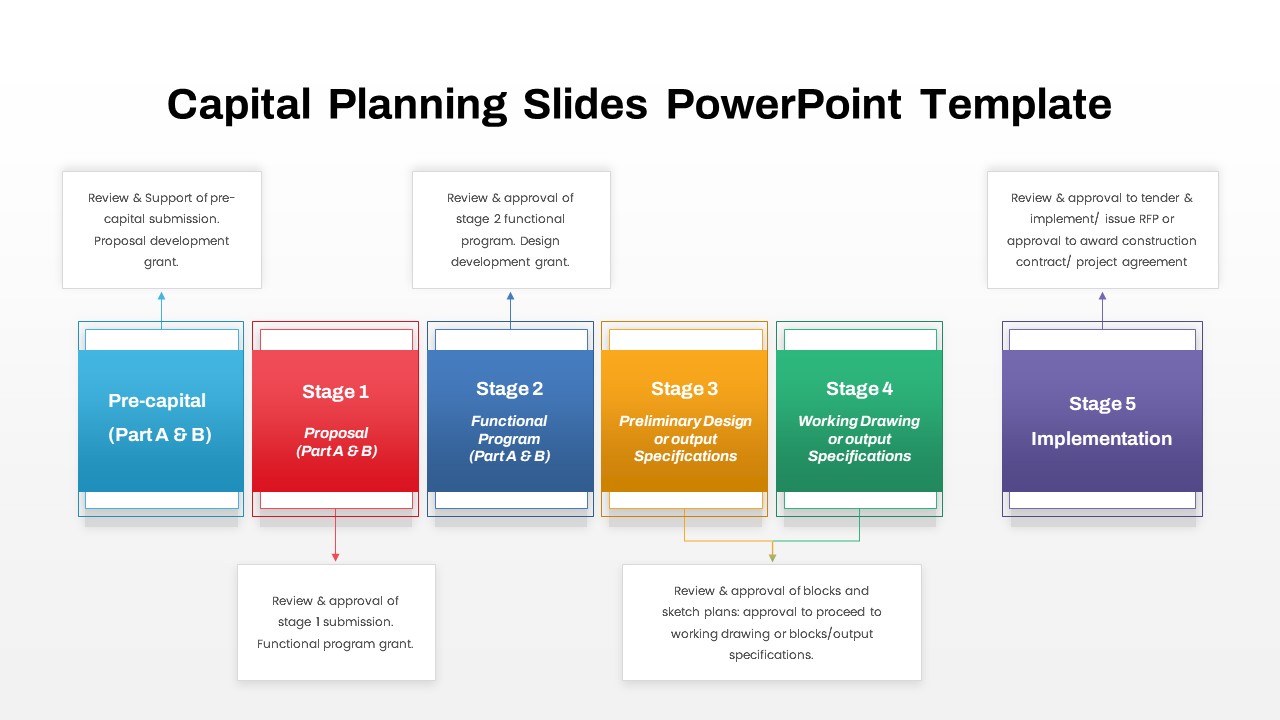
Capital Planning Five-Stage Process template for PowerPoint & Google Slides
Process
Premium
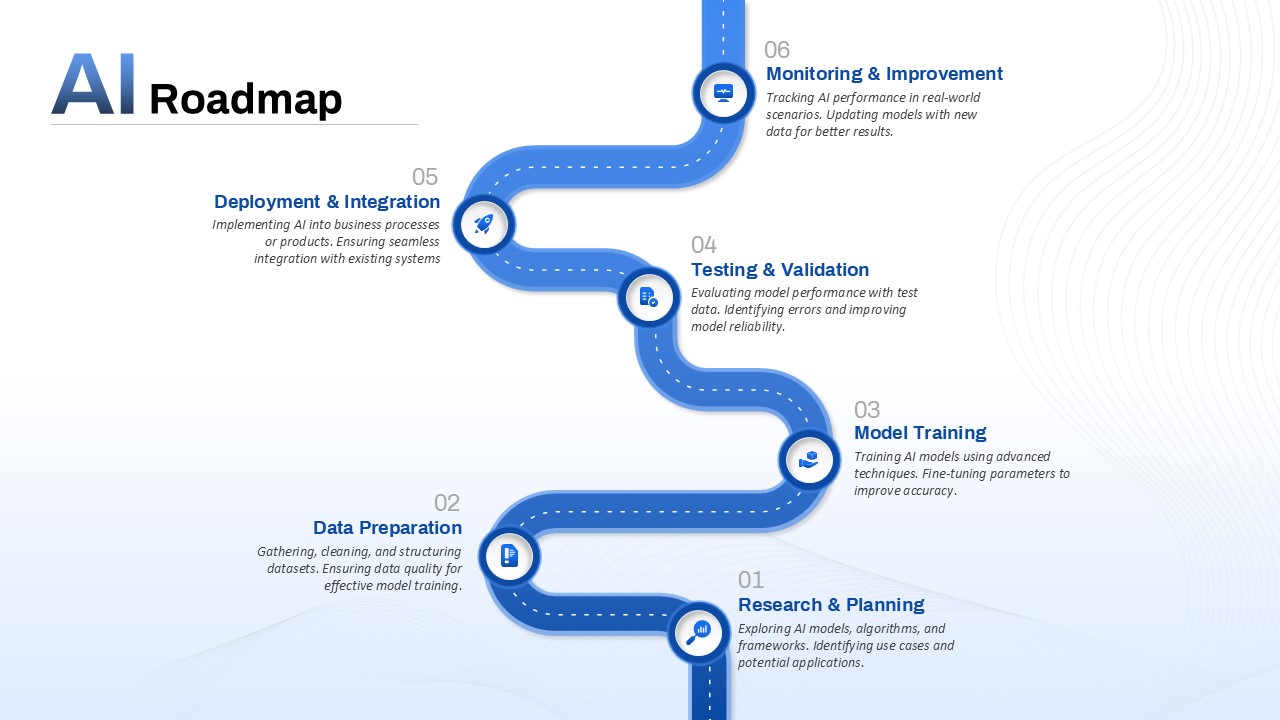
AI Roadmap & Planning Timeline Template for PowerPoint & Google Slides
Roadmap
Premium
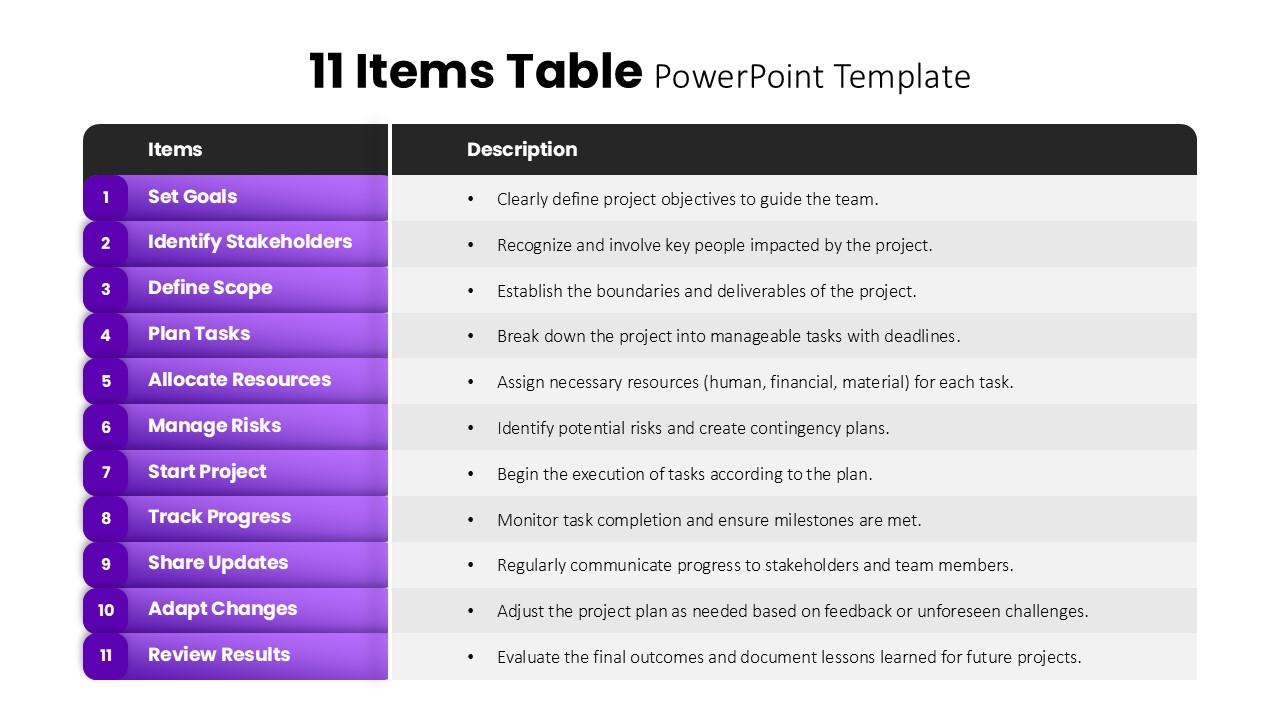
11 Items Table Project Planning Steps template for PowerPoint & Google Slides
Business Plan
Premium
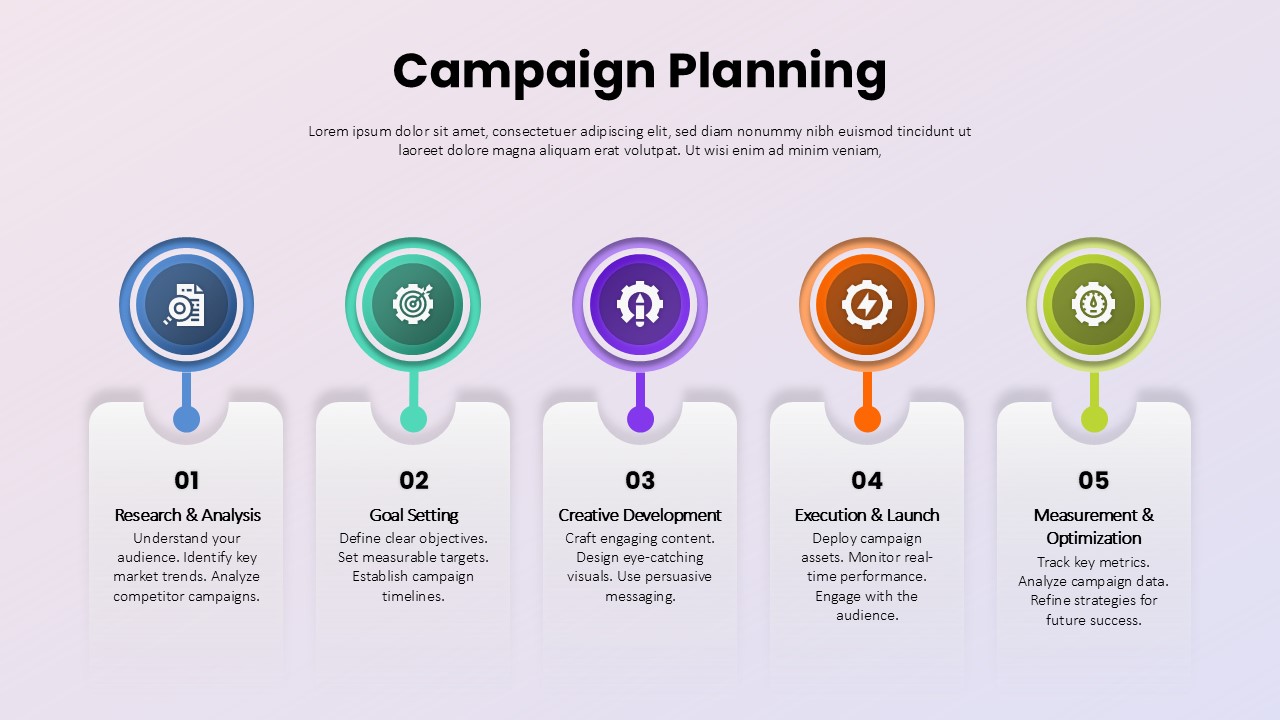
Campaign Planning Process template for PowerPoint & Google Slides
Process
Premium
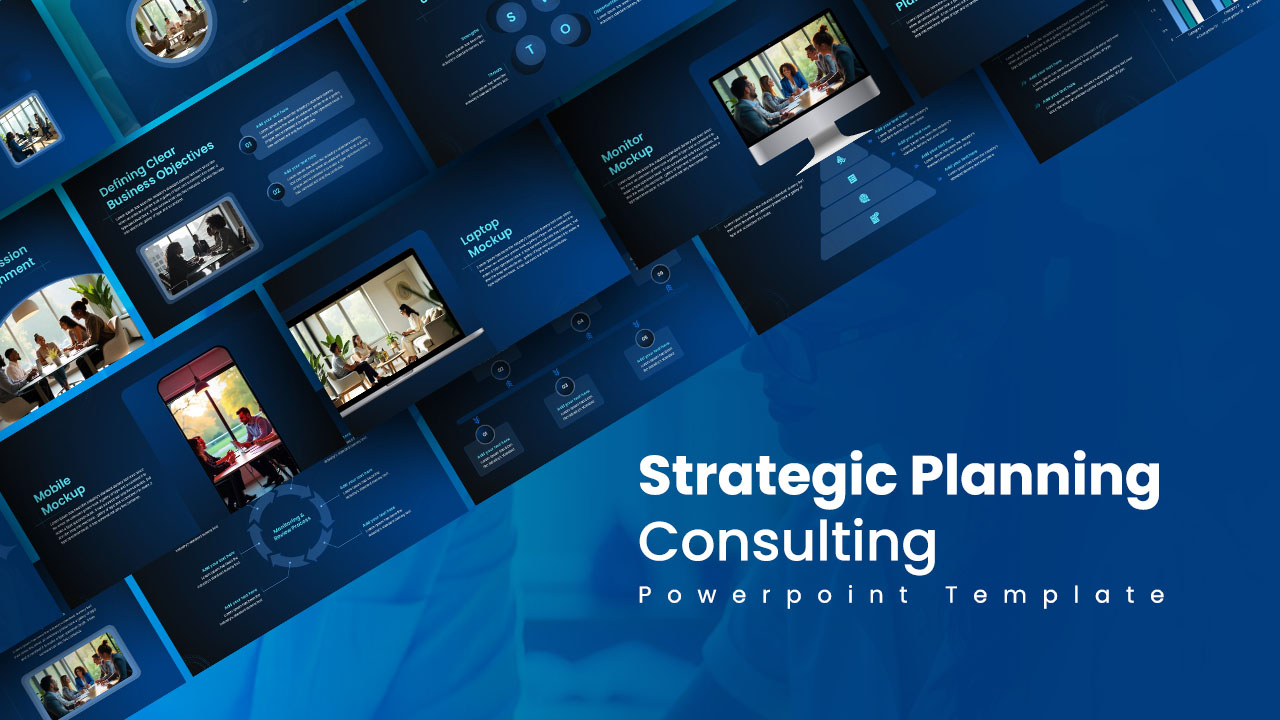
Strategic Planning Consulting Template for PowerPoint & Google Slides
Business Strategy
Premium
Event Planning Gantt Chart template for PowerPoint & Google Slides
Business
Premium
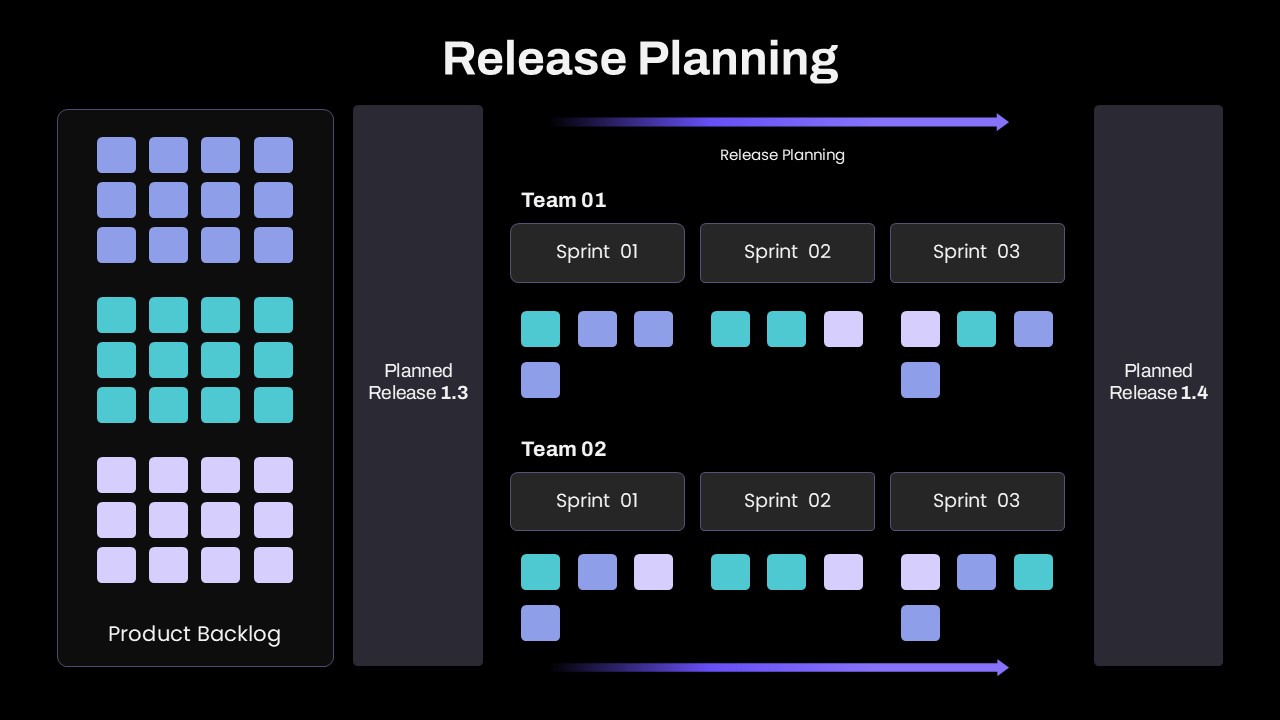
Release Planning Template for PowerPoint & Google Slides
Scrum
Premium
Advanced Succession Planning Workflow Template for PowerPoint & Google Slides
Employee Performance
Premium
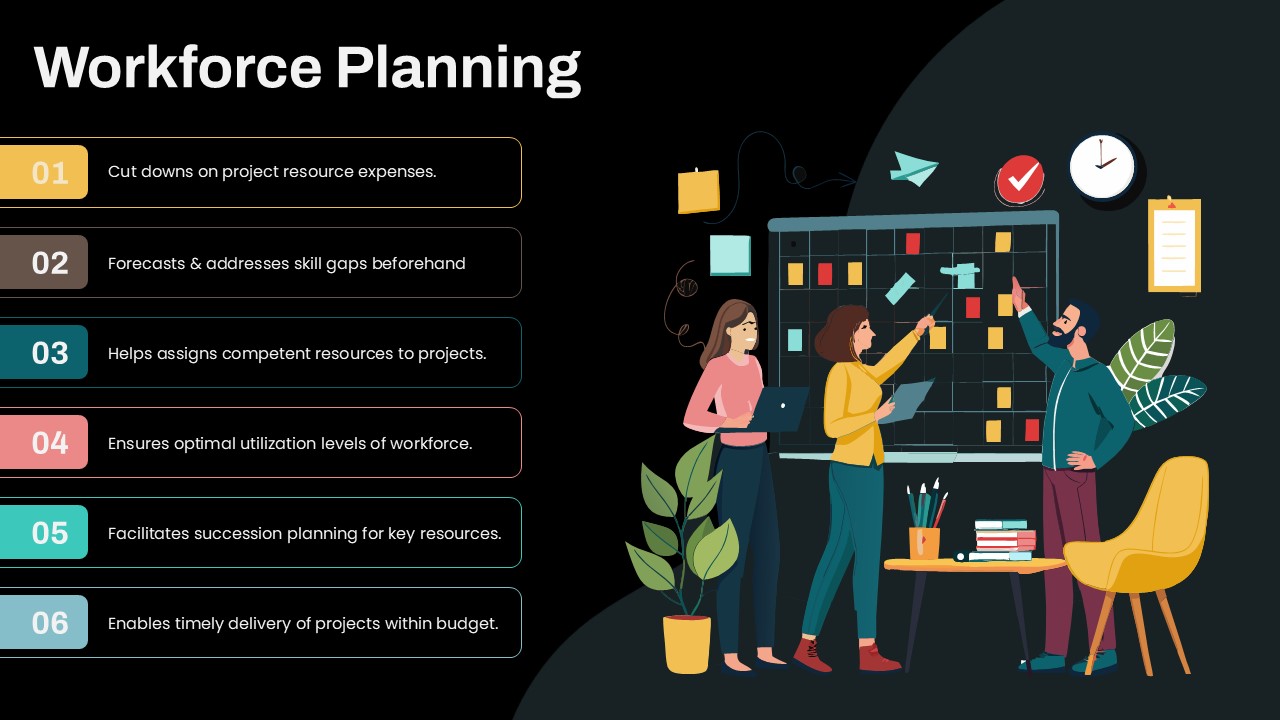
Workforce Planning Benefits Infographic Template for PowerPoint & Google Slides
HR
Premium
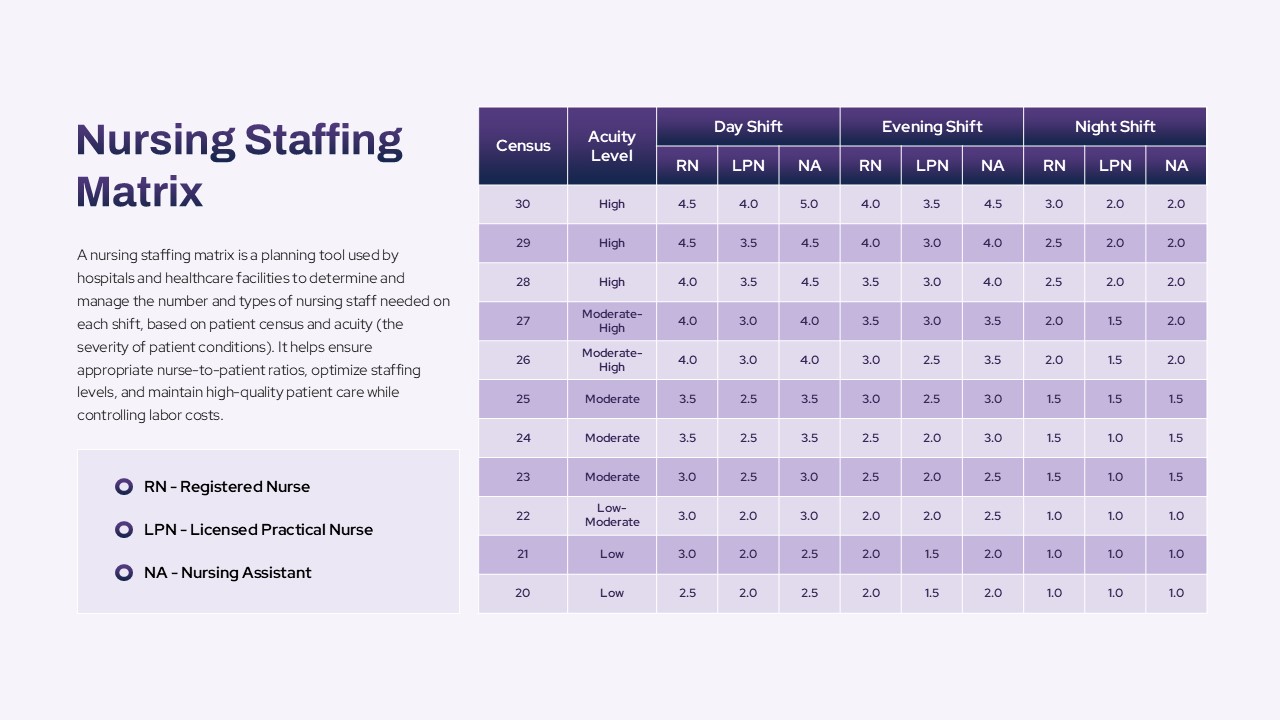
Nursing Staffing Matrix Planning Template for PowerPoint & Google Slides
Nursing
Premium
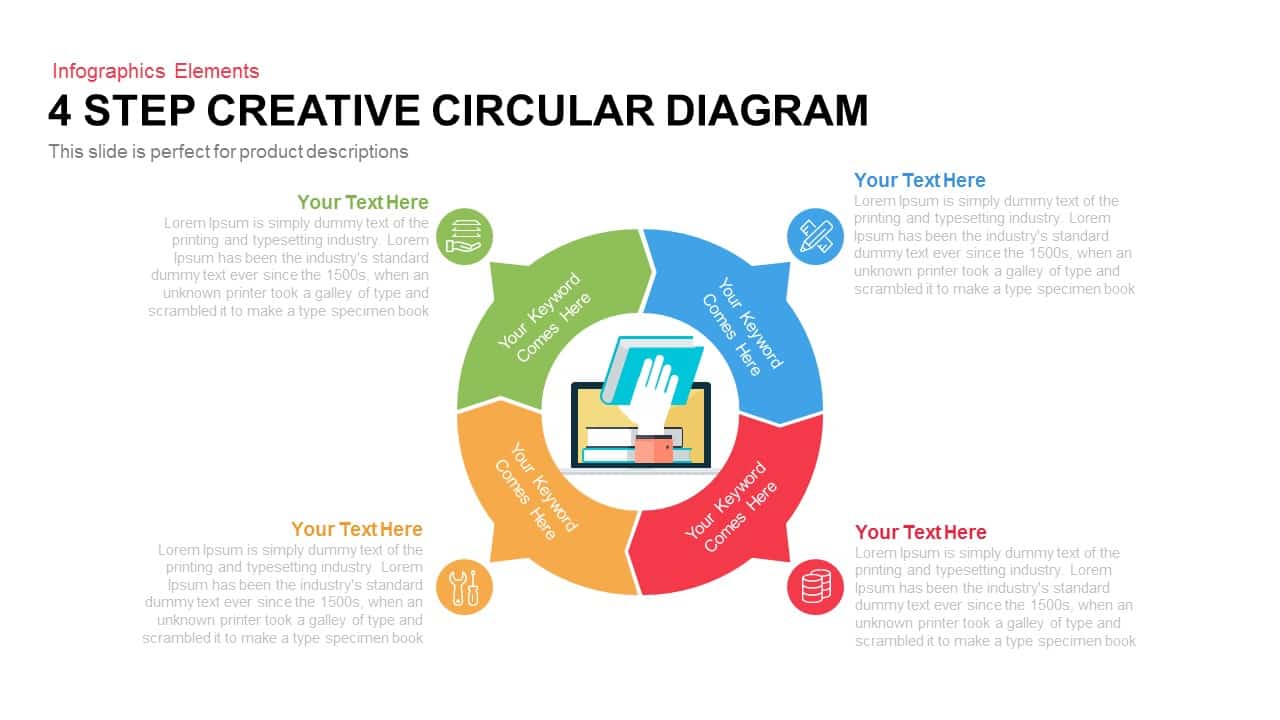
4 Step Creative Circular Diagram Template for PowerPoint & Google Slides
Infographics
Premium
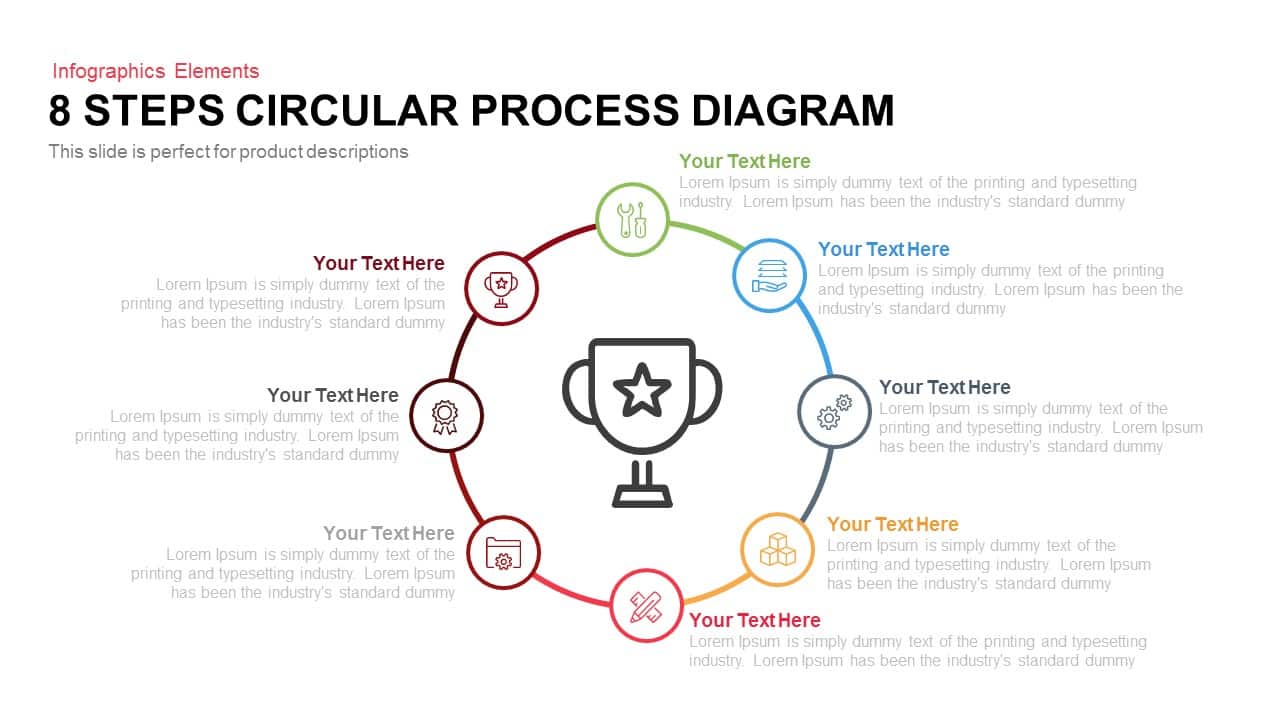
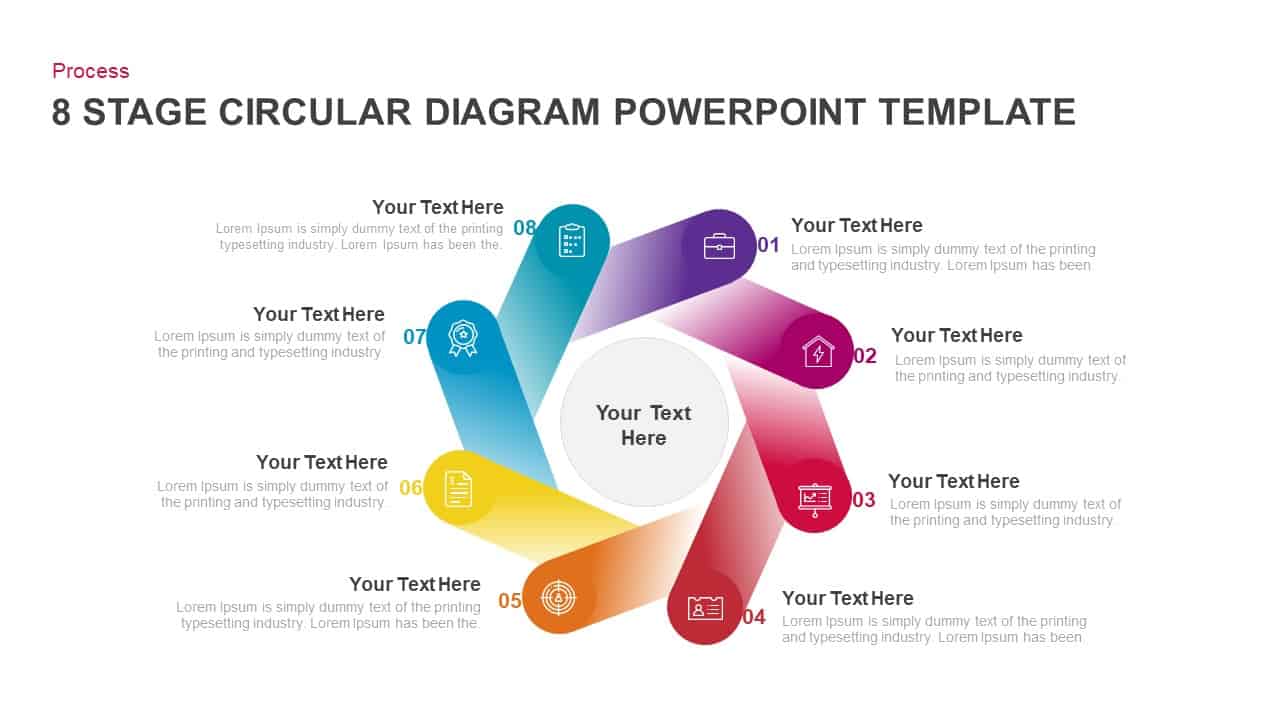
8 Steps Circular Process Diagram Template for PowerPoint & Google Slides
Process
Premium
Six Step Creative Circular Diagram Template for PowerPoint & Google Slides
Circle
Premium
Six Steps Circular CRM Diagram Template for PowerPoint & Google Slides
Customer Journey
Premium
4 Step 3D Circular Process Diagram template for PowerPoint & Google Slides
Process
Premium
Eight Section Circular Diagram Template for PowerPoint & Google Slides
Circle
Premium
Six Section Circular Infographic Diagram Template for PowerPoint & Google Slides
Circle
Premium
Eight-Section Circular Diagram template for PowerPoint & Google Slides
Circle
Premium
Four-Stage Business Circular Diagram Template for PowerPoint & Google Slides
Process
Premium

Light Bulb Idea Circular Diagram Template for PowerPoint & Google Slides
Infographics
Premium
Five-Section Circular Arrow Diagram Template for PowerPoint & Google Slides
Circle
Premium
12 Step Circular Diagram for PowerPoint & Google Slides
Process
Premium

8-Step Circular Arrow Diagram Template for PowerPoint & Google Slides
Arrow
Premium
Four Section Circular Text Boxes Diagram Template for PowerPoint & Google Slides
Circle
Premium
Eight-Step Circular Diagram Infographic Template for PowerPoint & Google Slides
Circle
Premium

8-Step Puzzle Circular Diagram Template for PowerPoint & Google Slides
Circle
Premium
4 Staged Circular Business Process Diagram template for PowerPoint & Google Slides
Process
Premium
Six-Stage Circular Diagram Process Template for PowerPoint & Google Slides
Circle
Premium
8 Steps Circular Process Diagram Template for PowerPoint & Google Slides
Circle
Premium
Five Stage Circular Arrow Diagram Template for PowerPoint & Google Slides
Process
Premium
Five-Stage Circular Process Flow Diagram Template for PowerPoint & Google Slides
Circle
Premium
Five-Step Circular Process Diagram Template for PowerPoint & Google Slides
Circle
Premium
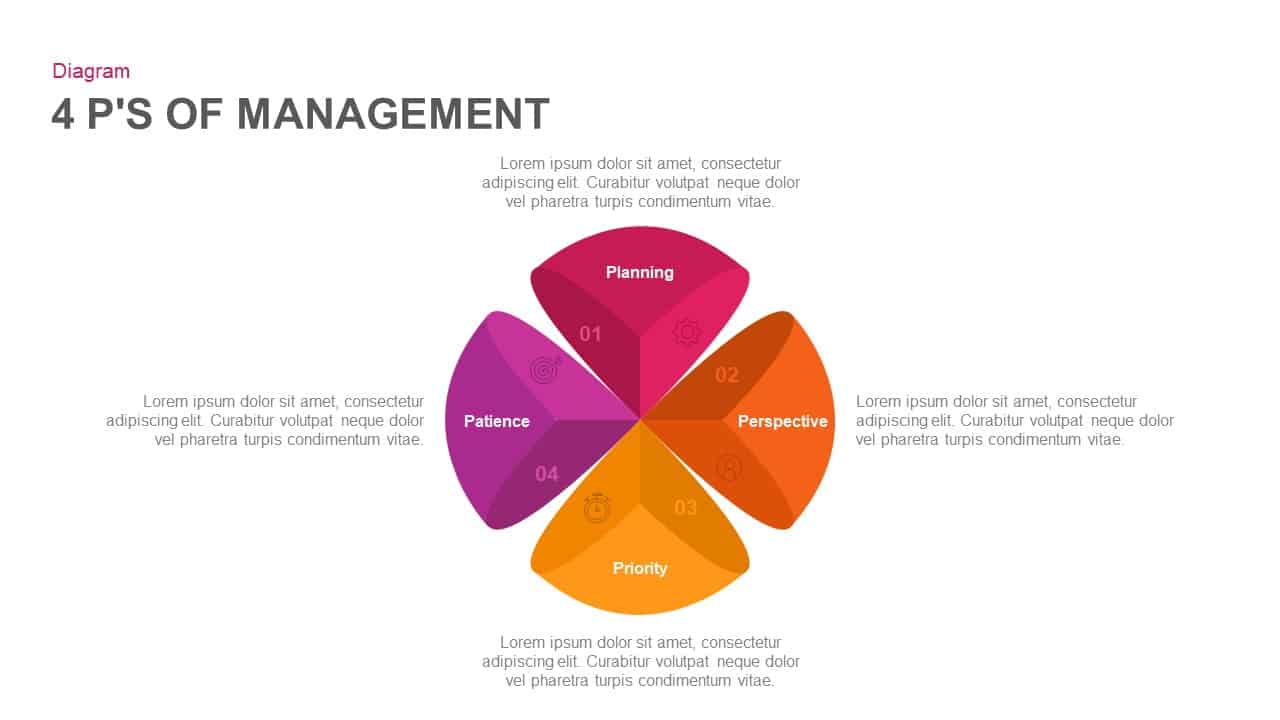
4 Ps of Management Circular Diagram Template for PowerPoint & Google Slides
Circle
Premium
Six-Stage Clockwise Circular Diagram Template for PowerPoint & Google Slides
Circle
Premium
Circular Three-Step Infographic Diagram Template for PowerPoint & Google Slides
Circle
Premium
8 Step Circular Process Flow Diagram Template for PowerPoint & Google Slides
Process
Premium
6-Step Circular Process Flow Diagram Template for PowerPoint & Google Slides
Process
Premium
8-Stage Chevron Circular Diagram Template for PowerPoint & Google Slides
Process
Premium
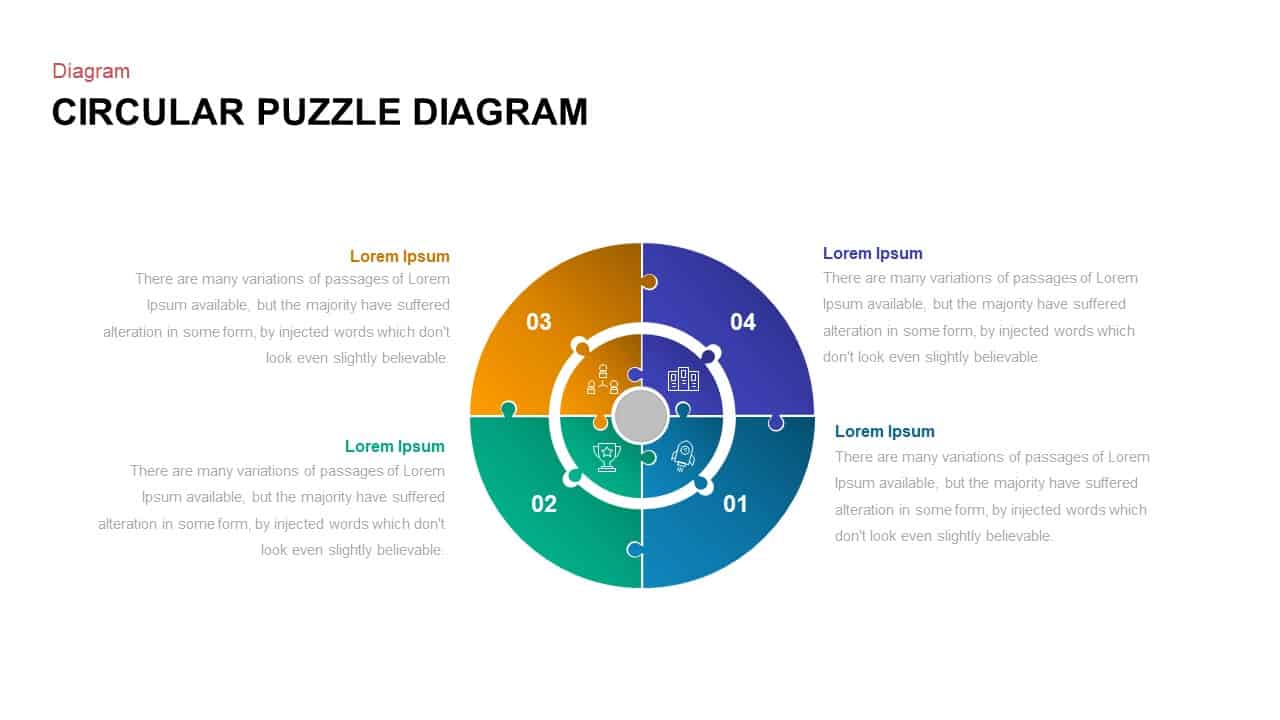
Colorful Circular Puzzle Diagram Template for PowerPoint & Google Slides
Circle
Premium
Eight Step Circular Diagram Template for PowerPoint & Google Slides
Circle
Premium
4 Staged Circular Business Process Diagram for PowerPoint & Google Slides
Process
Premium
6-Part Circular Gear Infographic Diagram Template for PowerPoint & Google Slides
Process
Premium
Agile Lifecycle Circular Diagram Template for PowerPoint & Google Slides
Circle
Premium
Circular CRM Process Infographic Diagram Template for PowerPoint & Google Slides
Circle
Premium
5S Lean Methodology Circular Diagram Template for PowerPoint & Google Slides
Process
Premium
4MAT Learning Cycle Circular Diagram Template for PowerPoint & Google Slides
Circle
Premium
Four-Item Circular Diagram Concept Template for PowerPoint & Google Slides
Circle
Premium
3 Step Creative Circular Diagram for PowerPoint & Google Slides
Process
Premium
8-Step Circular Diagram Infographics Template for PowerPoint & Google Slides
Circle
Premium
Circular 3D Cube Six-Segment Diagram Template for PowerPoint & Google Slides
Infographics
Premium
Circular Business Ecosystem Diagram Template for PowerPoint & Google Slides
Business Strategy
Premium
Competitive Intelligence Circular Diagram for PowerPoint & Google Slides
Circle
Premium
Free Circular Multi-Step Flow Chart Diagram Template for PowerPoint & Google Slides
Flow Charts
Free
Concentric Circular Arrow Cycle Diagram Template for PowerPoint & Google Slides
Process
Premium
10-Step Circular Process Diagram Template for PowerPoint & Google Slides
Process
Premium
10 Step Circular Process Diagram Template for PowerPoint & Google Slides
Circle
Premium
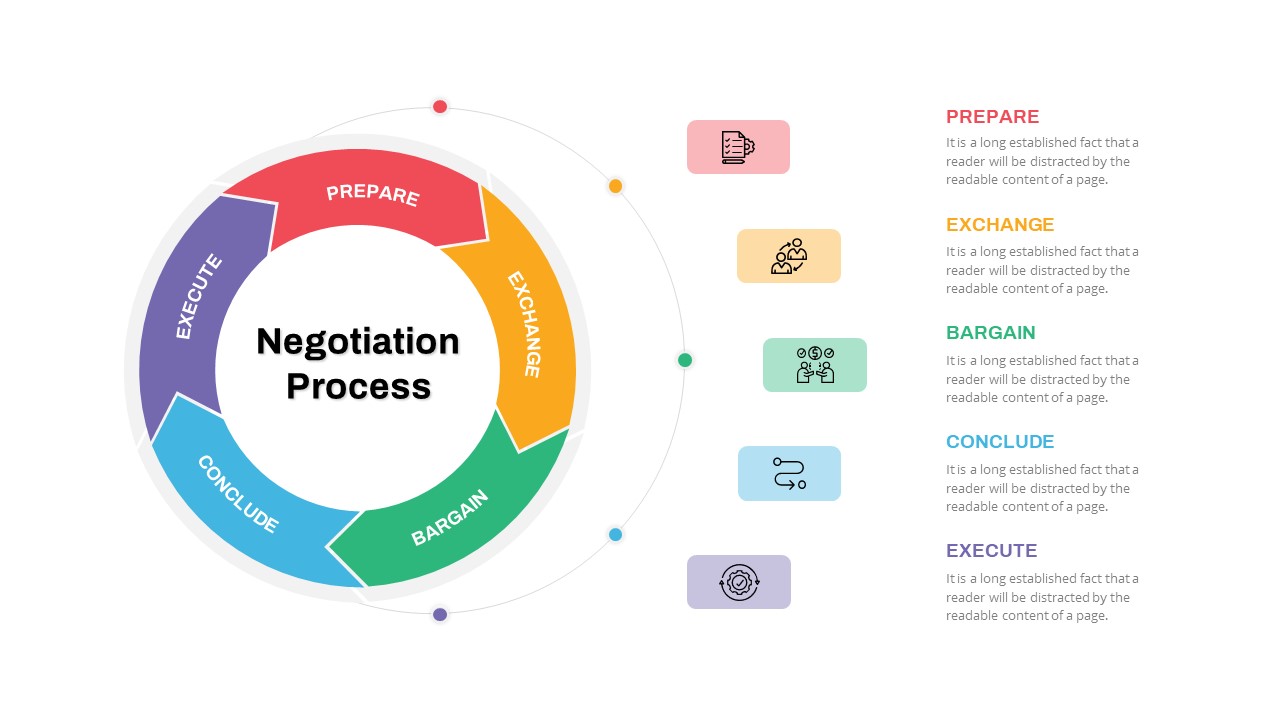
Negotiation Process Circular Diagram Template for PowerPoint & Google Slides
Circle
Premium
Release Management Cycle Circular Diagram Template for PowerPoint & Google Slides
Software Development
Premium
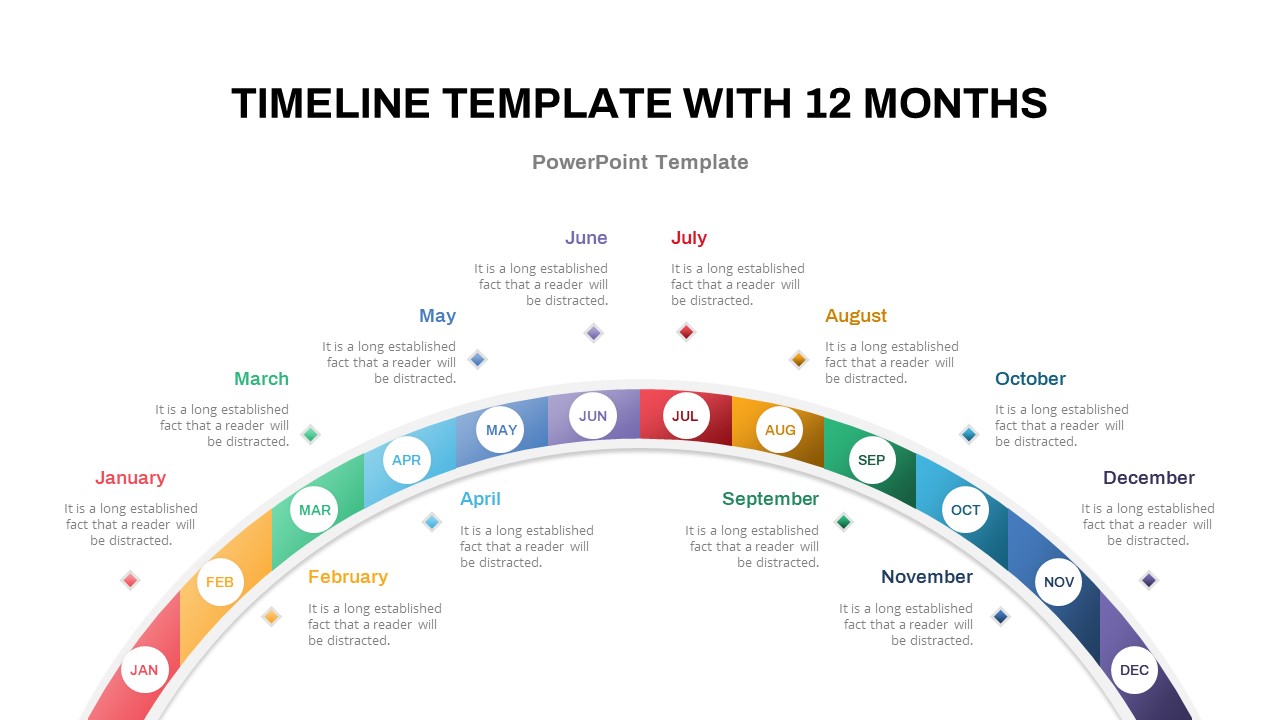
12-Month Semi-Circular Timeline Diagram Template for PowerPoint & Google Slides
Timeline
Premium
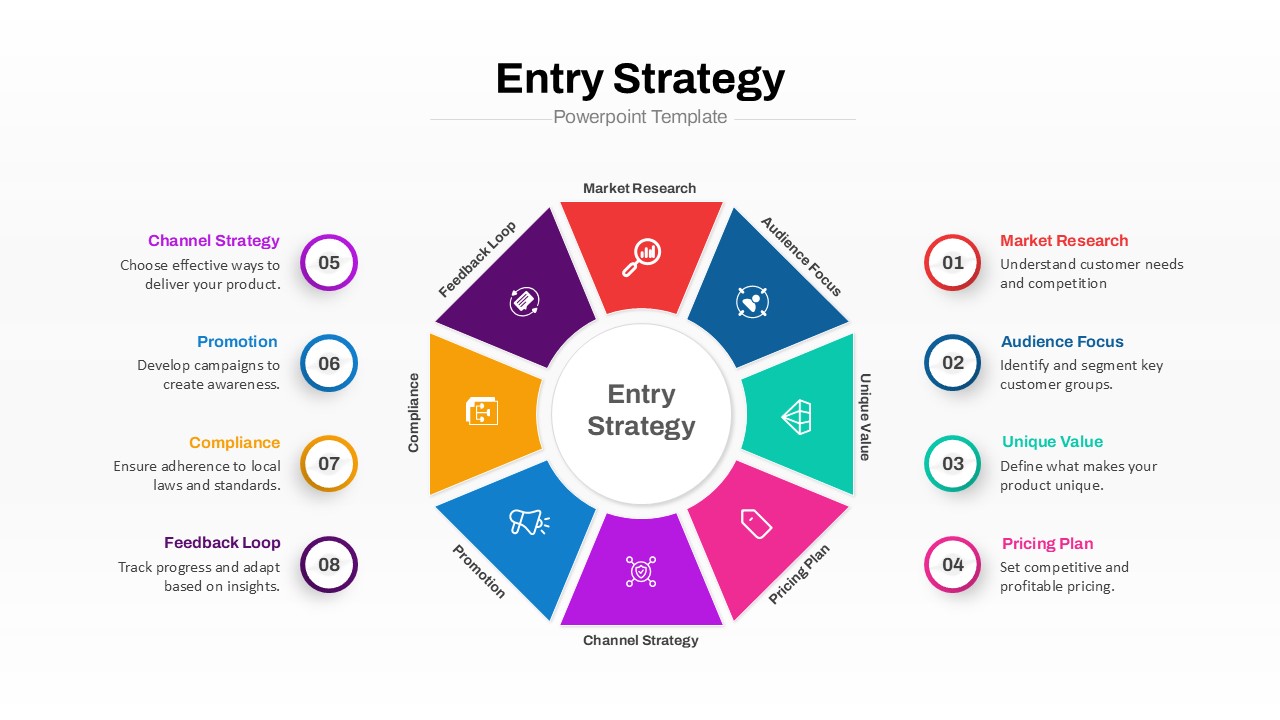
Entry Strategy Circular Diagram Template for PowerPoint & Google Slides
Circle
Premium
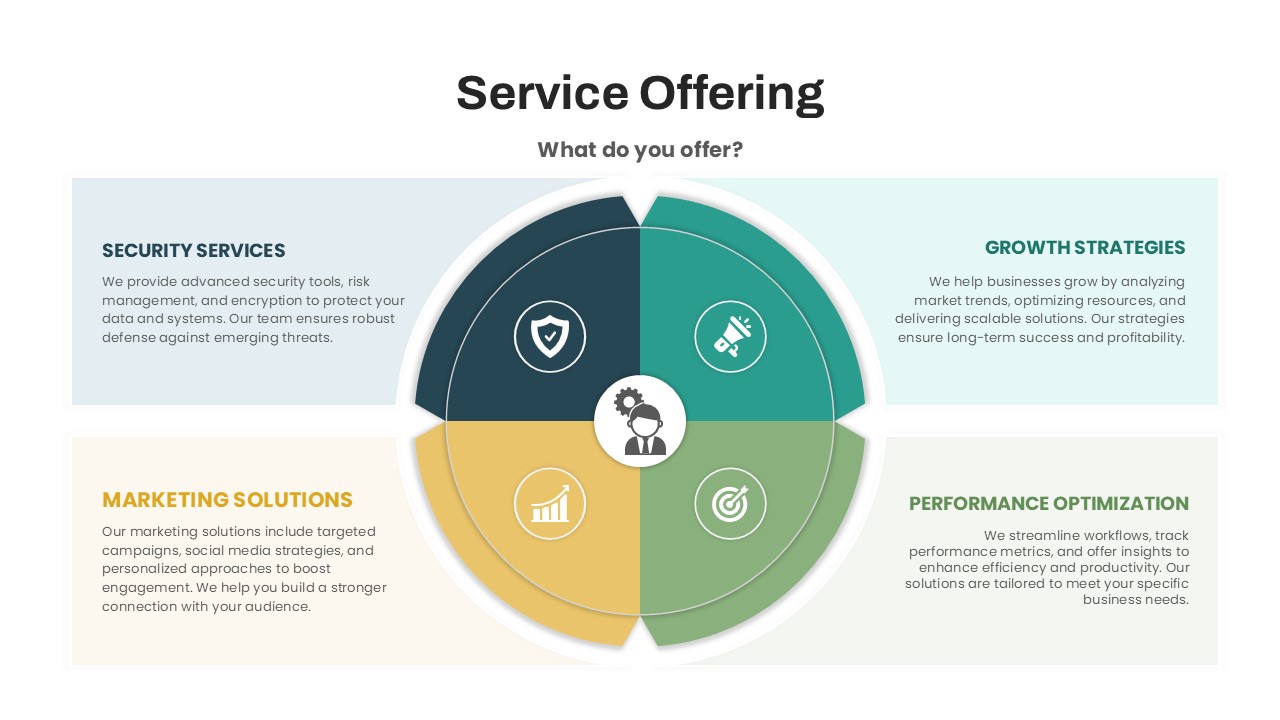
Circular Service Offering Diagram Template for PowerPoint & Google Slides
Circle
Premium
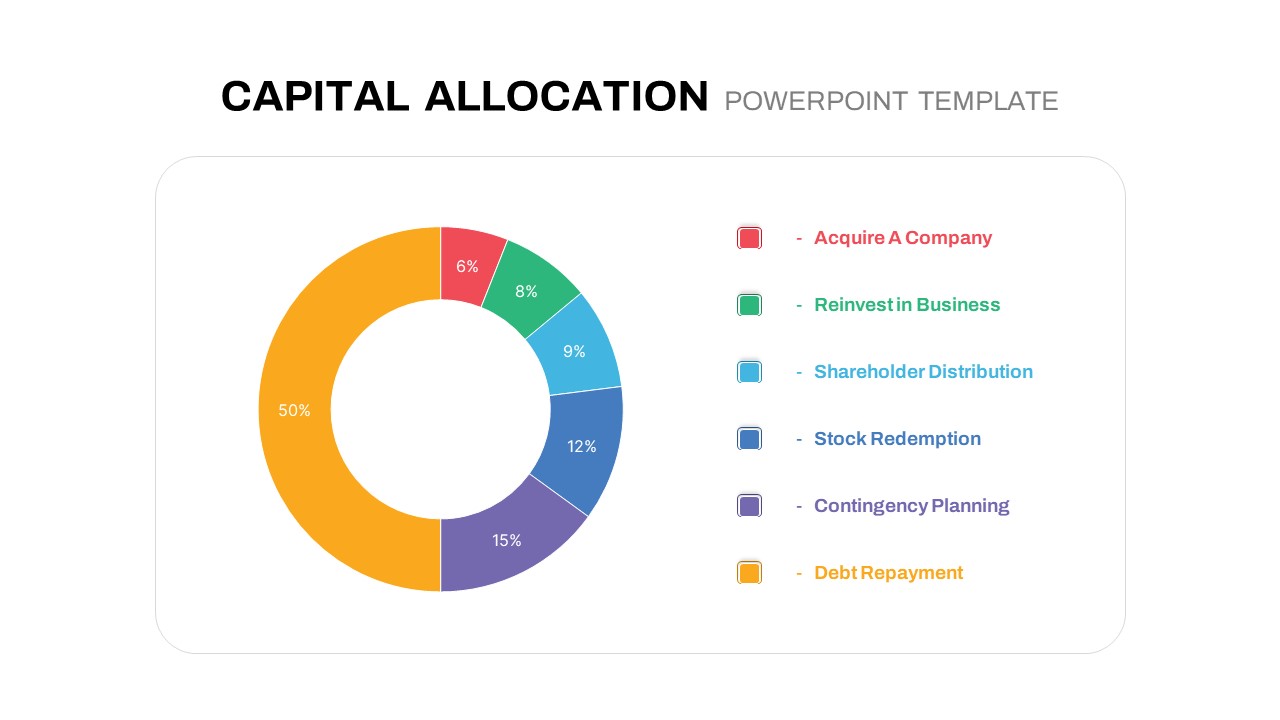
Circular Capital Allocation Diagram Template for PowerPoint & Google Slides
Business Models
Premium
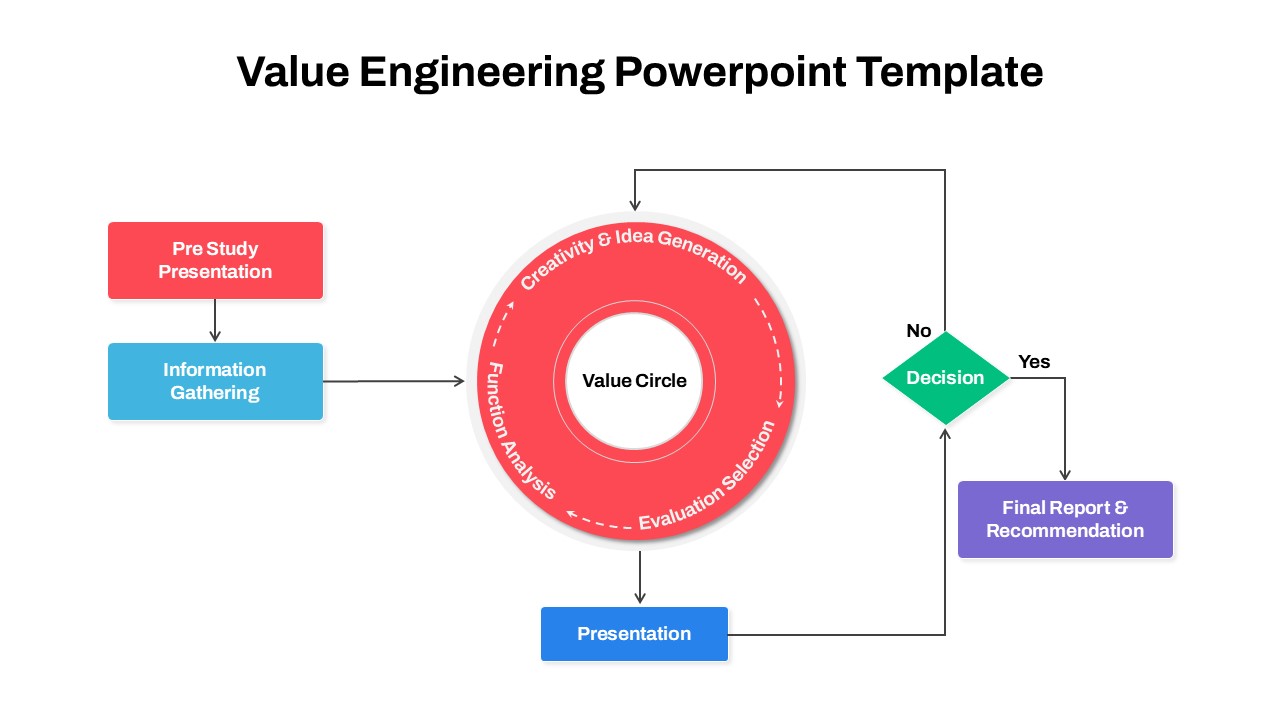
Circular Value Engineering Diagram Template for PowerPoint & Google Slides
Process
Premium
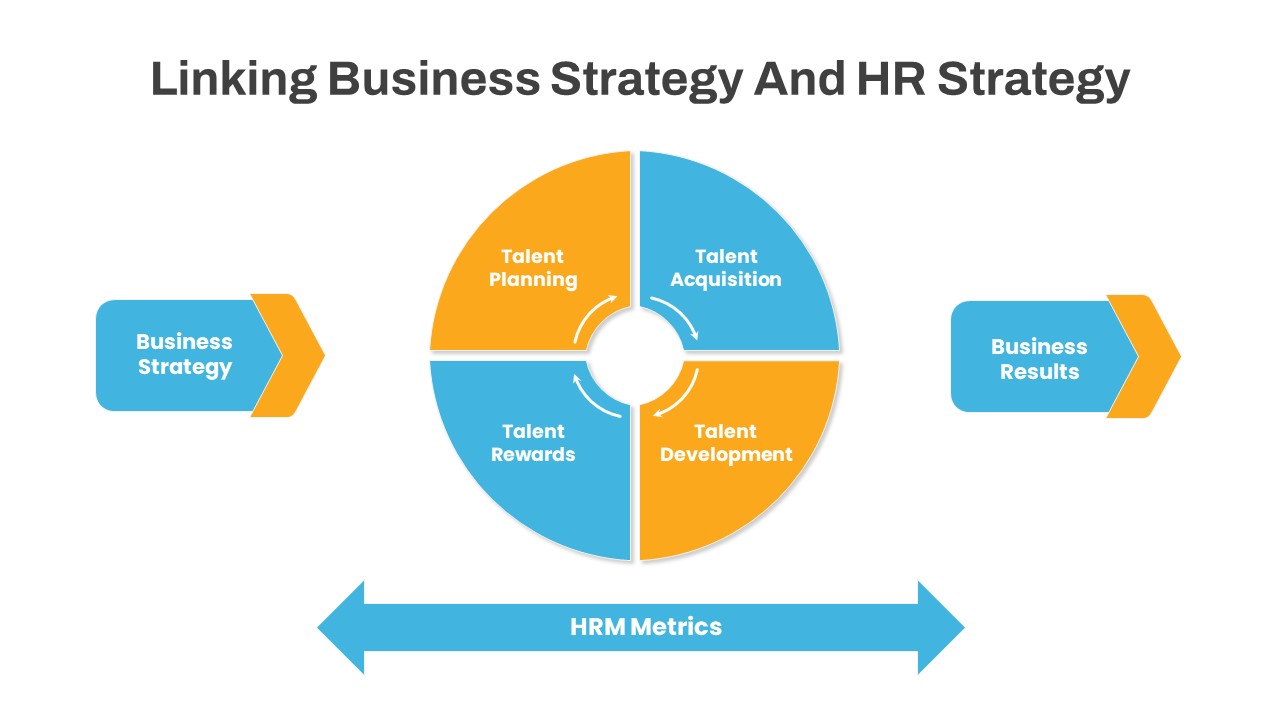
Linking Business HR Strategy Circular Diagram Template for PowerPoint & Google Slides
Business Strategy
Premium
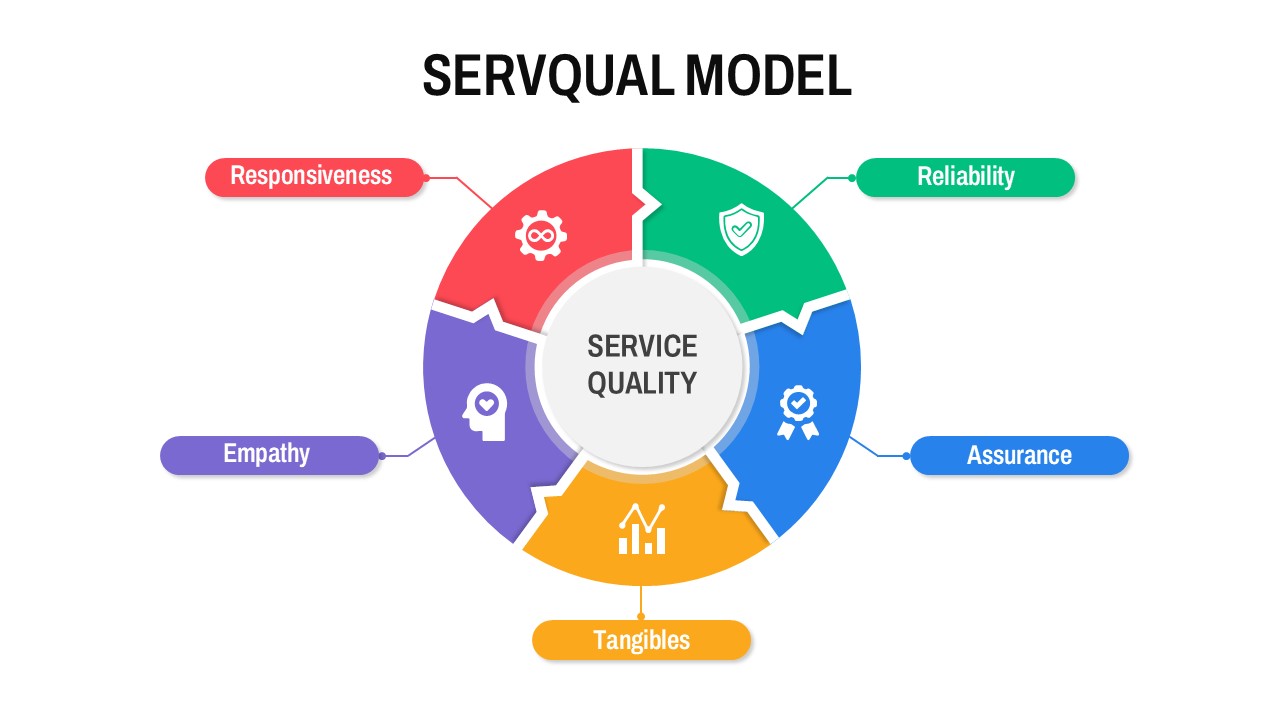
Circular SERVQUAL Model Diagram Template for PowerPoint & Google Slides
Business Strategy
Premium
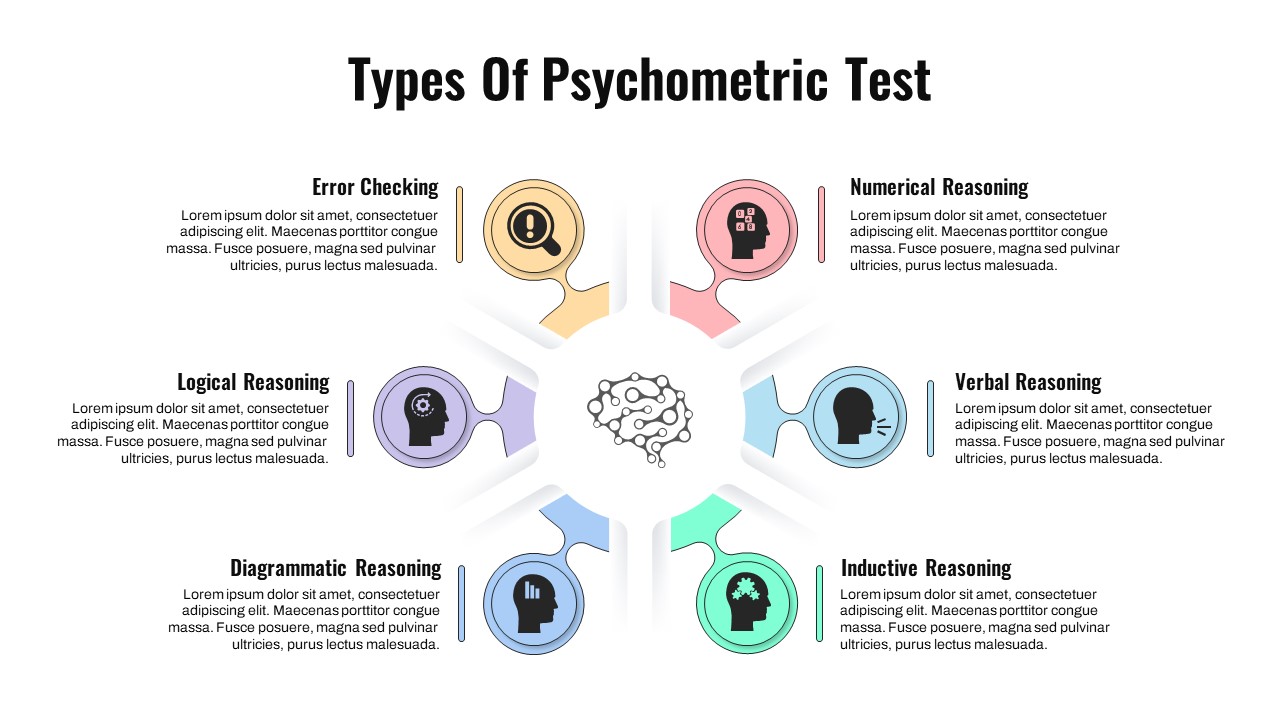
Psychometric Test Types Circular Diagram Template for PowerPoint & Google Slides
Circle
Premium
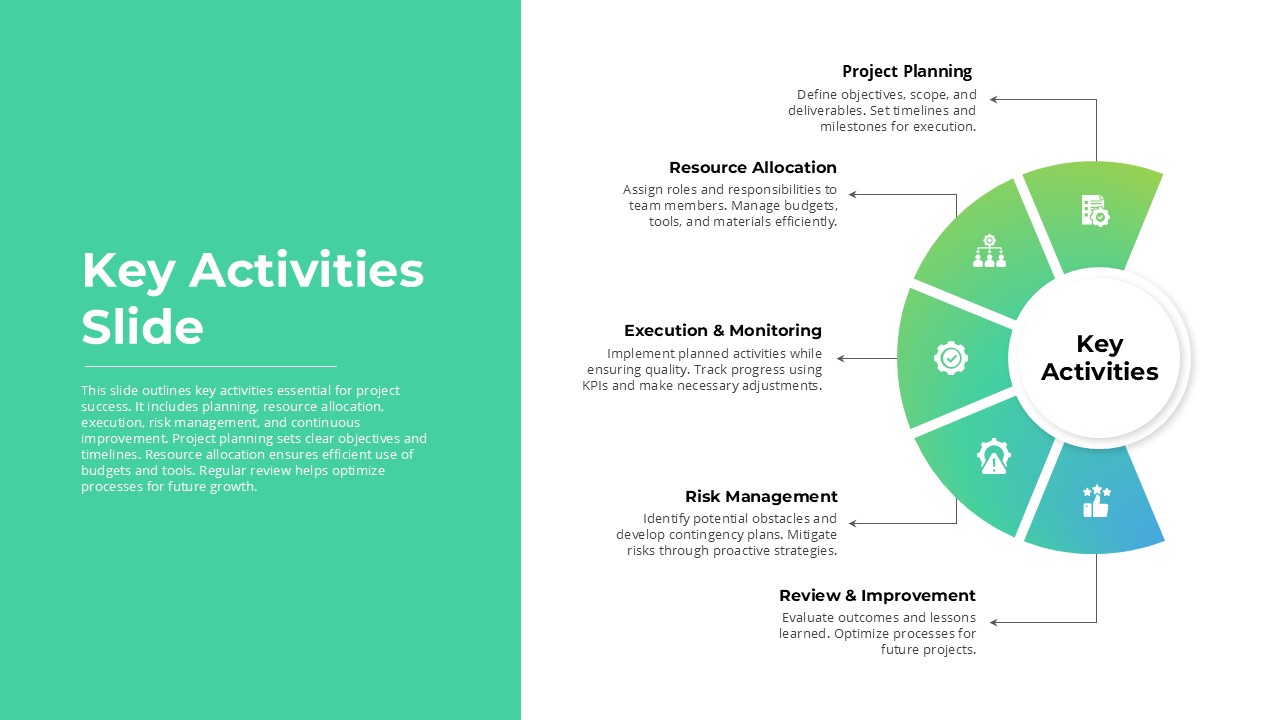
Project Key Activities Circular Diagram Template for PowerPoint & Google Slides
Process
Premium
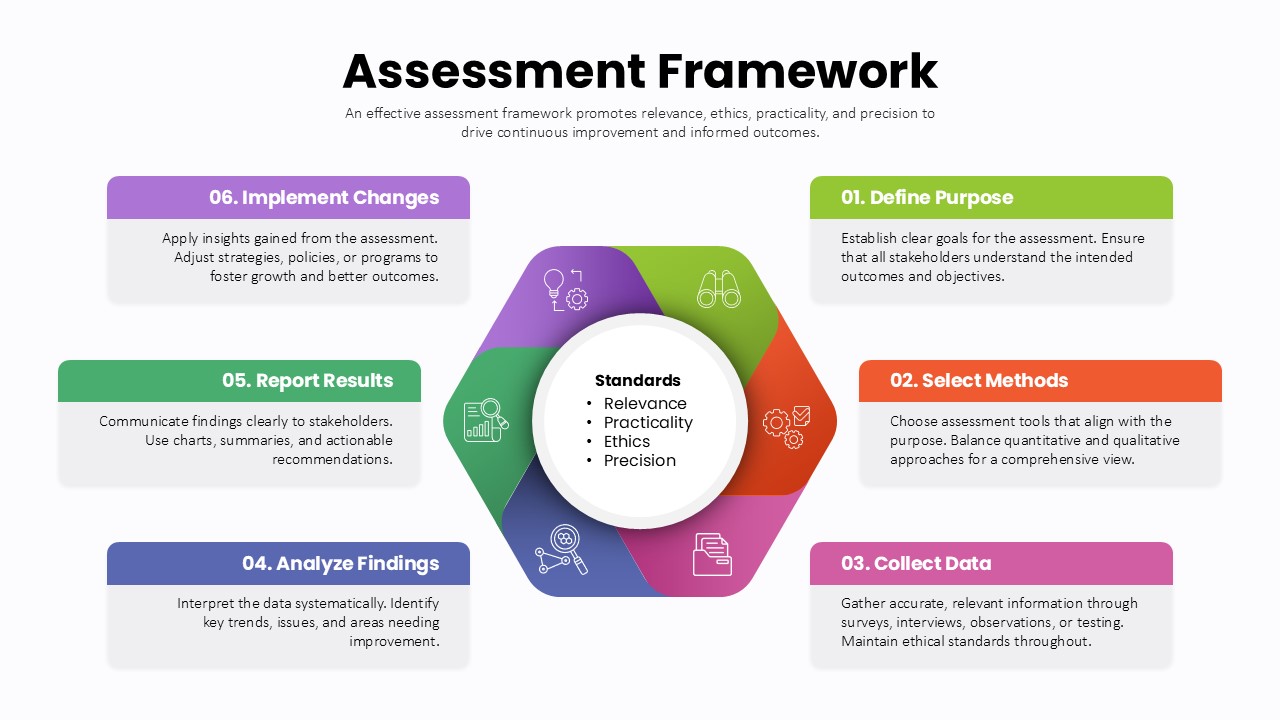
Assessment Framework Circular Diagram Template for PowerPoint & Google Slides
Circle
Premium