Weight Scales Shape Diagram for PowerPoint & Google Slides
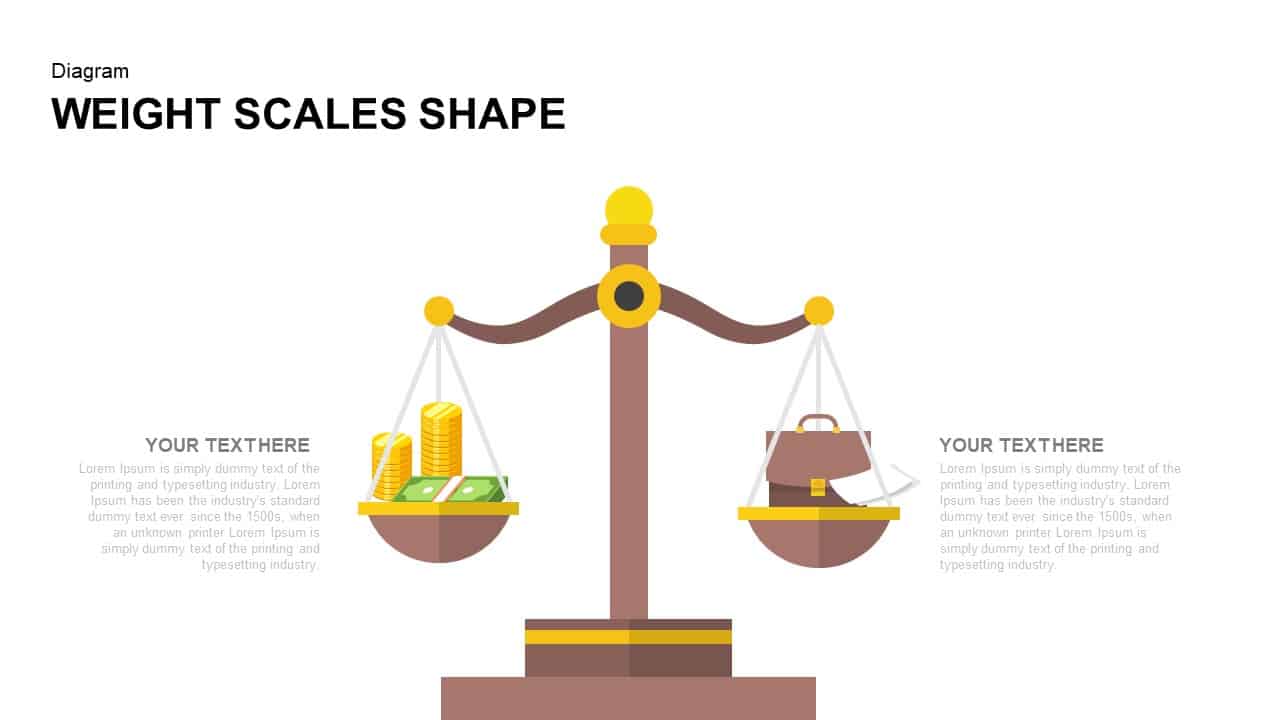


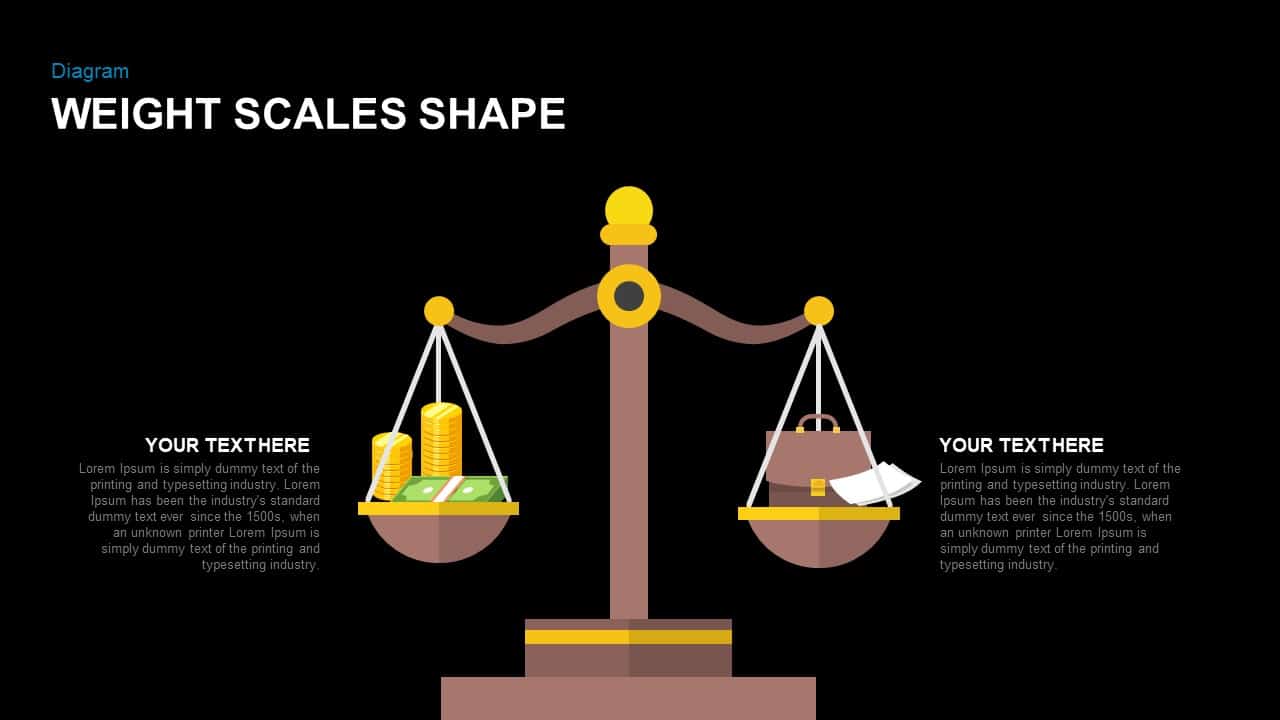

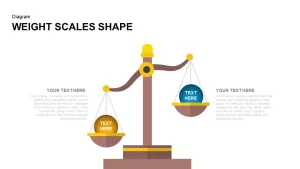
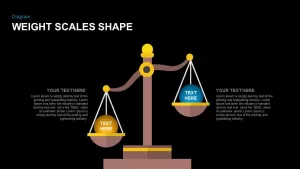
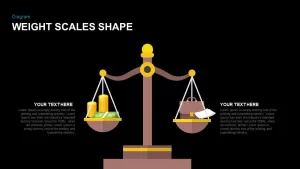
This Weight Scales Shape Diagram slide is designed to visually represent a balanced comparison between two categories or ideas. The diagram features a classic set of scales, with one side holding money and the other a briefcase, making it ideal for illustrating trade-offs, value comparisons, or resource allocation. The scale design is clean and simple, with placeholders for text on either side, making it easy to convey your message clearly.
Whether you’re comparing financial options, project stages, or competing strategies, this diagram helps simplify complex comparisons into an easy-to-understand visual. The bright and engaging colors add a dynamic touch to your presentation, ensuring that your audience stays focused on the key concepts you are discussing. With editable text boxes, you can customize the content to suit your specific needs, making this slide versatile for a range of professional topics.
The minimalist style ensures that the focus remains on the content, while the weight scale metaphor provides a clear and engaging way to communicate balance or opposing factors. Whether you’re in finance, business, or education, this slide offers an effective way to present comparative information.
Who is it for:
Business analysts, financial planners, project managers, and consultants can benefit from this diagram to illustrate comparisons, trade-offs, and decision-making processes. Educators and trainers can also use it to teach concepts involving balance or resource allocation.
Other Uses:
In addition to comparing financial or resource data, this slide can be repurposed for decision-making processes, risk assessments, or evaluating multiple options. It can also be used in marketing presentations to compare product features, customer preferences, or campaign performance.
Login to download this file

Item ID
SB01005
Related Templates

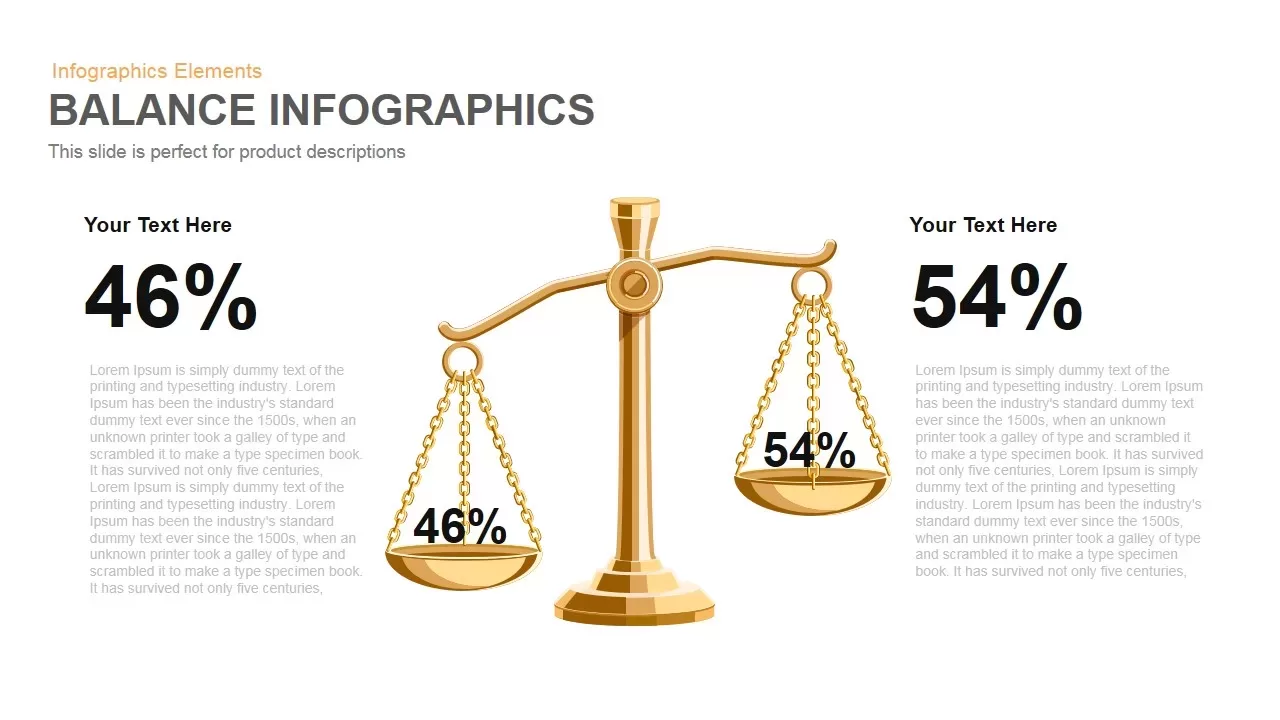
Gold Scales Balance Comparison Template for PowerPoint & Google Slides
Comparison
3D Shape Linear Process Flow Diagram Template for PowerPoint & Google Slides
Process
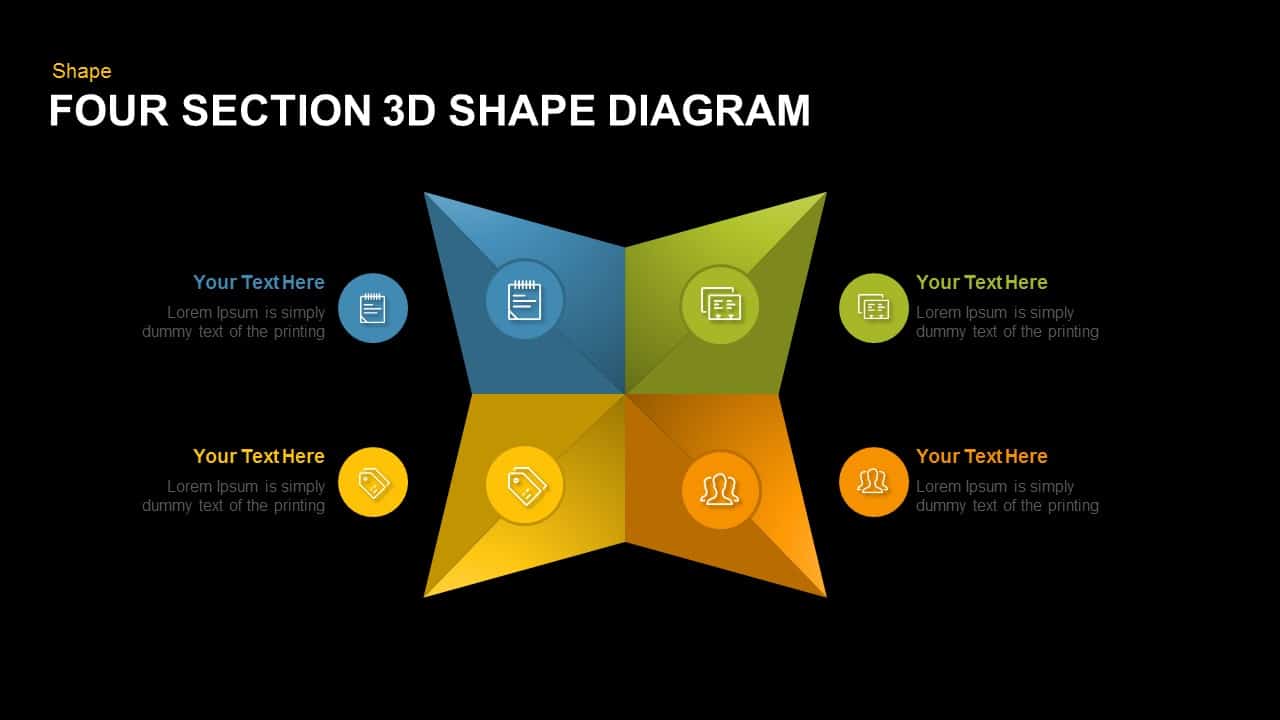
Editable Four-Section 3D Shape Diagram Template for PowerPoint & Google Slides
Comparison
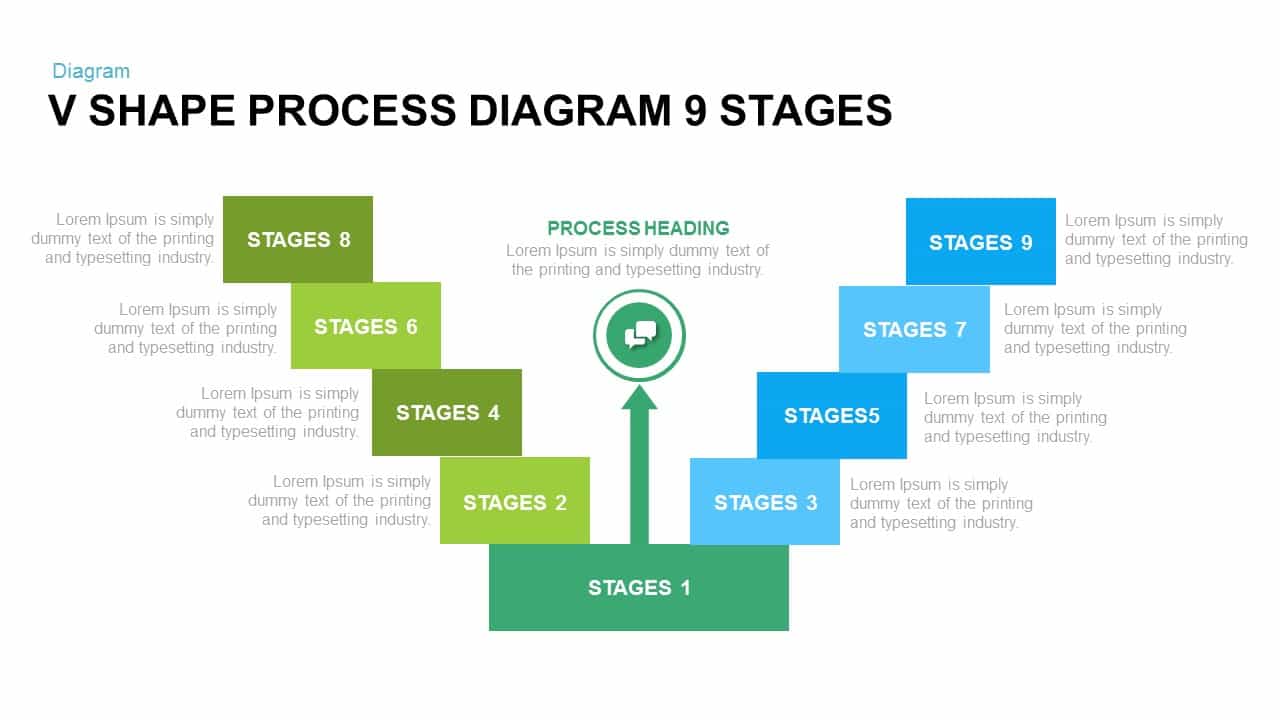
V Shape Process Diagram 9 Stages for PowerPoint & Google Slides
Infographics
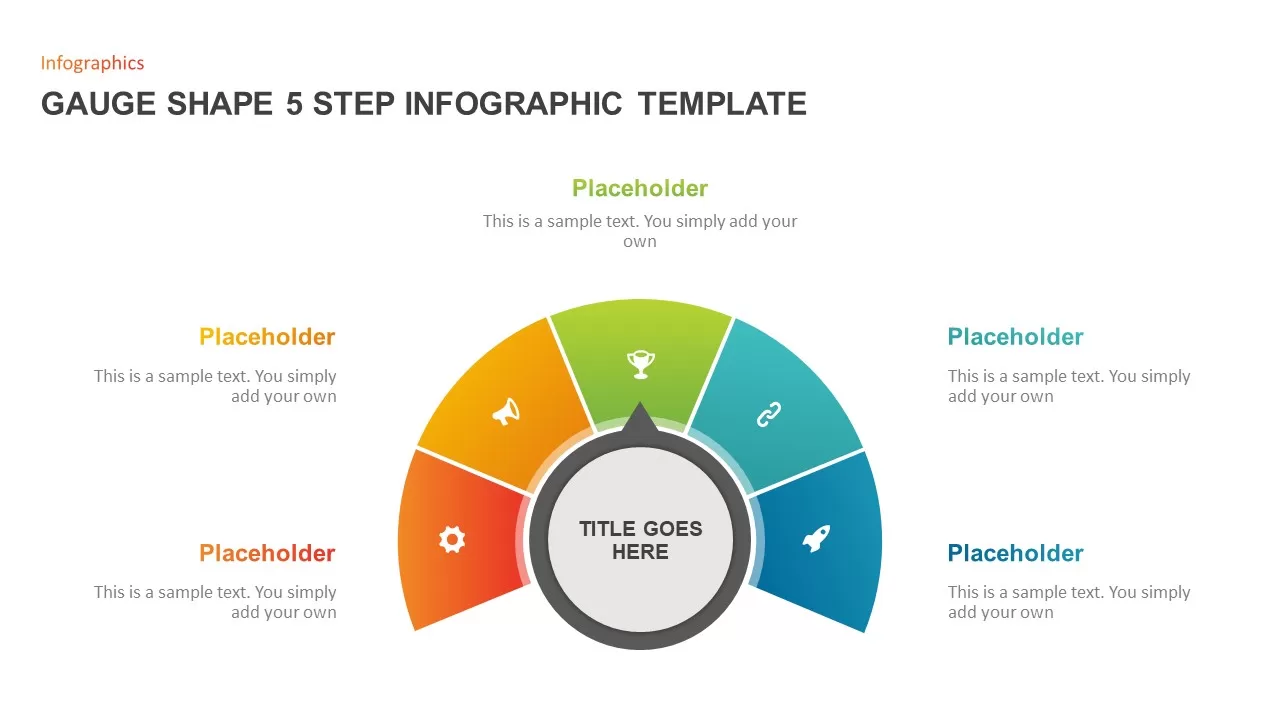
Gauge Shape 5-Step Infographic Diagram Template for PowerPoint & Google Slides
Process
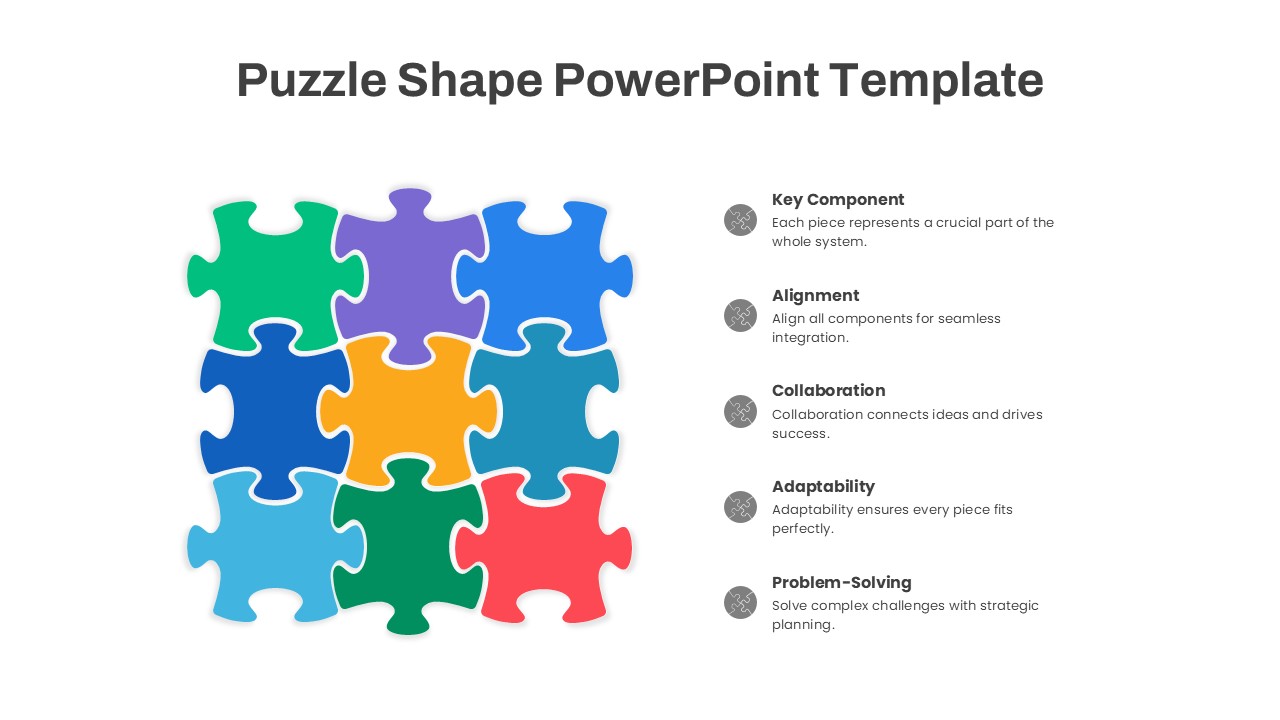
Puzzle Shape Diagram with Five Elements Template for PowerPoint & Google Slides
Circular
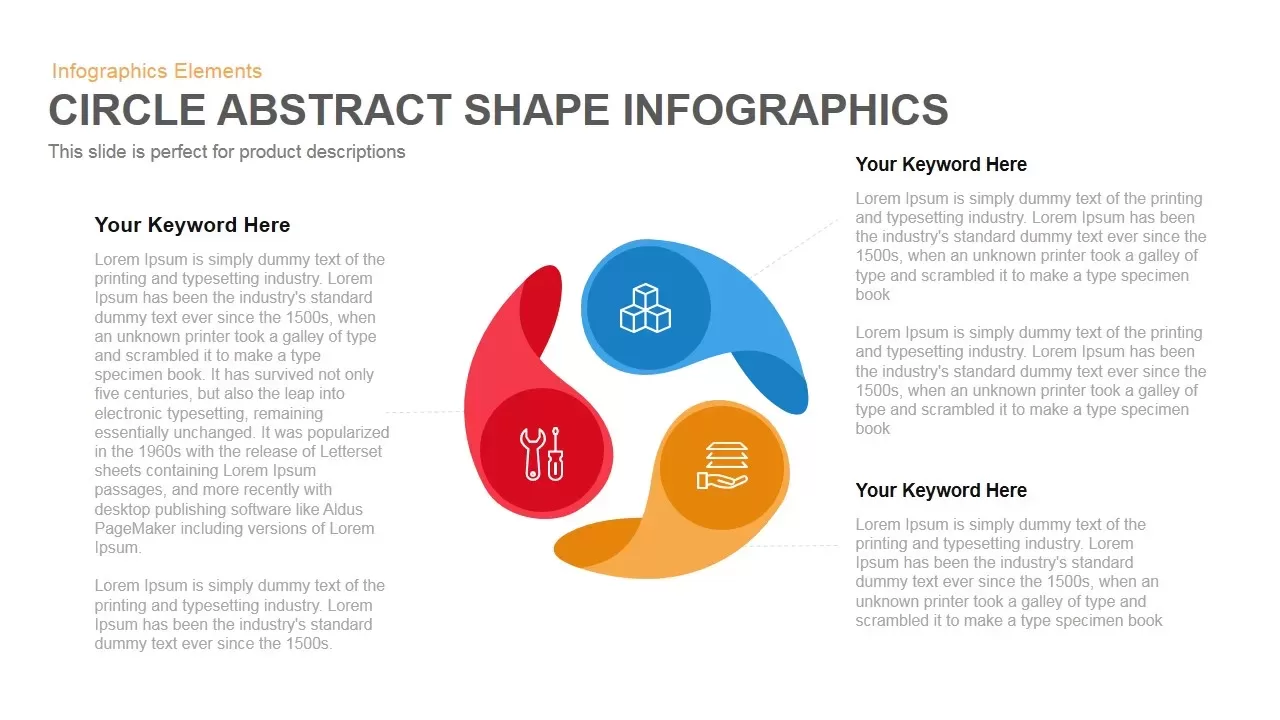
Circle Abstract Shape Infographics Template for PowerPoint & Google Slides
Circular
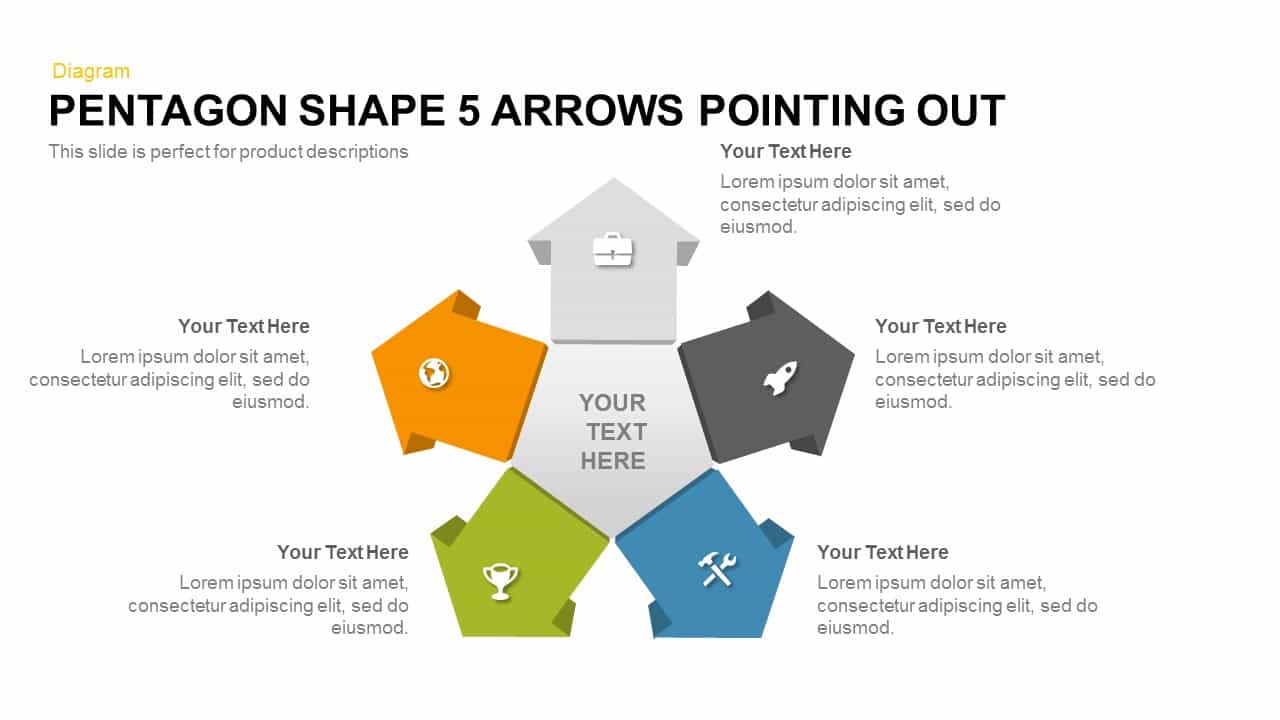
Pentagon Shape 5 Arrows Pointing Out template for PowerPoint & Google Slides
Arrow
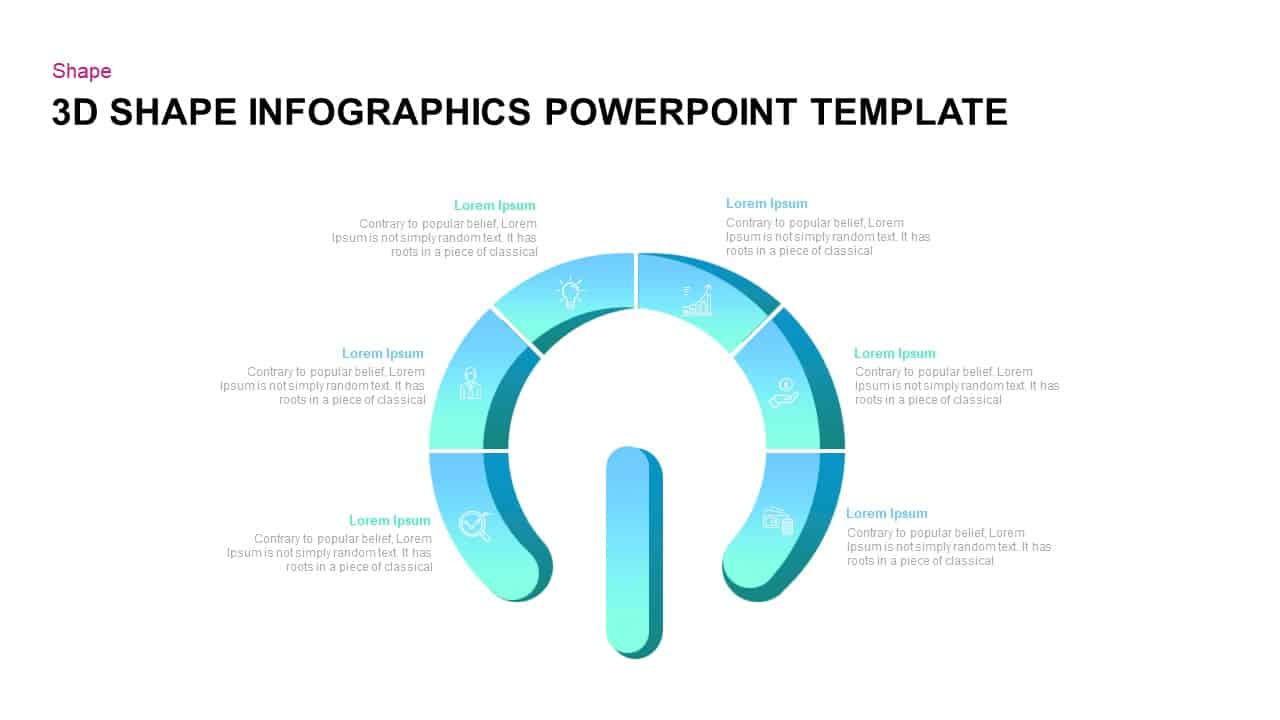
3D Segmented Shape Infographic Template for PowerPoint & Google Slides
Circular
Shape Loop Four-Step Infographic Slide Template for PowerPoint & Google Slides
Process
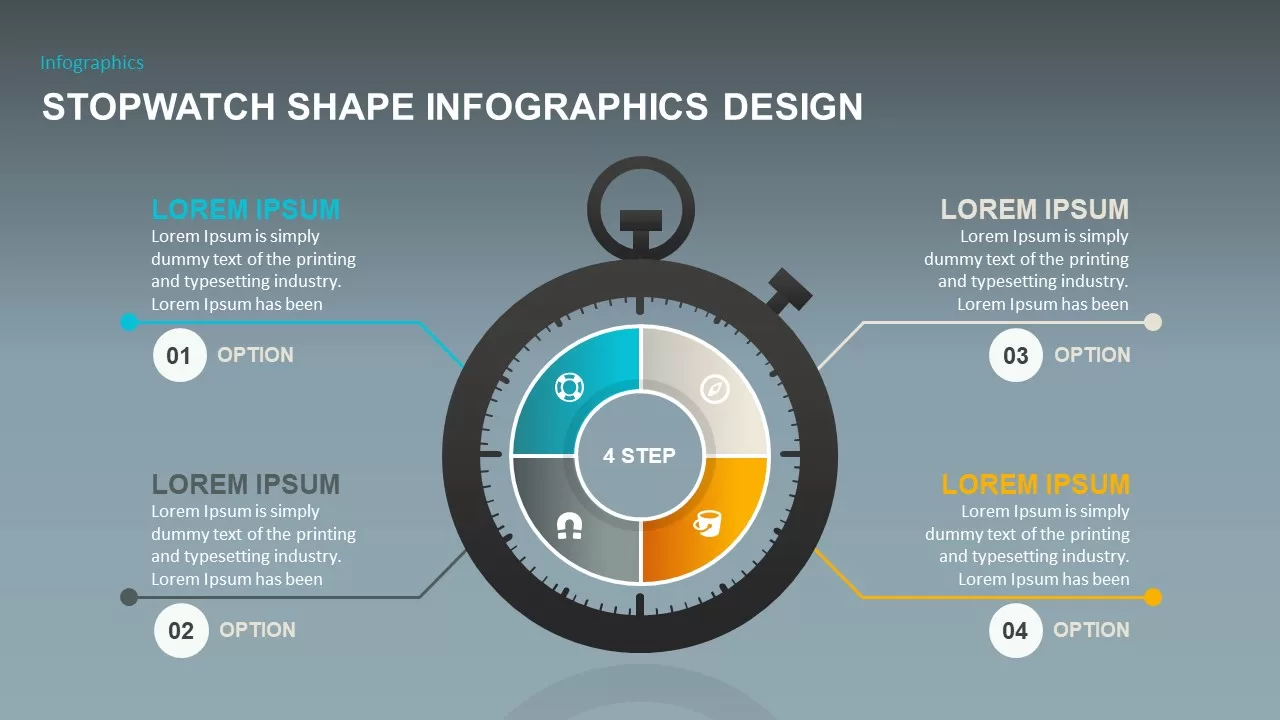
Stopwatch Shape Infographics for PowerPoint & Google Slides
Process
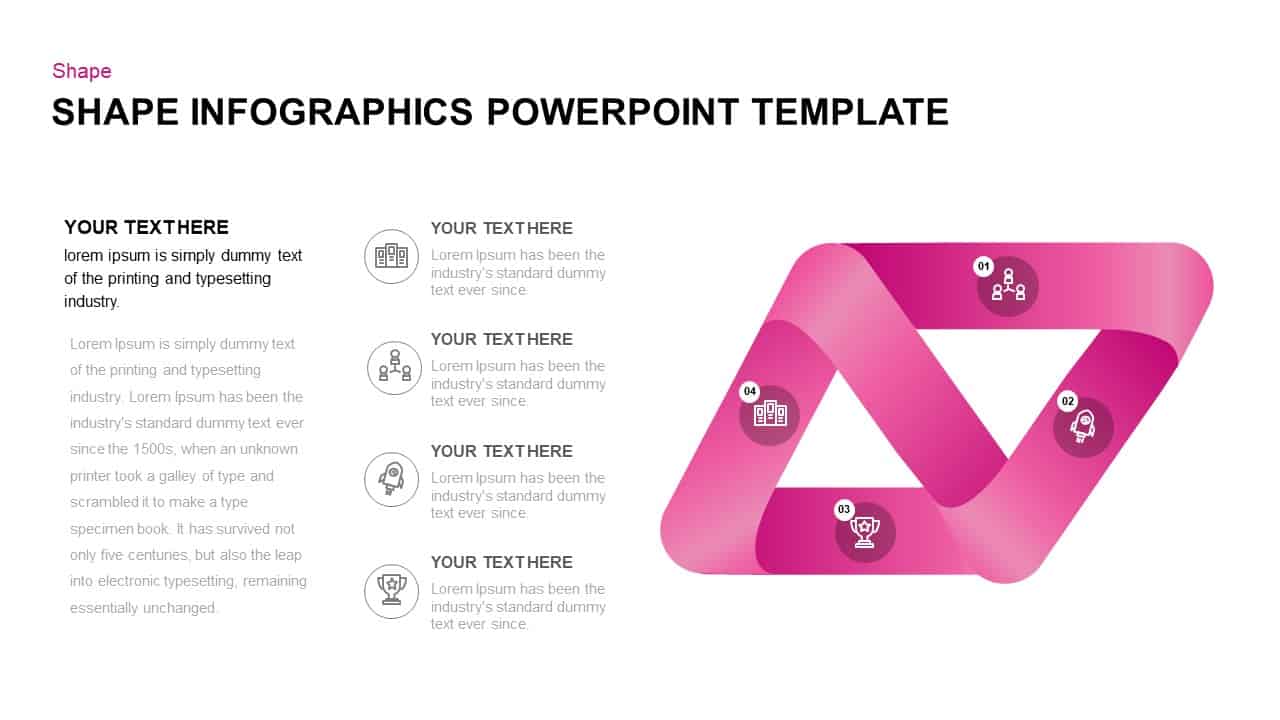
Versatile 3D Modular Shape Infographics Template for PowerPoint & Google Slides
Infographics
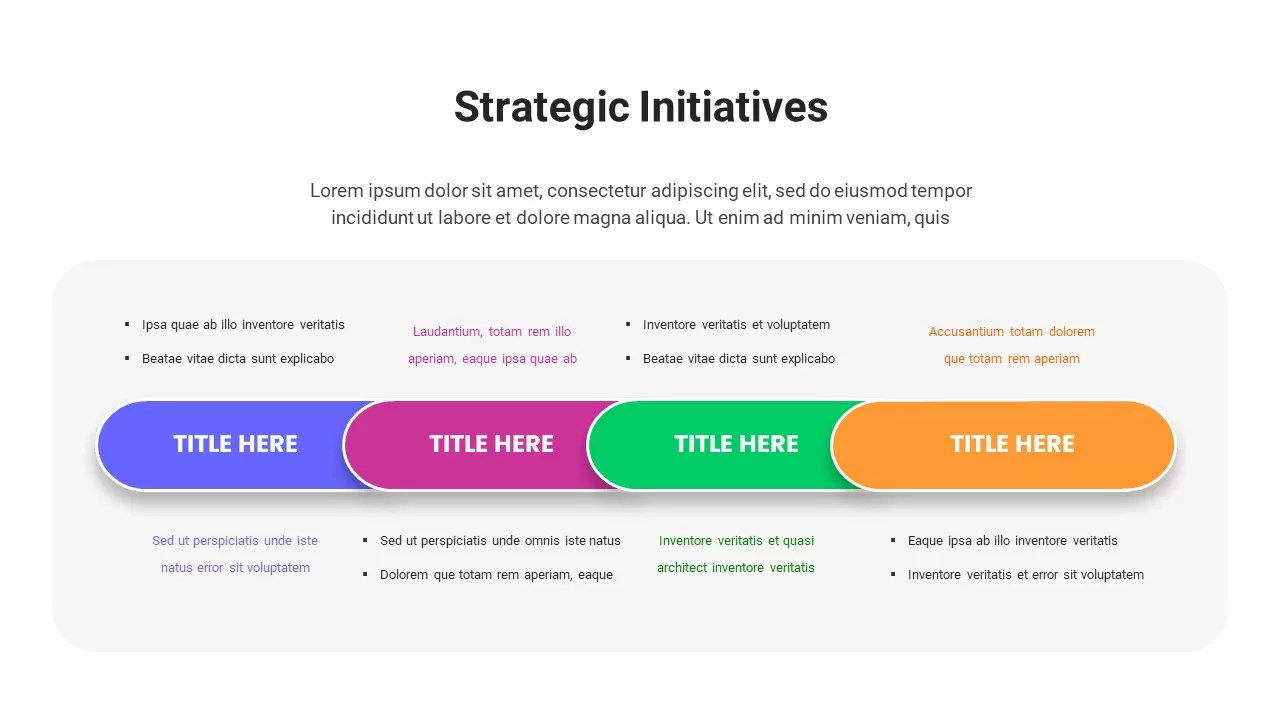
Strategic Initiatives Pill Shape Slide Template for PowerPoint & Google Slides
Pitch Deck
Fluid-Shape Cover Slide Template for PowerPoint & Google Slides
Company Profile
Arrow Types Shape Library Editable Template for PowerPoint & Google Slides
Arrow
Snake Diagram Pack of 8 Slides template for PowerPoint & Google Slides
Process
Gear Process Diagram PowerPoint Template for PowerPoint & Google Slides
Process
Sales Process Workflow Funnel Diagram PowerPoint Template for PowerPoint & Google Slides
Funnel
Puzzle Diagram PowerPoint Template for PowerPoint & Google Slides
Process
Transportation Logistics PowerPoint Diagram template for PowerPoint & Google Slides
Process
Emoji Scale PowerPoint Diagram for PowerPoint & Google Slides
Infographics
4 Step Problem Solving PowerPoint Diagram for PowerPoint & Google Slides
Process
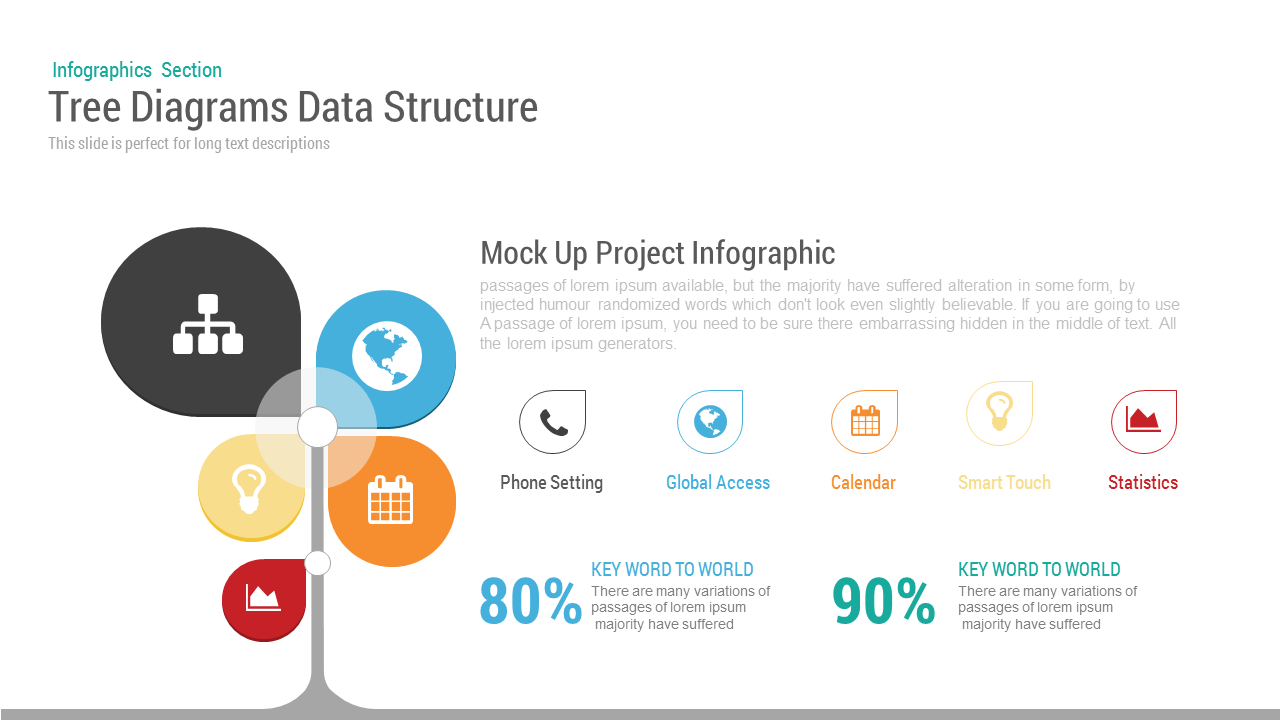
Tree Diagram template for PowerPoint & Google Slides
Decision Tree
Modern Circle SWOT Analysis Diagram Template for PowerPoint & Google Slides
SWOT
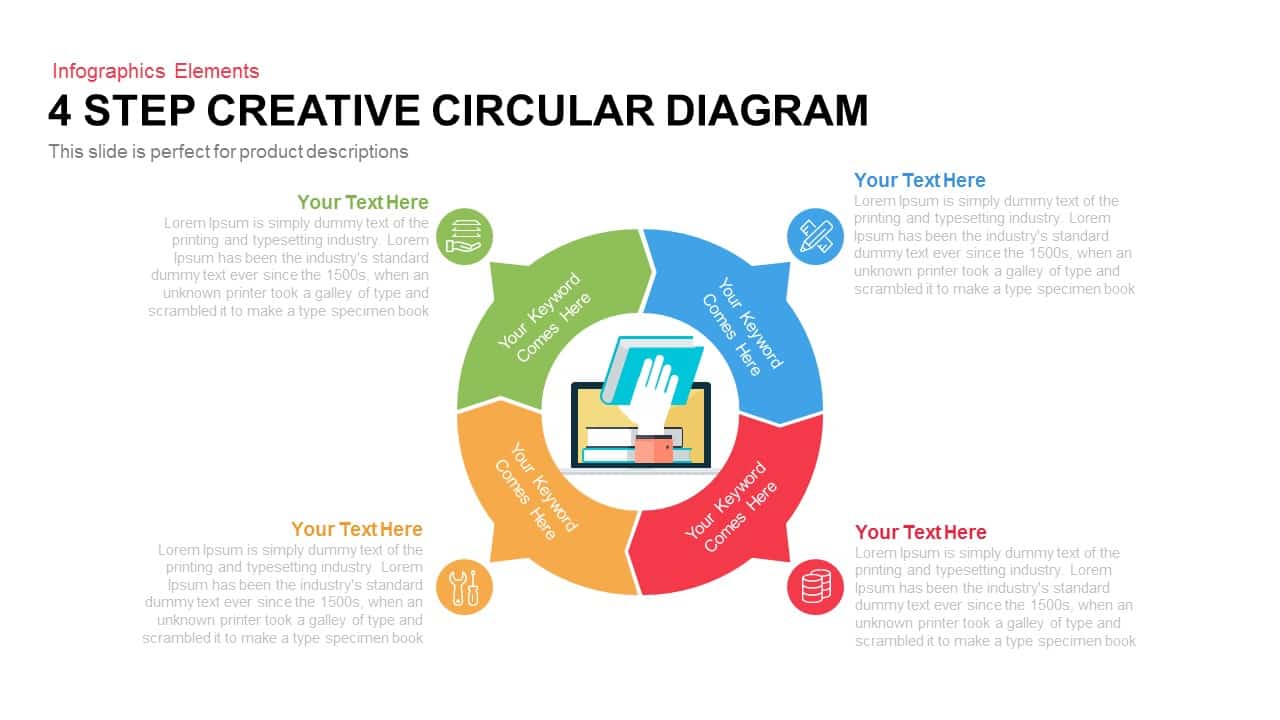
4 Step Creative Circular Diagram Template for PowerPoint & Google Slides
Infographics
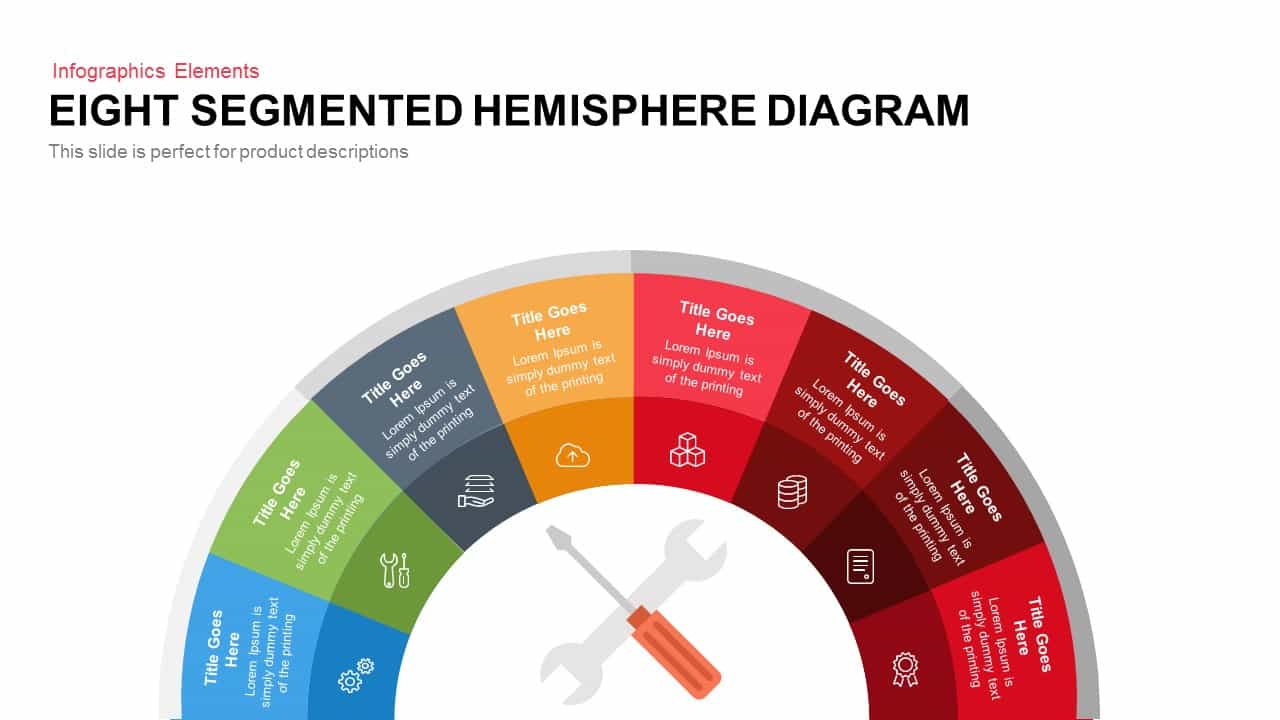
Eight Segmented Hemisphere Diagram Template for PowerPoint & Google Slides
Process
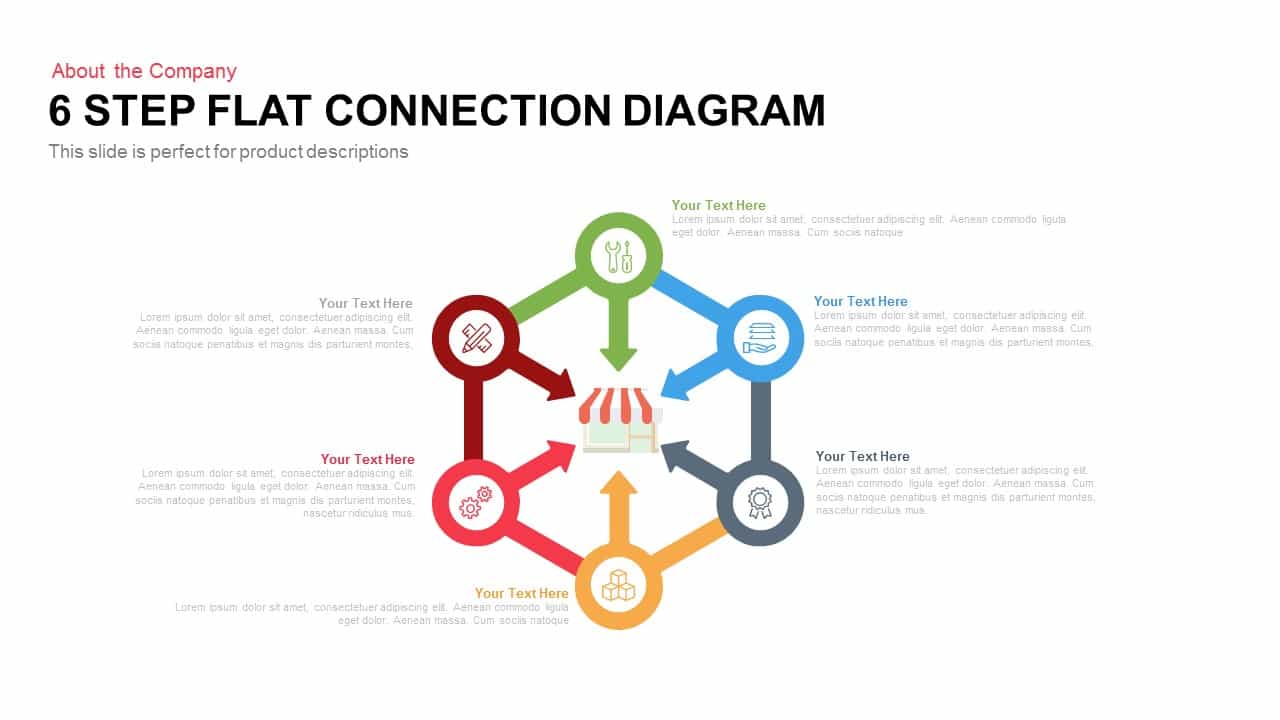
6 Step Flat Connection Diagram template for PowerPoint & Google Slides
Circular
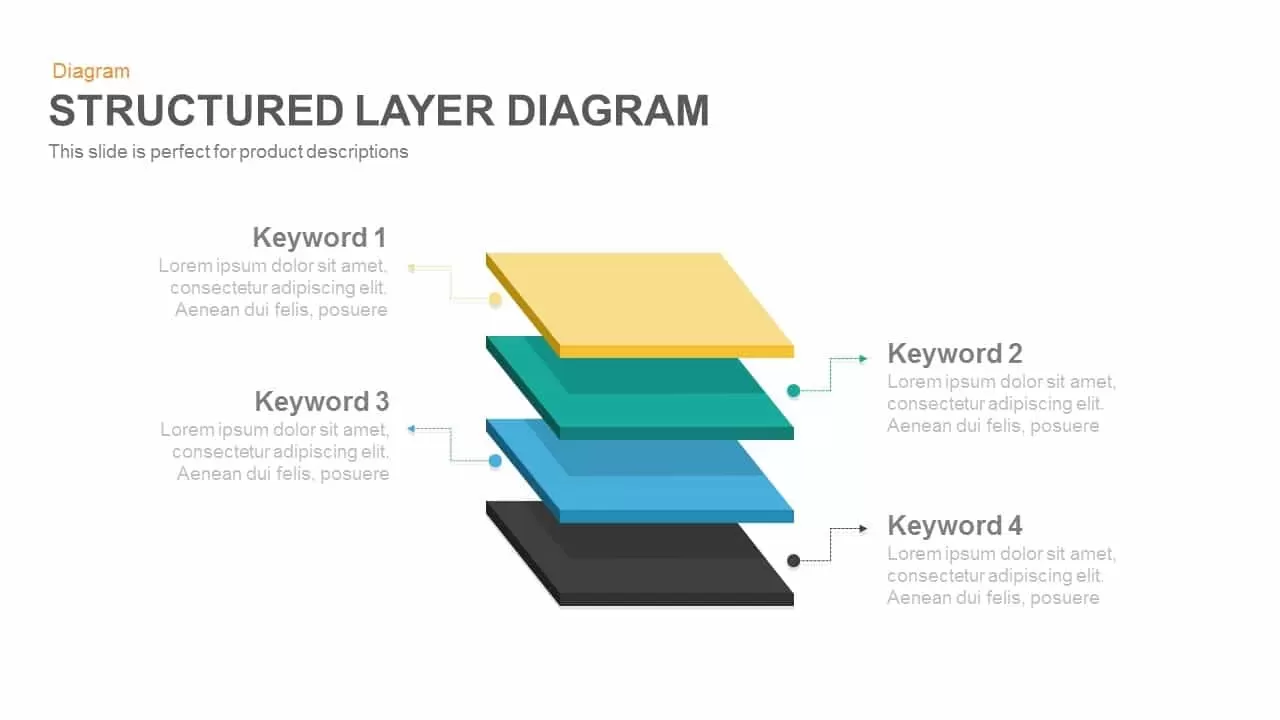
Professional Structured 3D Layer Diagram Template for PowerPoint & Google Slides
Process
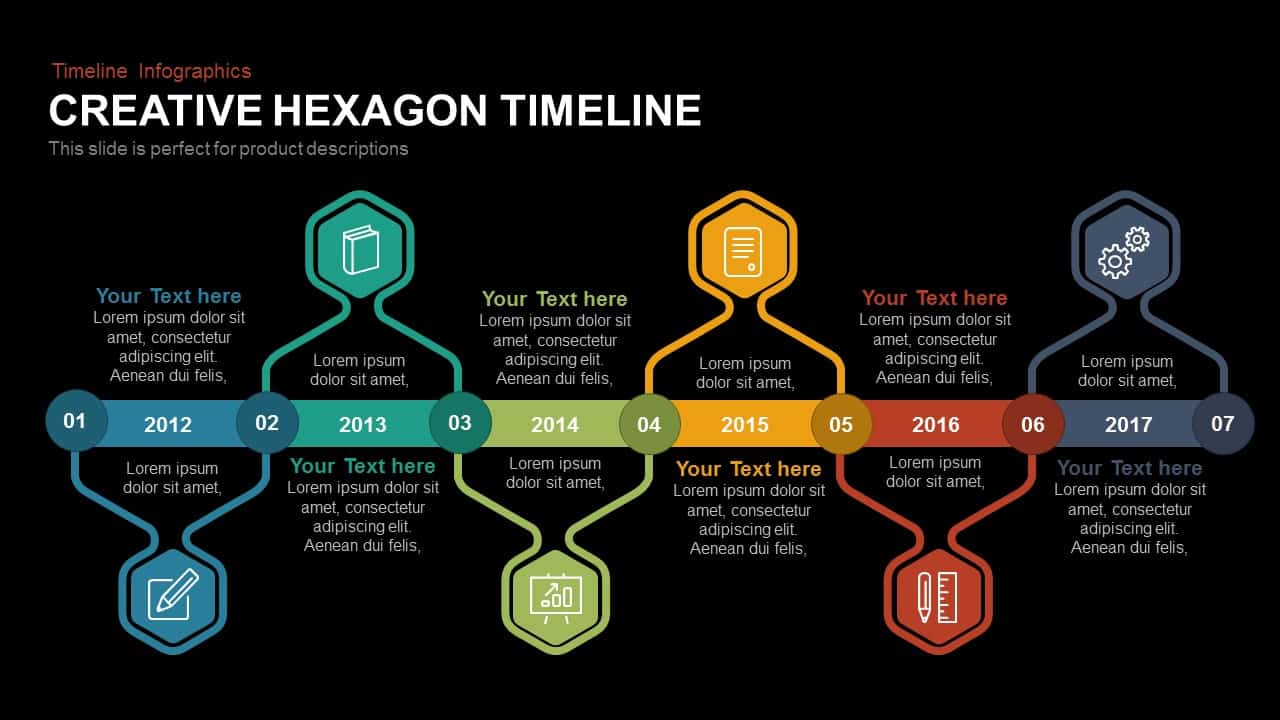
Annual Creative Hexagon Timeline Diagram Template for PowerPoint & Google Slides
Timeline
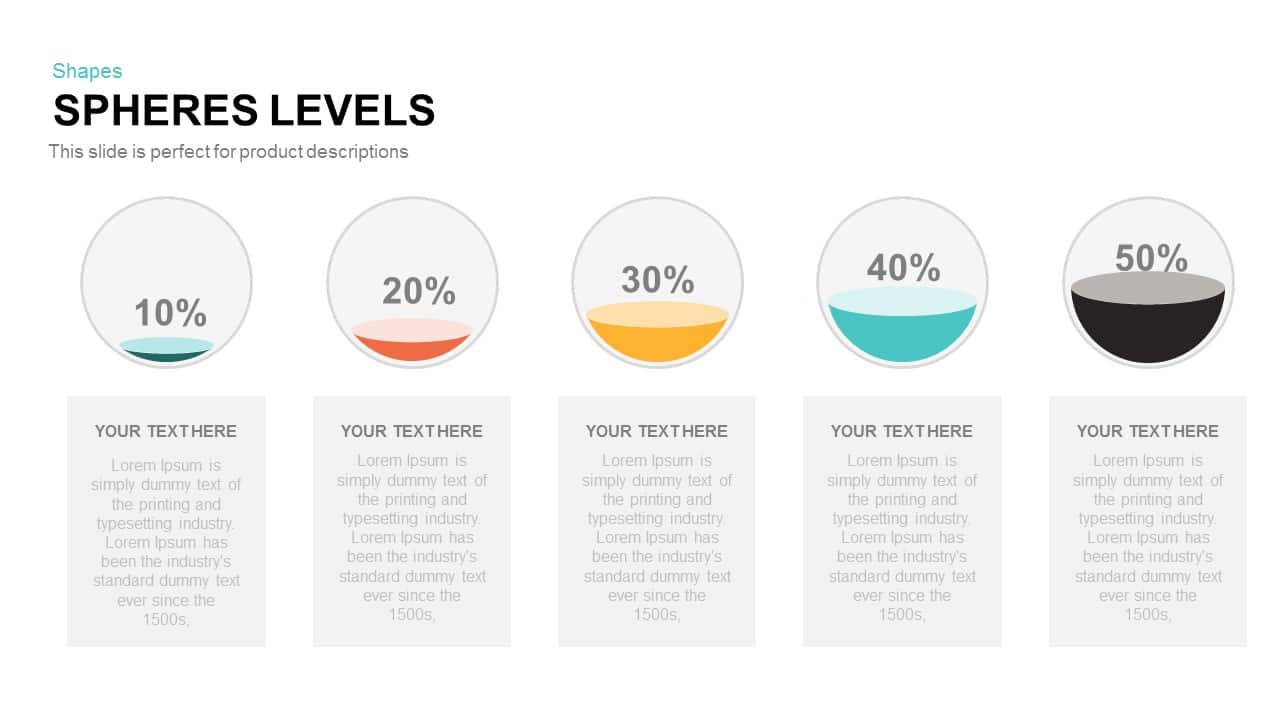
Five-Level Sphere Indicators Diagram template for PowerPoint & Google Slides
Infographics
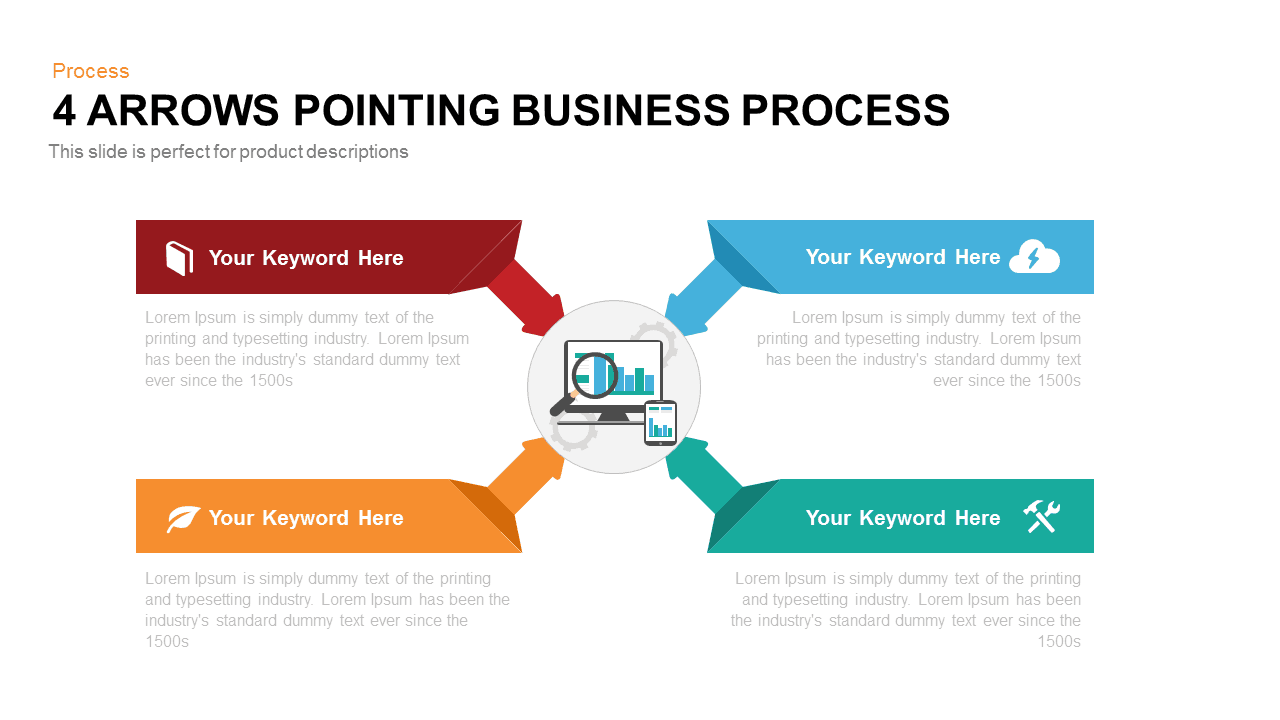
Four Arrows Business Process Diagram template for PowerPoint & Google Slides
Process

Cause and Effect Diagram Infographic Template for PowerPoint & Google Slides
Bar/Column
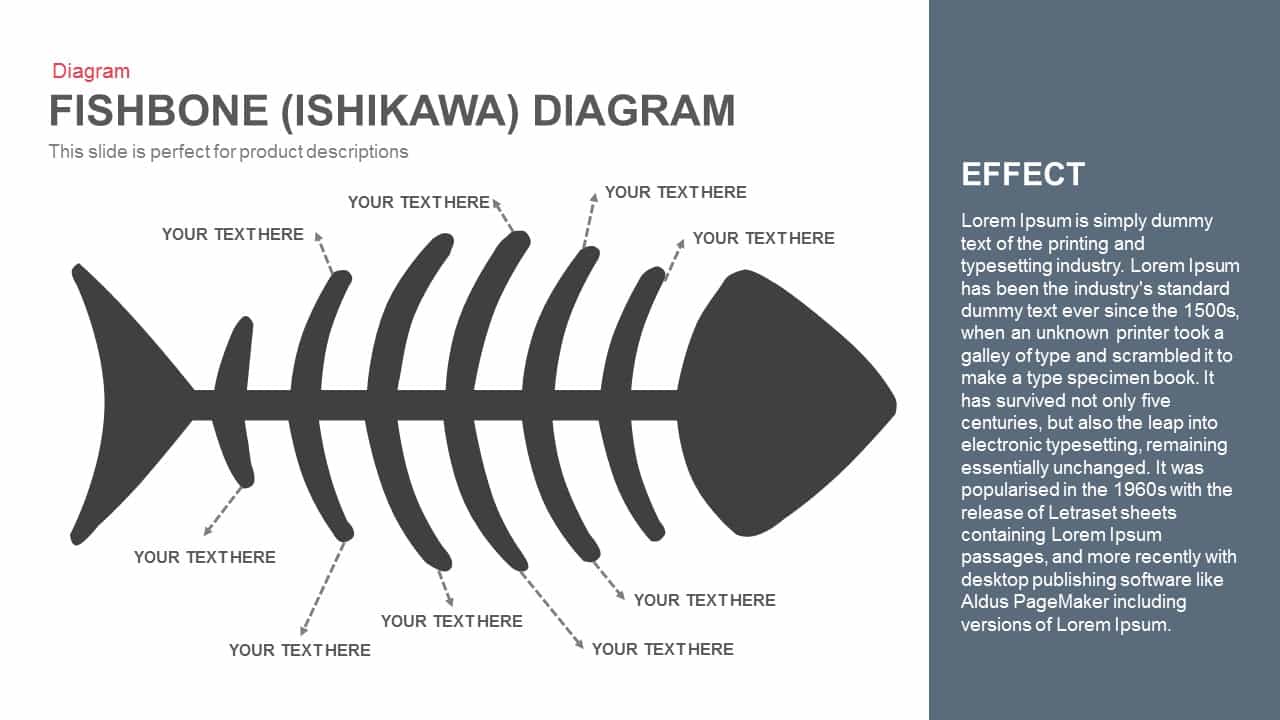
Fishbone (Ishikawa) Diagram for PowerPoint & Google Slides
Process
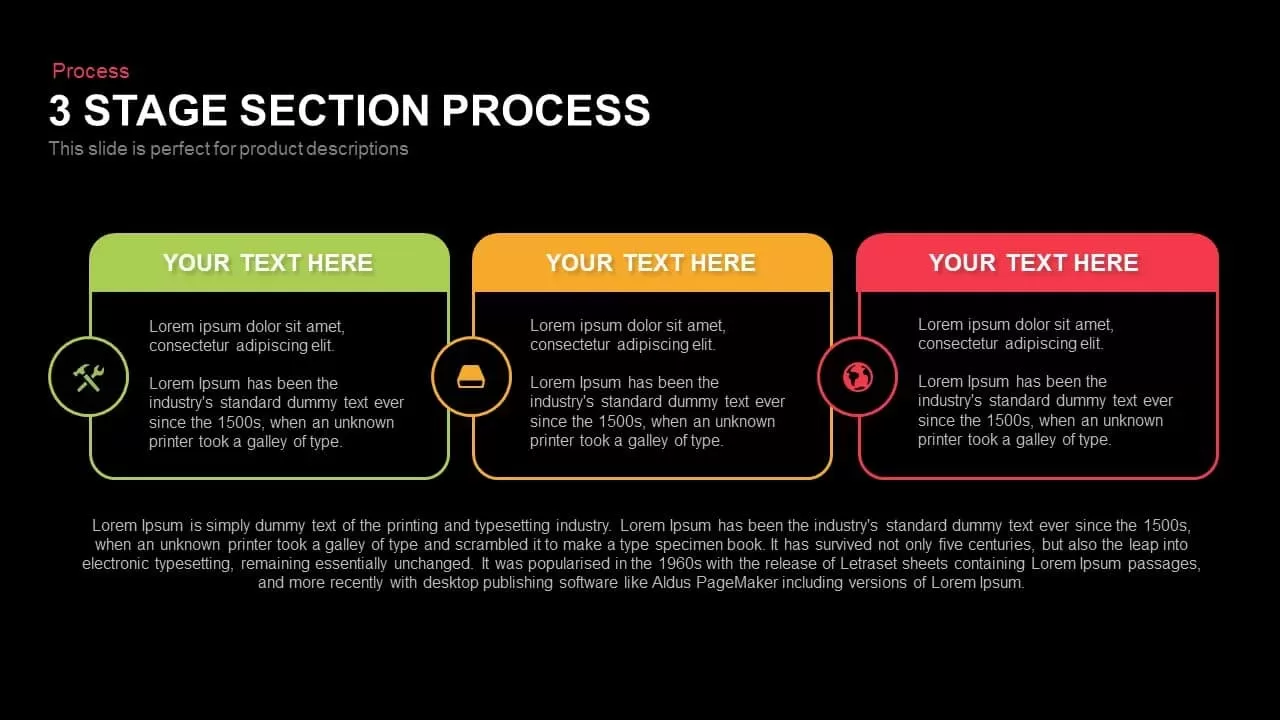
3 Stage Section Process Diagram Template for PowerPoint & Google Slides
Process

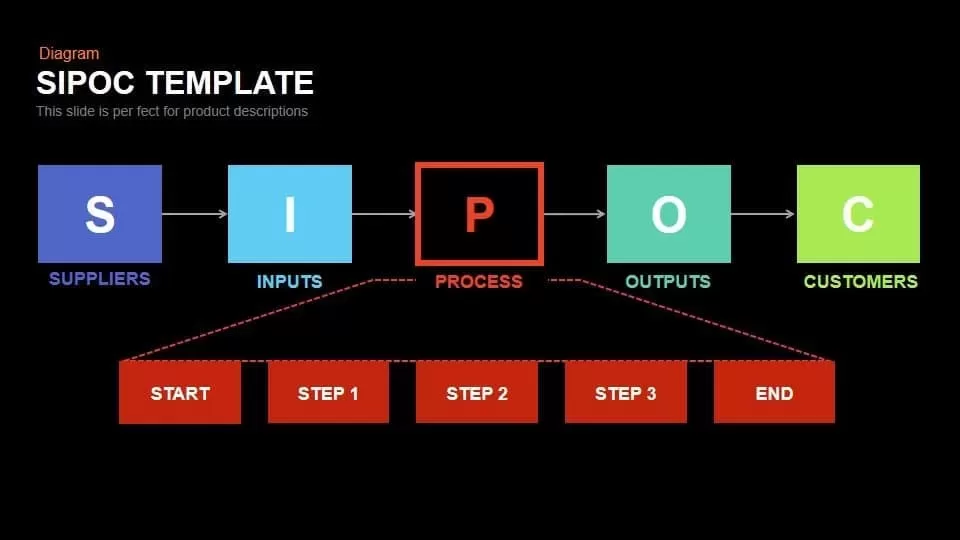
SIPOC Diagram with Process Breakdown Template for PowerPoint & Google Slides
Process
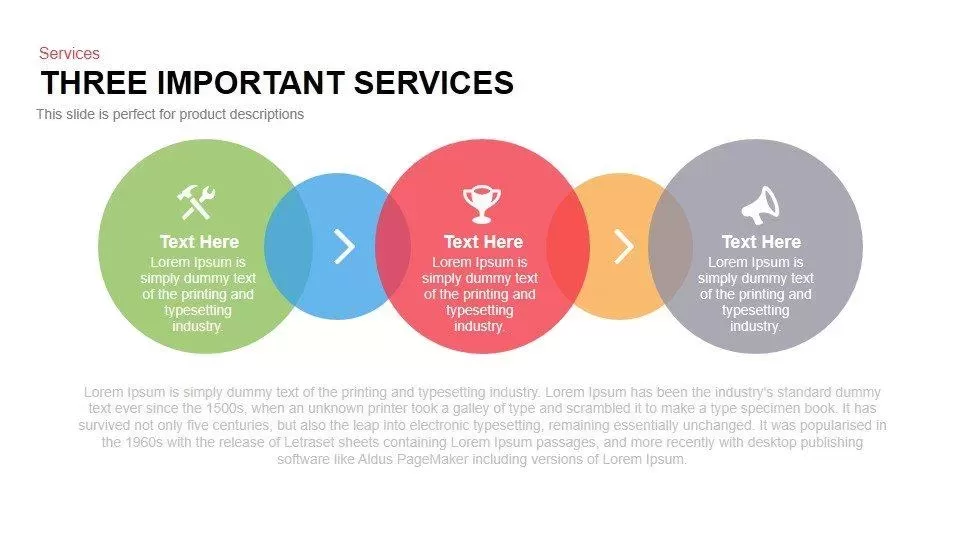
Three Important Services Flow Diagram Template for PowerPoint & Google Slides
Process
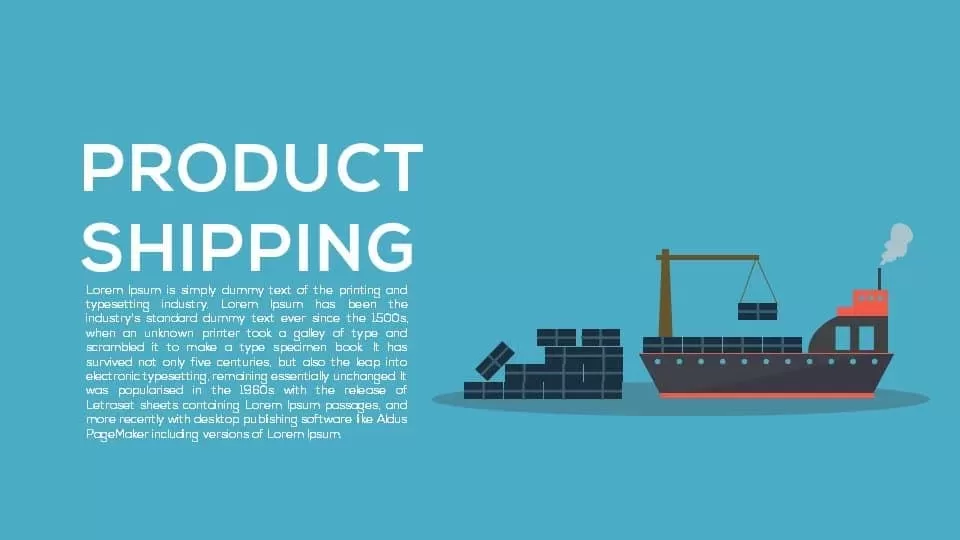
Product Shipping Metaphor Diagram Template for PowerPoint & Google Slides
Process
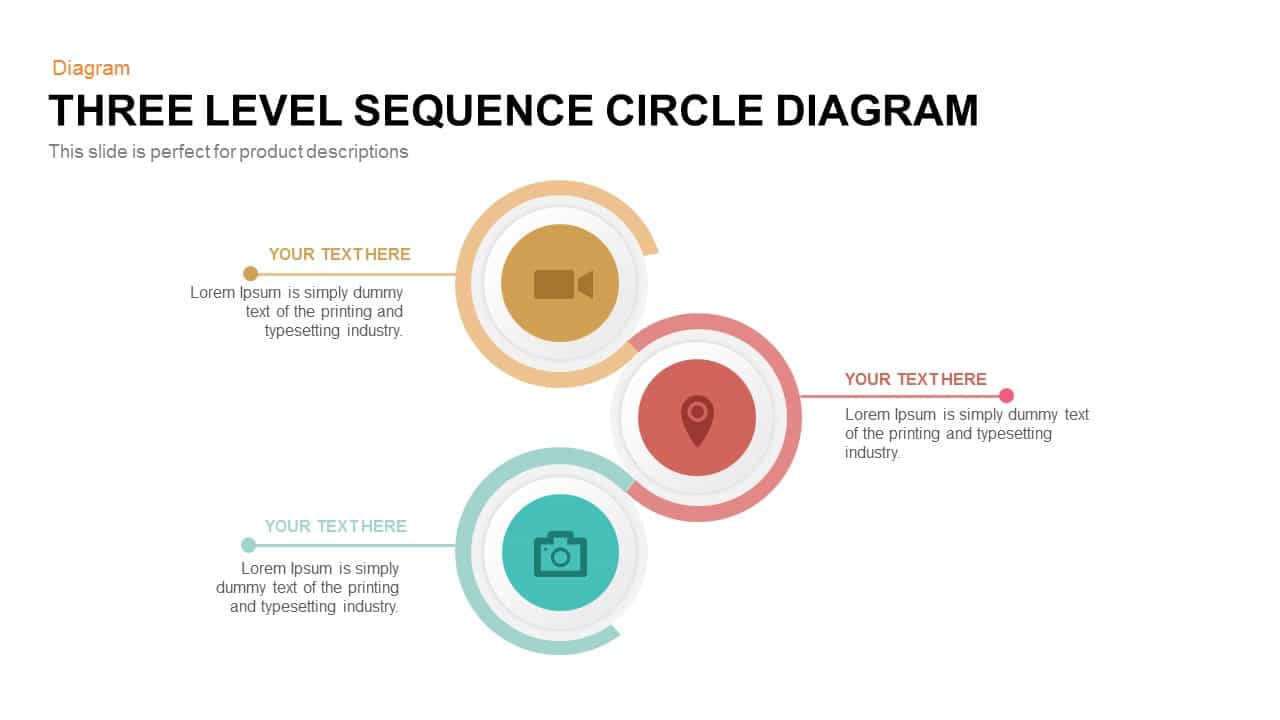
Three-Level Sequence Circle Diagram Template for PowerPoint & Google Slides
Circular
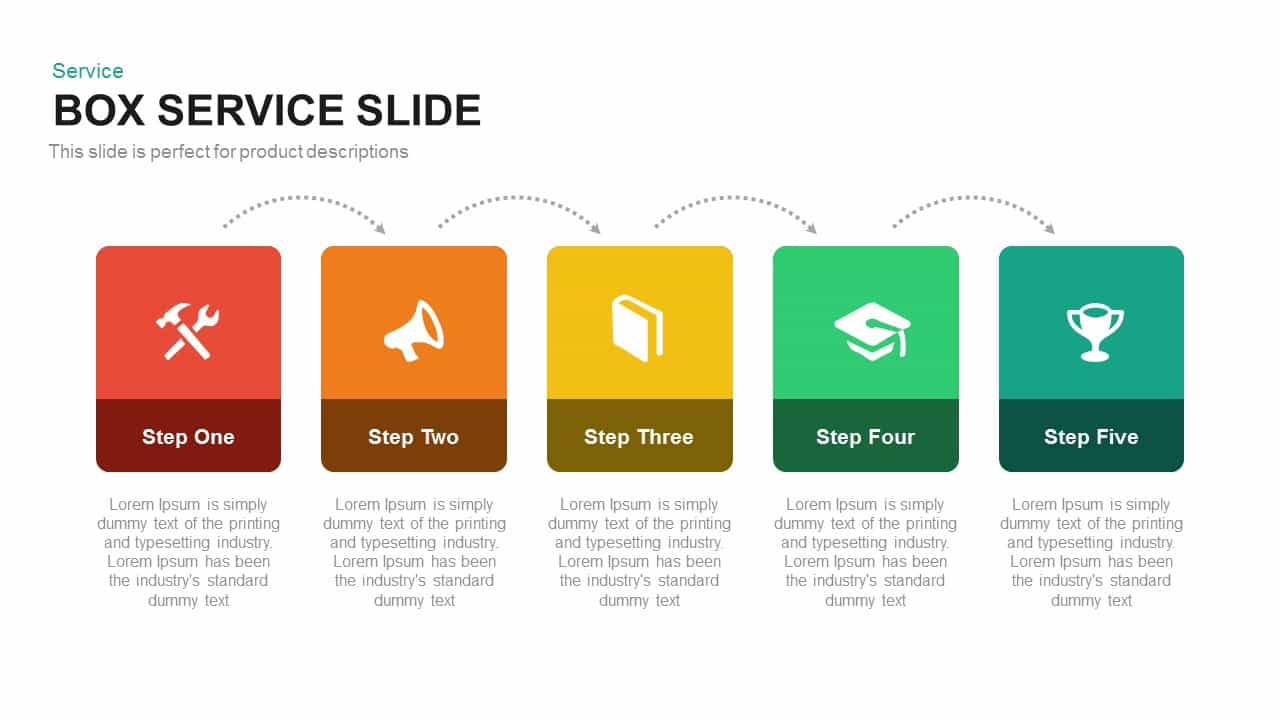
Professional Box Service Diagram Template for PowerPoint & Google Slides
Comparison
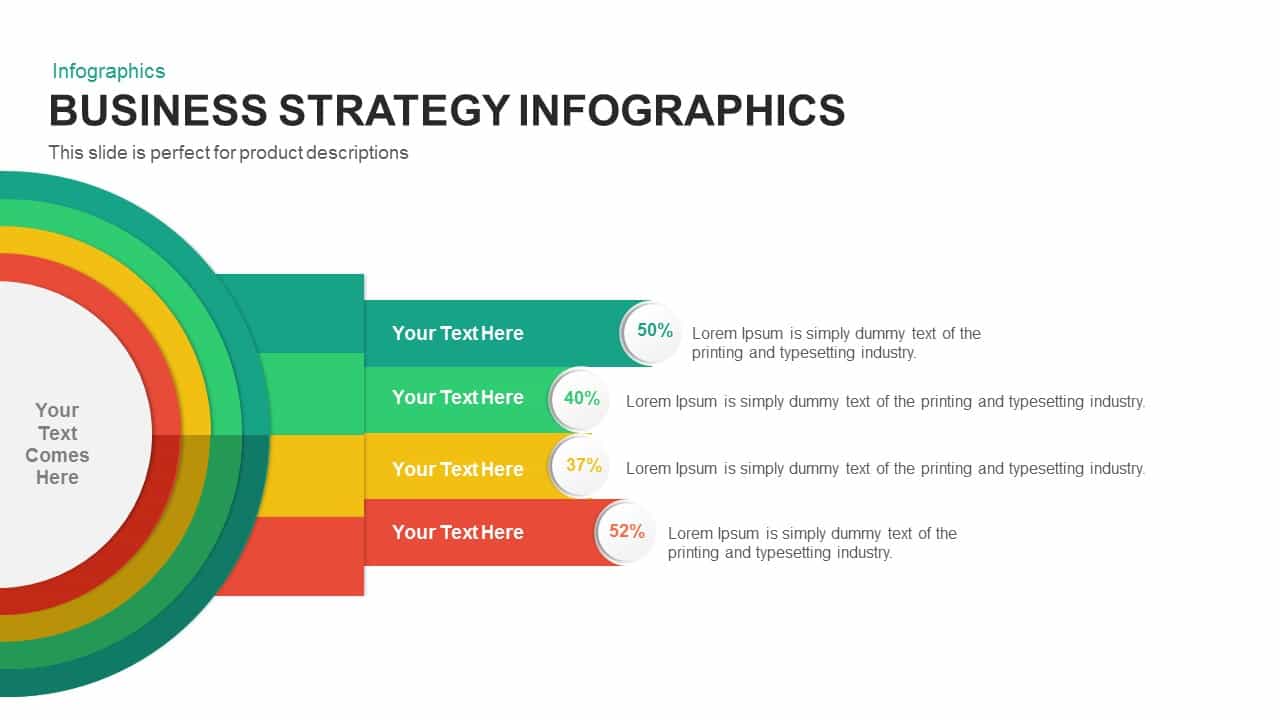
Business Strategy Infographics Diagram Template for PowerPoint & Google Slides
Business Strategy
Four-Circle Hub and Spoke Diagram Template for PowerPoint & Google Slides
Process
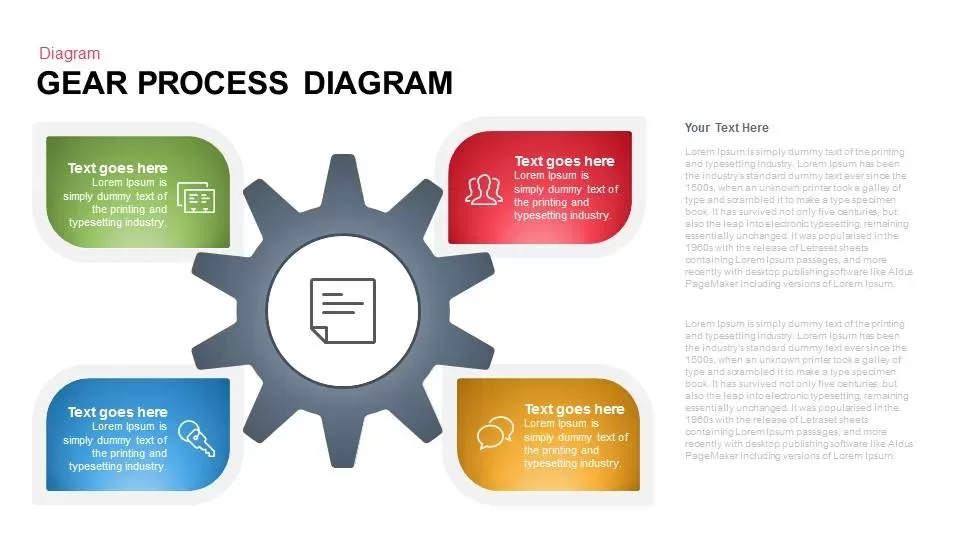
Gear Process Diagram for PowerPoint & Google Slides
Process
Arrow Process Diagram for PowerPoint & Google Slides
Process
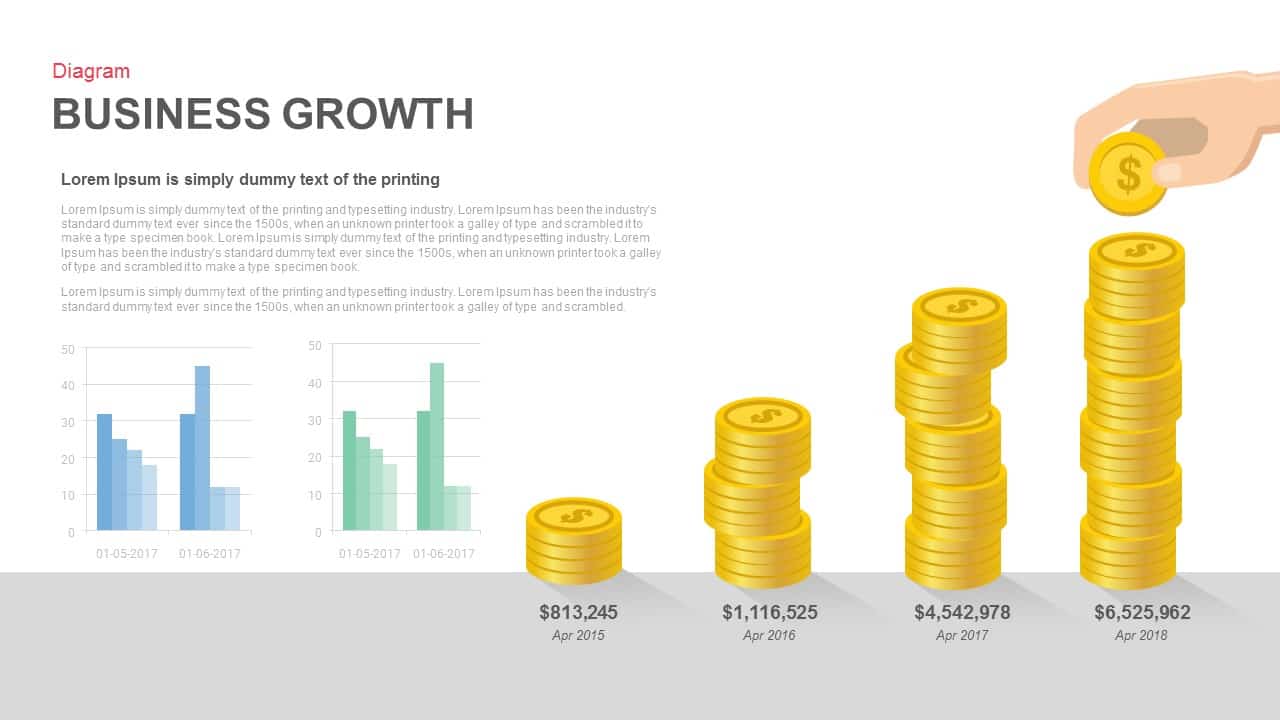
Business Growth Diagram for PowerPoint & Google Slides
Business Models

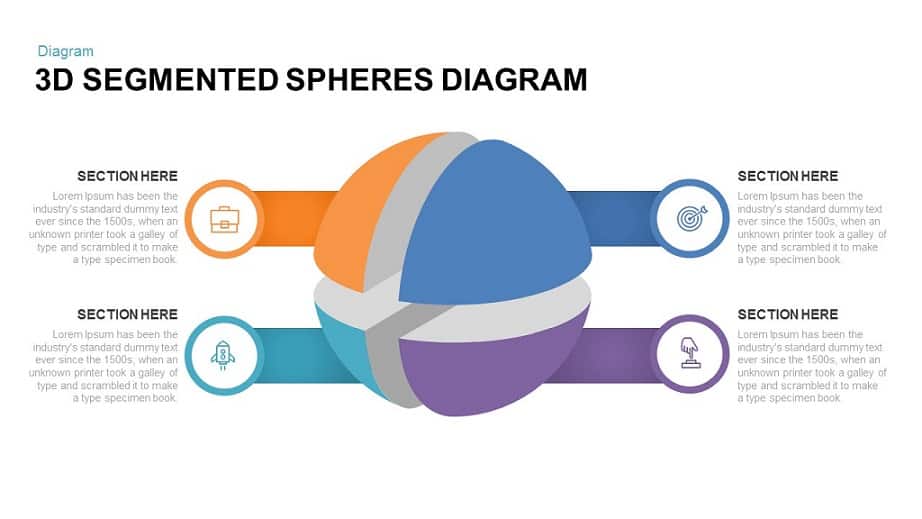
3D Segmented Spheres Diagram template for PowerPoint & Google Slides
Infographics
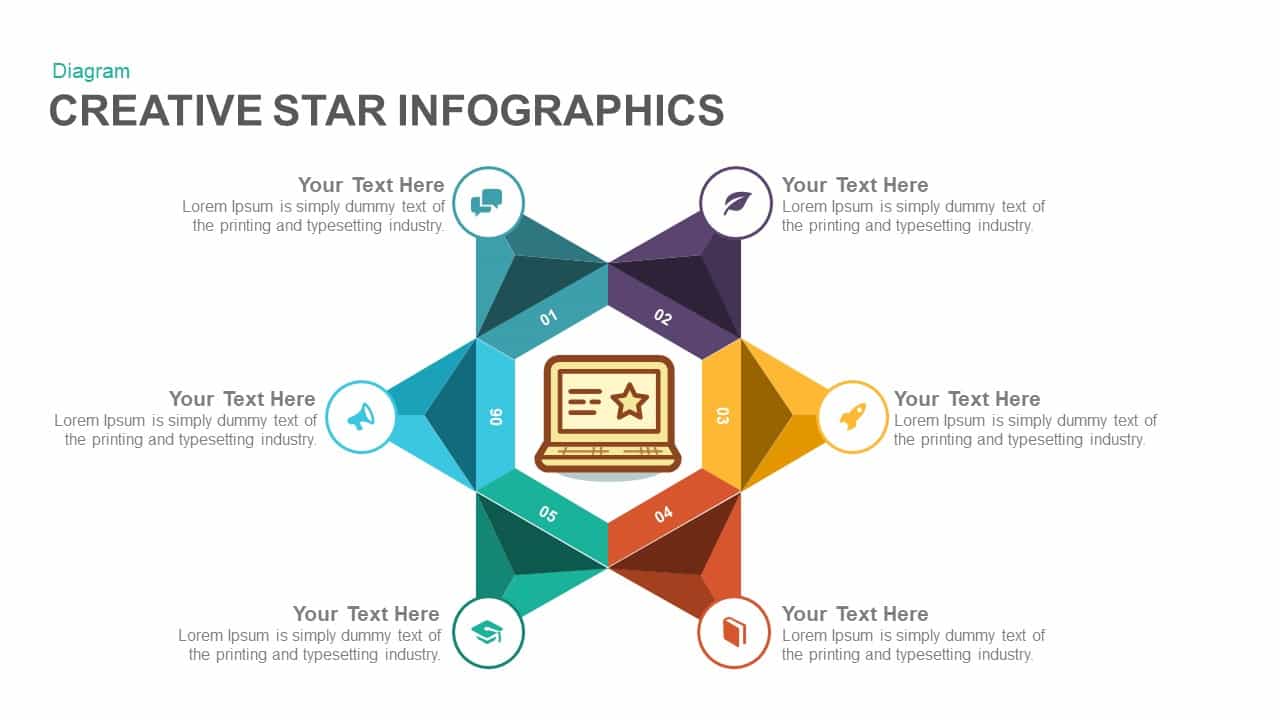
Six-Section Star Infographic Diagram Template for PowerPoint & Google Slides
Circular

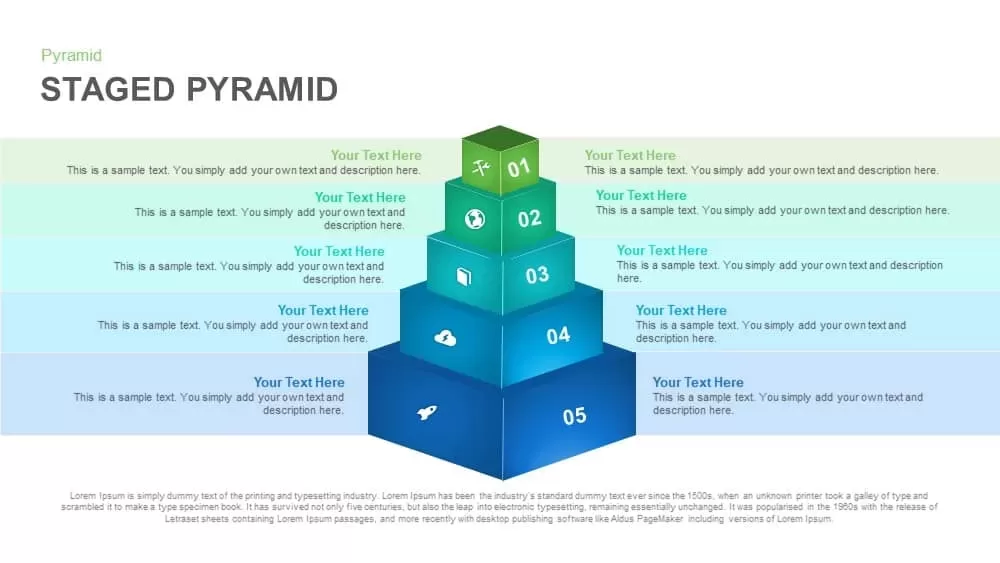
Five-Level Staged Pyramid Diagram Template for PowerPoint & Google Slides
Pyramid
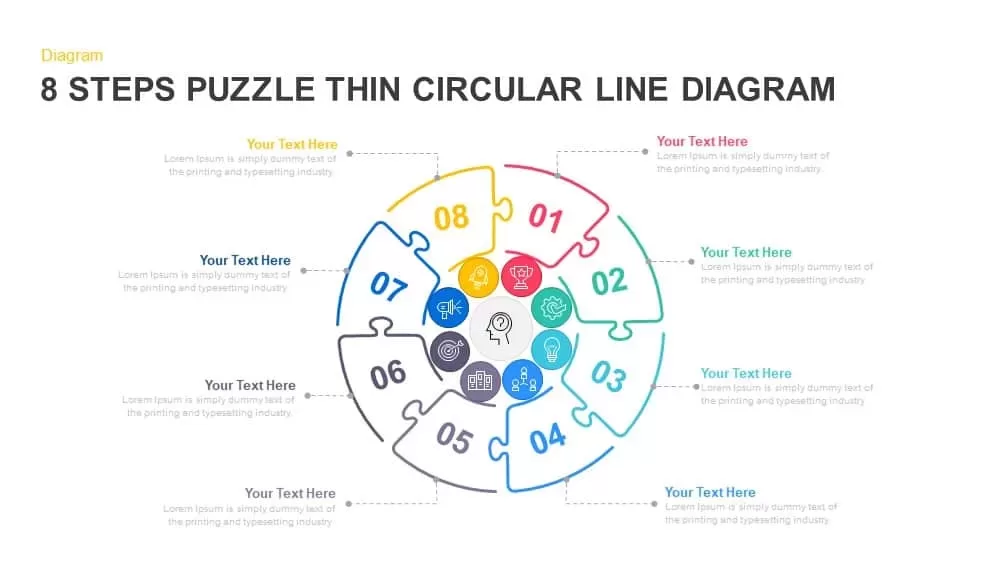
8-Step Puzzle Circular Diagram Template for PowerPoint & Google Slides
Circular
Marketing Risk Management Gear Diagram Template for PowerPoint & Google Slides
Risk Management
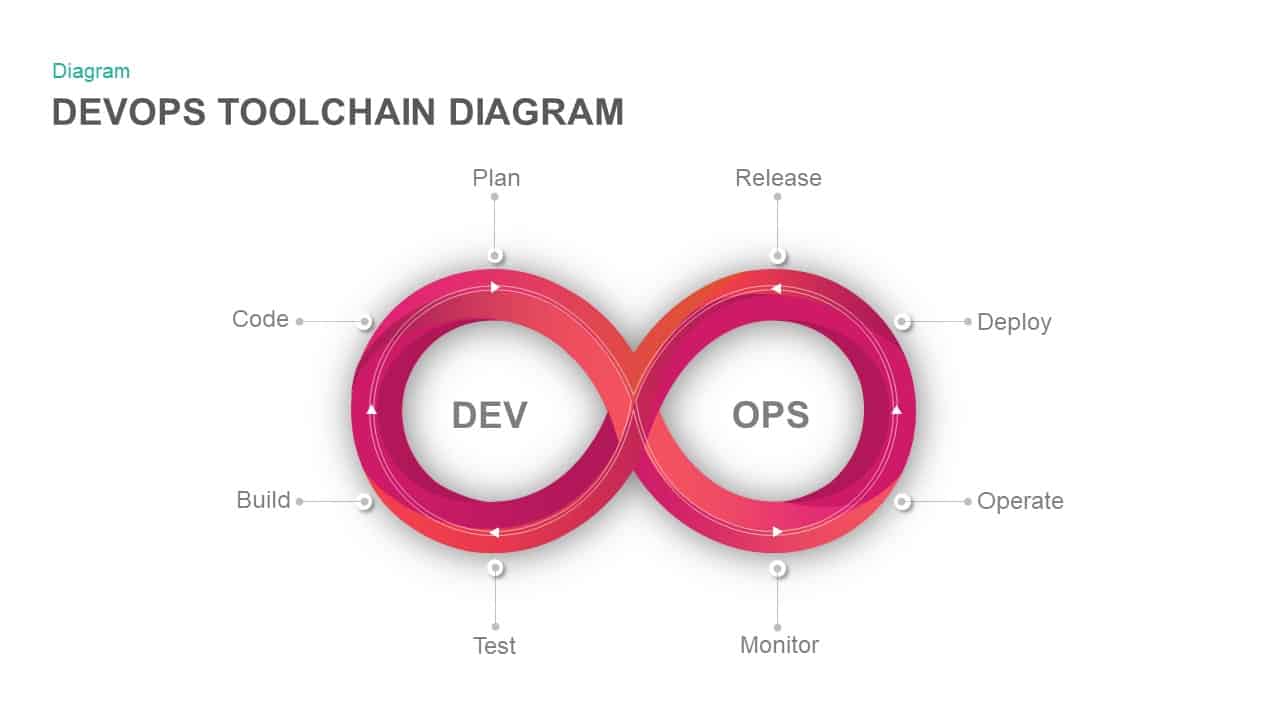
DevOps Infinity Loop Process Diagram Template for PowerPoint & Google Slides
Process
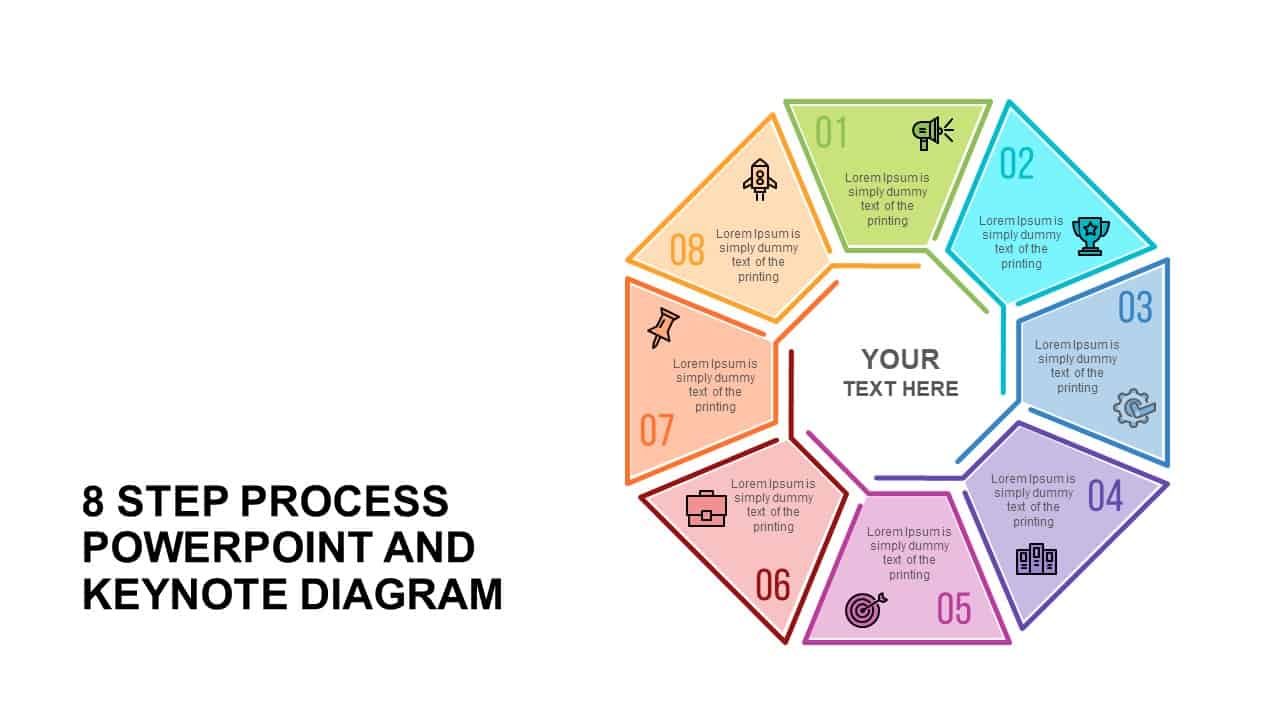
8 Step Process Diagram for PowerPoint & Google Slides
Process
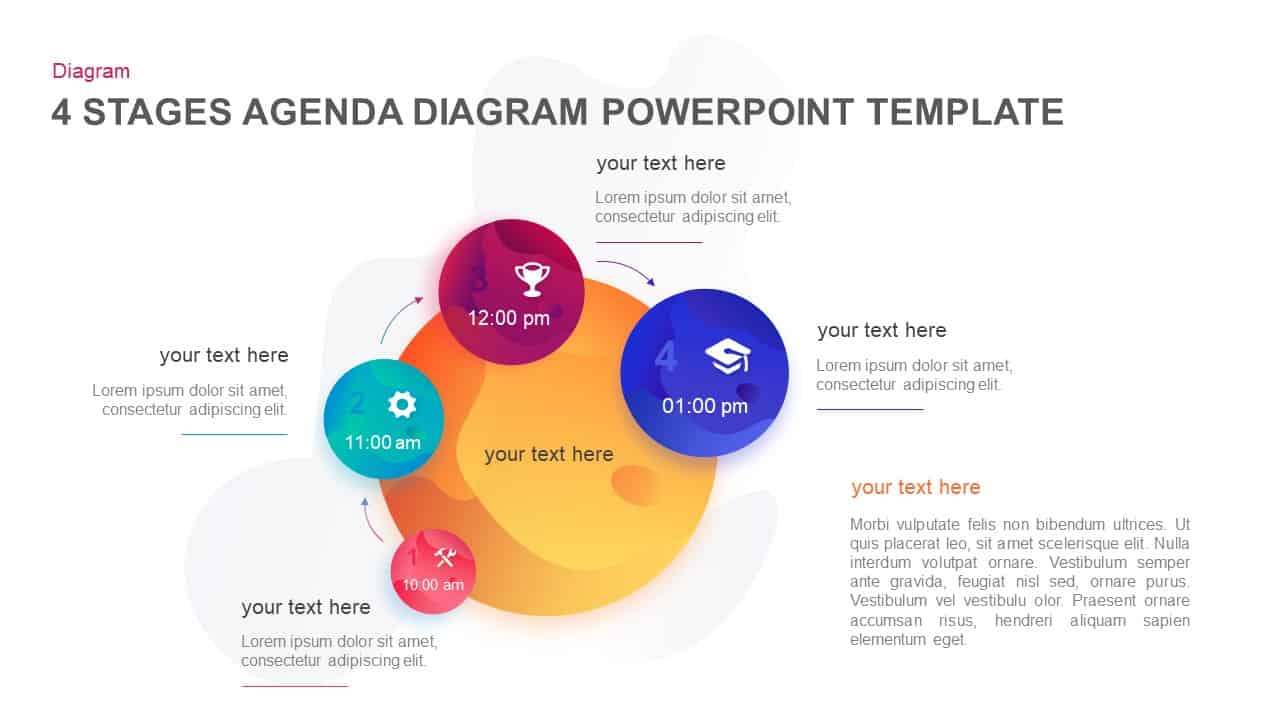
Four-Stage Agenda Circle Diagram Slide Template for PowerPoint & Google Slides
Agenda
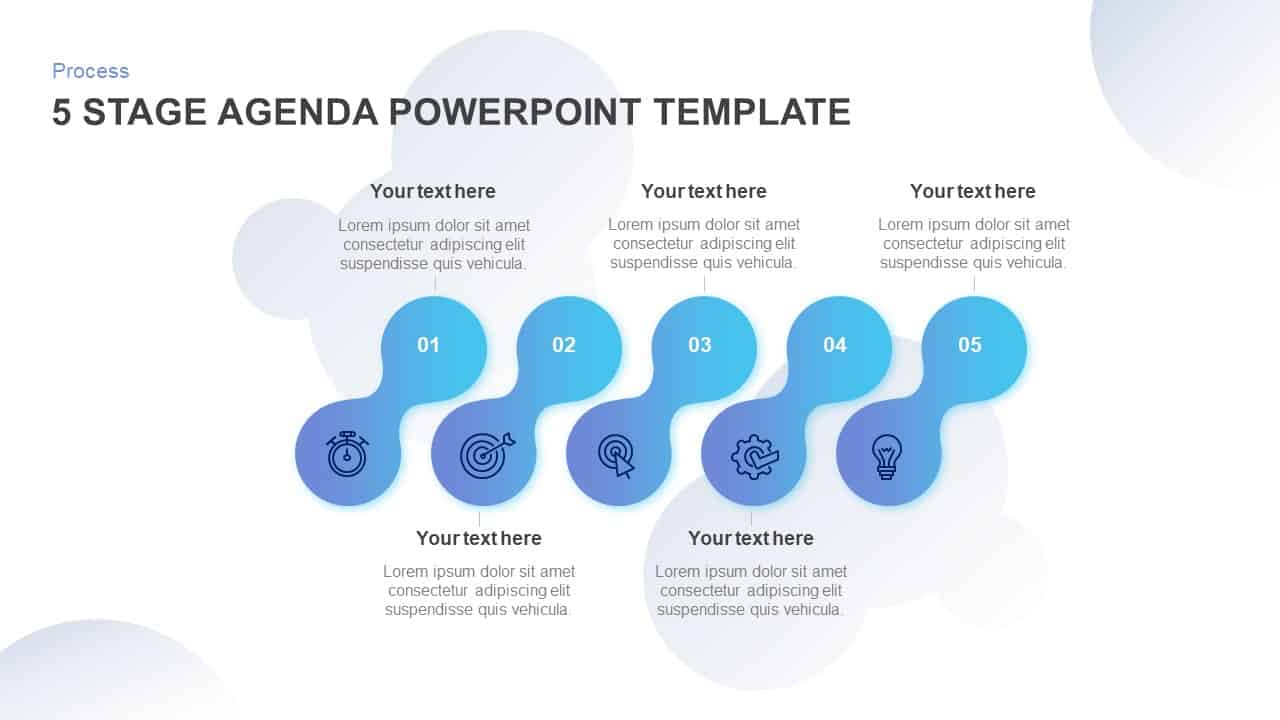
Five-Stage Agenda Flow Diagram Template for PowerPoint & Google Slides
Agenda
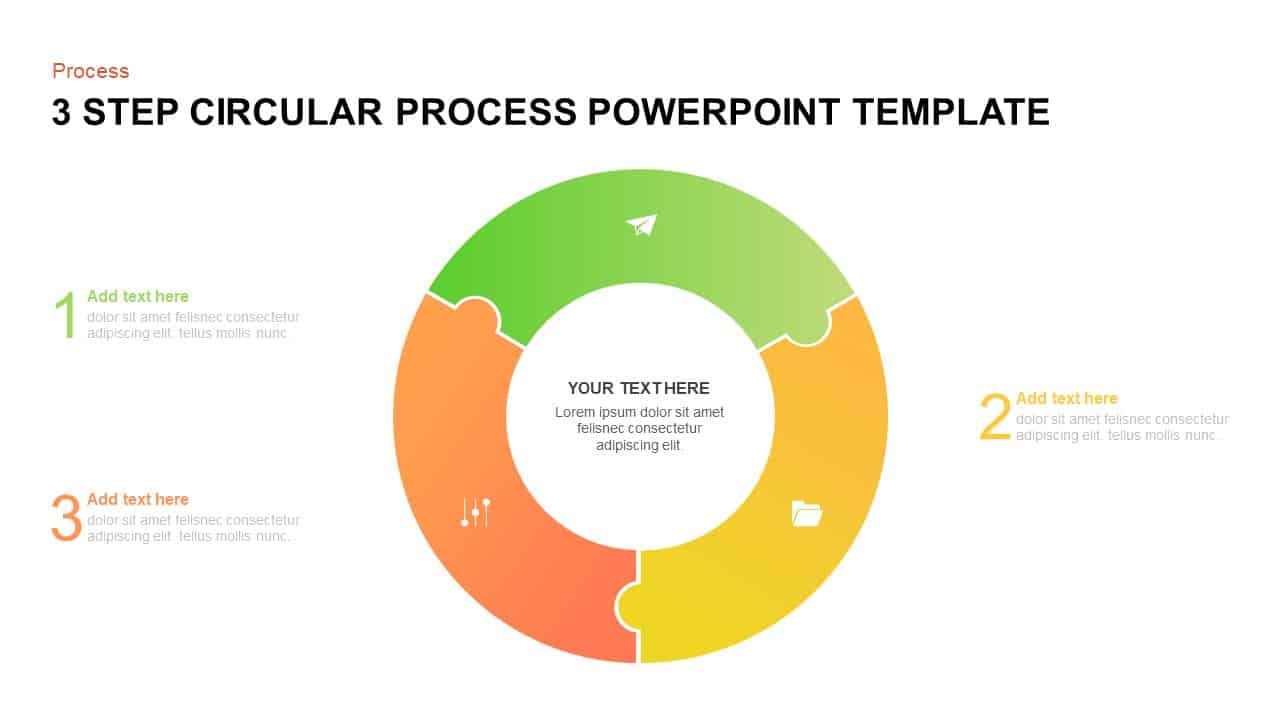
Five-Step Circular Process Diagram Template for PowerPoint & Google Slides
Circular
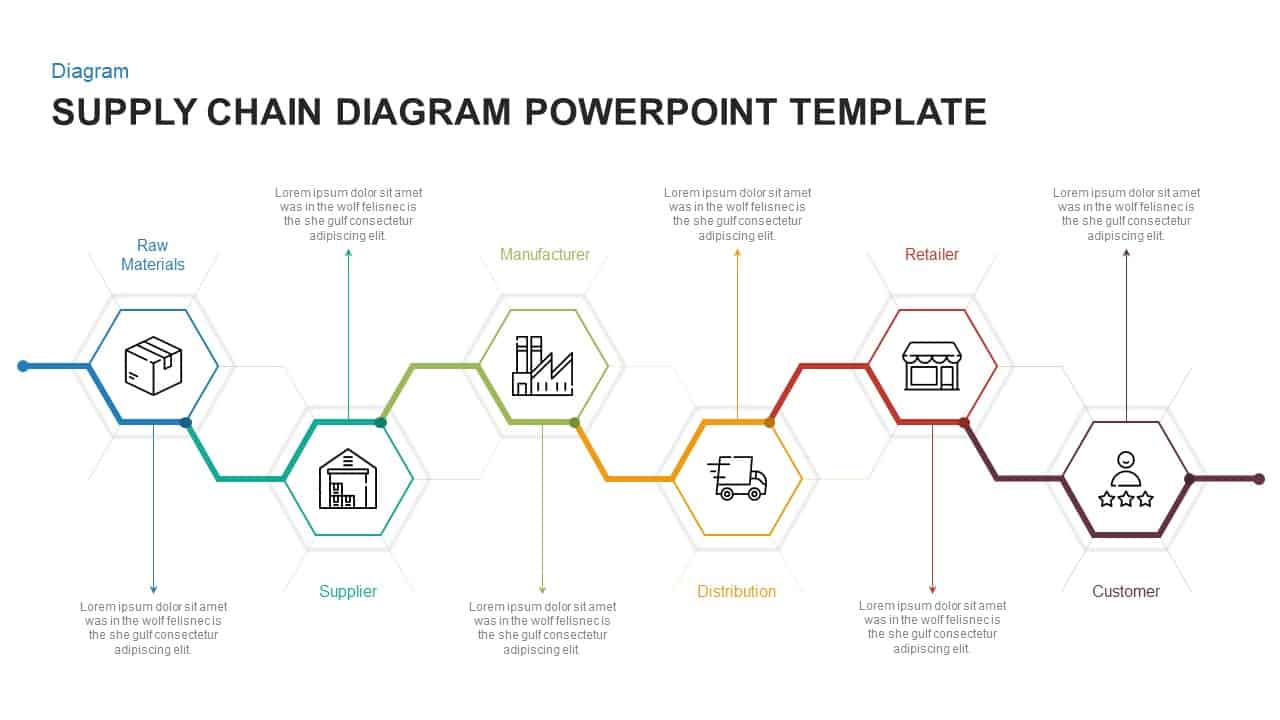
Hexagonal Supply Chain Diagram Template for PowerPoint & Google Slides
Process
Three to Nine-Step Puzzle Ring Process Diagram Template for PowerPoint & Google Slides
Circular
4 Stage Linear Process Flow Diagram Template for PowerPoint & Google Slides
Process
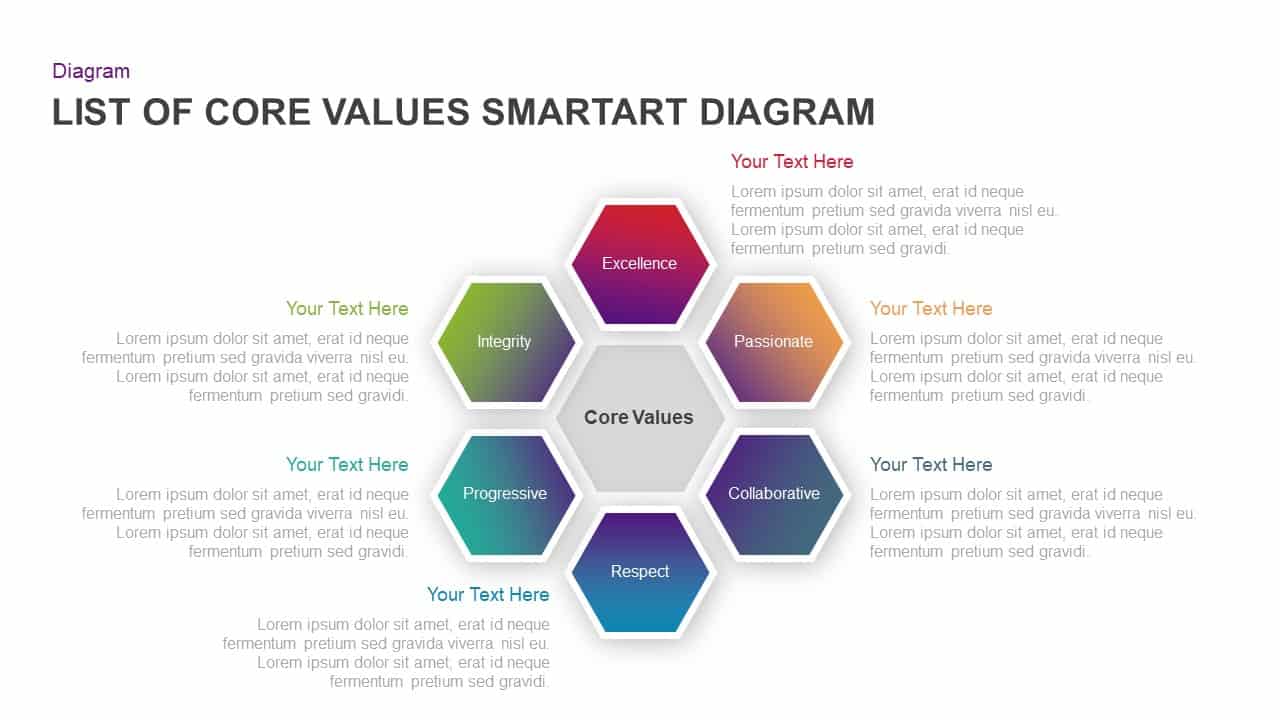
Core Values SmartArt Hexagon Diagram Template for PowerPoint & Google Slides
Circular
Five-Input Cause and Effect Diagram Template for PowerPoint & Google Slides
Arrow
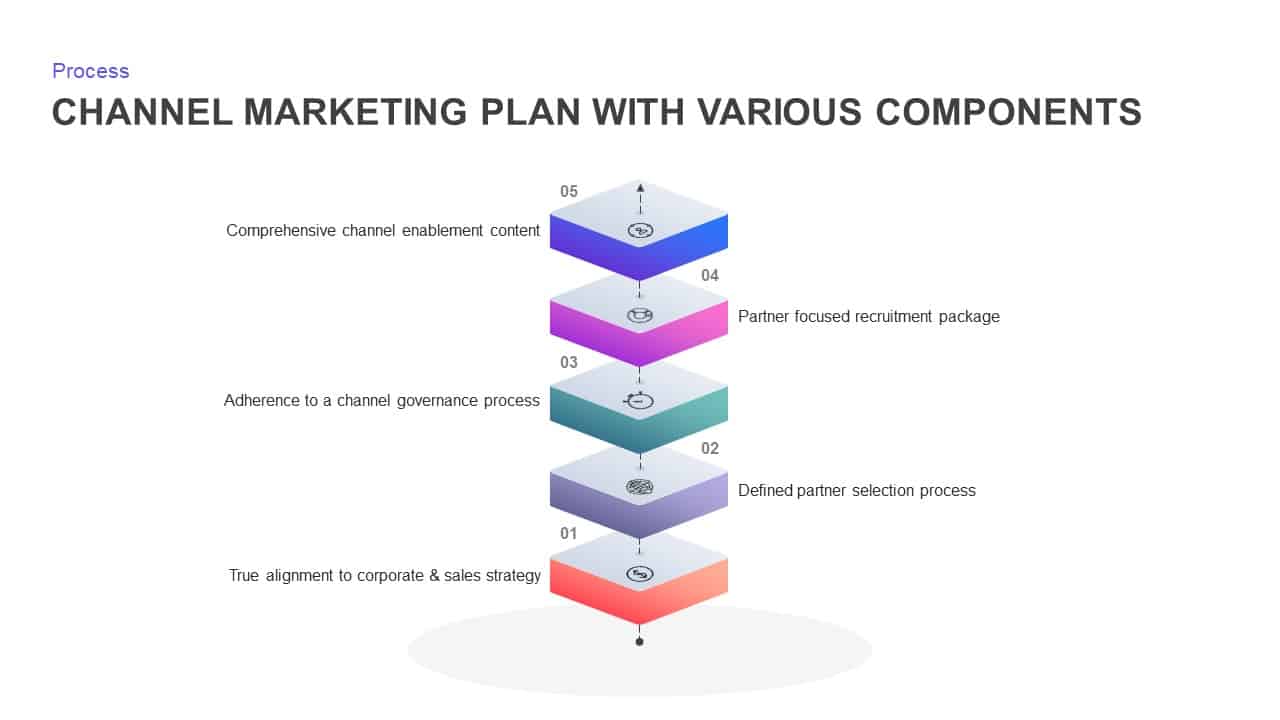
Channel Marketing Plan Layered Diagram Template for PowerPoint & Google Slides
Process
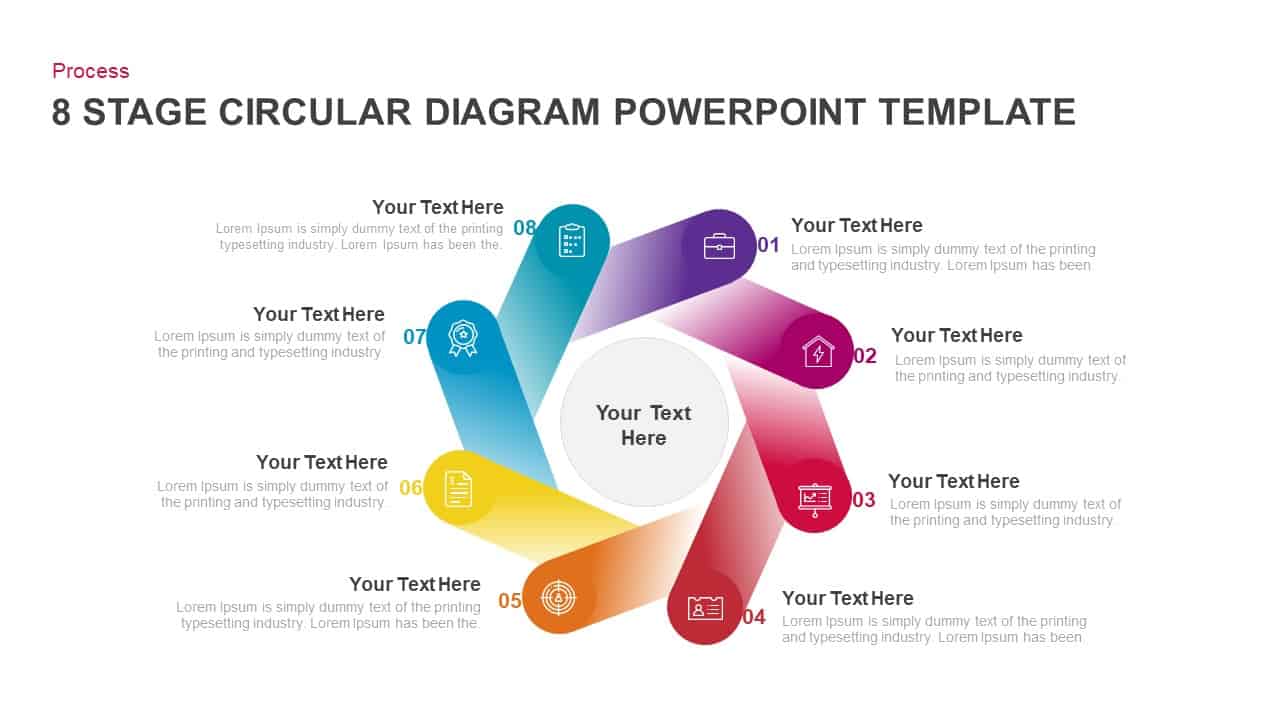
8-Stage Chevron Circular Diagram Template for PowerPoint & Google Slides
Process
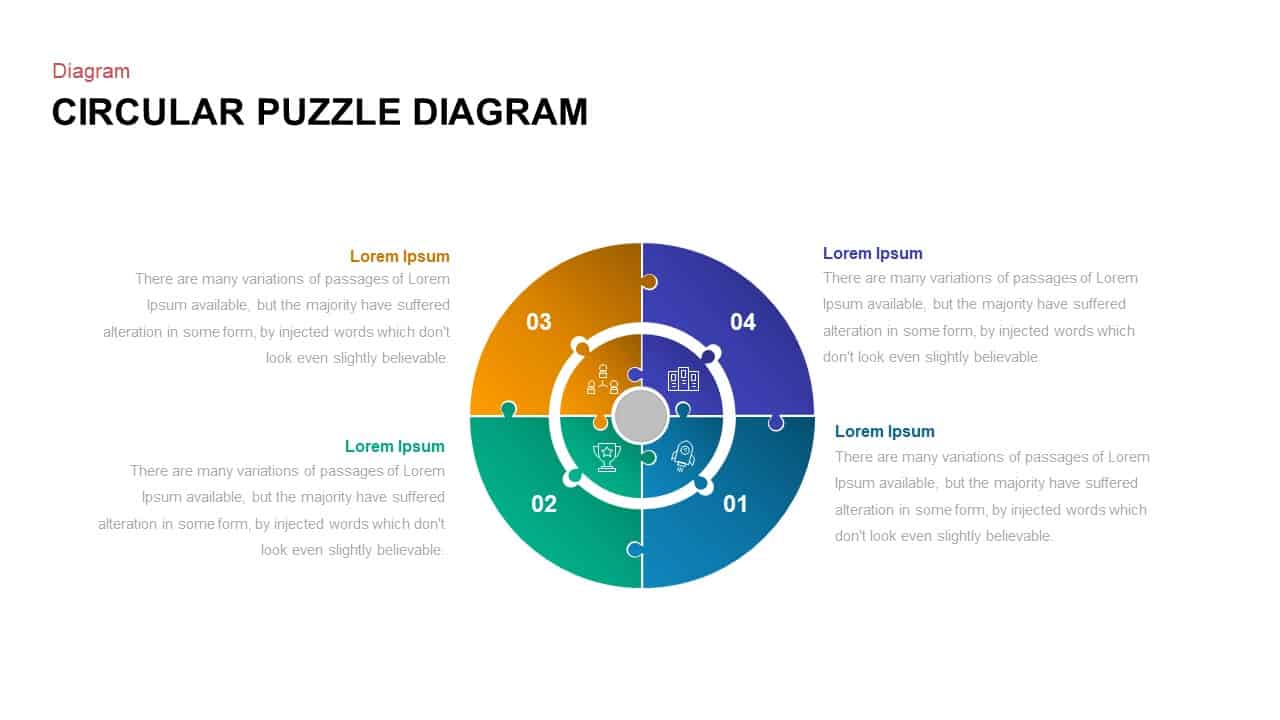
Colorful Circular Puzzle Diagram Template for PowerPoint & Google Slides
Circular
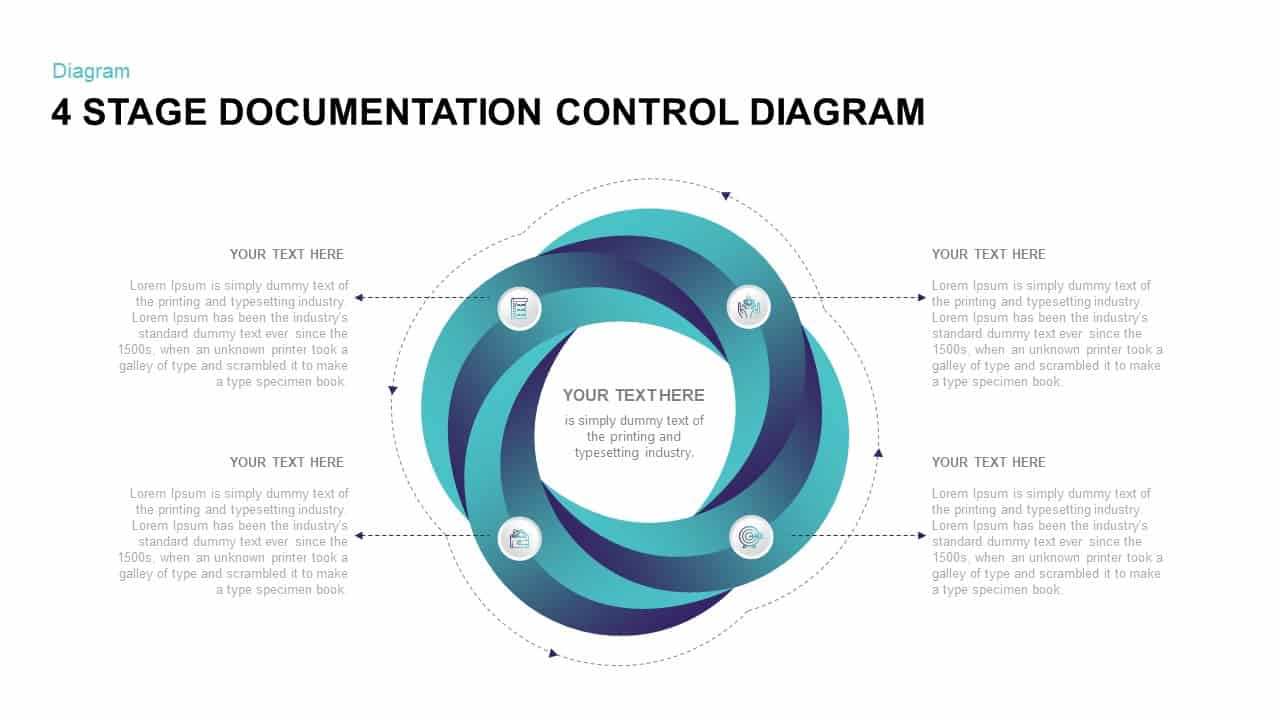
4-Stage Documentation Control Diagram Template for PowerPoint & Google Slides
Process
Vertical Split Flow Chart Diagram Template for PowerPoint & Google Slides
Flow Charts
Six-Circle Process Infographic Diagram Template for PowerPoint & Google Slides
Circular
3D Layered Infographic Diagram Template for PowerPoint & Google Slides
Infographics
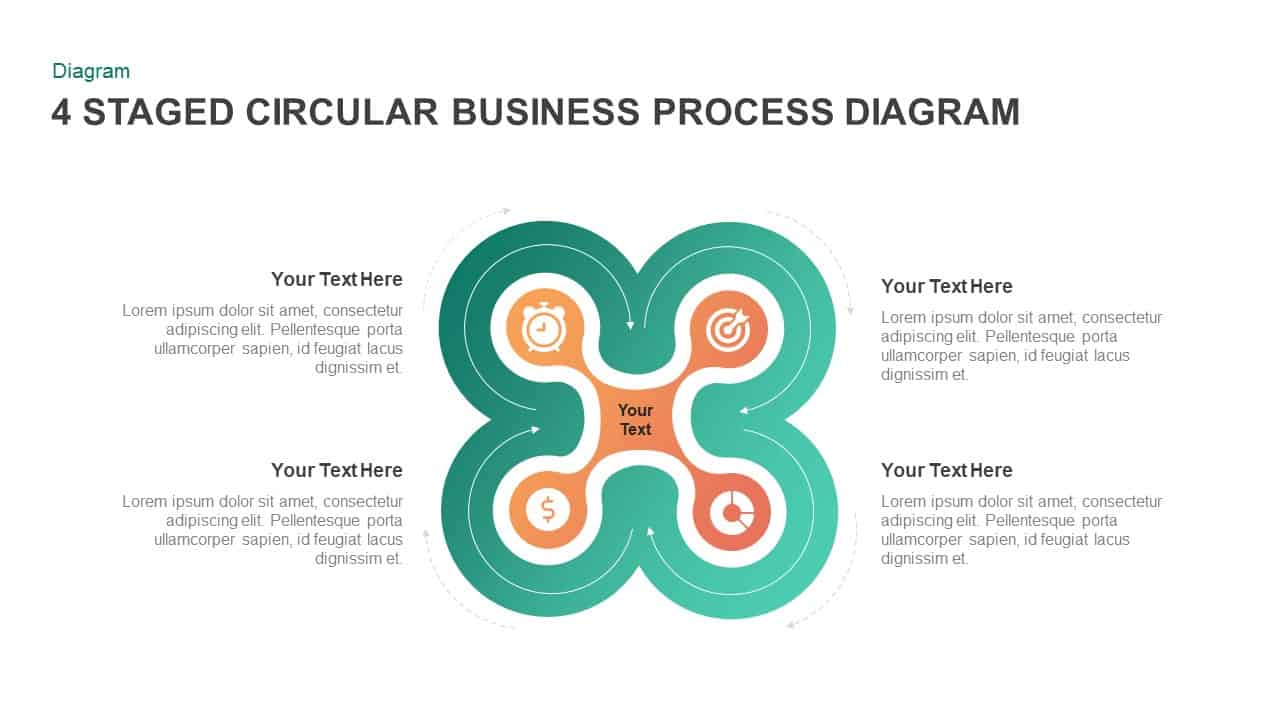
4 Staged Circular Business Process Diagram for PowerPoint & Google Slides
Process

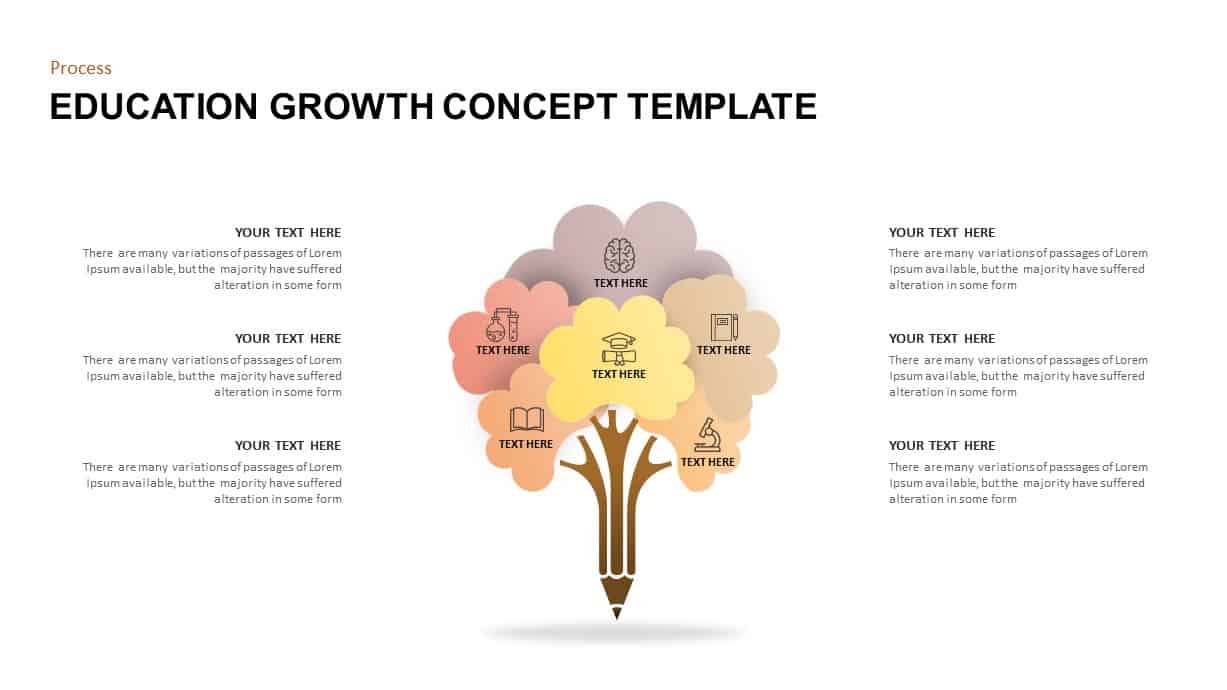
Education Growth Concept Diagram for PowerPoint & Google Slides
Process
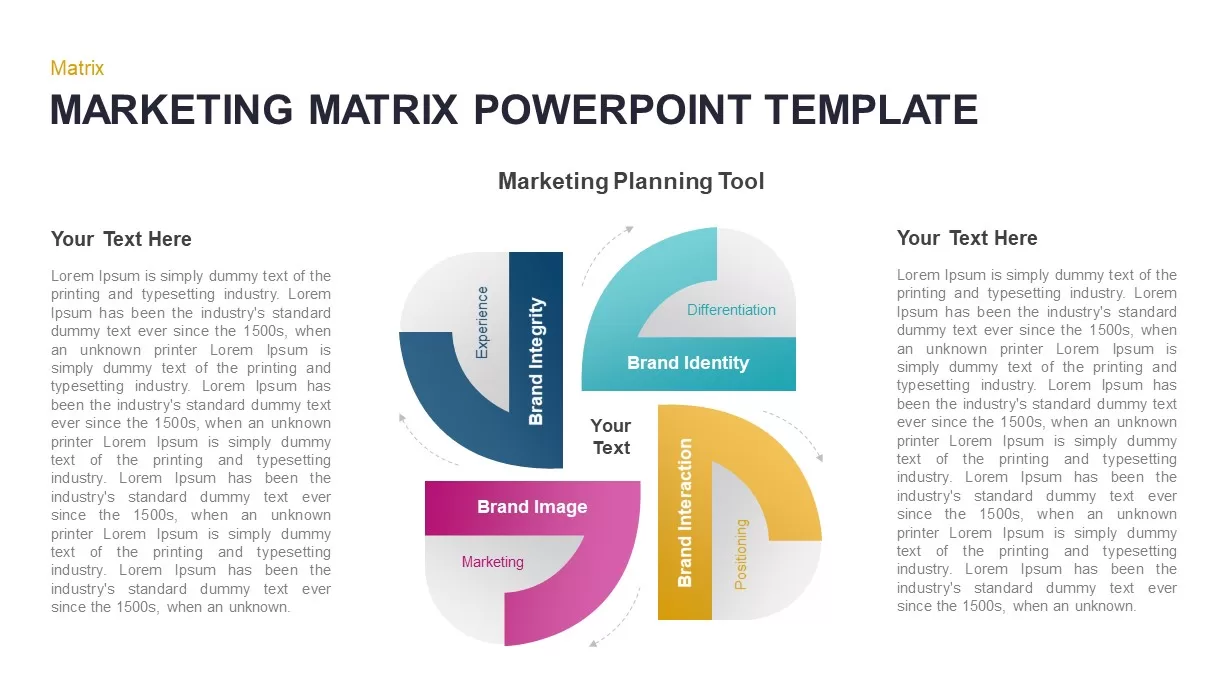
Marketing Matrix Brand Quadrant Diagram Template for PowerPoint & Google Slides
Process
Circular CRM Process Infographic Diagram Template for PowerPoint & Google Slides
Circular
Four-Phase Maturity Model Diagram Template for PowerPoint & Google Slides
Process
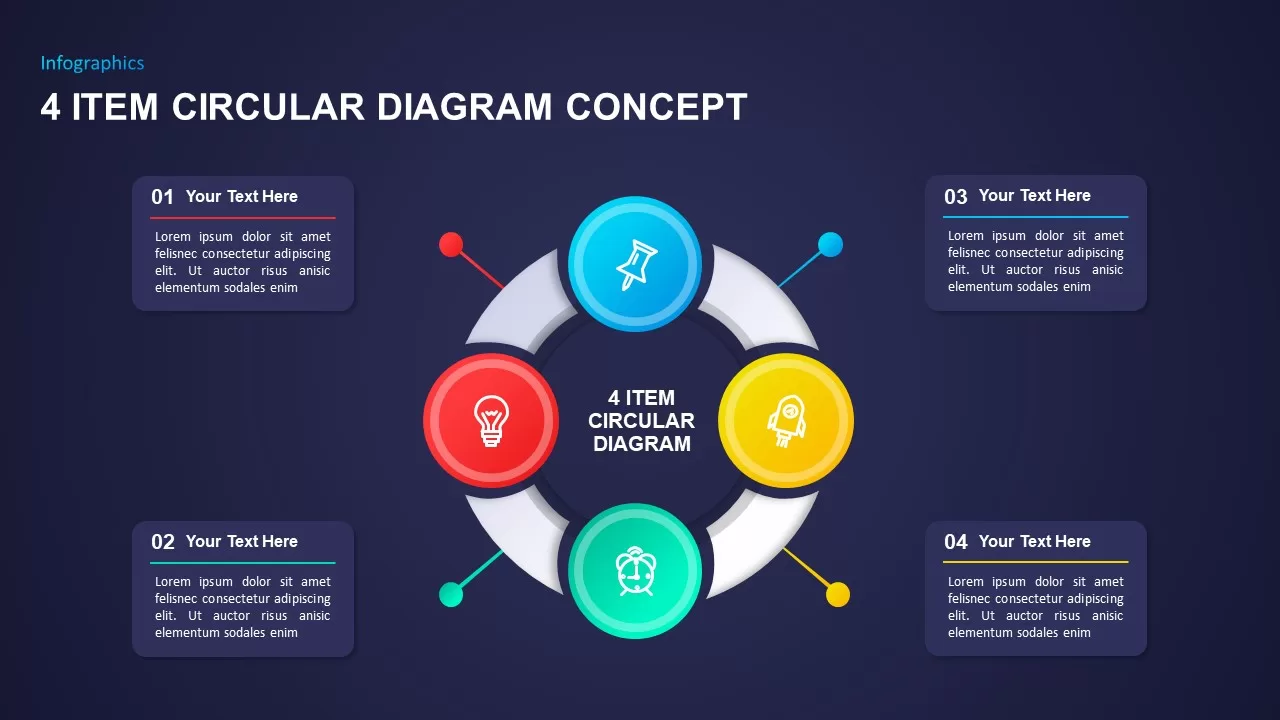
Four-Item Circular Diagram Concept Template for PowerPoint & Google Slides
Circular
Flow Chart Diagram Template for PowerPoint & Google Slides
Flow Charts
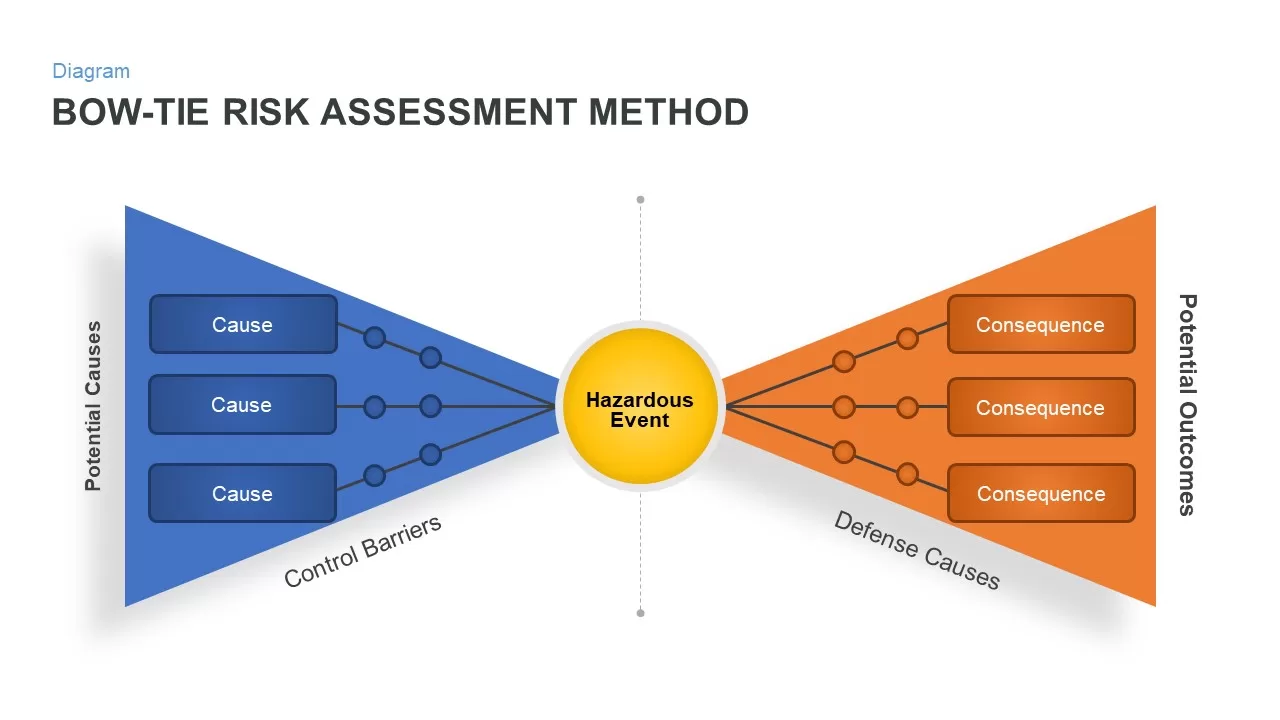
Bow-Tie Risk Assessment Diagram Template for PowerPoint & Google Slides
Risk Management
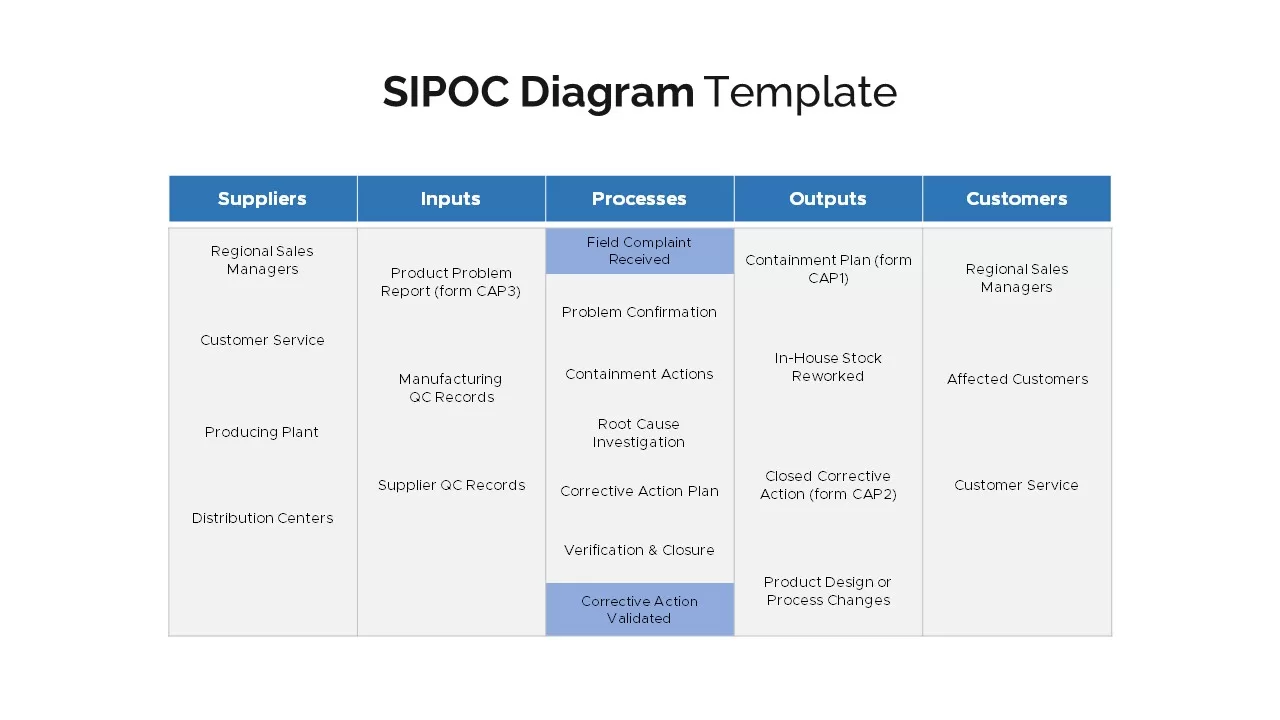
Four SIPOC Diagram Infographic Templates for PowerPoint & Google Slides
Business Plan
Free Simple Venn Diagram Overview template for PowerPoint & Google Slides
Comparison Chart
Free
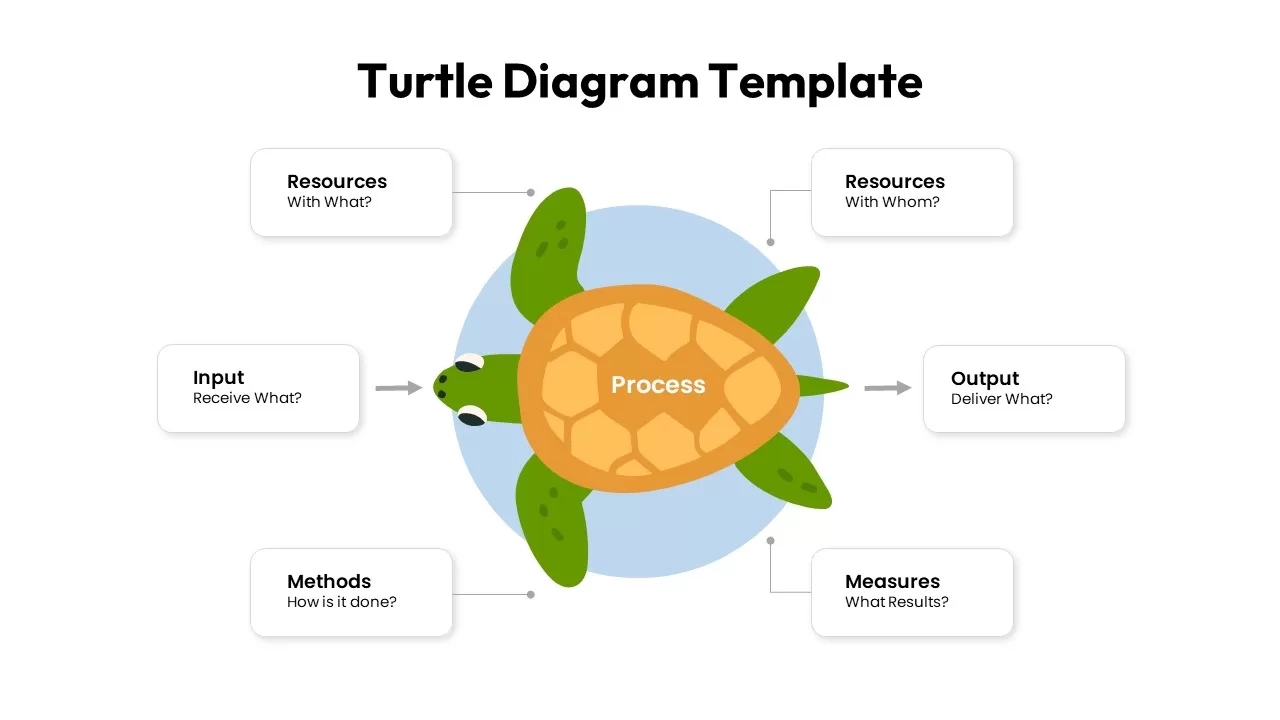
Turtle Diagram Infographics Template for PowerPoint & Google Slides
Process
Free Circular Multi-Step Flow Chart Diagram Template for PowerPoint & Google Slides
Flow Charts
Free
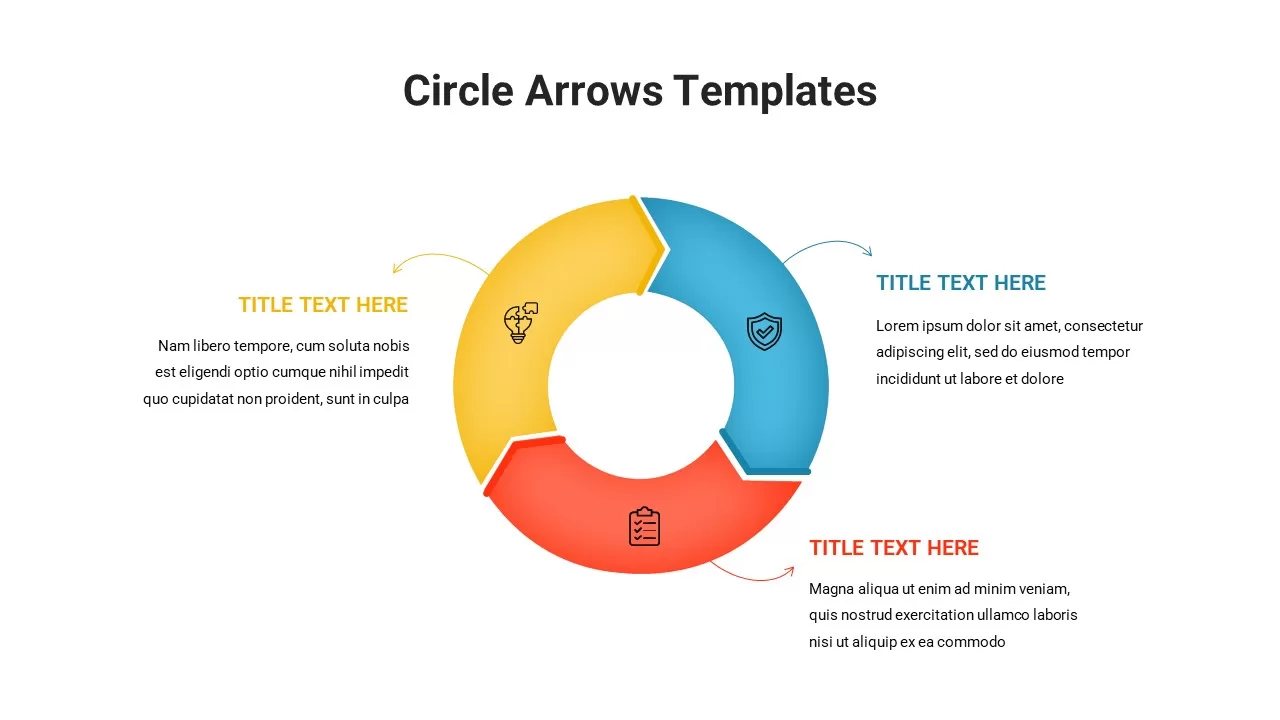
Circle Arrows Diagram template for PowerPoint & Google Slides
Process
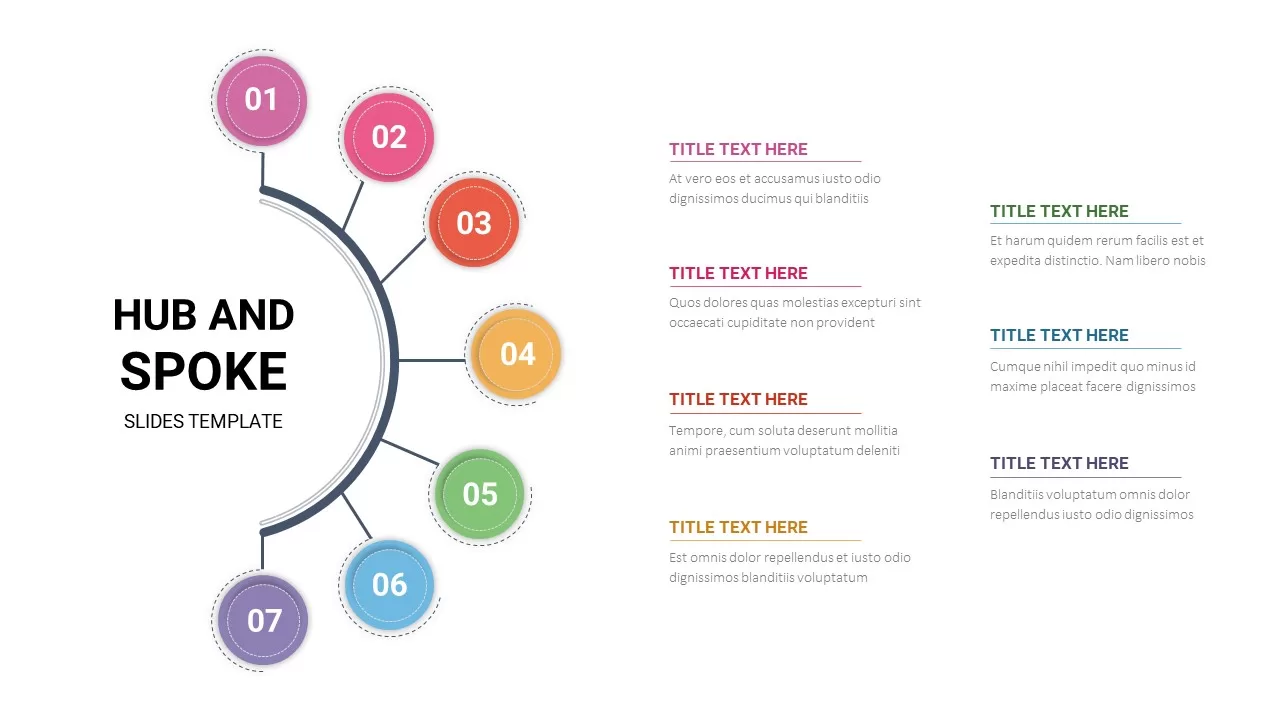
7 Hub and Spoke Diagram Slide for PowerPoint & Google Slides
Process
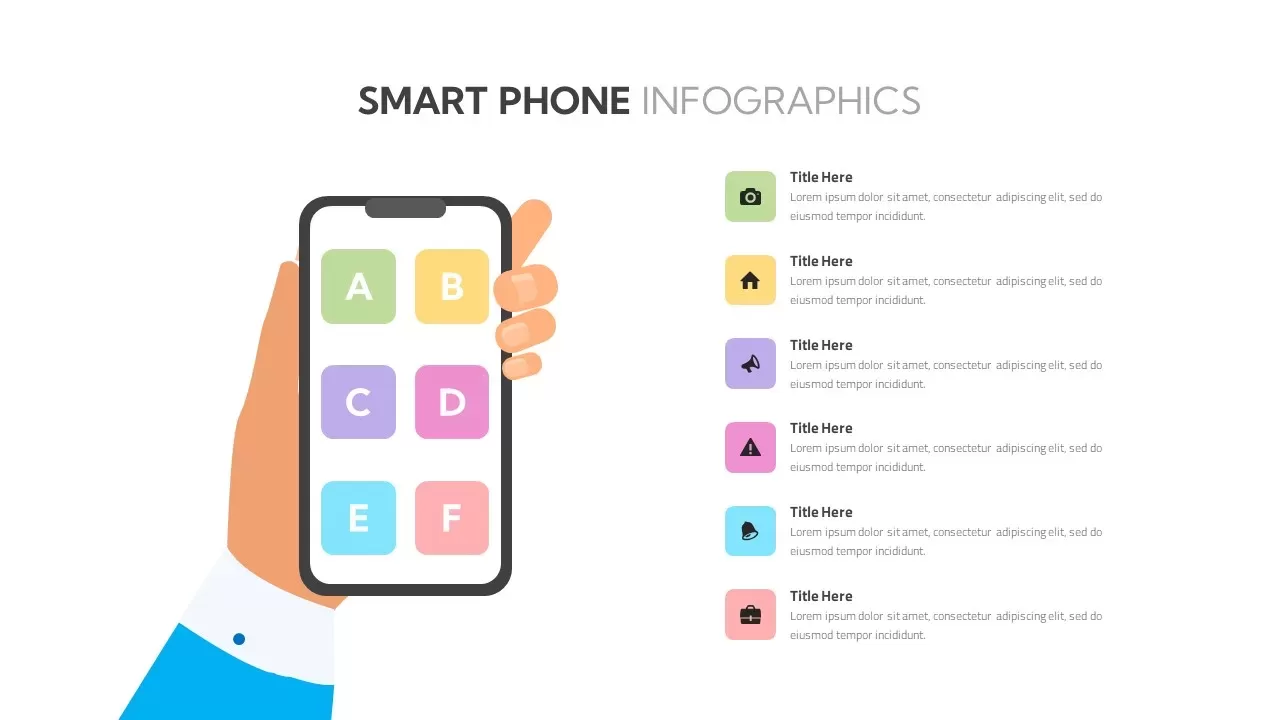
Smartphone Infographic Diagram Template for PowerPoint & Google Slides
Comparison
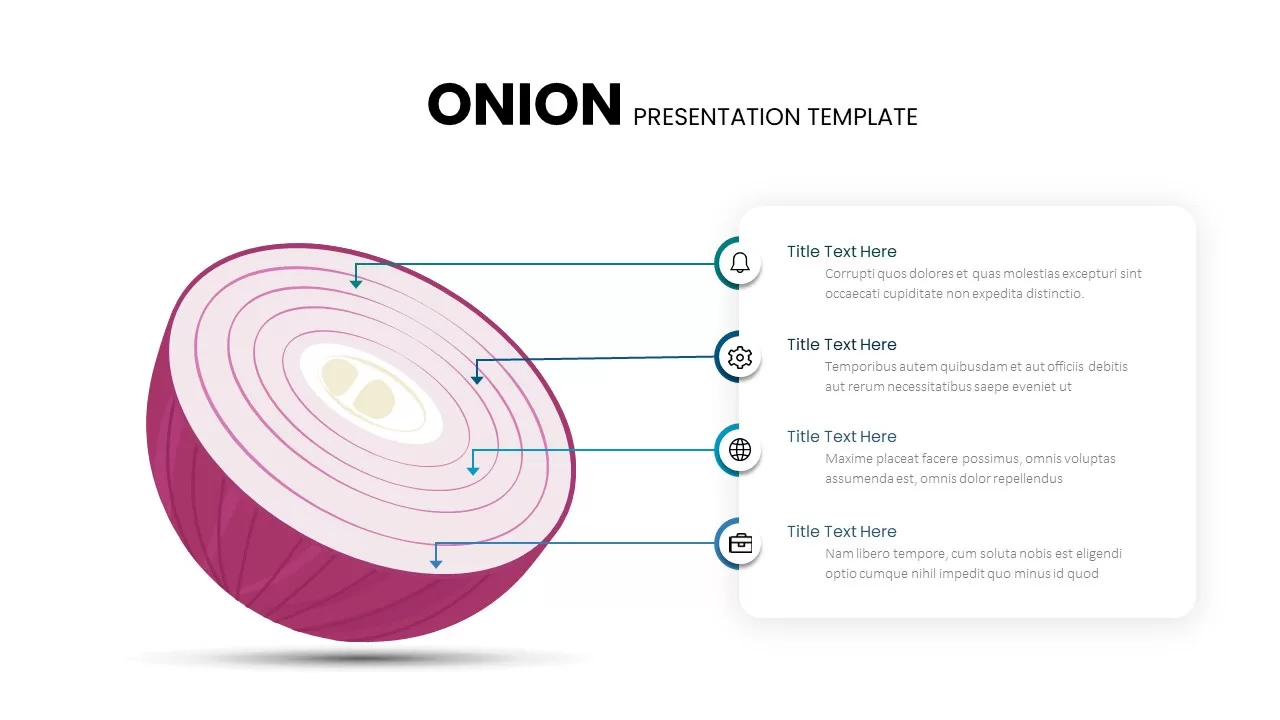
Layered Onion Diagram Template for PowerPoint & Google Slides
Process
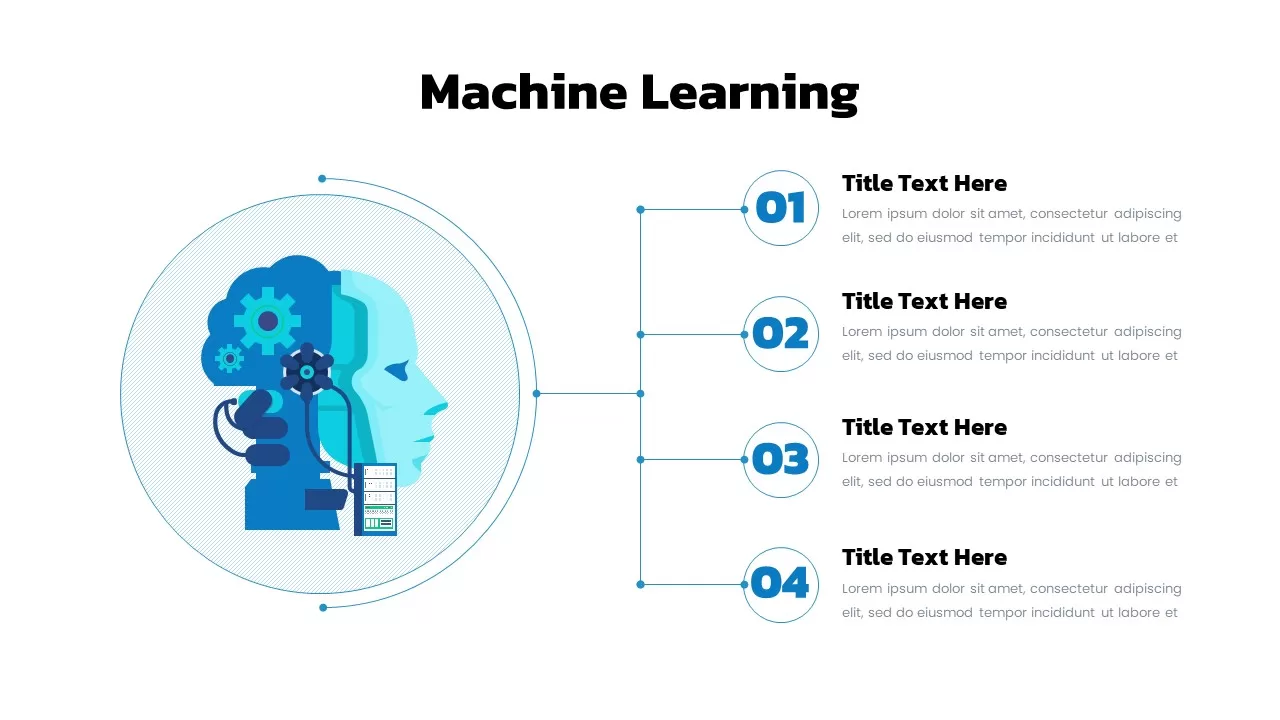
Machine Learning Diagram Template for PowerPoint & Google Slides
Process
Five Circle Venn Diagram for Template for PowerPoint & Google Slides
Circular
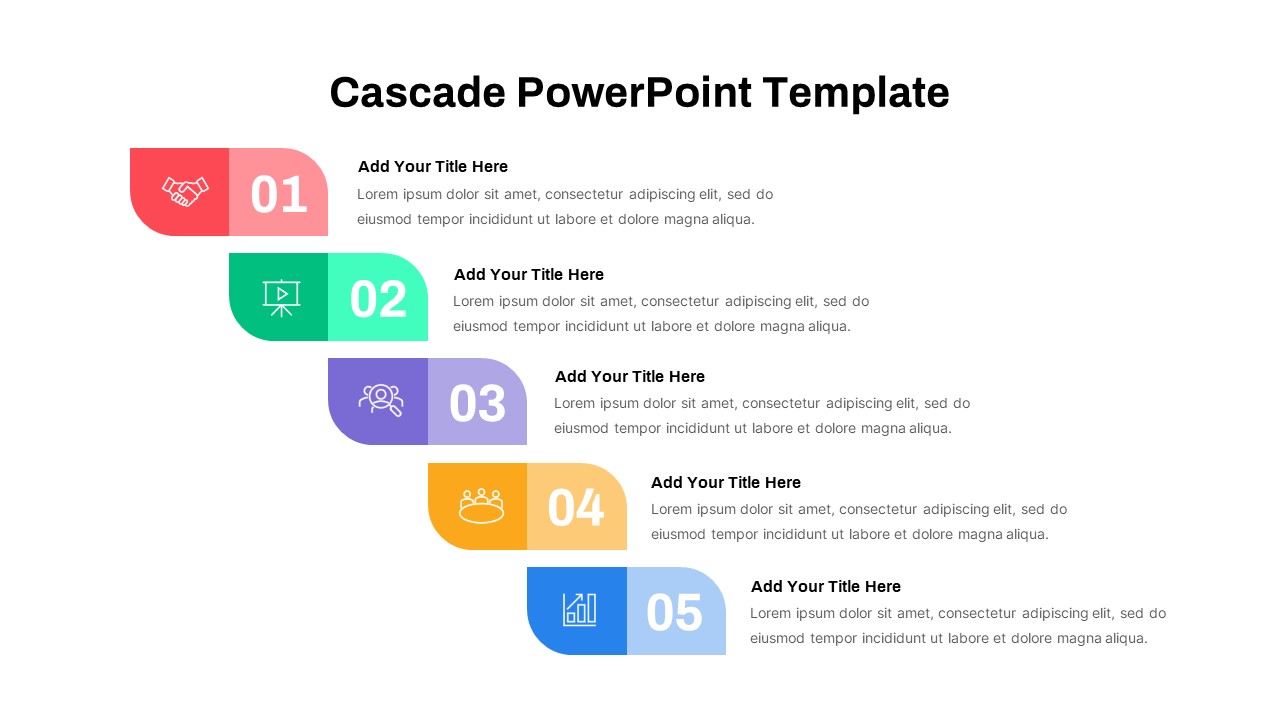
Five-Step Cascade Diagram & Timeline Template for PowerPoint & Google Slides
Process
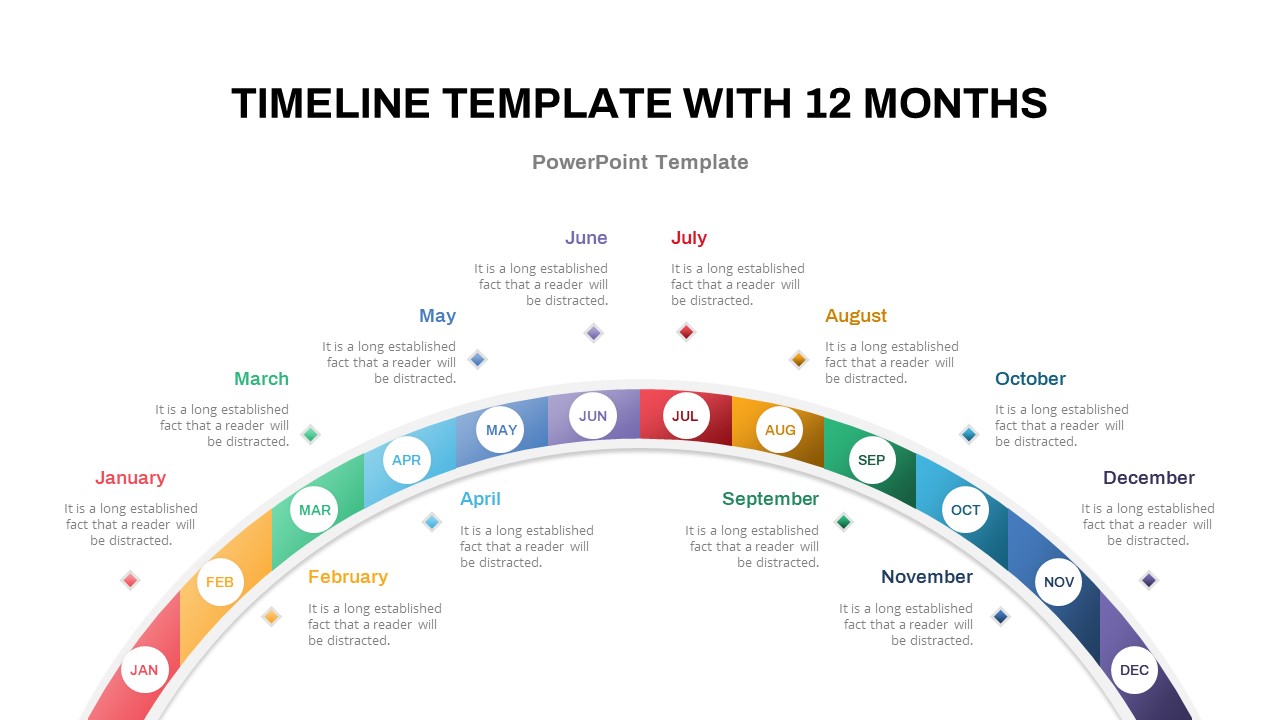
12-Month Semi-Circular Timeline Diagram Template for PowerPoint & Google Slides
Timeline
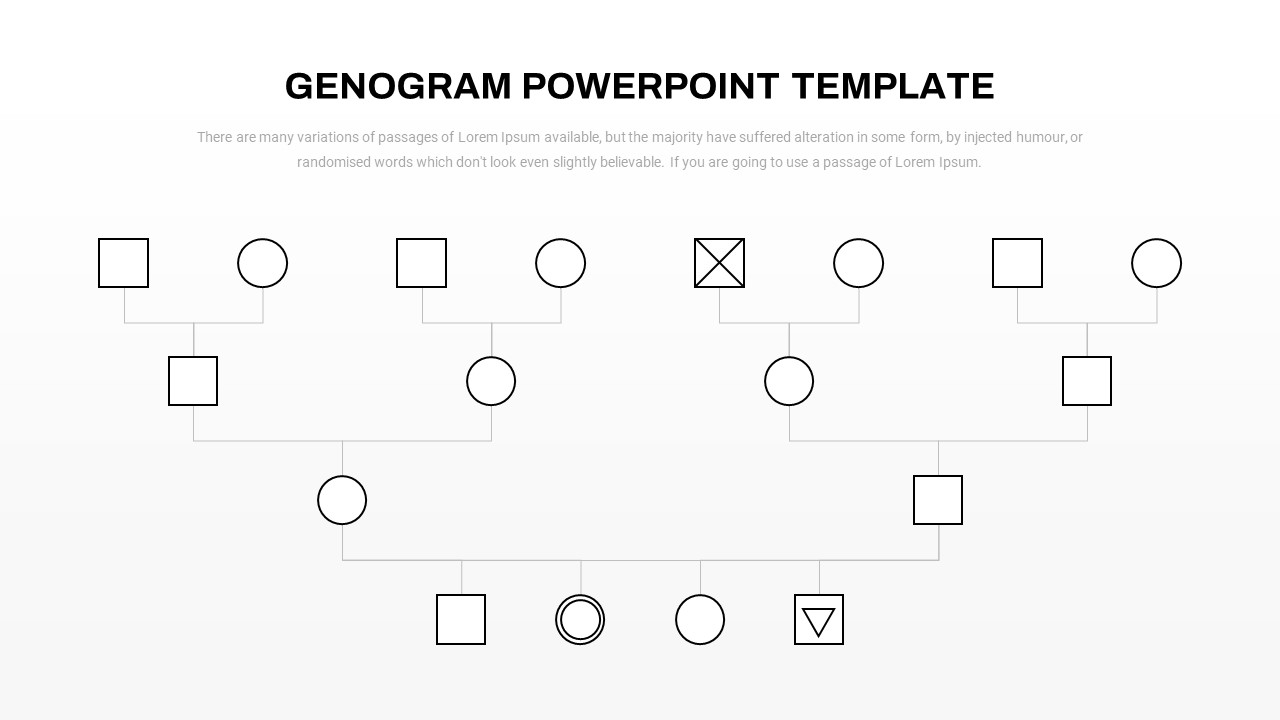
Genogram Family Relationship Diagram Template for PowerPoint & Google Slides
Org Chart
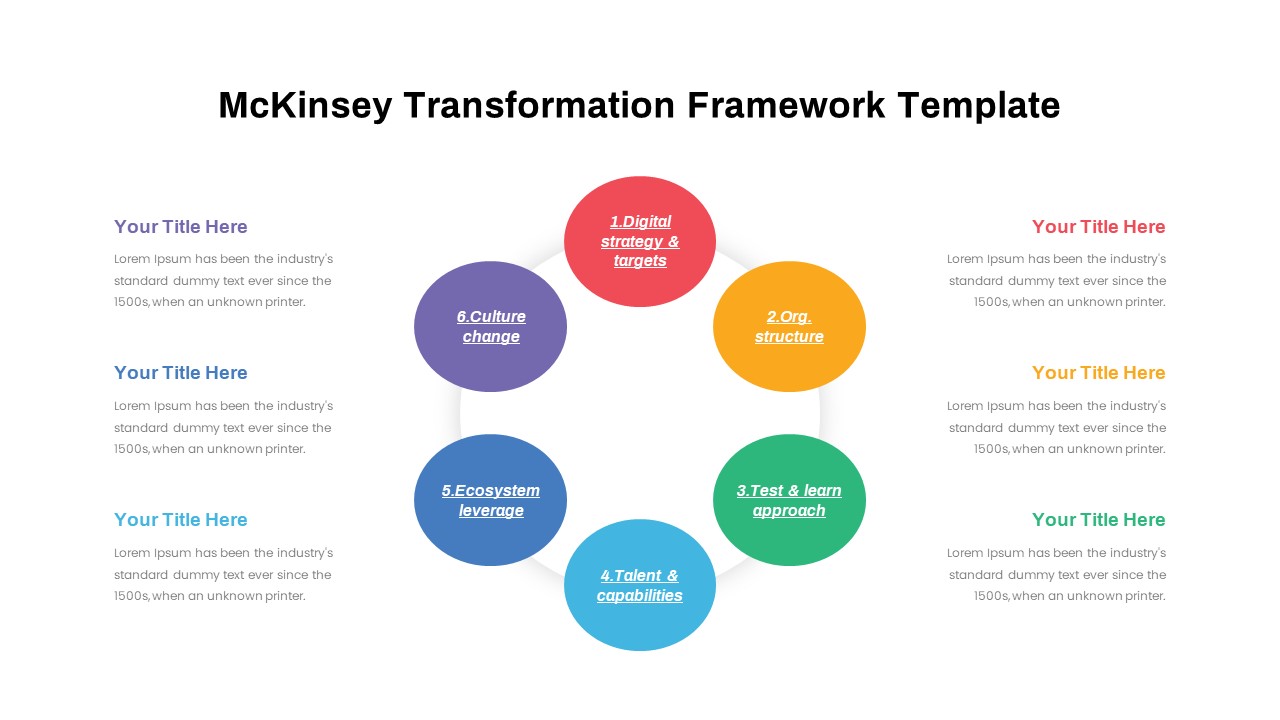
BCG Transformation Framework Diagram Template for PowerPoint & Google Slides
BCG
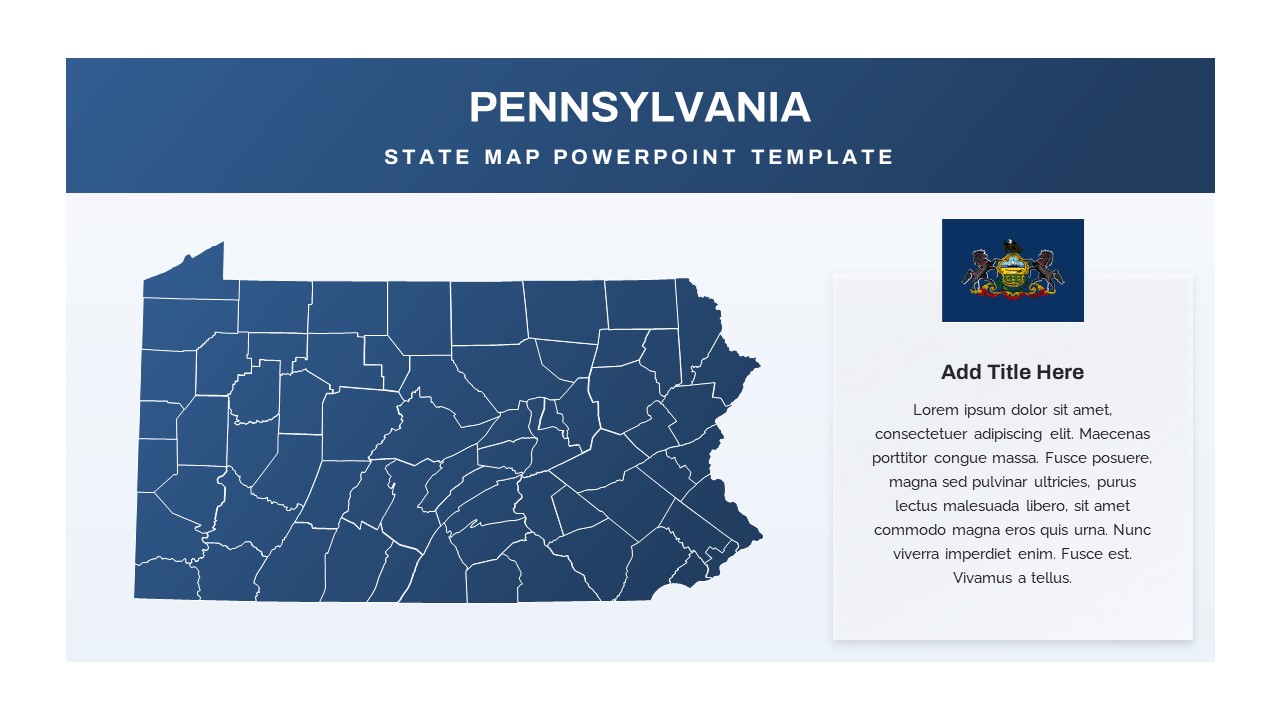
Pennsylvania State Map Diagram Template for PowerPoint & Google Slides
World Maps
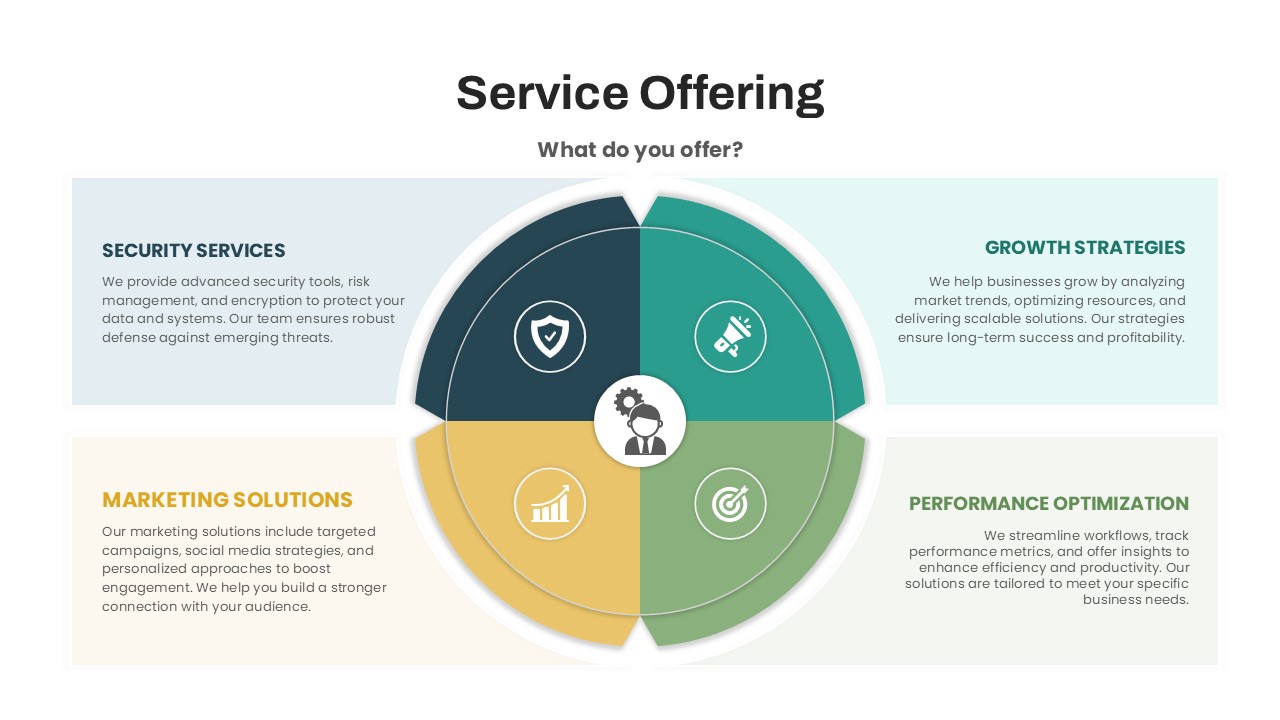
Circular Service Offering Diagram Template for PowerPoint & Google Slides
Circular
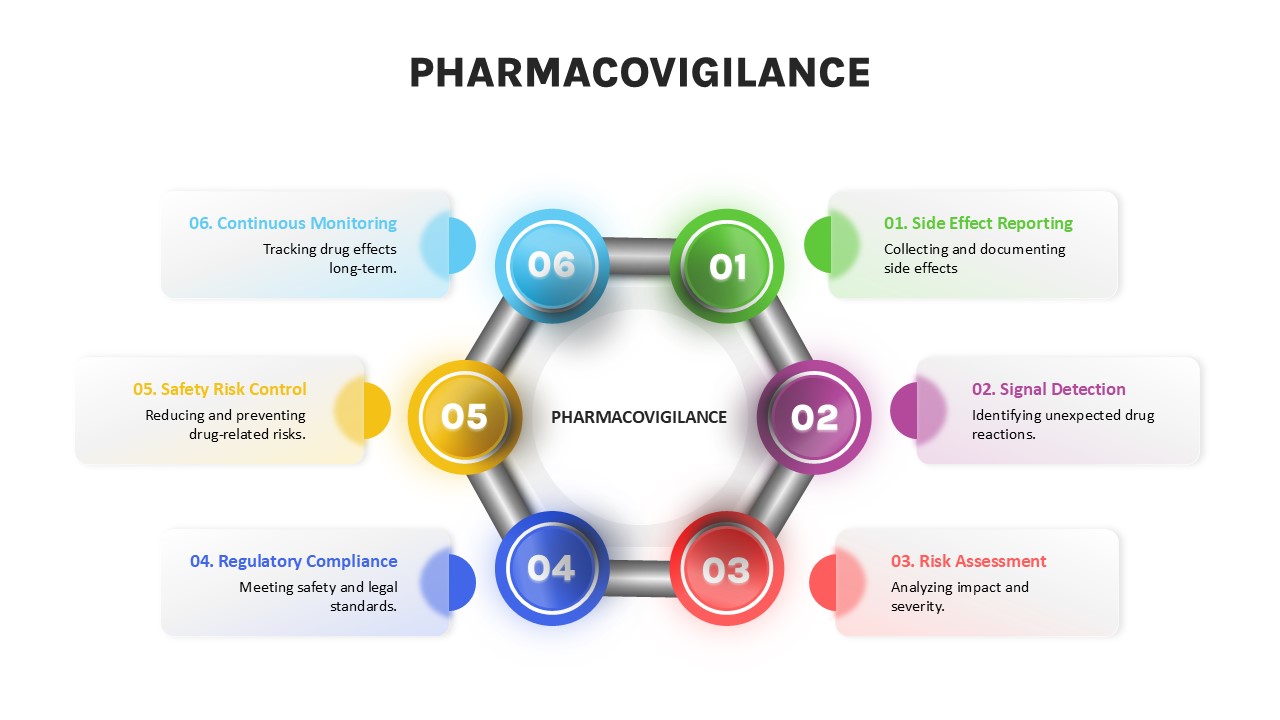
Pharmacovigilance Process Diagram Template for PowerPoint & Google Slides
Process
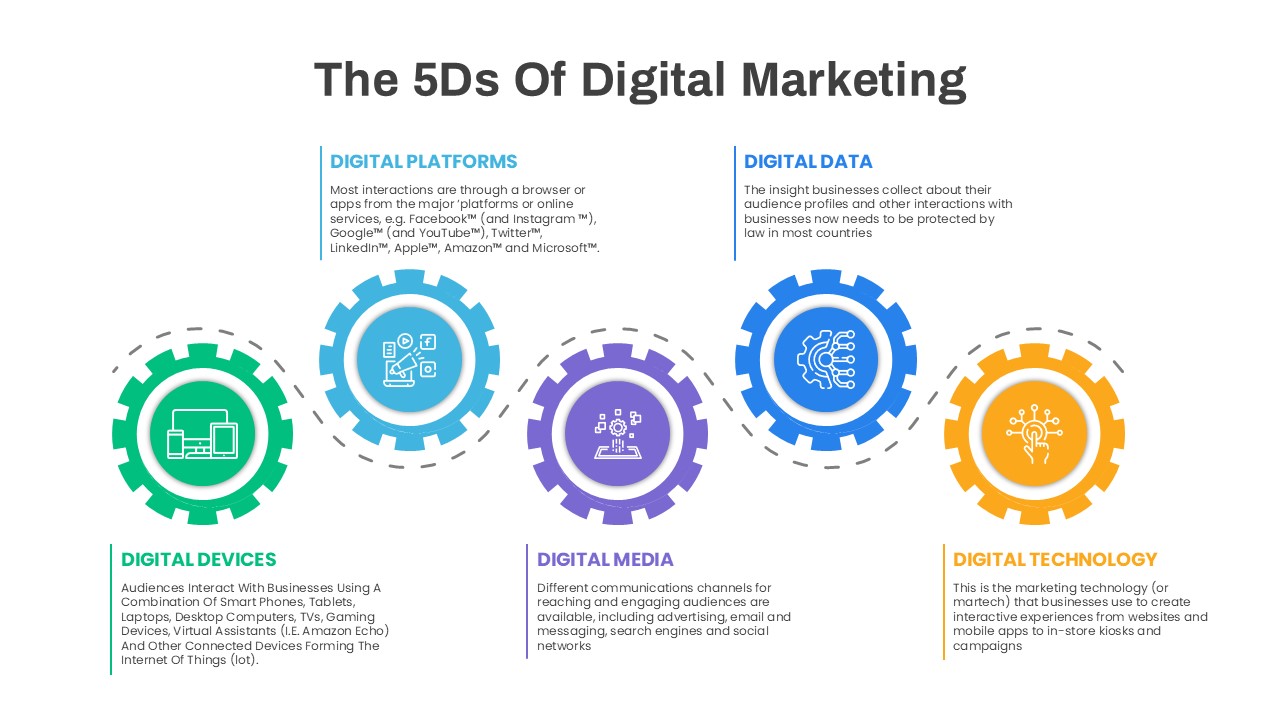
5D Digital Marketing Flow Diagram Template for PowerPoint & Google Slides
Digital Marketing
DESTEP Marketing Analysis Diagram Template for PowerPoint & Google Slides
Circular
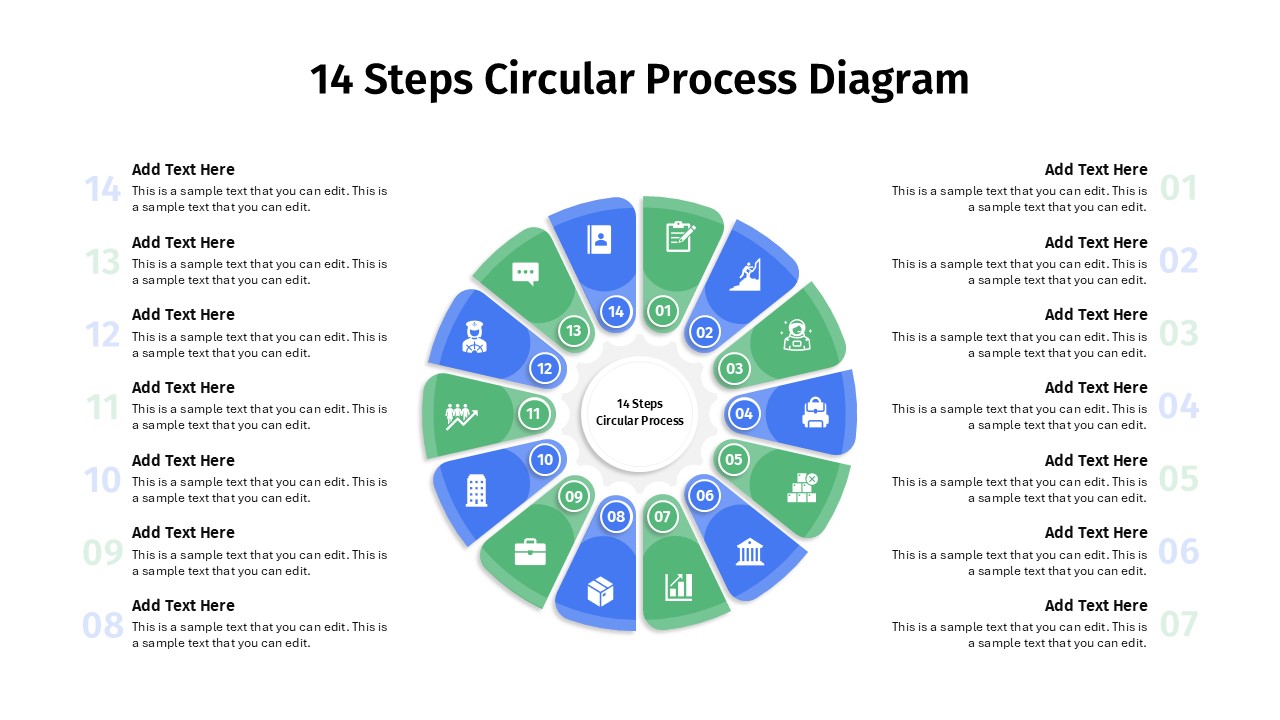
14 Steps Circular Process Diagram Template for PowerPoint & Google Slides
Circular
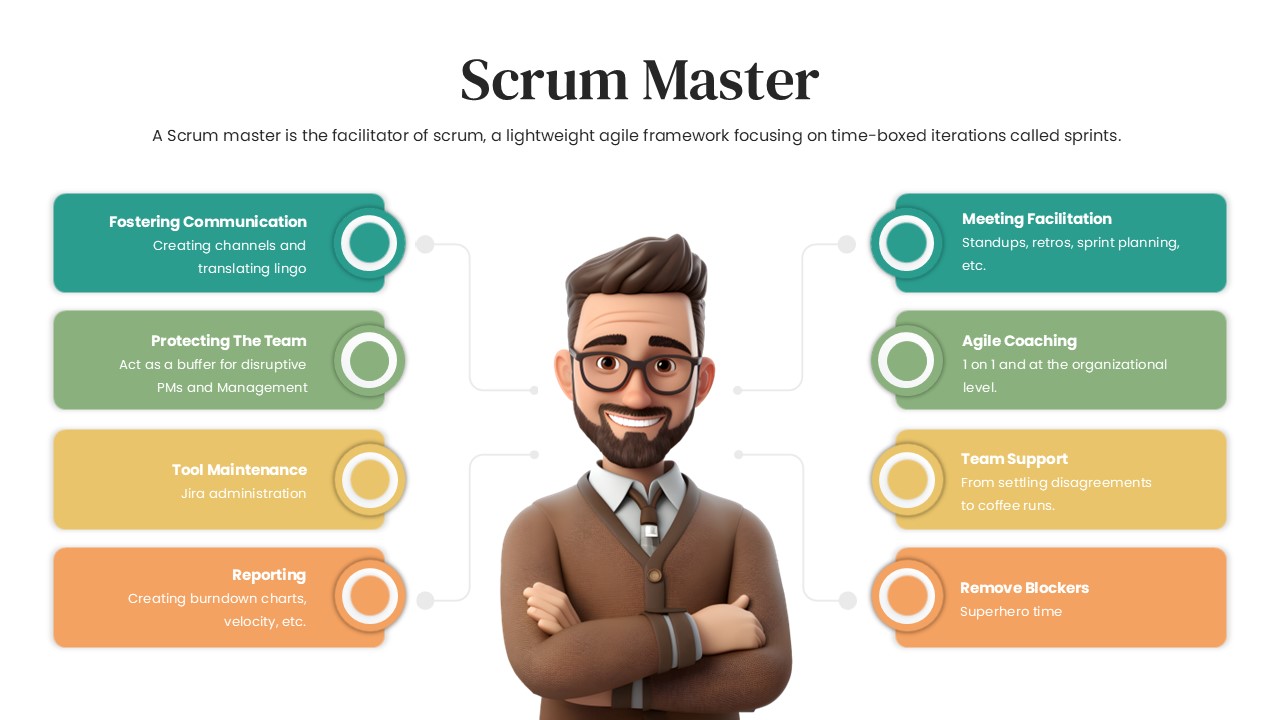
Scrum Master Diagram Template for PowerPoint & Google Slides
Scrum
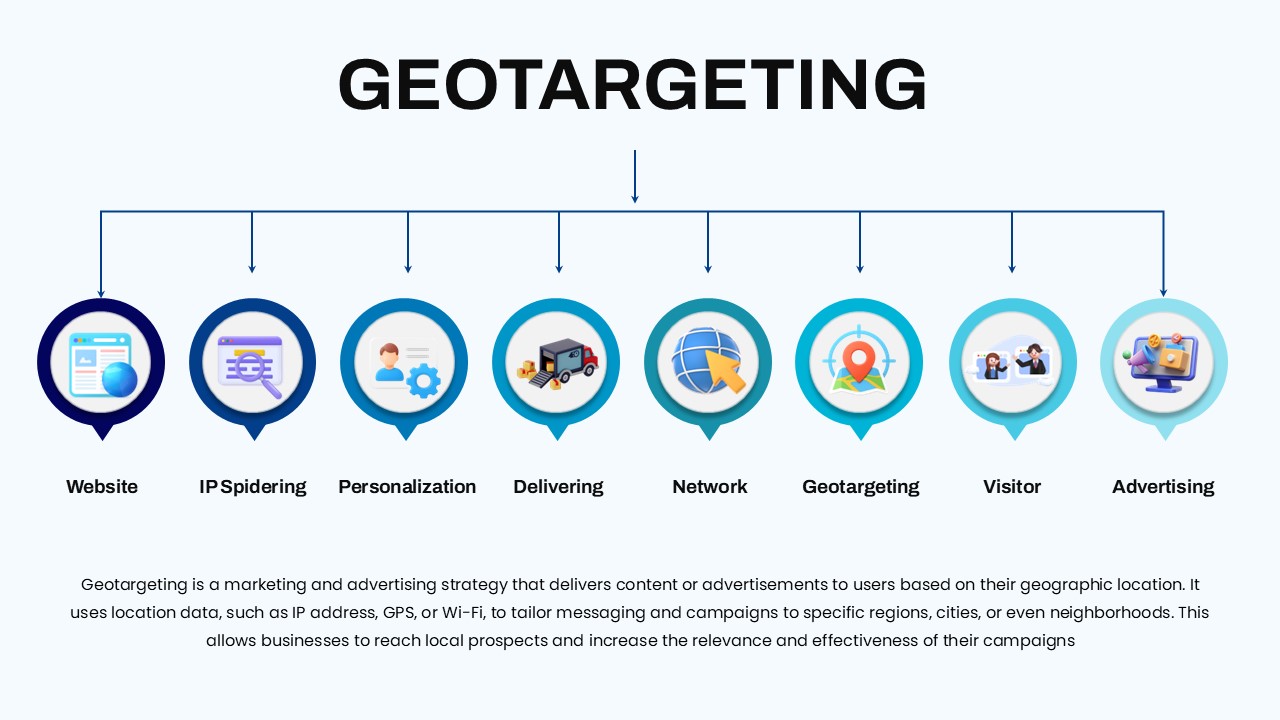
Geotargeting Diagram Template for PowerPoint & Google Slides
Digital Marketing
Flywheel Growth Cycle Diagram Template for PowerPoint & Google Slides
Circular
Q-Learning Process Flow Diagram Template for PowerPoint & Google Slides
Process
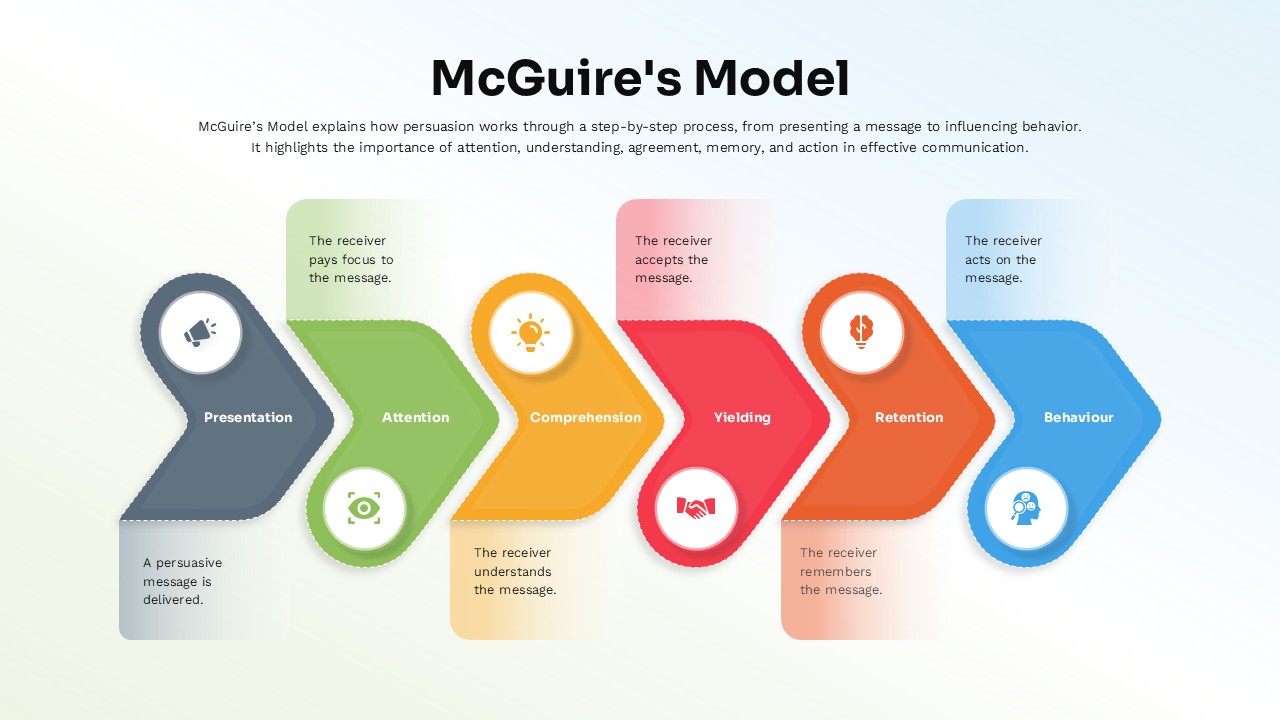
McGuire’s Persuasion Process Flow Diagram Template for PowerPoint & Google Slides
Marketing
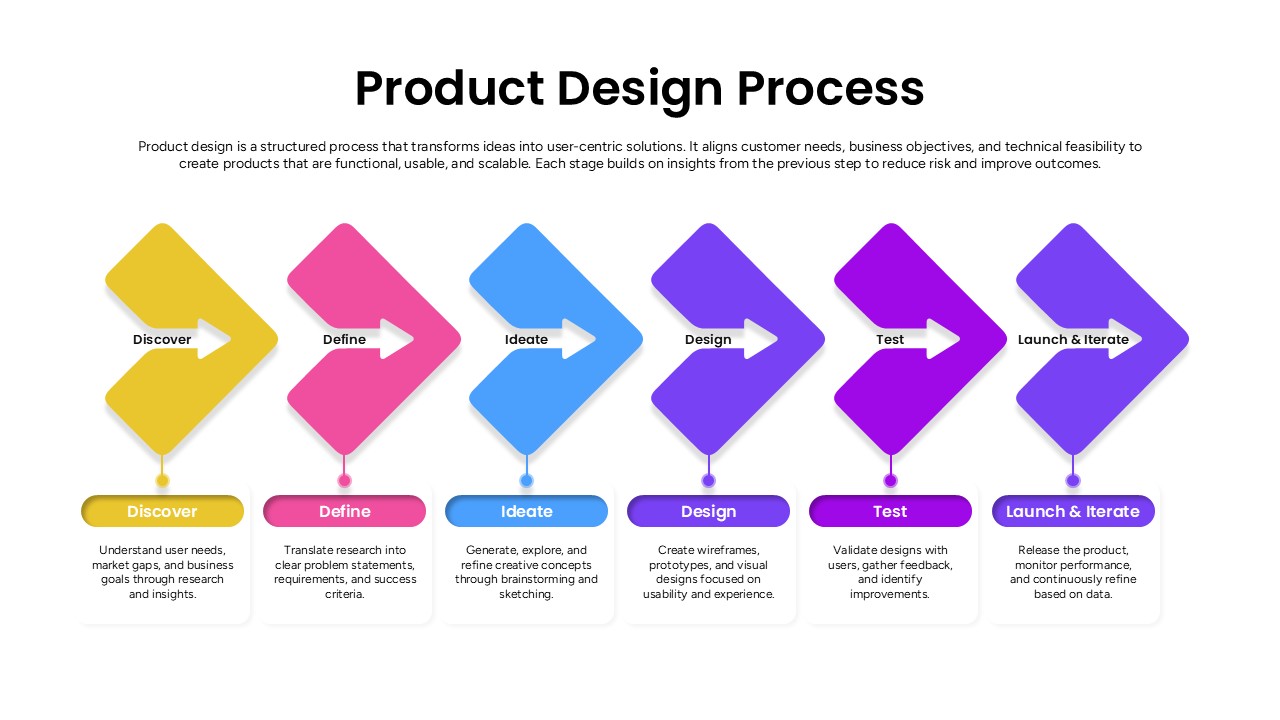
Product Design Process Flow Diagram Template for PowerPoint & Google Slides
Process