Wastewater Treatment Process Flow Chart Template for PowerPoint & Google Slides


Description
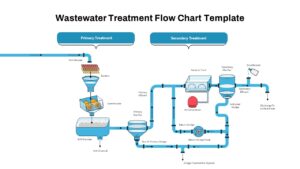
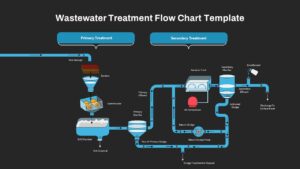
Visualize the full cycle of wastewater management with this detailed flow chart slide, depicting both primary and secondary treatment stages. Beginning with raw sewage entering the system, the process flows through screens and a comminutor for debris removal, then into a grit chamber where solids settle out for disposal. Clear the liquid fraction advances into the primary clarifier, producing primary effluent and primary sludge—the latter routed to separate sludge treatment and disposal. The effluent then moves through an aeration tank powered by an air compressor to promote microbial digestion, followed by a secondary clarifier that separates activated sludge for return via a dedicated pump. Finally, the clarified water receives a disinfectant dose before discharge to surface water, completing the treatment cycle.
Built on master slides for both PowerPoint and Google Slides, this template offers fully editable vector shapes, text labels, and connector arrows. Change component colors, swap icons for custom processes, or adjust line widths to match your branding. Grouped elements and alignment guides ensure consistent spacing when you rearrange steps or extend the flow for tertiary treatment. High-resolution graphics render crisply on widescreens, projectors, or printed whitepapers. Reuse this single-slide asset across technical reports, stakeholder presentations, or training modules to standardize process communications and streamline slide creation.
Who is it for
Utility managers, environmental engineers, and facility operators will benefit from this chart when presenting treatment plant designs, operational reports, or compliance briefings. Training coordinators can also leverage it for new-staff onboarding and safety workshops.
Other Uses
Beyond wastewater facilities, repurpose this flow diagram for chemical process workflows, manufacturing lines, or any multi-stage operational system requiring clear step-by-step visualization.
Login to download this file

Item ID
SB03854
Related Templates

Dermatology Diagnosis and Treatment Slide for PowerPoint & Google Slides
Health
Comprehensive Hiring Process Flow Chart Template for PowerPoint & Google Slides
Flow Charts
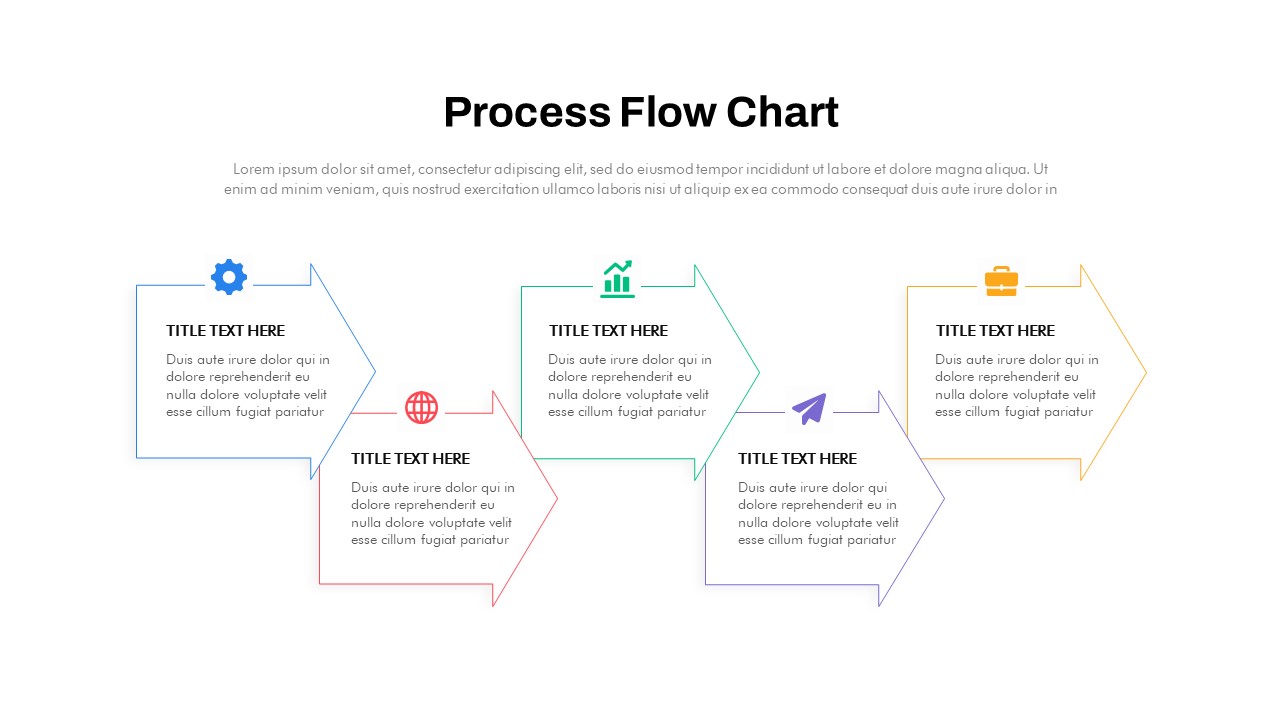
Animated Process Flow Chart Template for PowerPoint & Google Slides
Infographics
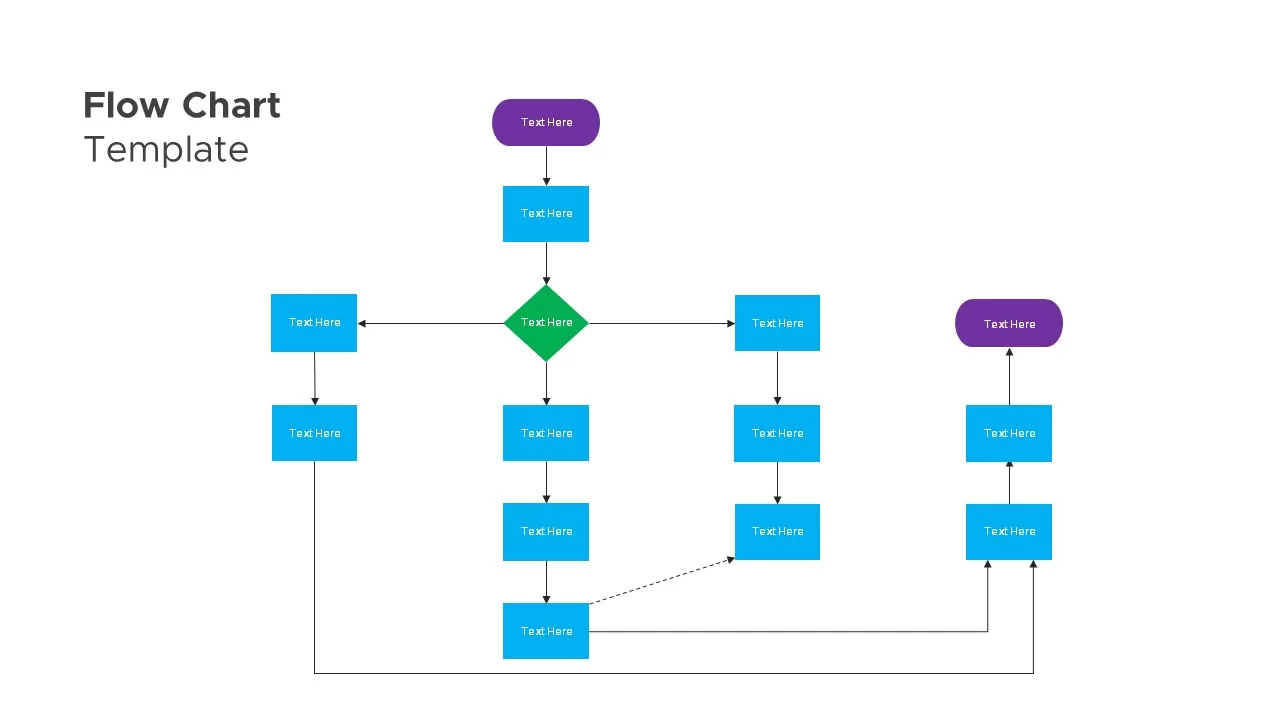
Flow Chart template for PowerPoint & Google Slides
Flow Charts
Vertical Split Flow Chart Diagram Template for PowerPoint & Google Slides
Flow Charts
Flow Chart Diagram Template for PowerPoint & Google Slides
Flow Charts
Flow Chart Diagram template for PowerPoint & Google Slides
Flow Charts
Flow Chart Template for PowerPoint & Google Slides
Flow Charts
Flow Chart Template for PowerPoint & Google Slides
Flow Charts
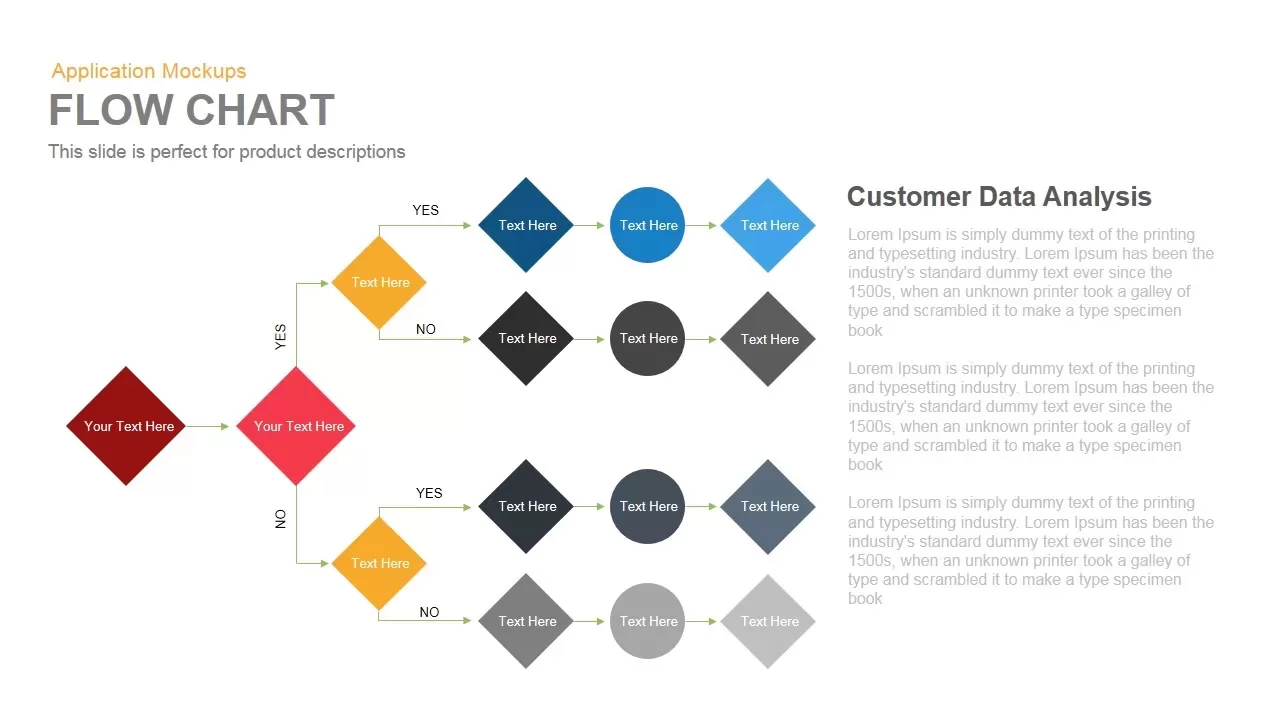
Flow Chart Decision Tree Template for PowerPoint & Google Slides
Flow Charts
Flow Chart Template for PowerPoint & Google Slides
Flow Charts
Flow Chart template for PowerPoint & Google Slides
Flow Charts
Flow Chart template for PowerPoint & Google Slides
Flow Charts
Free Circular Multi-Step Flow Chart Diagram Template for PowerPoint & Google Slides
Flow Charts
Free
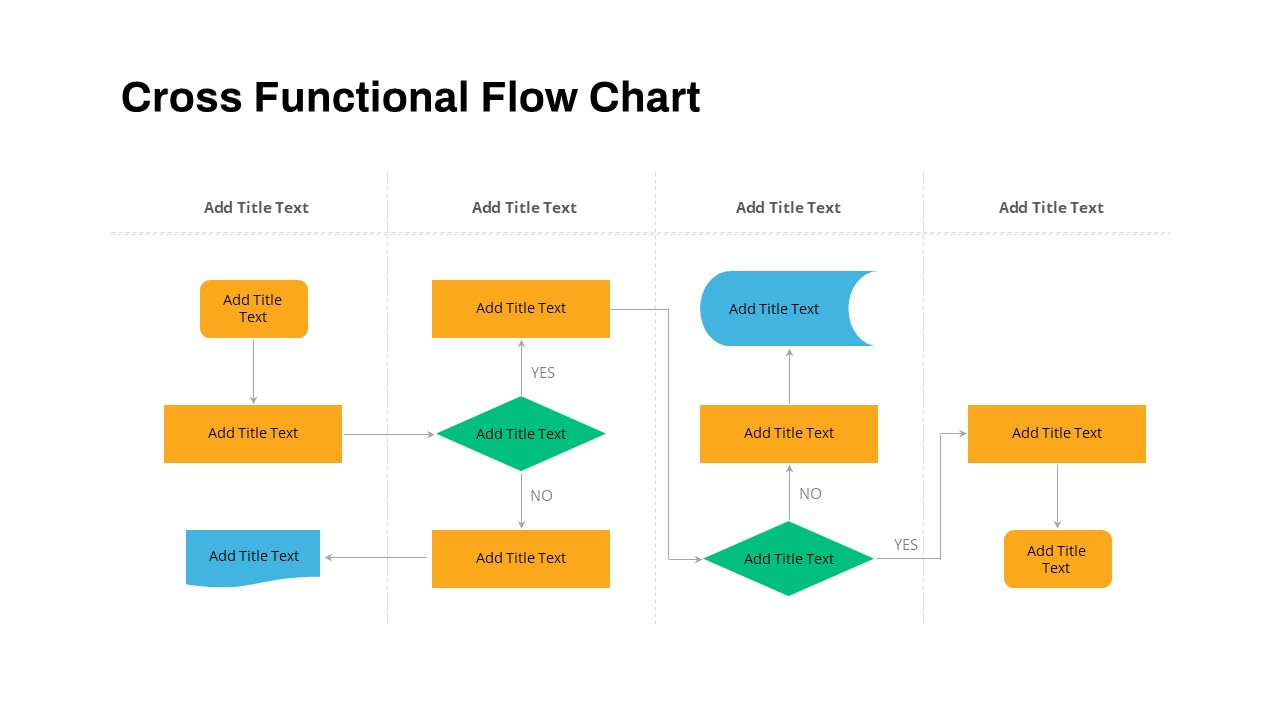
Cross Functional Swimlane Flow Chart Template for PowerPoint & Google Slides
Flow Charts
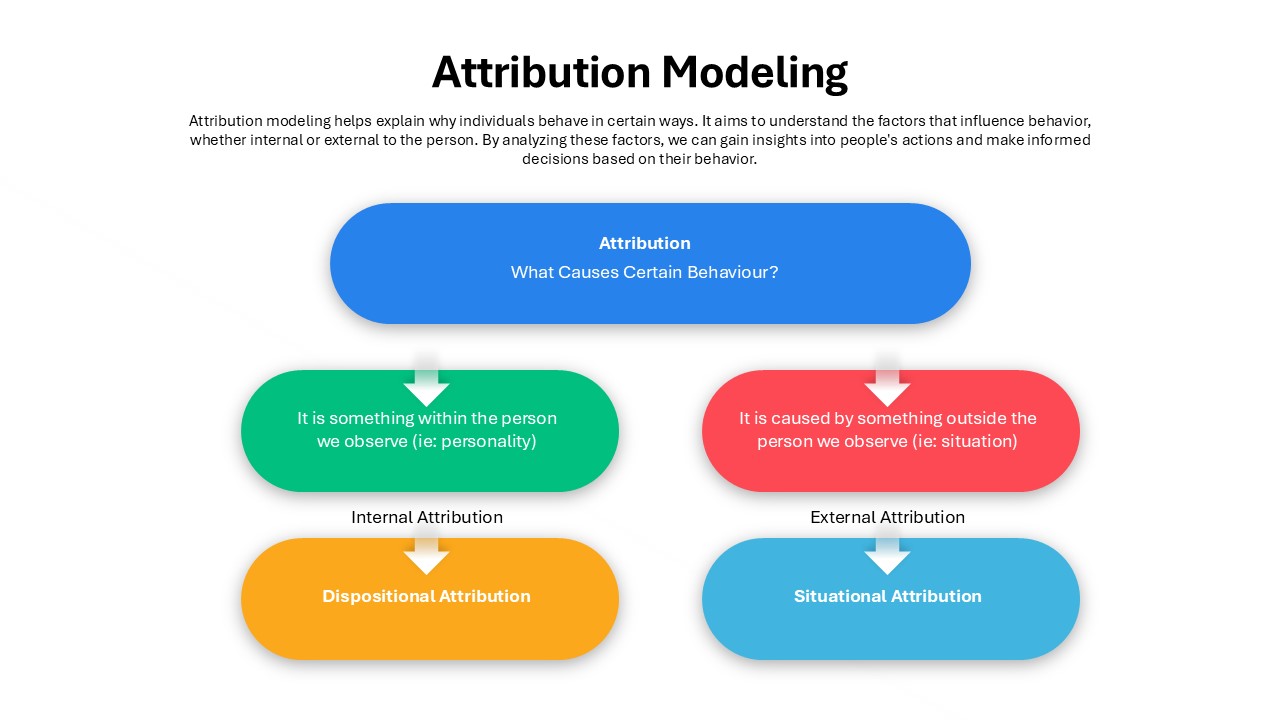
Attribution Modeling Flow Chart Template for PowerPoint & Google Slides
Flow Charts
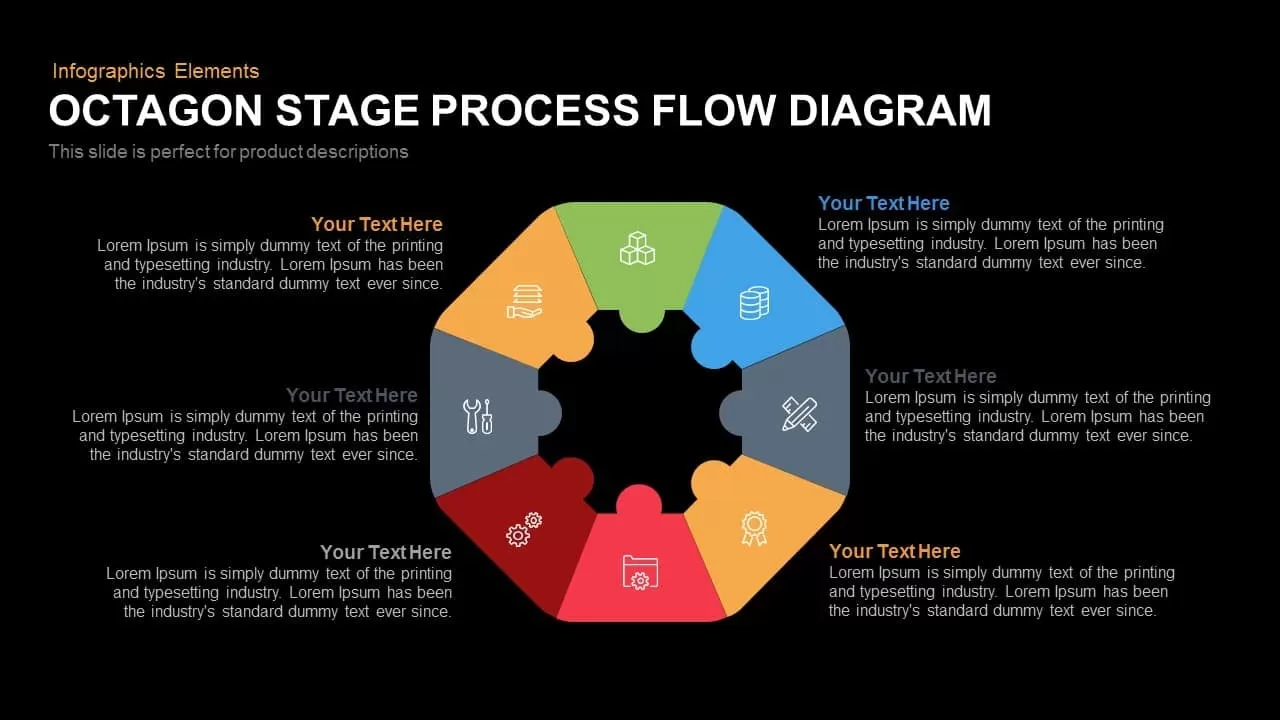
Octagon Process Flow template for PowerPoint & Google Slides
Process
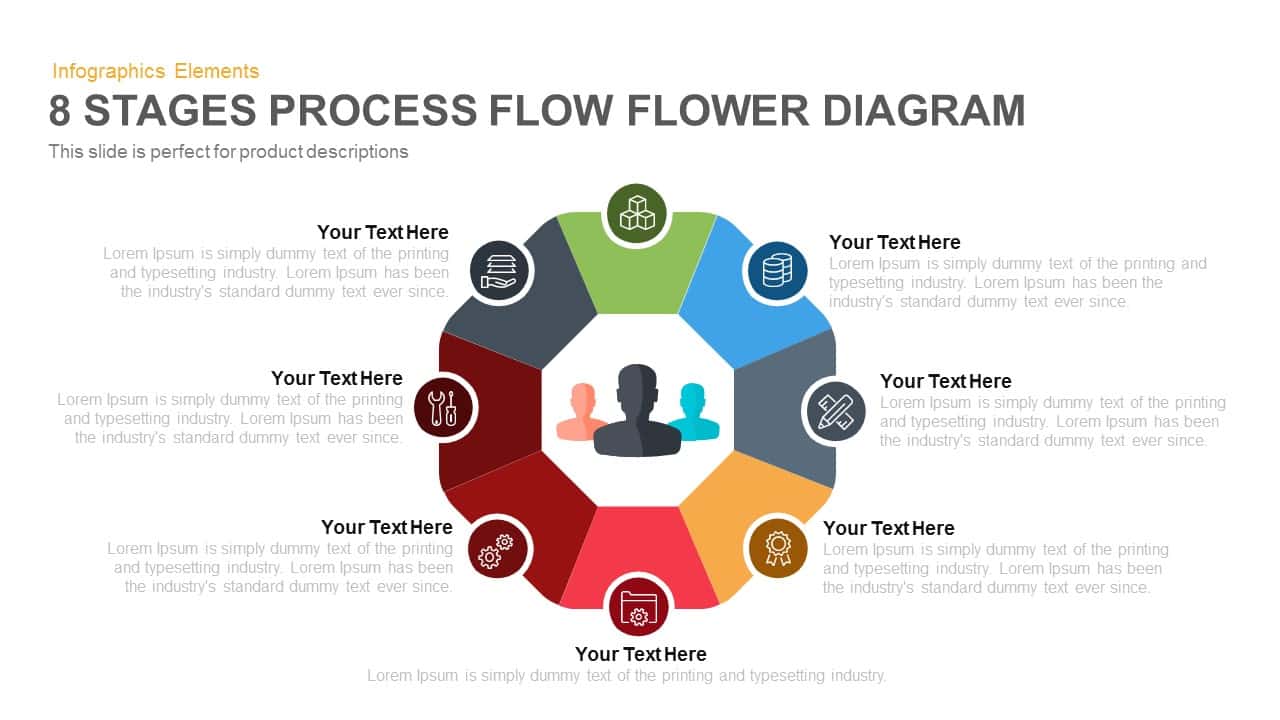
8-Stage Process Flow Flower Diagram Template for PowerPoint & Google Slides
Infographics
4 Section Pipe Diagram Process Flow Template for PowerPoint & Google Slides
Process
Dynamic Shield Process Flow Diagram template for PowerPoint & Google Slides
Process
5-Stage Arrow Infographics Process Flow Template for PowerPoint & Google Slides
Arrow

15-Step Process Flow Diagram Template for PowerPoint & Google Slides
Process
3D Shape Linear Process Flow Diagram Template for PowerPoint & Google Slides
Process
Linear Process Flow Circles Diagram Template for PowerPoint & Google Slides
Process
Six-Stage Zig-Zag Process Flow Diagram Template for PowerPoint & Google Slides
Process
Vertical Business Process Flow Diagram Template for PowerPoint & Google Slides
Process
Five-Stage Direct Flow Arrow Process Template for PowerPoint & Google Slides
Arrow
Six-Sided Shutter Diagram Process Flow Template for PowerPoint & Google Slides
Process

Four-Plus Process Flow Diagram Template for PowerPoint & Google Slides
Process
Four-Stage Circular Process Flow Template for PowerPoint & Google Slides
Process
Five Stage Linear Process Flow Diagram Template for PowerPoint & Google Slides
Process
Isometric Five-Stage Process Flow Template for PowerPoint & Google Slides
Process
Five-Stage Linear Process Flow Diagram Template for PowerPoint & Google Slides
Process
Five-Step Hexagonal Process Flow Template for PowerPoint & Google Slides
Process
Gradient Chevron Five-Stage Process Flow Template for PowerPoint & Google Slides
Arrow
Five-Stage Circular Process Flow Diagram Template for PowerPoint & Google Slides
Circular
5-Stage Gear Process Flow Diagram Template for PowerPoint & Google Slides
Process
Four-Stage Linear Process Flow Diagram Template for PowerPoint & Google Slides
Process
5-Stage Linear Process Flow Diagram Template for PowerPoint & Google Slides
Process
5 Stage Linear Process Flow Diagram Template for PowerPoint & Google Slides
Process
Five-Stage Process Flow Diagram Template for PowerPoint & Google Slides
Process
4 Stage Linear Process Flow Diagram Template for PowerPoint & Google Slides
Process
7 Stage Linear Process Flow Diagram Template for PowerPoint & Google Slides
Process
8 Step Circular Process Flow Diagram Template for PowerPoint & Google Slides
Process
6-Step Business Process Flow Diagram Template for PowerPoint & Google Slides
Process
6-Step Circular Process Flow Diagram Template for PowerPoint & Google Slides
Process
4-Stage Linear Process Flow Diagram Template for PowerPoint & Google Slides
Process
4-Step Linear Process Flow Diagram Template for PowerPoint & Google Slides
Process
Colorful 8-Stage Droplet Process Flow Diagram Template for PowerPoint & Google Slides
Process

Modern 5-Step Process Flow Infographic Template for PowerPoint & Google Slides
Process
Five-Step Process Flow Infographic Template for PowerPoint & Google Slides
Process
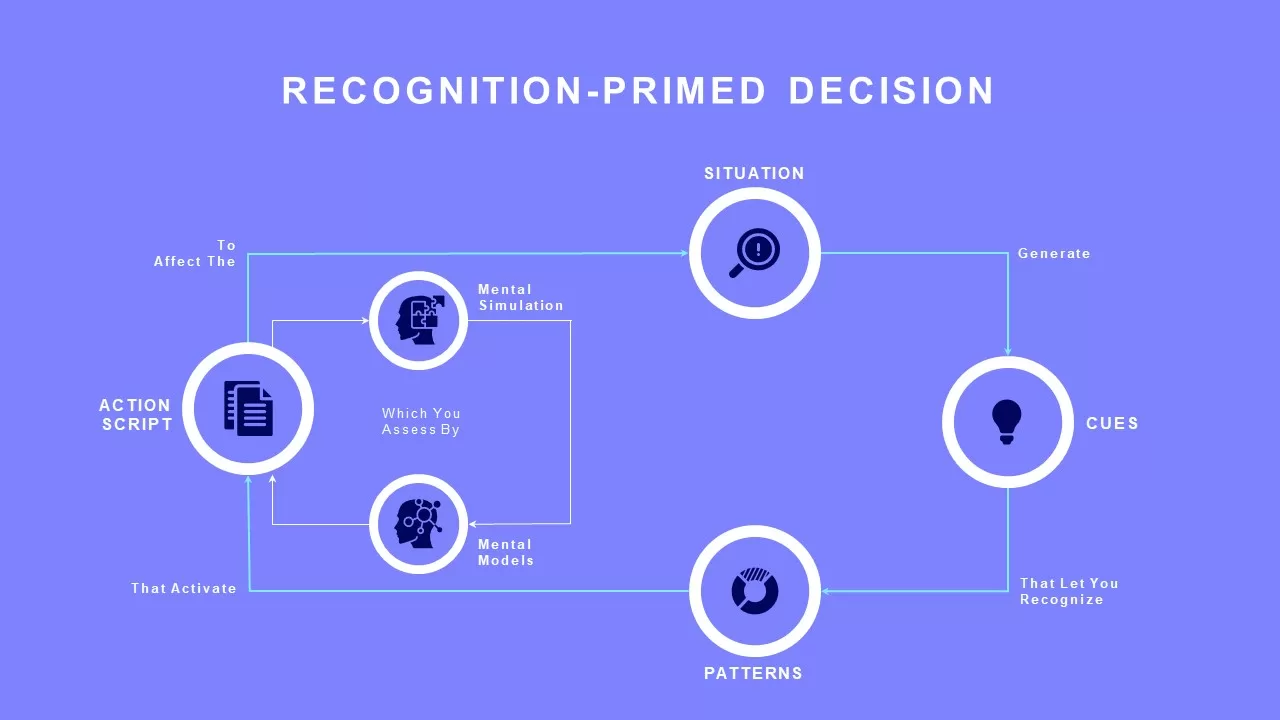
Recognition-Primed Decision Process Flow Template for PowerPoint & Google Slides
Flow Charts
Minimal Process Flow Diagram Infographic Template for PowerPoint & Google Slides
Process

Free Colorful Process Flow Infographics Template for PowerPoint & Google Slides
Process
Free
Process Flow Overview template for PowerPoint & Google Slides
Business
Process Flow Steps template for PowerPoint & Google Slides
Business Plan
Process Flow Diagram template for PowerPoint & Google Slides
Process
Process Flow Template for PowerPoint & Google Slides
Process
Colorful Process Flow Template for PowerPoint & Google Slides
Process
Colorful Process Flow Infographics Template for PowerPoint & Google Slides
Process
Process Flow Template for PowerPoint & Google Slides
Process
Free
Process Flow Template for PowerPoint & Google Slides
Process
Free
4 stage Process Flow template for PowerPoint & Google Slides
Process
5 Stage Process Flow Overview template for PowerPoint & Google Slides
Process
Curved Arrow Process Flow Infographic Template for PowerPoint & Google Slides
Process
Curved Arrow Process Flow Diagram Template for PowerPoint & Google Slides
Process
Curved Arrow Process Flow Diagram Template for PowerPoint & Google Slides
Arrow
Curved Arrow Process Flow template for PowerPoint & Google Slides
Process
Circular Arrows Process Flow template for PowerPoint & Google Slides
Process
Curved Arrow Process Flow template for PowerPoint & Google Slides
Process
Circular Arrows Process Flow template for PowerPoint & Google Slides
Process
Circular Arrows Process Flow template for PowerPoint & Google Slides
Process
Circle Arrow Process Flow template for PowerPoint & Google Slides
Process
Animated Accordion Process Flow Template for PowerPoint & Google Slides
Process
Hexagonal Process Flow Template for PowerPoint & Google Slides
Process
Conveyor Belt Infographic Process Flow Template for PowerPoint & Google Slides
Process
Conveyor Belt Sequential Process Flow Template for PowerPoint & Google Slides
Process
Dynamic Conveyor Belt Process Flow Template for PowerPoint & Google Slides
Process
3D Conveyor Belt Process Flow Diagram Template for PowerPoint & Google Slides
Process
E-Waste Management Process Flow Diagram Template for PowerPoint & Google Slides
Process
Current vs Future Process Flow Template for PowerPoint & Google Slides
Comparison
Five-Phase Project Intake Process Flow Template for PowerPoint & Google Slides
Process
Talent Acquisition Process Flow Template for PowerPoint & Google Slides
Recruitment

DevOps Infographics & Process Flow Template for PowerPoint & Google Slides
Information Technology
Neurology Neuron Structure Process Flow Template for PowerPoint & Google Slides
Health
Comprehensive Process Flow Diagram Template for PowerPoint & Google Slides
Process
Animated Gears Process Flow Diagram Template for PowerPoint & Google Slides
Process
Capital Investments Process Flow Diagram Template for PowerPoint & Google Slides
Process
Order to Cash Process Flow Diagram Template for PowerPoint & Google Slides
Process
Chevron Process Flow Sequence Slide Template for PowerPoint & Google Slides
Arrow
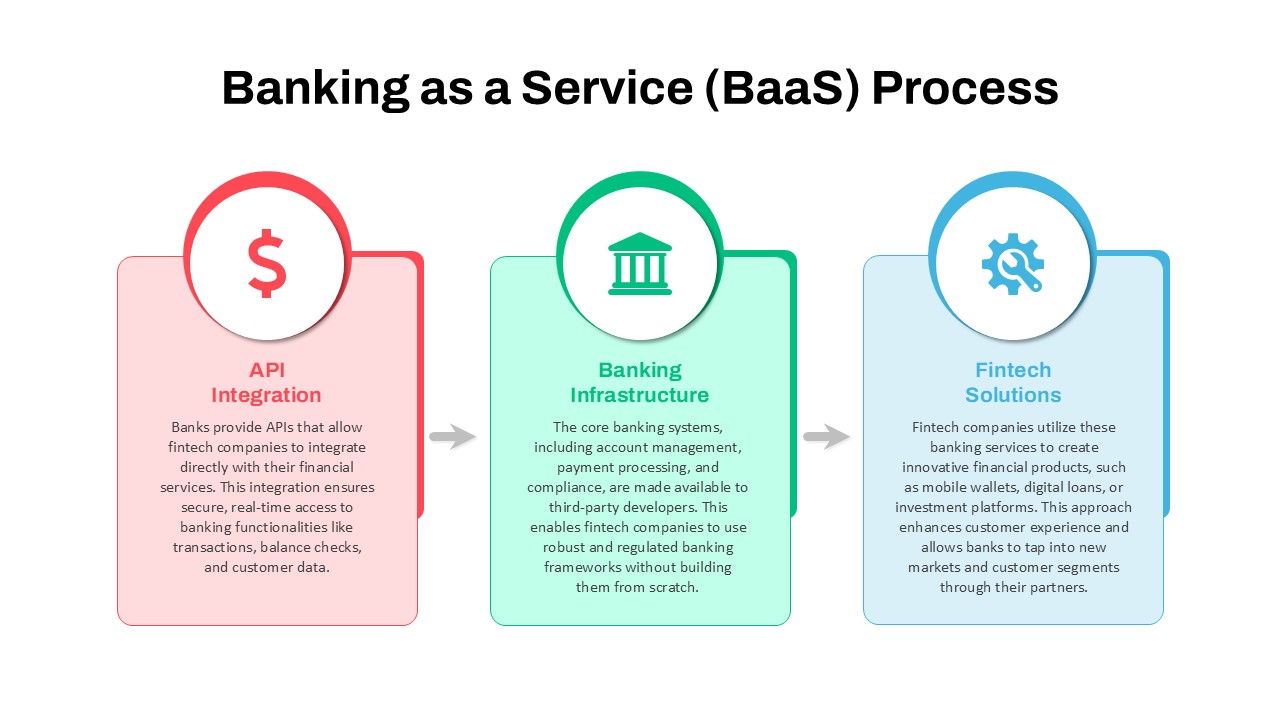
Banking as a Service (BaaS) Process Flow Template for PowerPoint & Google Slides
Process
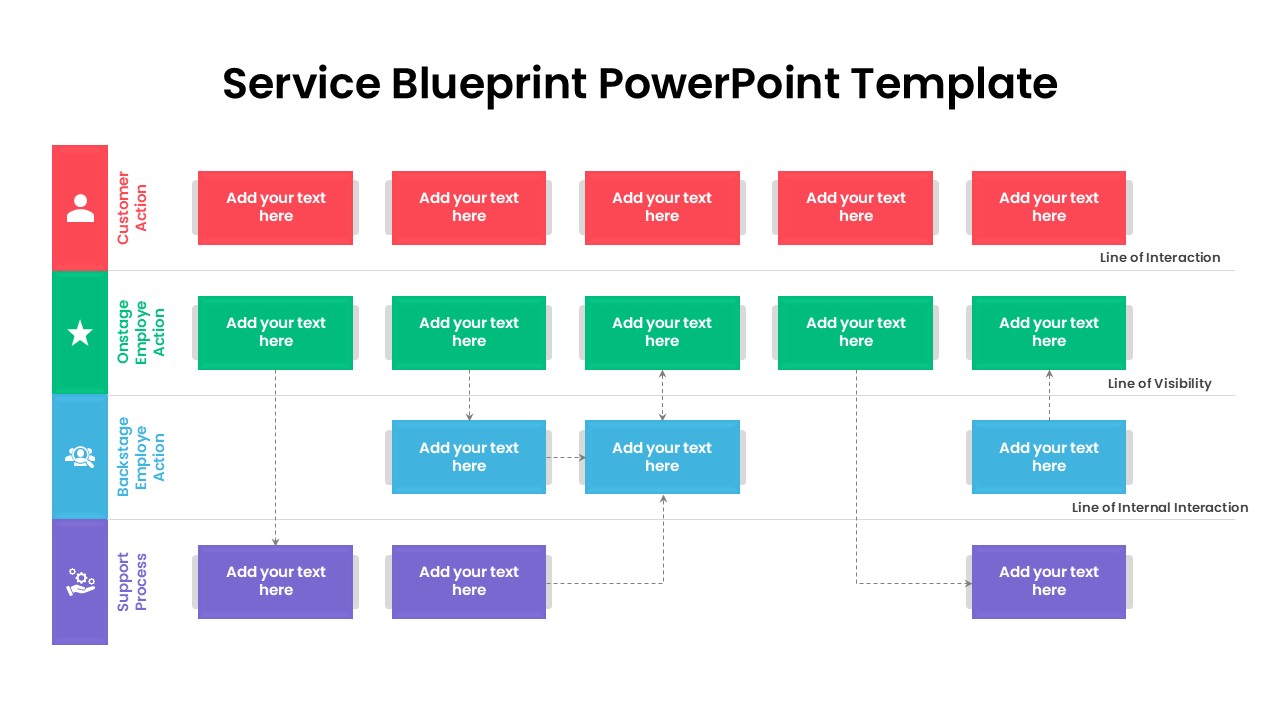
Service Blueprint Process Flow Template for PowerPoint & Google Slides
Process
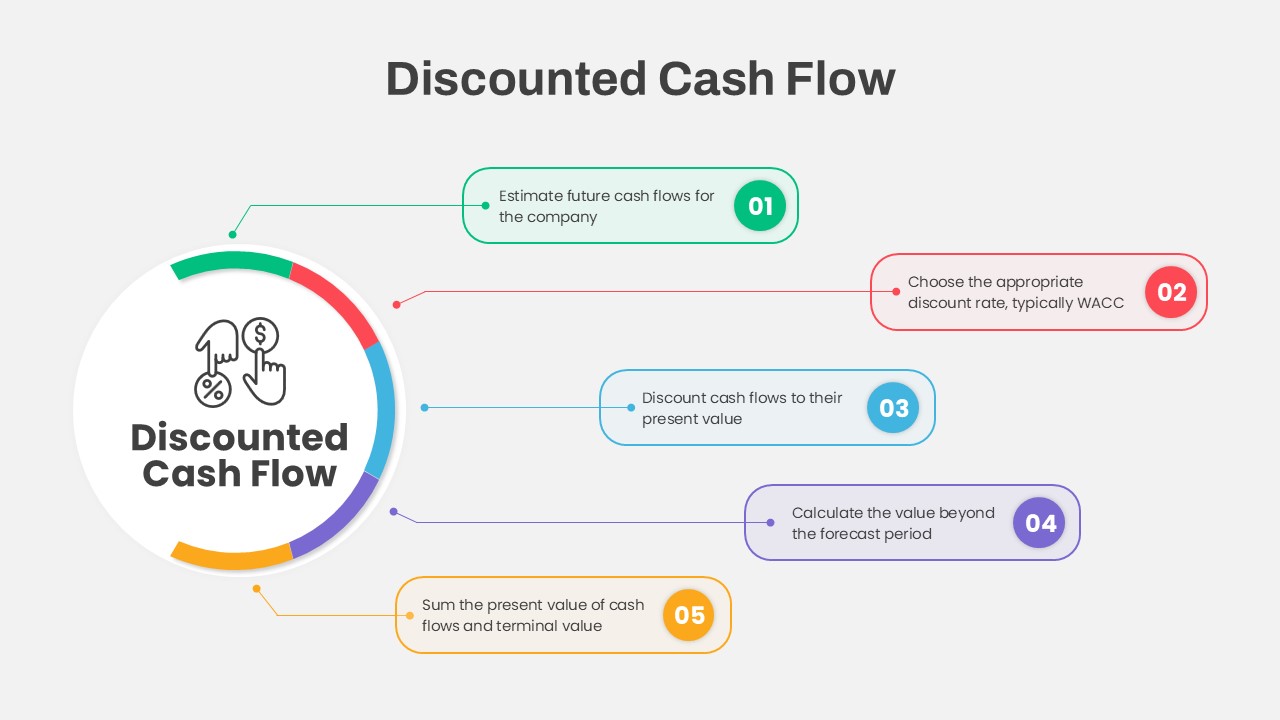
Discounted Cash Flow Five-Step Process Template for PowerPoint & Google Slides
Process
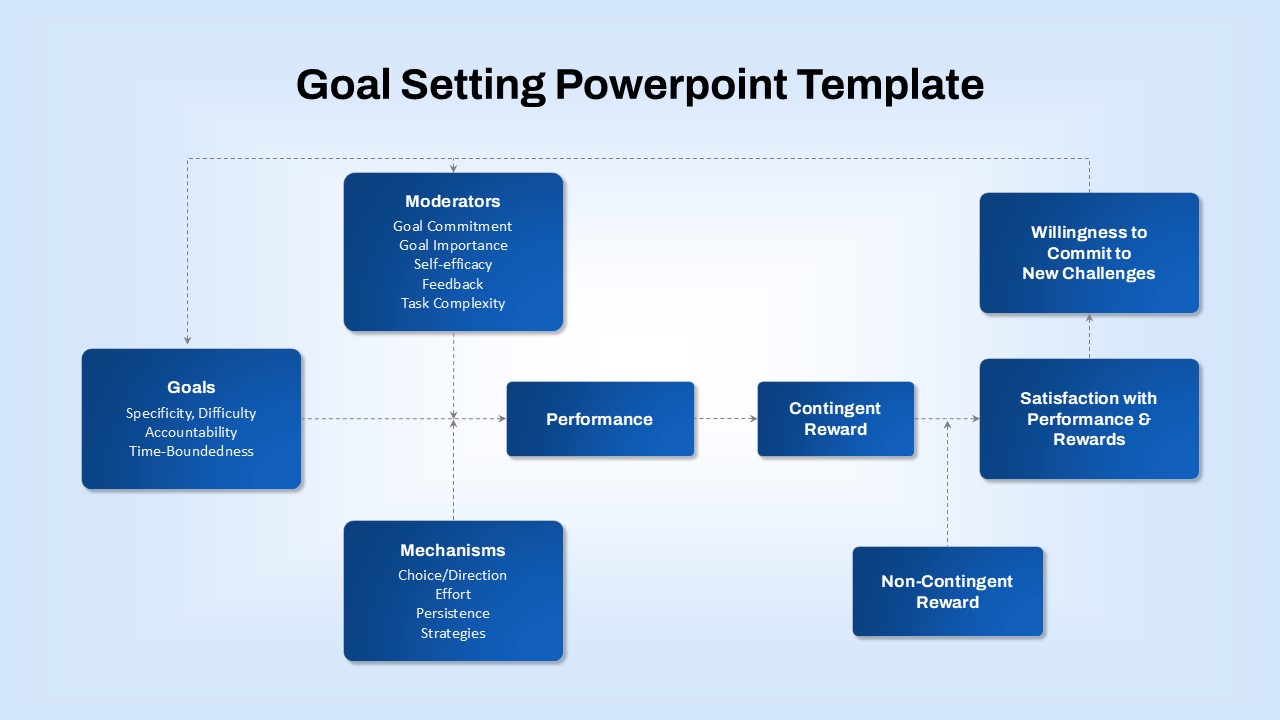
Goal-Setting Process Flow Diagram Template for PowerPoint & Google Slides
Goals
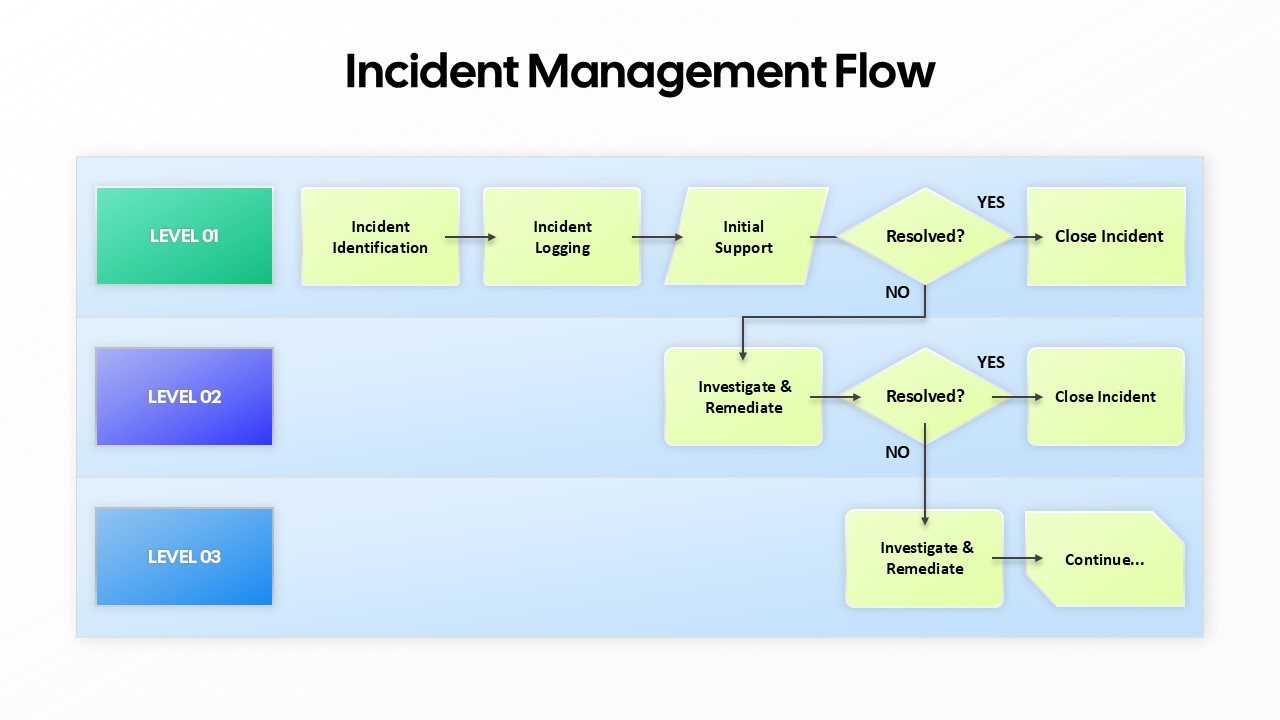
Incident Management Flow Process template for PowerPoint & Google Slides
Flow Charts
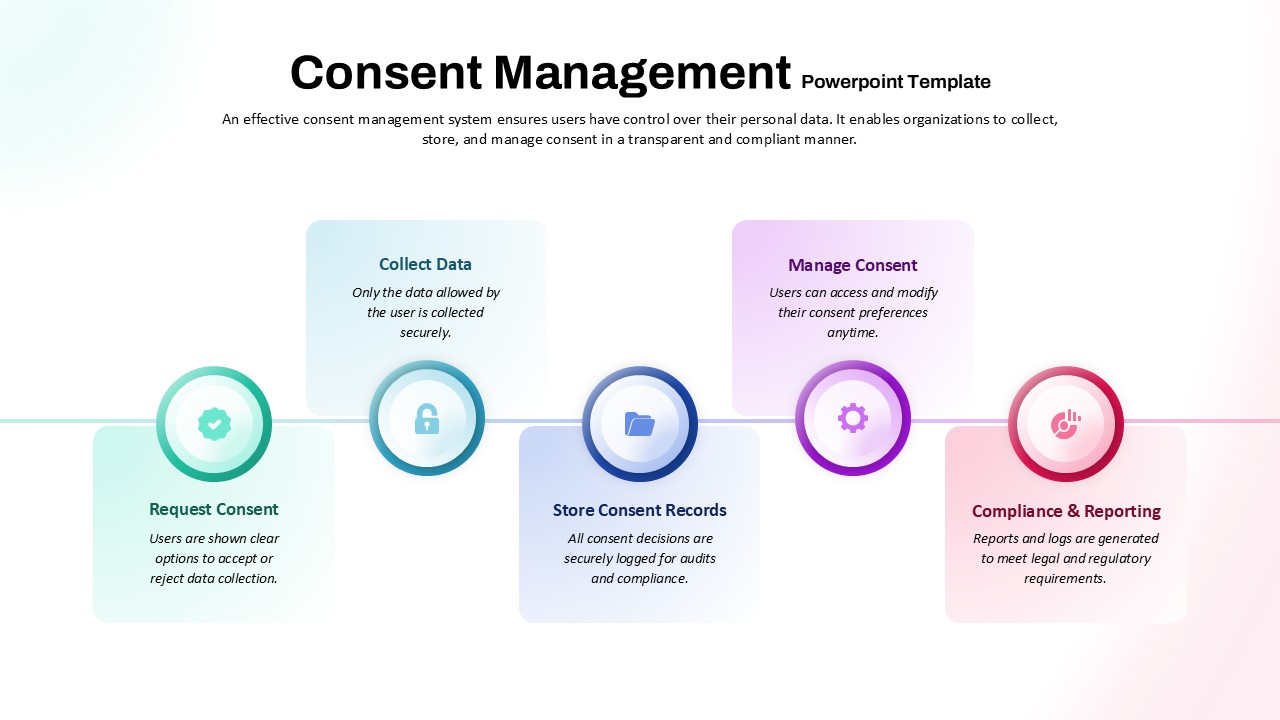
Consent Management System Process Flow Template for PowerPoint & Google Slides
Process
Resume Screening Process Flow Diagram Template for PowerPoint & Google Slides
Process
Q-Learning Process Flow Diagram Template for PowerPoint & Google Slides
Process
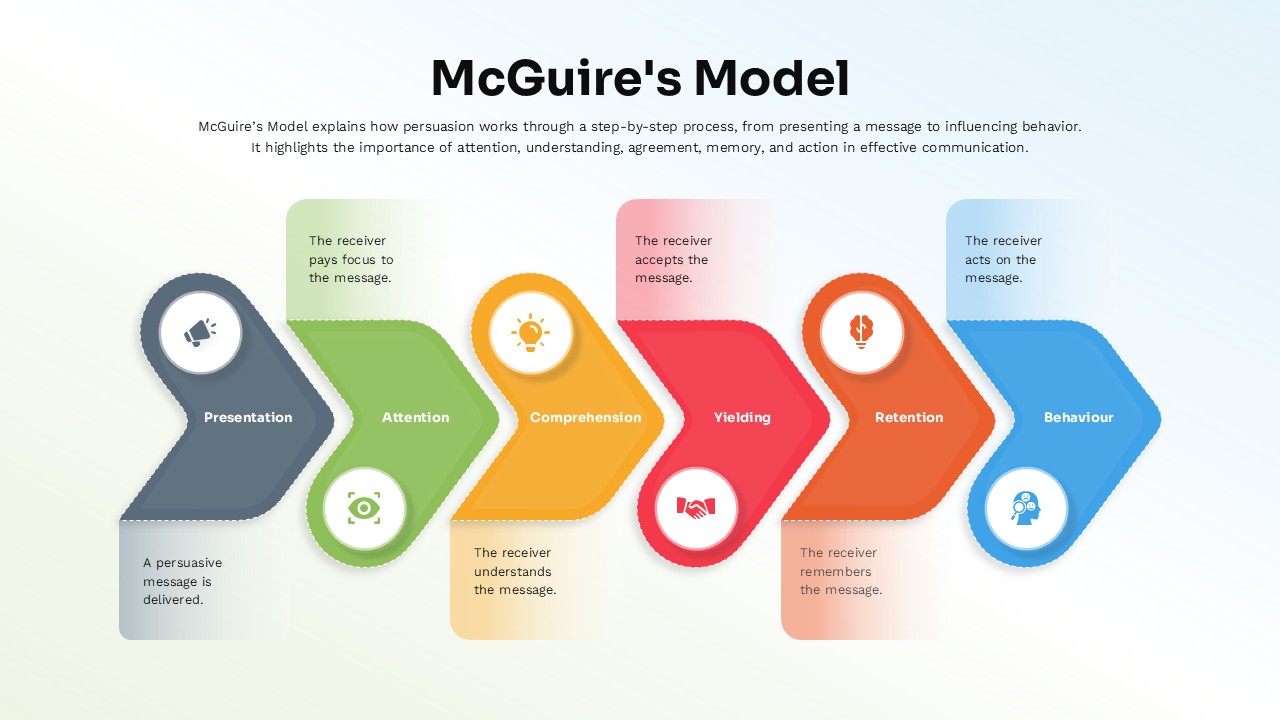
McGuire’s Persuasion Process Flow Diagram Template for PowerPoint & Google Slides
Marketing
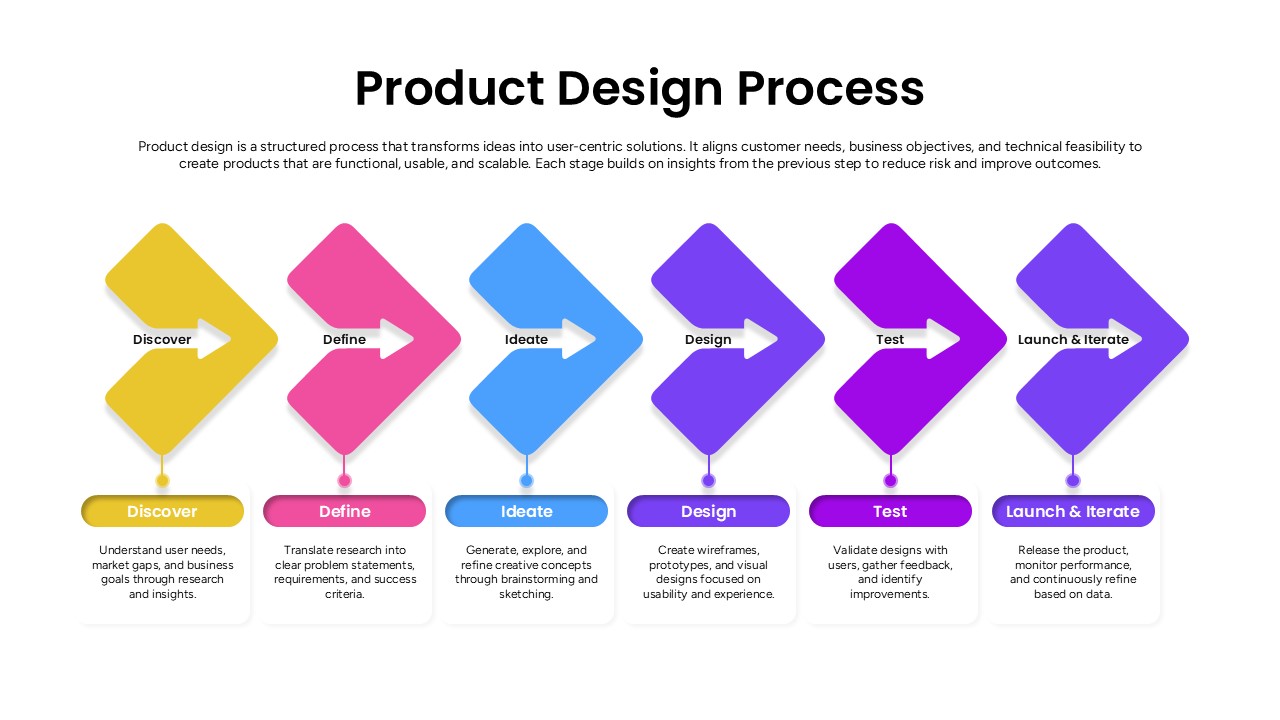
Product Design Process Flow Diagram Template for PowerPoint & Google Slides
Process