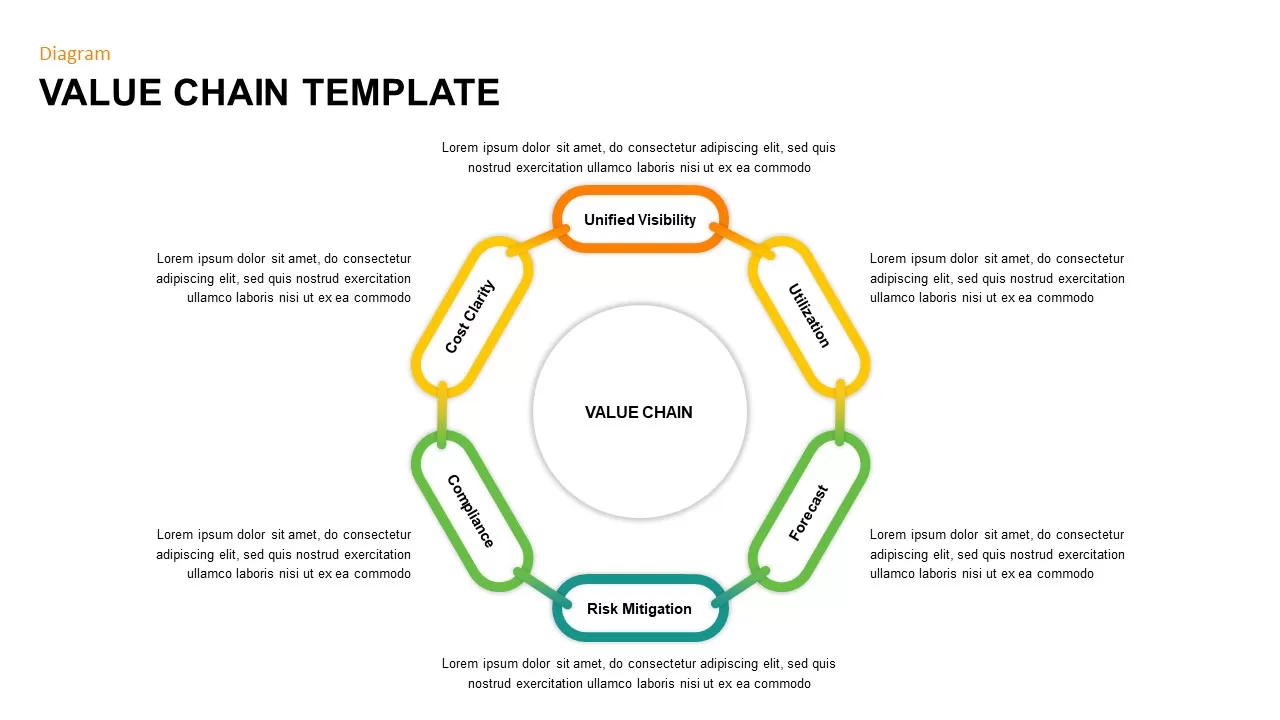
Value Chain Circular Process Diagram Template for PowerPoint & Google Slides


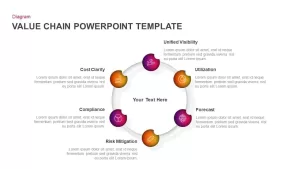
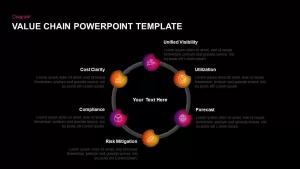
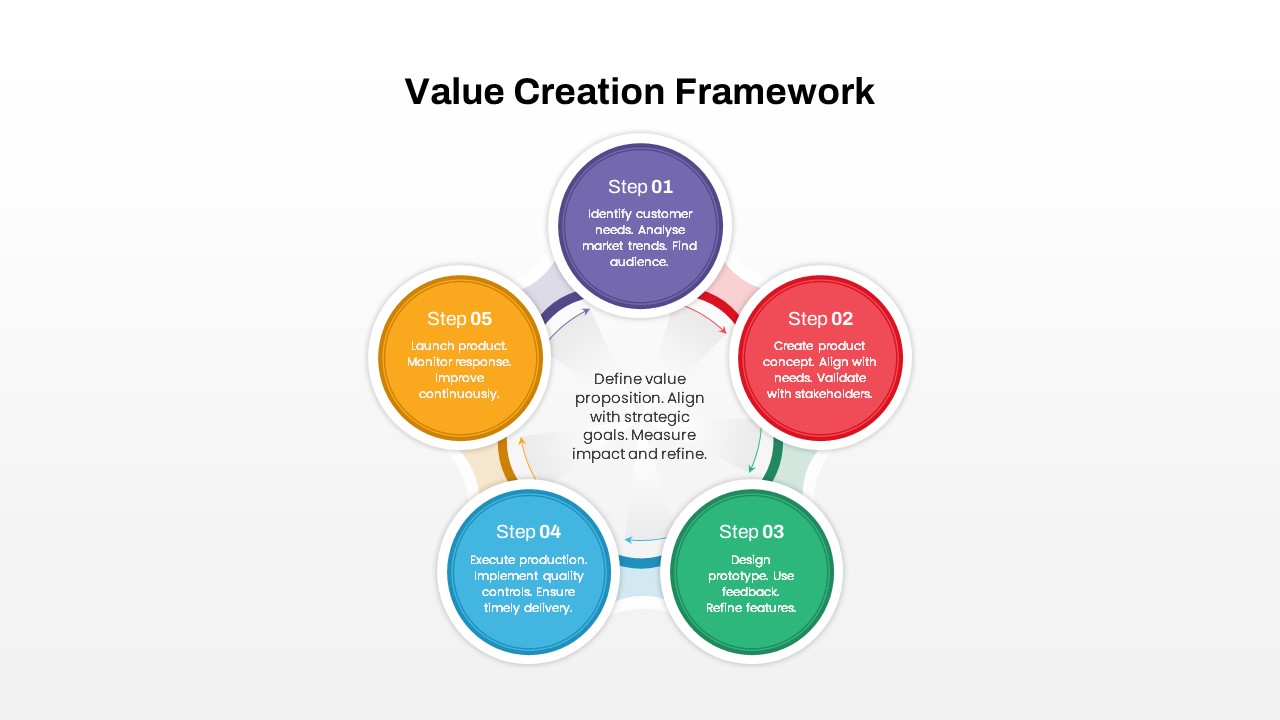
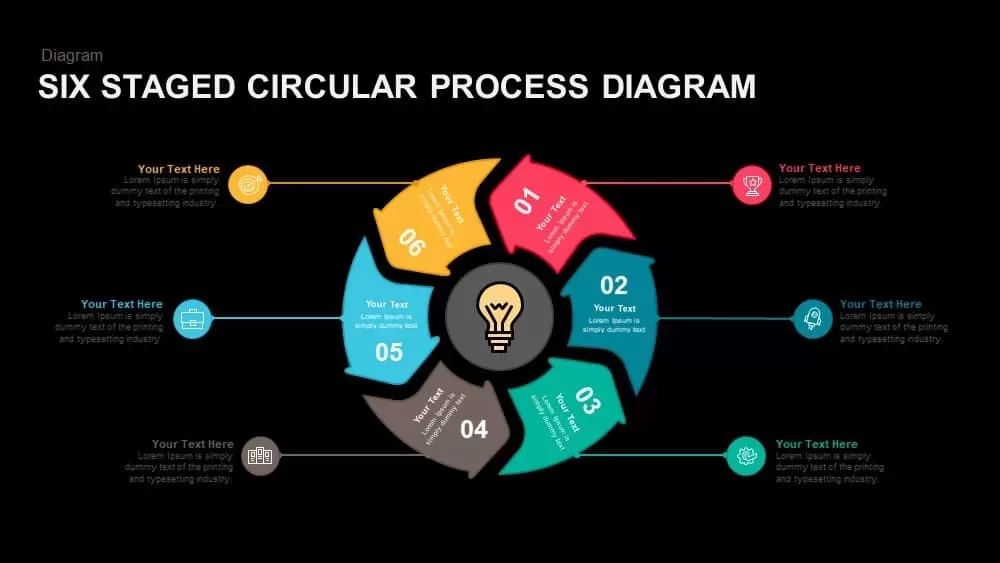
Elevate your strategic presentations with this dynamic value chain diagram slide, featuring six isometric nodes evenly arranged around a circular ring. Each node includes a gradient-filled circle with placeholder icons for Unified Visibility, Utilization, Forecast, Risk Mitigation, Compliance, and Cost Clarity, accompanied by bold labels and succinct text blocks. The soft gray ring connects all stages, emphasizing the continuous flow of value creation. A central placeholder invites your core message or title. The rich purple-to-amber gradient on the nodes contrasts elegantly with the clean white background, while subtle drop shadows lend depth and focus.
Built on master slides, this fully editable asset enables you to swap icons, adjust gradient hues, and modify text placeholders in seconds to match your brand identity. Vector-based graphics guarantee crisp output at any resolution, whether displayed on large screens, virtual meetings, or printed handouts. Logical layer grouping allows you to reposition or duplicate nodes, remove stages, or integrate additional labels without disrupting the layout. Seamlessly compatible with both PowerPoint and Google Slides, this slide resolves formatting inconsistencies and accelerates deck creation.
Use this circular ring framework to illustrate not only value chains but also supply chain processes, product life cycles, risk assessment workflows, or strategic capability models. Duplicate the slide for multi-phase roadmaps or incorporate a subset of nodes to focus on priority stages.
Who is it for
Supply chain managers, operations directors, business analysts, management consultants, and C-suite executives will leverage this slide to communicate complex process flows, showcase strategic models, and align stakeholders.
Other Uses
Repurpose this diagram for product development cycles, service delivery workflows, quality control checkpoints, or organizational capability mapping. Adjust node titles and icons to visualize sales funnels, project governance frameworks, or continuous improvement loops.
Login to download this file

Item ID
SB01439
Related Templates

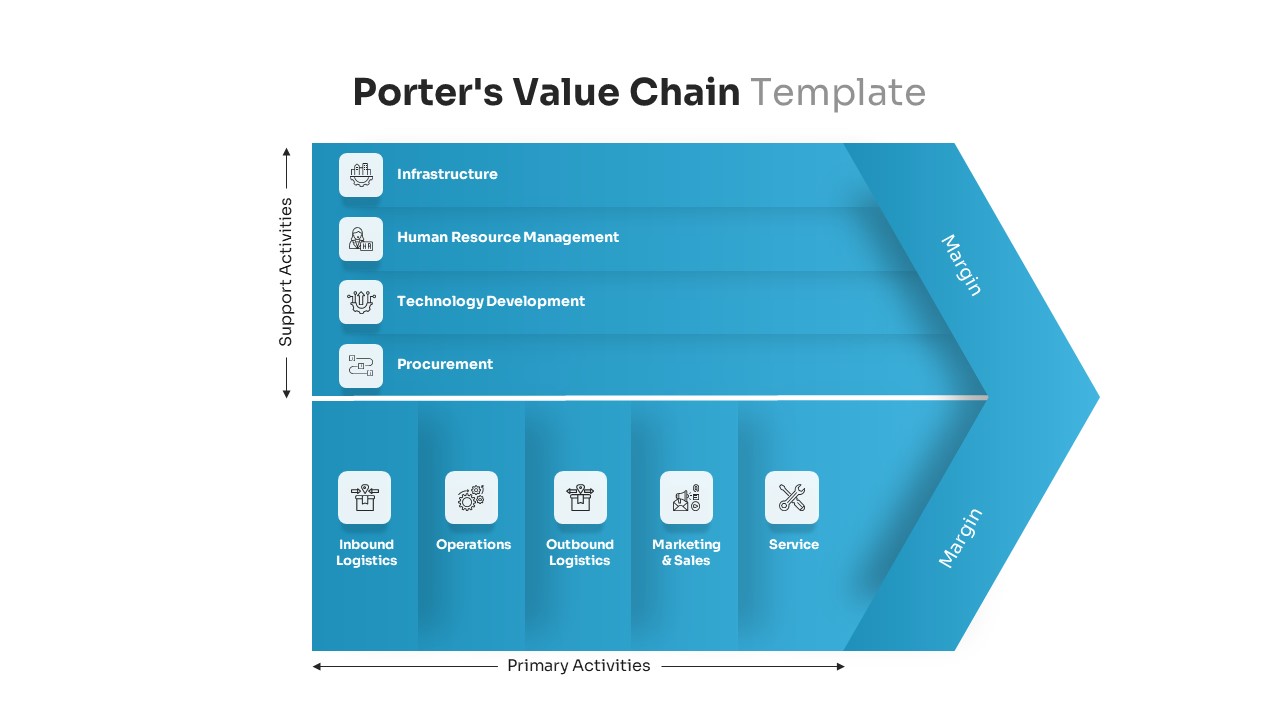
Porter’s Value Chain Analysis Diagram Template for PowerPoint & Google Slides
Business Strategy
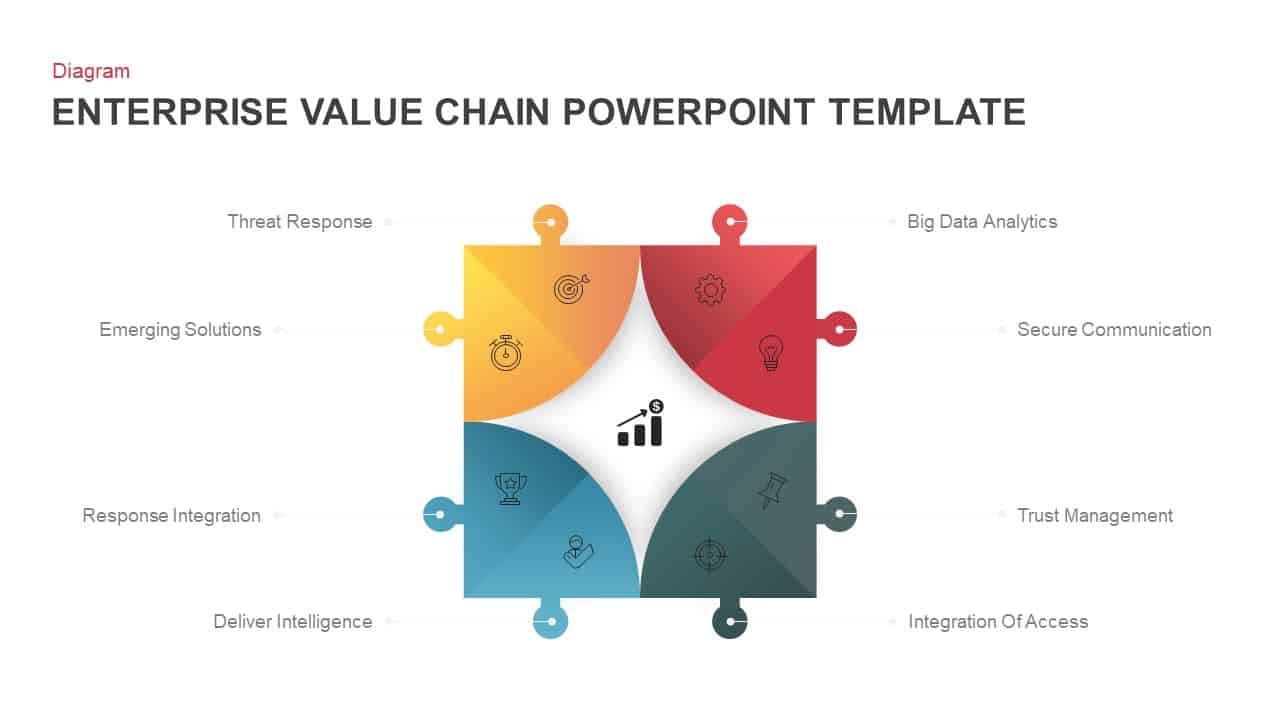
Enterprise Value Chain Puzzle Diagram Template for PowerPoint & Google Slides
Business Models
Value Chain Diagram template for PowerPoint & Google Slides
Business Strategy
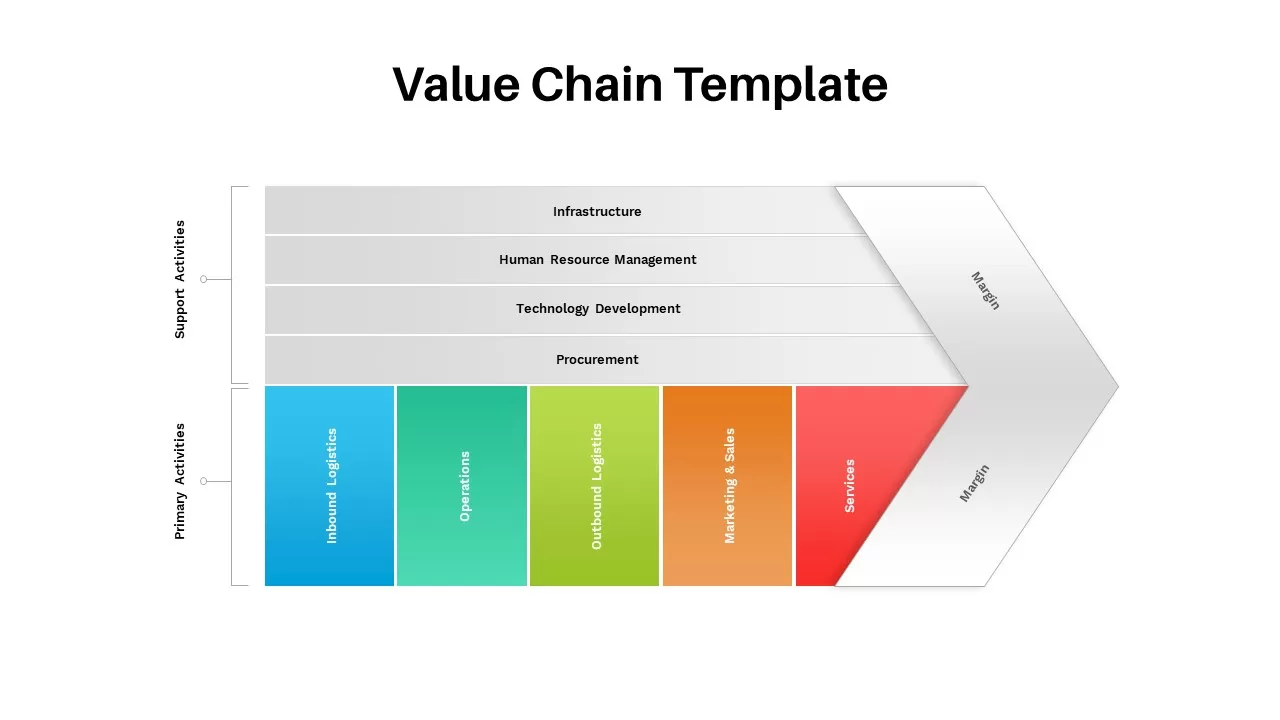
Value Chain Template for PowerPoint & Google Slides
Business Strategy
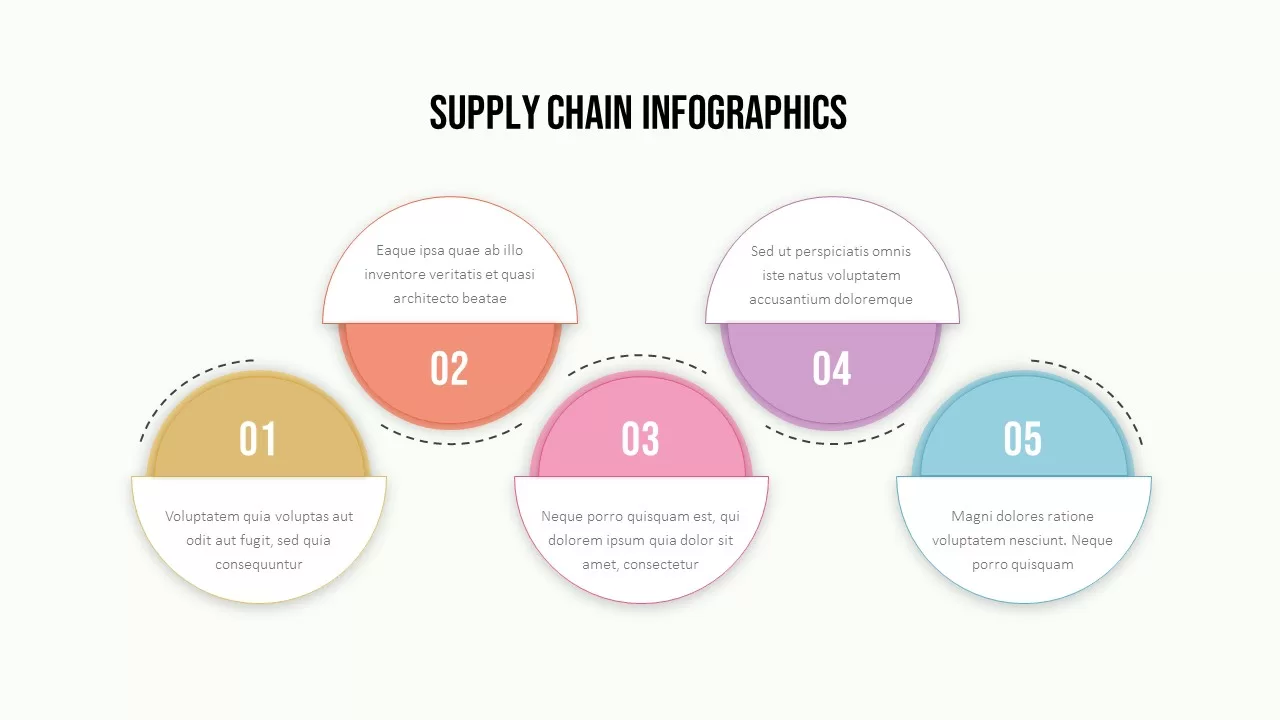
Supply Chain Circular Process Infographics Template for PowerPoint & Google Slides
Business Strategy
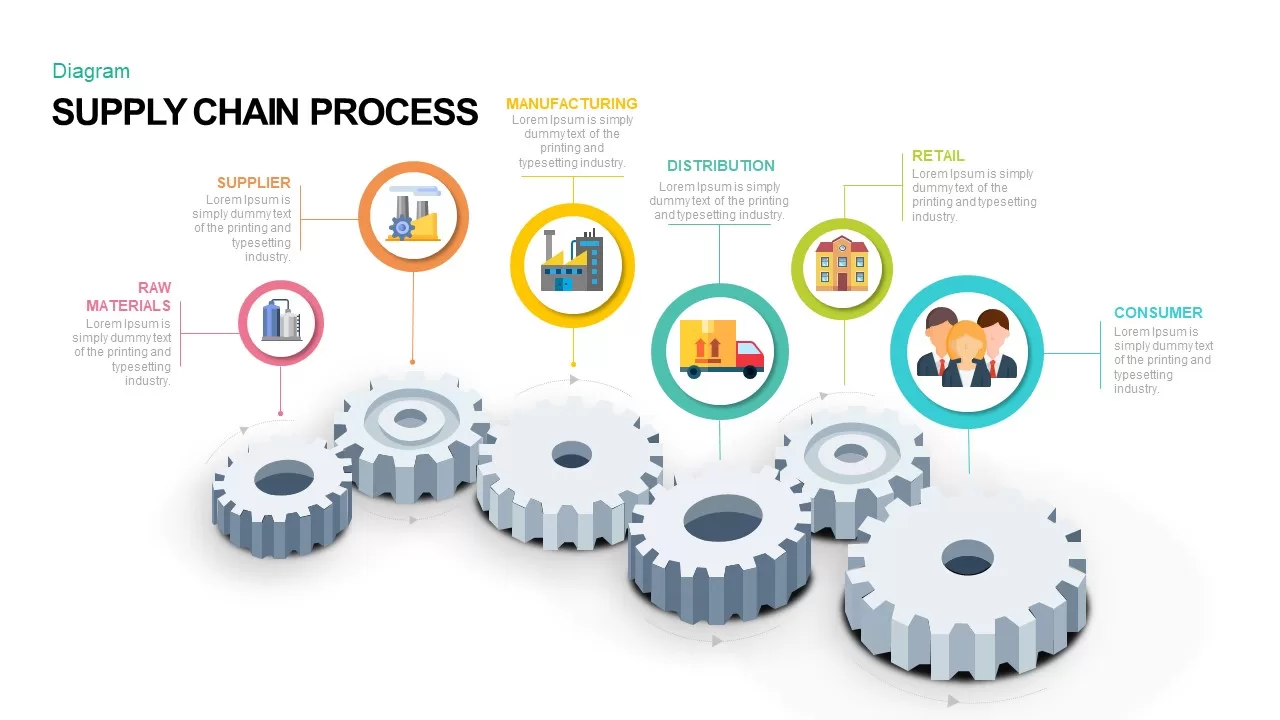
Supply Chain Process Gear Diagram Template for PowerPoint & Google Slides
Process
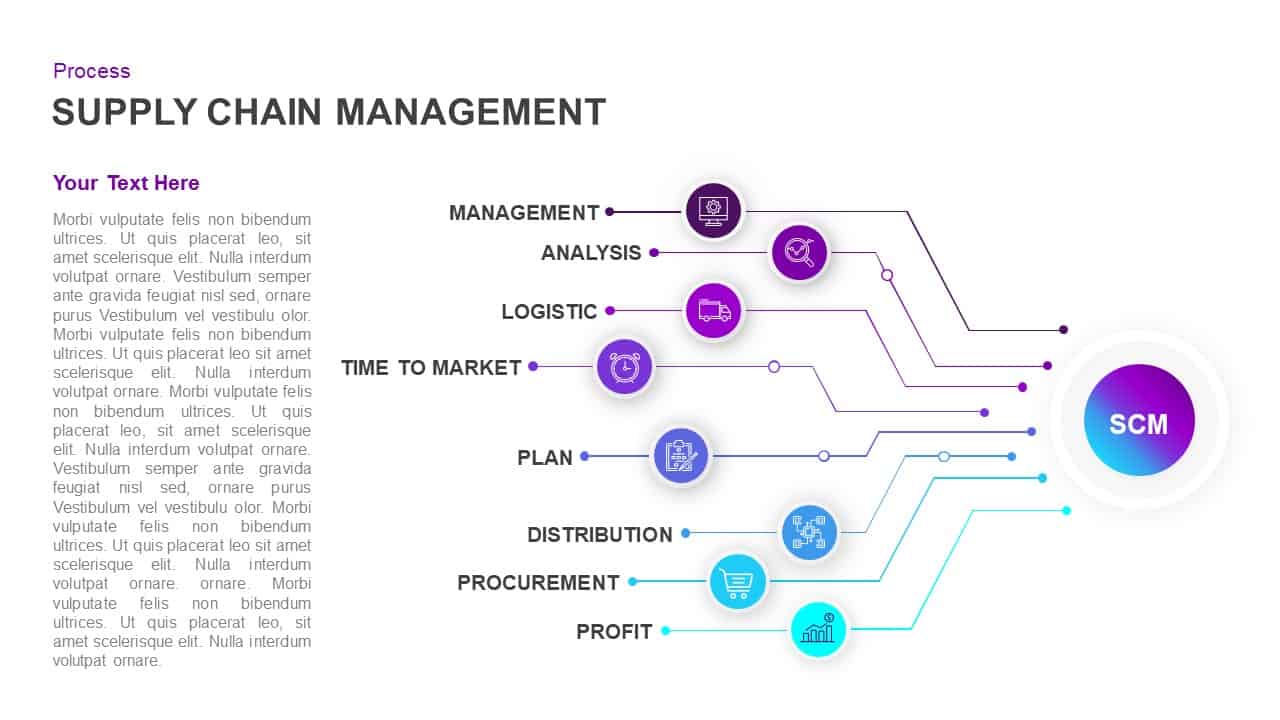
Supply Chain Management Process Diagram Template for PowerPoint & Google Slides
Process
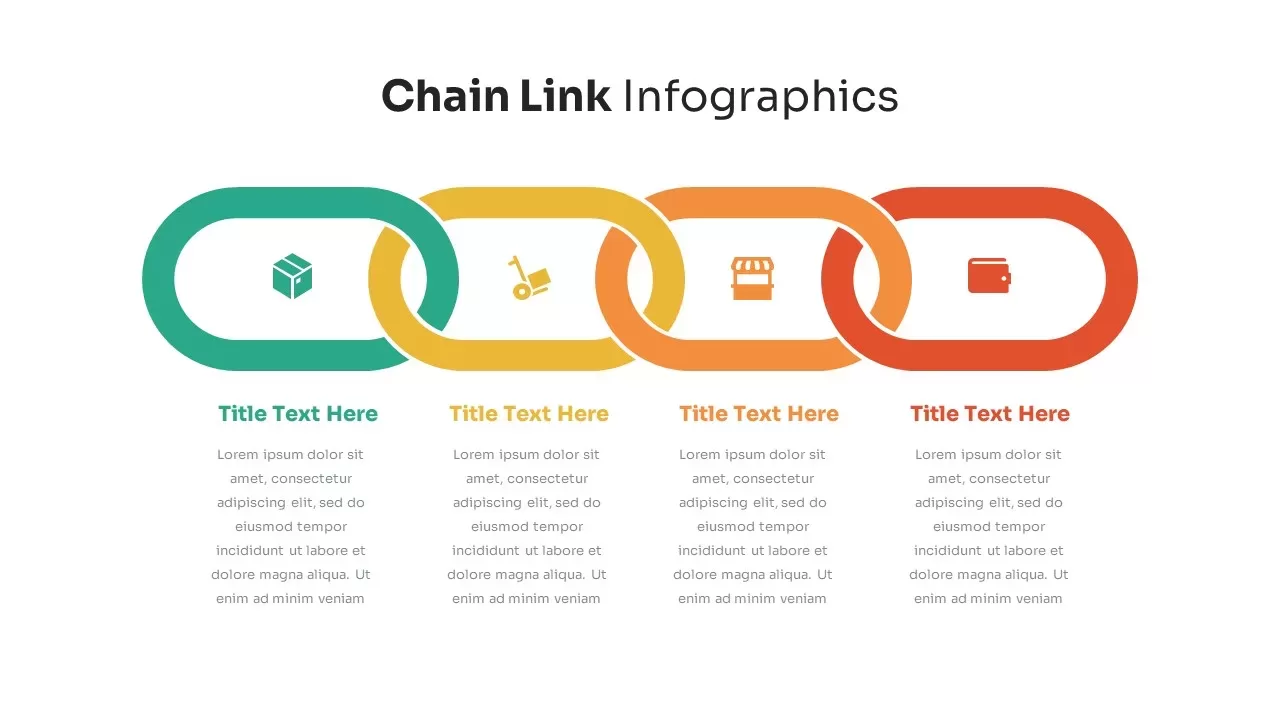
Chain Link Process Infographic Diagram Template for PowerPoint & Google Slides
Process
Chain Link Process Infographic Diagram Template for PowerPoint & Google Slides
Process
Chain Link Process Infographic Diagram Template for PowerPoint & Google Slides
Process
Circular Value Engineering Diagram Template for PowerPoint & Google Slides
Process
Supply Chain Analytics Process Template for PowerPoint & Google Slides
Process
Five-Step Chain Link Process Infographic Template for PowerPoint & Google Slides
Process
Six-Step Chain Link Technology Process Template for PowerPoint & Google Slides
Process
Chain Process Infographic for PowerPoint & Google Slides
Process
Value Creation Framework Process Diagram Template for PowerPoint & Google Slides
Business Plan
Hexagonal Supply Chain Diagram Template for PowerPoint & Google Slides
Process
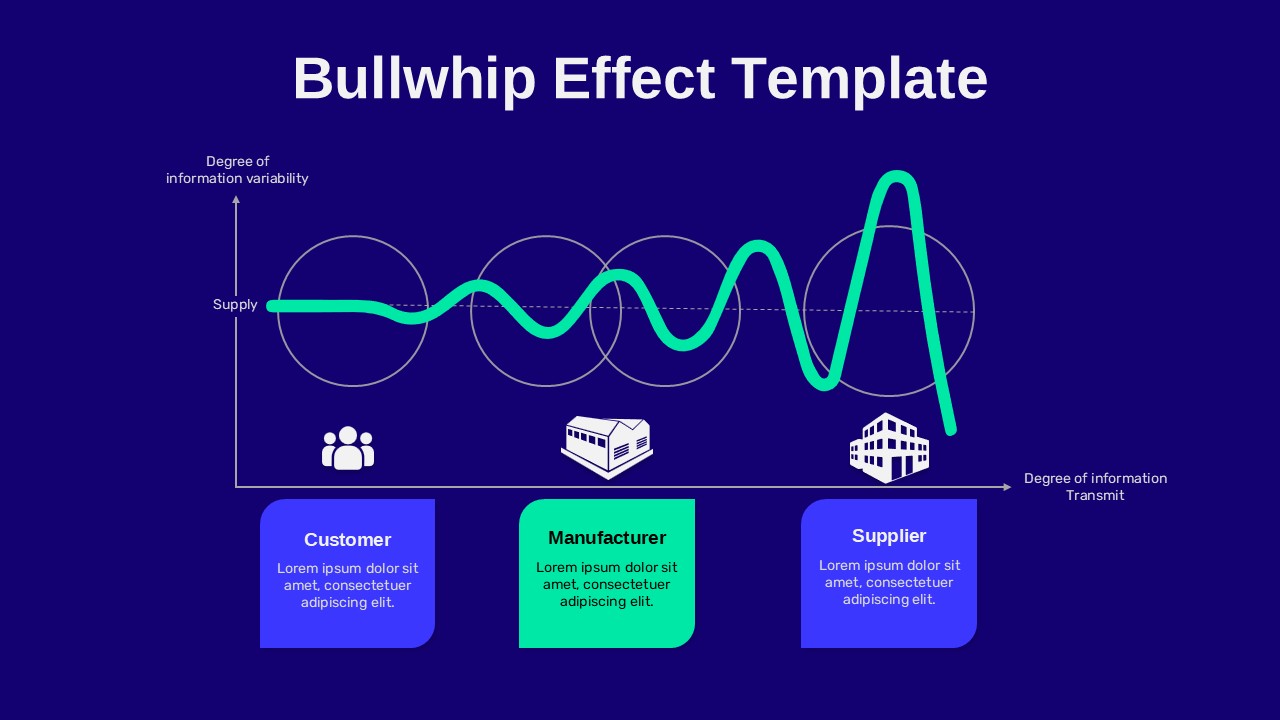
Bullwhip Effect Supply Chain Variability Diagram Template for PowerPoint & Google Slides
Business Models
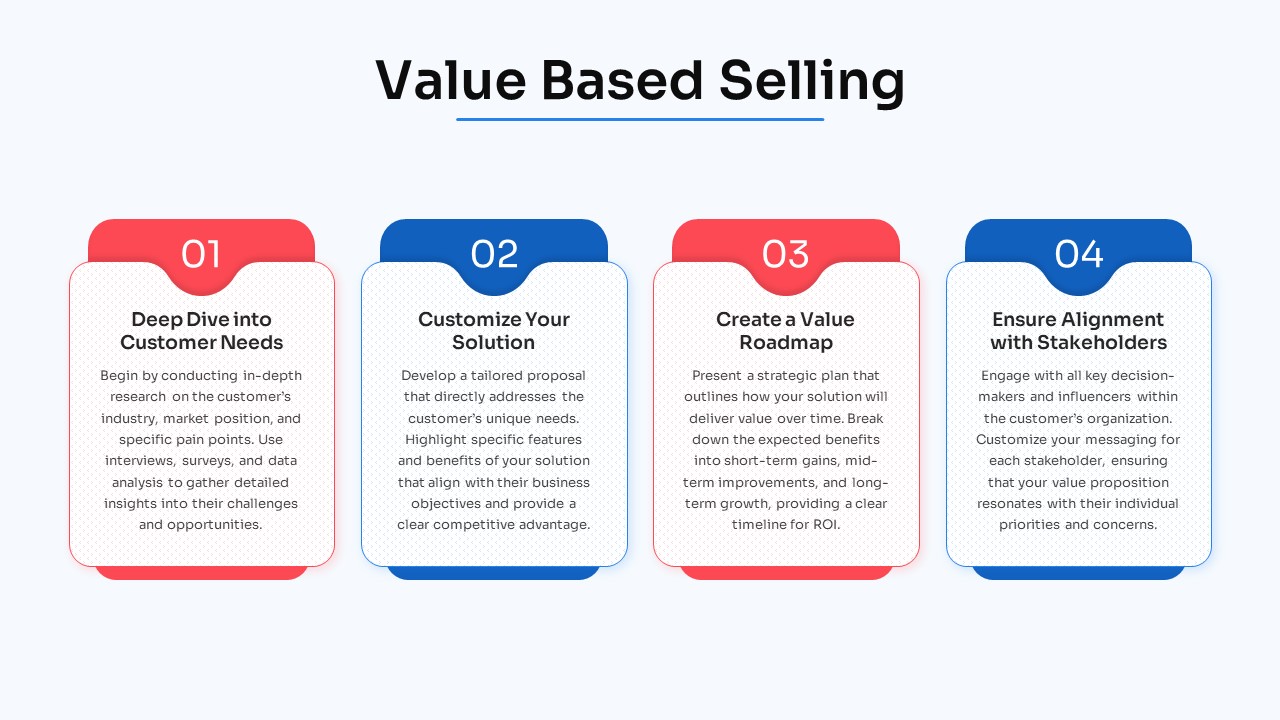
Free Four-Step Value-Based Selling Process Template for PowerPoint & Google Slides
Process
Free
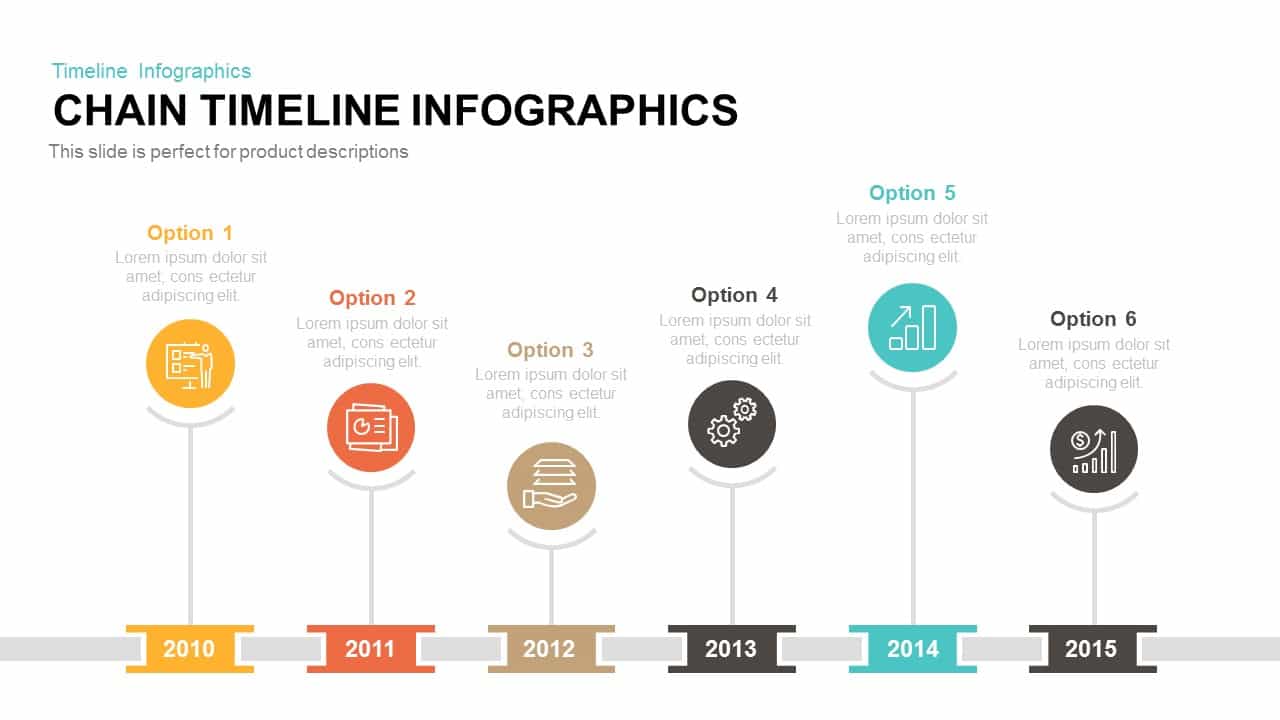
Chain Timeline template for PowerPoint & Google Slides
Timeline
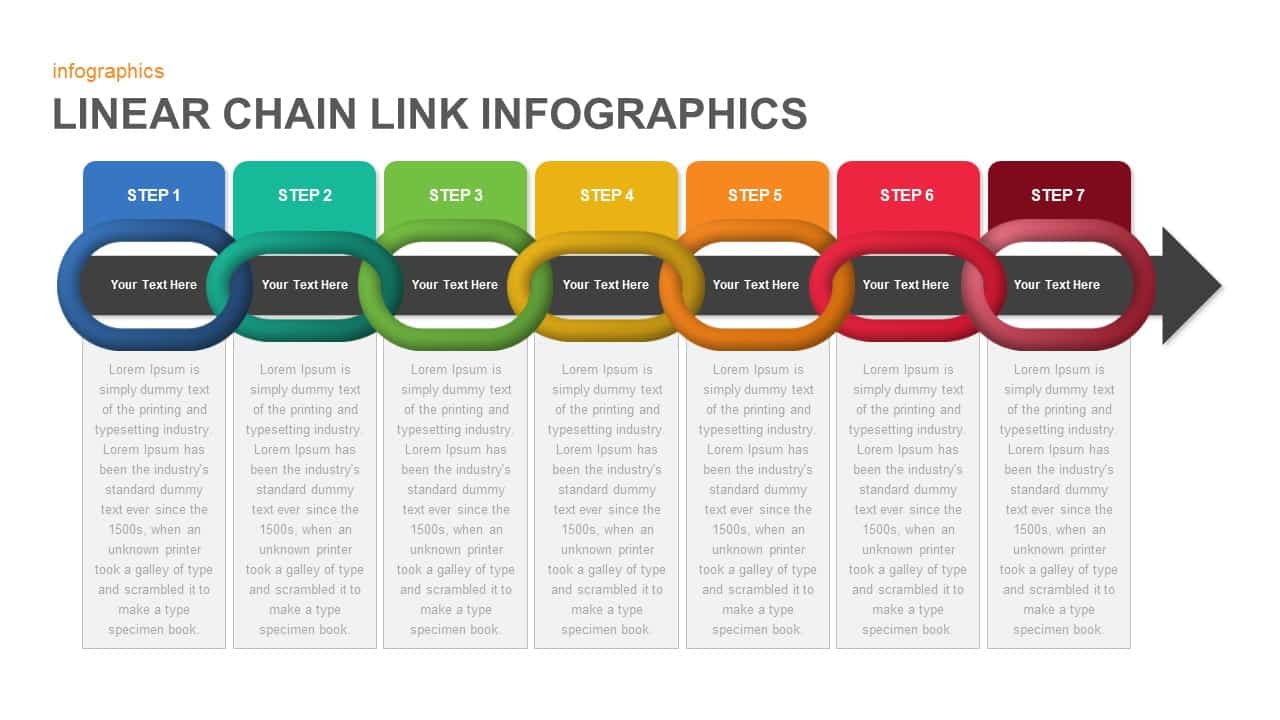
Linear Chain Link Infographics Template for PowerPoint & Google Slides
Process
Logistics and Supply Chain Management Template for PowerPoint & Google Slides
Process
Supply Chain Management Logistics Cover Template for PowerPoint & Google Slides
Pitch Deck
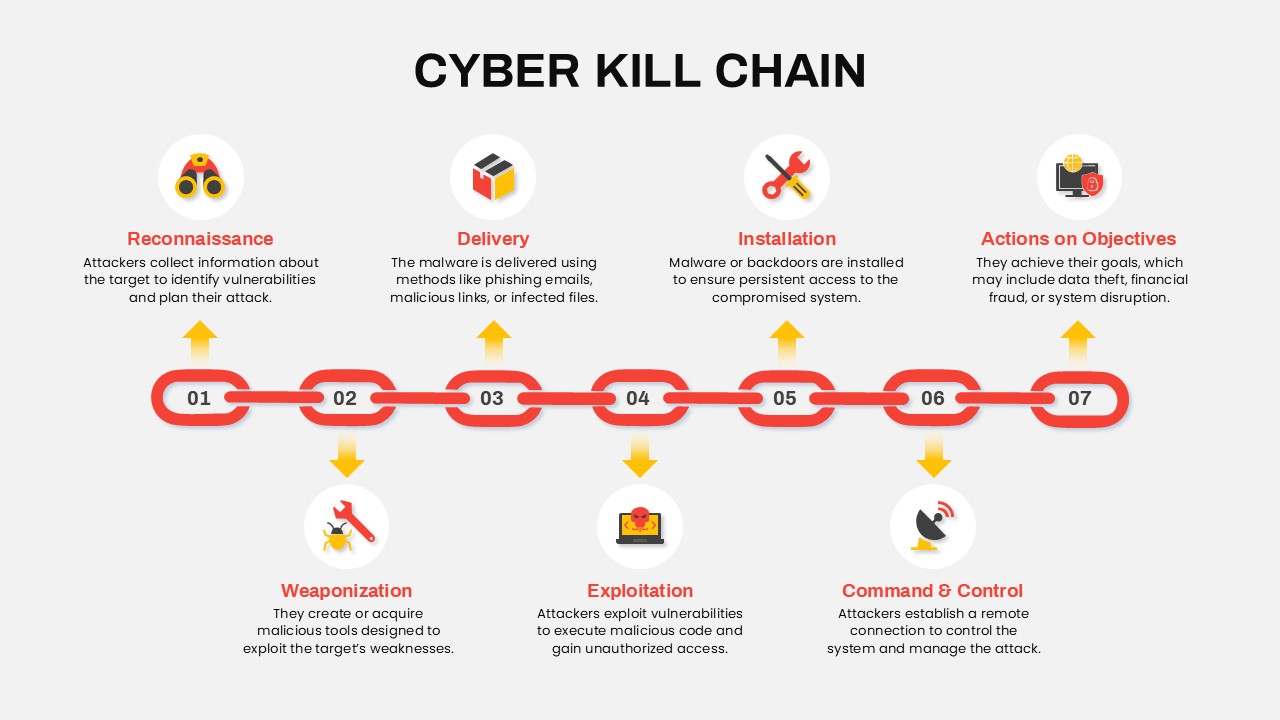
Cyber Kill Chain Template for PowerPoint & Google Slides
Information Technology
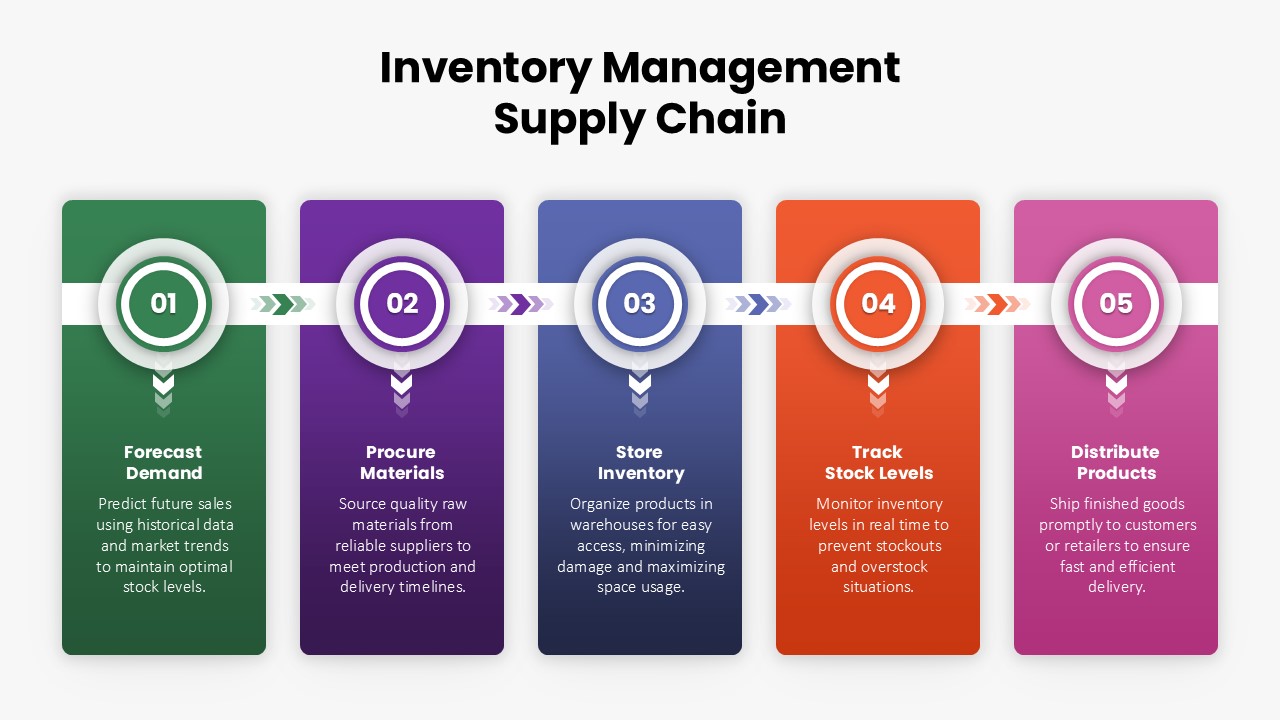
Inventory Management Supply Chain Template for PowerPoint & Google Slides
Process
Broken Chain Concept template for PowerPoint & Google Slides
Business
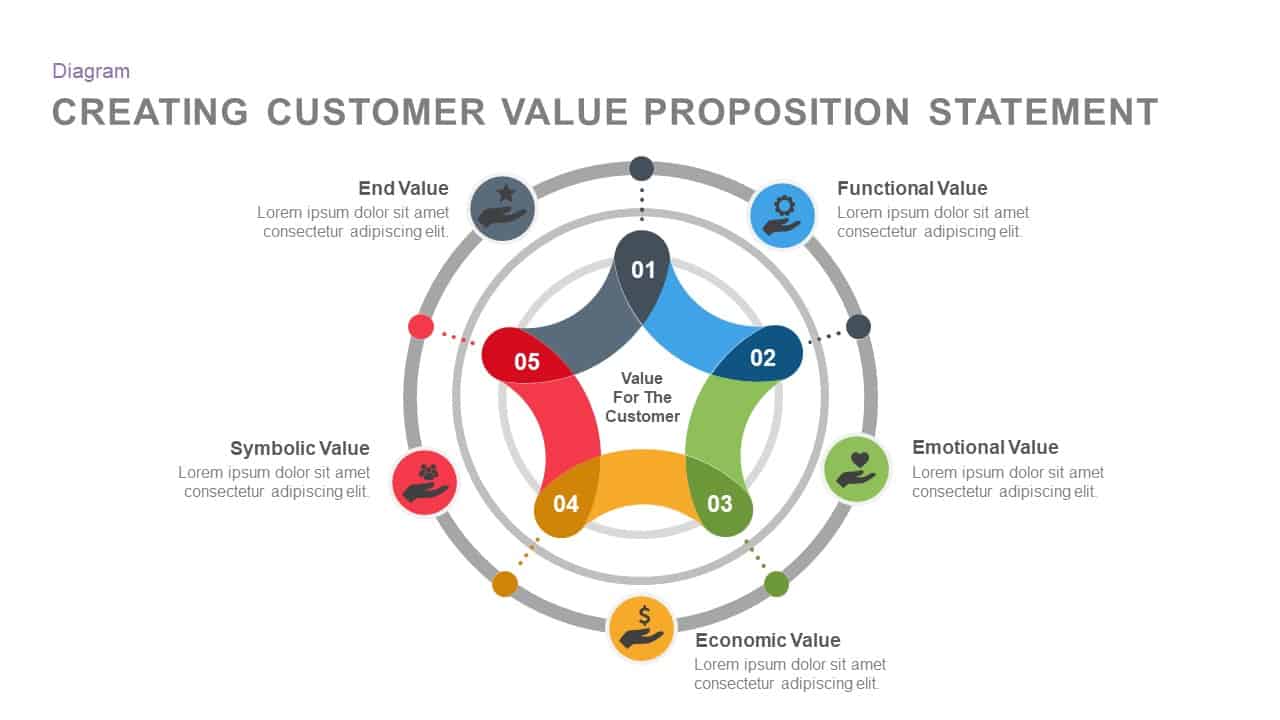
Customer Value Proposition Diagram Template for PowerPoint & Google Slides
Circular

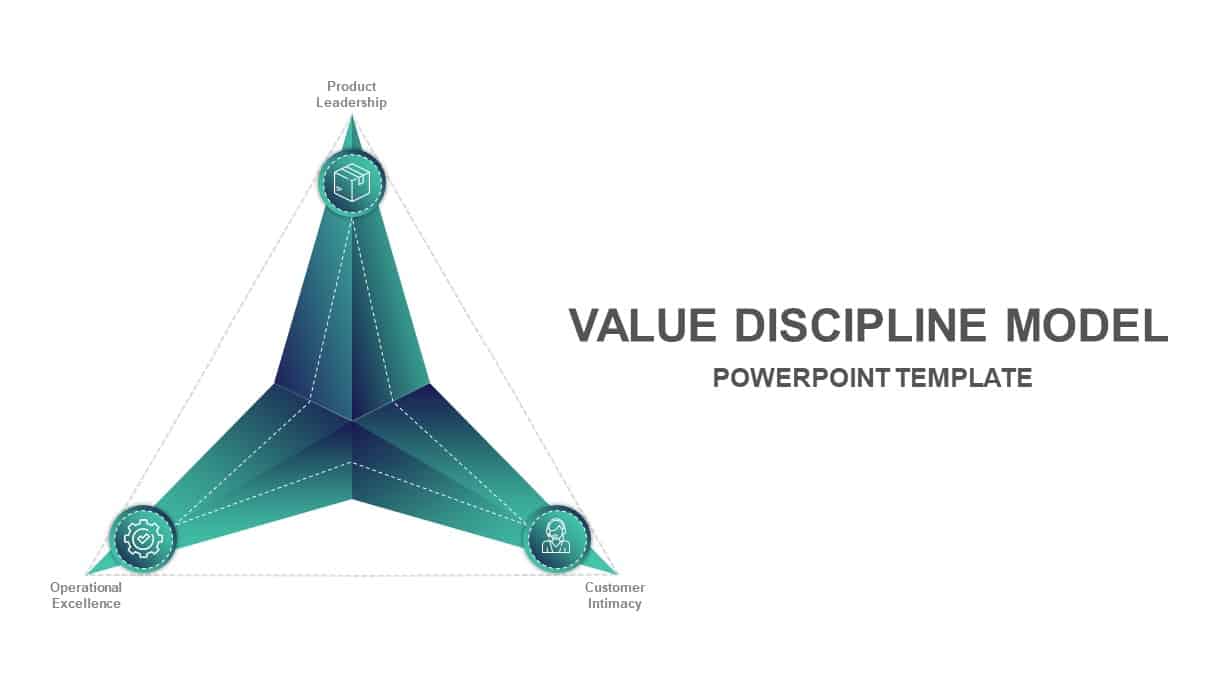
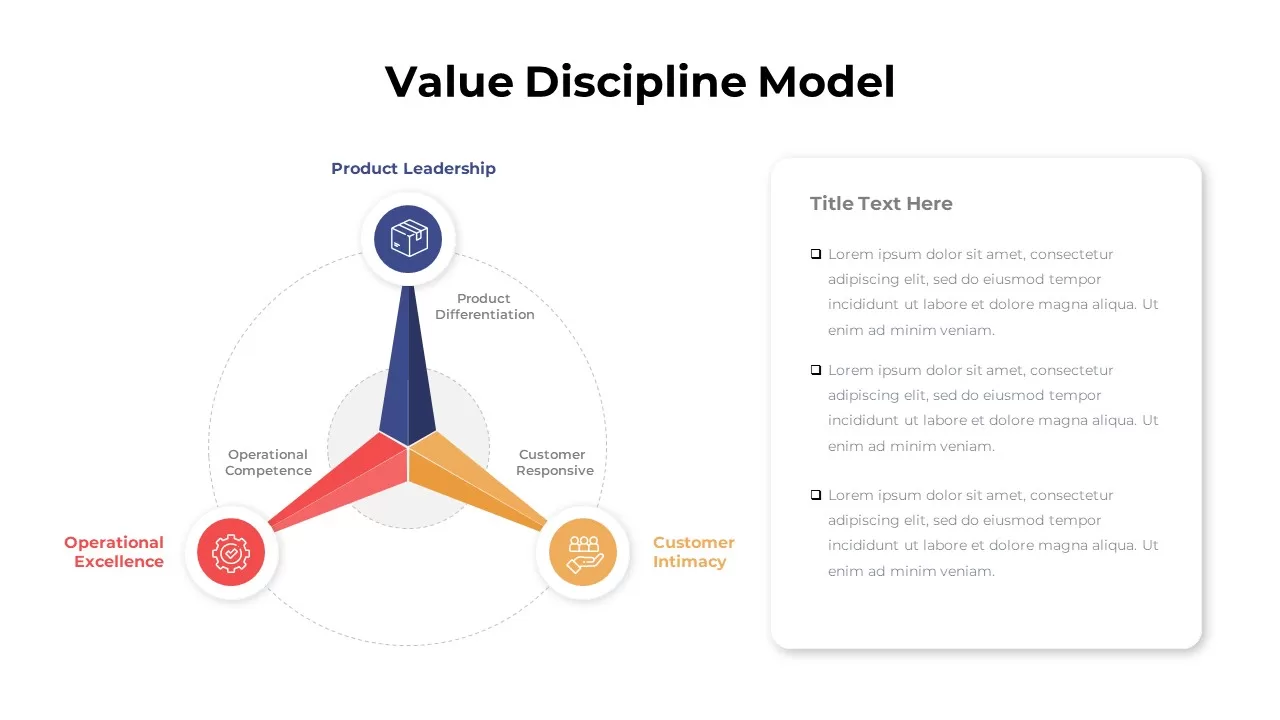
Value Discipline Strategy Diagram Template for PowerPoint & Google Slides
Comparison
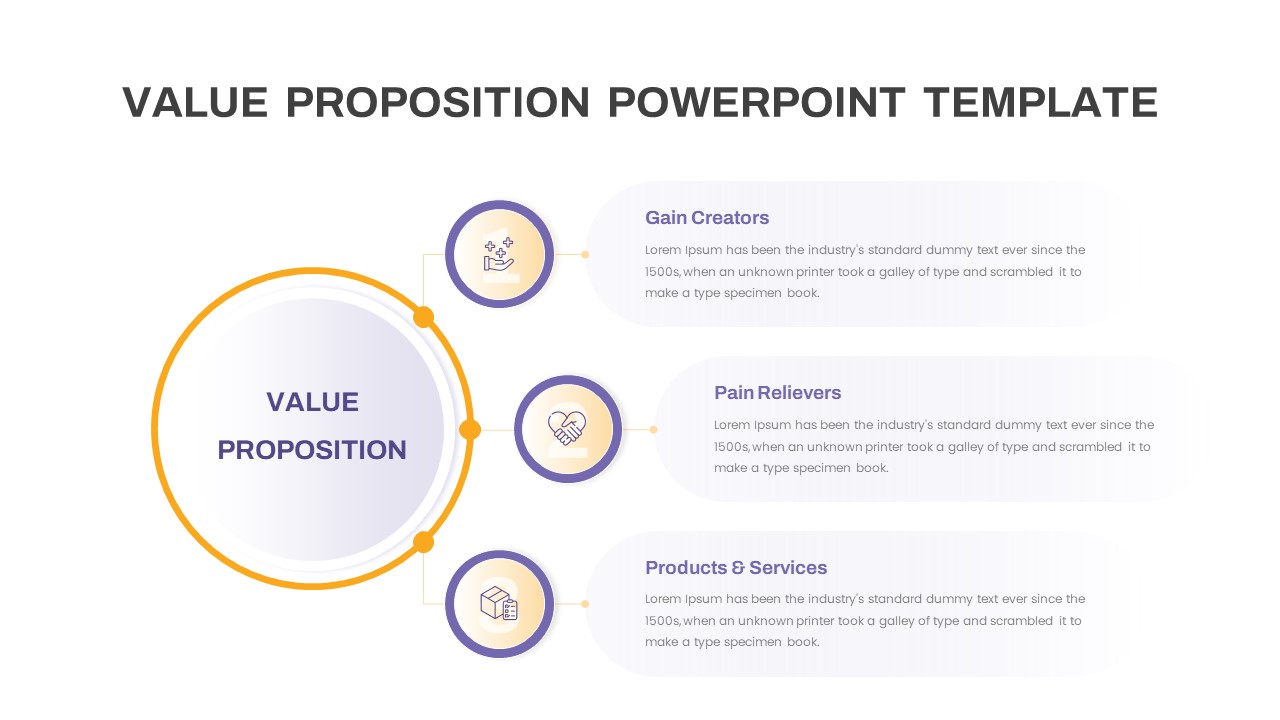
Free Value Proposition Diagram Template for PowerPoint & Google Slides
Business Strategy
Free
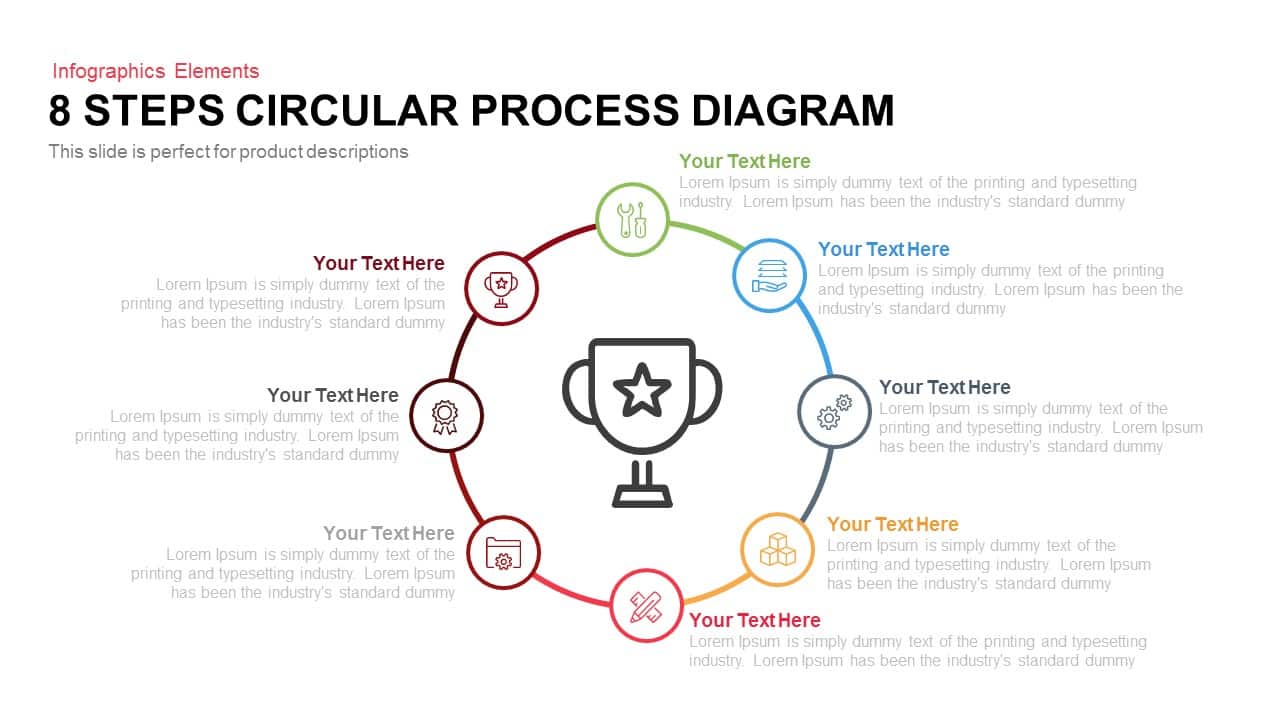
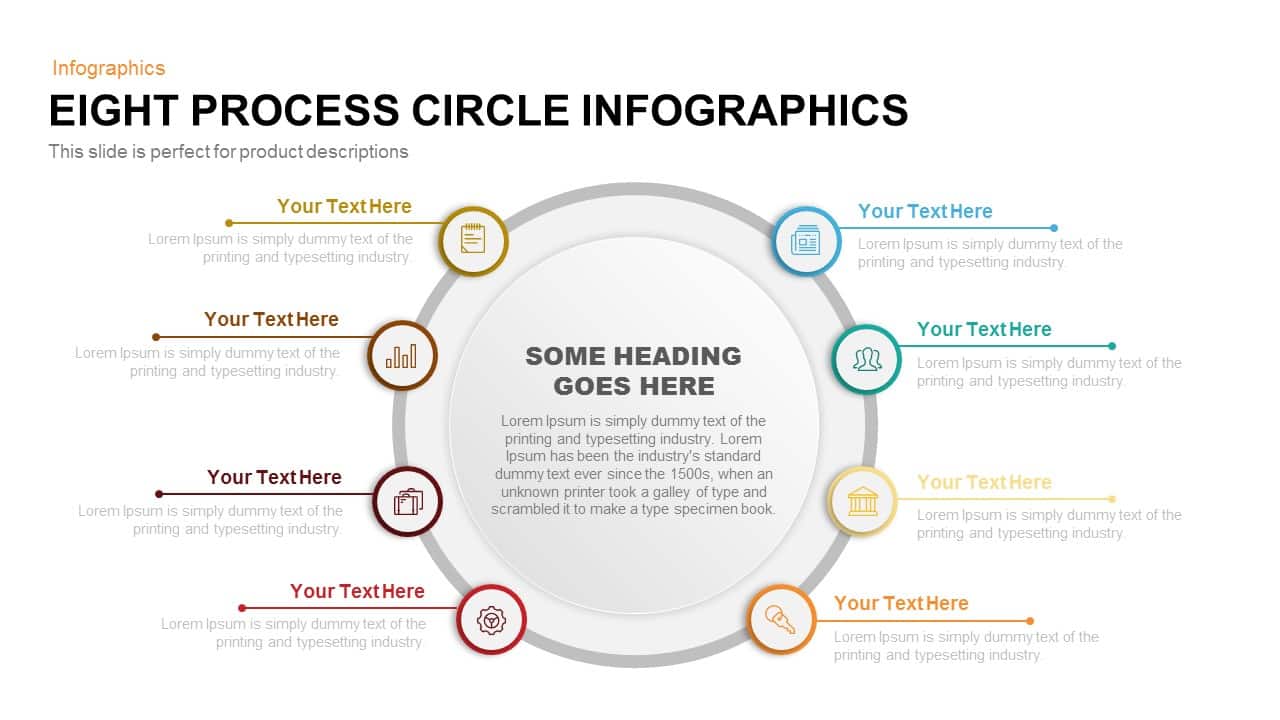
8 Steps Circular Process Diagram Template for PowerPoint & Google Slides
Process
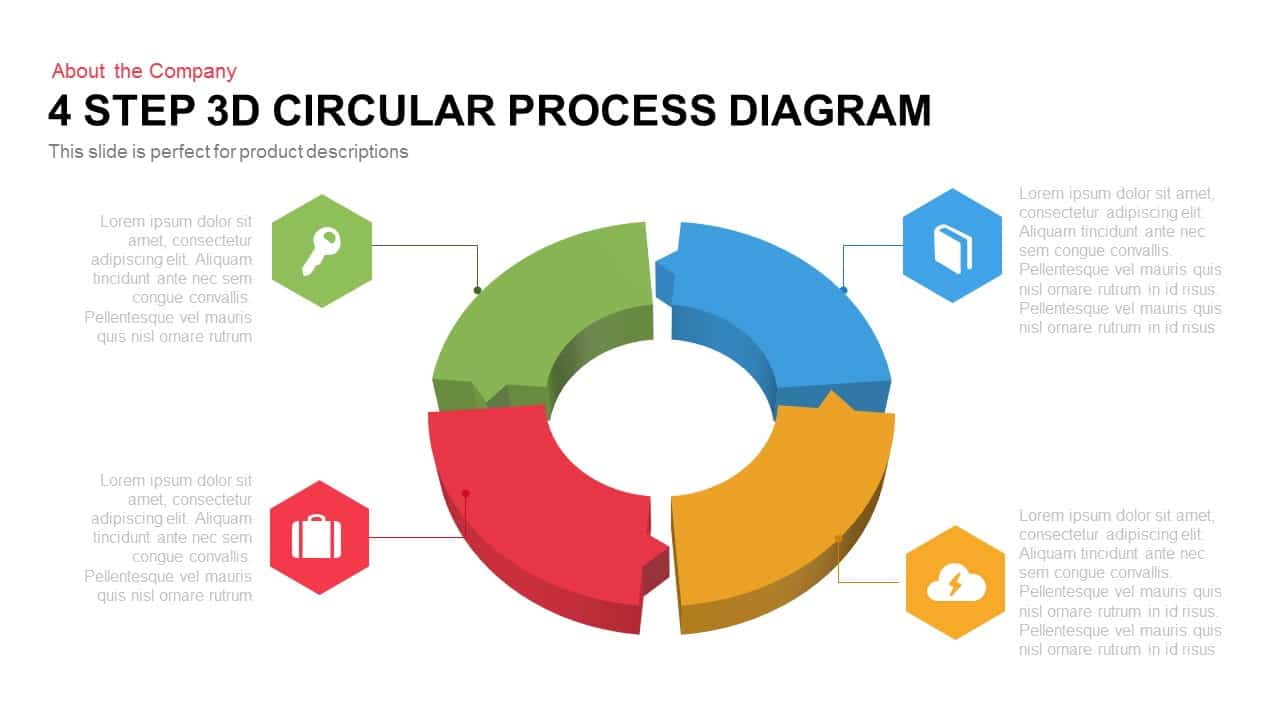
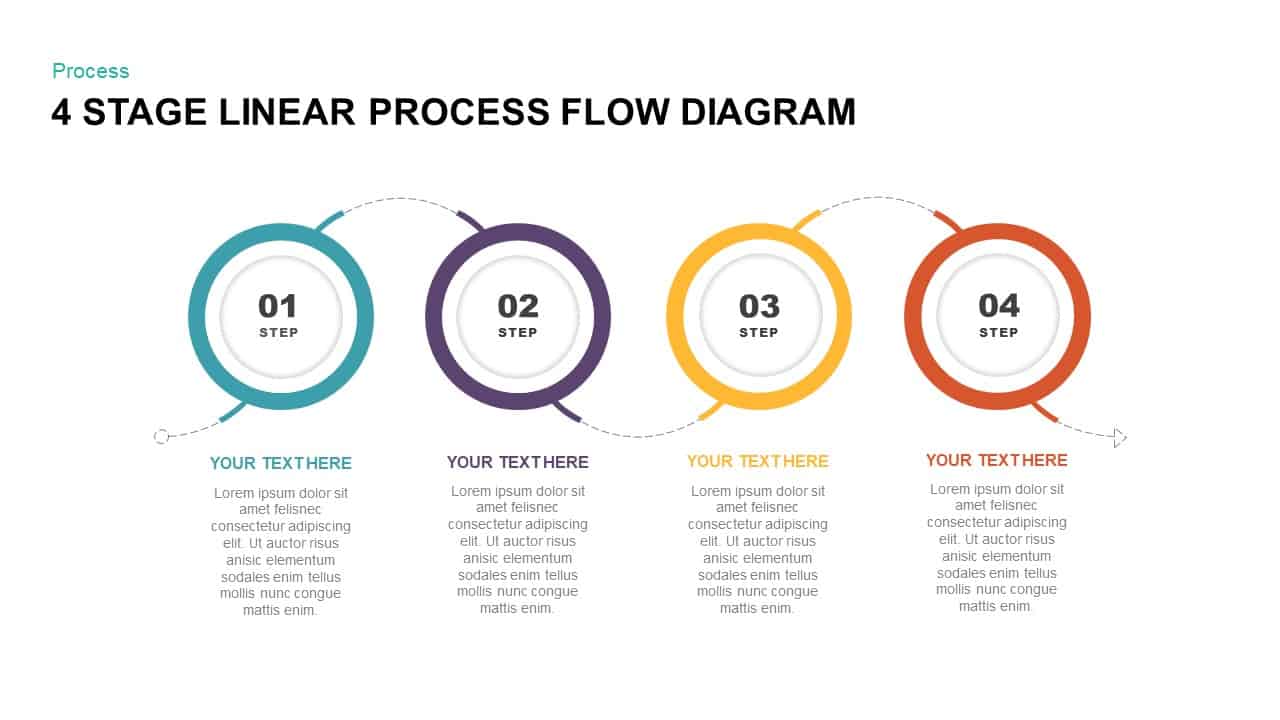
4 Step 3D Circular Process Diagram template for PowerPoint & Google Slides
Process
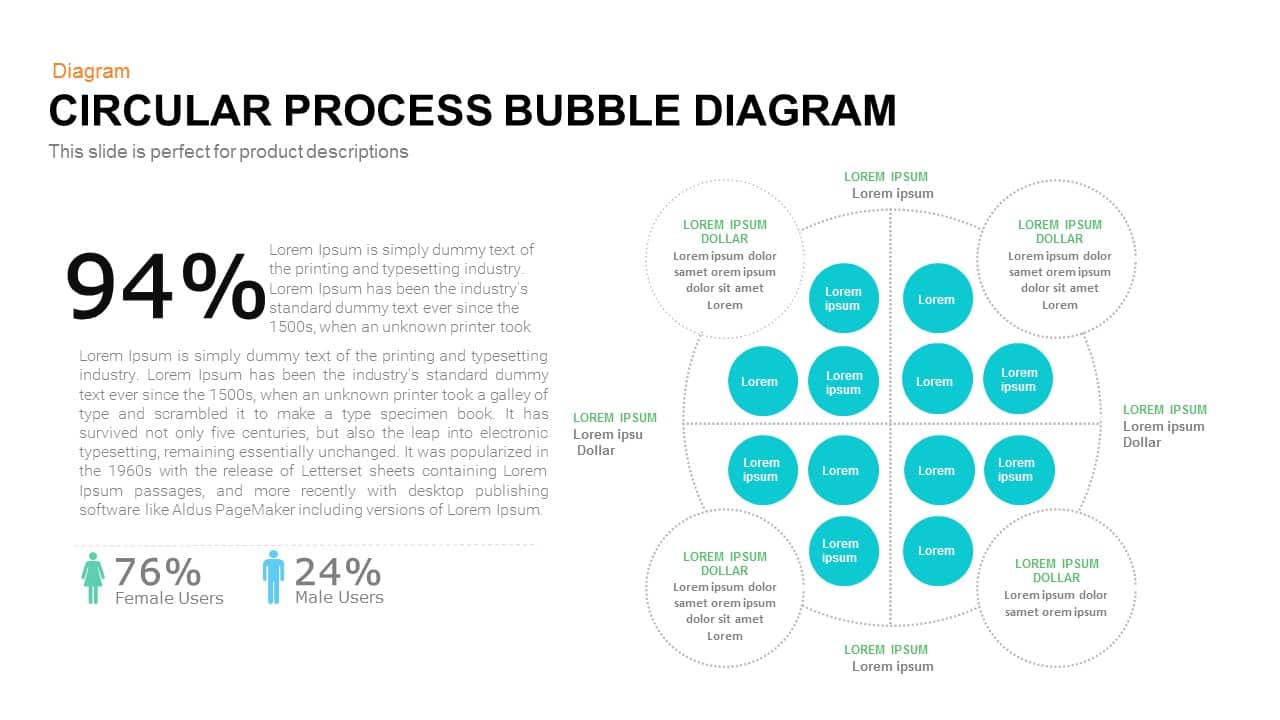
Bubble Circular Process Diagram Template for PowerPoint & Google Slides
Process
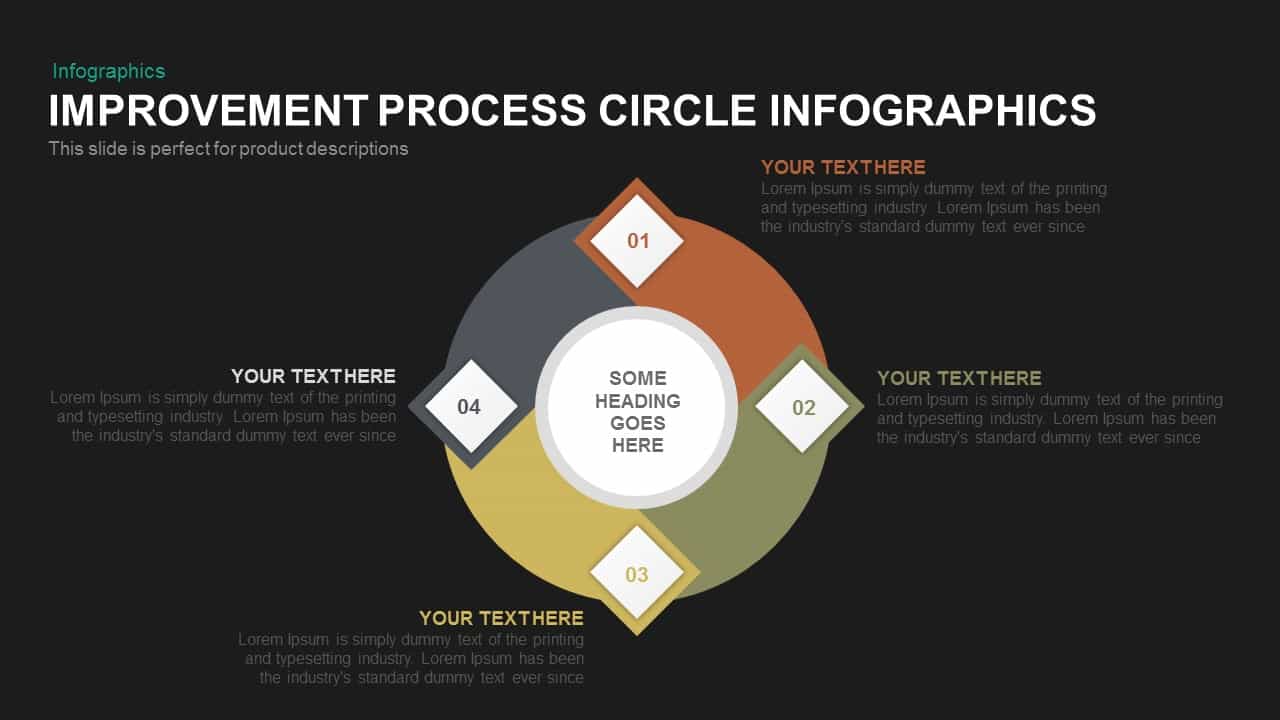
Circular Improvement Process Diagram Template for PowerPoint & Google Slides
Process

Six-Process Circular Arrow Diagram Template for PowerPoint & Google Slides
Circular

Six-Stage Circular Process Diagram Template for PowerPoint & Google Slides
Process
9-Step Circular Arrows Process Diagram Template for PowerPoint & Google Slides
Process
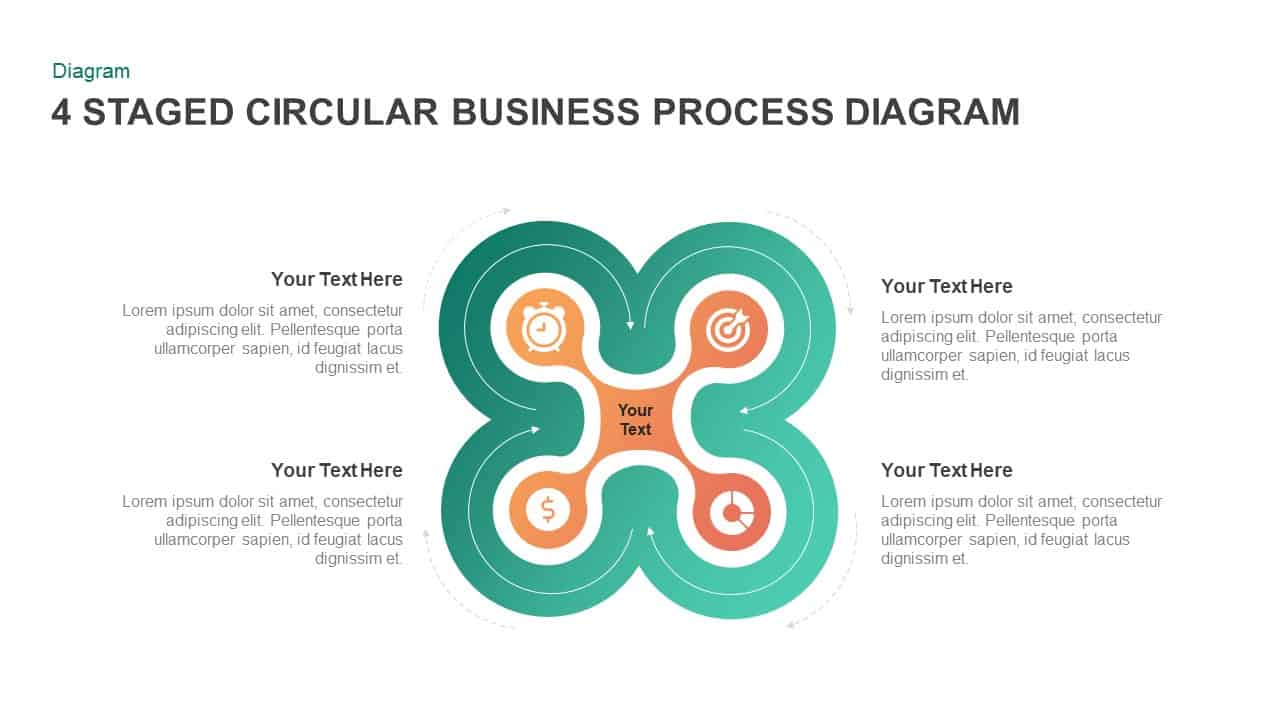
4 Staged Circular Business Process Diagram template for PowerPoint & Google Slides
Process
Six-Stage Circular Diagram Process Template for PowerPoint & Google Slides
Circular
Five-Stage Circular Process Diagram Template for PowerPoint & Google Slides
Circular
8 Steps Circular Process Diagram Template for PowerPoint & Google Slides
Circular
Five-Stage Circular Process Flow Diagram Template for PowerPoint & Google Slides
Circular
Five-Step Circular Process Diagram Template for PowerPoint & Google Slides
Circular
Circular CRM Process Diagram Infographic Template for PowerPoint & Google Slides
Circular
8 Step Circular Process Flow Diagram Template for PowerPoint & Google Slides
Process
6-Step Circular Process Flow Diagram Template for PowerPoint & Google Slides
Process
Circular CRM Process Infographic Diagram Template for PowerPoint & Google Slides
Circular
Circular Arrow Process Diagram Template for PowerPoint & Google Slides
Circular
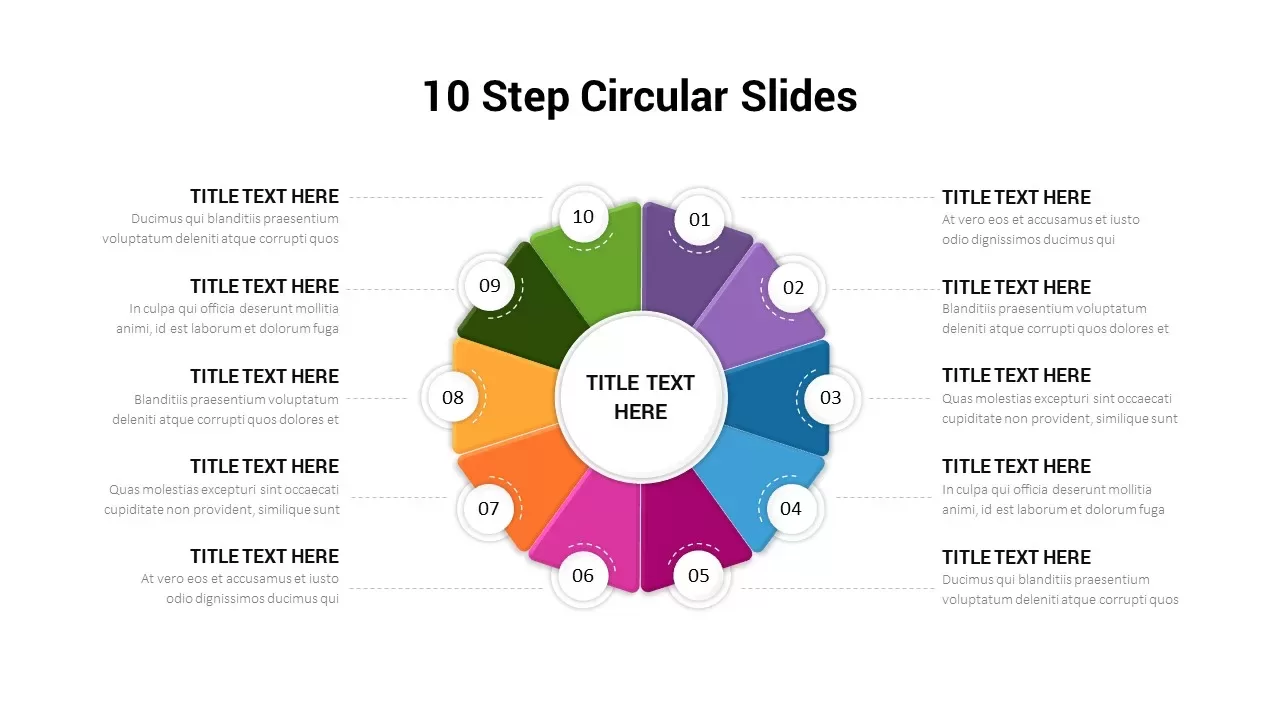
10-Step Circular Process Diagram Template for PowerPoint & Google Slides
Process
10-Step Circular Process Diagram Template for PowerPoint & Google Slides
Process
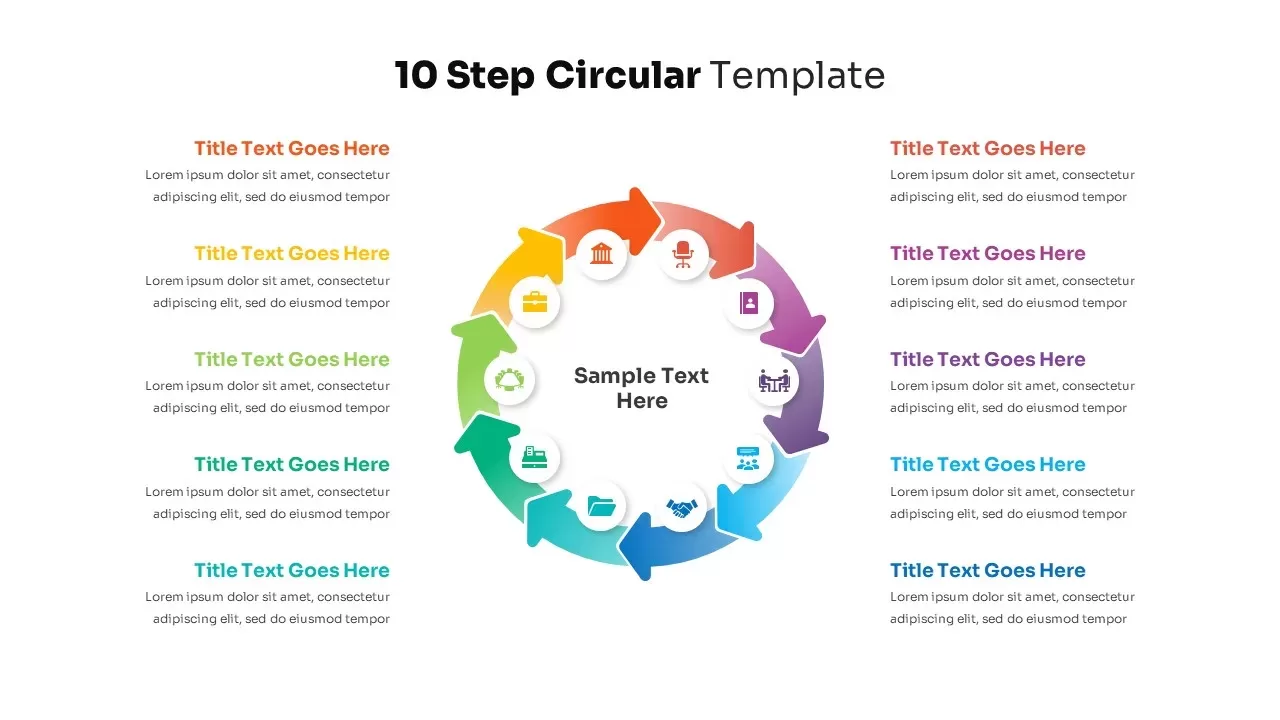
10 Step Circular Process Diagram Template for PowerPoint & Google Slides
Circular
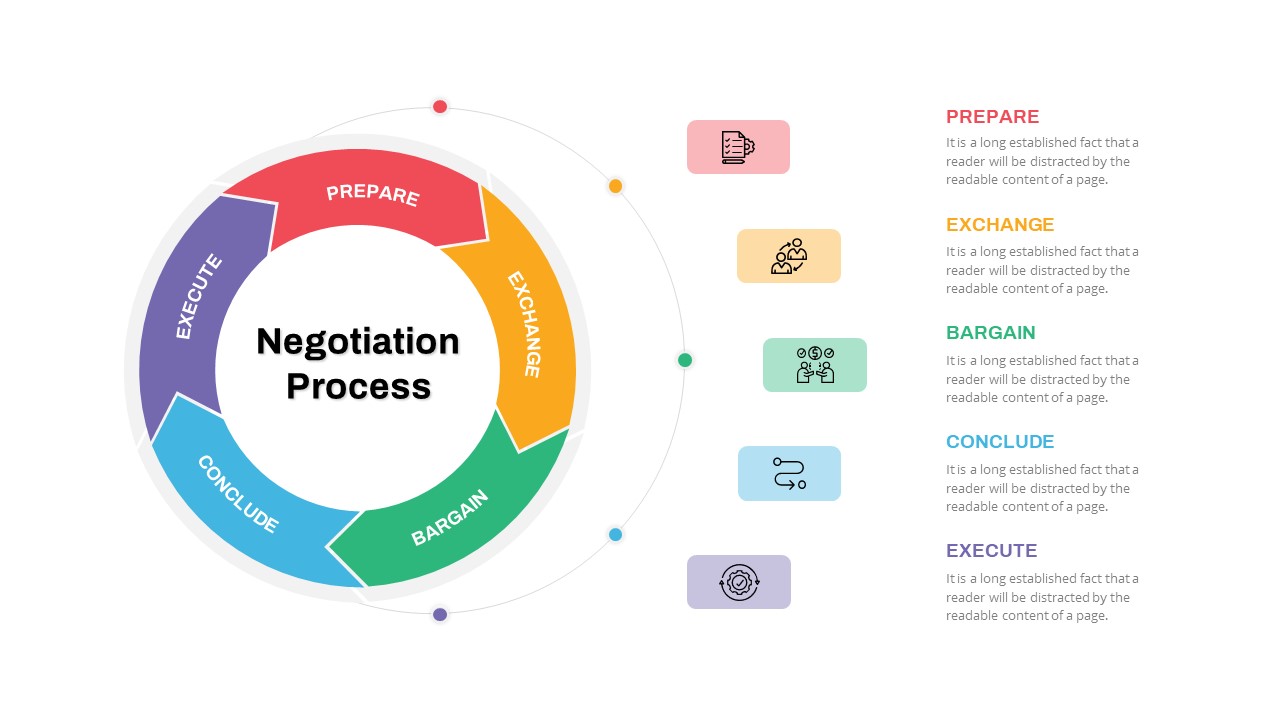
Negotiation Process Circular Diagram Template for PowerPoint & Google Slides
Circular
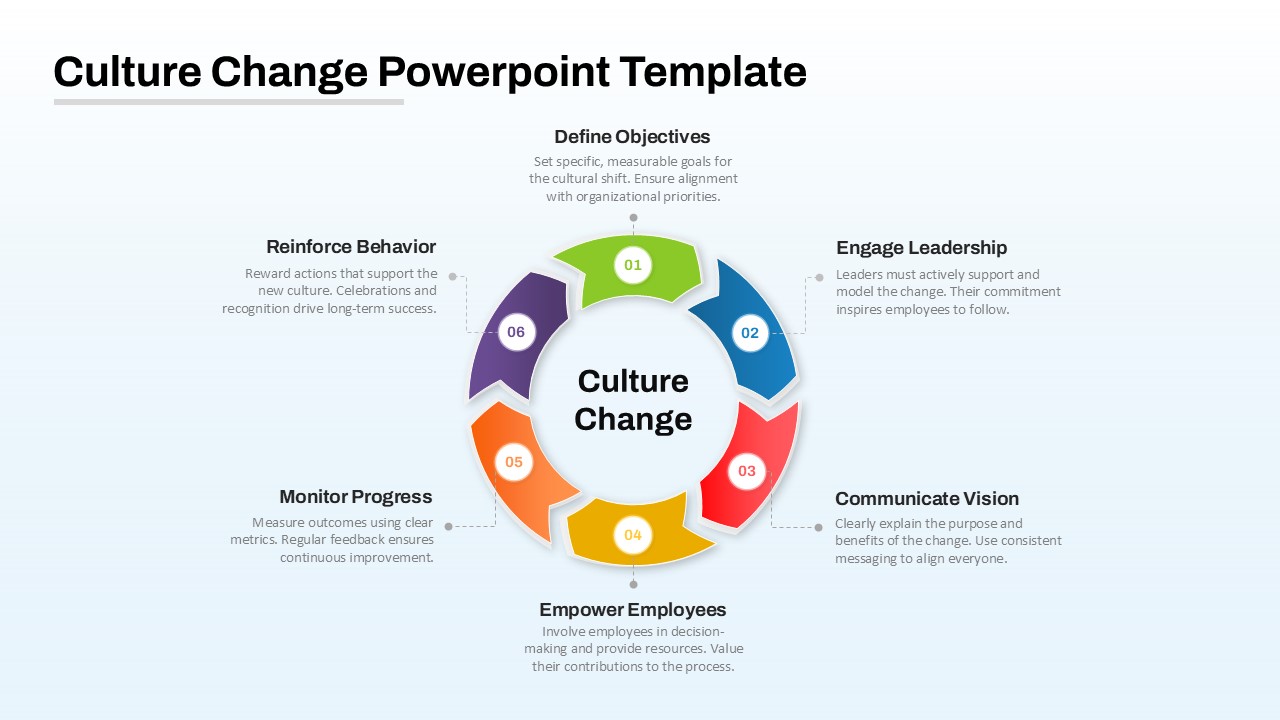
Culture Change Circular Process Diagram Template for PowerPoint & Google Slides
Process
Workshop 5-Step Circular Process Diagram Template for PowerPoint & Google Slides
Circular
14 Steps Circular Process Diagram Template for PowerPoint & Google Slides
Circular
Headcount Planning Circular Process Diagram Template for PowerPoint & Google Slides
HR
Strategy Development Process Circular Diagram Template for PowerPoint & Google Slides
Business Strategy
4 Staged Circular Business Process Diagram for PowerPoint & Google Slides
Process
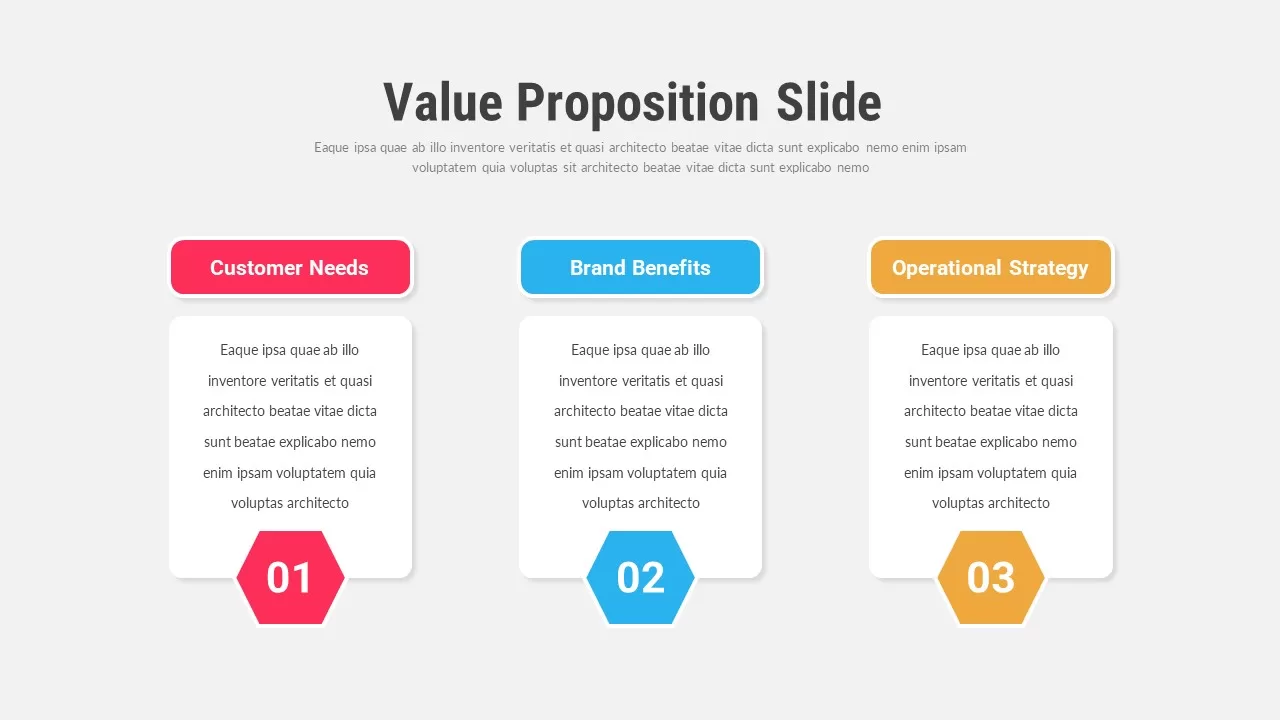
Value Proposition Slides Pack for PowerPoint & Google Slides
Infographics
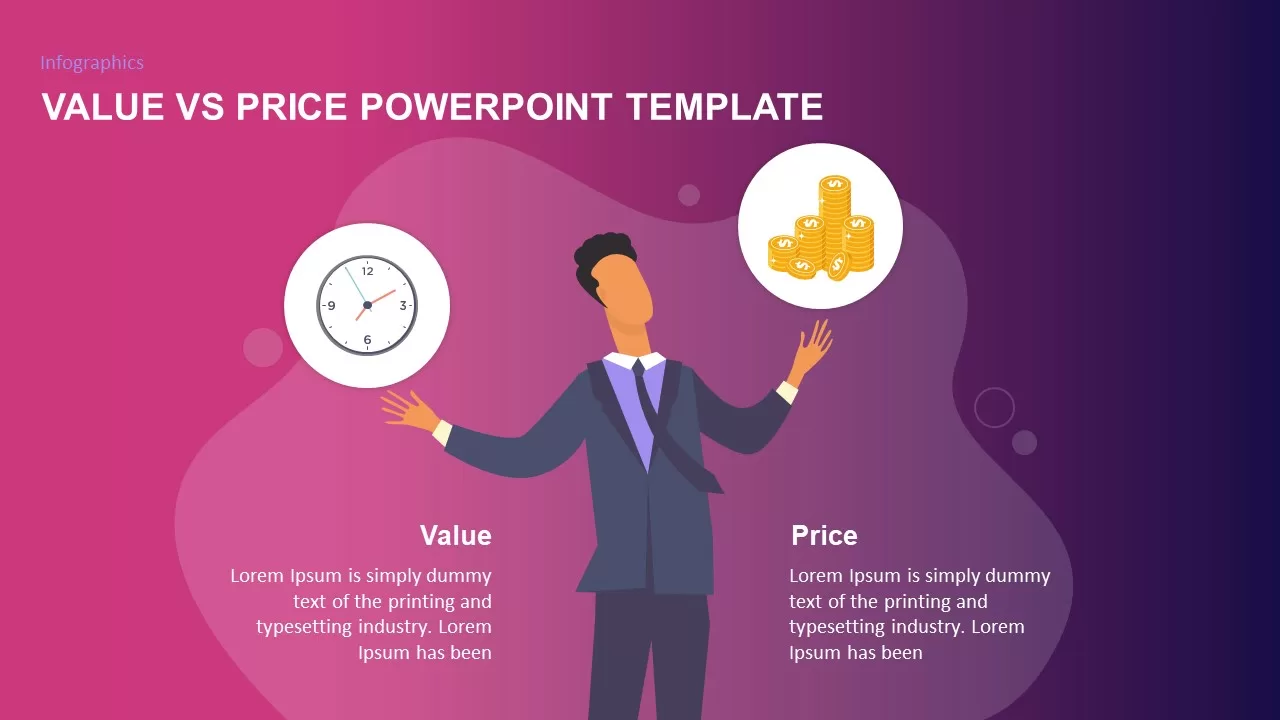
Value vs Price PowerPoint Template for PowerPoint & Google Slides
Comparison

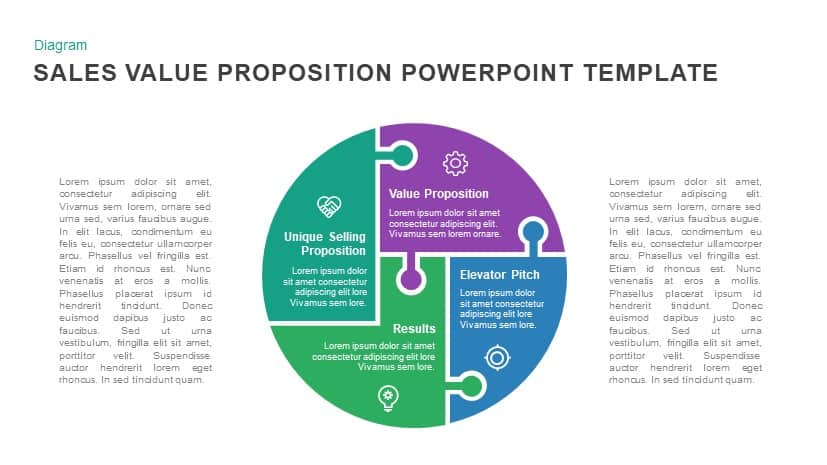
Sales Value Proposition template for PowerPoint & Google Slides
Infographics
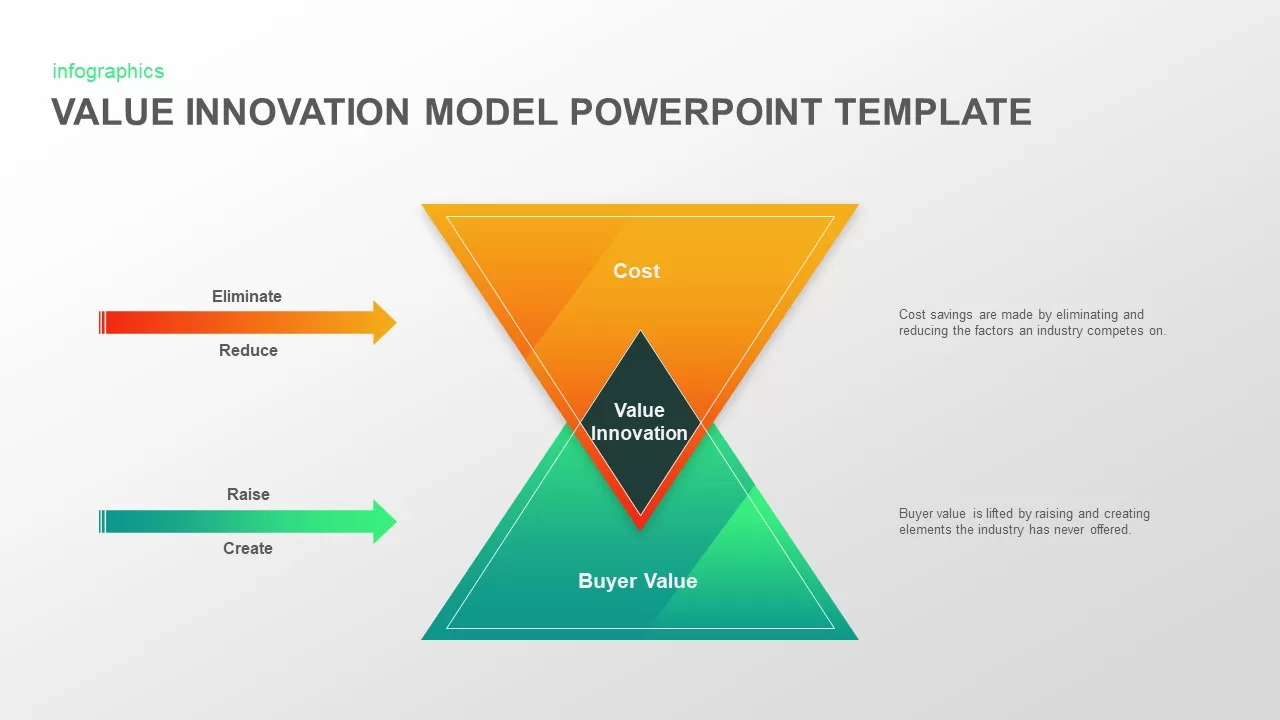
Value Innovation Model PowerPoint & Google Slides Template for Presentations
Business Proposal
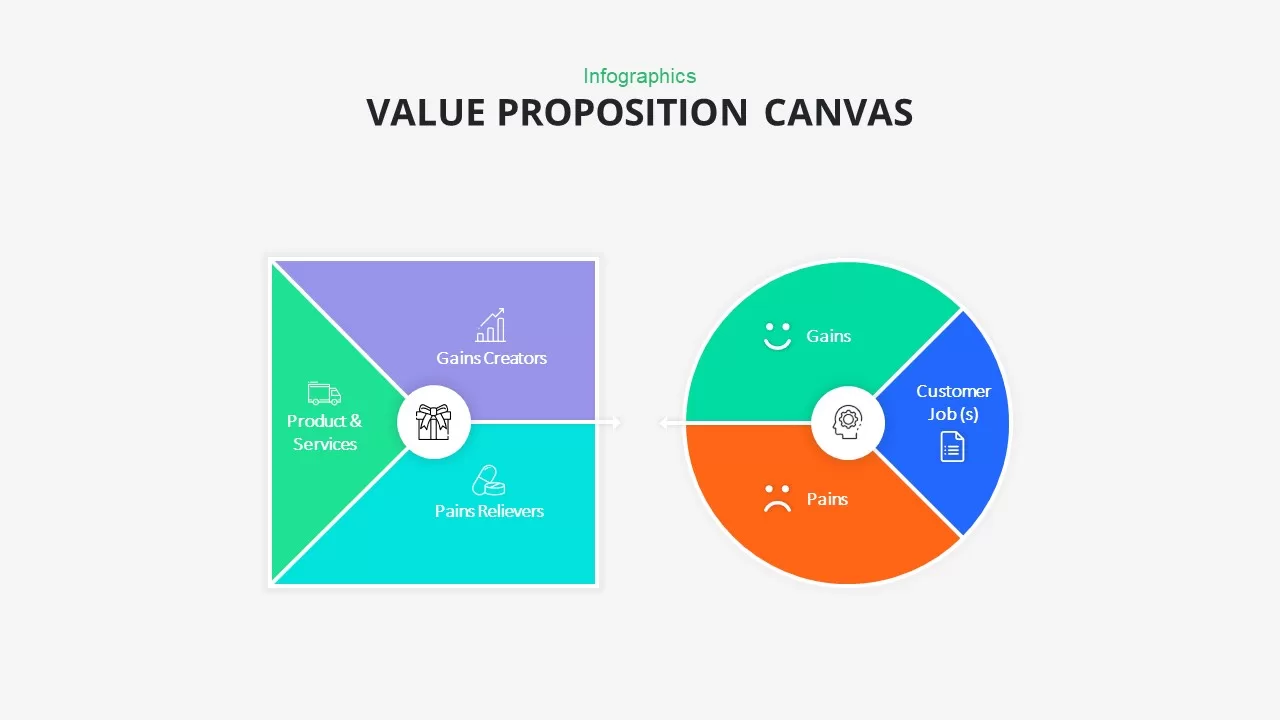
Value Proposition Canvas Infographic Template for PowerPoint & Google Slides
Business Report
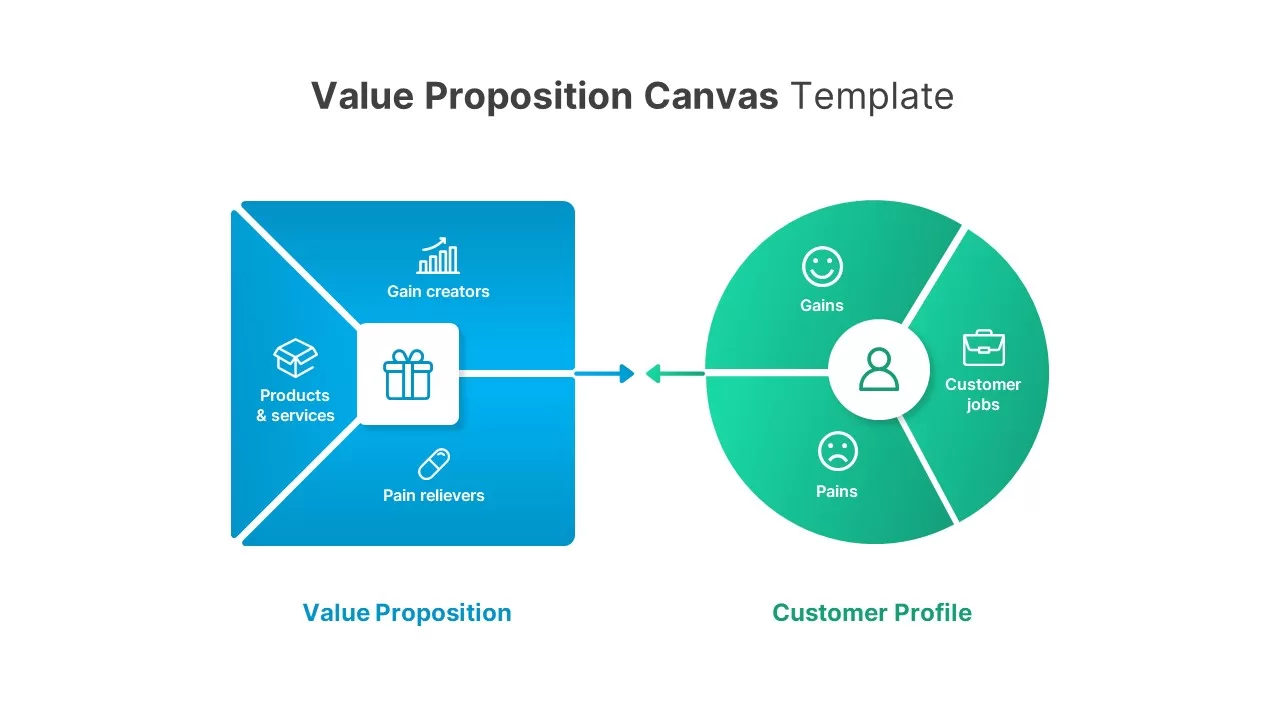
Value Proposition Canvas Template for PowerPoint & Google Slides
Business Strategy
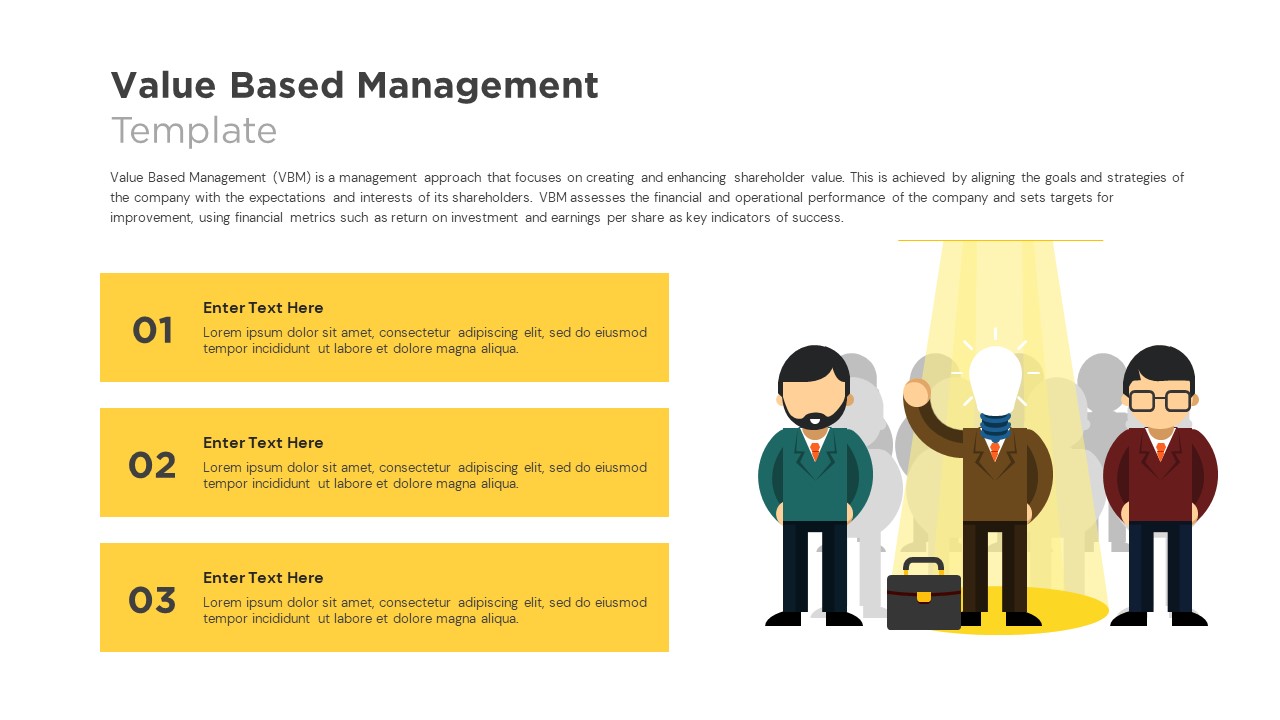
Value Based Management Step-by-Step Template for PowerPoint & Google Slides
Business Strategy
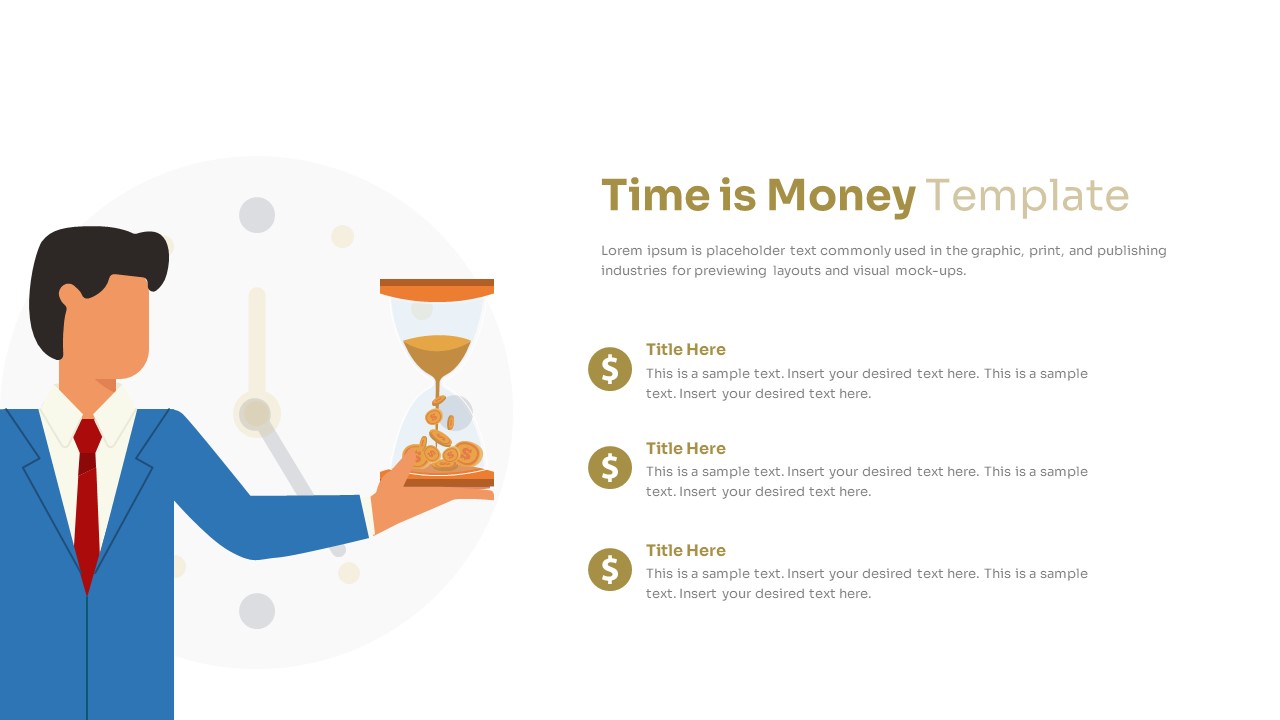
Time is Money Concept and Value Slide Template for PowerPoint & Google Slides
Finance
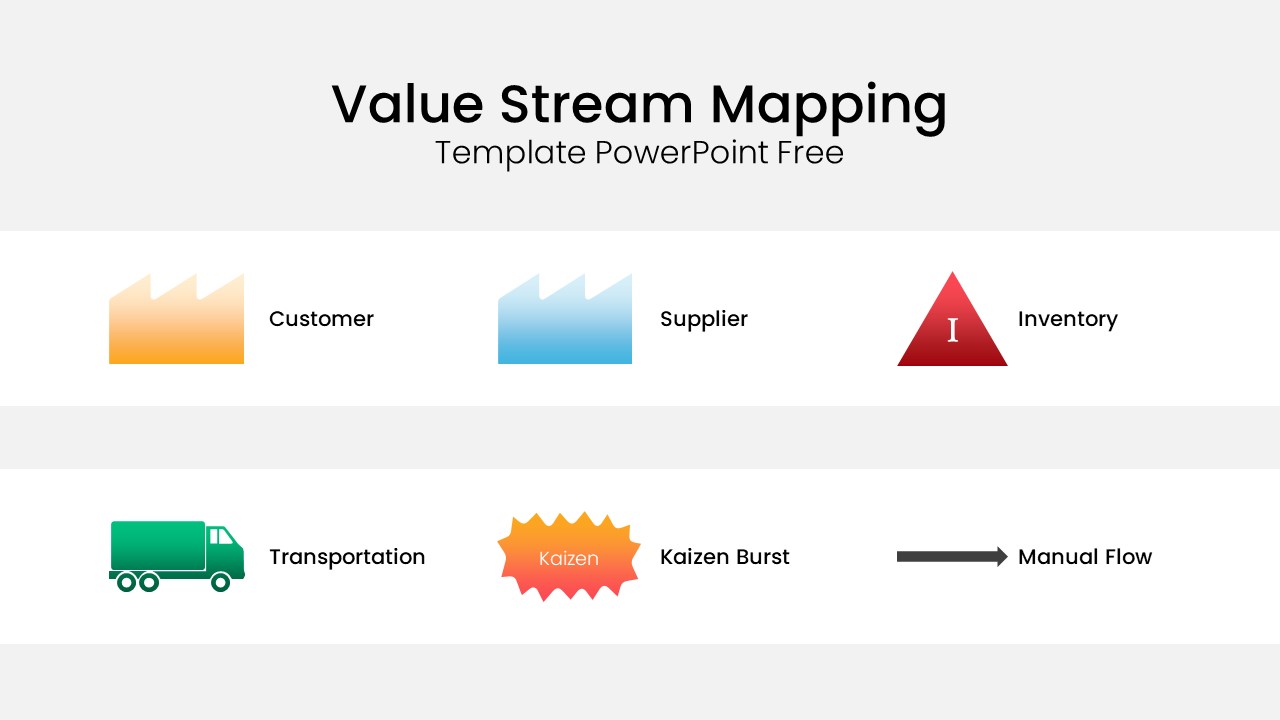
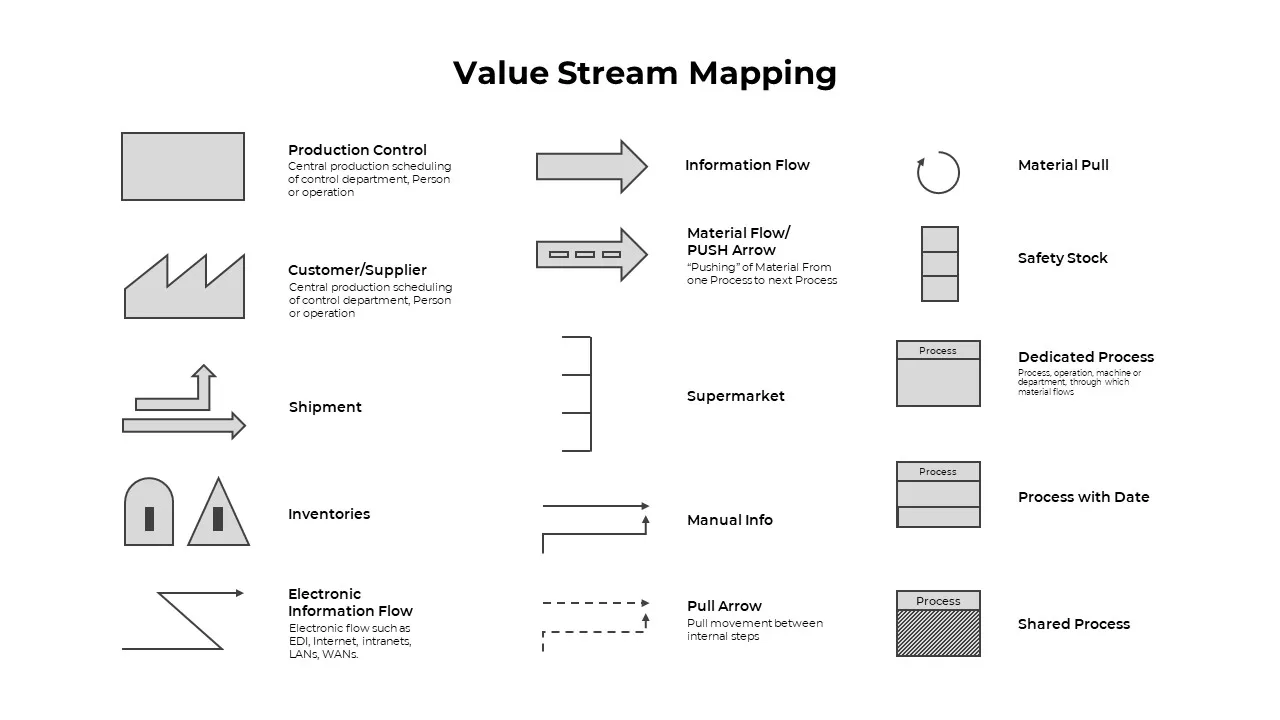
Value Stream Mapping Symbol Legend Template for PowerPoint & Google Slides
Charts
Free
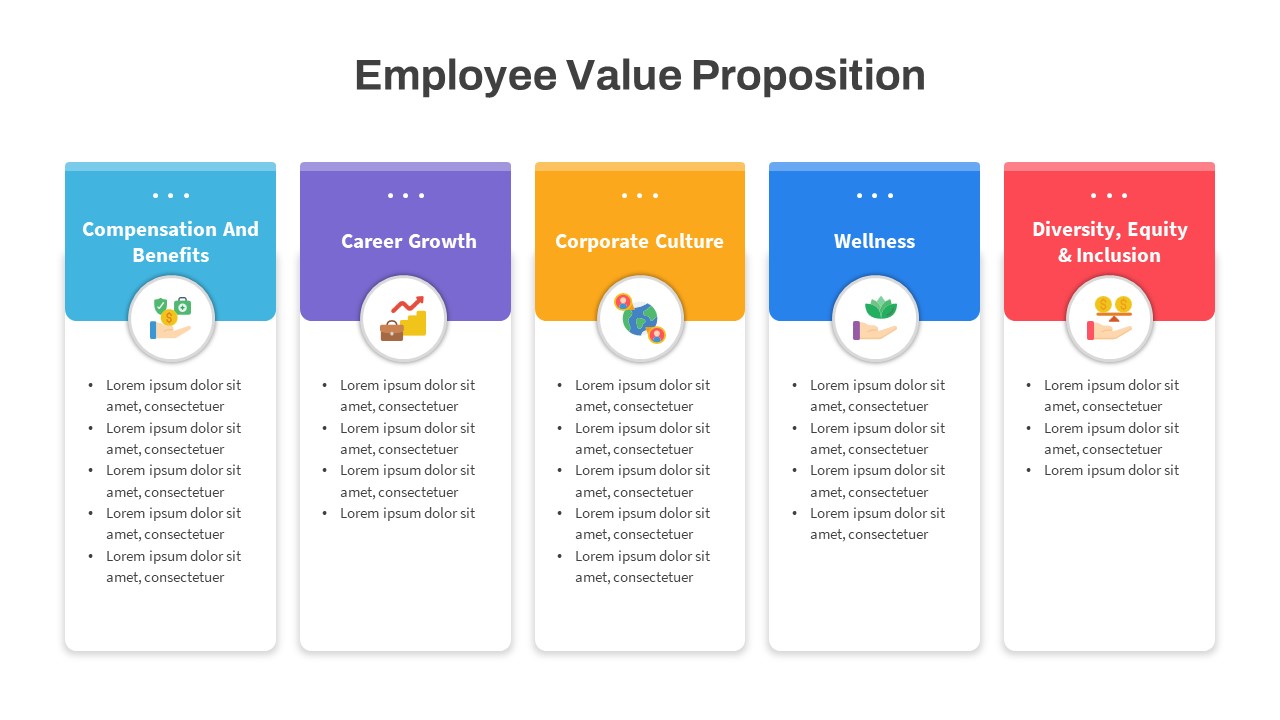
Employee Value Proposition Framework Template for PowerPoint & Google Slides
Recruitment
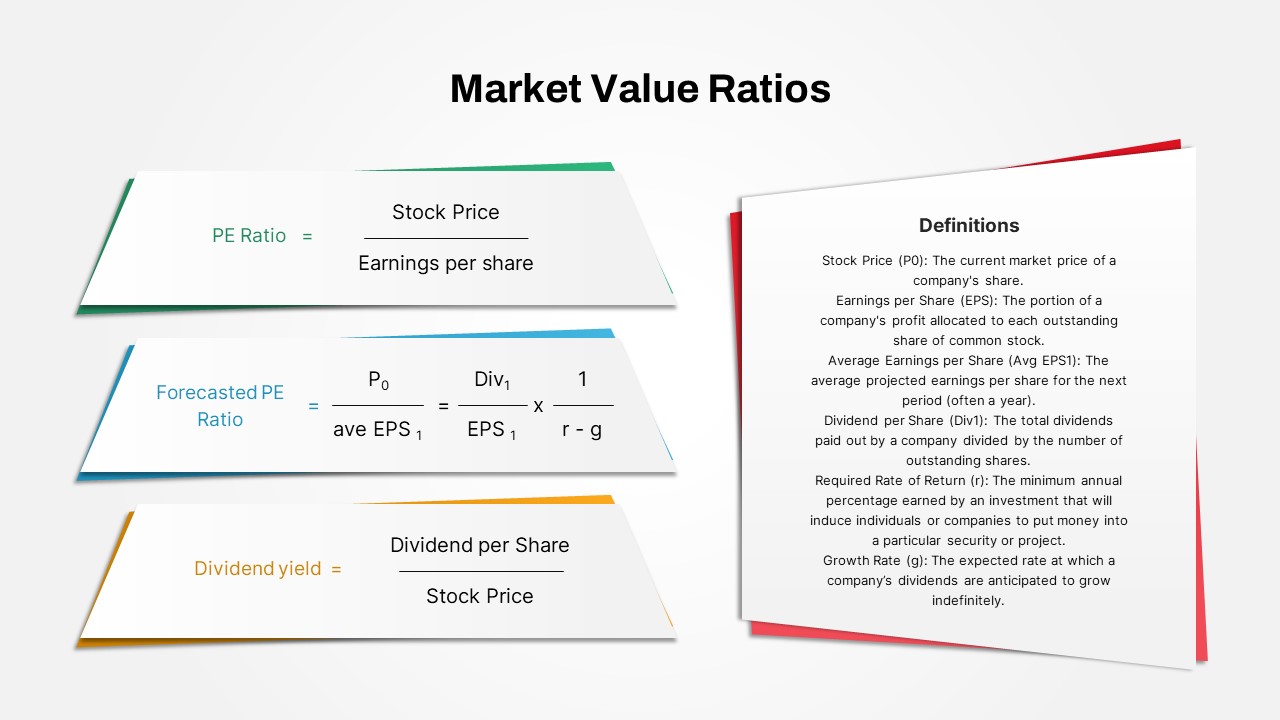
Market Value Ratios Formula Overview Template for PowerPoint & Google Slides
Business Report
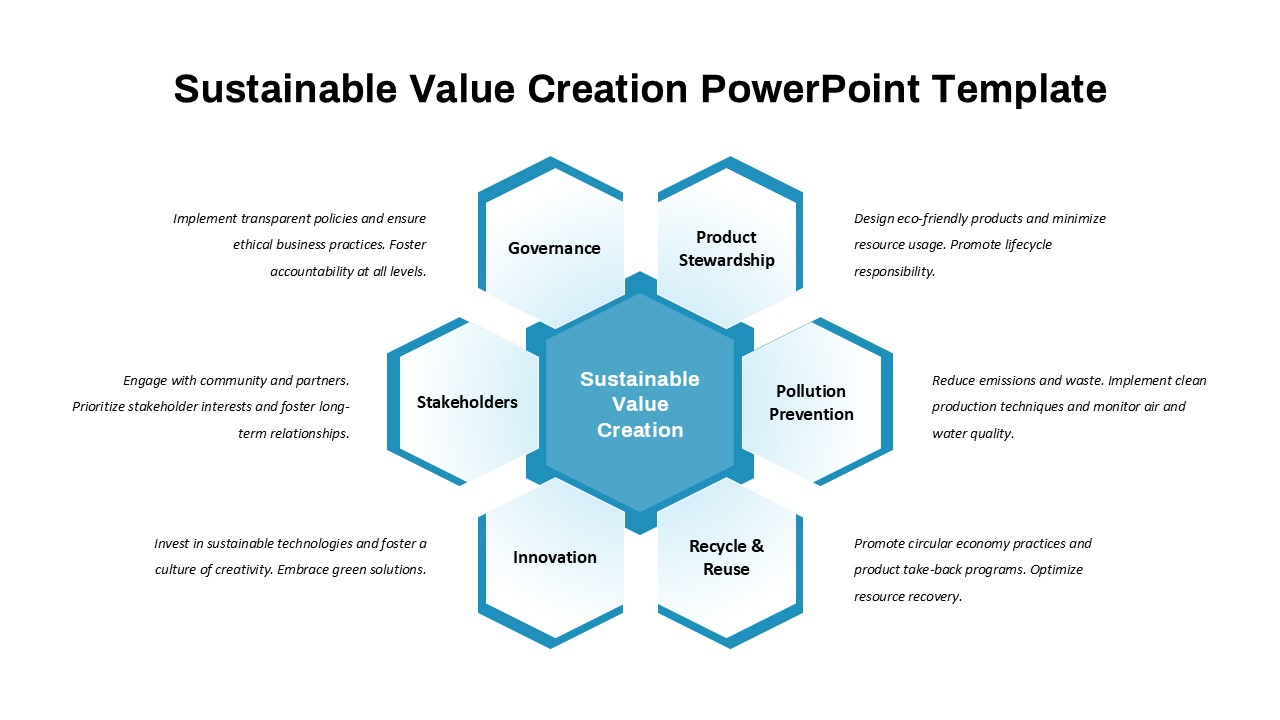
Sustainable Value Creation Framework Template for PowerPoint & Google Slides
Process
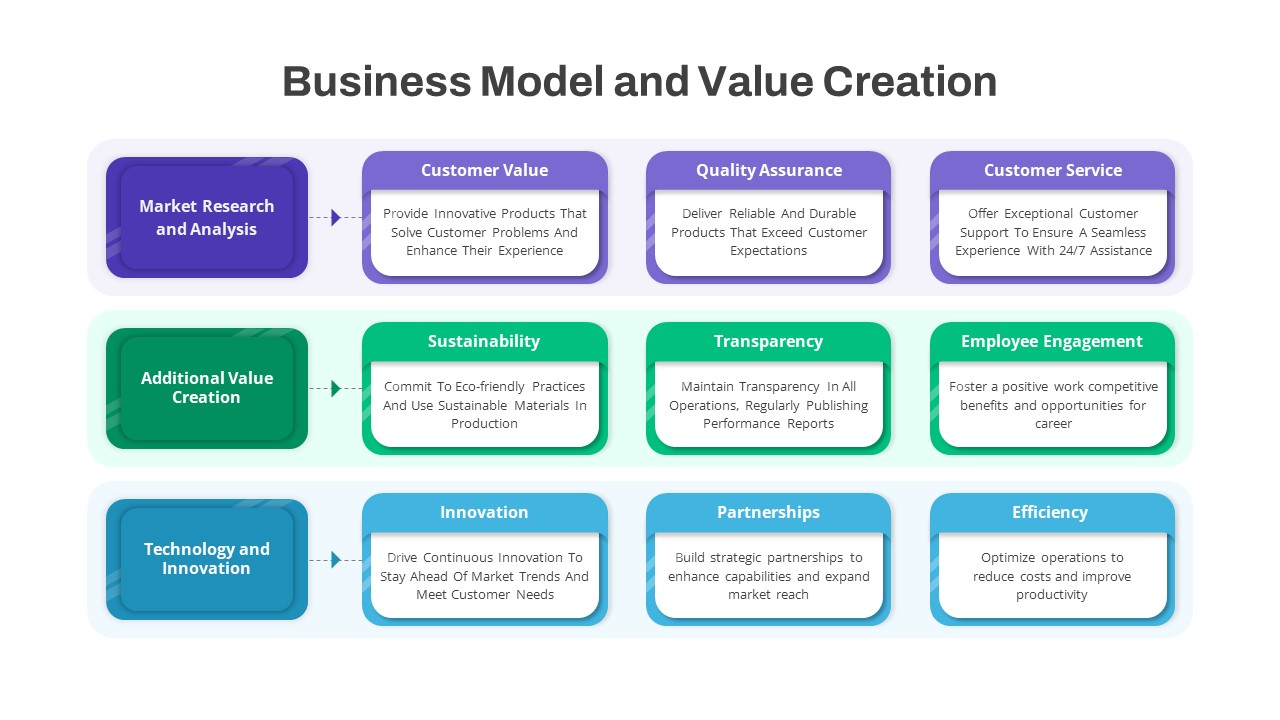
Business Model & Value Creation Template for PowerPoint & Google Slides
Process
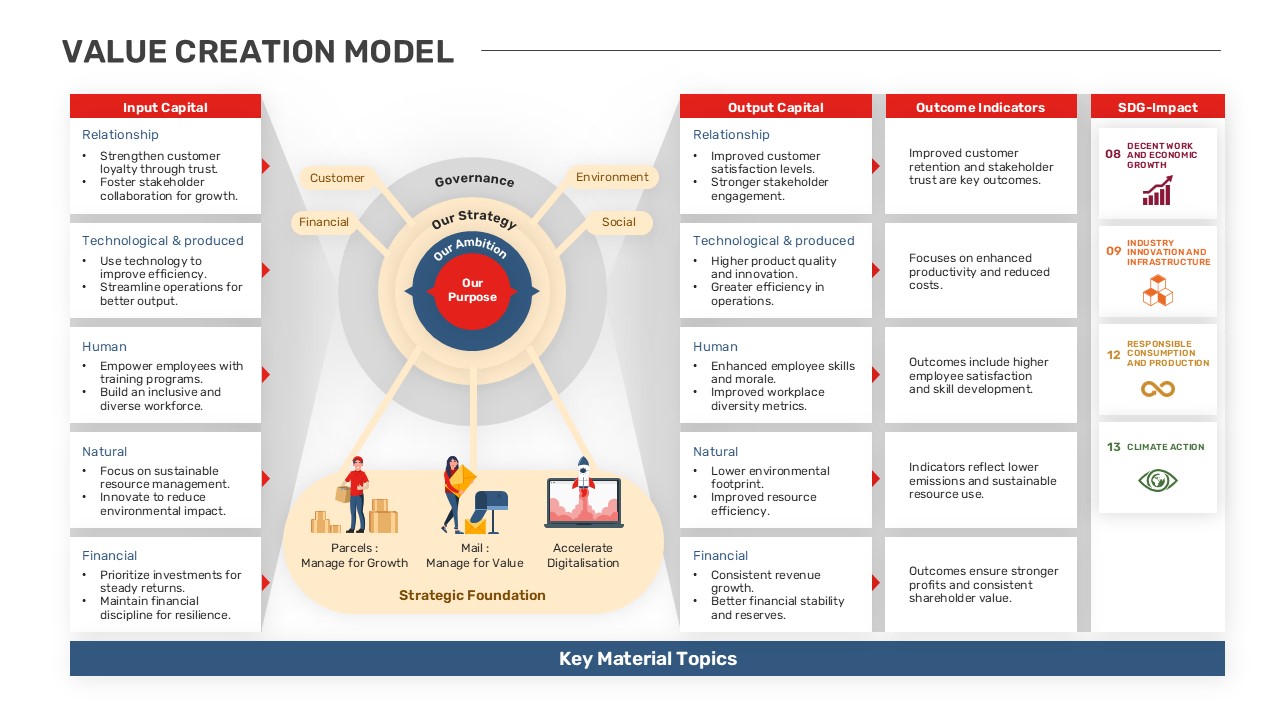
Comprehensive Value Creation Model Template for PowerPoint & Google Slides
Business Models
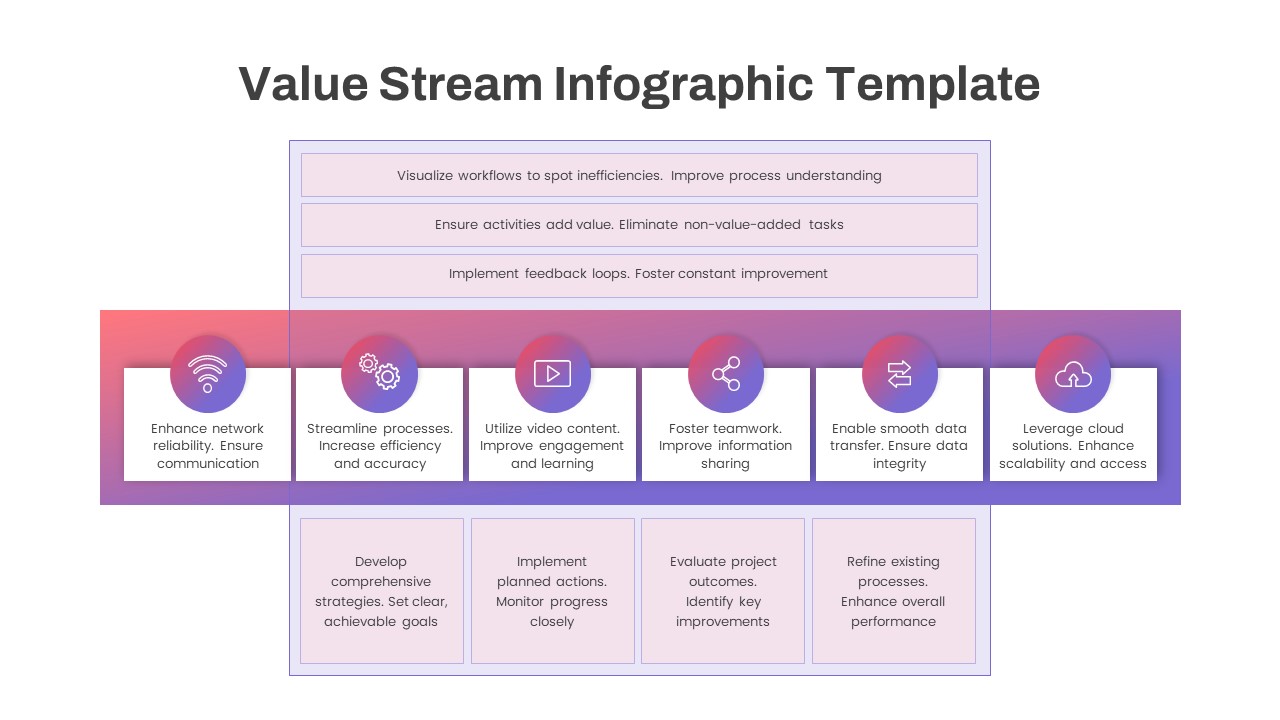
Comprehensive Value Stream Infographic Template for PowerPoint & Google Slides
Process
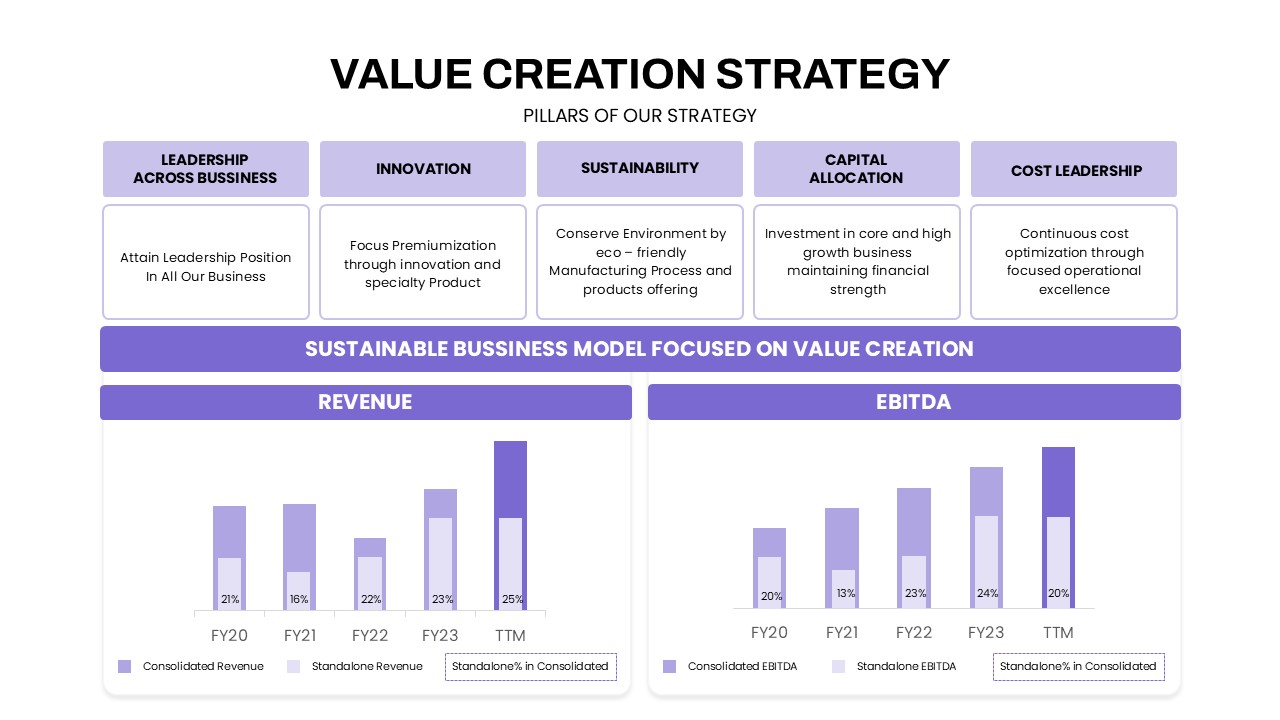
Value Creation Strategy Template for PowerPoint & Google Slides
Business Strategy
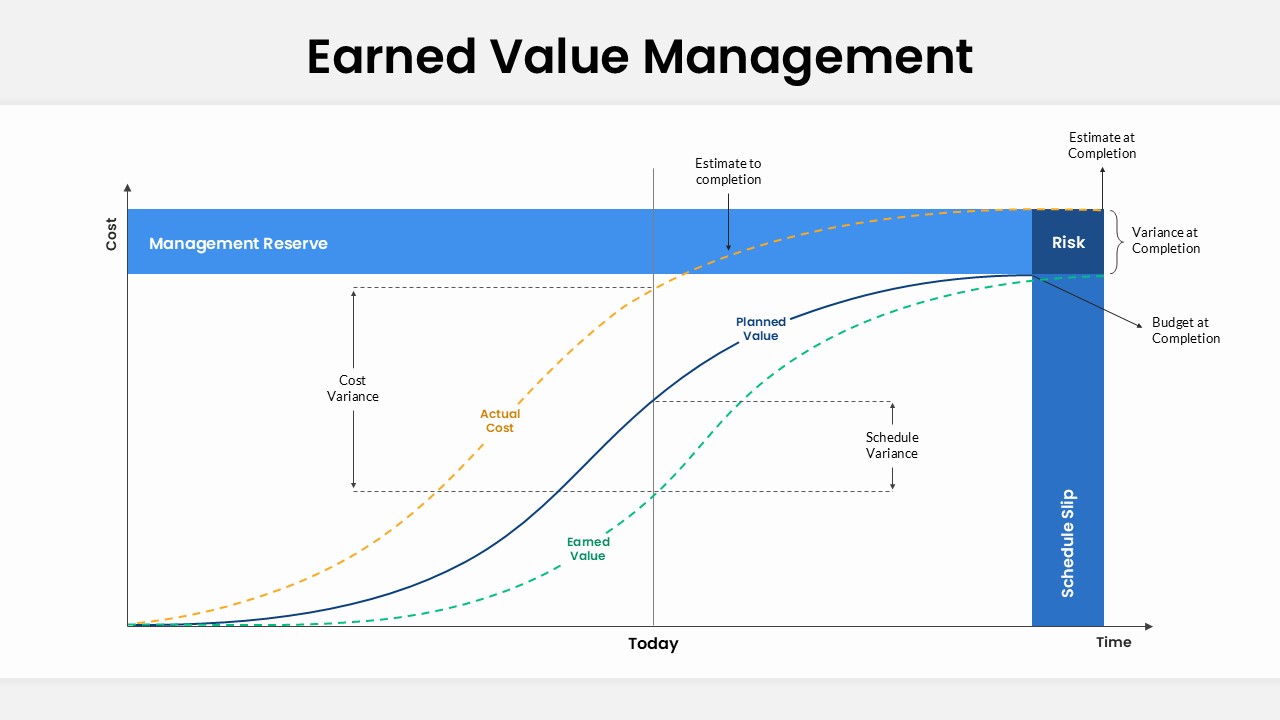
Earned Value Management (EVM) Slide Template for PowerPoint & Google Slides
Charts
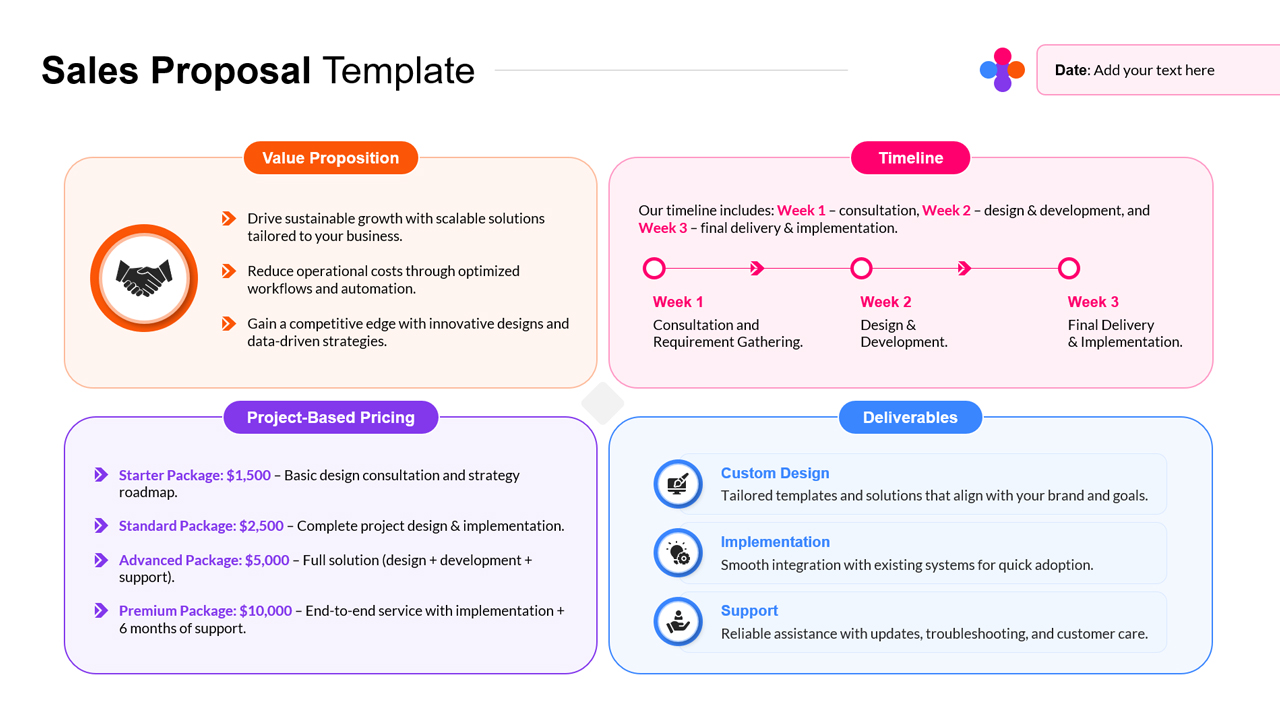
Sales Proposal Value Template for PowerPoint & Google Slides
Business Proposal
Value Stream Mapping for PowerPoint & Google Slides
Business
Value Discipline Model infographic for PowerPoint & Google Slides
Marketing
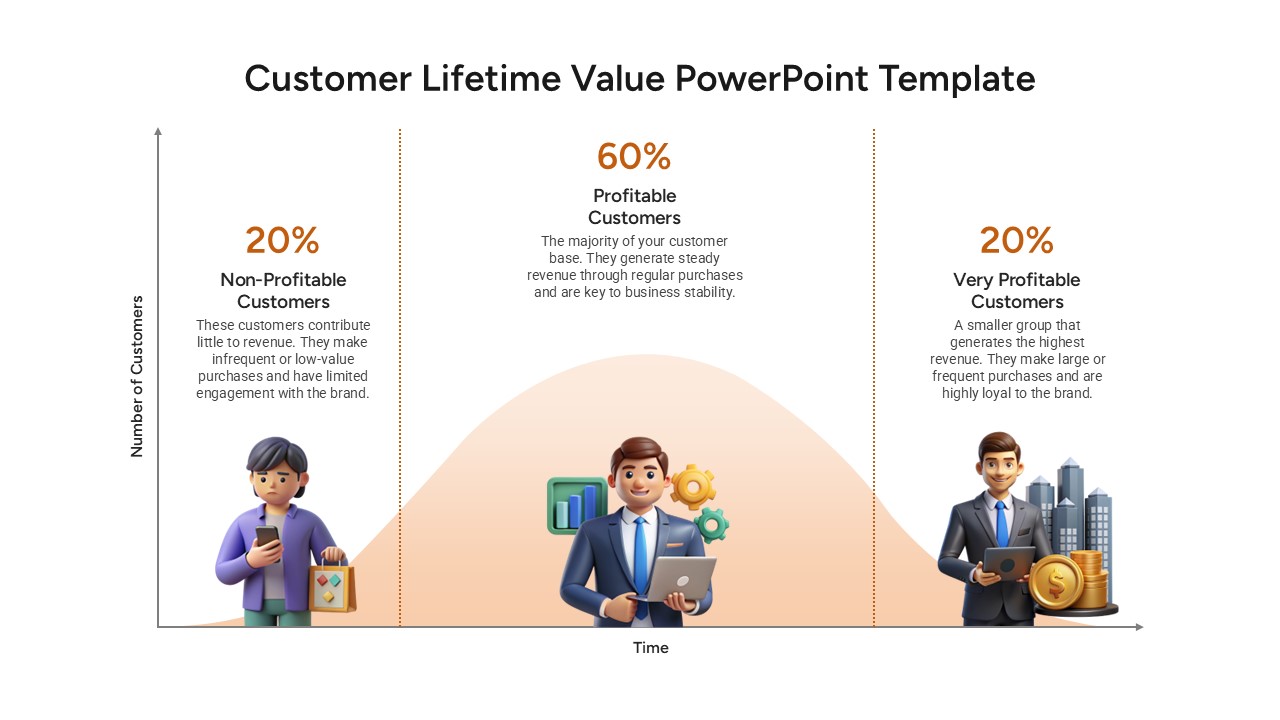
Customer Lifetime Value Analysis for PowerPoint & Google Slides
Customer Journey
Eight-Stage Circular Process Infographic Template for PowerPoint & Google Slides
Circular
Four-Stage Circular Process Flow Template for PowerPoint & Google Slides
Process
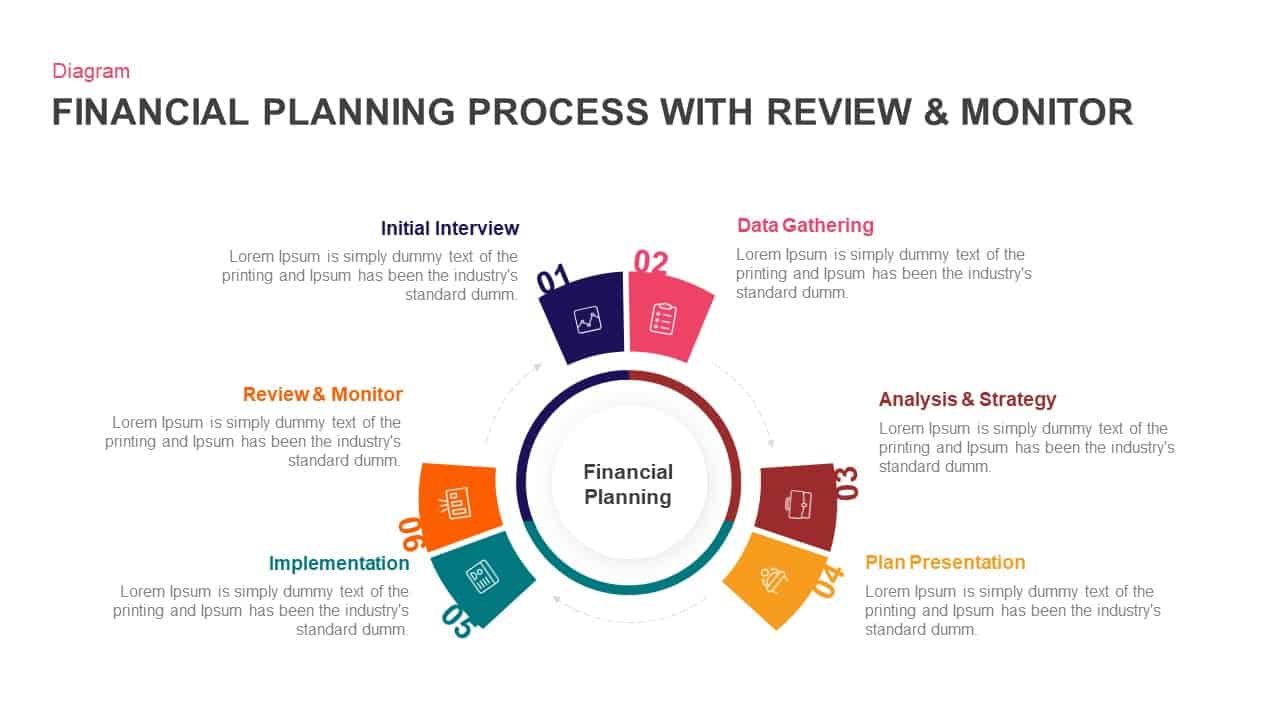
Financial Planning Circular Process Template for PowerPoint & Google Slides
Process
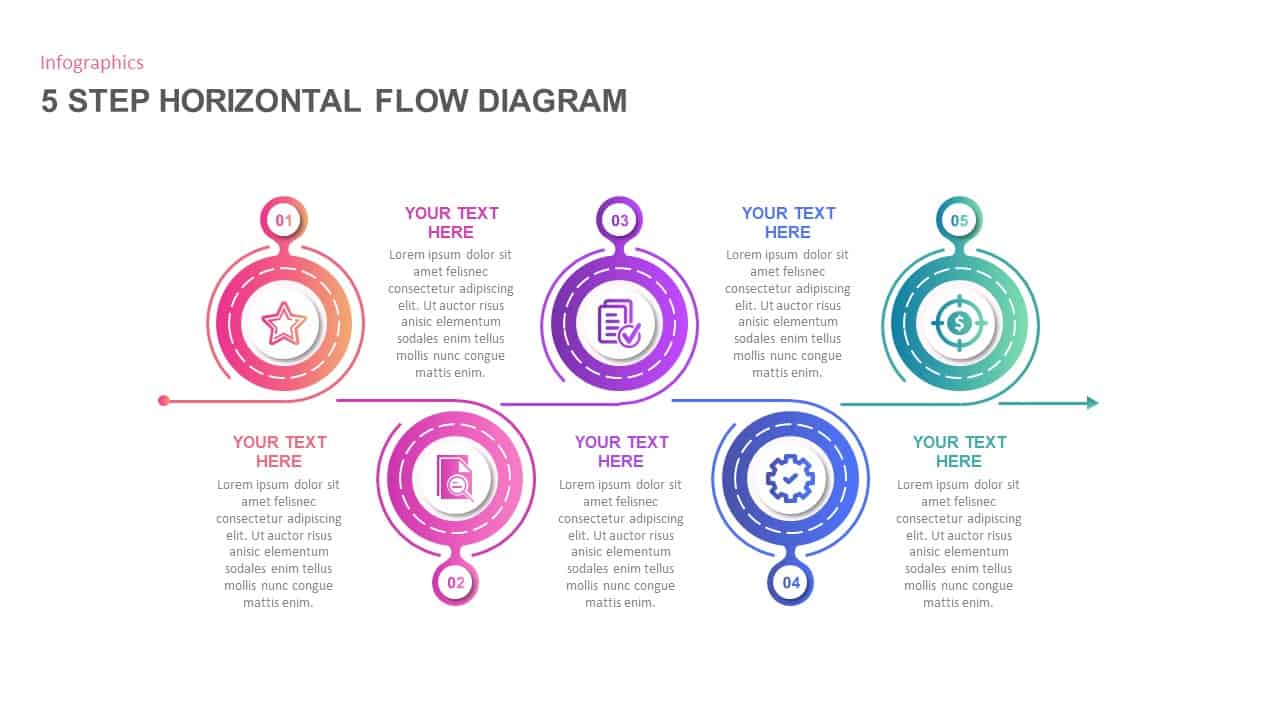
5-Step Circular Gradient Process Flow Template for PowerPoint & Google Slides
Process
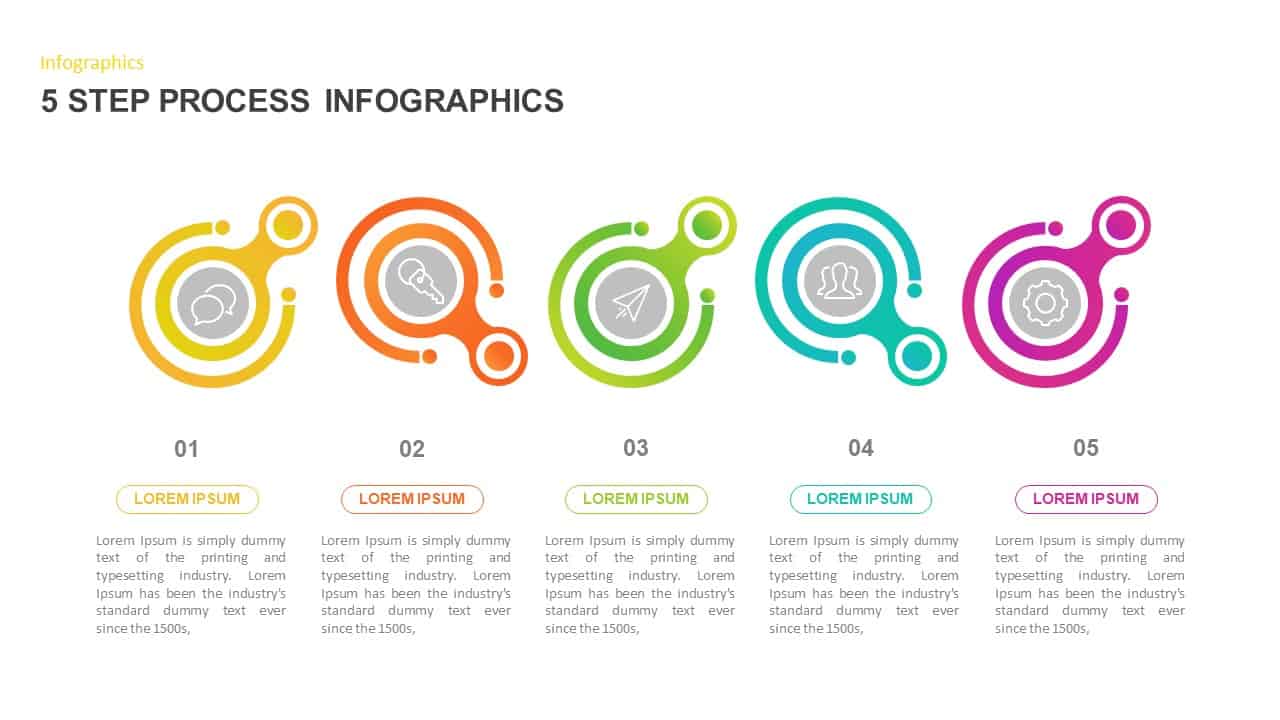
Colorful 5-Step Circular Process Template for PowerPoint & Google Slides
Process
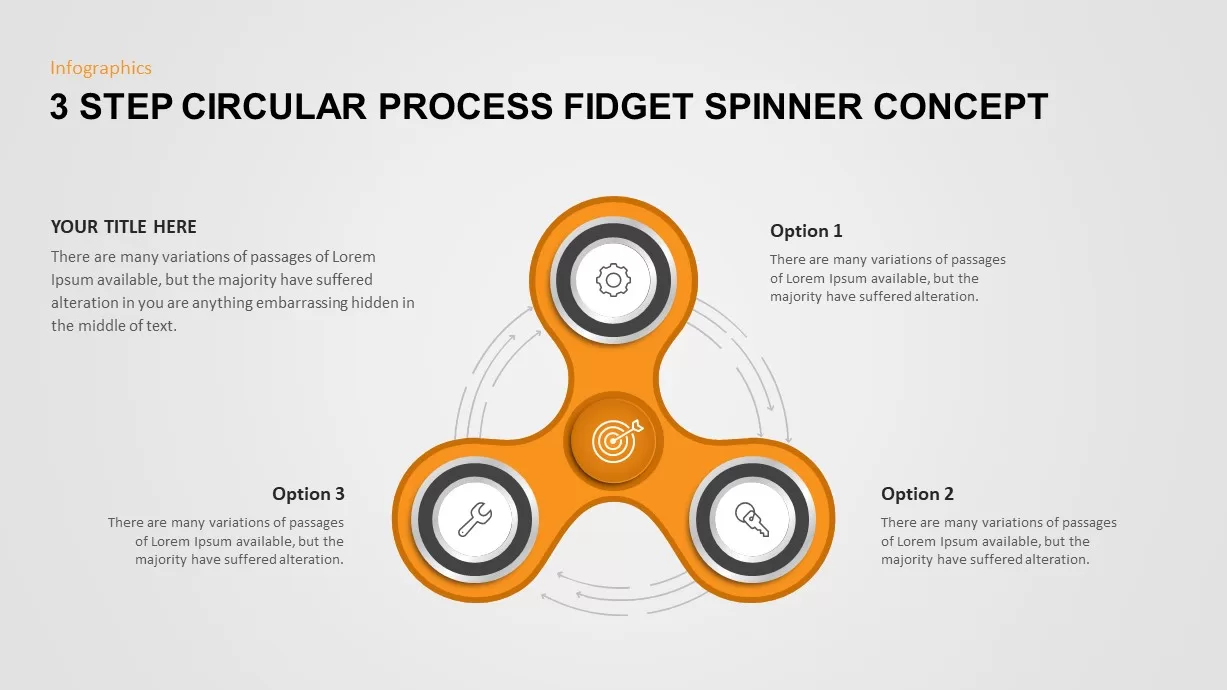
3 Step Circular Process Fidget Spinner Template for PowerPoint & Google Slides
Process
Four-Step Circular Process Infographics Template for PowerPoint & Google Slides
Circular
3 & 4 Step Circular Process Infographic Template for PowerPoint & Google Slides
Process
Circular Arrows Process Flow template for PowerPoint & Google Slides
Process
Circular Arrows Process Flow template for PowerPoint & Google Slides
Process
Circular Arrows Process Flow template for PowerPoint & Google Slides
Process
Ten Step Circular Process Infographic Template for PowerPoint & Google Slides
Process
Ten-Step Circular Process Infographic Template for PowerPoint & Google Slides
Circular
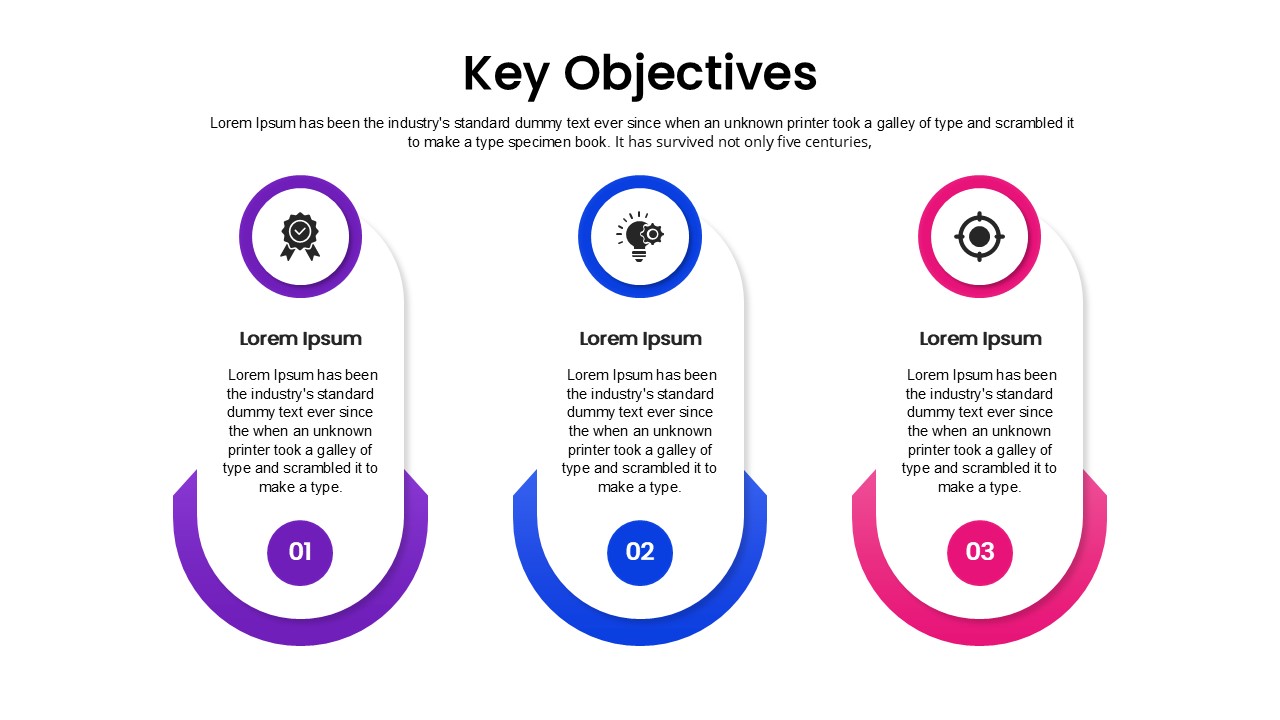
Key Objectives Circular Process template for PowerPoint & Google Slides
Business
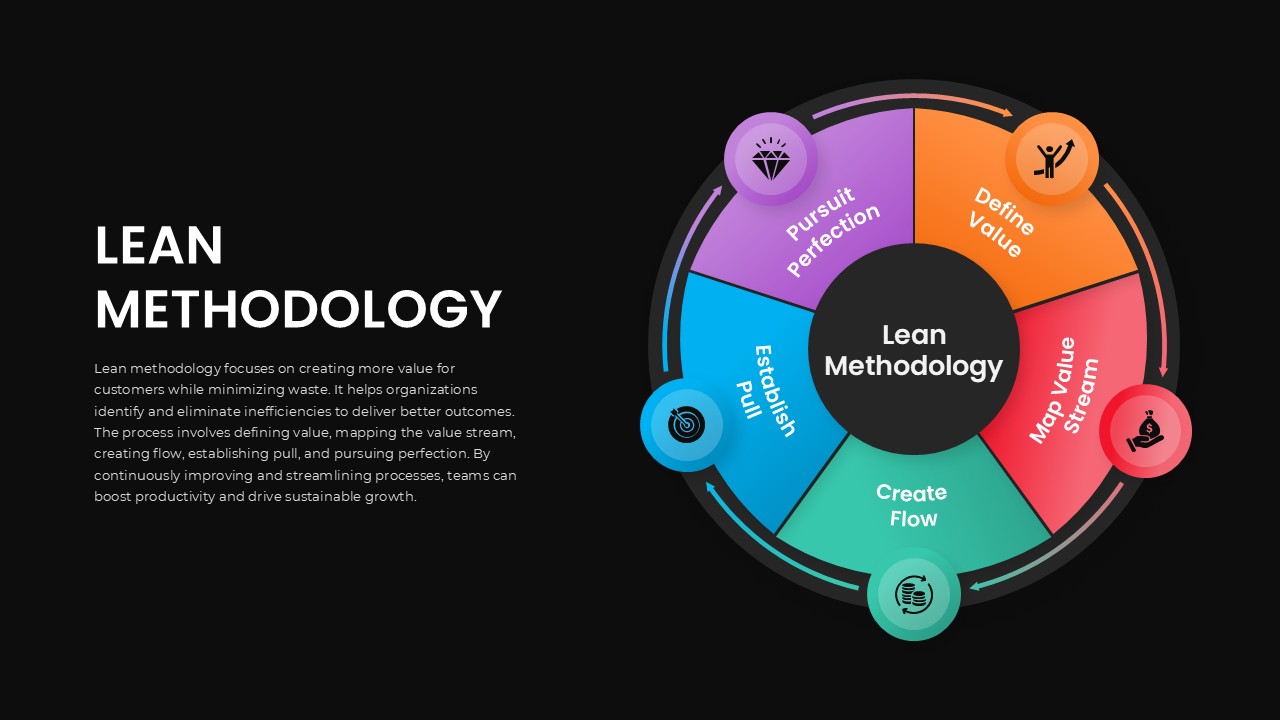
Lean Methodology Circular Process Template for PowerPoint & Google Slides
Process
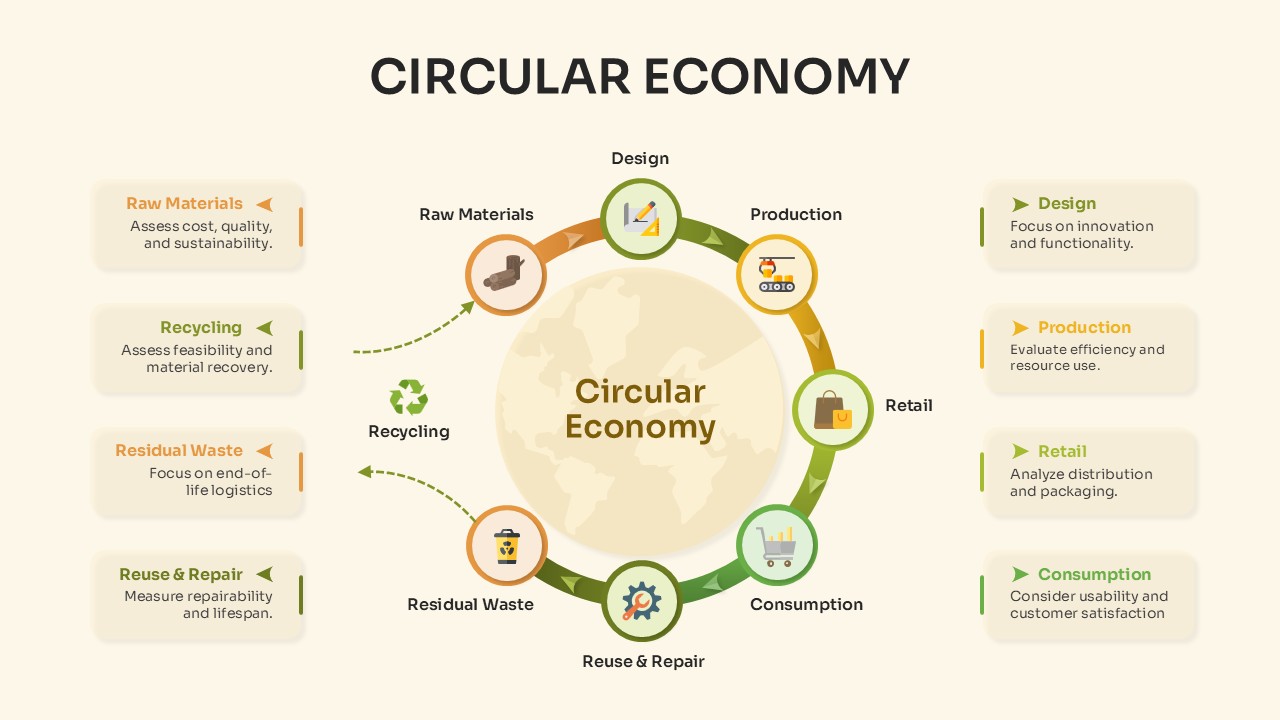
Circular Economy Process Overview Template for PowerPoint & Google Slides
Circular
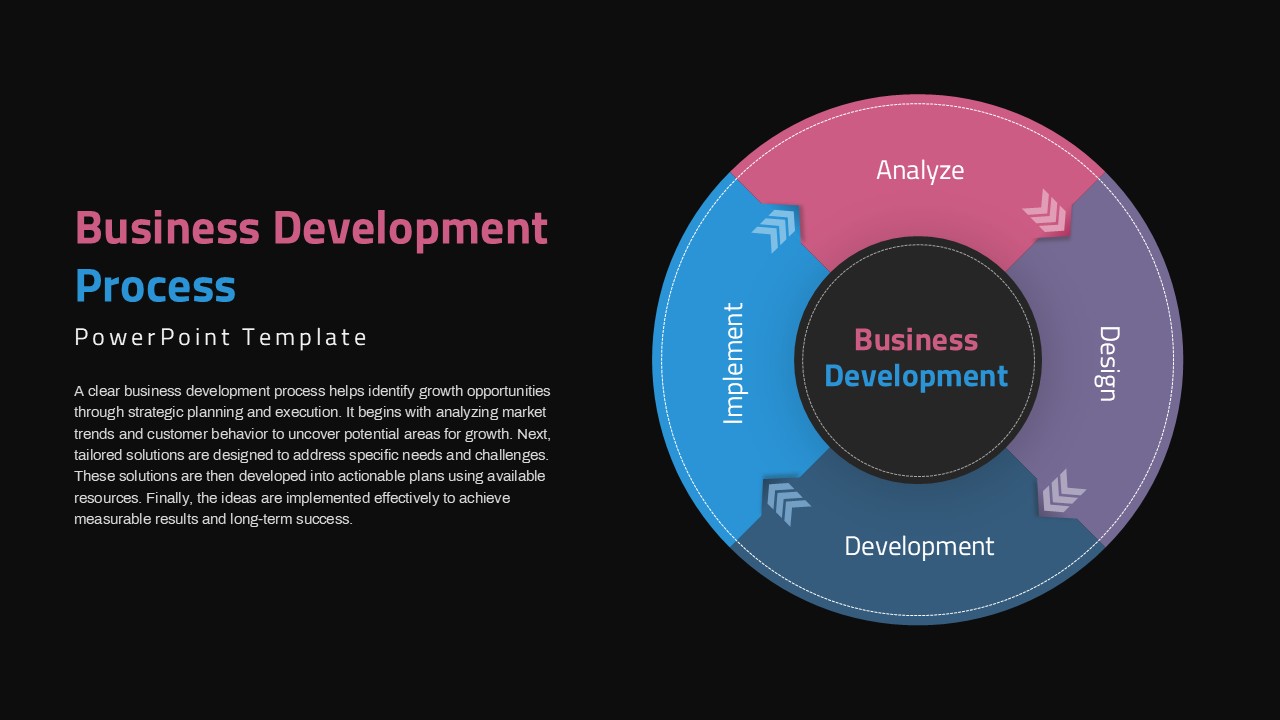
Circular Business Development Process Template for PowerPoint & Google Slides
Process
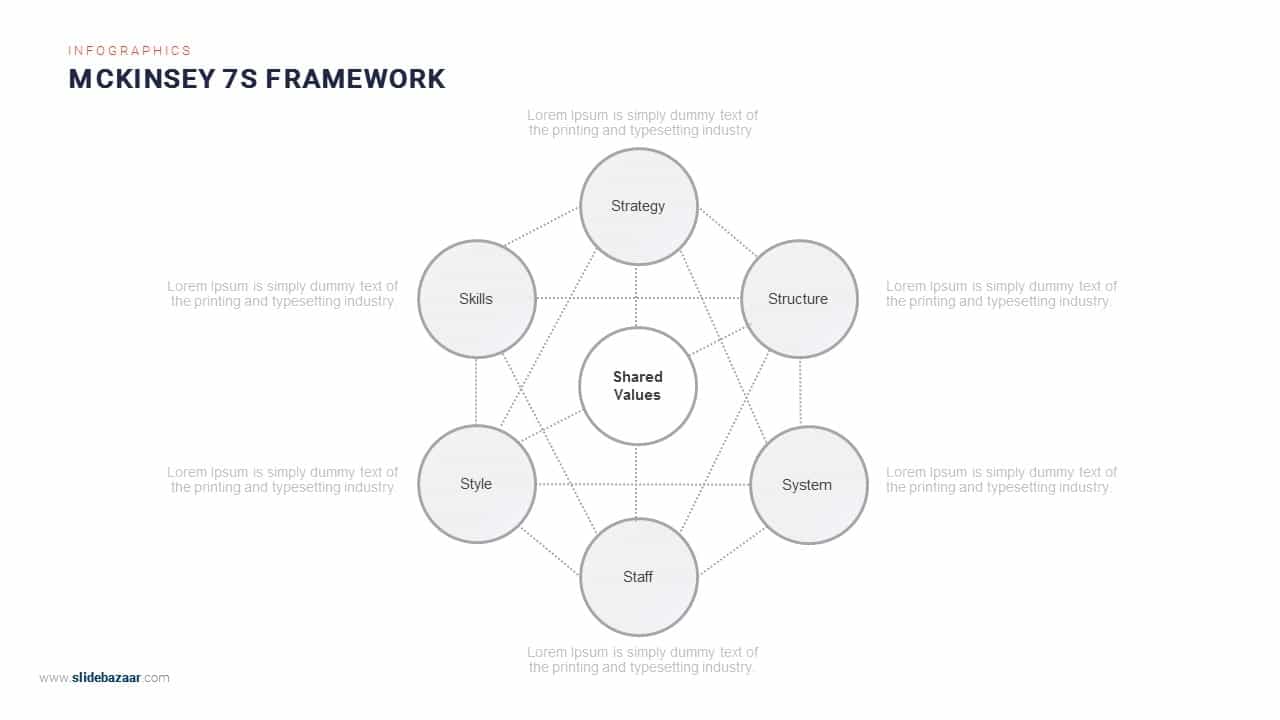
McKinsey 7S Framework Circular Diagram Template for PowerPoint & Google Slides
Circular
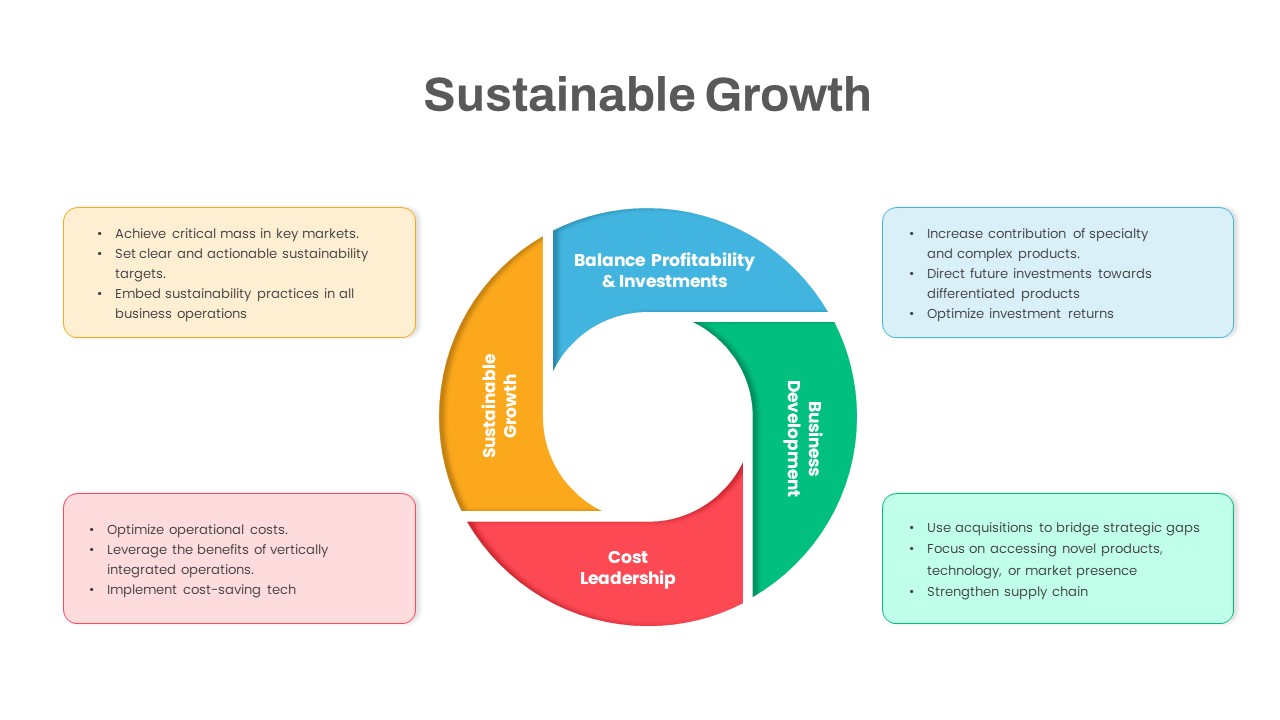
Sustainable Growth Circular Diagram Template for PowerPoint & Google Slides
Circular
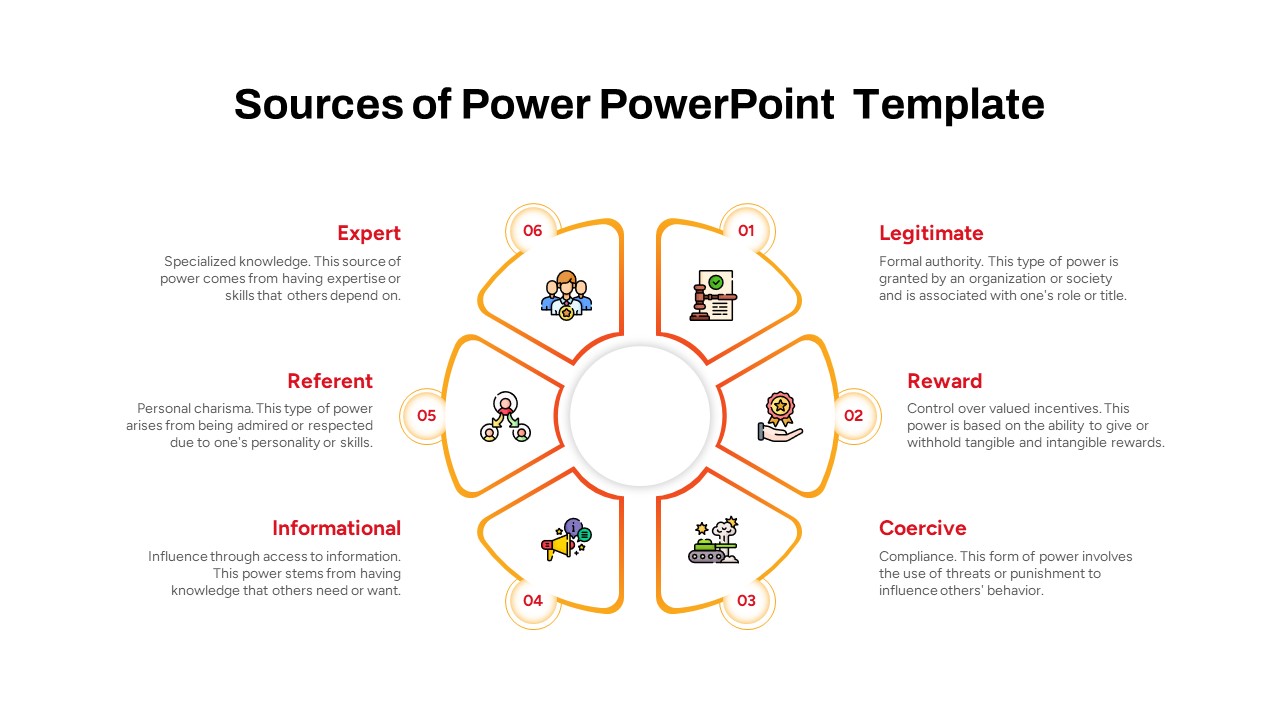
Sources of Power Circular Diagram Template for PowerPoint & Google Slides
Circular
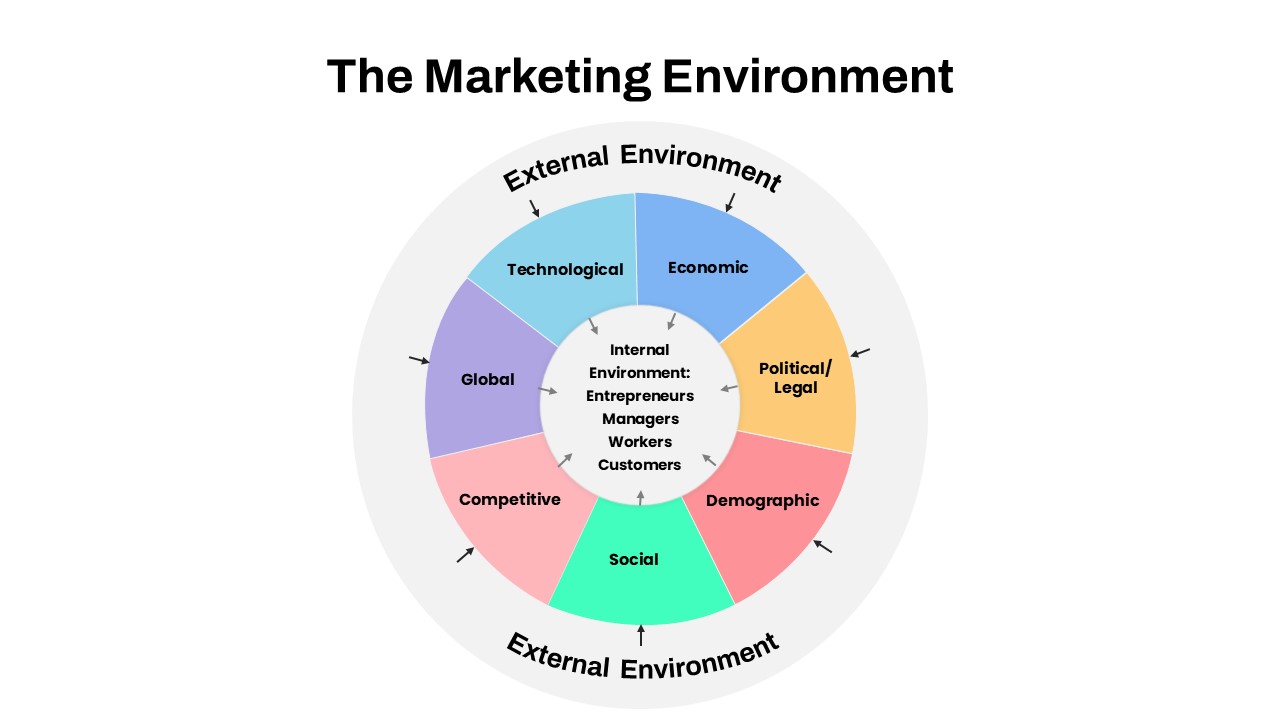
Marketing Environment Circular Diagram template for PowerPoint & Google Slides
Marketing
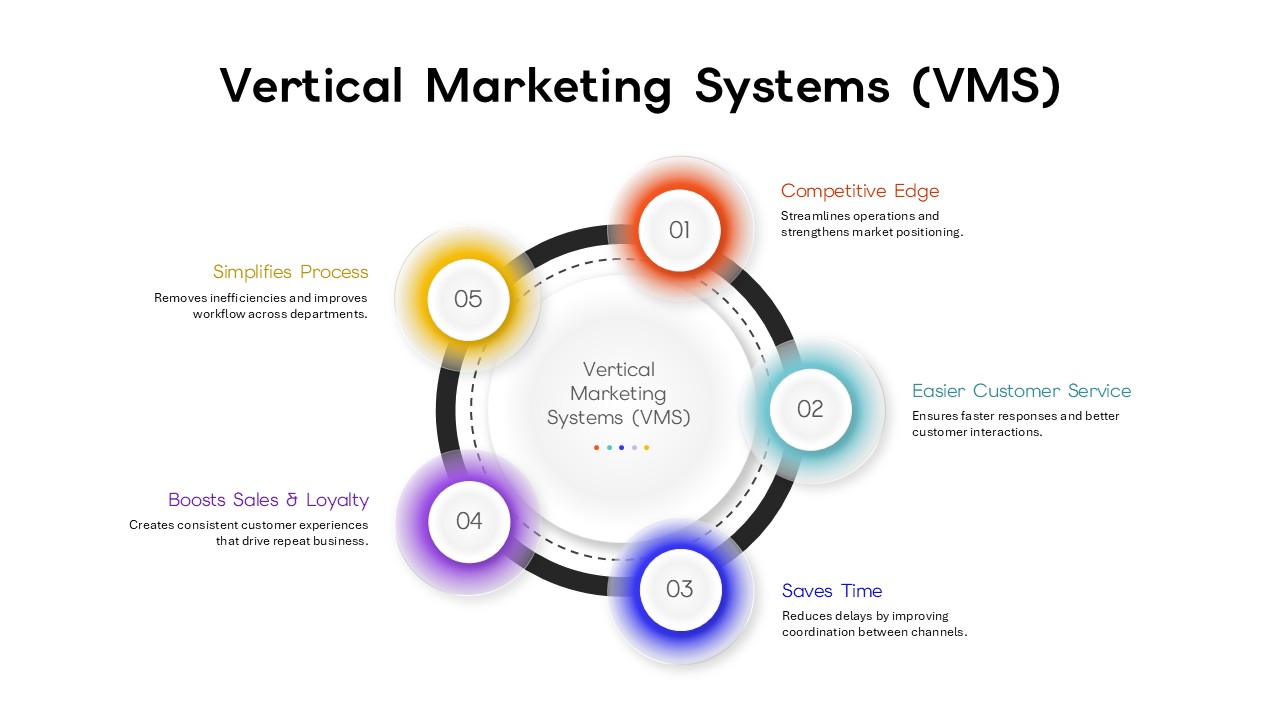
Vertical Marketing Systems (VMS) Circular Diagram Template for PowerPoint & Google Slides
Marketing