Team Gantt Chart Overview template for PowerPoint & Google Slides


Description
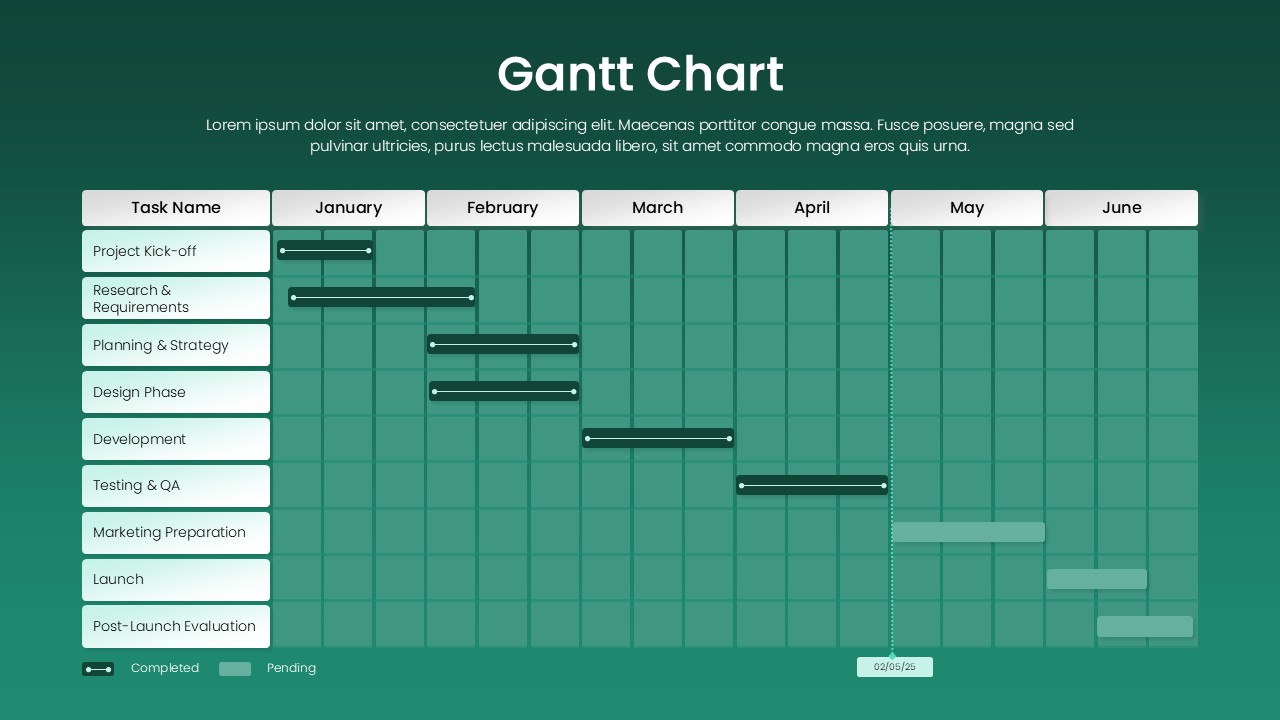
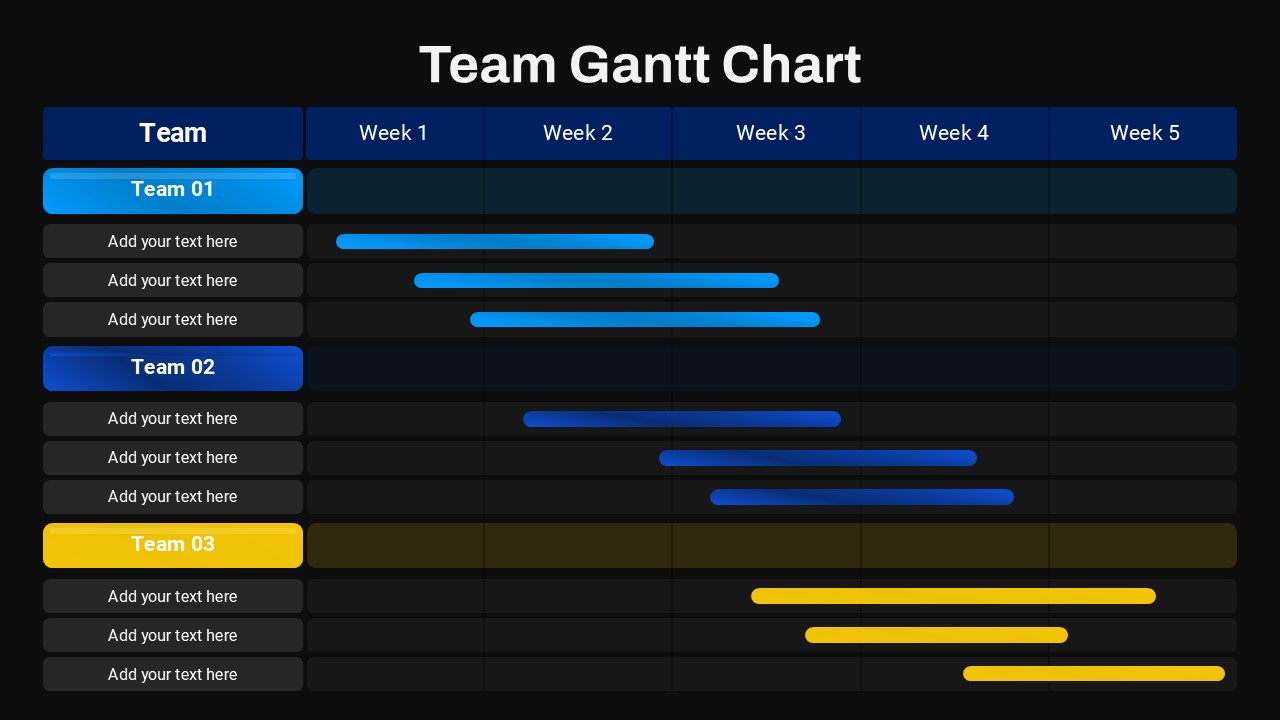
This Team Gantt Chart slide is an ideal tool for tracking project timelines, team assignments, and task progress. The clean, structured layout presents a timeline across five weeks, with color-coded bars that represent the tasks or phases for each team. Team 01, Team 02, and Team 03 are each allocated a unique color (blue, dark blue, and yellow), making it easy to differentiate the various tasks. The slide is fully customizable, allowing you to update text, adjust task durations, and modify the color scheme to align with your branding or project needs. The modern design features a clear title and neatly organized sections, ensuring that the information is presented in a visually appealing and accessible format.
Designed for project managers, team leaders, and executives, this slide ensures easy tracking of team progress, helping stakeholders to quickly assess project status and identify potential bottlenecks. With its straightforward design, this Gantt Chart template is highly effective for presentations, internal team meetings, or progress reports to stakeholders, making it a versatile tool in any project management toolkit.
Who is it for
This slide is perfect for project managers, team leaders, and executives in industries ranging from IT to marketing, education, and consulting. It serves as a powerful tool for visualizing project timelines and tracking team progress. Ideal for businesses, startups, and organizations that rely on project-based work, this template will also be valuable for consultants and individuals managing multiple teams.
Other Uses
Beyond project timelines, this Gantt Chart slide can be used to manage product development cycles, marketing campaign schedules, HR task allocation, or educational semester planning. It is versatile enough for use in progress updates, team alignment meetings, project review sessions, and even personal project management.
Login to download this file

Item ID
SB05404
Related Templates

Static Gantt Chart Overview template for PowerPoint & Google Slides
Project Status
Free Professional Gantt Chart Pack – 4 Slides Template for PowerPoint & Google Slides
Gantt Chart
Free
Creative Dynamic Gantt Chart Timeline Template for PowerPoint & Google Slides
Timeline

Fully Editable Gantt Chart Timeline template for PowerPoint & Google Slides
Gantt Chart

Product Roadmap Gantt Chart Timeline template for PowerPoint & Google Slides
Gantt Chart
Project Gantt Chart template for PowerPoint & Google Slides
Gantt Chart
Interactive Project Gantt Chart Timeline Template for PowerPoint & Google Slides
Gantt Chart
Annual Project Gantt Chart Timeline Template for PowerPoint & Google Slides
Gantt Chart
Project Gantt Chart Template for PowerPoint & Google Slides
Gantt Chart
Overlapping Timeline Gantt Chart Diagram Template for PowerPoint & Google Slides
Timeline
Project Tracker Timeline Gantt Chart Template for PowerPoint & Google Slides
Project Status
Baseline vs Actual Gantt Chart Template for PowerPoint & Google Slides
Gantt Chart
Weekly Gantt Chart Project Timeline Template for PowerPoint & Google Slides
Gantt Chart
Event Planning Gantt Chart template for PowerPoint & Google Slides
Business
Color-Coded Gantt Chart template for PowerPoint & Google Slides
Business
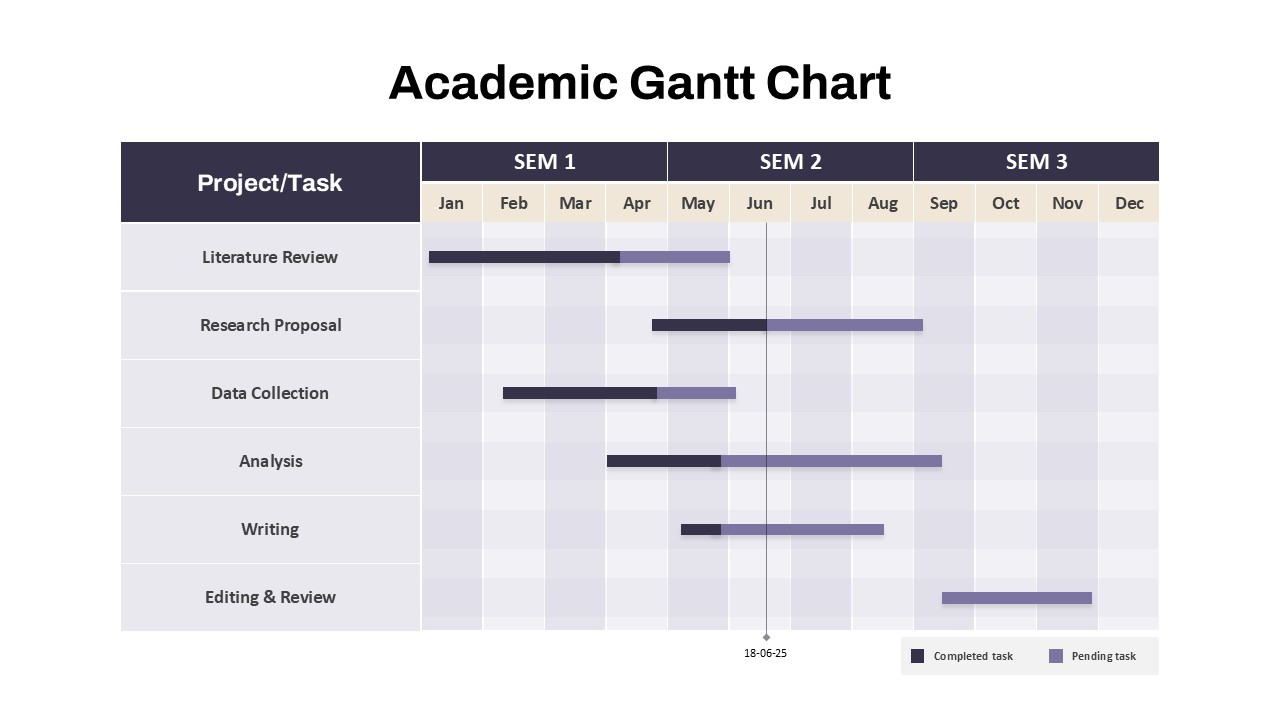
Academic Gantt Chart template for PowerPoint & Google Slides
Business
Stacked Gantt Chart Timeline Slide Template for PowerPoint & Google Slides
Gantt Chart
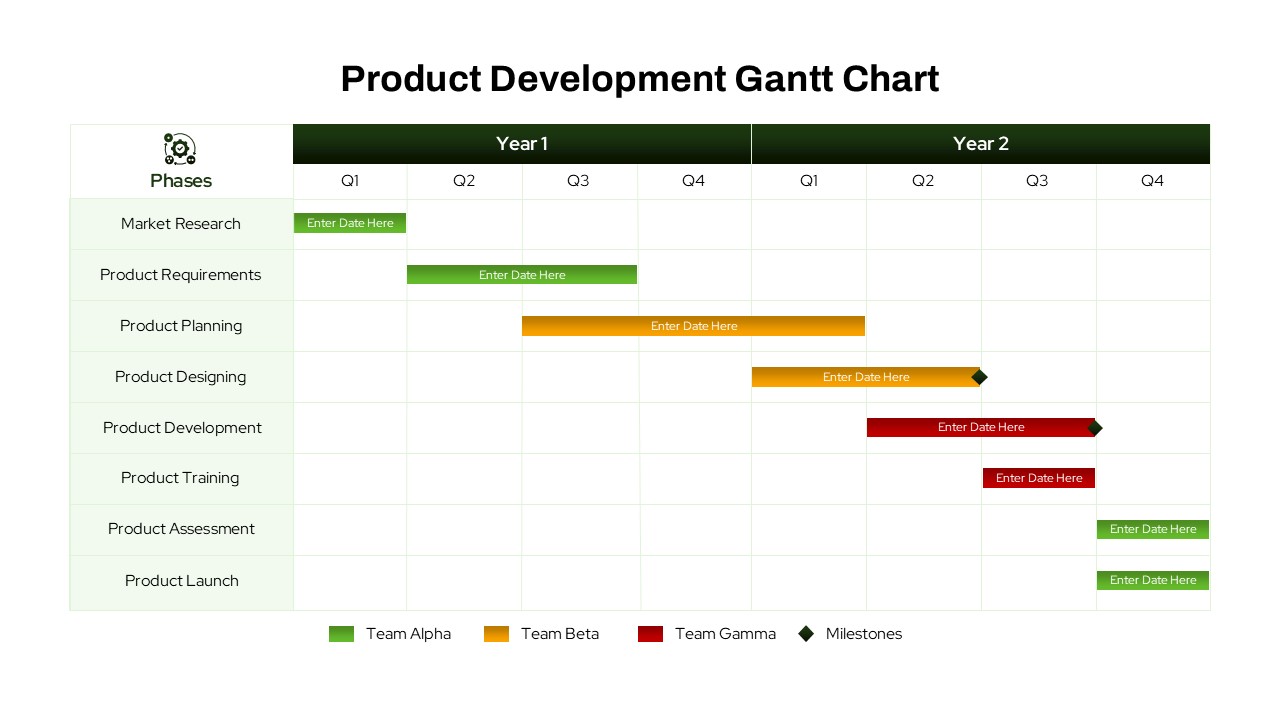
Product Development Gantt Chart template for PowerPoint & Google Slides
Gantt Chart
Bar Gantt Chart Template for PowerPoint & Google Slides
Gantt Chart
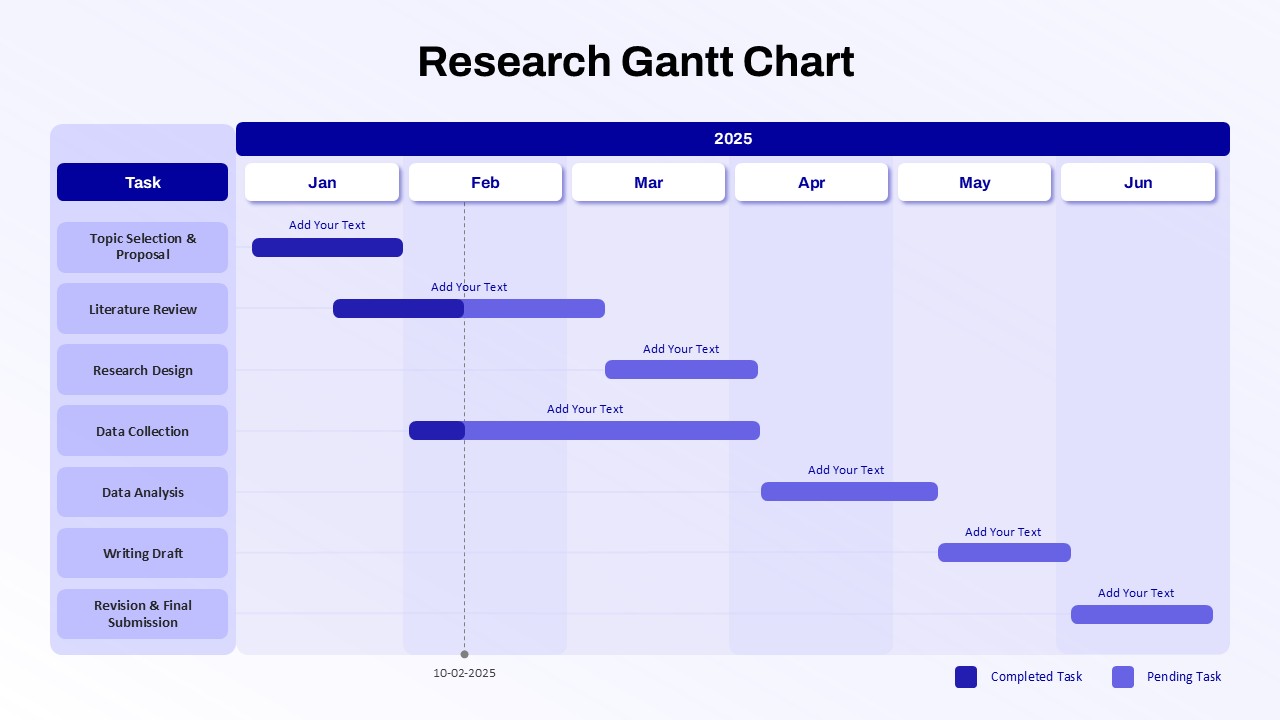
Research Gantt Chart template for PowerPoint & Google Slides
Project
Project Gantt Chart Template for PowerPoint & Google Slides
Gantt Chart
Green Gantt Chart Template for PowerPoint & Google Slides
Gantt Chart
Project Timeline Gantt Chart Template for PowerPoint & Google Slides
Gantt Chart
Colorful Annual Gantt Chart Project Planner Template for PowerPoint & Google Slides
Gantt Chart
Weekly Gantt Chart with Milestones Template for PowerPoint & Google Slides
Gantt Chart
7 Step 6 Month Gantt Chart Timeline Template for PowerPoint & Google Slides
Gantt Chart
Yearly Gantt Chart with Presentation Template for PowerPoint & Google Slides
Gantt Chart
Quarterly Gantt Chart with Today Marker Template for PowerPoint & Google Slides
Gantt Chart
Colorful Annual Gantt Chart Timeline Template for PowerPoint & Google Slides
Gantt Chart
Half Year Gantt Chart Templat for PowerPoint & Google Slides
Gantt Chart
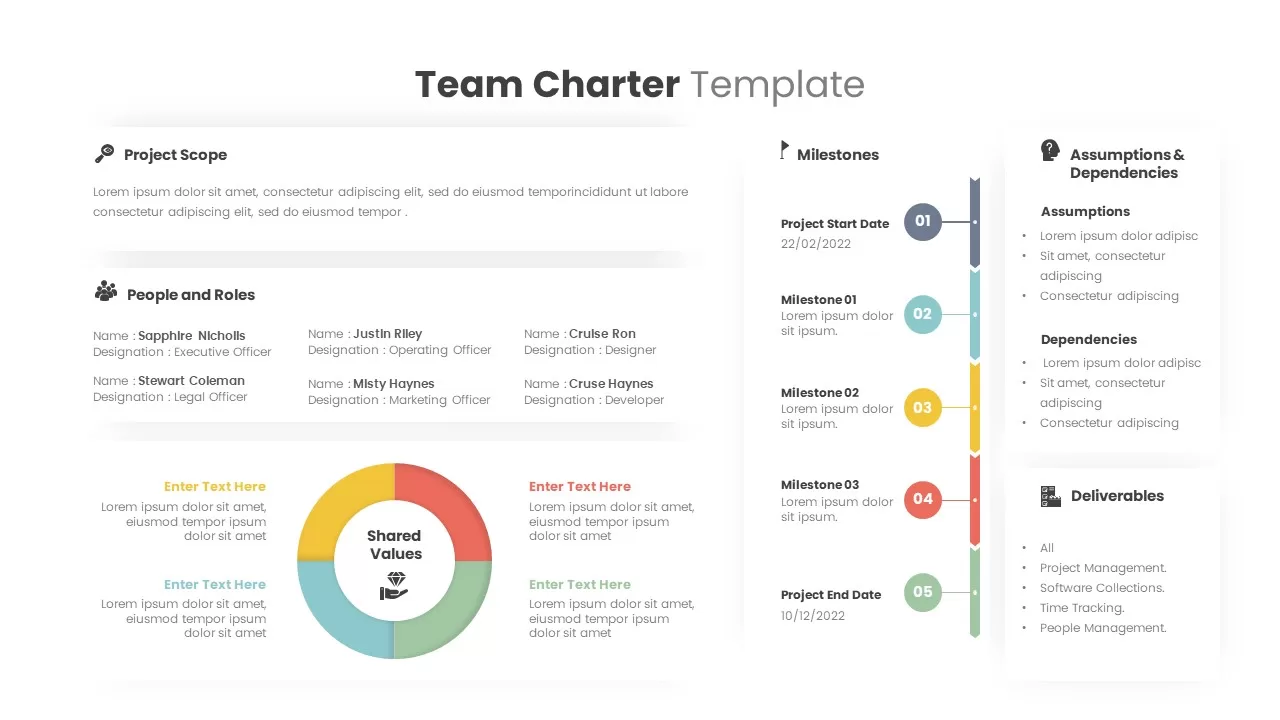
Team Charter Overview template for PowerPoint & Google Slides
Business Plan
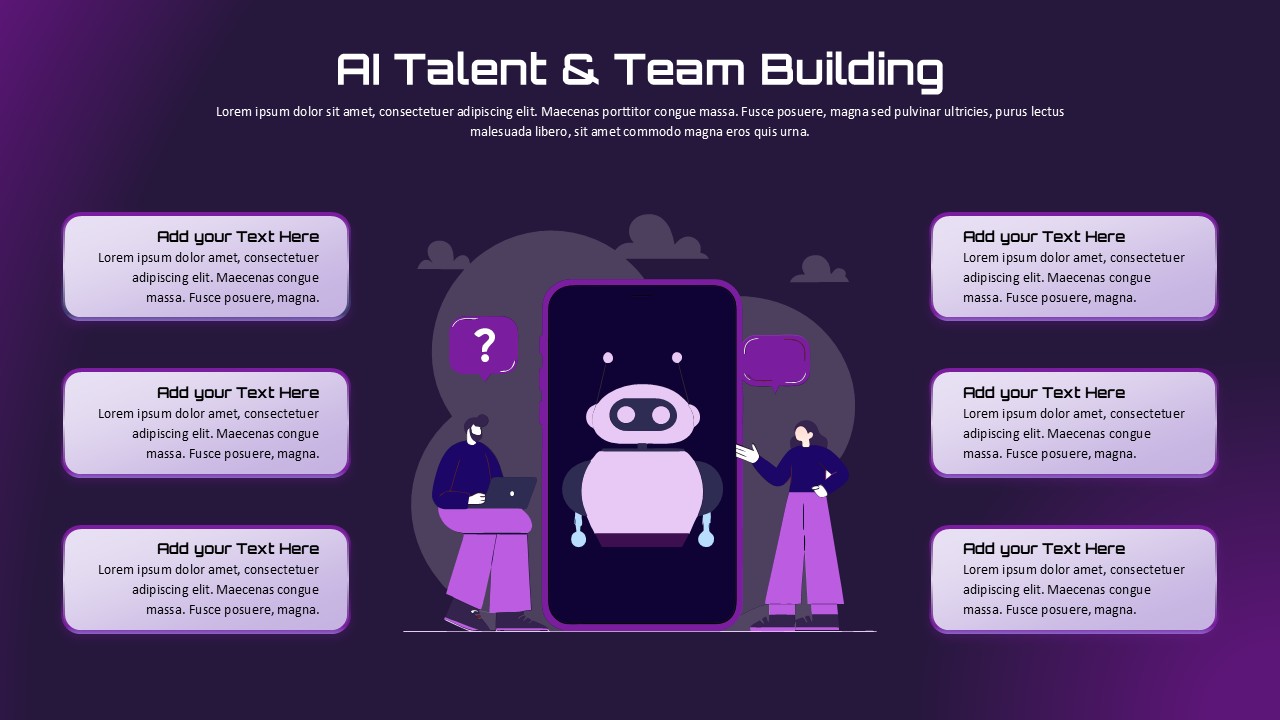
AI Talent & Team Building Overview template for PowerPoint & Google Slides
AI
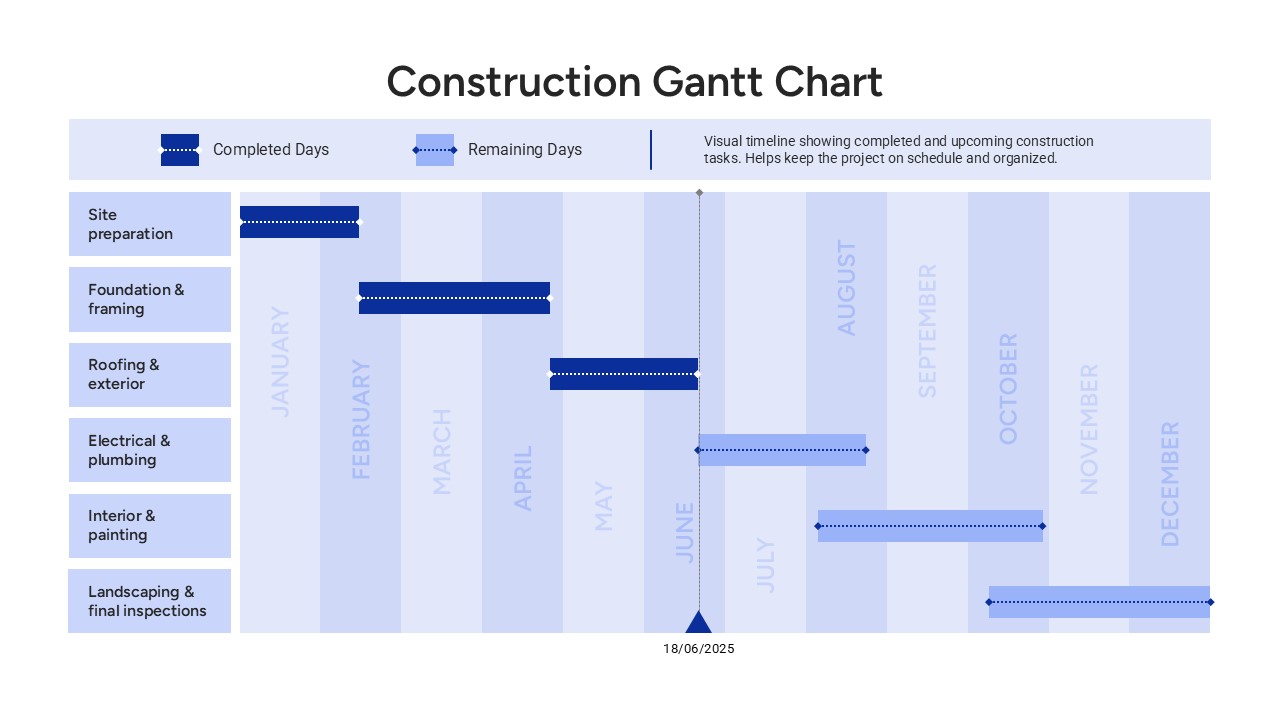
Construction Gantt Chart Template
Gantt Chart
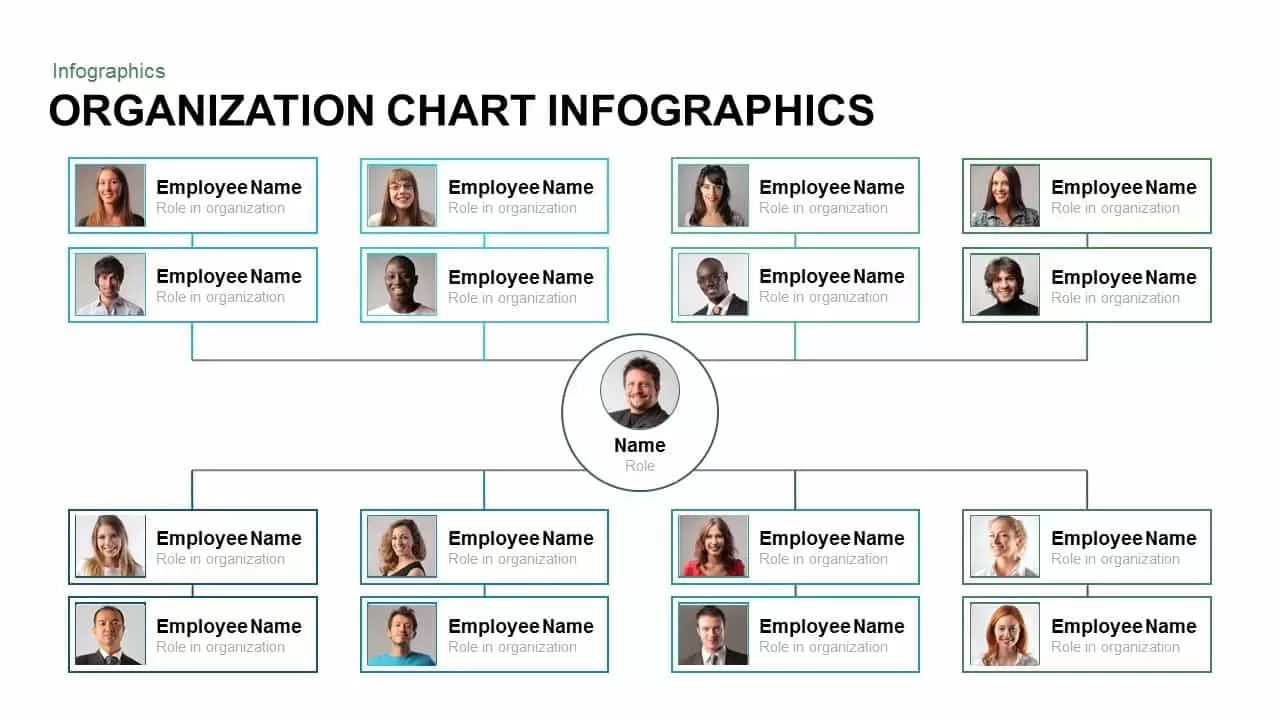
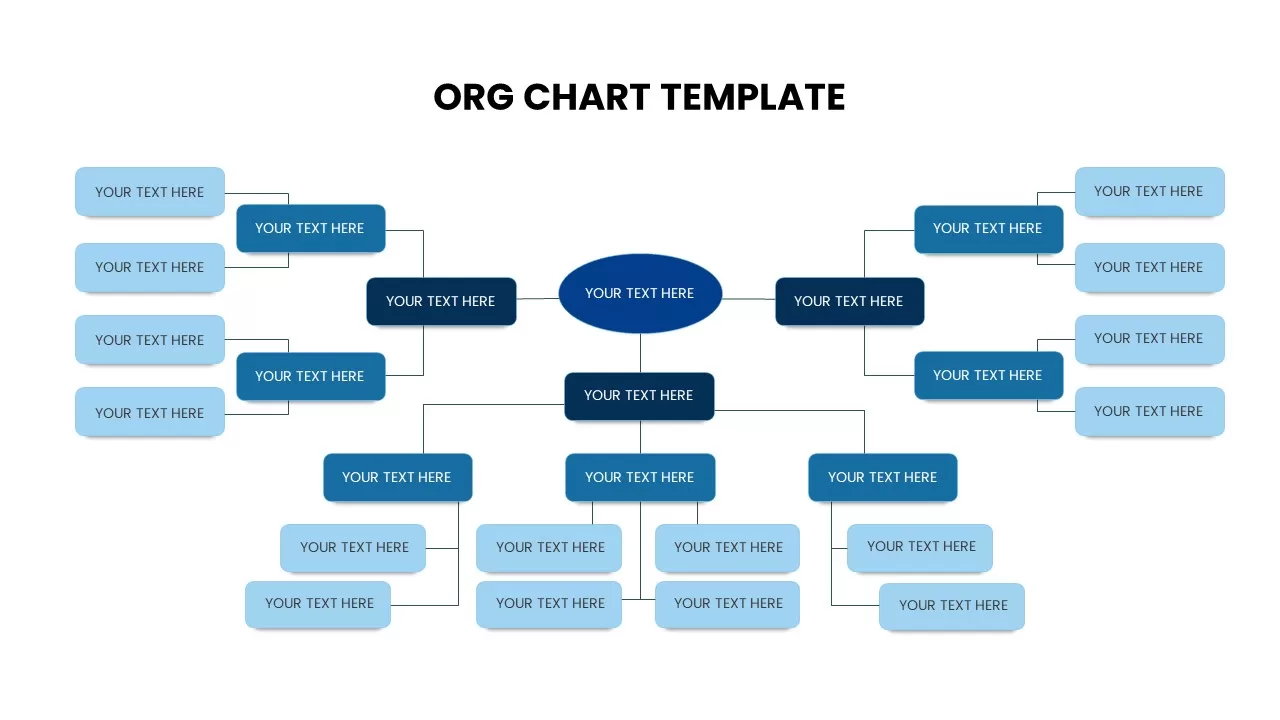
Organization Chart Overview template for PowerPoint & Google Slides
Org Chart
Comparison Chart Overview template for PowerPoint & Google Slides
Comparison Chart
Organizational Chart Overview template for PowerPoint & Google Slides
Org Chart
Technical Skills Donut Chart Overview Template for PowerPoint & Google Slides
HR
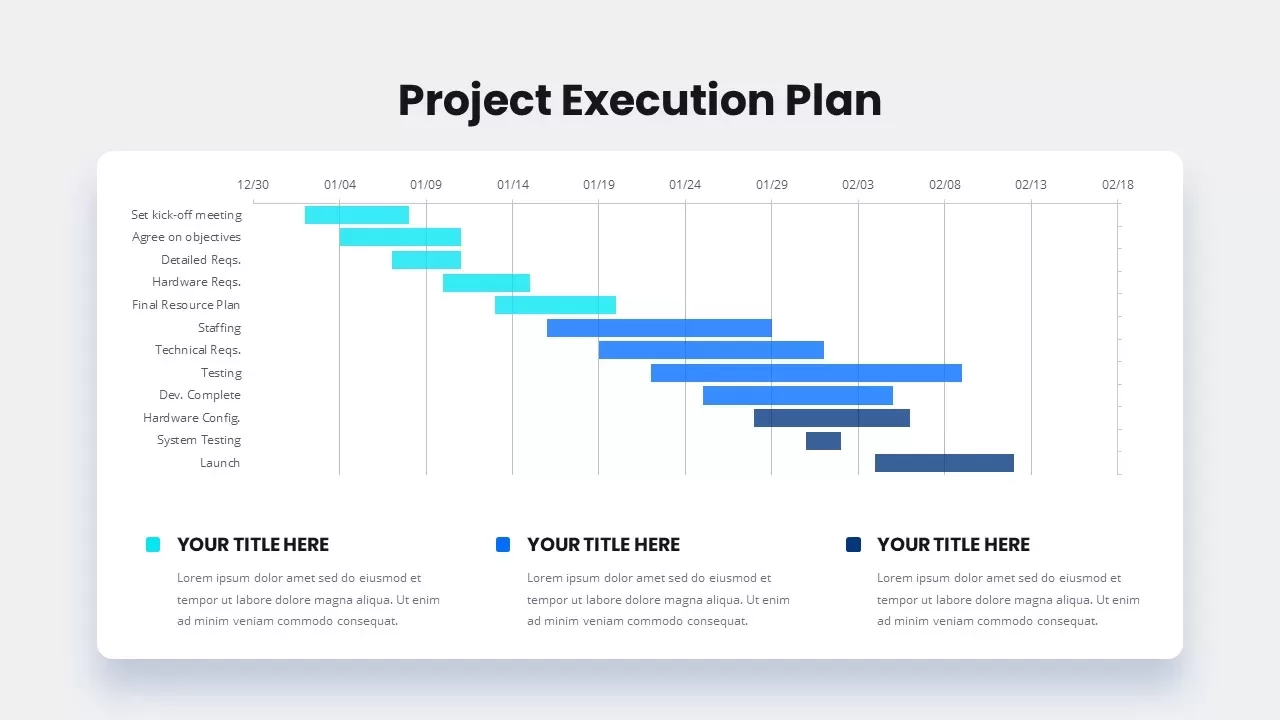
Project Execution Gantt Timeline Template for PowerPoint & Google Slides
Gantt Chart
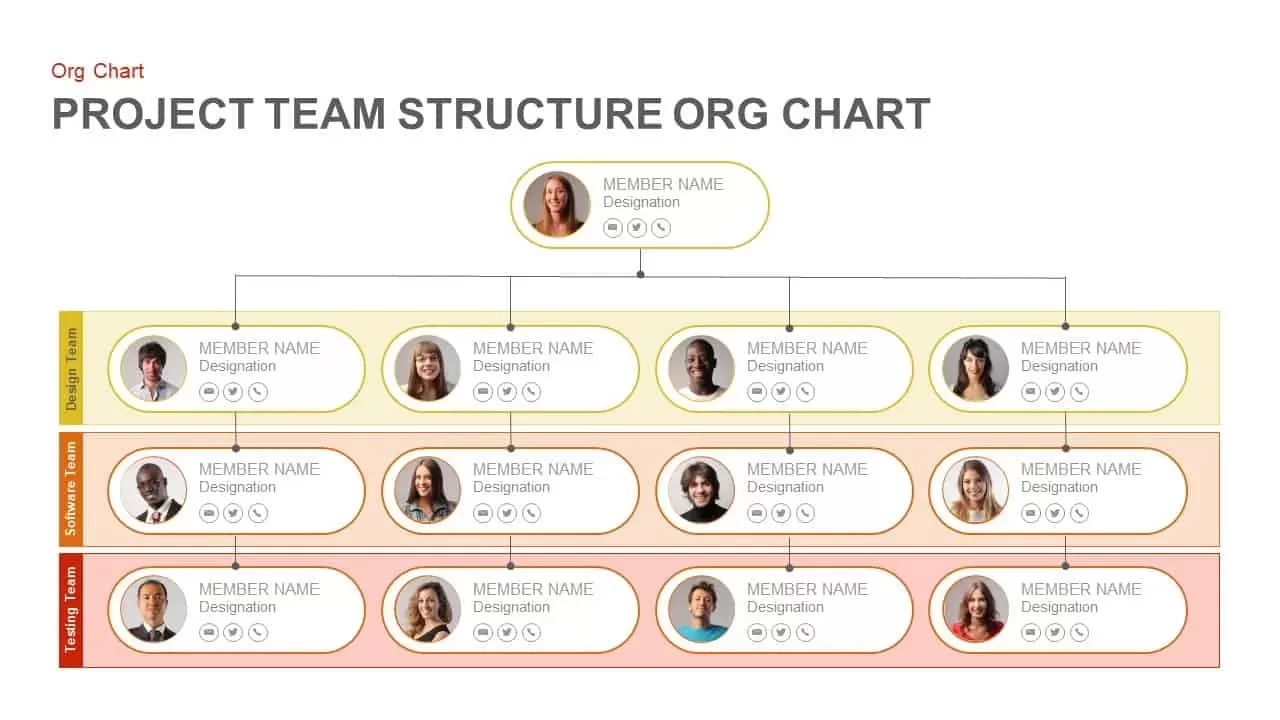
Project Team Structure Org Chart Template for PowerPoint & Google Slides
Org Chart
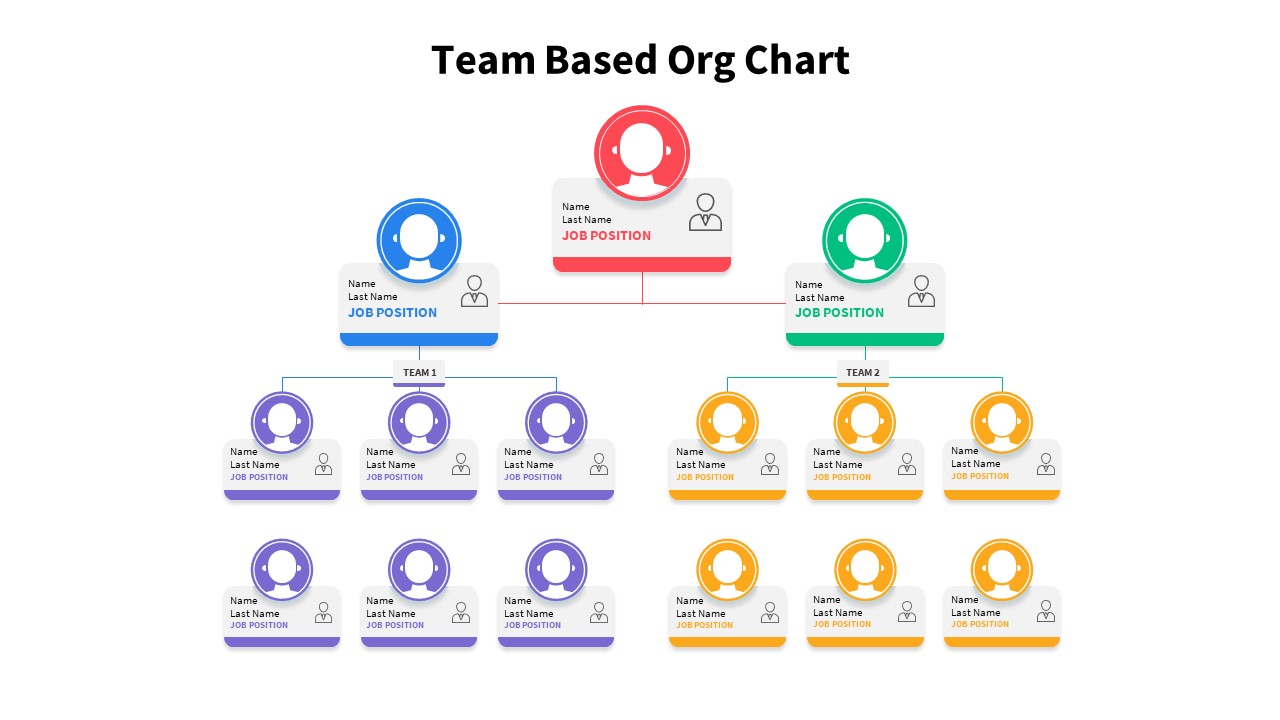
Team-Based Organizational Chart Template for PowerPoint & Google Slides
Org Chart
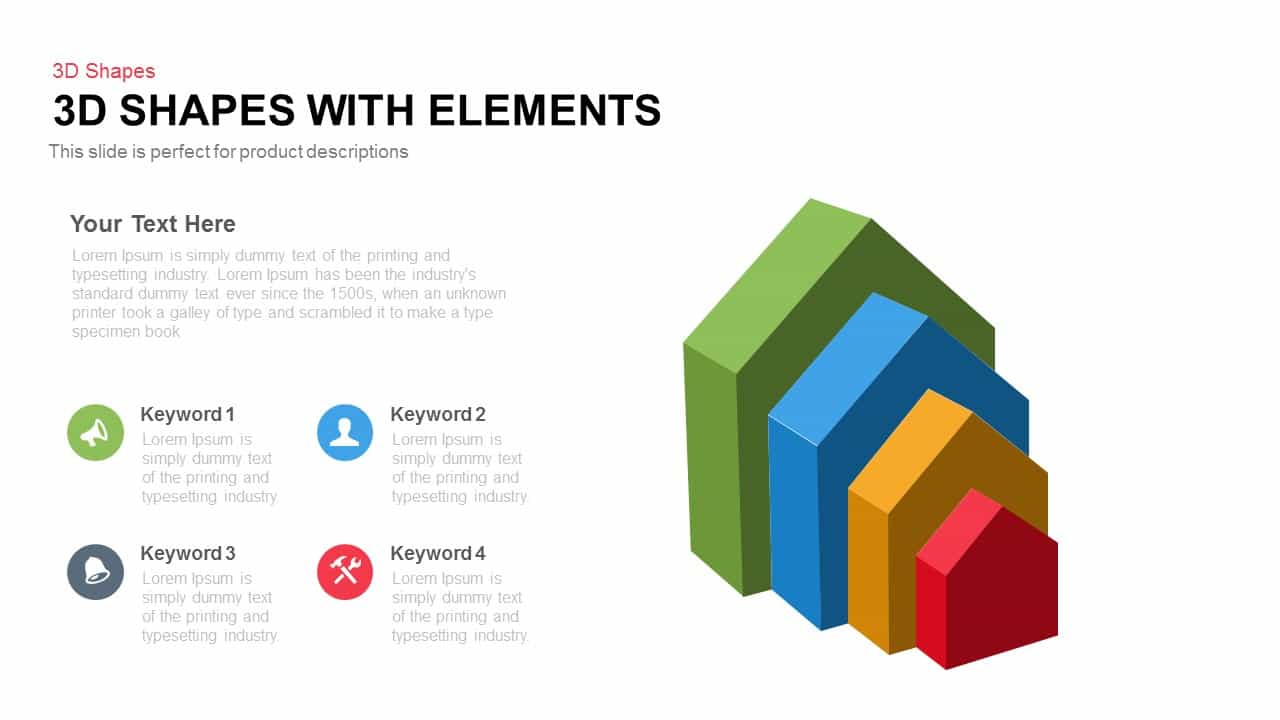
3D Shapes Overview template for PowerPoint & Google Slides
Process
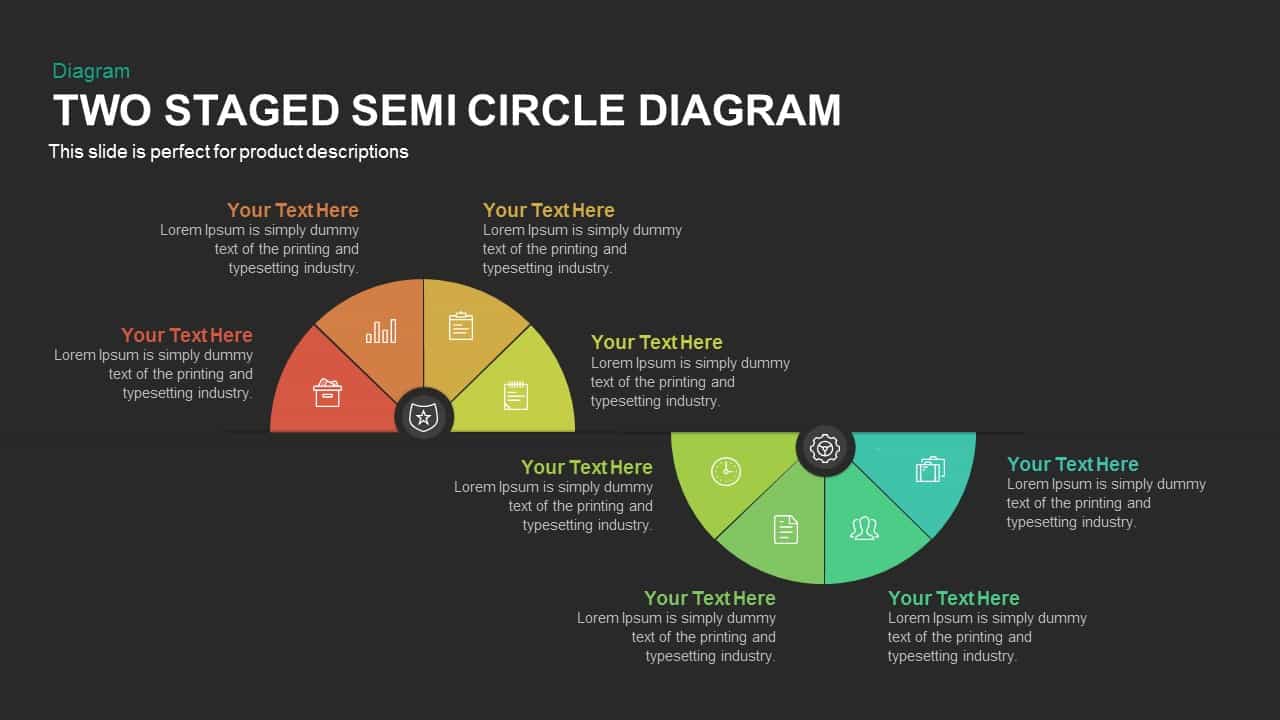
Two-Stage Semi-Circle Diagram Overview Template for PowerPoint & Google Slides
Circular
Business Presentation Overview template for PowerPoint & Google Slides
Company Profile
Free
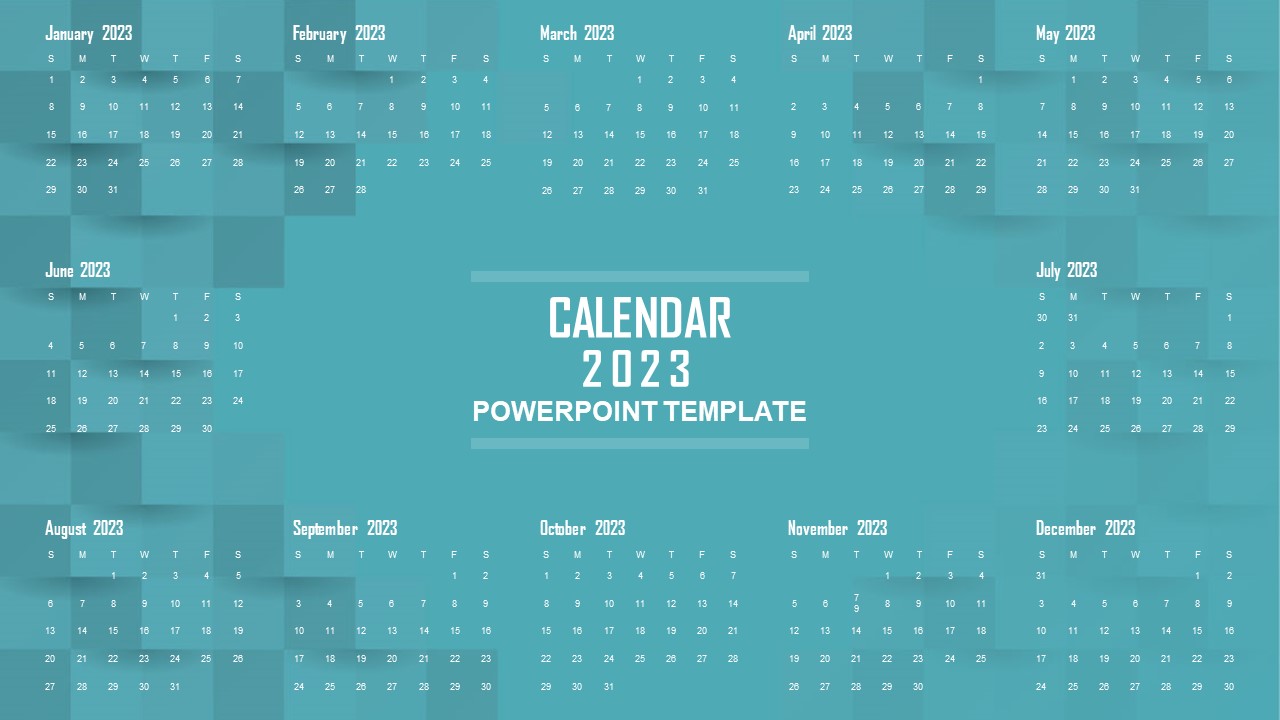
Elegant 2023 Annual Calendar Overview Template for PowerPoint & Google Slides
Timeline
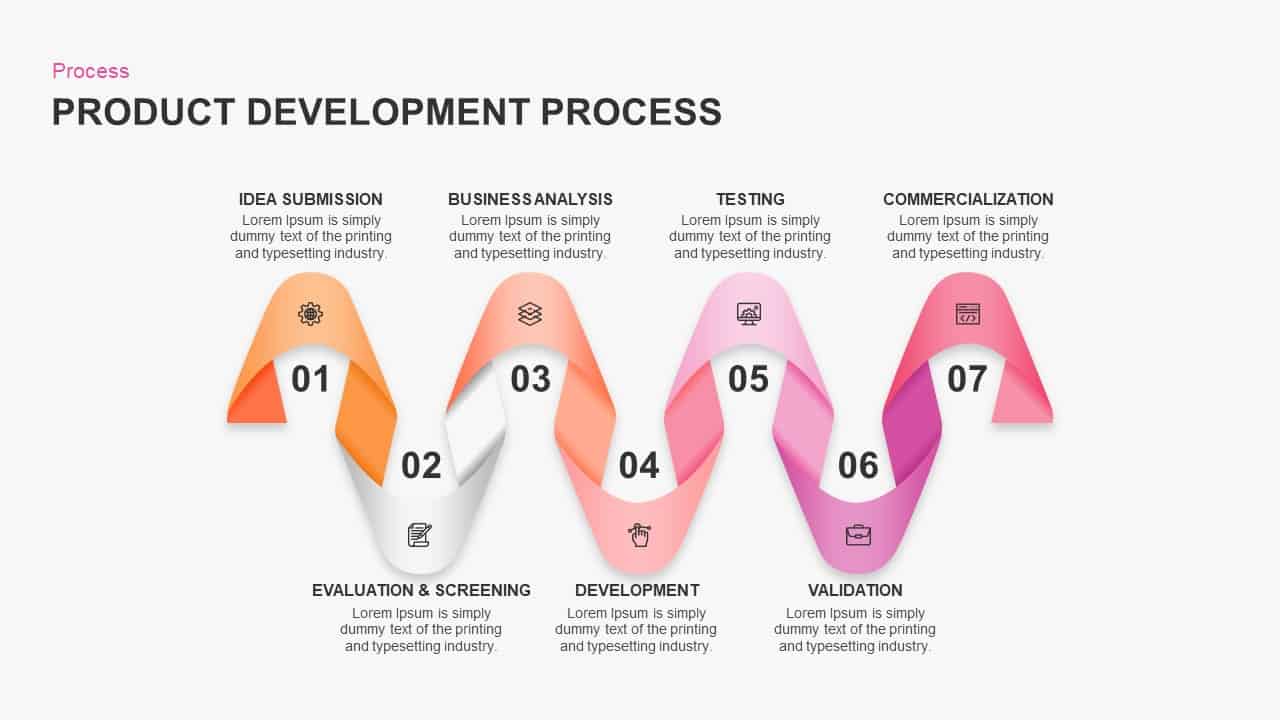
Product Development Process Overview template for PowerPoint & Google Slides
Process
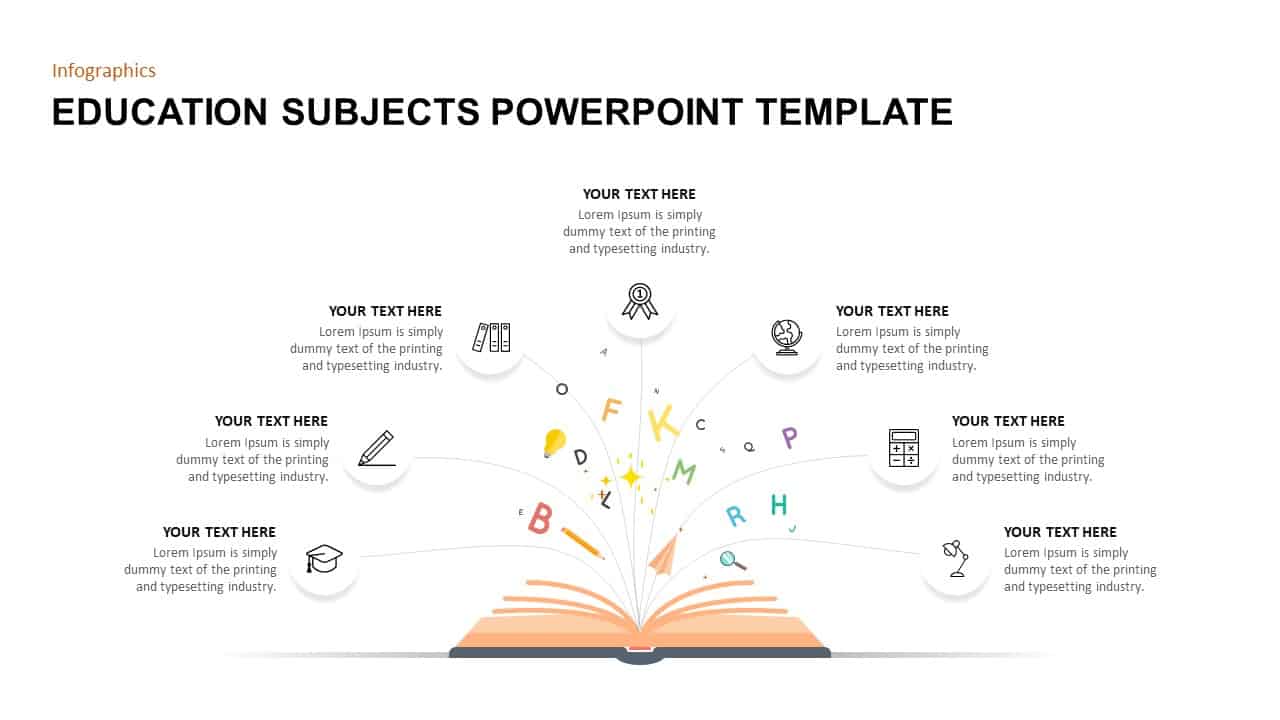
Education Subjects Overview template for PowerPoint & Google Slides
Agenda
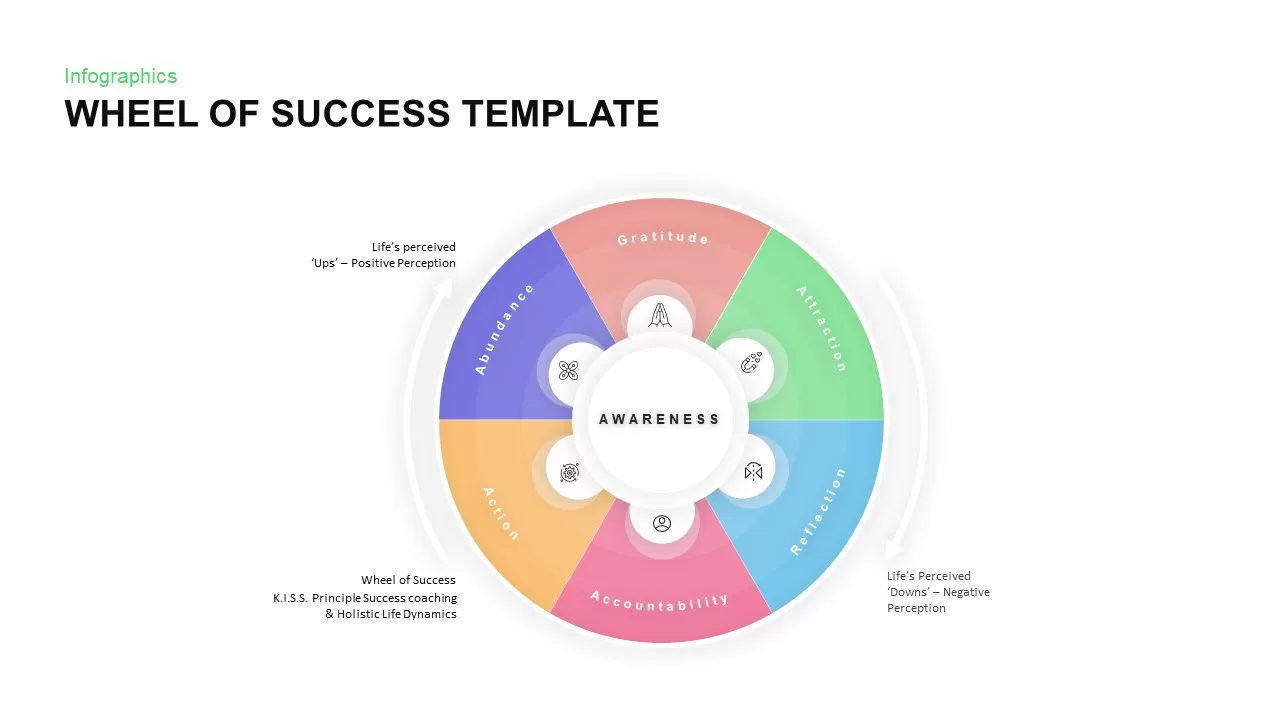
Wheel of Success Overview template for PowerPoint & Google Slides
Business Strategy
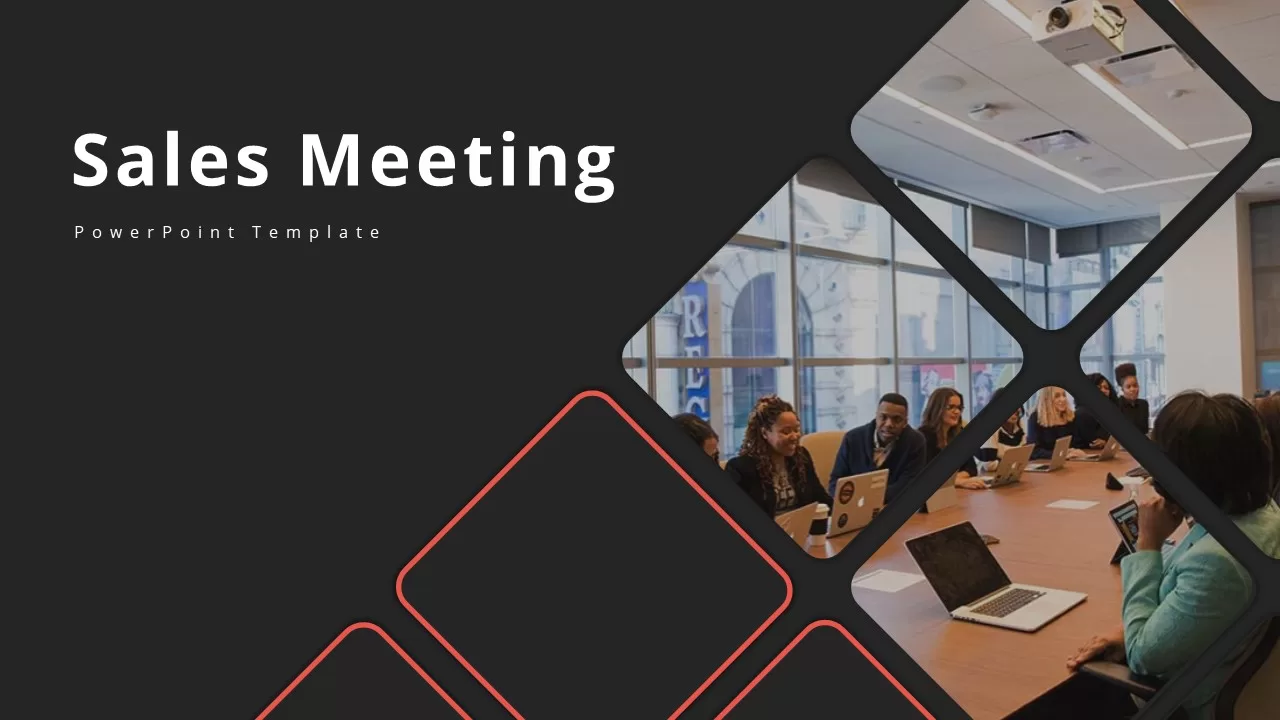
Sales Meeting Overview template for PowerPoint & Google Slides
Pitch Deck
Corporate Level Strategy Overview template for PowerPoint & Google Slides
Business Strategy
Lewin’s Change Model Overview Template for PowerPoint & Google Slides
Gap
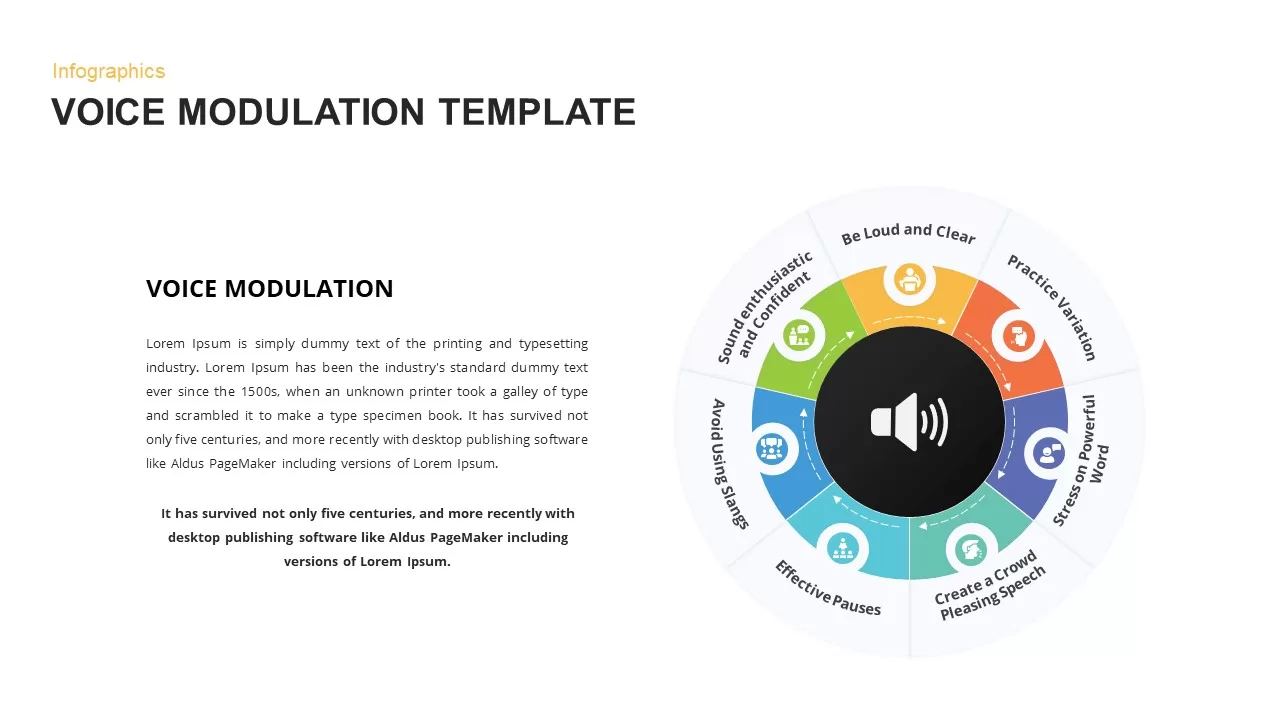
Voice Modulation Overview Template for PowerPoint & Google Slides
Circular
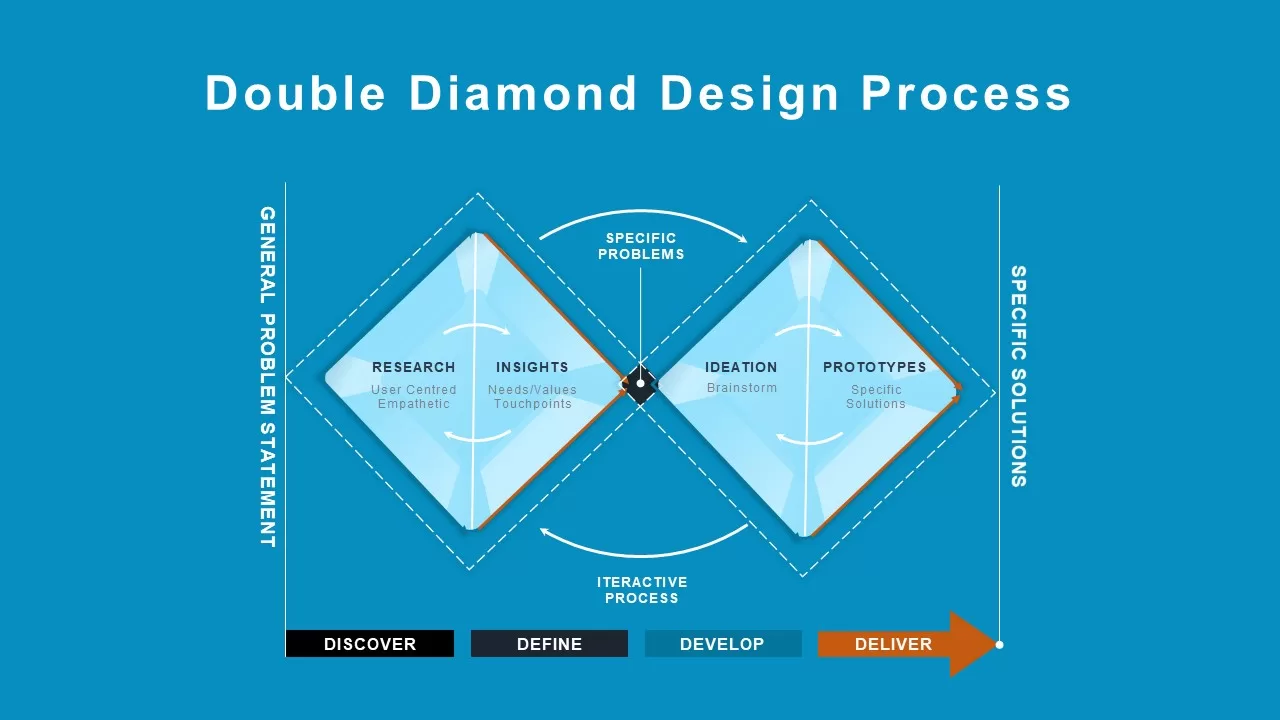
Double Diamond Design Process Overview Template for PowerPoint & Google Slides
Process
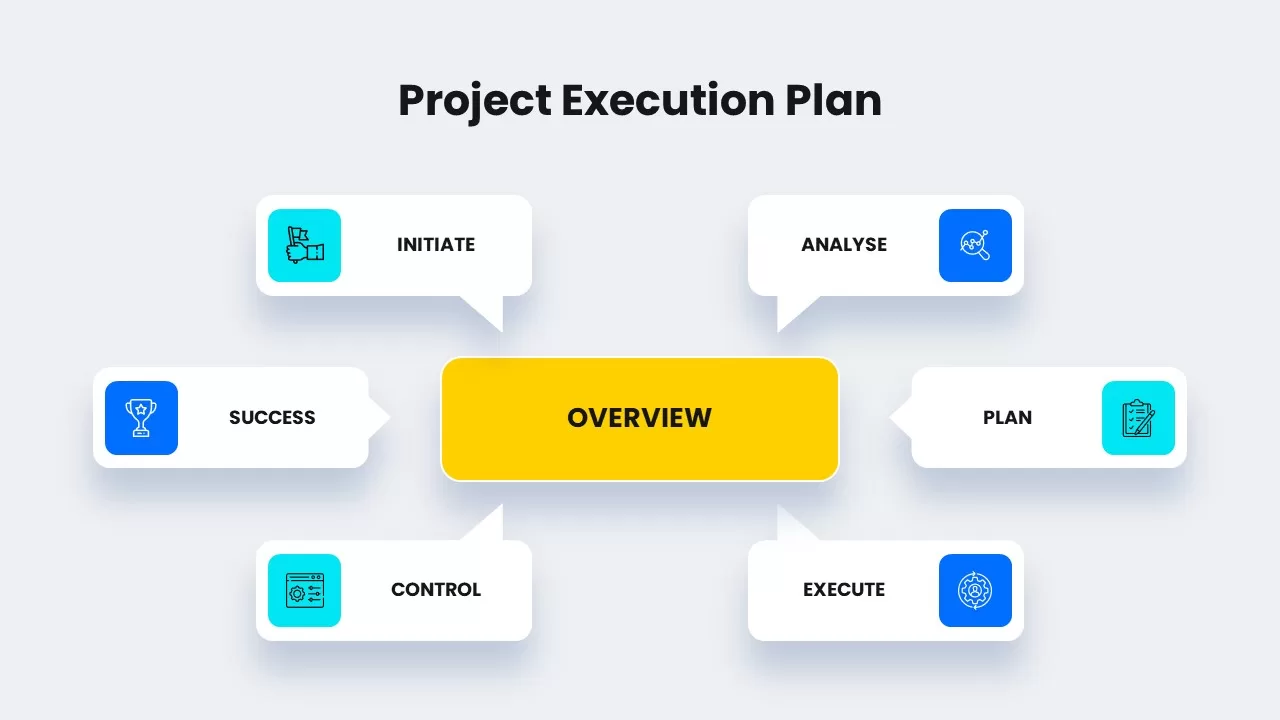
Project Execution Plan Overview Template for PowerPoint & Google Slides
Project Status
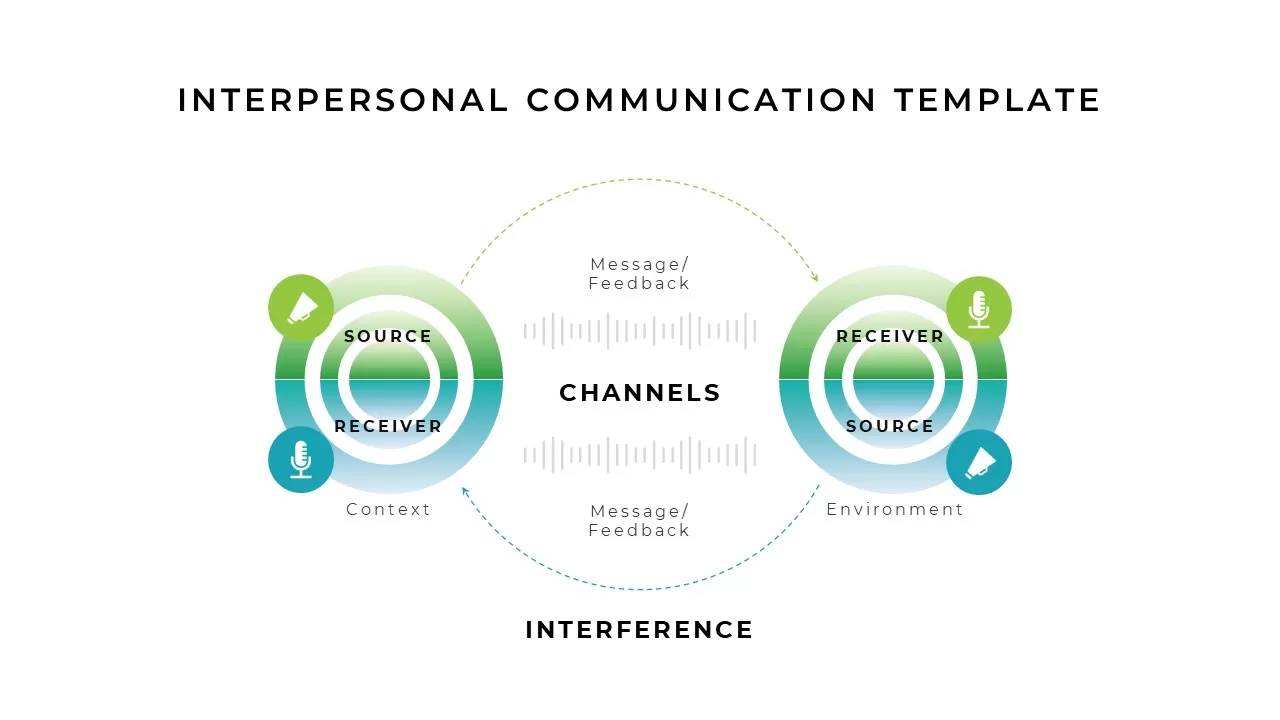
Interpersonal Communication Model Overview template for PowerPoint & Google Slides
Business
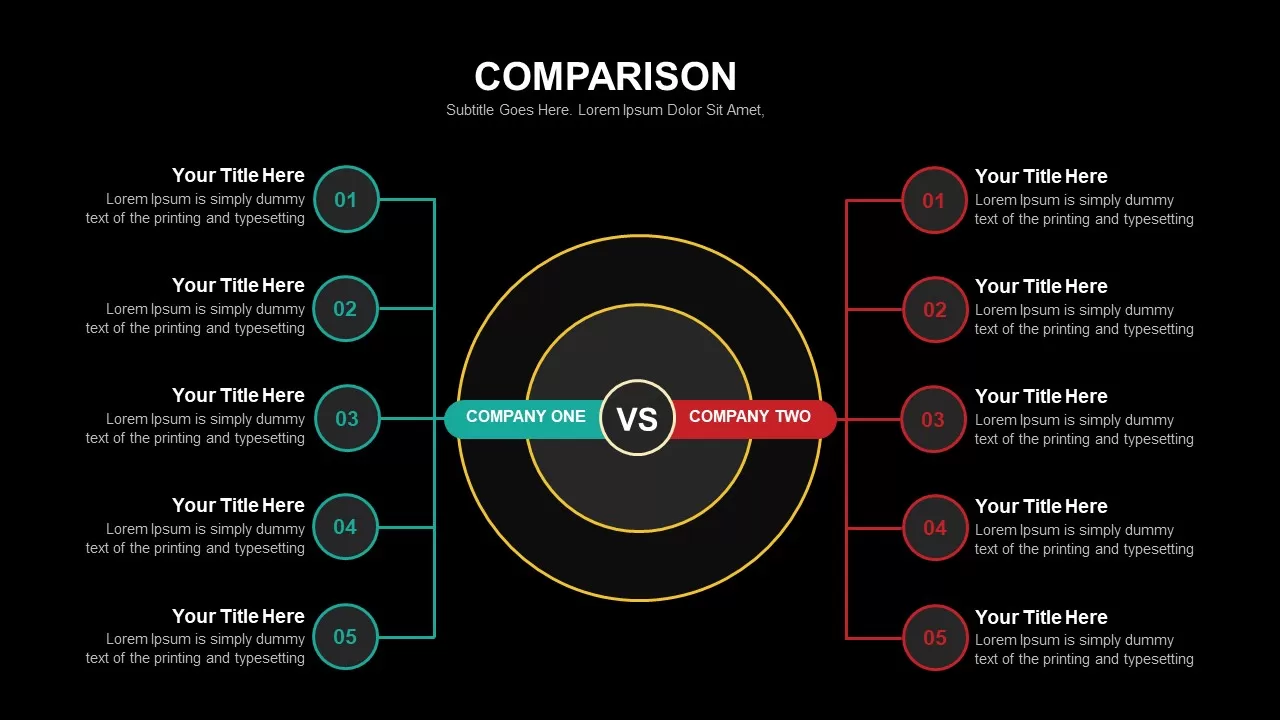
Comparison Infographic Overview template for PowerPoint & Google Slides
Business
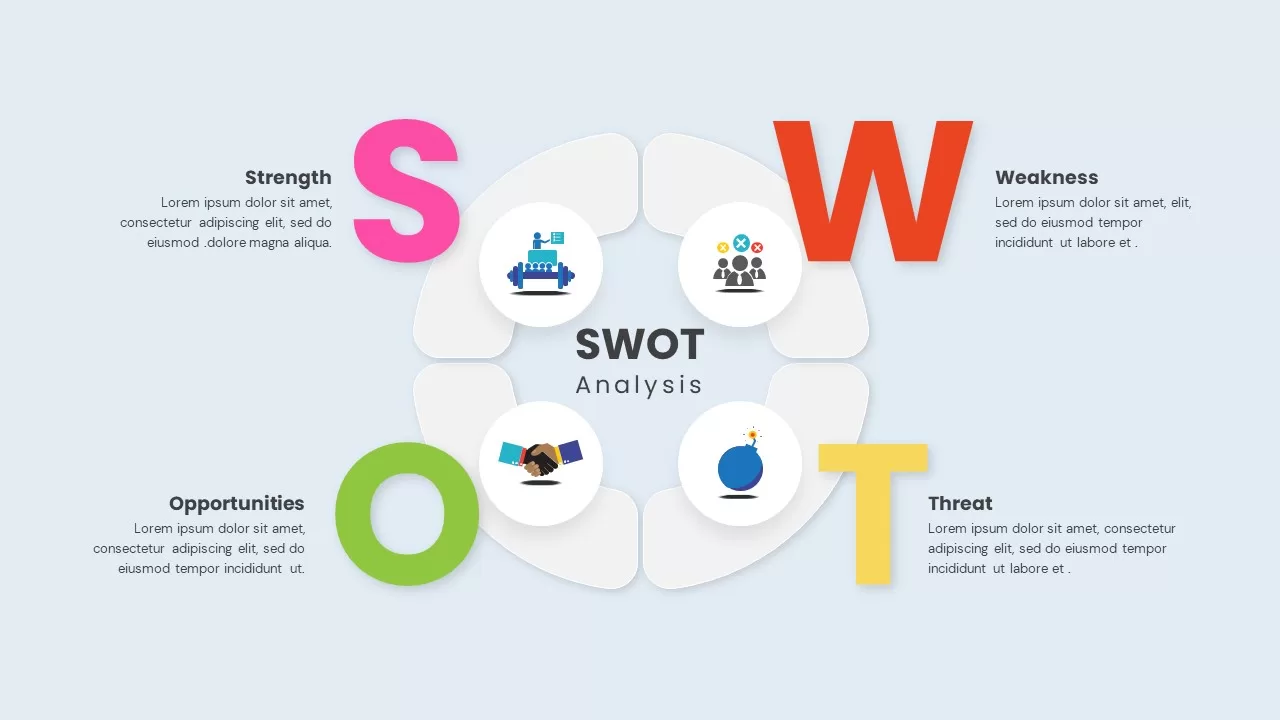
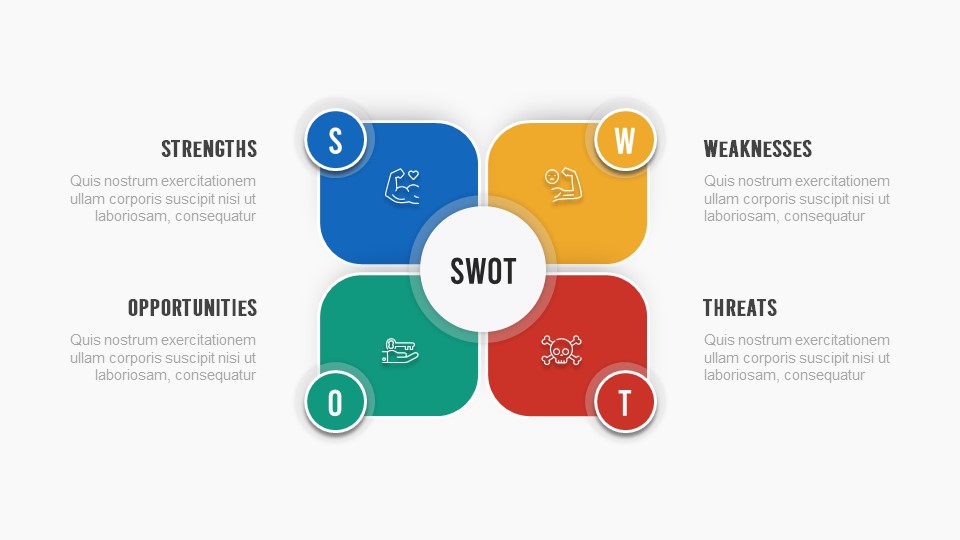
SWOT Analysis Visual Overview template for PowerPoint & Google Slides
Business Strategy
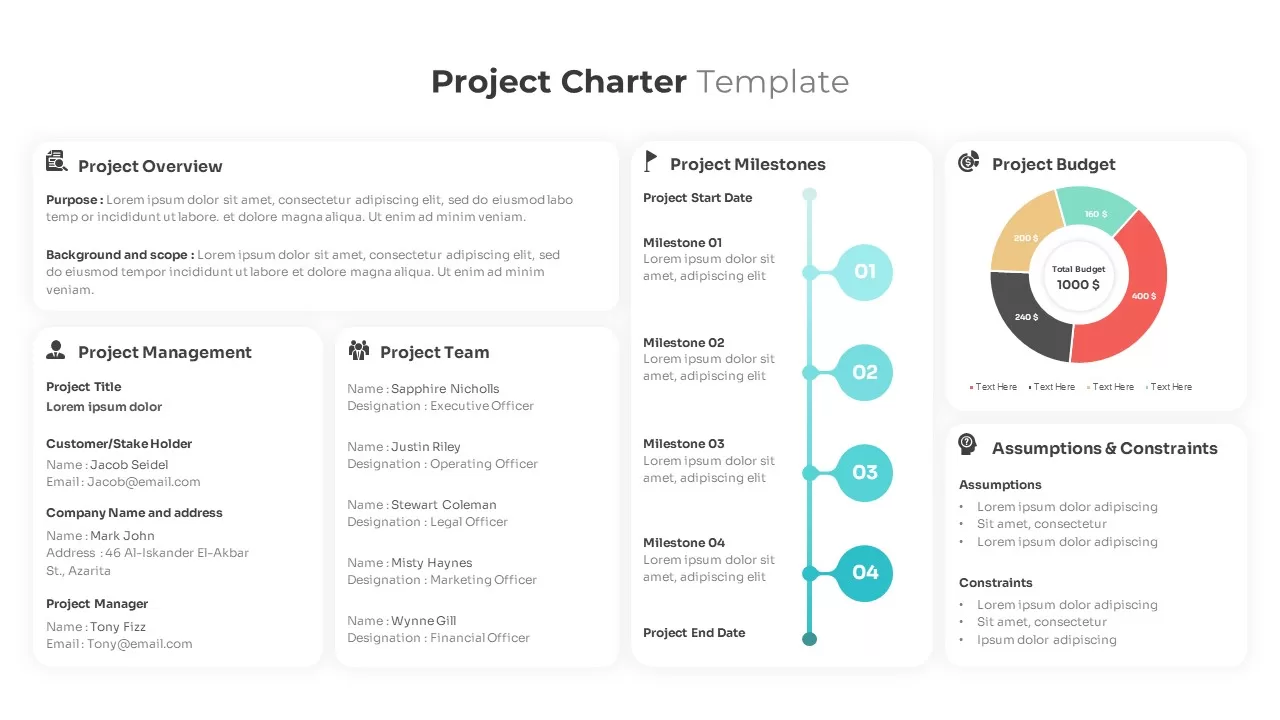
Project Charter Overview template for PowerPoint & Google Slides
Business Plan

Free SWOT Analysis Overview template for PowerPoint & Google Slides
SWOT
Free
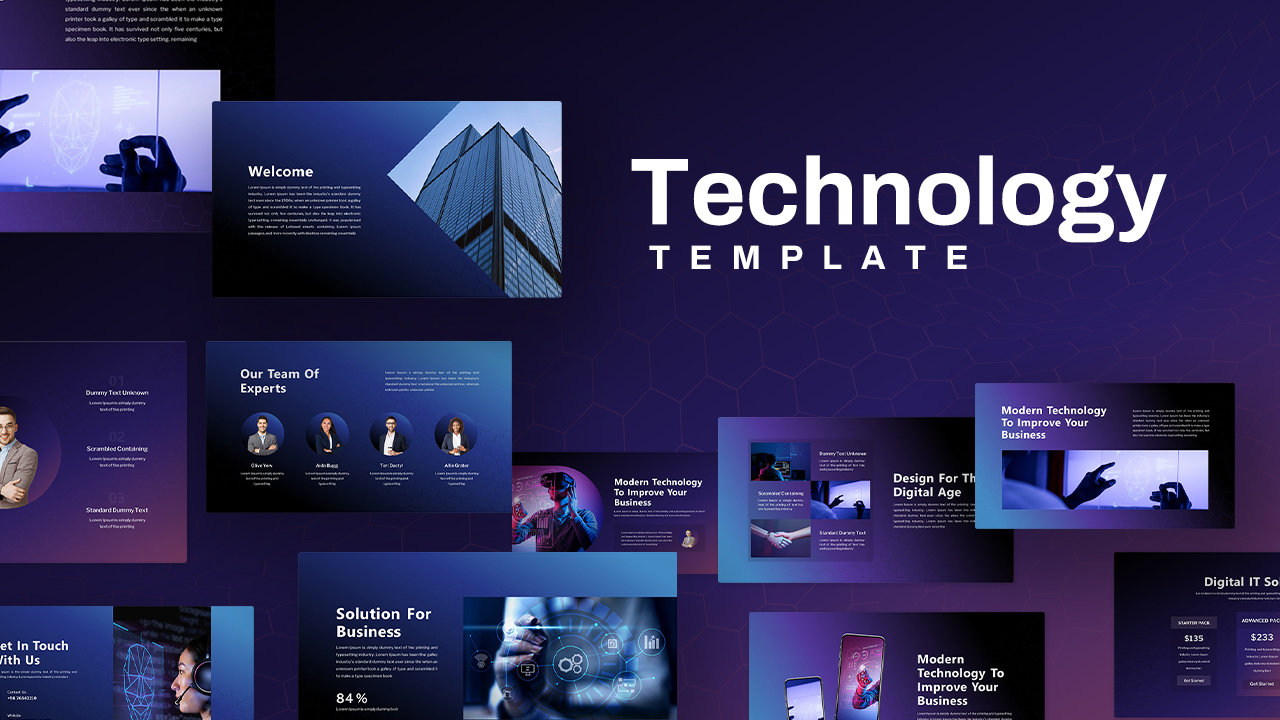
Modern Technology Solutions Overview template for PowerPoint & Google Slides
Information Technology
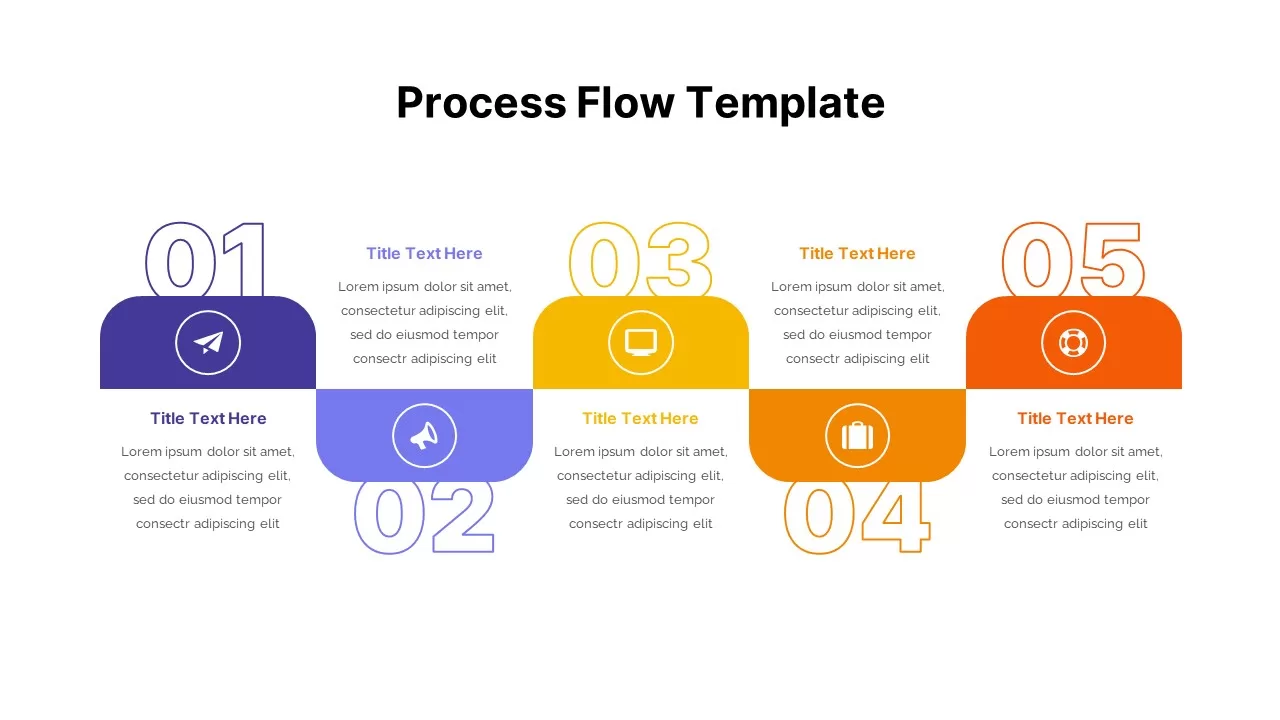
5 Stage Process Flow Overview template for PowerPoint & Google Slides
Process
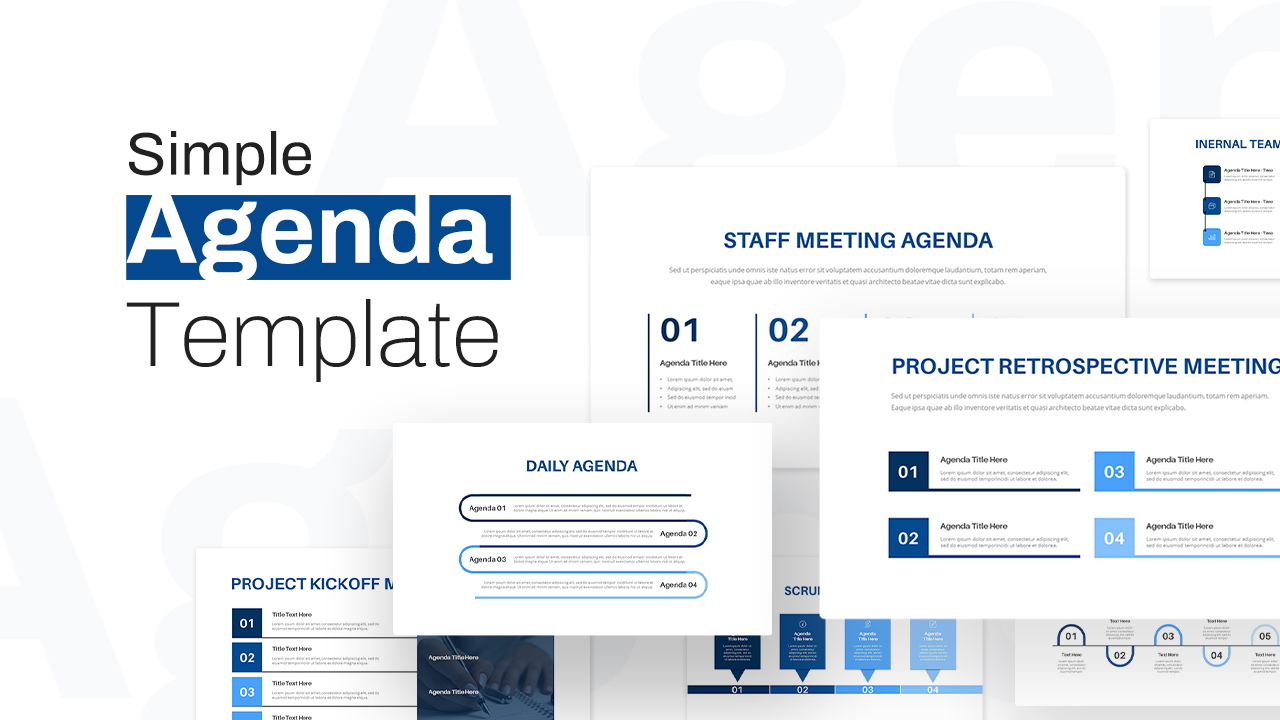
Simple Agenda Slide Deck Overview Template for PowerPoint & Google Slides
Agenda

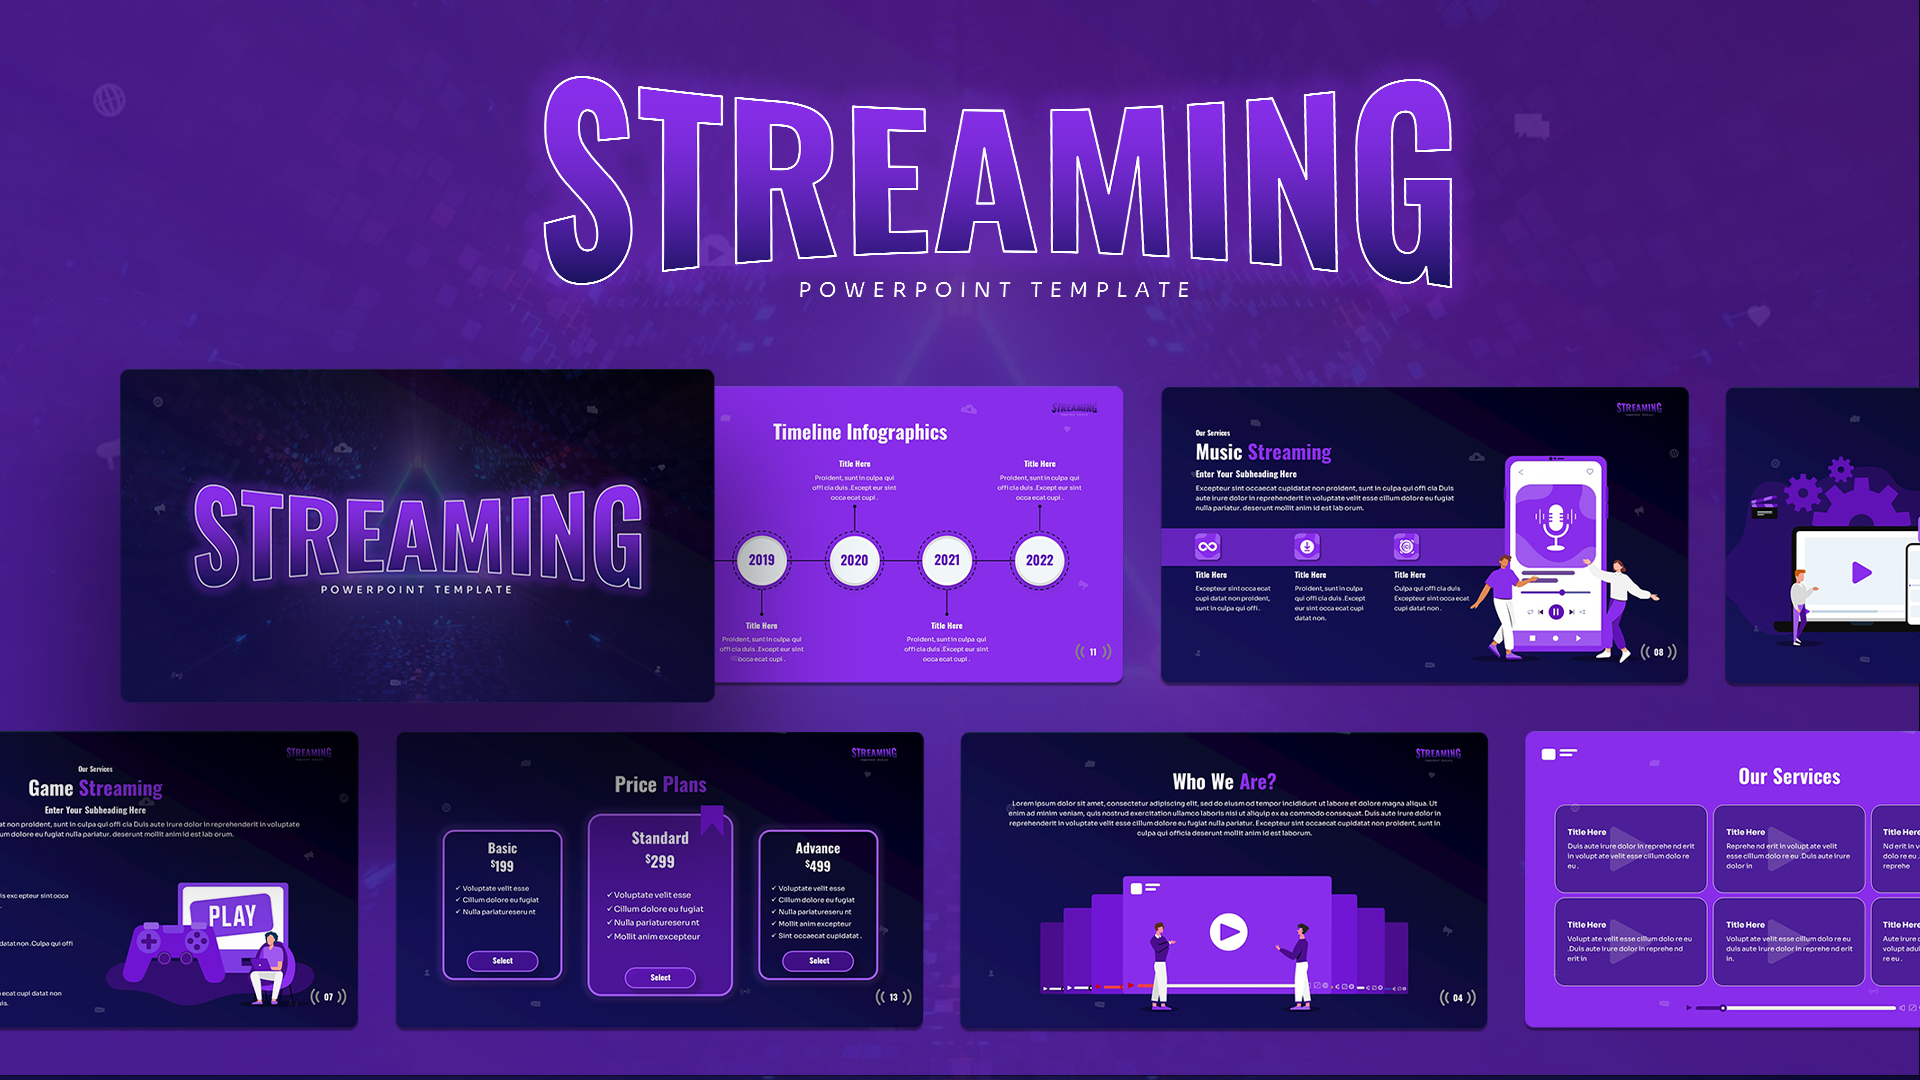
Streaming Service Overview template for PowerPoint & Google Slides
Business Proposal
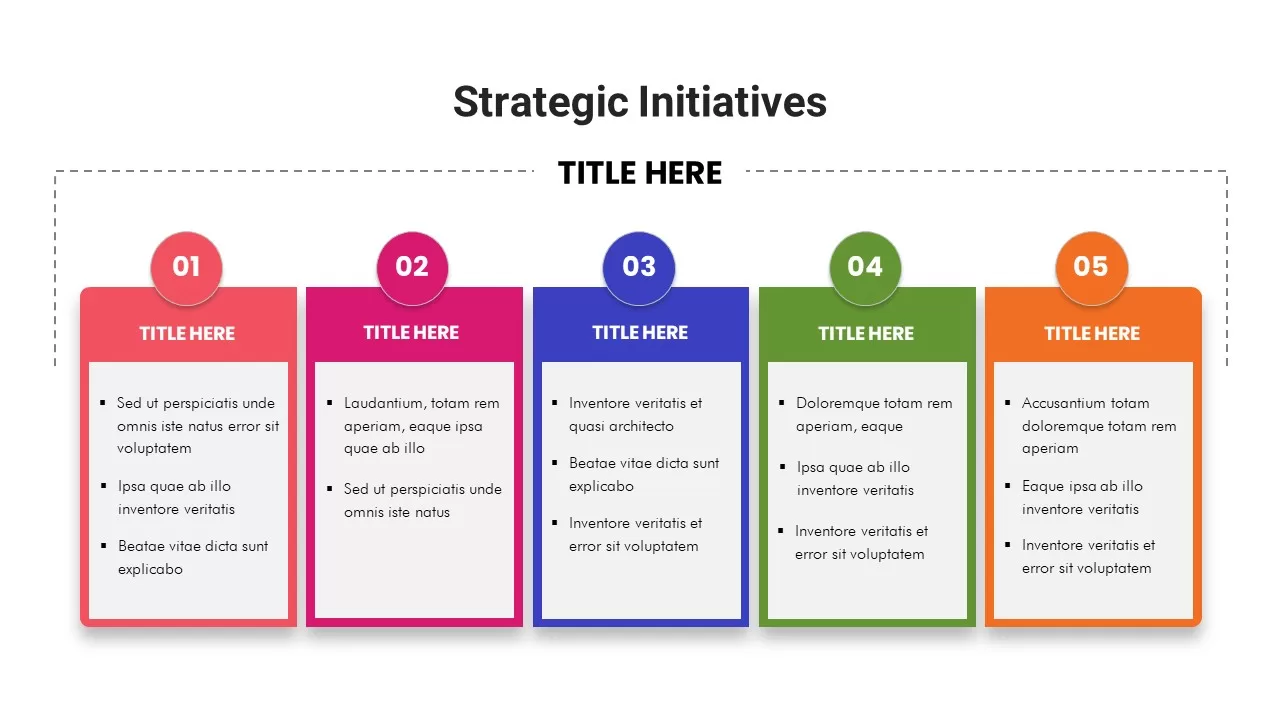
Strategic Initiatives Overview template for PowerPoint & Google Slides
Business Strategy
Aviation Airline Industry Overview template for PowerPoint & Google Slides
Business
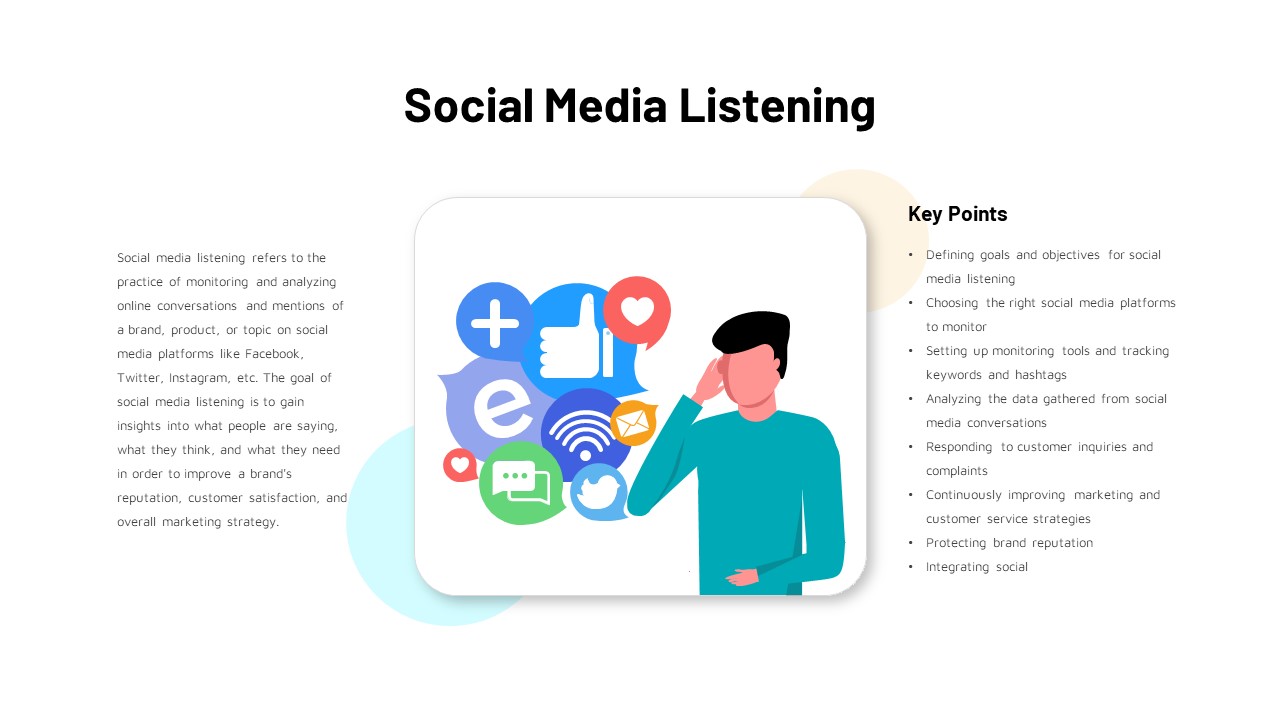
Social Media Listening Overview Slide Template for PowerPoint & Google Slides
Customer Experience
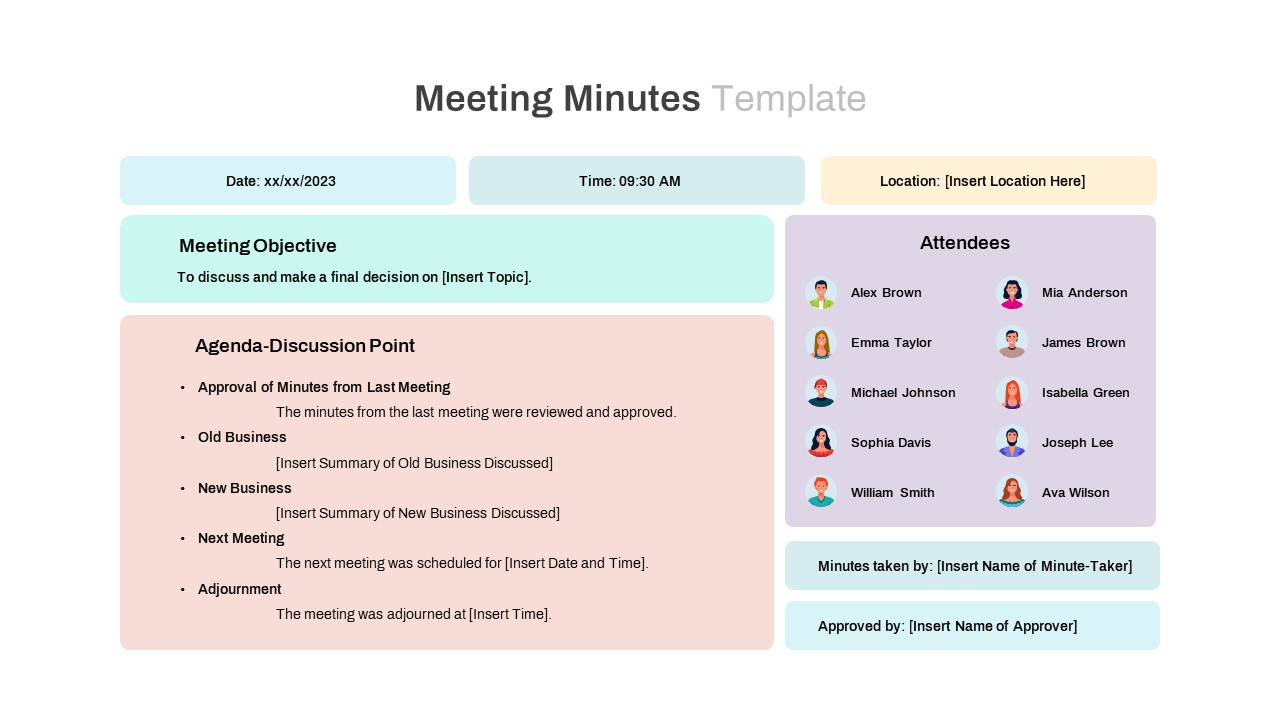
Meeting Minutes and Attendees Overview Template for PowerPoint & Google Slides
Business Report
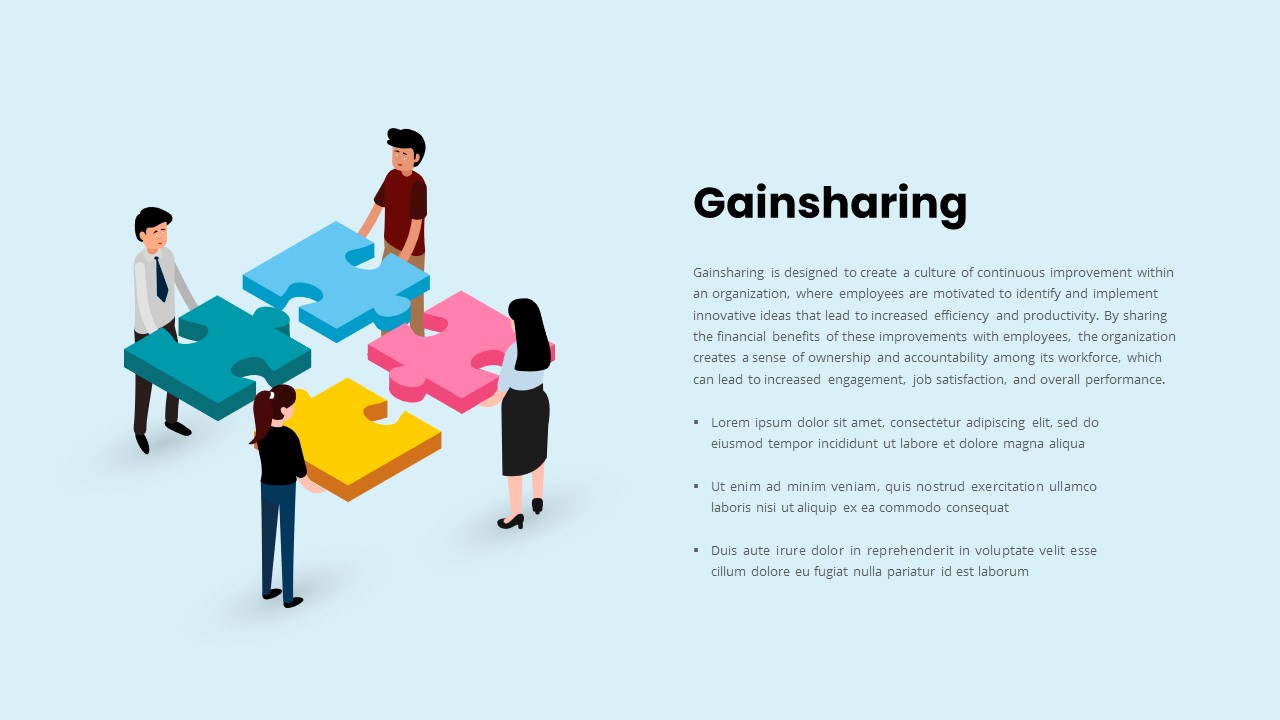
Gainsharing Culture Overview template for PowerPoint & Google Slides
Employee Performance
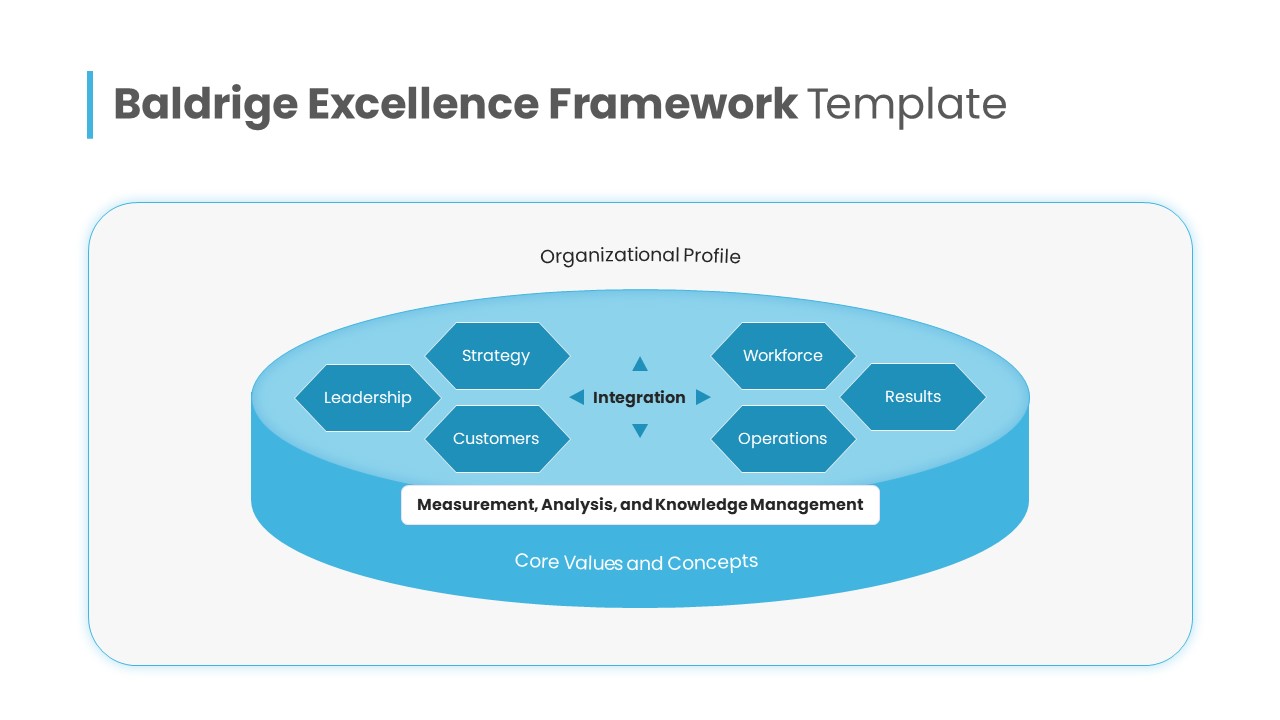
Baldrige Excellence Framework Overview Template for PowerPoint & Google Slides
Leadership
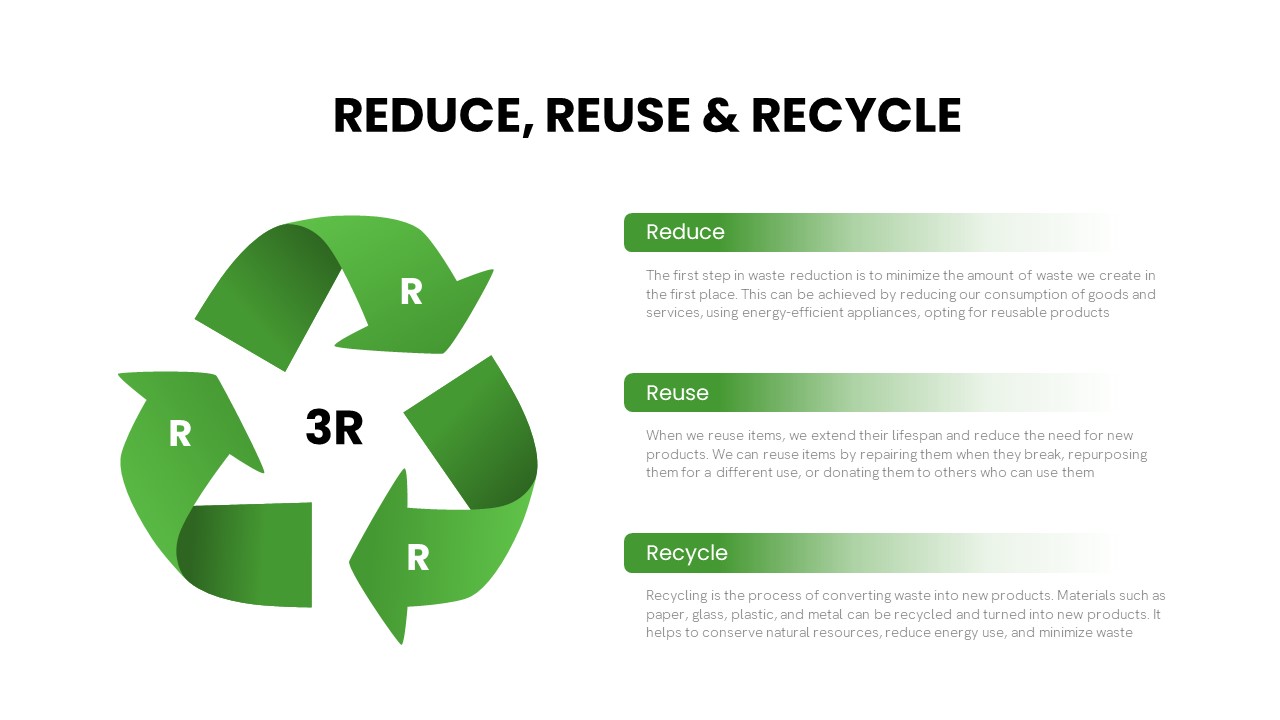
3R Waste Management Cycle Overview template for PowerPoint & Google Slides
Process

Modern Construction Project Overview Template for PowerPoint & Google Slides
Pitch Deck
Presentation Magazine Company Overview Template for PowerPoint & Google Slides
Company Profile
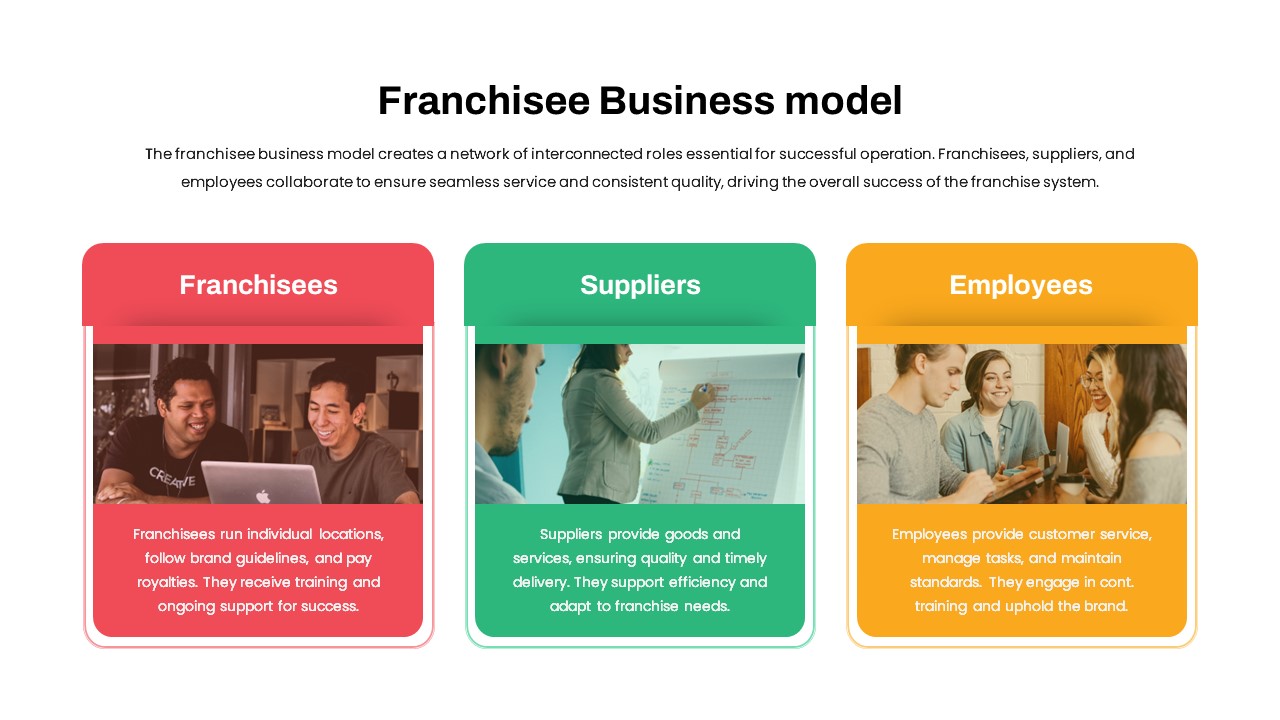
Franchisee Business Model Overview Template for PowerPoint & Google Slides
Business Models
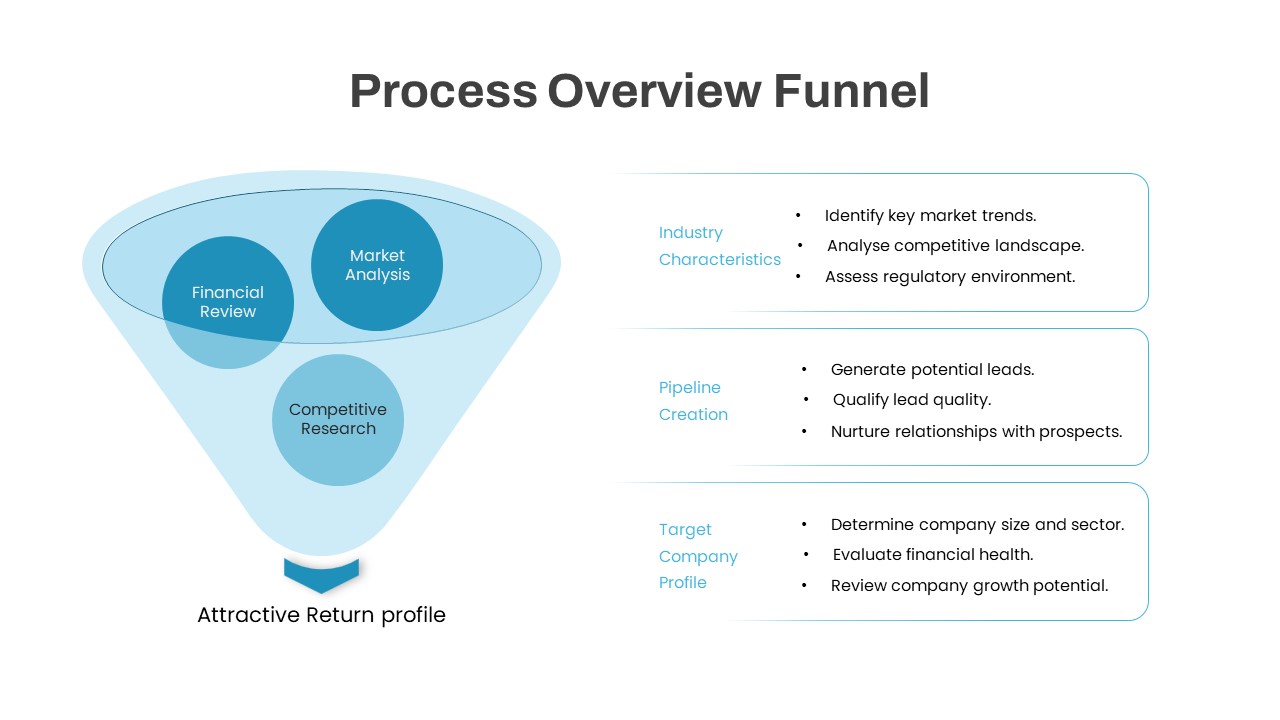
Process Overview Funnel Diagram Template for PowerPoint & Google Slides
Funnel
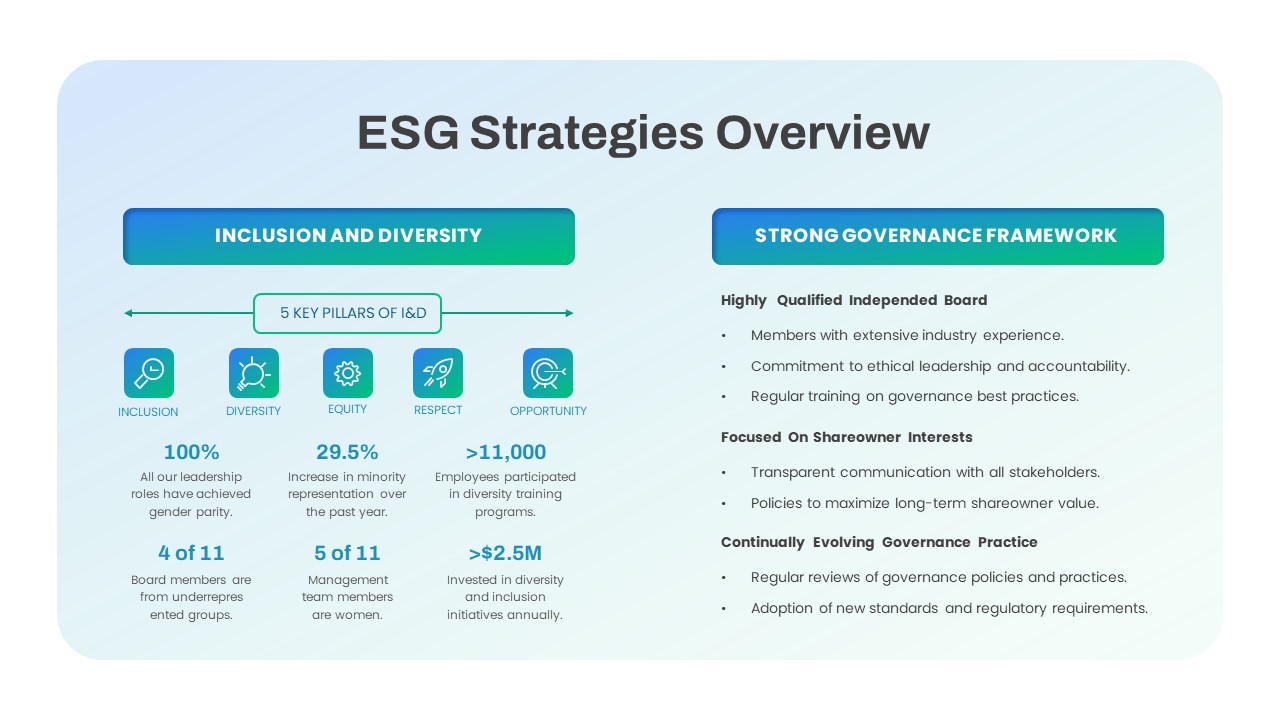
Comprehensive ESG Strategies Overview Template for PowerPoint & Google Slides
Infographics
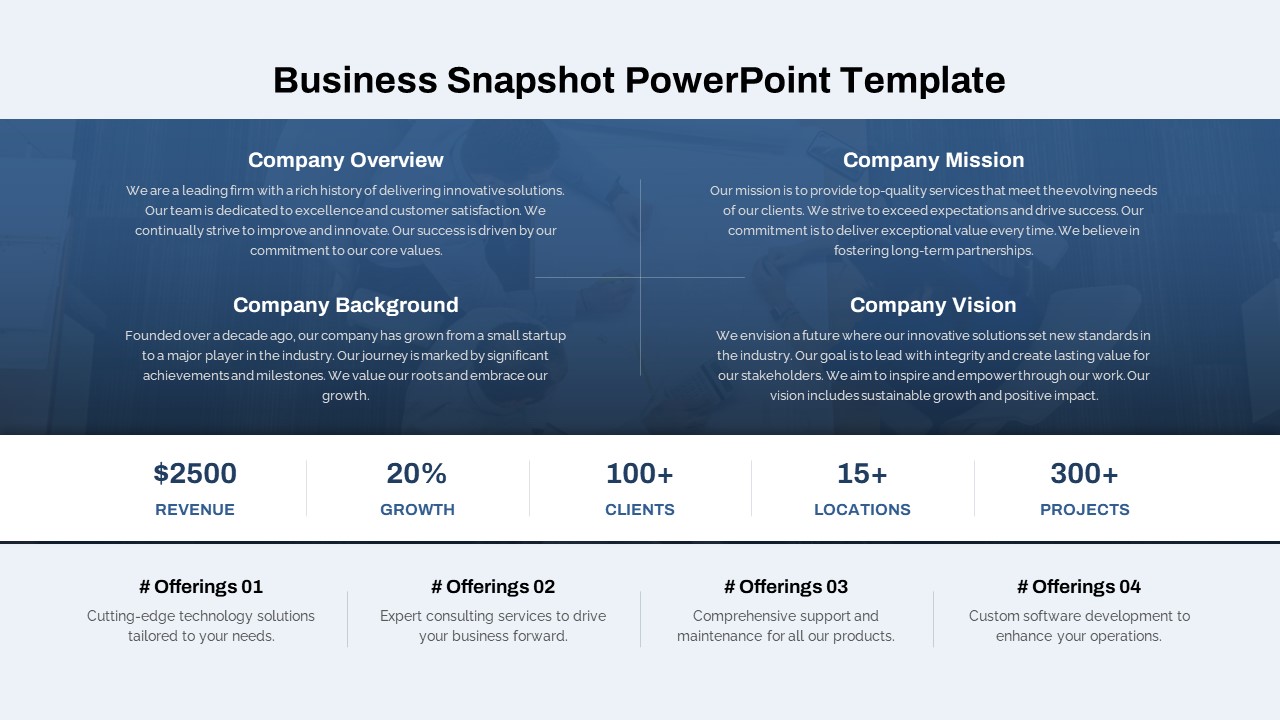
Modern Business Snapshot Overview Template for PowerPoint & Google Slides
Business Report
Marketing Advertising Types Overview Template for PowerPoint & Google Slides
Advertising
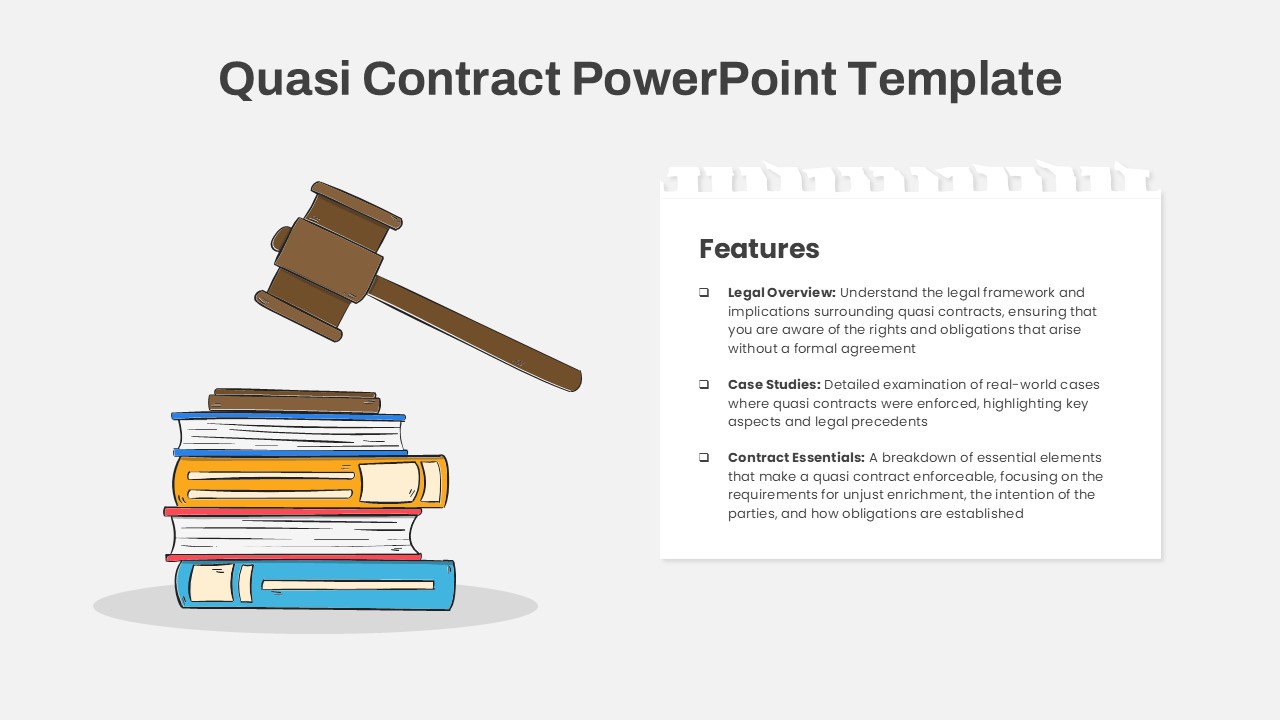
Quasi Contract Gavel & Books Overview Template for PowerPoint & Google Slides
Business Requirements
Zero Trust Security Model Overview template for PowerPoint & Google Slides
Infographics
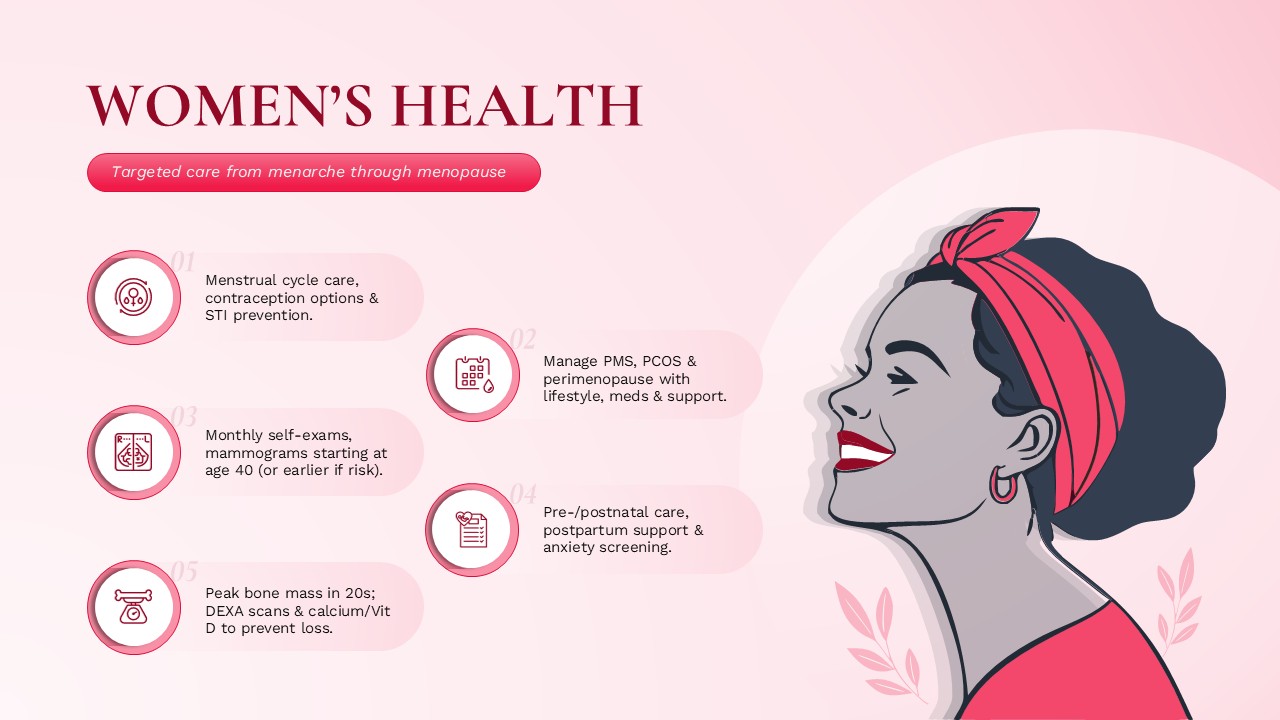
Women’s Health Care Overview template for PowerPoint & Google Slides
Medical
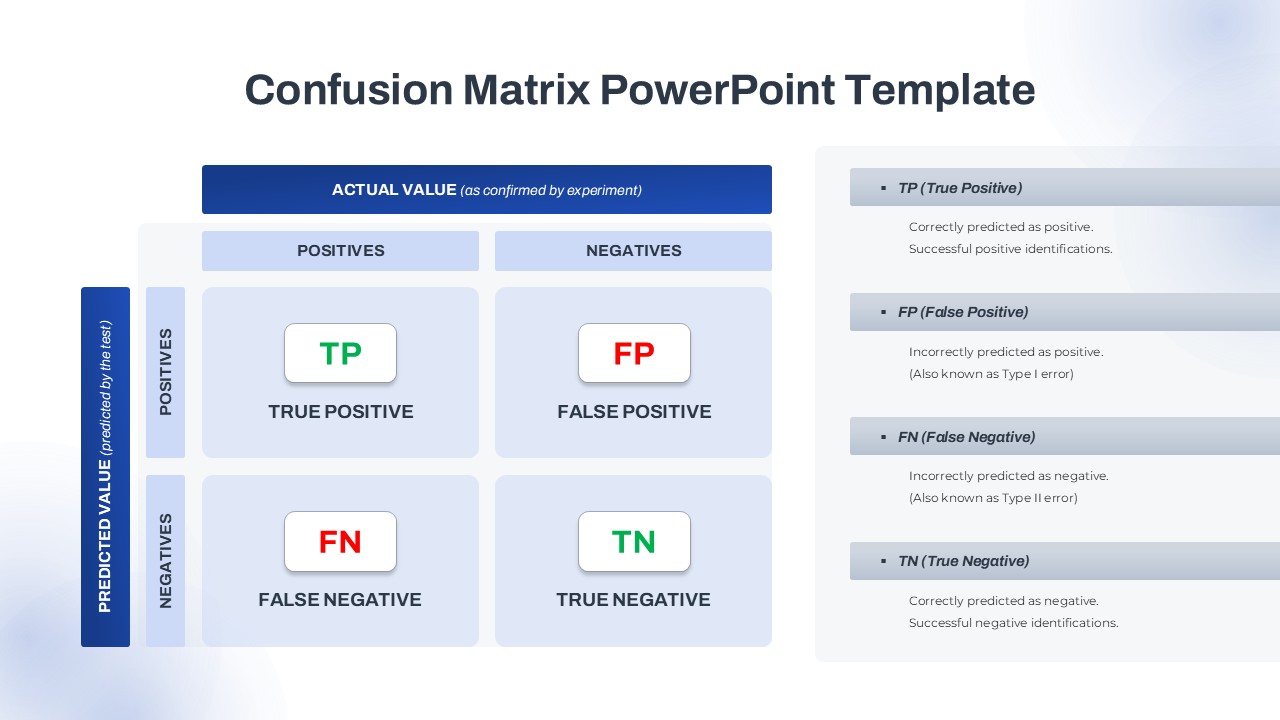
Confusion Matrix Diagram Overview Template for PowerPoint & Google Slides
Comparison
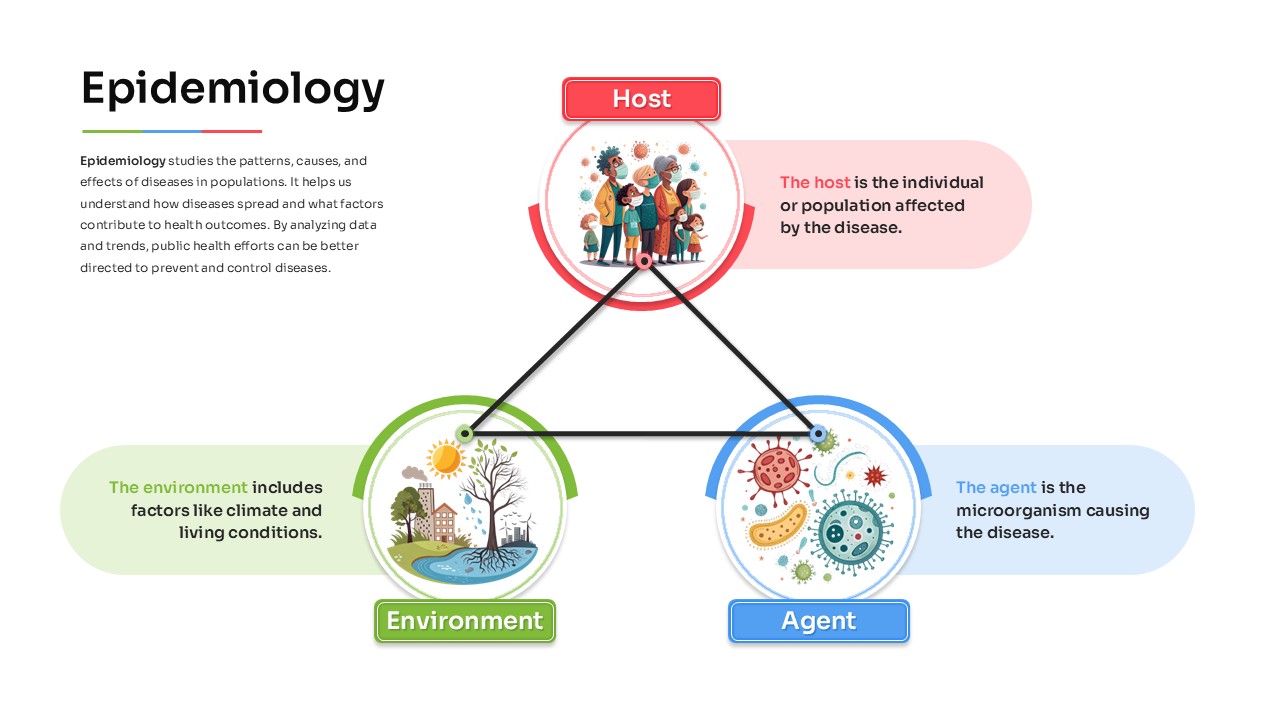
Epidemiology Overview template for PowerPoint & Google Slides
Health
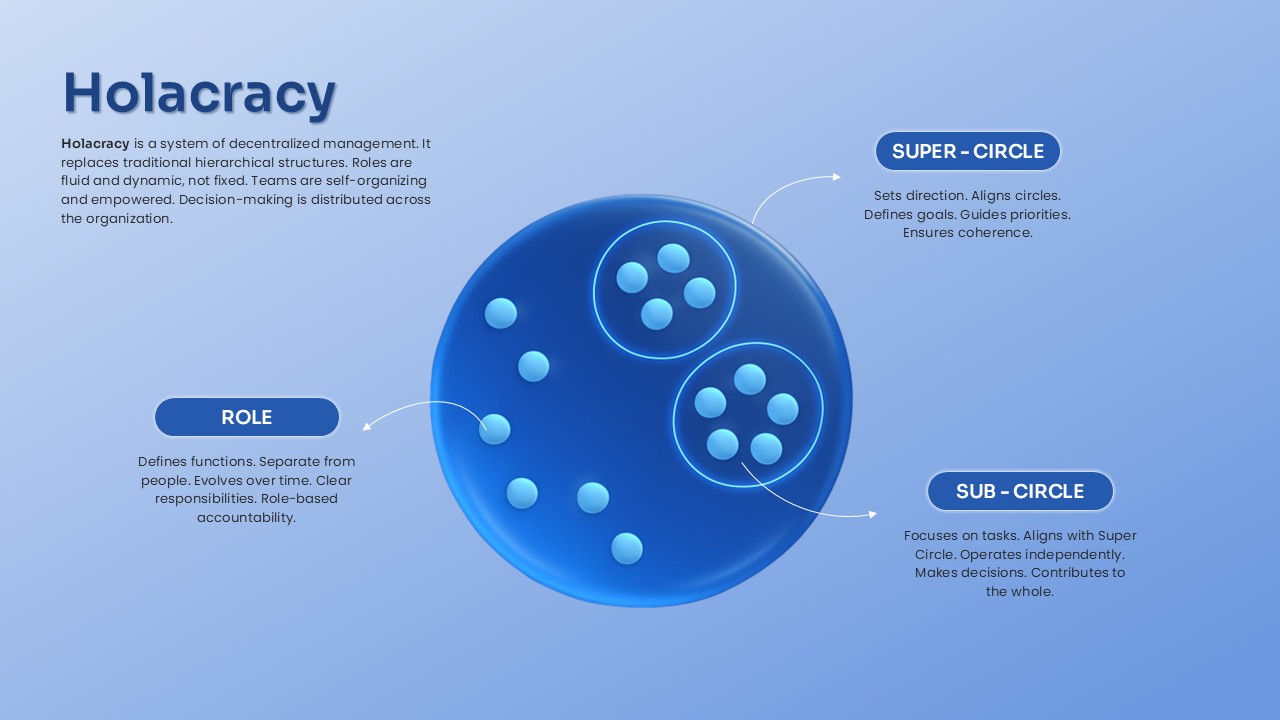
Holacracy System Overview template for PowerPoint & Google Slides
Process
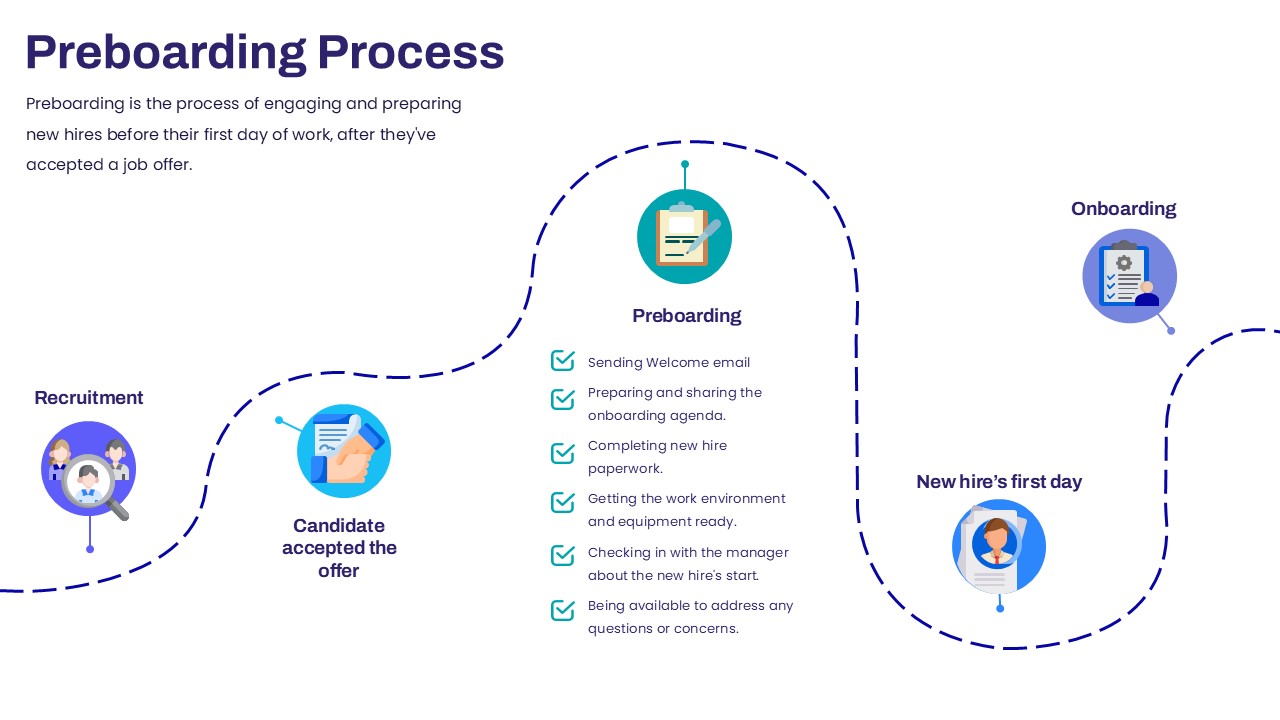
Preboarding Process Overview template for PowerPoint & Google Slides
Company Profile
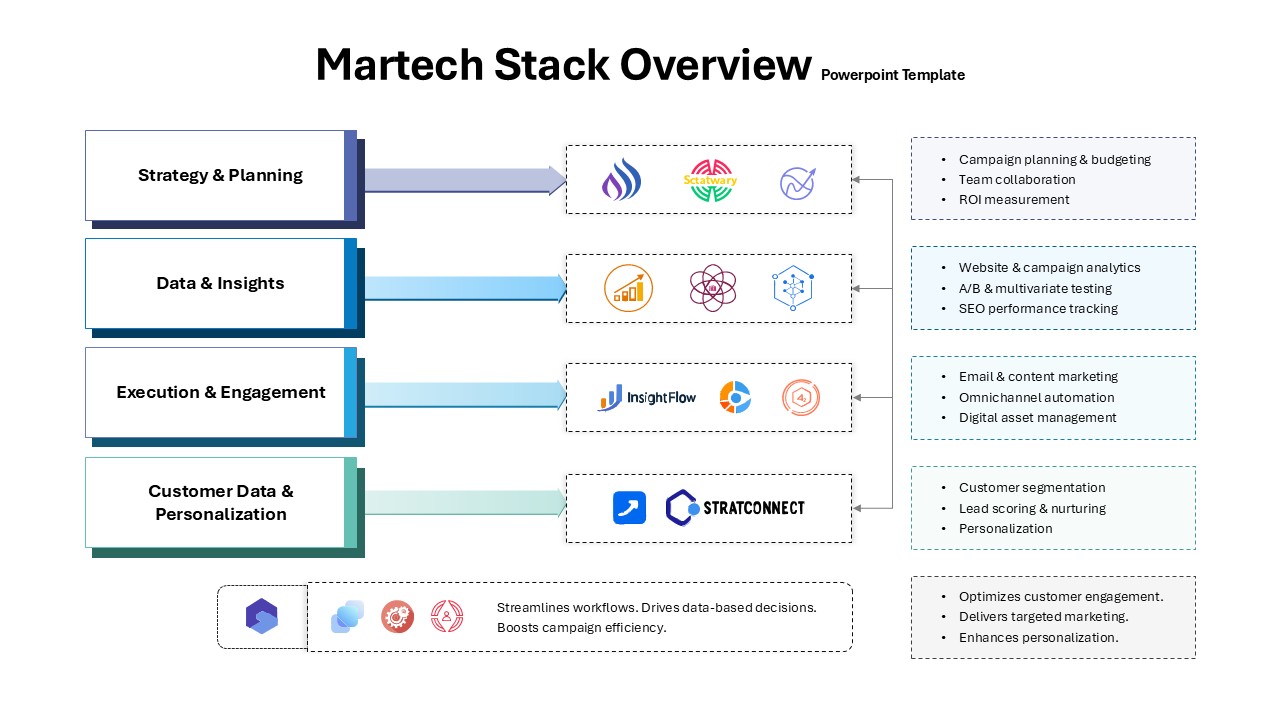
Martech Stack Overview Template for PowerPoint & Google Slides
Information Technology
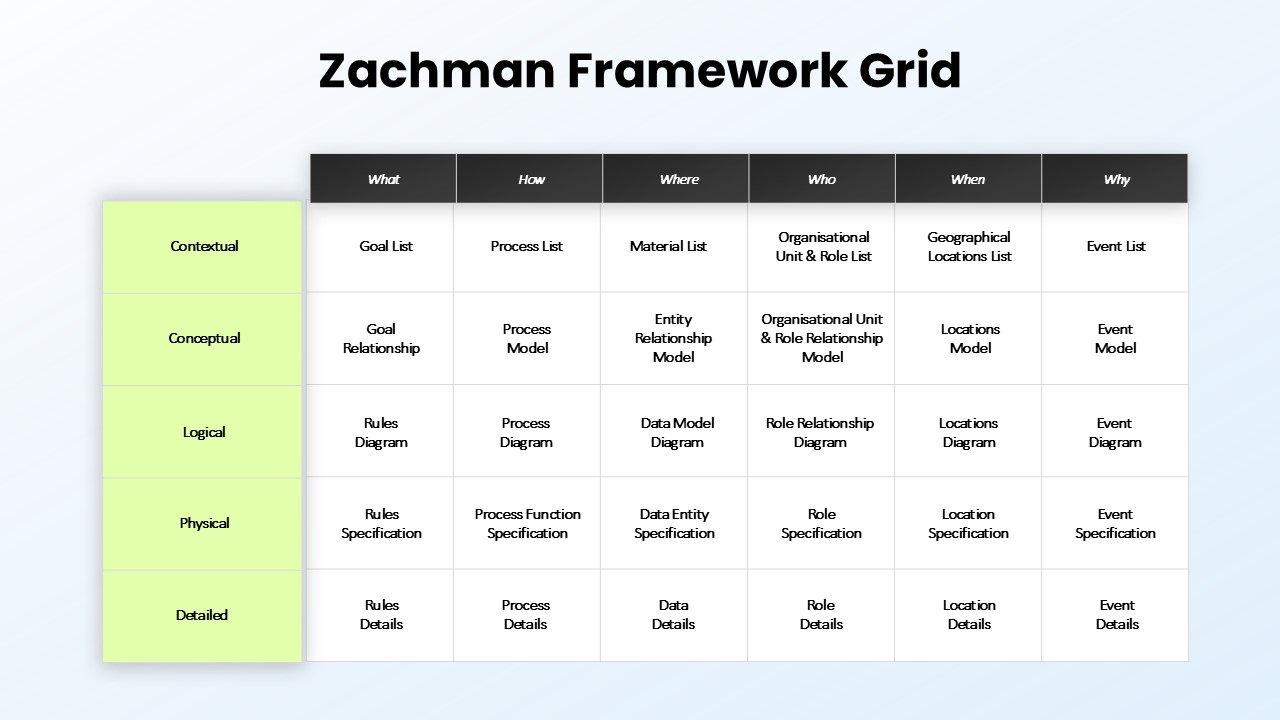
Zachman Framework Grid Overview template for PowerPoint & Google Slides
Process
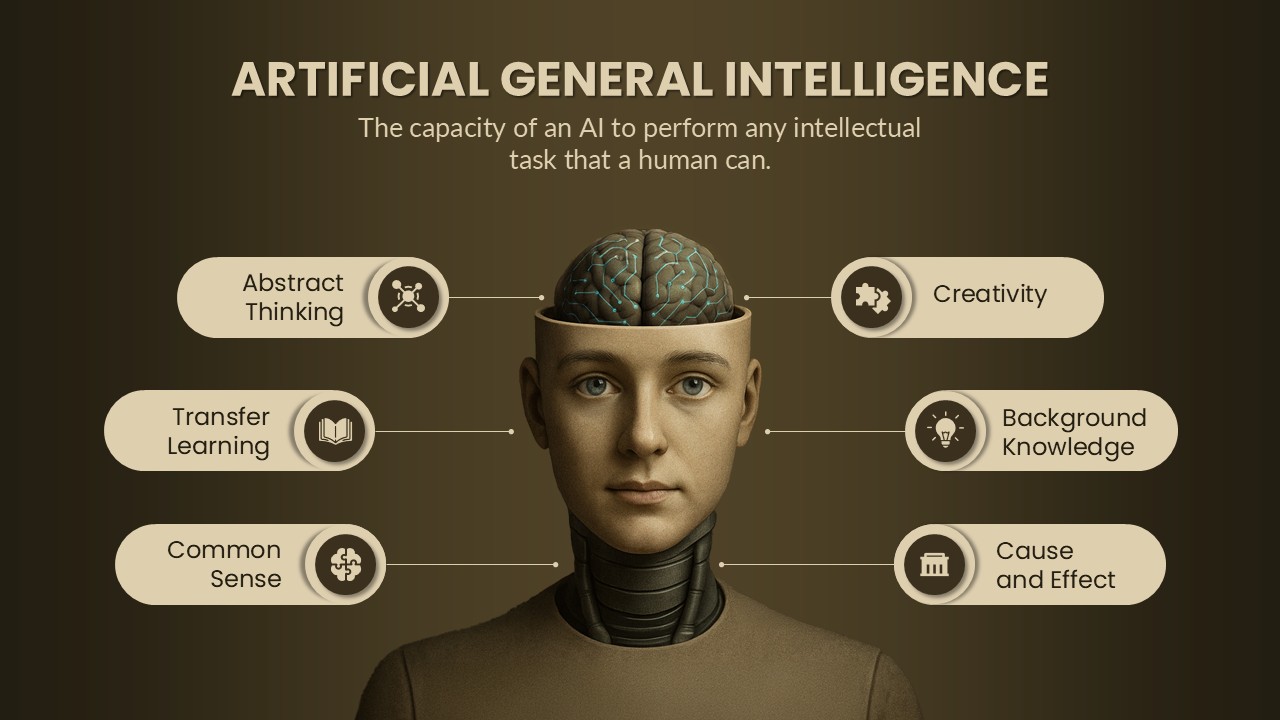
Artificial General Intelligence Overview Template for PowerPoint & Google Slides
AI
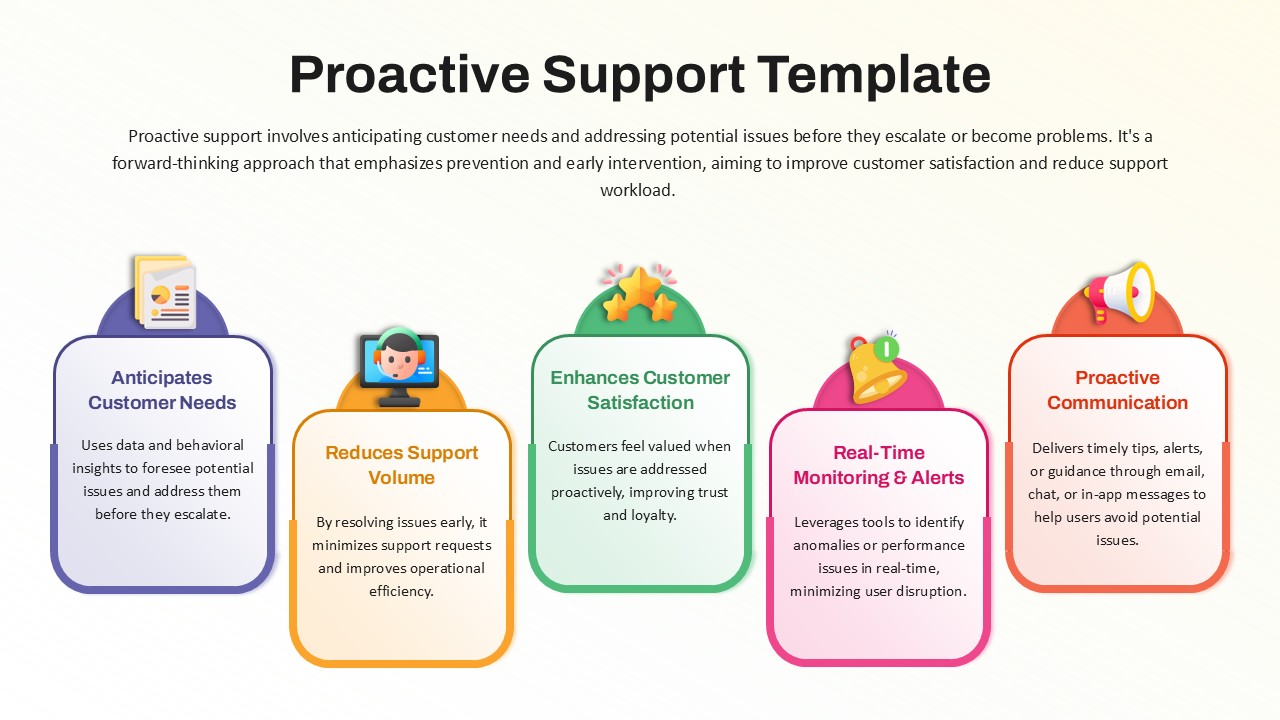
Proactive Support Overview template for PowerPoint & Google Slides
Business
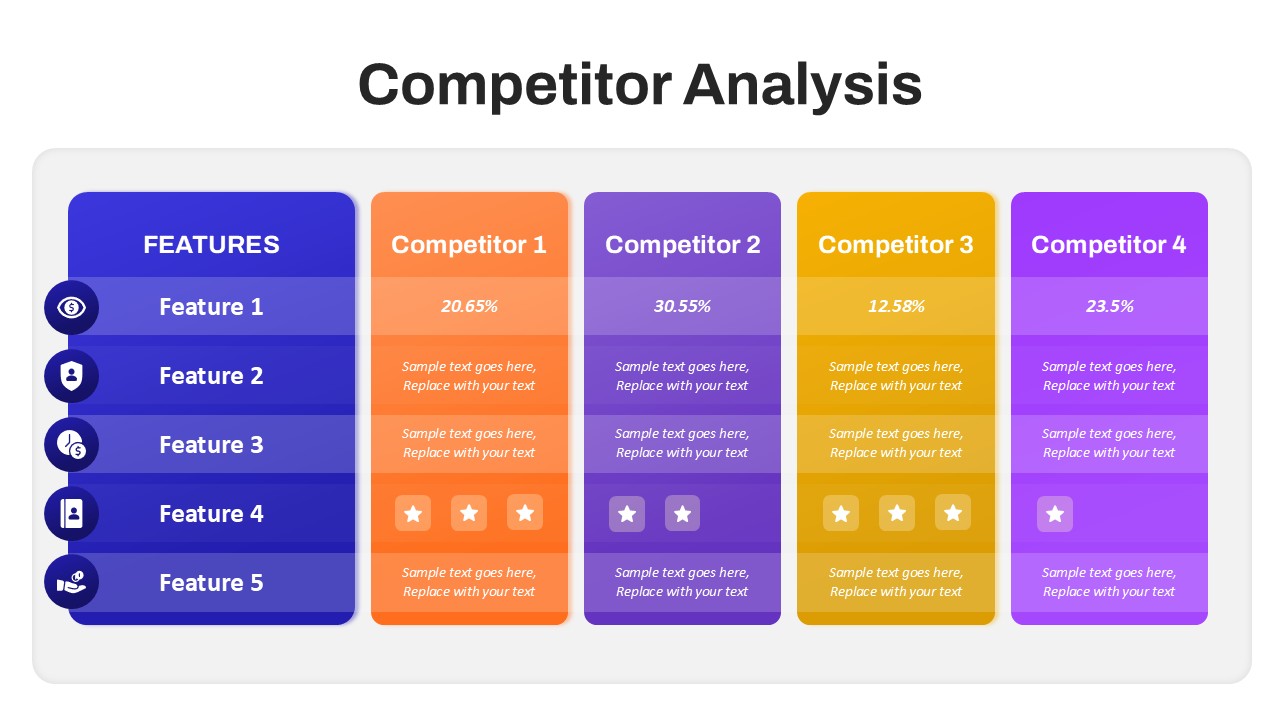
Competitor Analysis Overview template for PowerPoint & Google Slides
Competitor Analysis
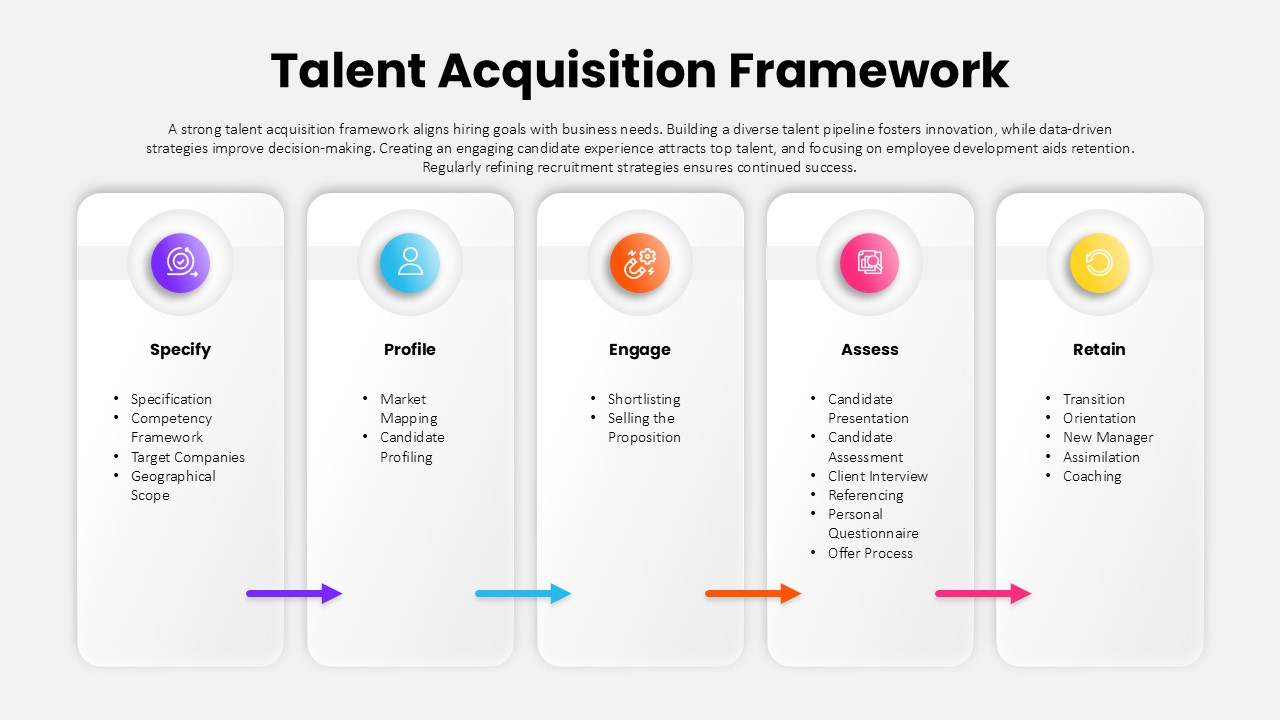
Talent Acquisition Framework Overview template for PowerPoint & Google Slides
Business Strategy
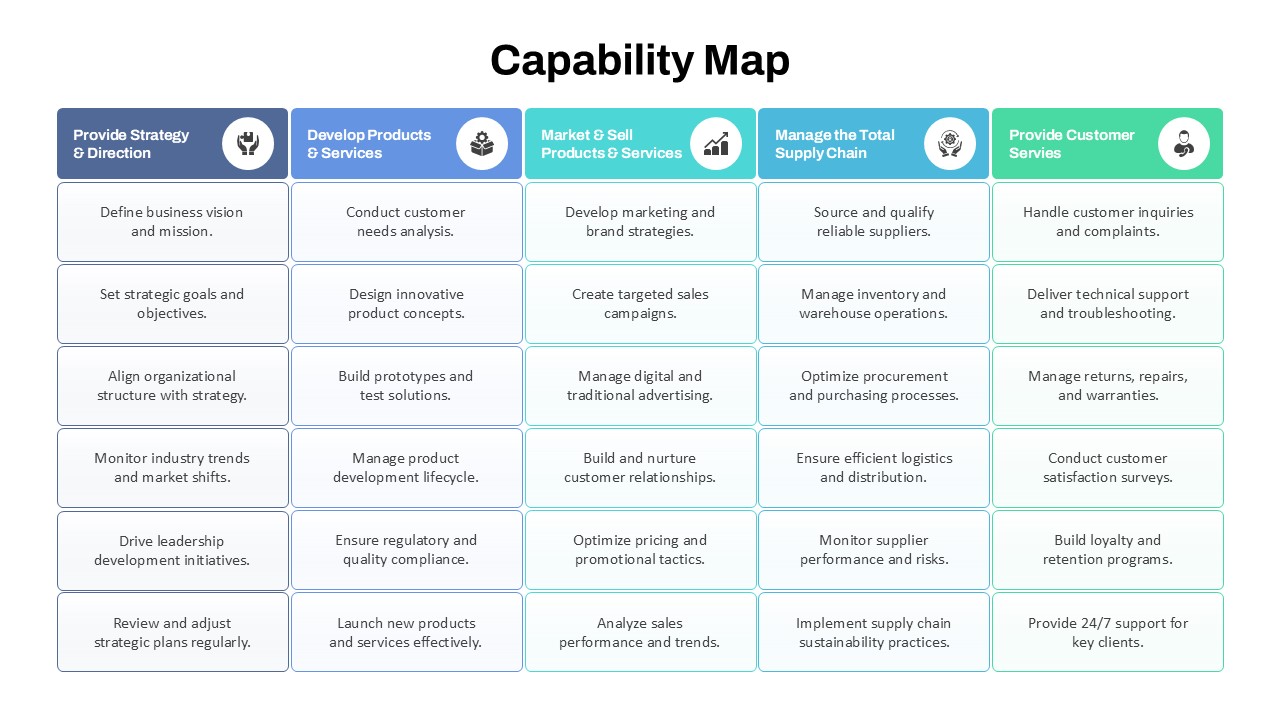
Capability Map Overview Template for PowerPoint & Google Slides
Business Strategy
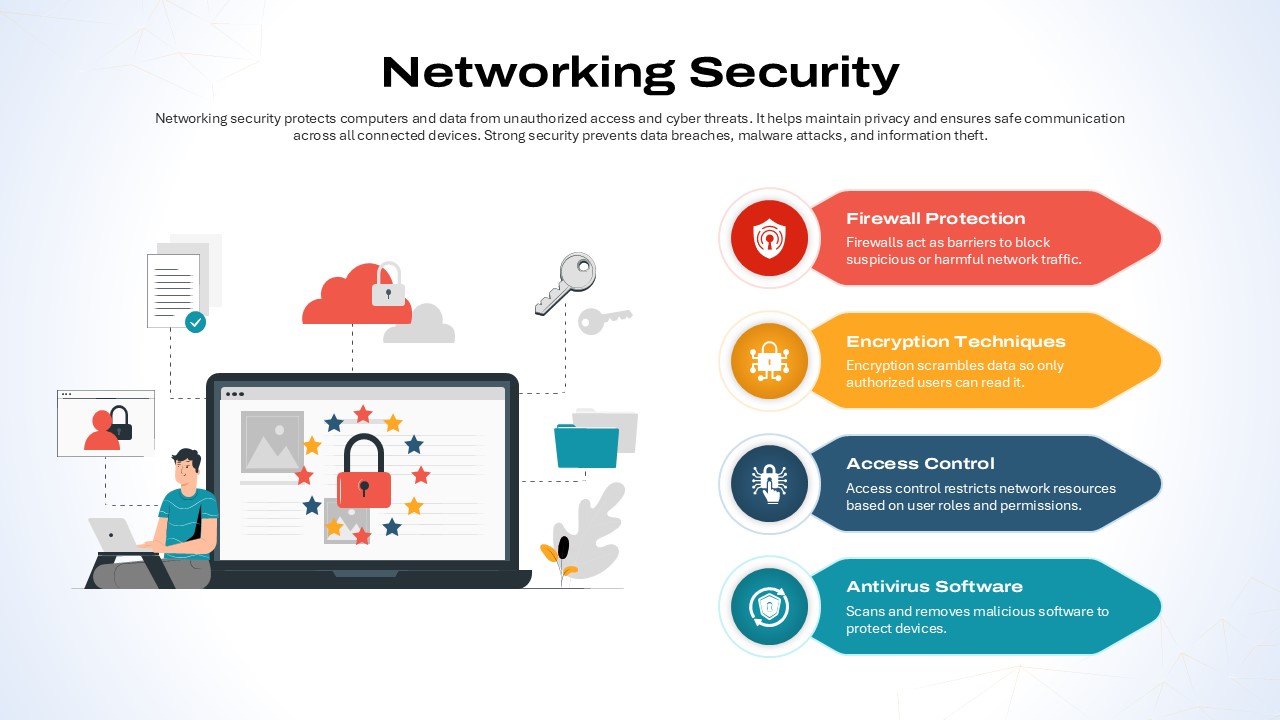
Networking Security overview template for PowerPoint & Google Slides
Technology
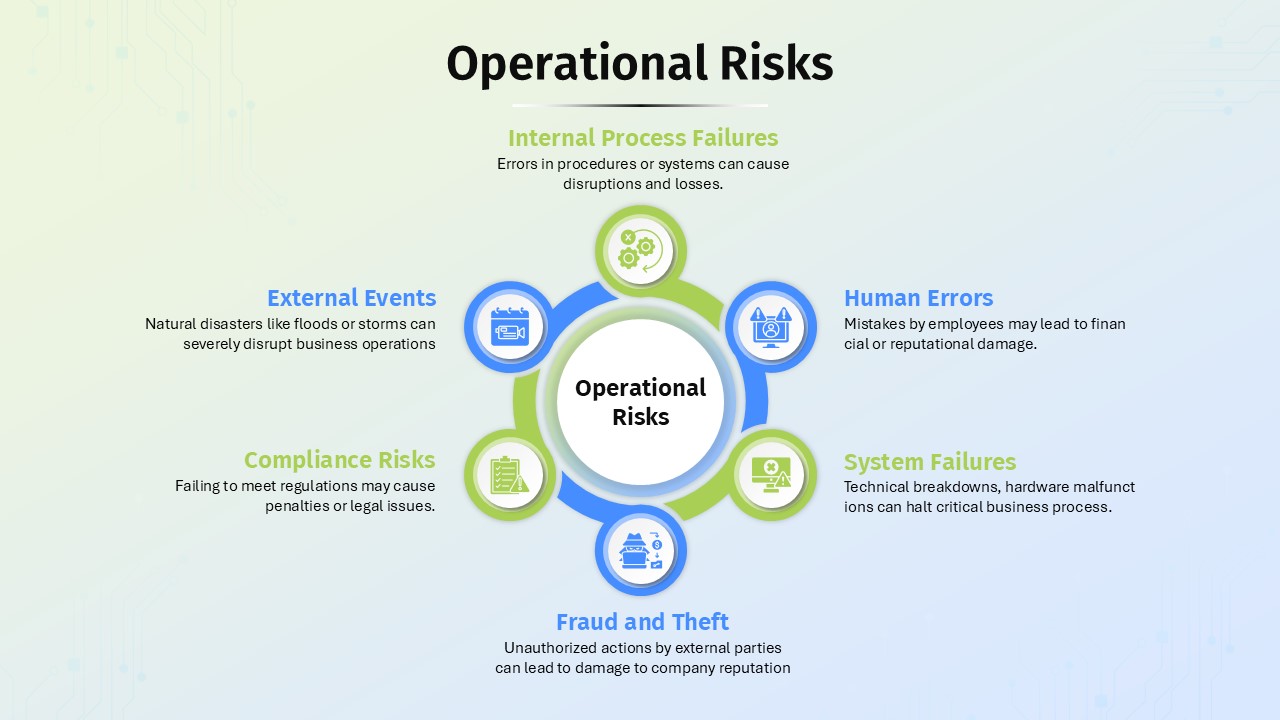
Operational Risks Overview template for PowerPoint & Google Slides
Business
Pediatric Health Services Overview Template for PowerPoint & Google Slides
Health
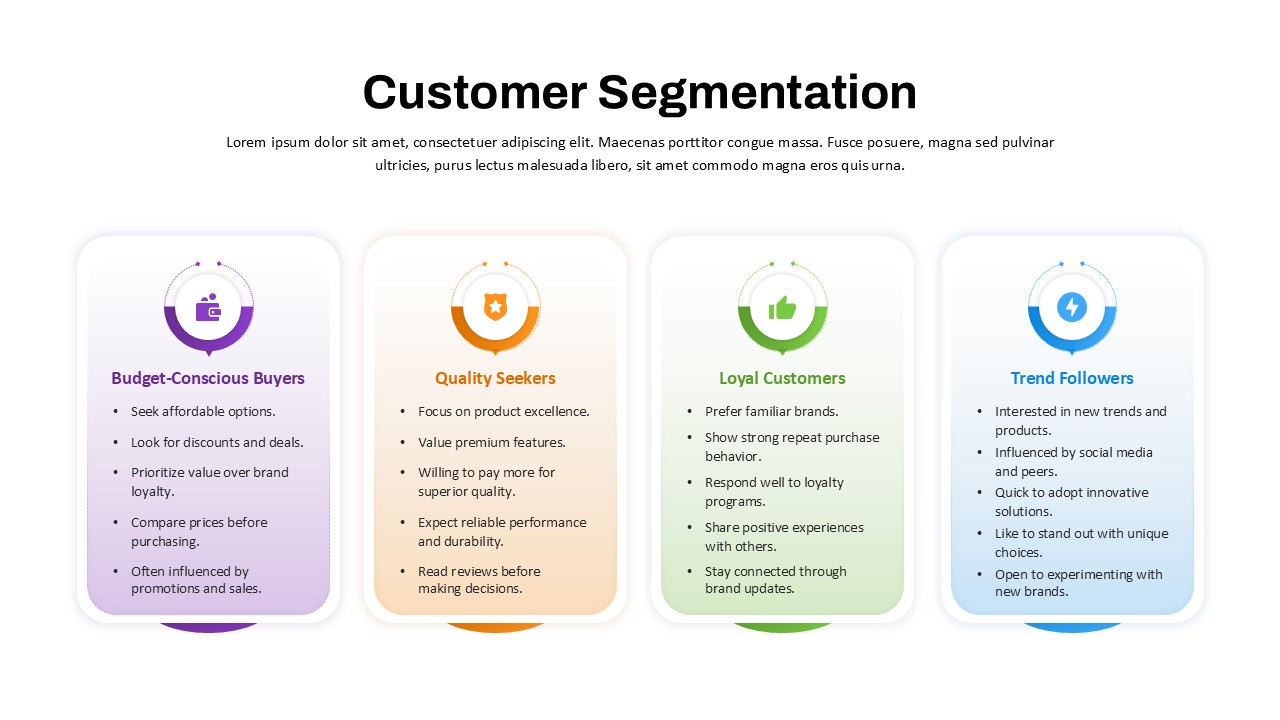
Customer Segmentation Overview template for PowerPoint & Google Slides
Marketing
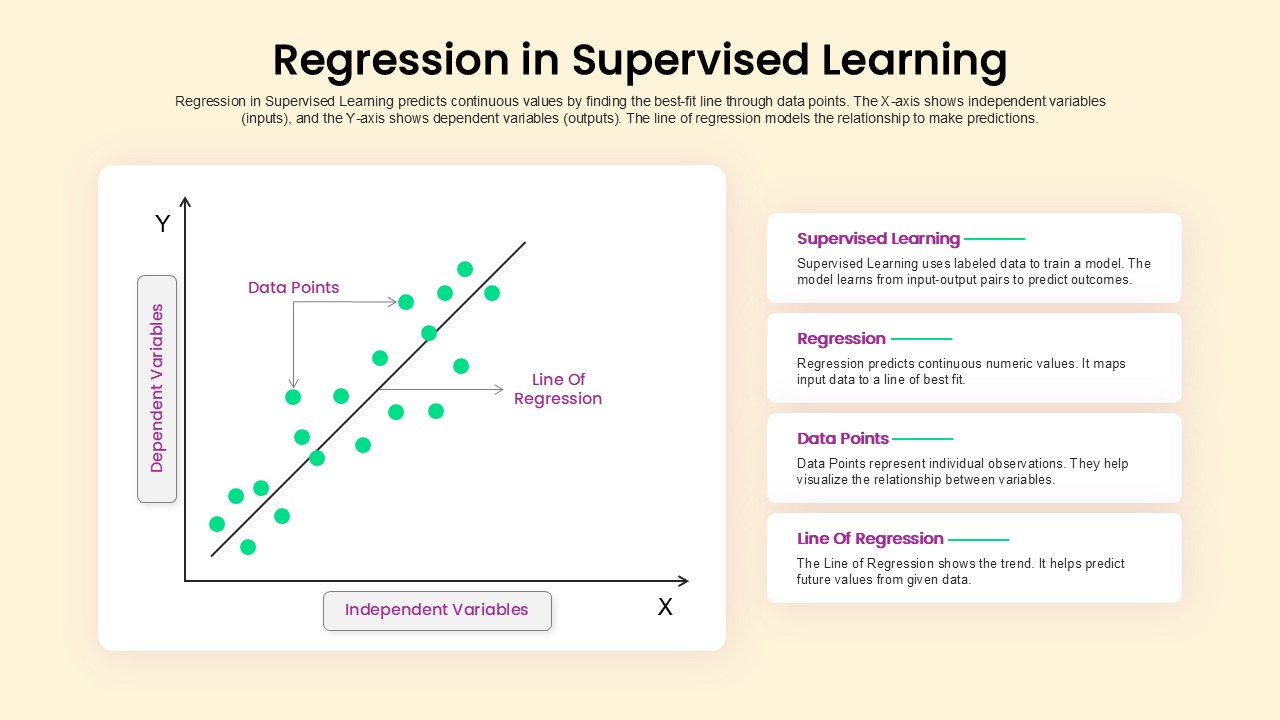
Regression in Supervised Learning Overview template for PowerPoint & Google Slides
Process
Machine Learning Overview Slide Template for PowerPoint & Google Slides
Machine Learning
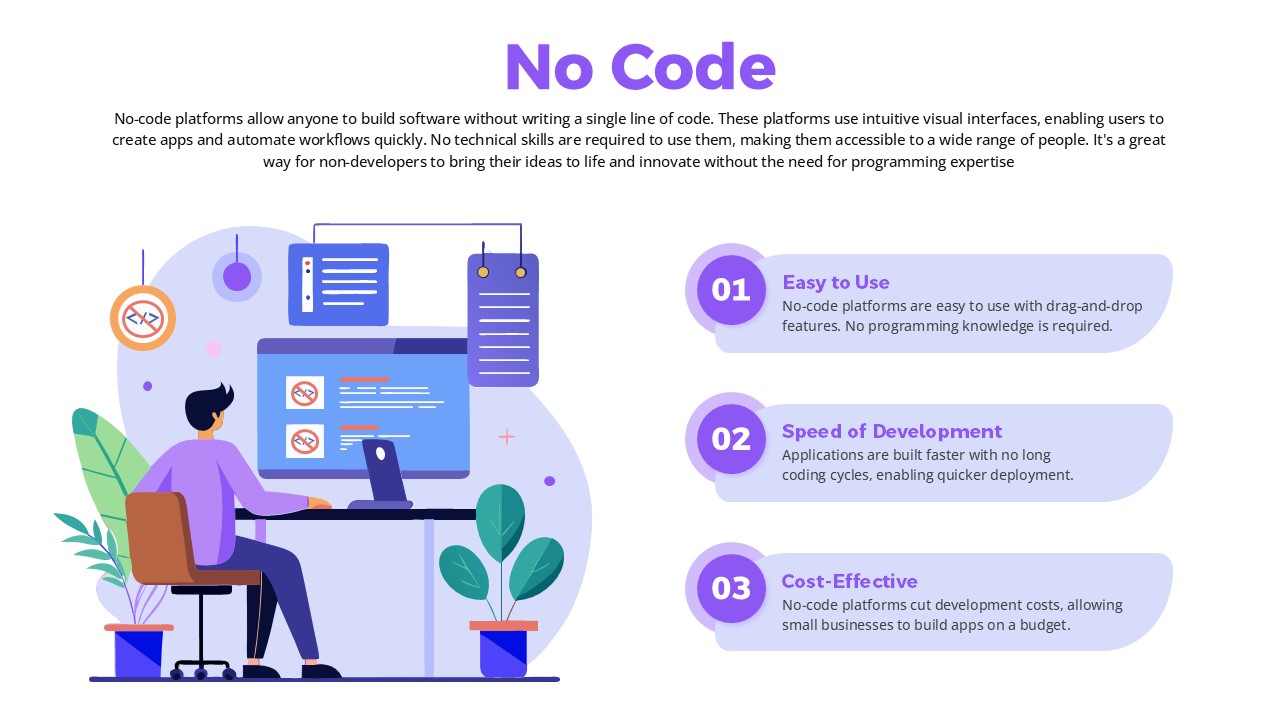
No-Code Overview with 3 Key Benefits Template for PowerPoint & Google Slides
Software Development
Machine Learning Pipeline Overview Template for PowerPoint & Google Slides
Machine Learning
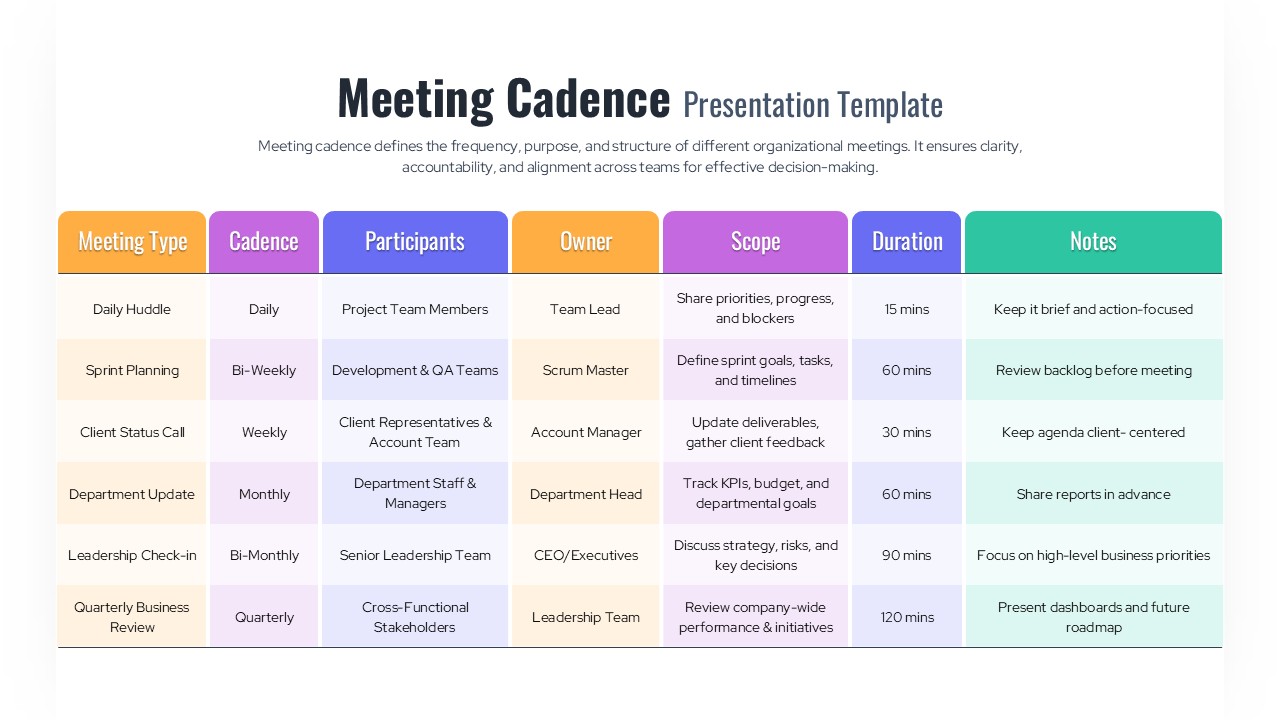
Meeting Cadence Schedule Overview Template for PowerPoint & Google Slides
Leadership
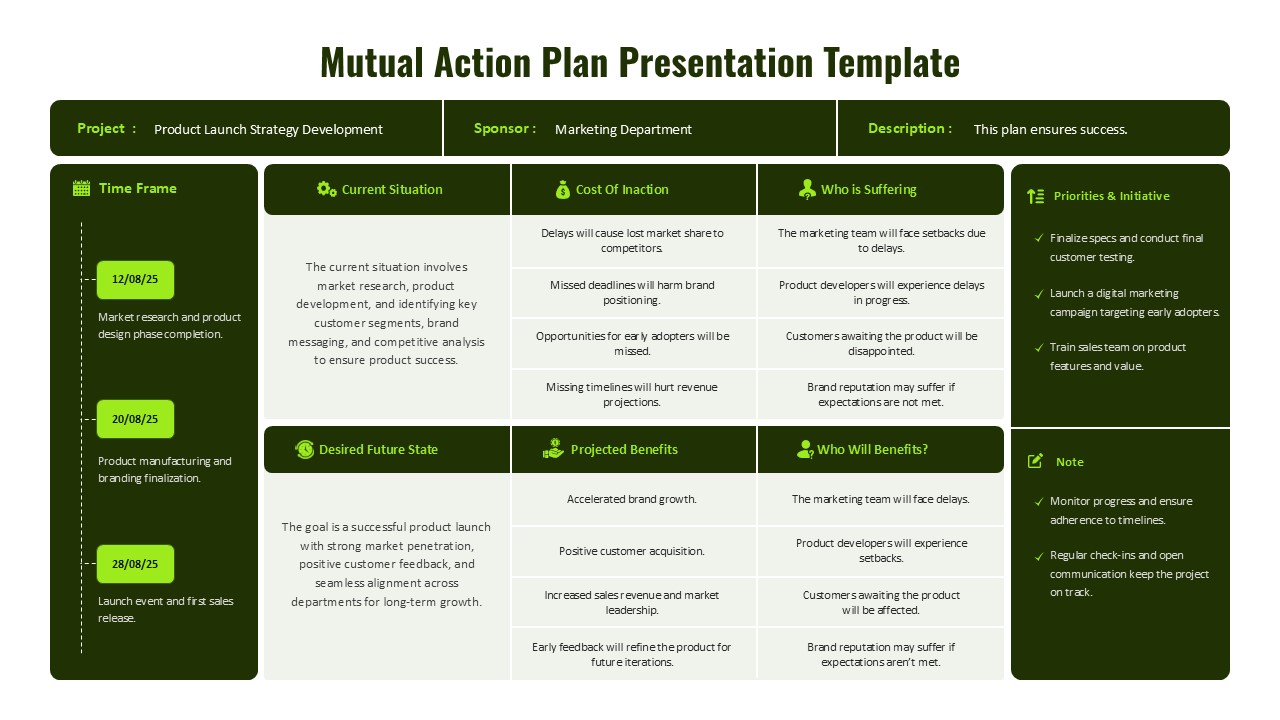
Mutual Action Plan Framework Overview Template for PowerPoint & Google Slides
Project