Strategic Planning Curve Diagram Template for PowerPoint & Google Slides


Description
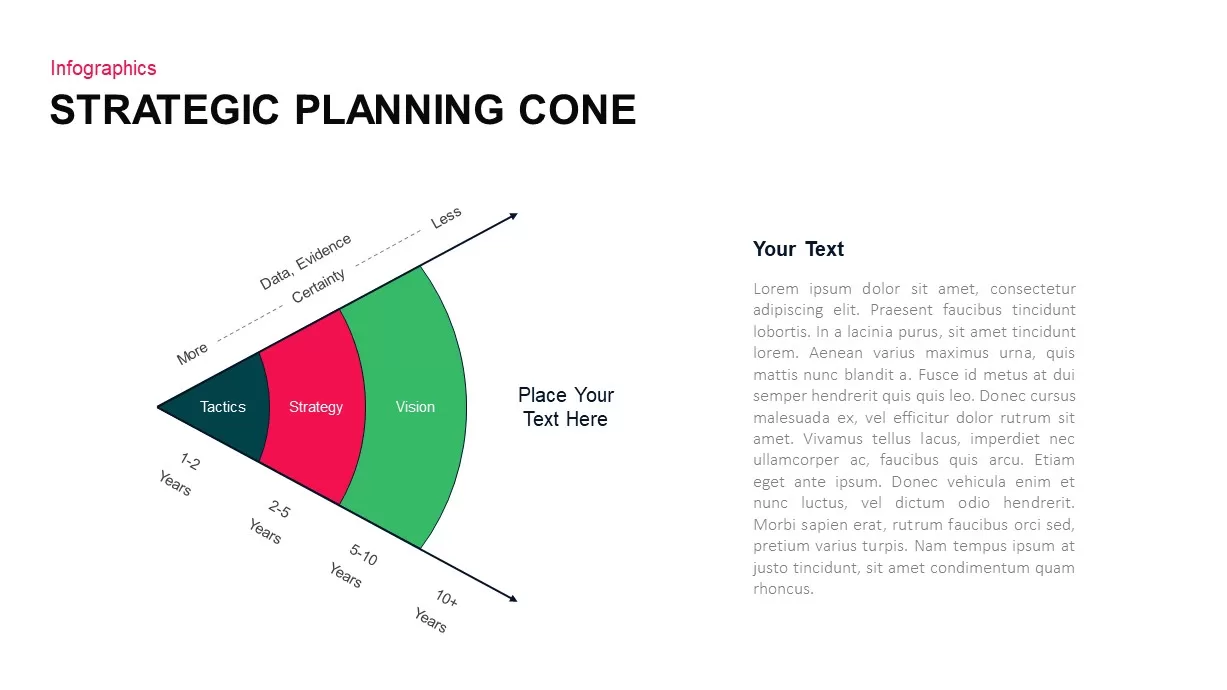
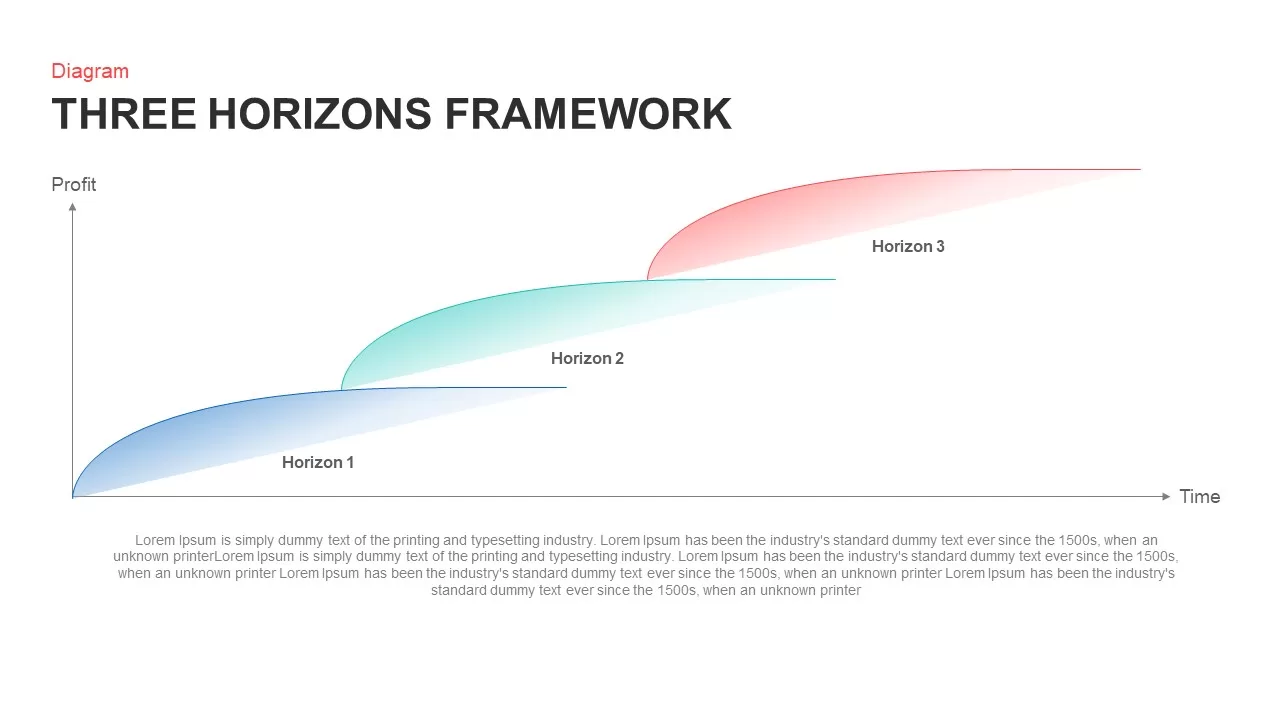
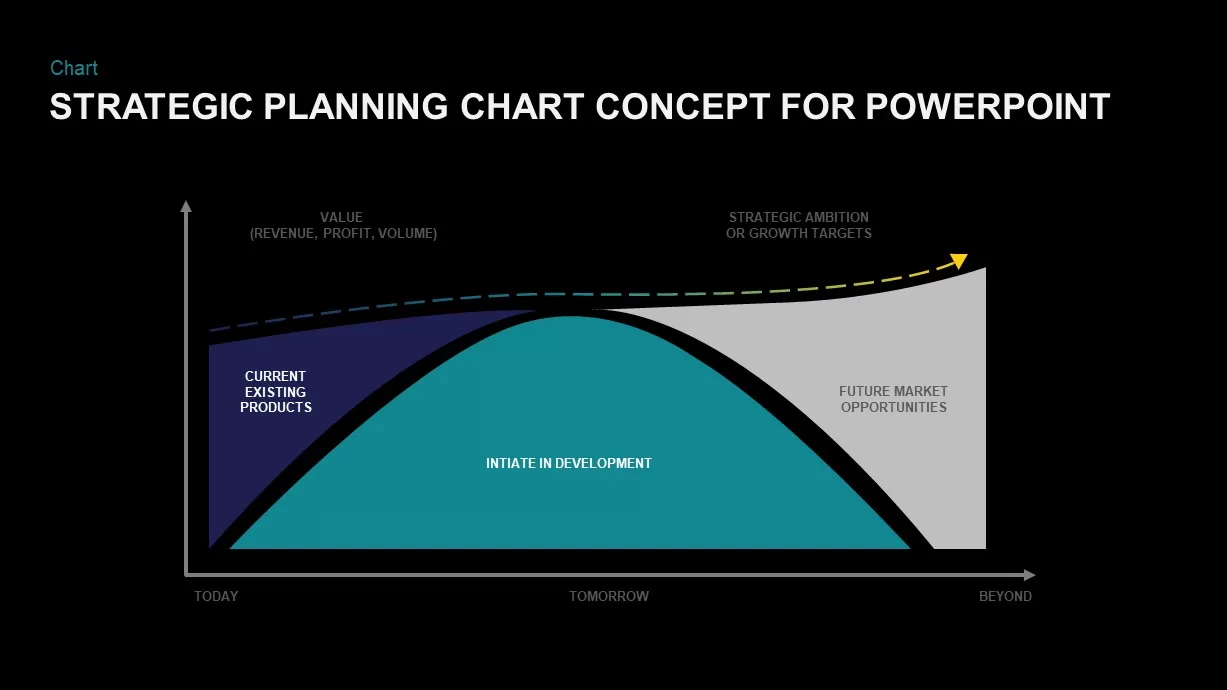
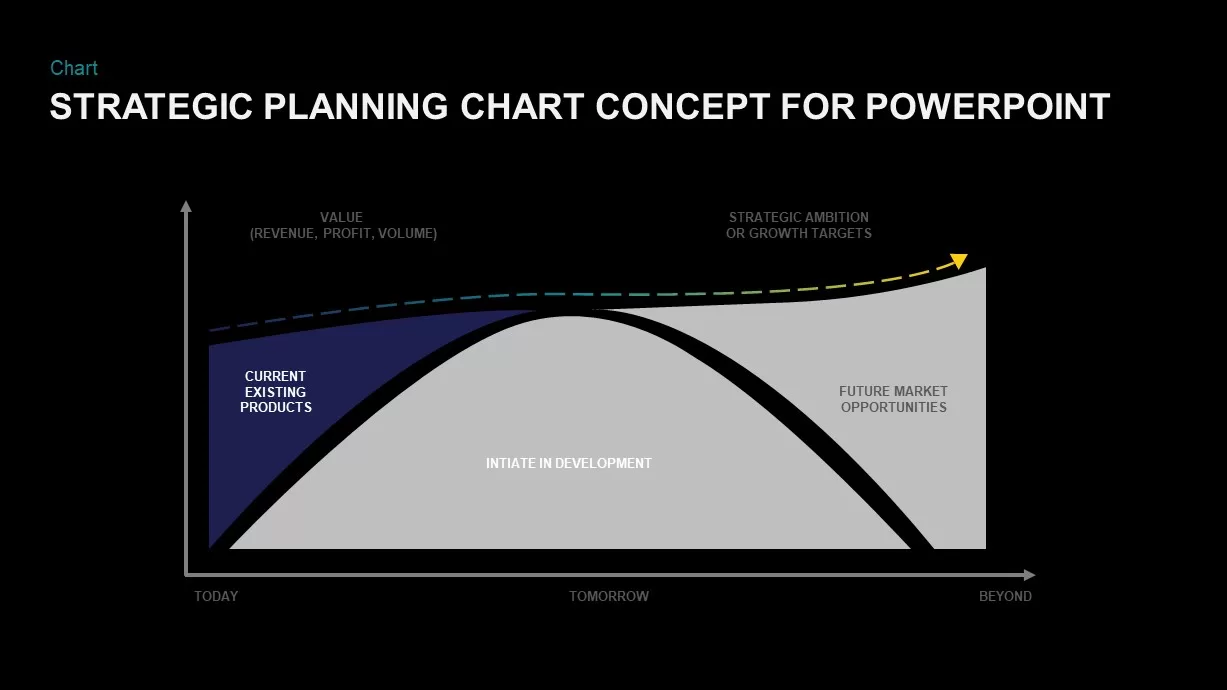
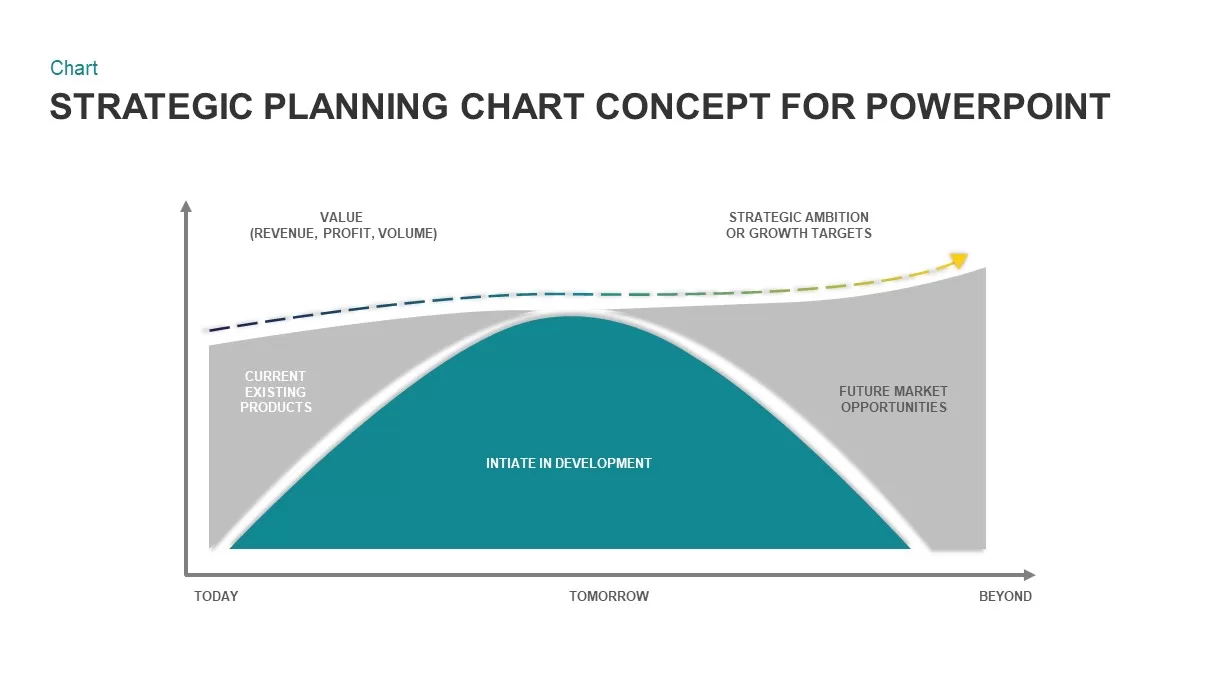
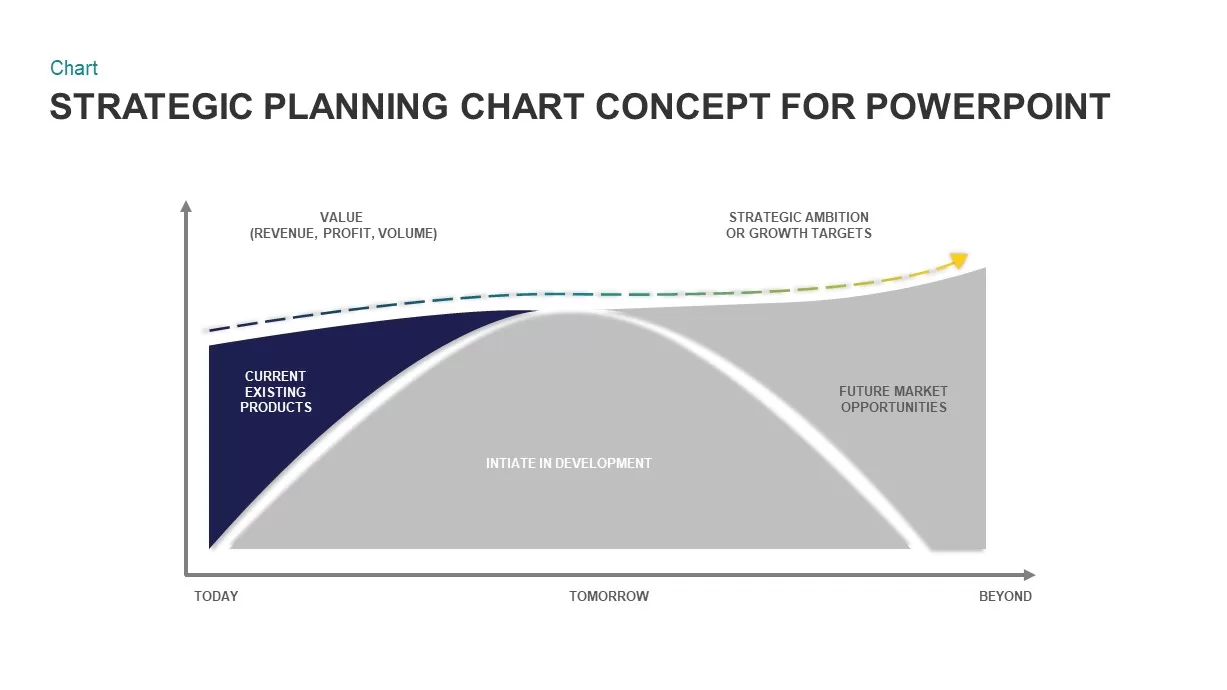
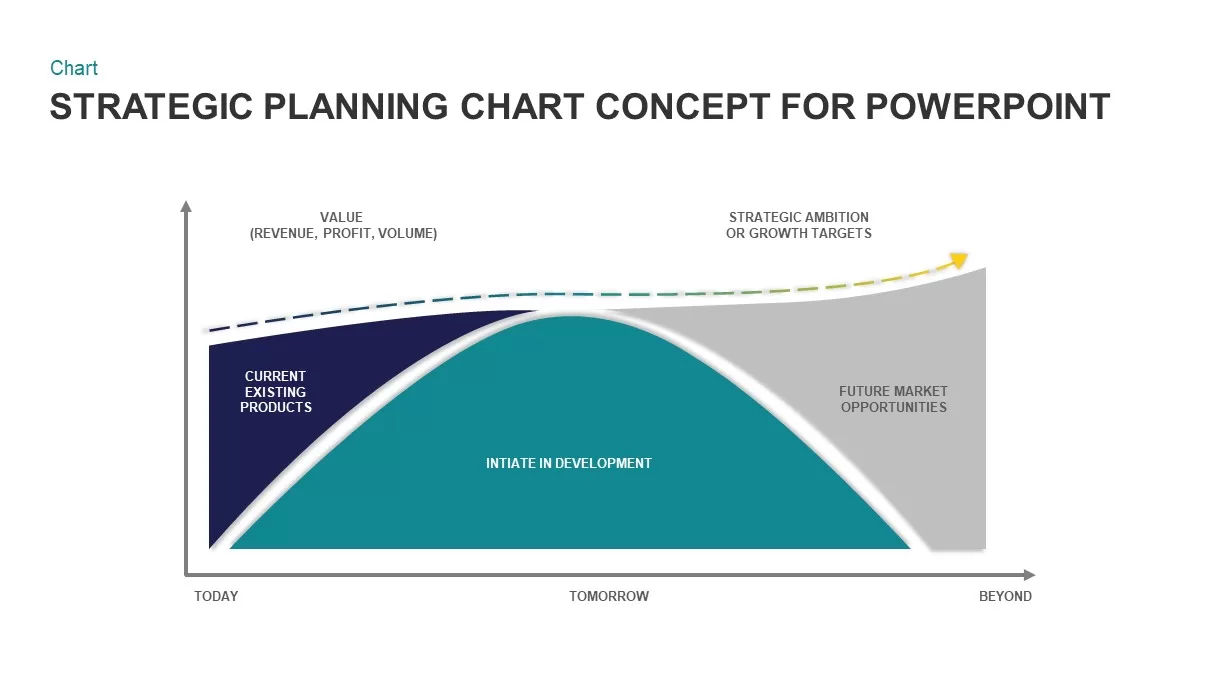
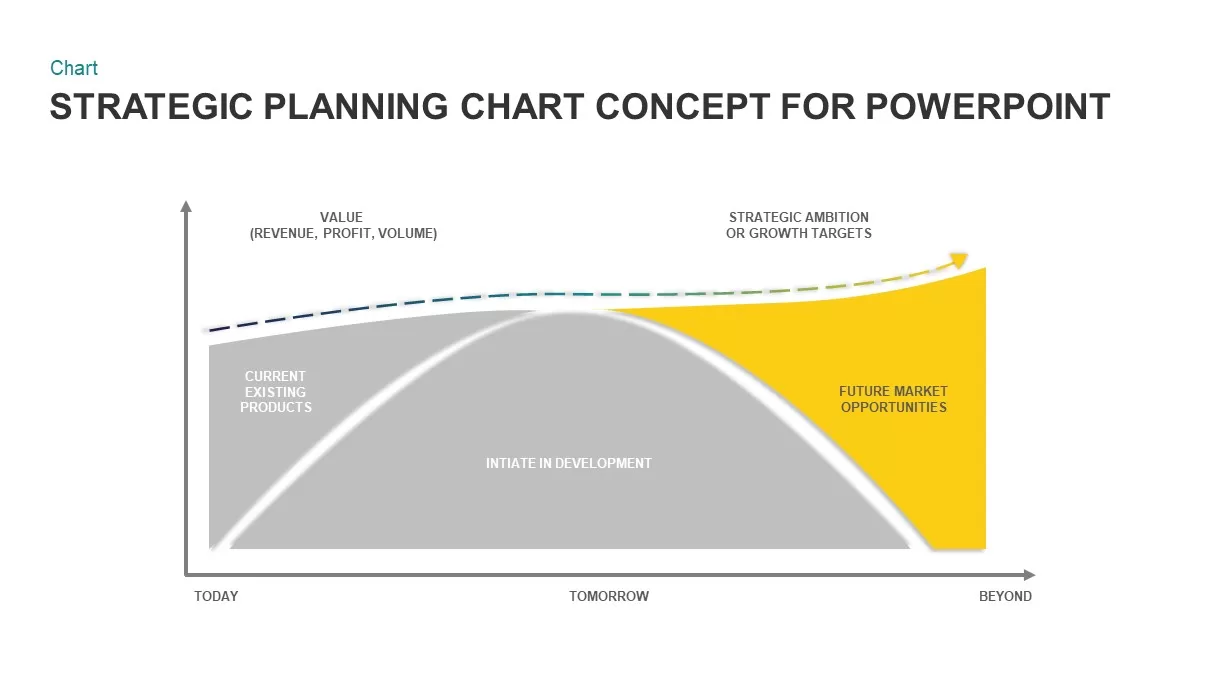
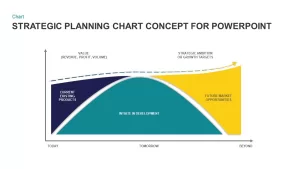
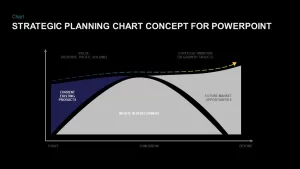
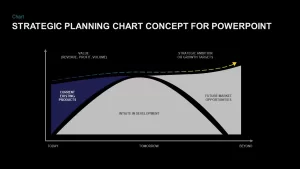
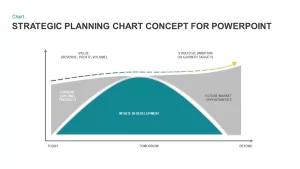
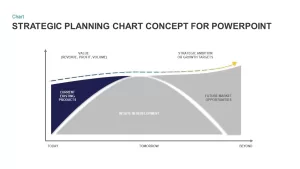
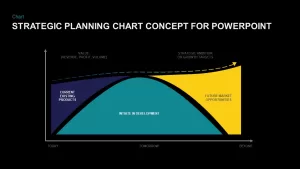
This versatile strategic planning curve diagram visualizes the progression from current products through development phases to future market opportunities on a value timeline. Three gradient-filled zones—navy for existing products, teal for initiatives in development, and yellow for future opportunities—are overlaid by a smooth curve and capped by a dashed ambition line. Each zone includes a bold label and ample space for concise annotations of objectives, KPIs, or market insights. The clean gray axes and minimal background focus attention on your data, while subtle drop shadows add depth.
Built on editable master slides, this infographic uses vector shapes and gradient fills to guarantee crisp scaling and theme-aware formatting in both PowerPoint and Google Slides. Swap colors, adjust segment widths, or replace labels in seconds with drag-and-drop placeholders and smart guides that enforce consistent spacing. Whether you’re mapping product lifecycles, forecasting revenue growth, or aligning on strategic targets, this slide streamlines storytelling and drives informed decision-making.
Leverage preconfigured text styles for headlines and body copy, and duplicate or reorder segments to reflect alternate scenarios. The modular design also supports overlaying percentage metrics, embedding icons, or extending the model with additional phases. With clean typography and a cohesive color palette, this curve-diagram template caters to executive briefings, investor presentations, and cross-functional workshops.
Who is it for
Strategists, product managers, business analysts, and consultants will find this curve diagram essential for illustrating lifecycle stages, forecasting performance, and aligning stakeholders on growth targets.
Other Uses
Repurpose this slide to depict technology adoption curves, capability maturity assessments, market segmentation journeys, or process-improvement roadmaps—simply relabel zones and adjust colors to suit any framework.
Login to download this file

Item ID
SB01728
Related Templates

3-Part Strategic Planning Cone Diagram Template for PowerPoint & Google Slides
Process

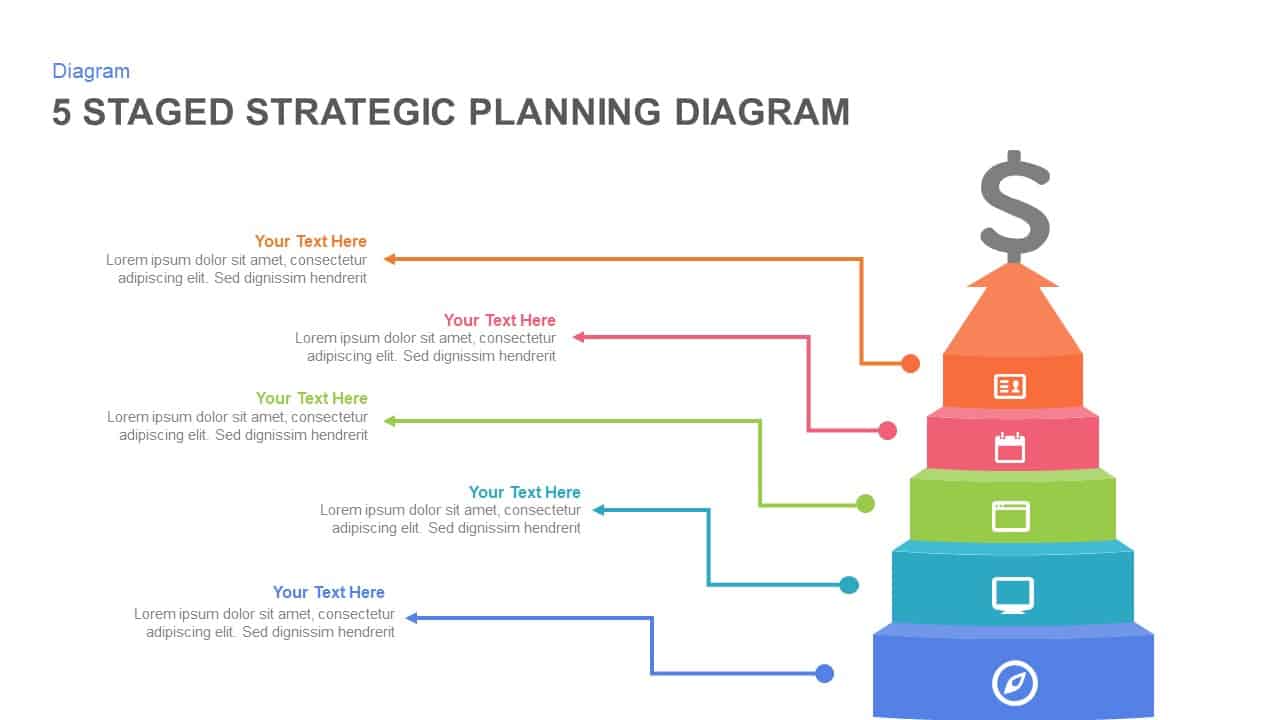
5-Stage Strategic Planning Pyramid Template for PowerPoint & Google Slides
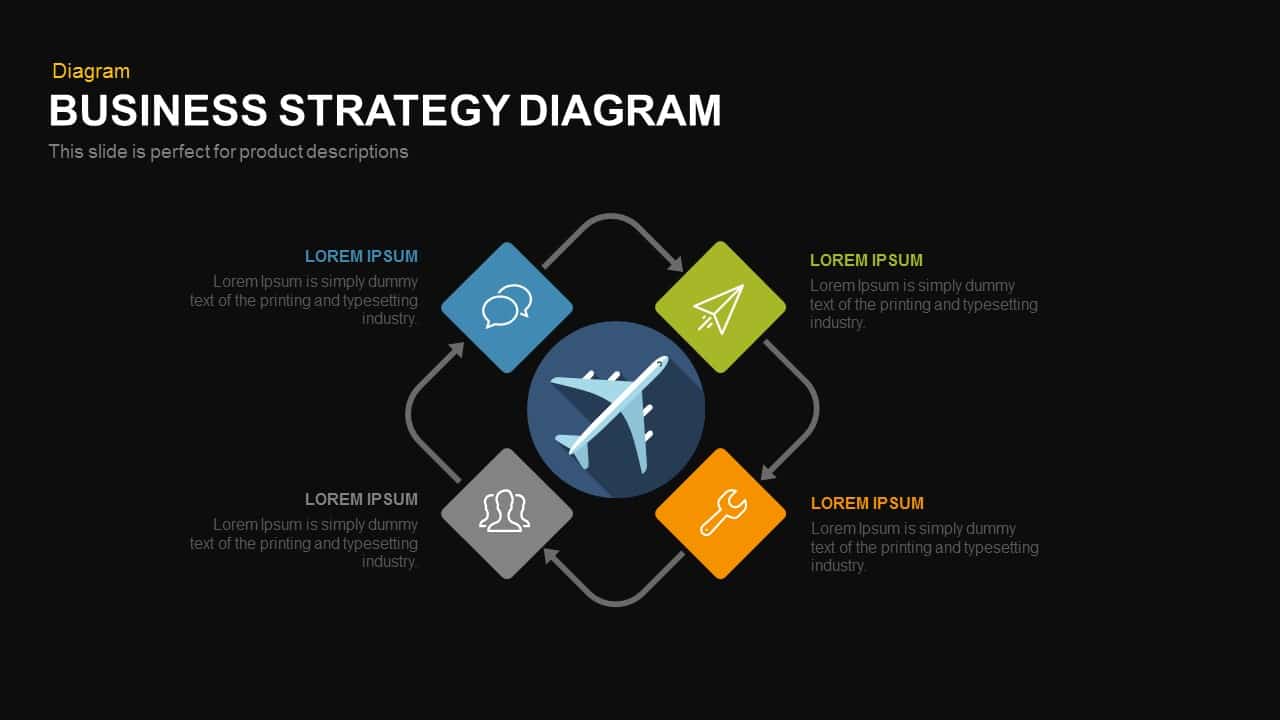
Business Strategy
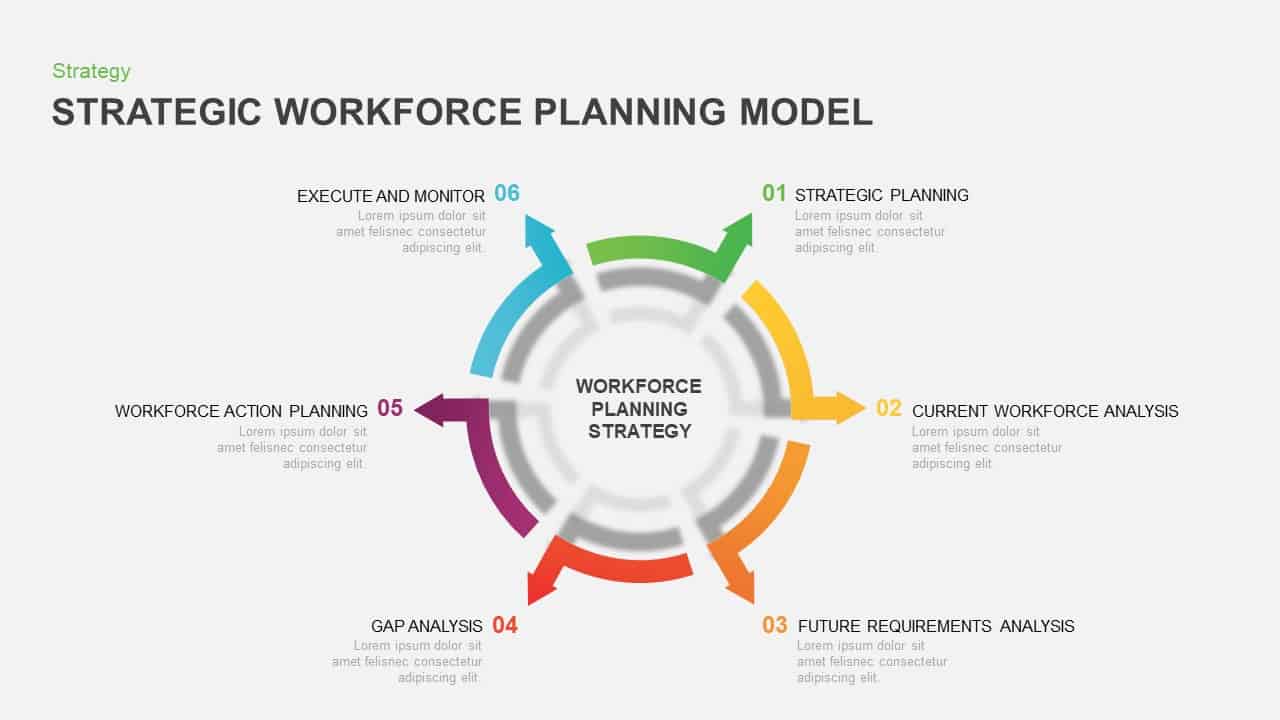
Strategic Workforce Planning Circular Template for PowerPoint & Google Slides
Circular
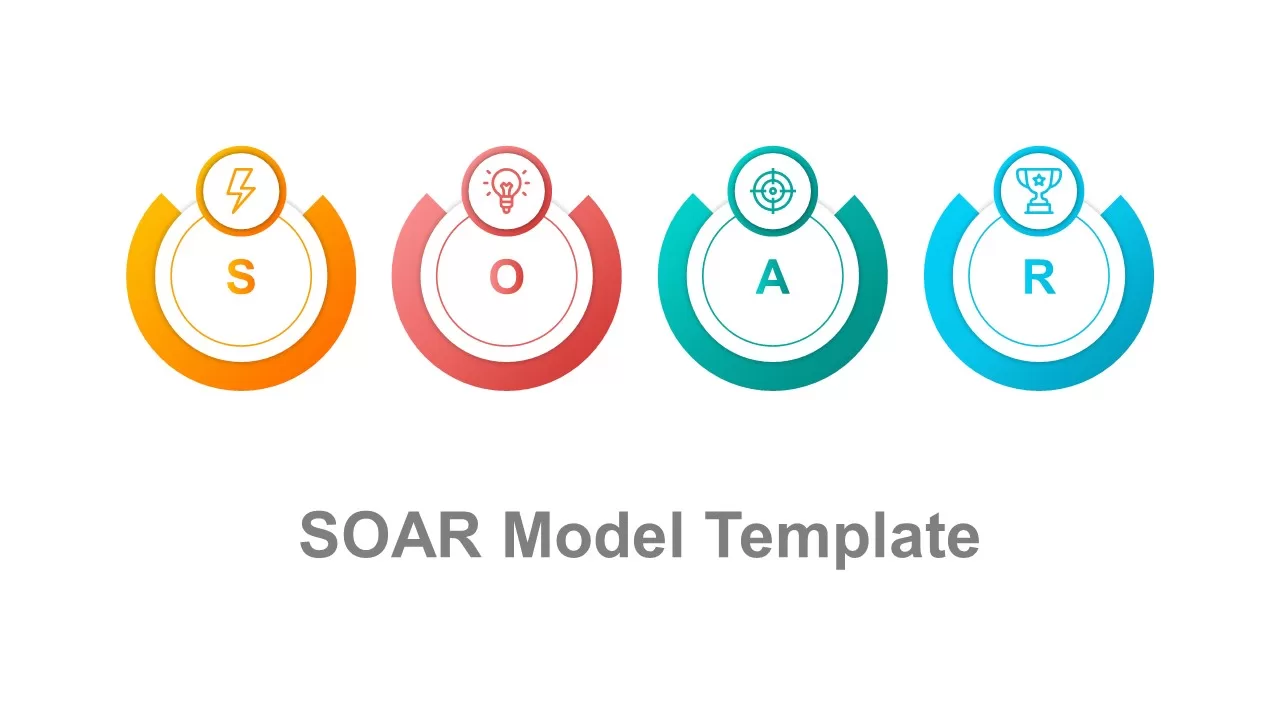
SOAR Strategic Planning Infographic Template for PowerPoint & Google Slides
Process
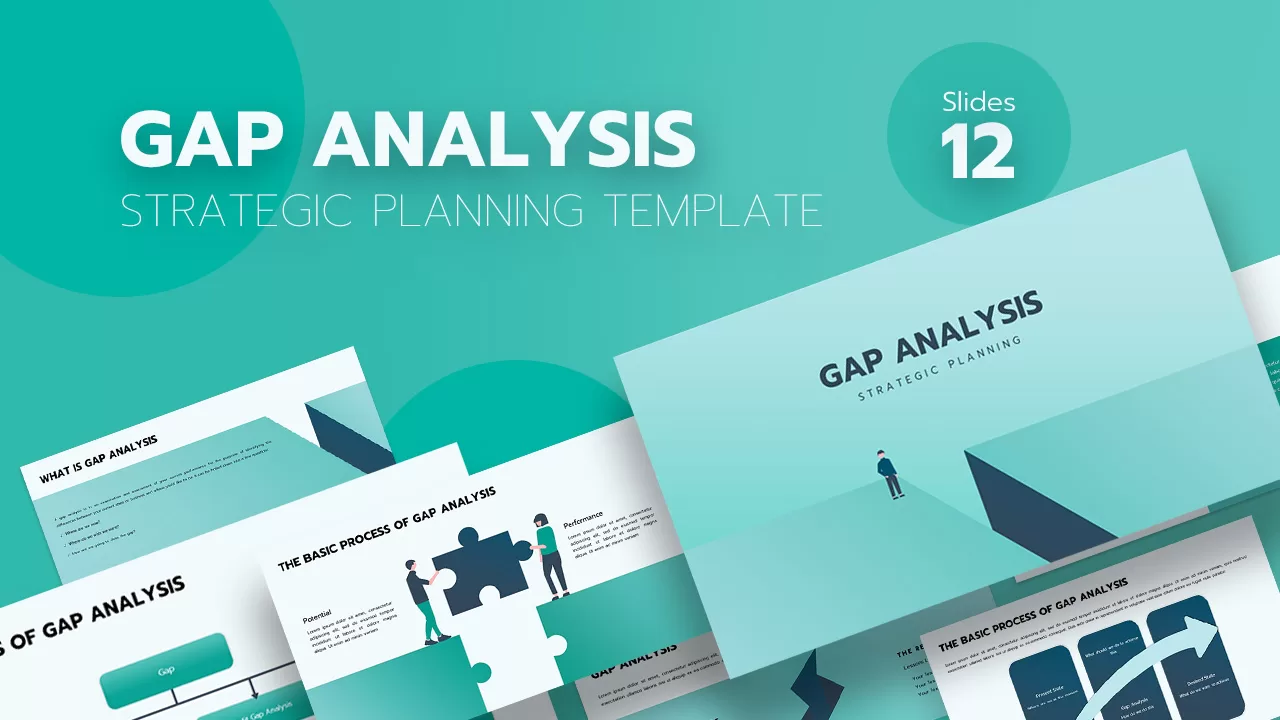
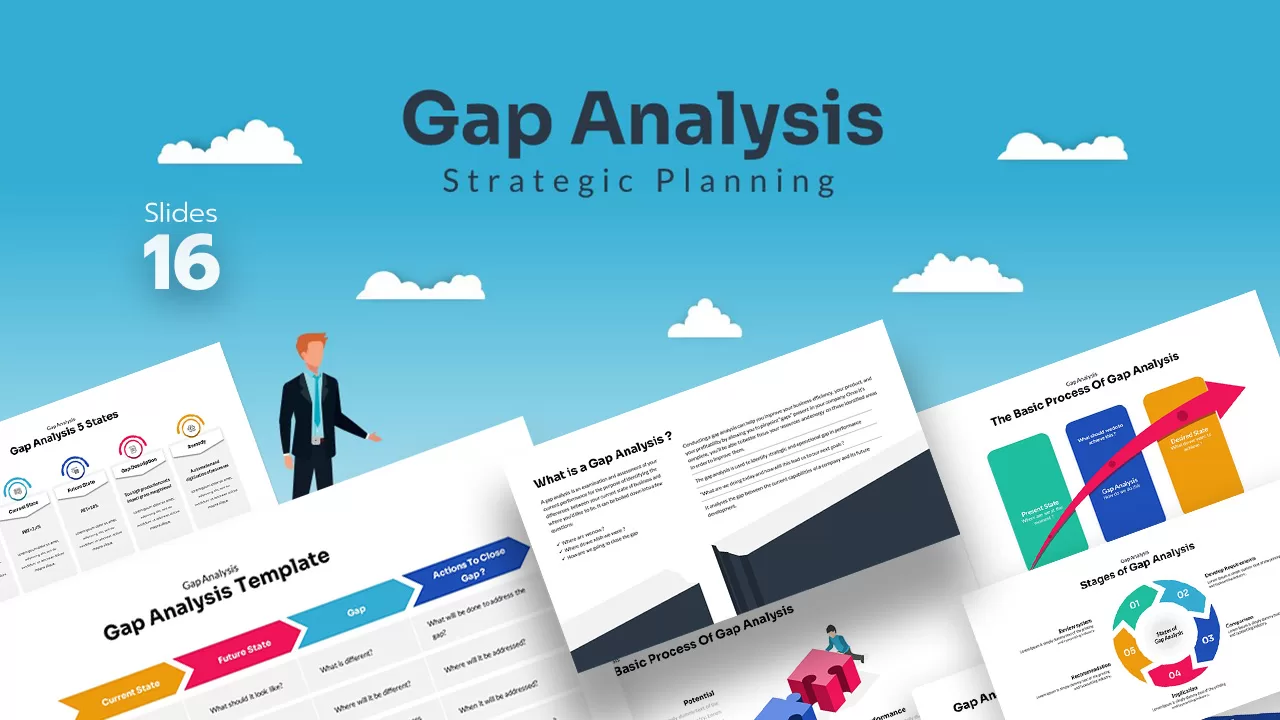
Gap Analysis Strategic Planning Template for PowerPoint & Google Slides
Gap
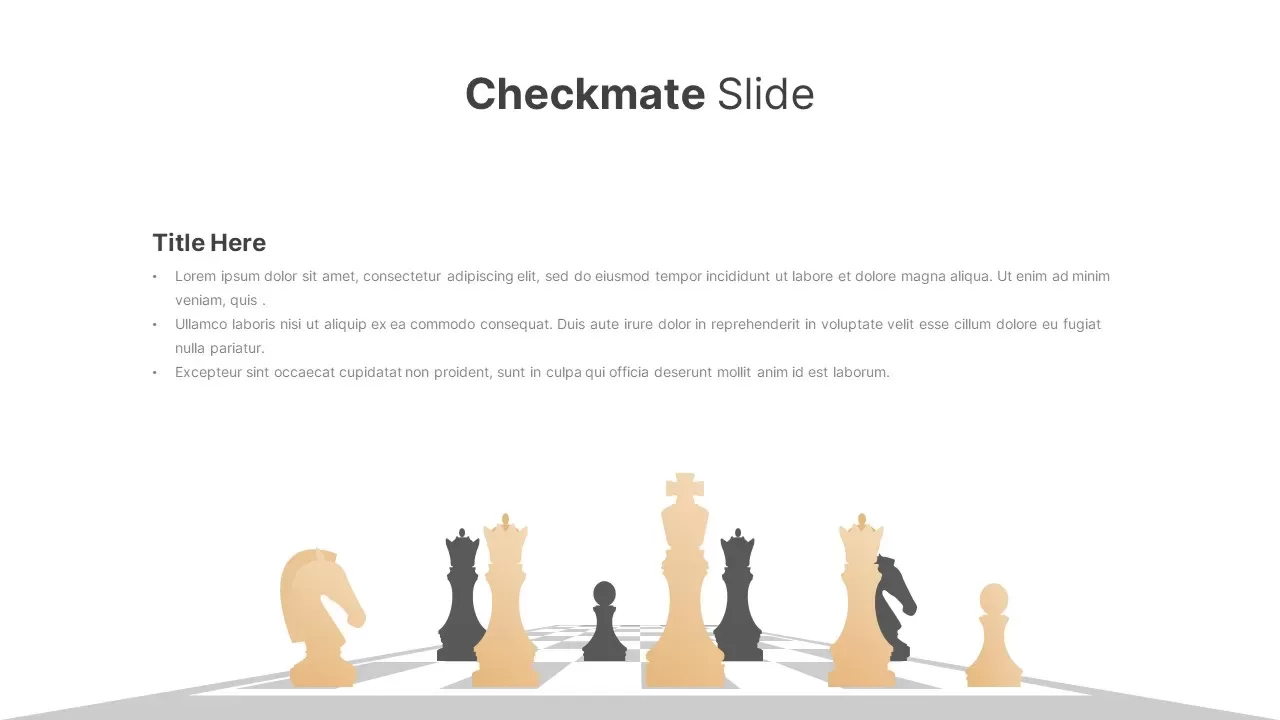
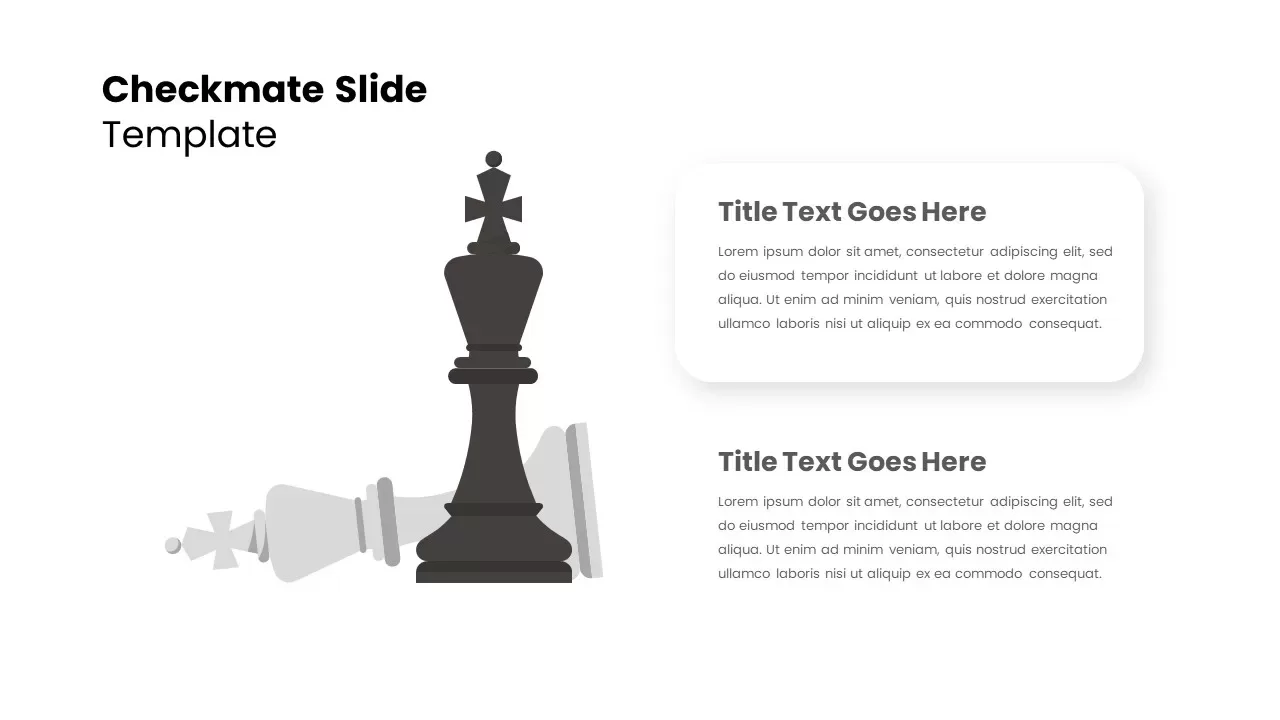
Strategic Checkmate Slide for Planning Template for PowerPoint & Google Slides
Business Report
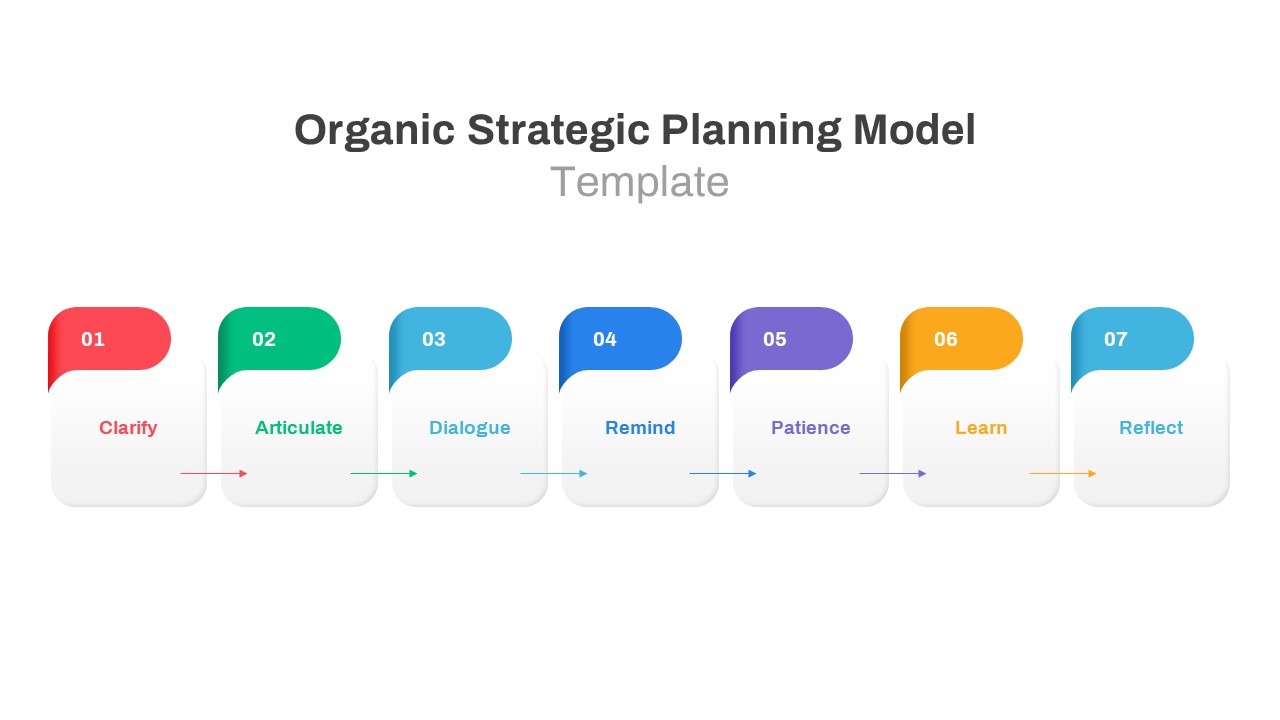
Organic Strategic Planning Model Template for PowerPoint & Google Slides
Business Strategy
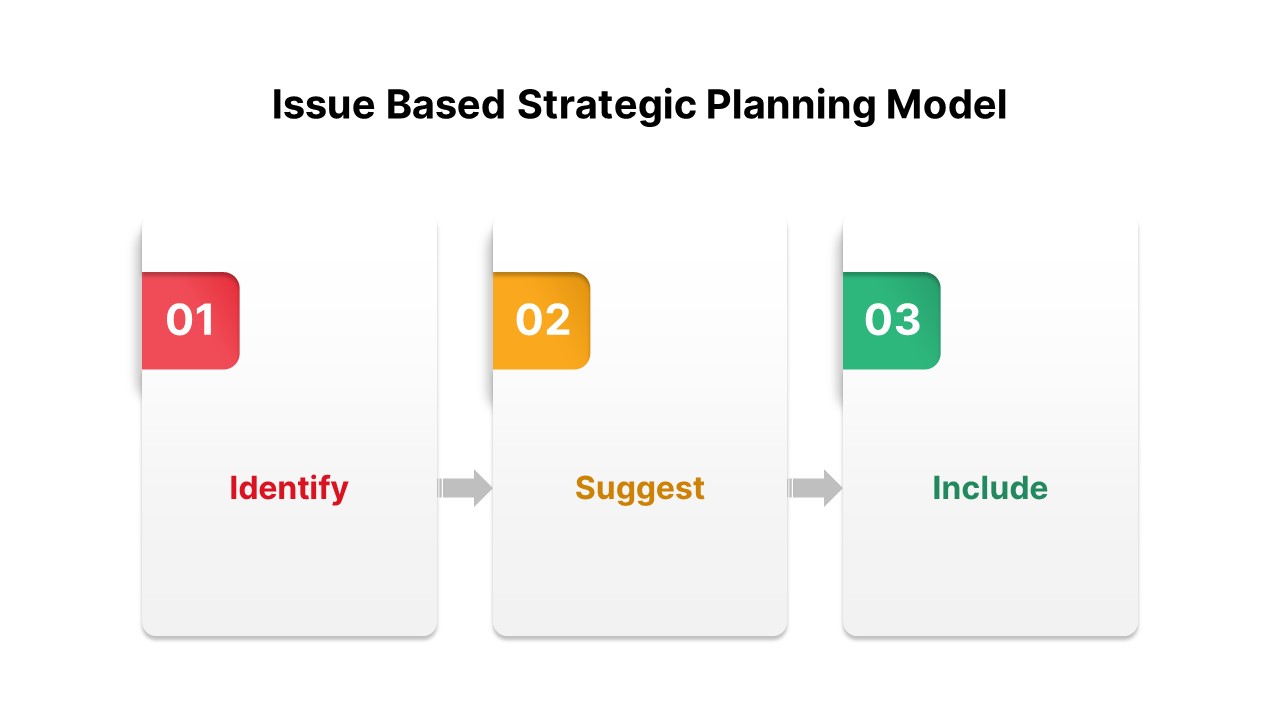
Issue-Based Strategic Planning Model Template for PowerPoint & Google Slides
Business Strategy
Iterative Strategic Planning Cycle Template for PowerPoint & Google Slides
Business Strategy
Strategic Planning Consulting Template for PowerPoint & Google Slides
Business Strategy
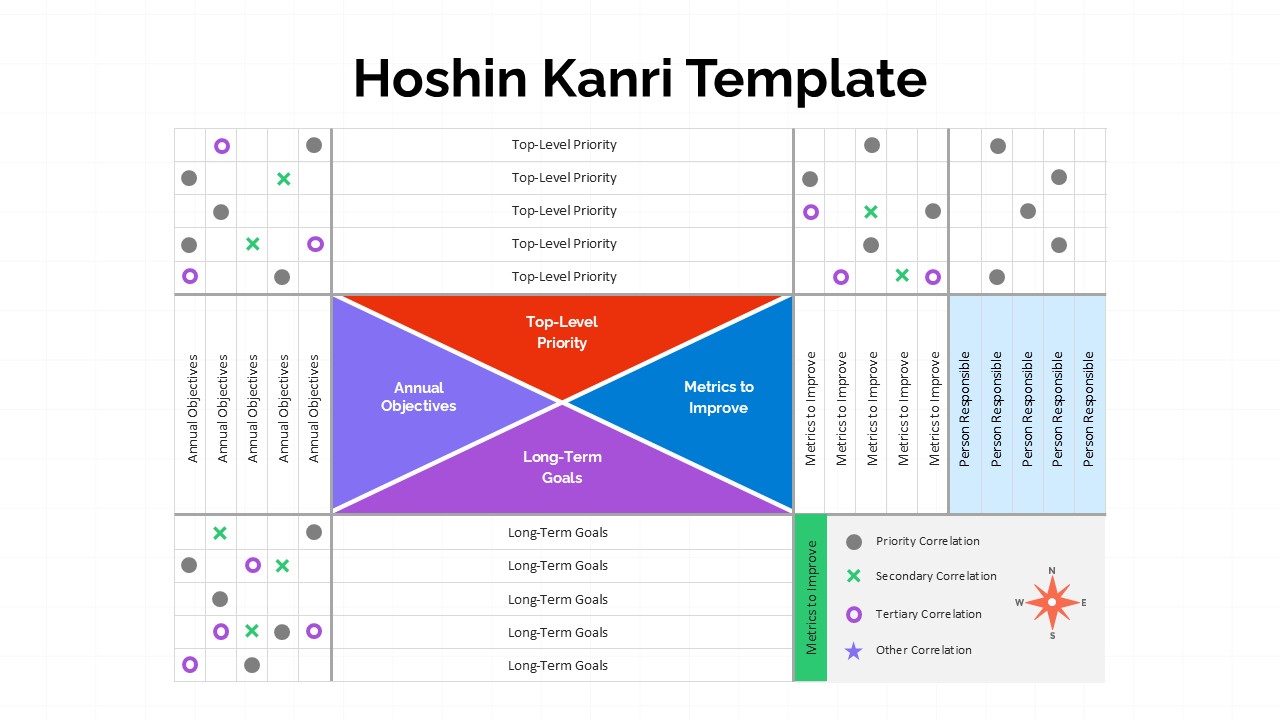
Hoshin Kanri Strategic Planning Matrix Template for PowerPoint & Google Slides
Business Strategy
Gap Analysis Strategic Planning for PowerPoint & Google Slides
Business
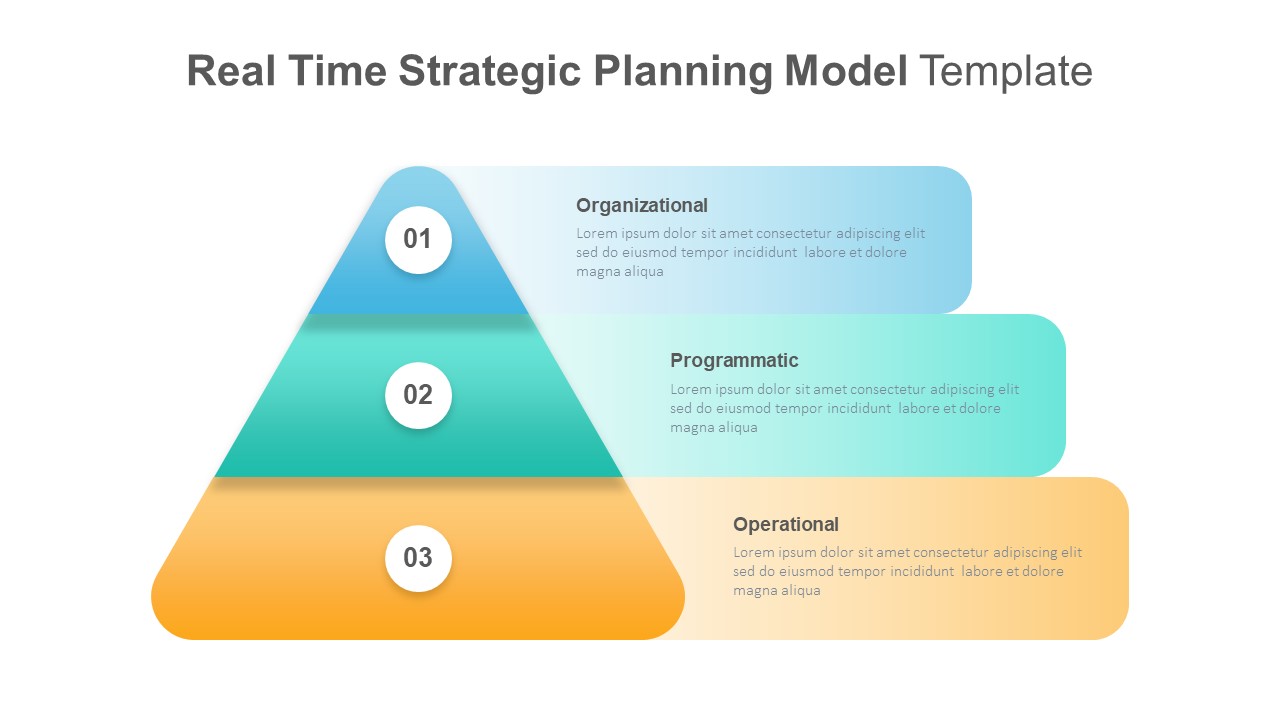
Real-Time Strategic Planning Pyramid Slide for PowerPoint & Google Slides
Business Strategy
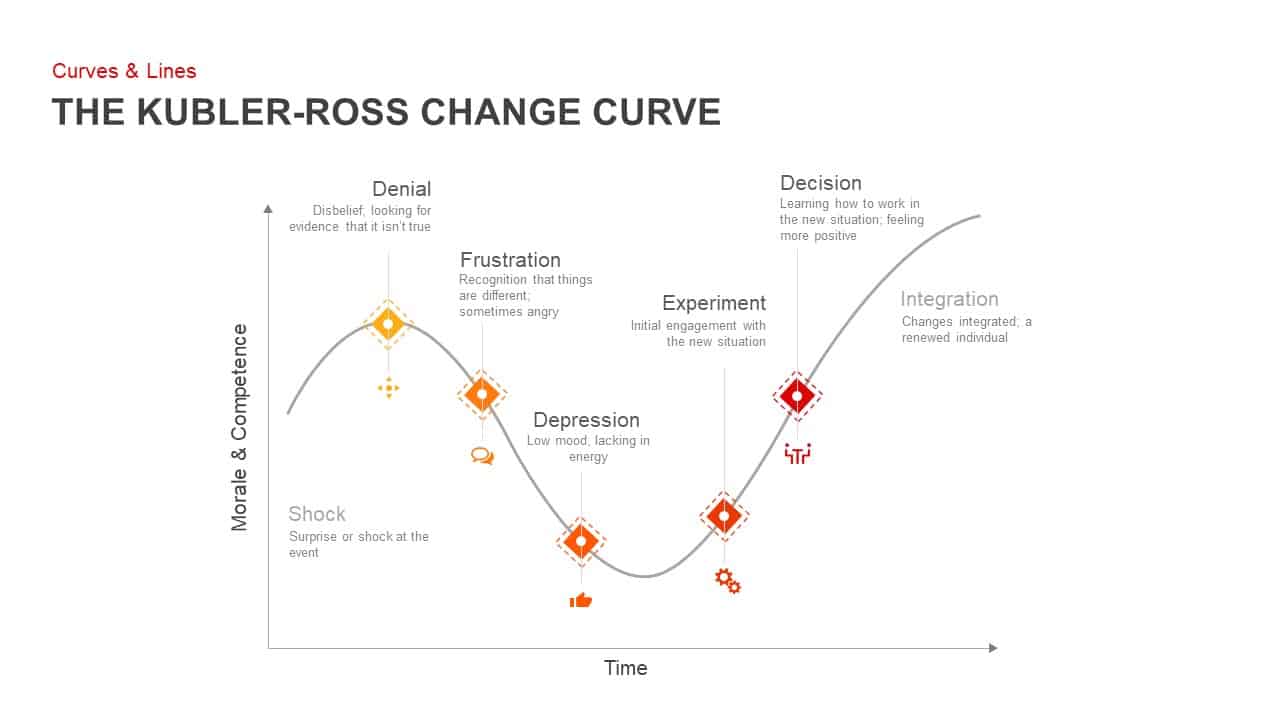
Kubler-Ross Change Curve Diagram Template for PowerPoint & Google Slides
Timeline
Snake Shaped Curve Diagram template for PowerPoint & Google Slides
Business
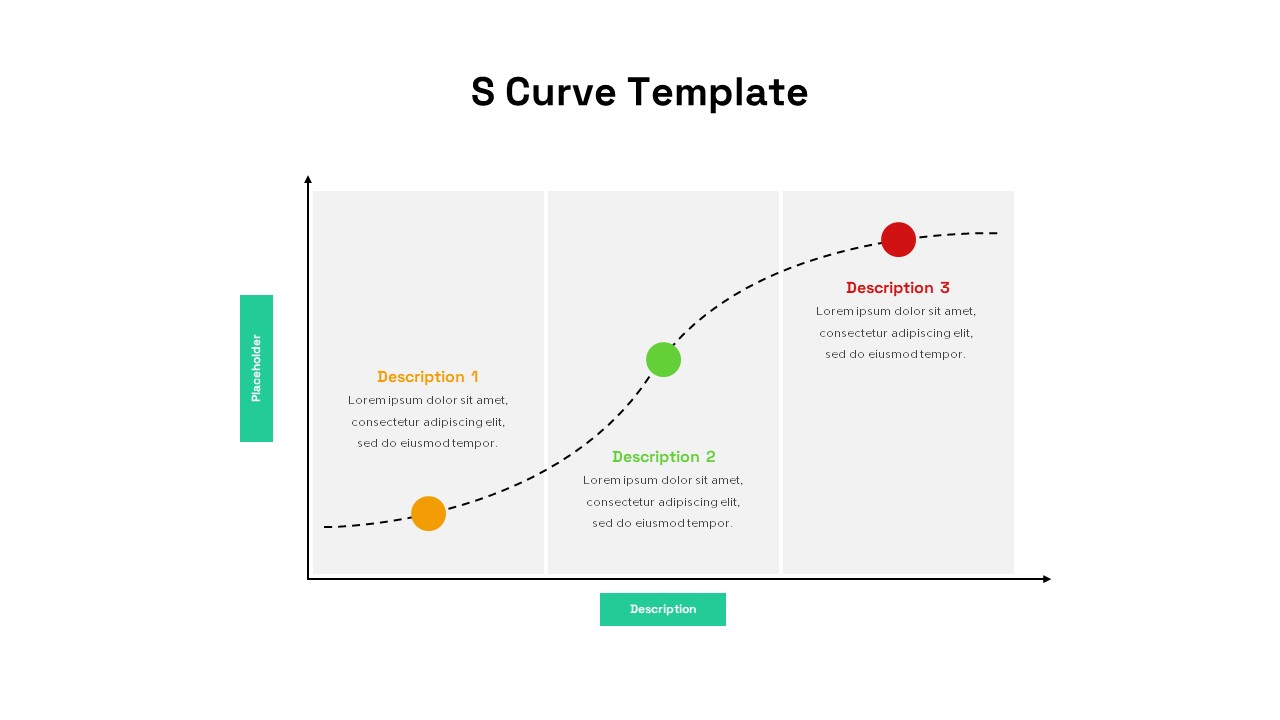
S-Curve Progression Framework Diagram Template for PowerPoint & Google Slides
Charts
Three-Stage S Curve Growth Diagram Template for PowerPoint & Google Slides
Process
Experience Curve Analysis Diagram Template for PowerPoint & Google Slides
Business Strategy
Gartner Hype Cycle Adoption Curve Diagram Template for PowerPoint & Google Slides
Infographics
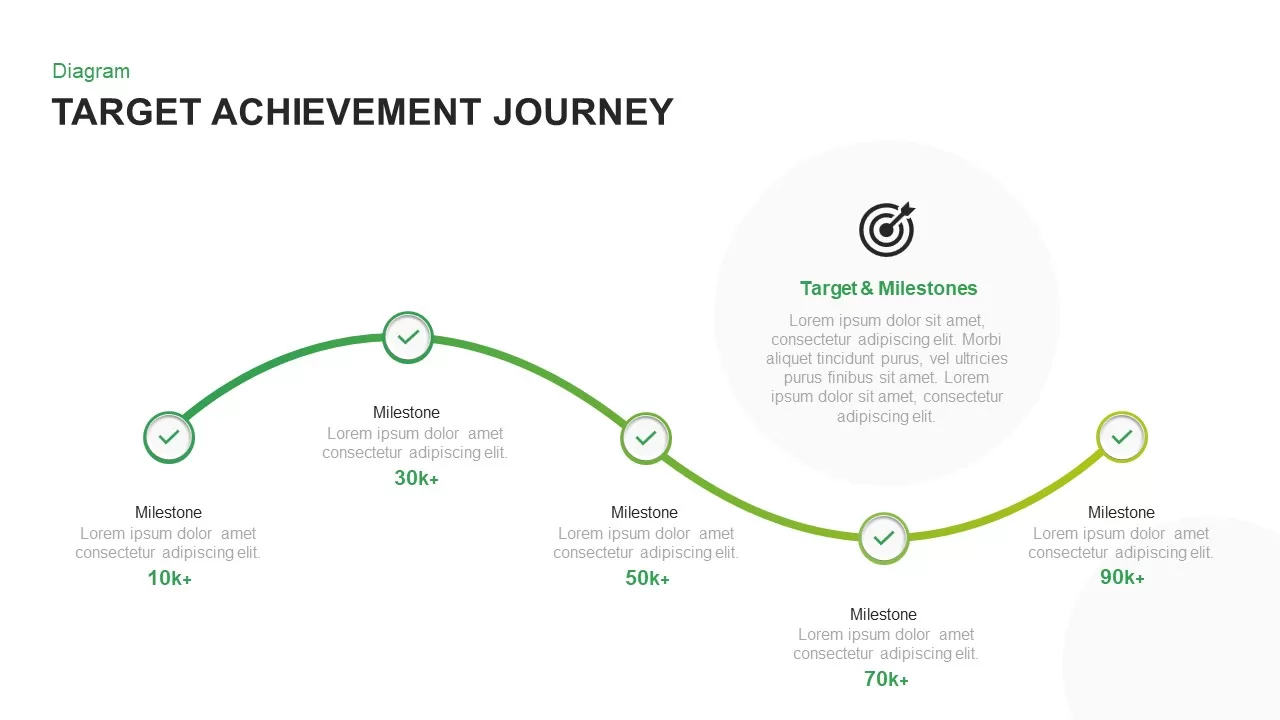
Target Achievement Milestone Curve Template for PowerPoint & Google Slides
Roadmap
Greiner’s Growth Model Curve template for PowerPoint & Google Slides
Infographics
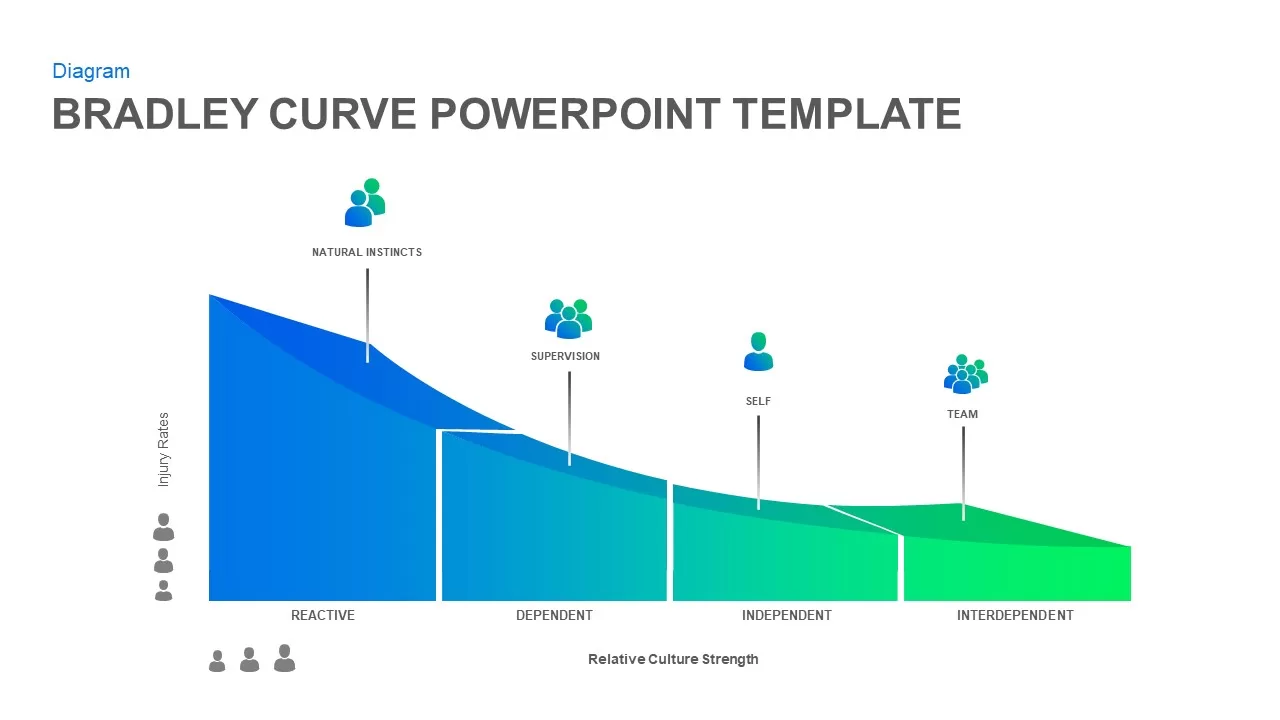
Bradley Curve Infographic Template for PowerPoint & Google Slides
Infographics
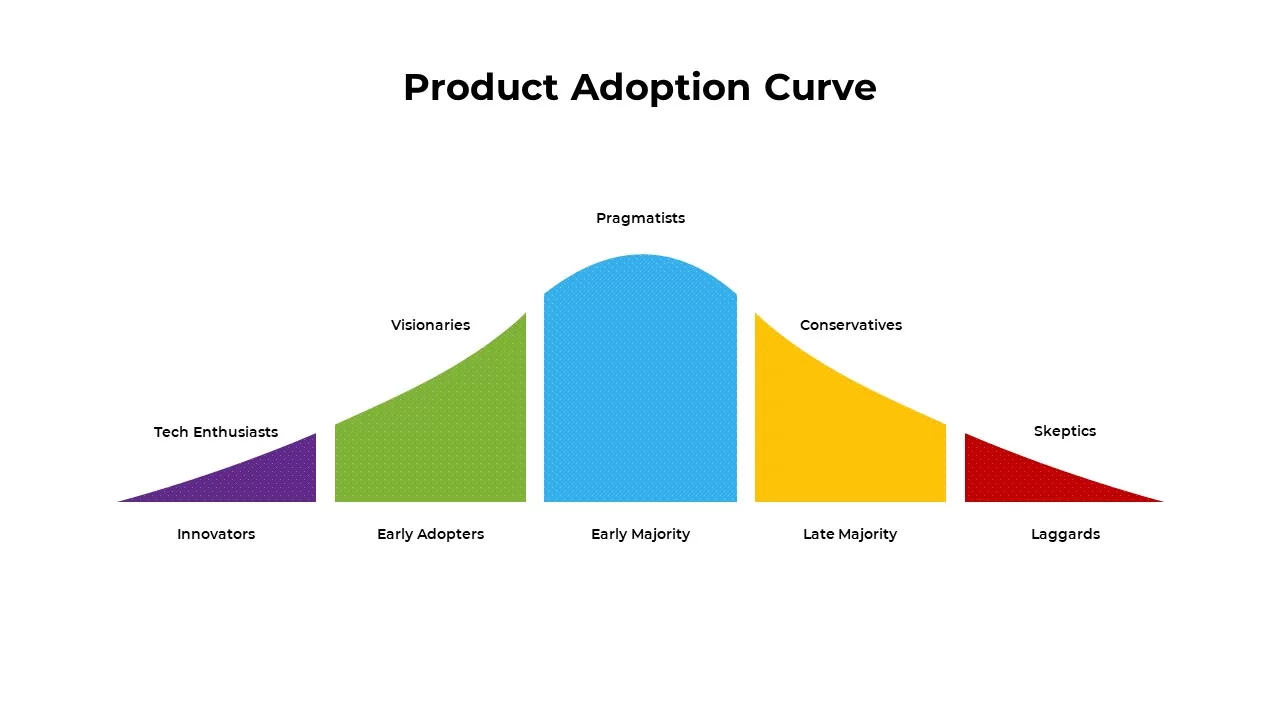
Product Adoption Curve Template for PowerPoint & Google Slides
Process
8-Bell Curve Infographic Slide Template for PowerPoint & Google Slides
Comparison Chart
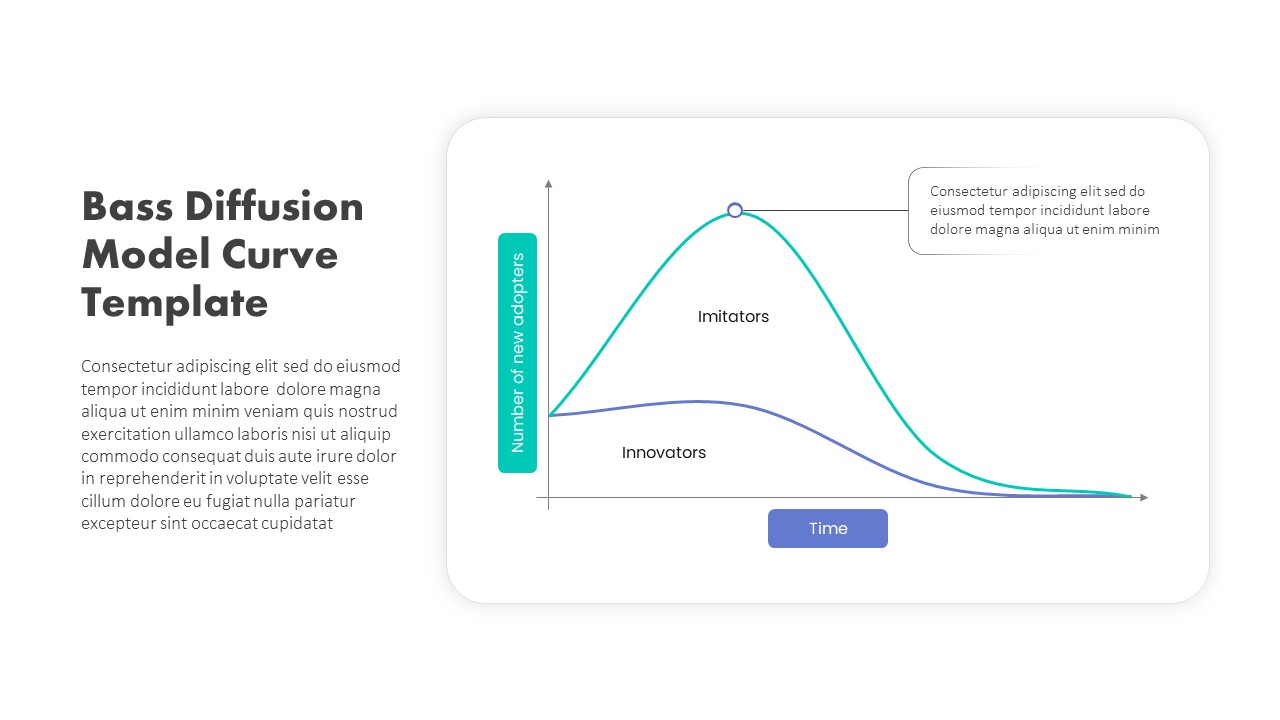
Bass Diffusion Model Curve for Adoption Template for PowerPoint & Google Slides
Comparison Chart
Growth Curve Line Chart Visualization Template for PowerPoint & Google Slides
Charts
Economies of Scale Cost Curve Comparison Template for PowerPoint & Google Slides
Comparison Chart
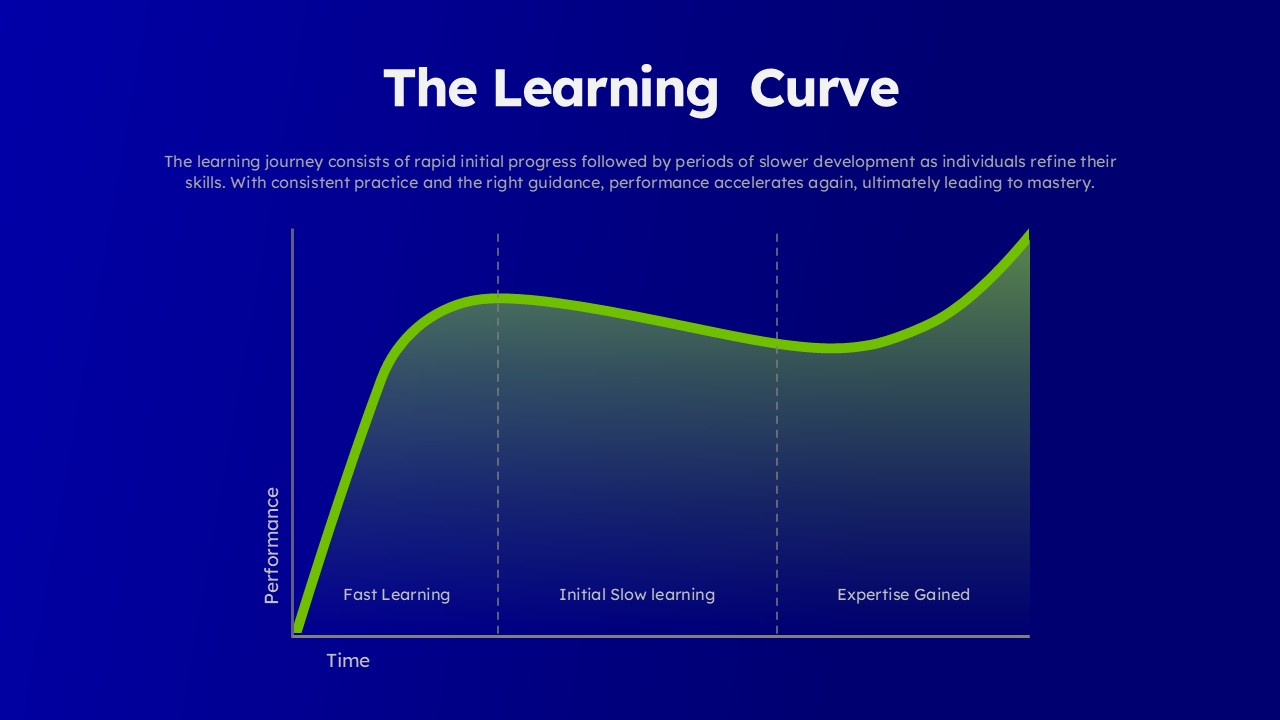
Learning Curve Performance Growth Chart Template for PowerPoint & Google Slides
Employee Performance
Strategic Business Diamond Diagram Template for PowerPoint & Google Slides
Business Strategy

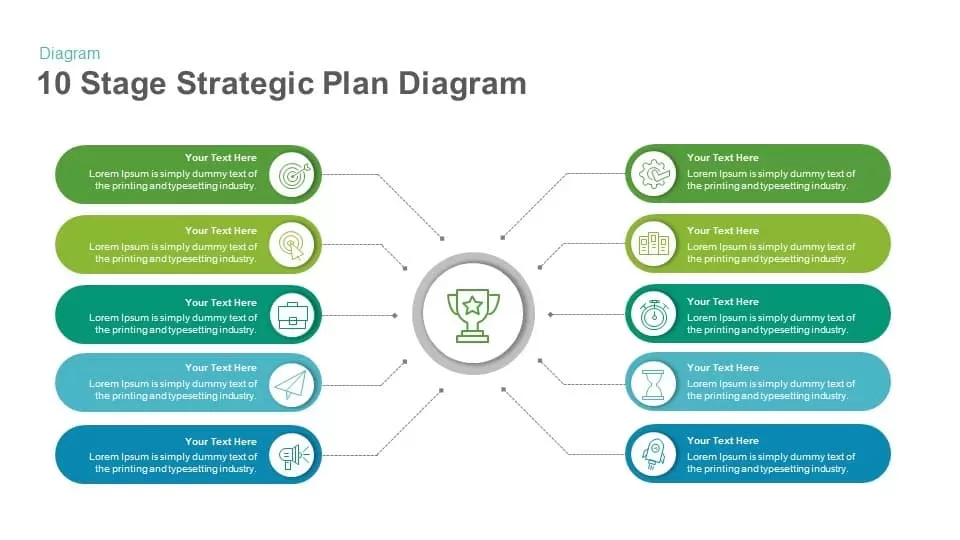
10 Stage Strategic Plan Diagram template for PowerPoint & Google Slides
Process
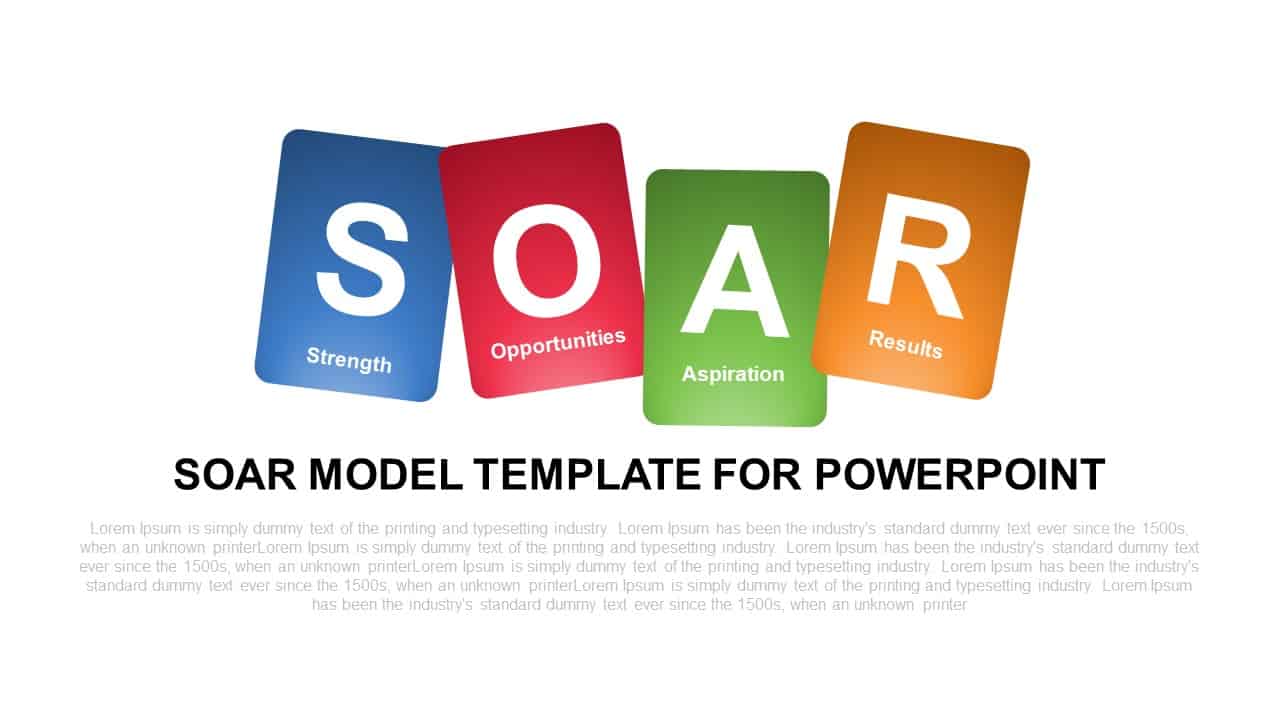
SOAR Strategic Model Card Diagram Template for PowerPoint & Google Slides
Process
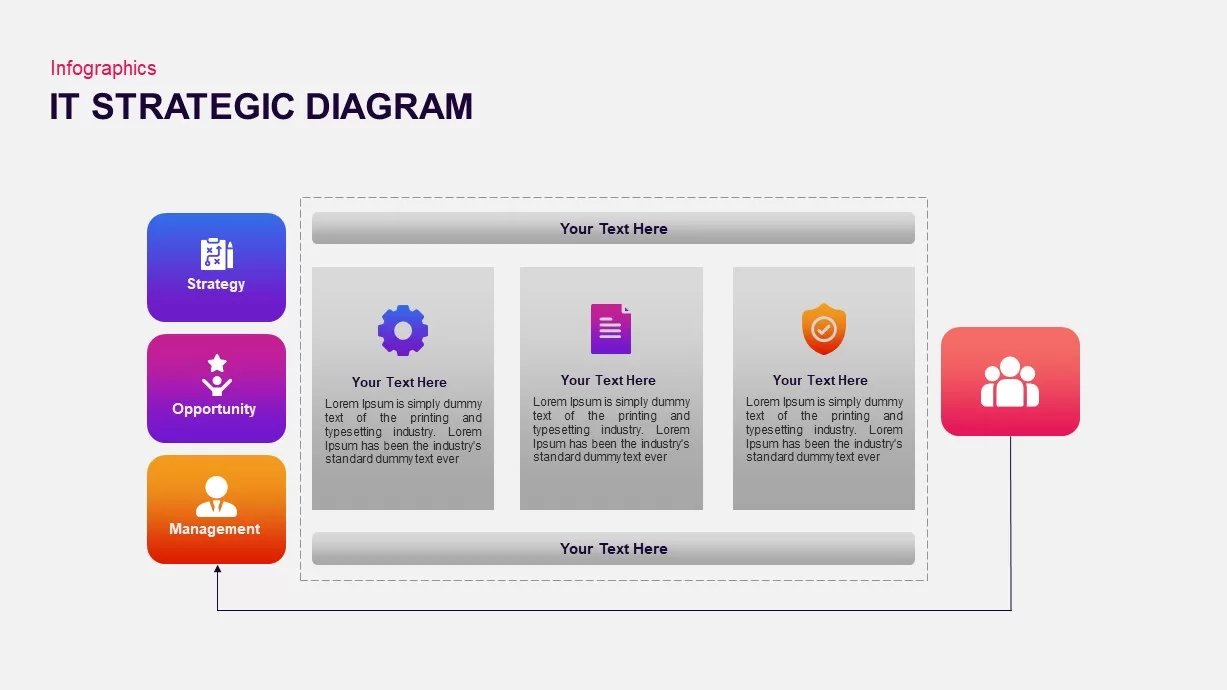
IT Strategic Diagram Infographic Pack Template for PowerPoint & Google Slides
Business Strategy
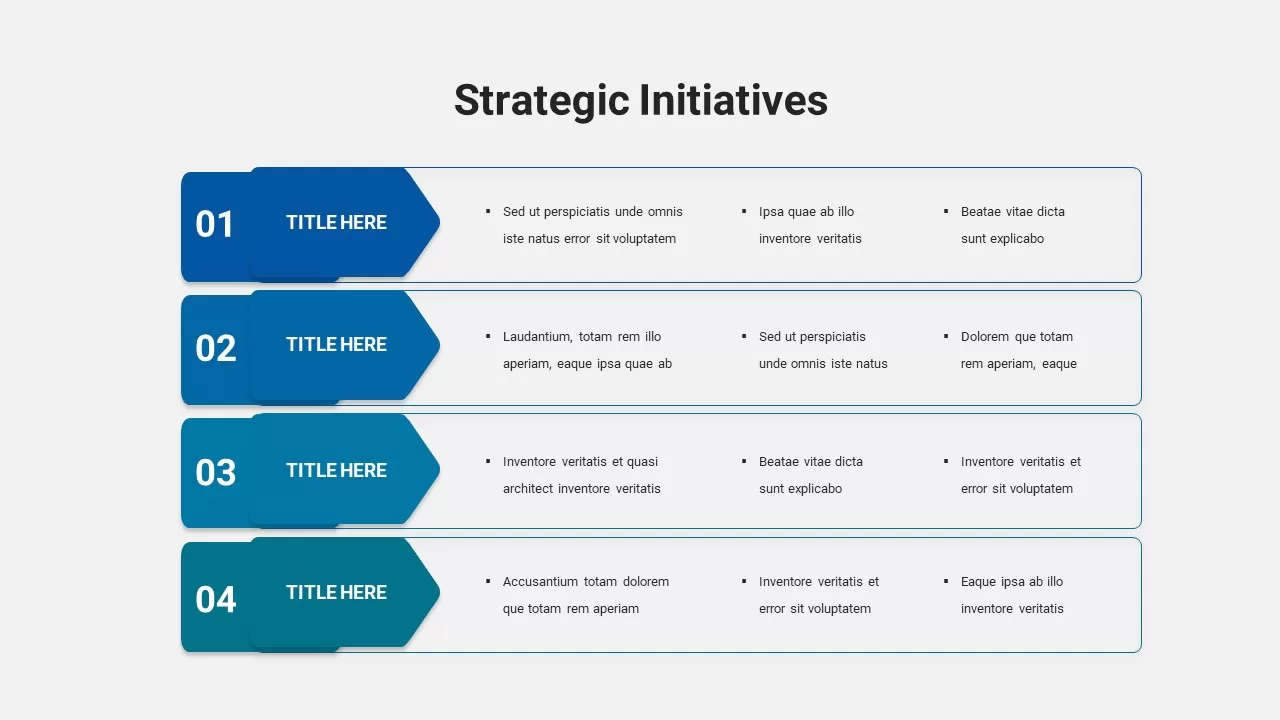
Arrowed Strategic Initiatives Diagram Template for PowerPoint & Google Slides
Process
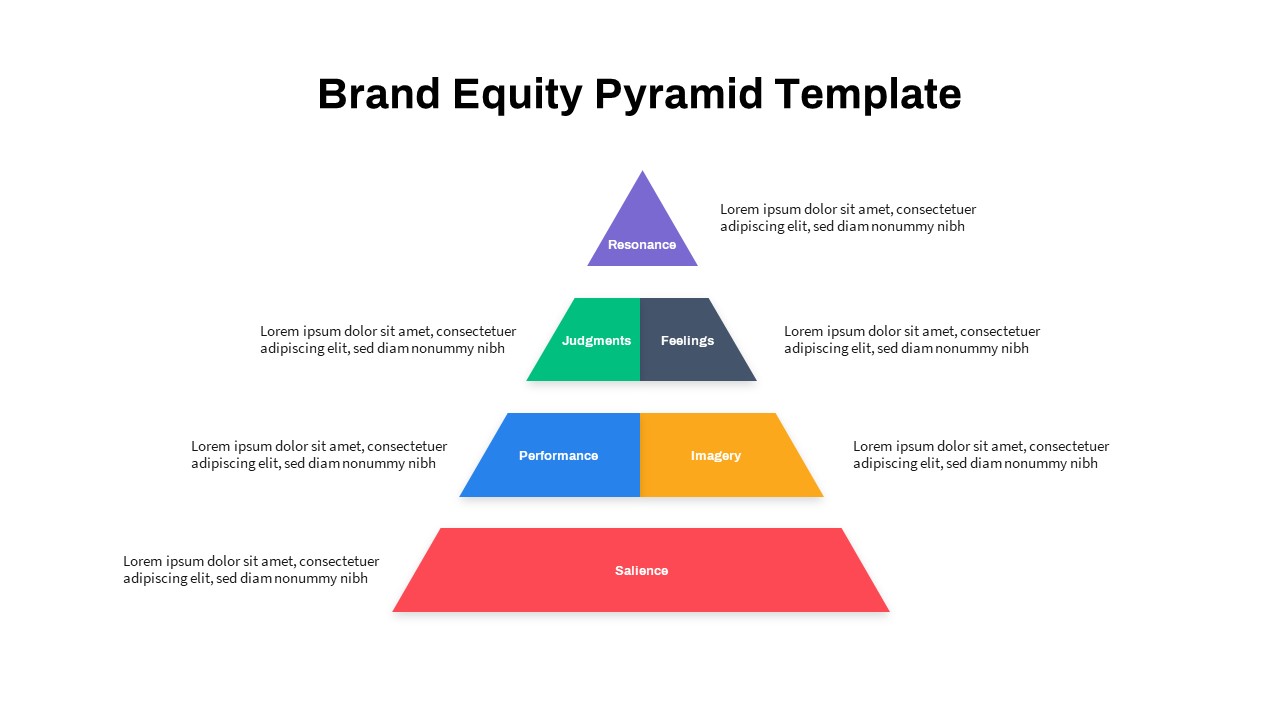
Strategic Brand Equity Pyramid Diagram Template for PowerPoint & Google Slides
Pyramid
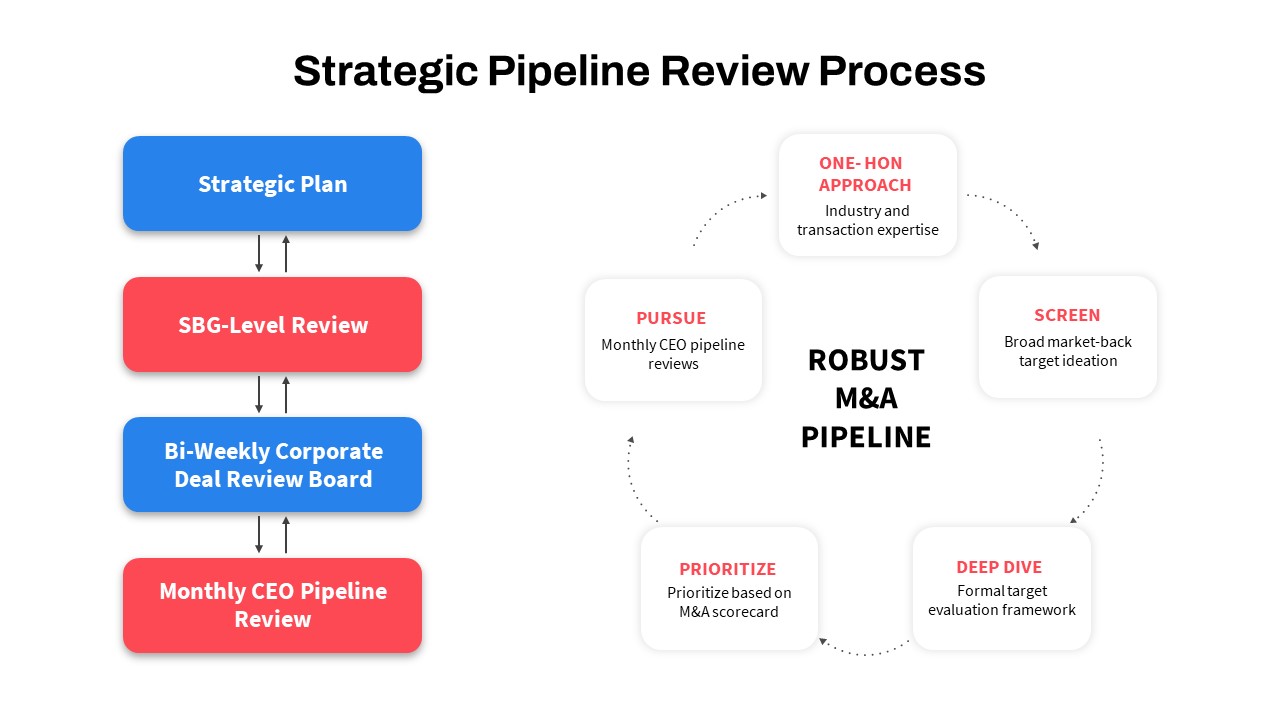
Strategic Pipeline Review Diagram Template for PowerPoint & Google Slides
Business Strategy
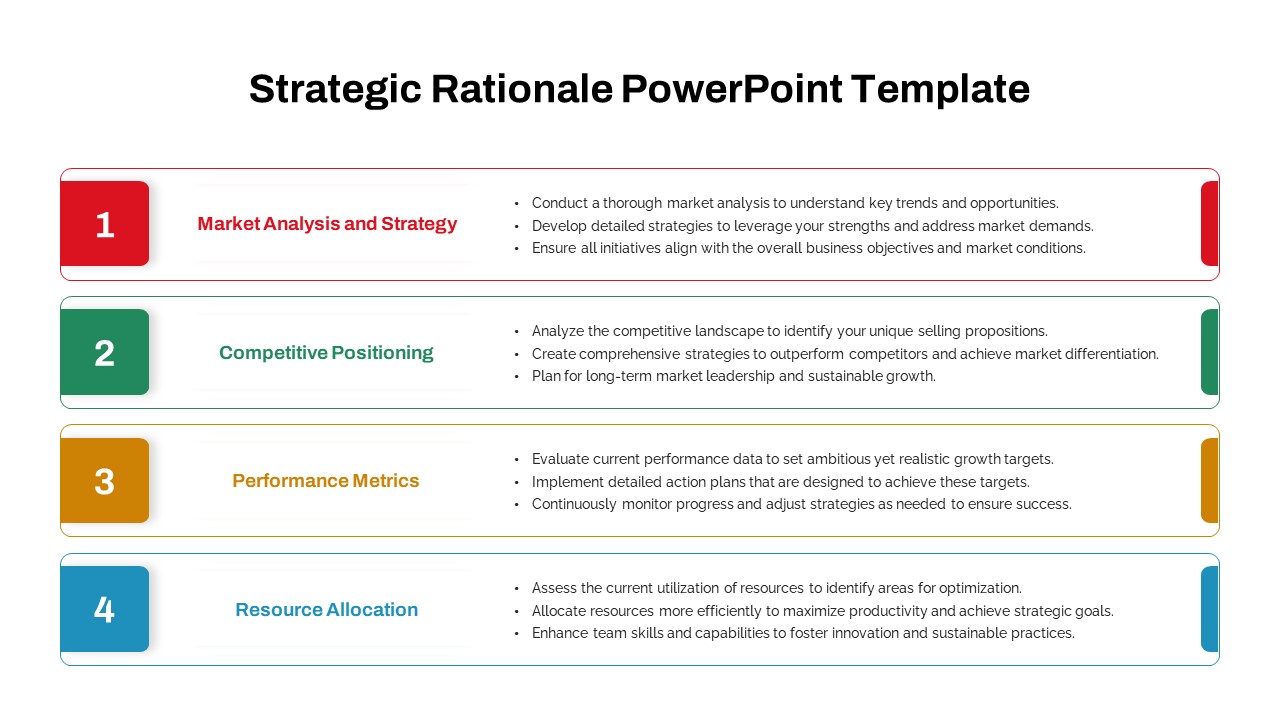
Strategic Rationale Framework Diagram Template for PowerPoint & Google Slides
Process
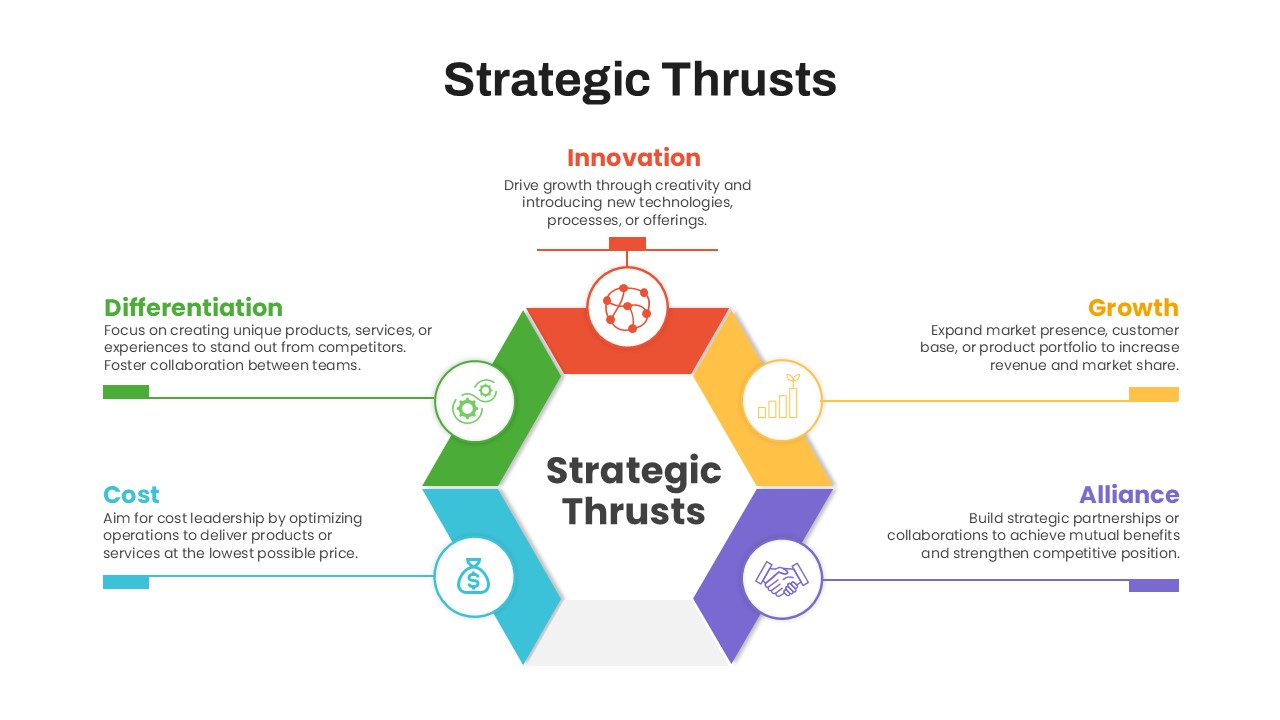
Six-Step Strategic Thrusts Diagram Slide Template for PowerPoint & Google Slides
Process
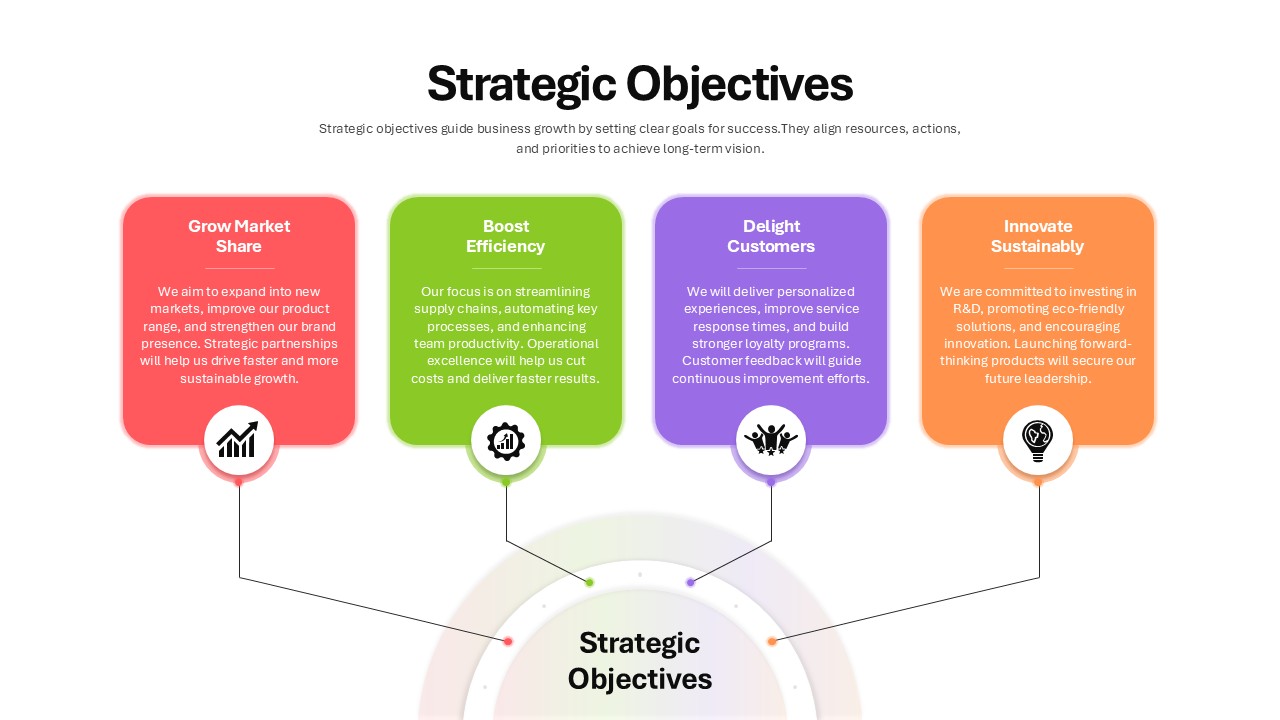
Four Strategic Objectives Radial Diagram Template for PowerPoint & Google Slides
Business Strategy
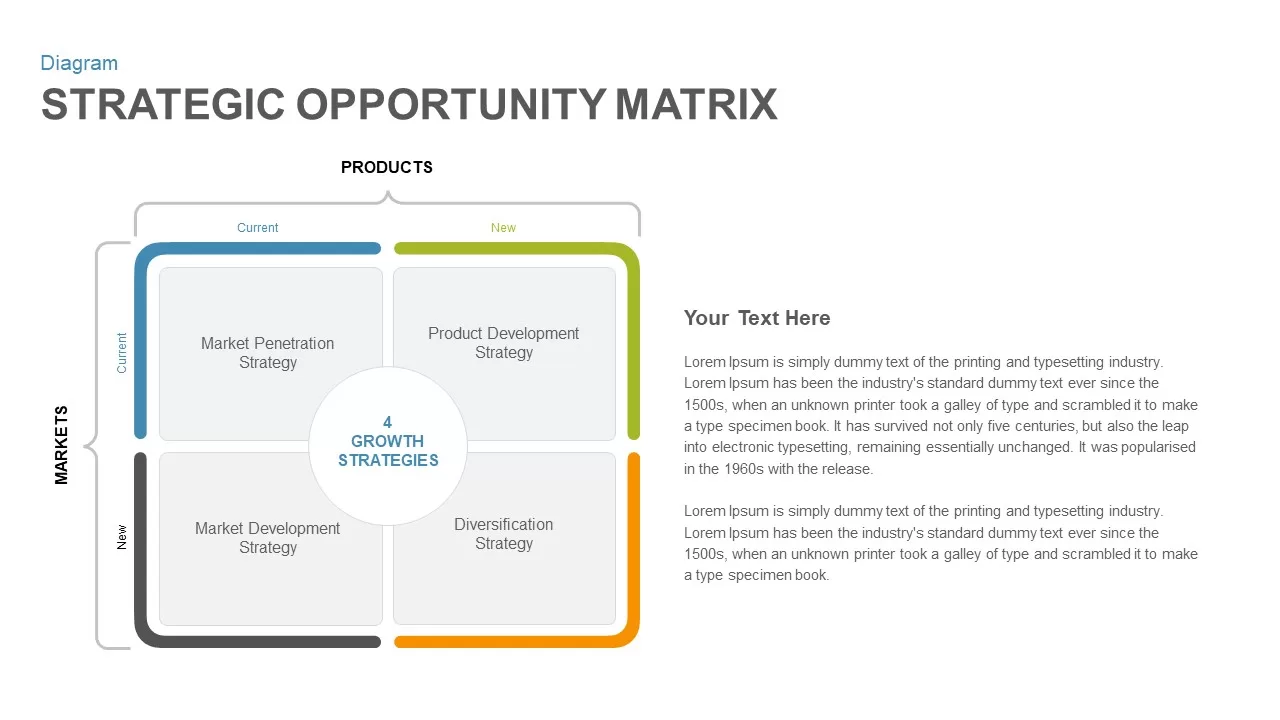
Strategic Opportunity Matrix Diagram for PowerPoint & Google Slides
Business Strategy
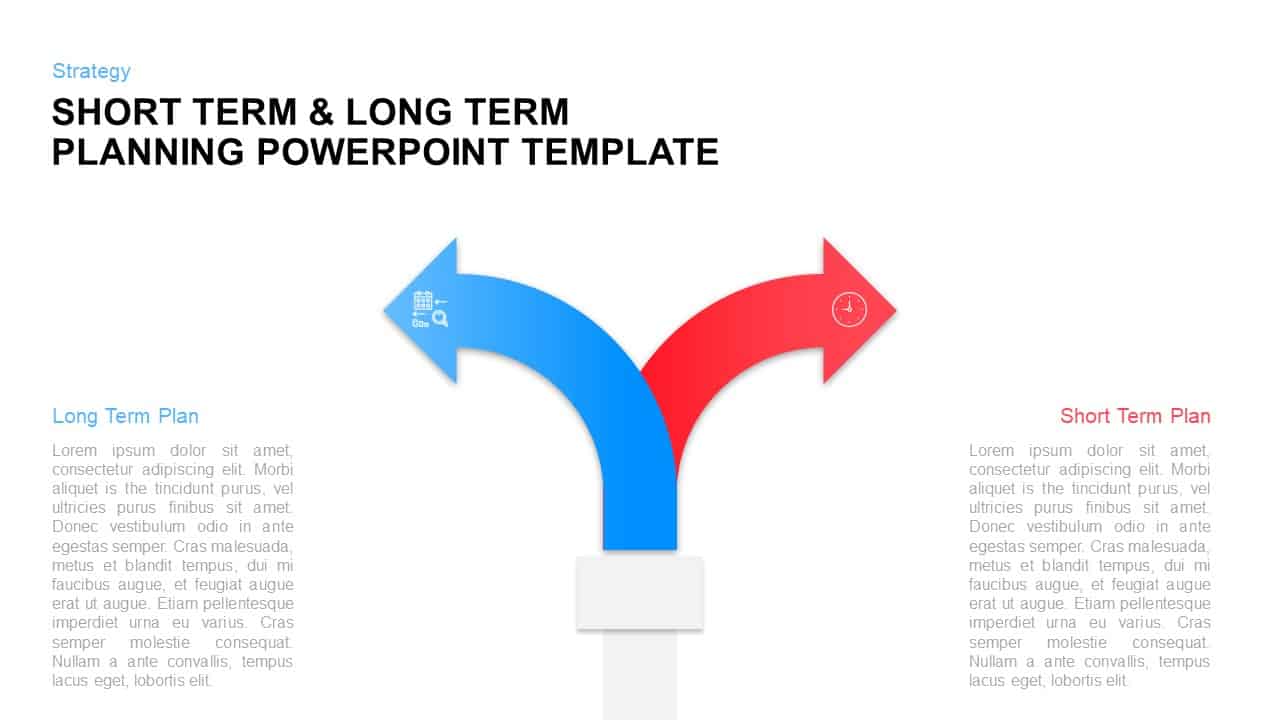
Long-Term vs Short-Term Planning Diagram Template for PowerPoint & Google Slides
Comparison
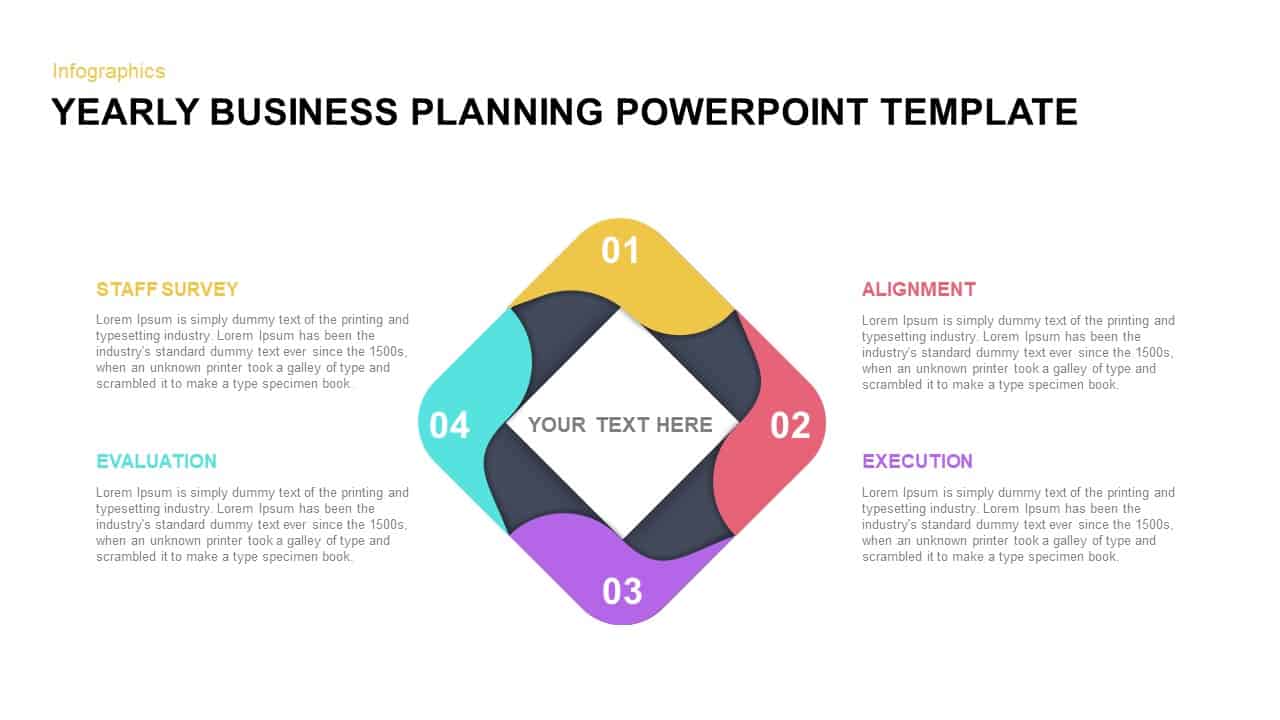
Yearly Business Planning Diamond Diagram Template for PowerPoint & Google Slides
Process
Capacity Planning Circular Diagram Template for PowerPoint & Google Slides
Circular
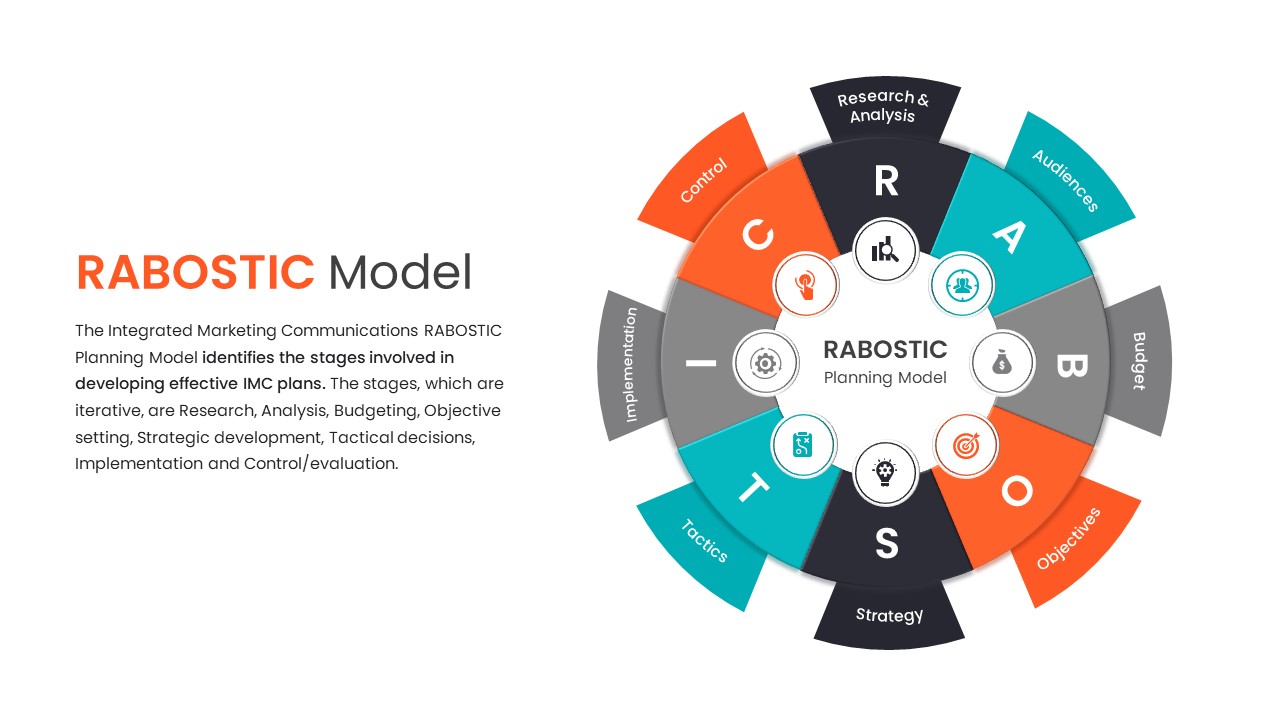
RABOSTIC IMC Planning Model Diagram Template for PowerPoint & Google Slides
Process
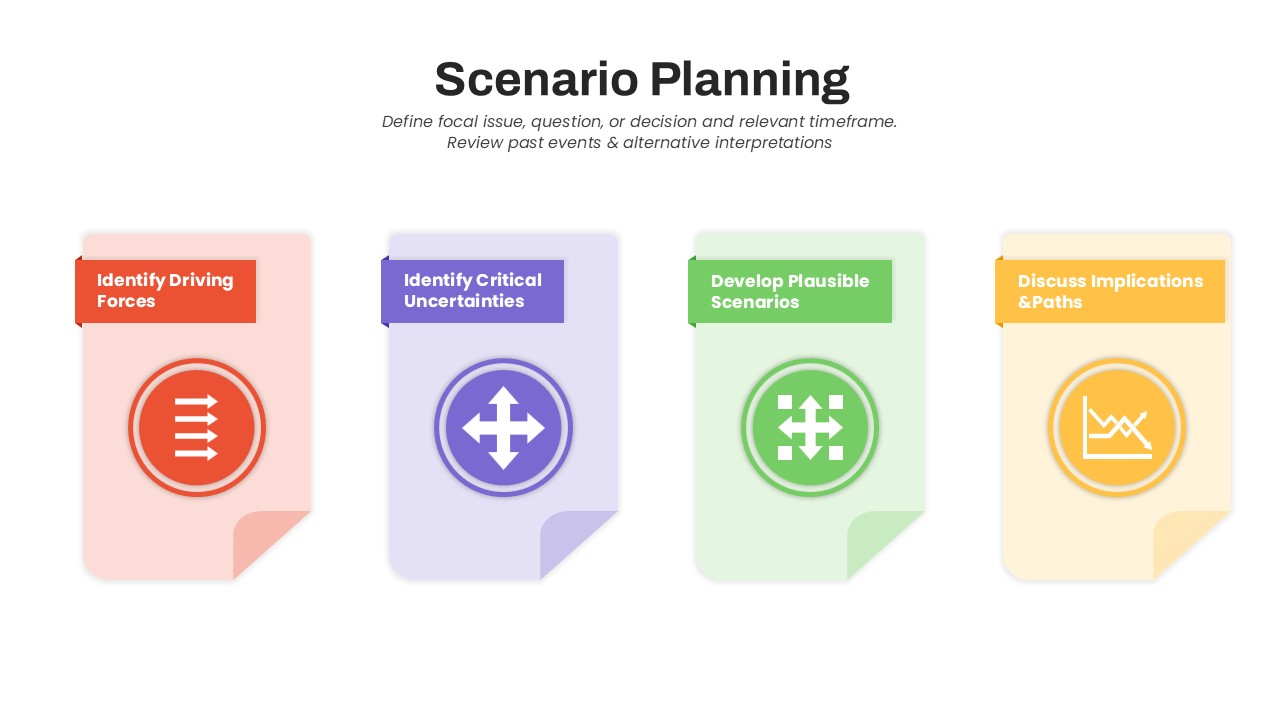
Scenario Planning Process Diagram Template for PowerPoint & Google Slides
Process
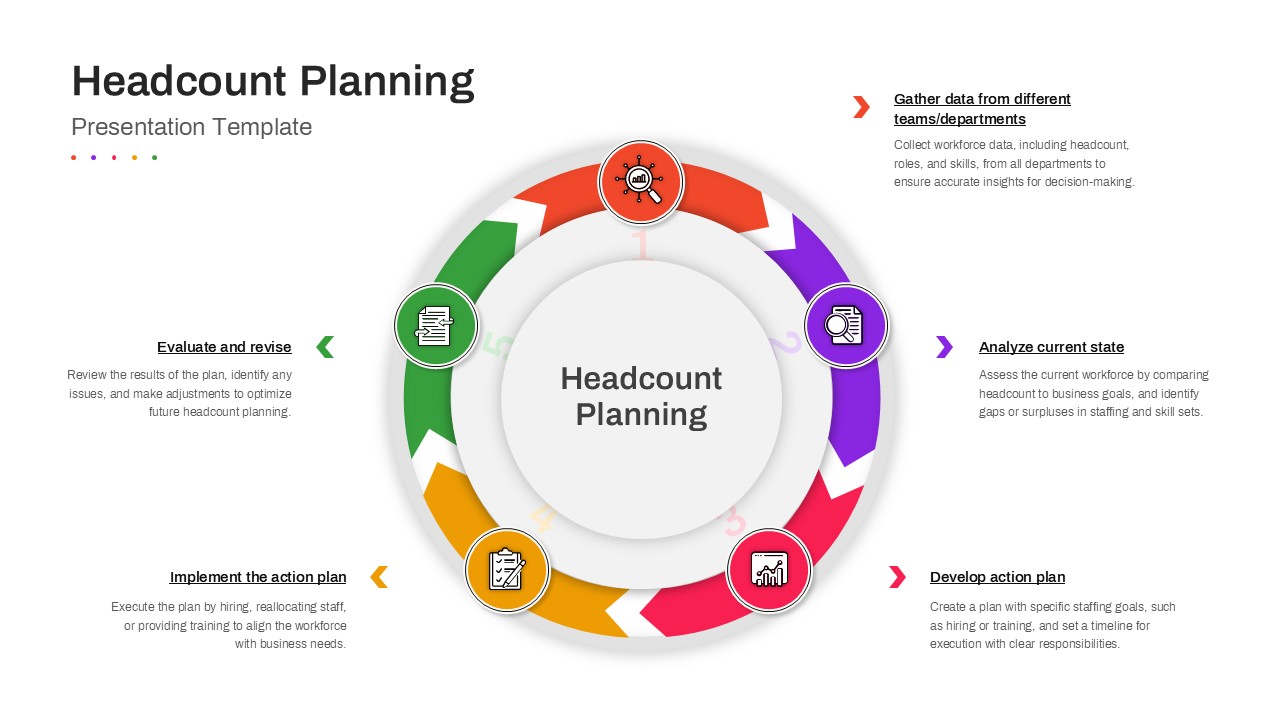
Headcount Planning Circular Process Diagram Template for PowerPoint & Google Slides
HR
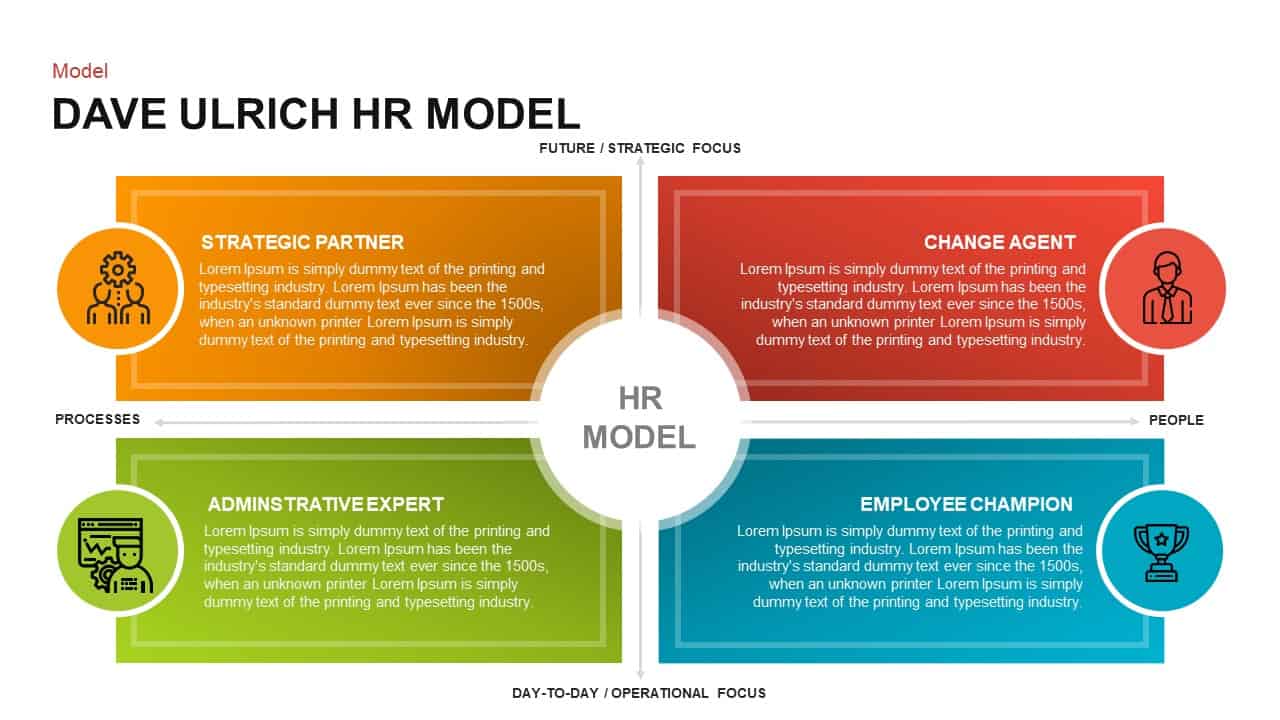
Dave Ulrich Strategic HR Model Quadrant Template for PowerPoint & Google Slides
Employee Performance
Strategic Three Horizons Framework Template for PowerPoint & Google Slides
Business Strategy
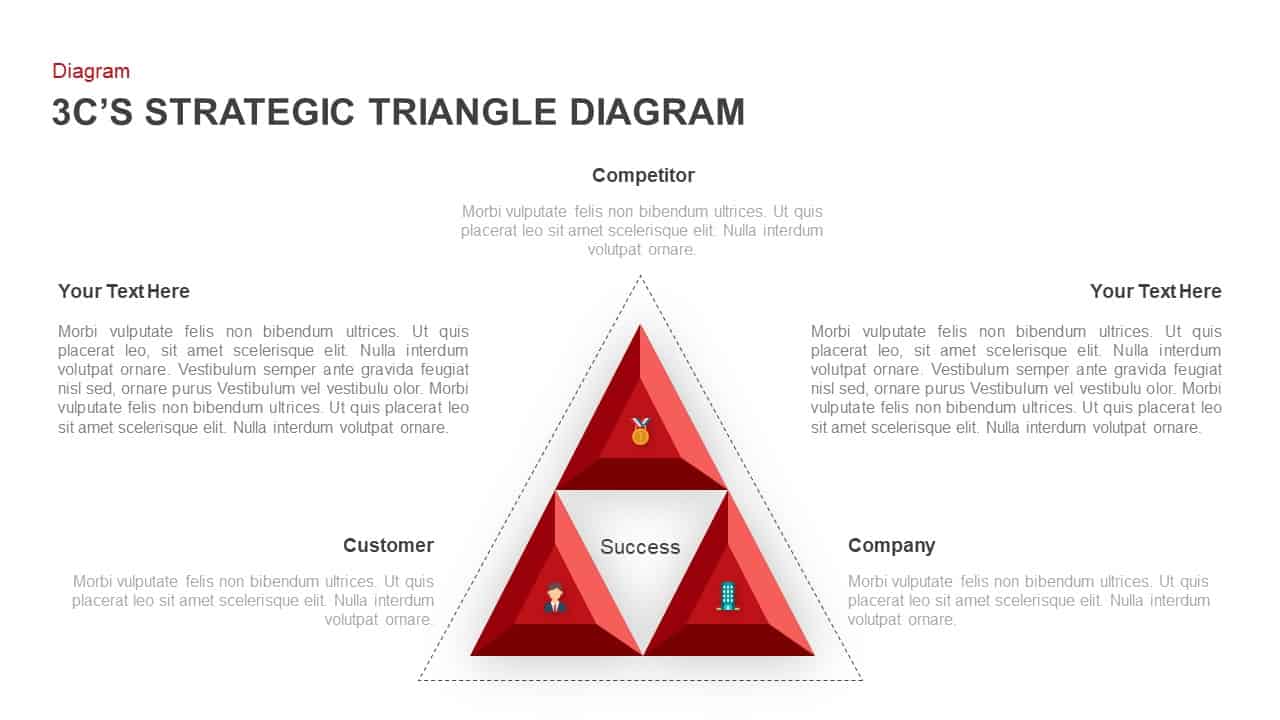
3C Strategic Triangle Analysis Template for PowerPoint & Google Slides
Competitor Analysis
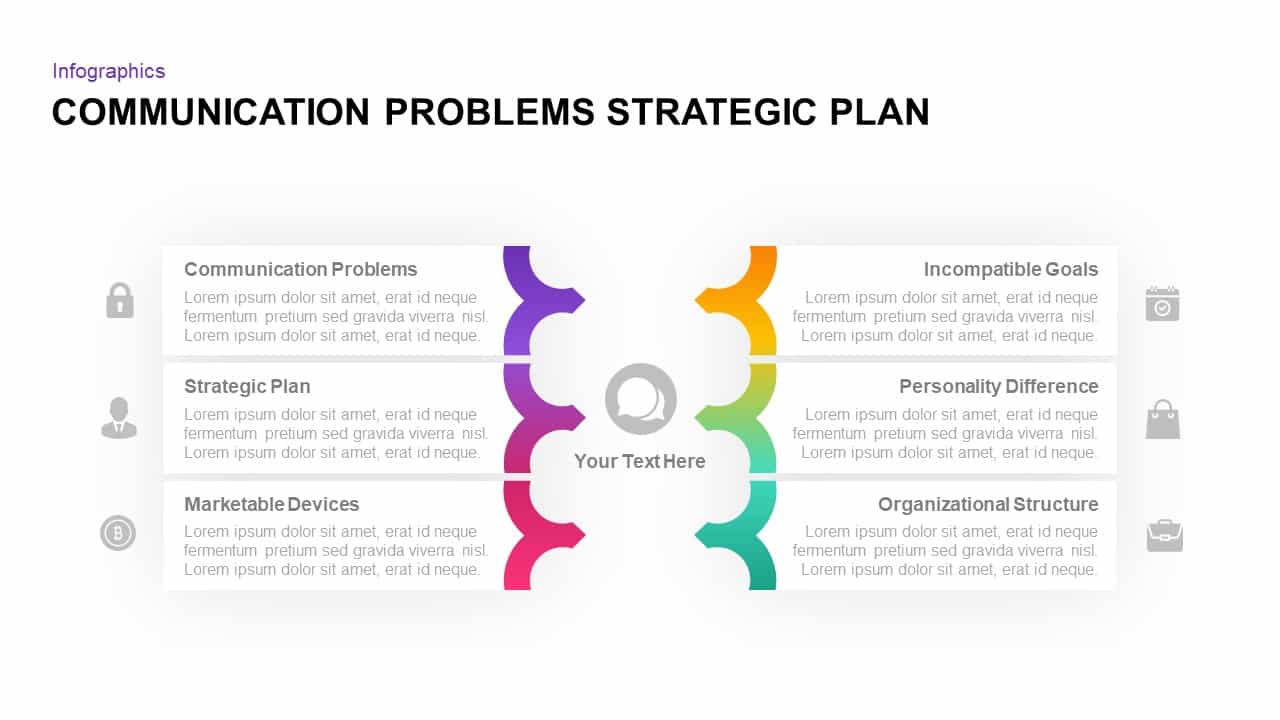
Communication Problems & Strategic Plan Template for PowerPoint & Google Slides
Process
Three-Year Strategic Plan Matrix Template for PowerPoint & Google Slides
Timeline
Strategic ADL Matrix by Industry Life Cycle & Position Template for PowerPoint & Google Slides
Business Strategy
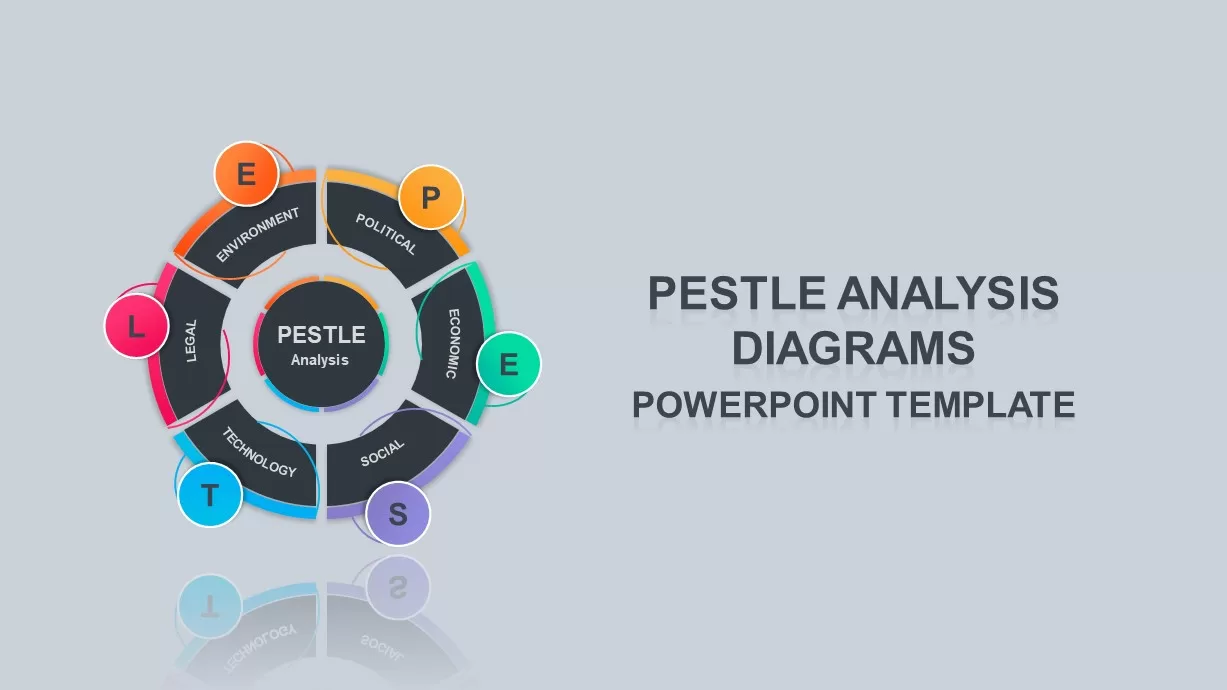
PESTLE and PEST Strategic Analysis Diagrams Template for PowerPoint & Google Slides
Business Strategy
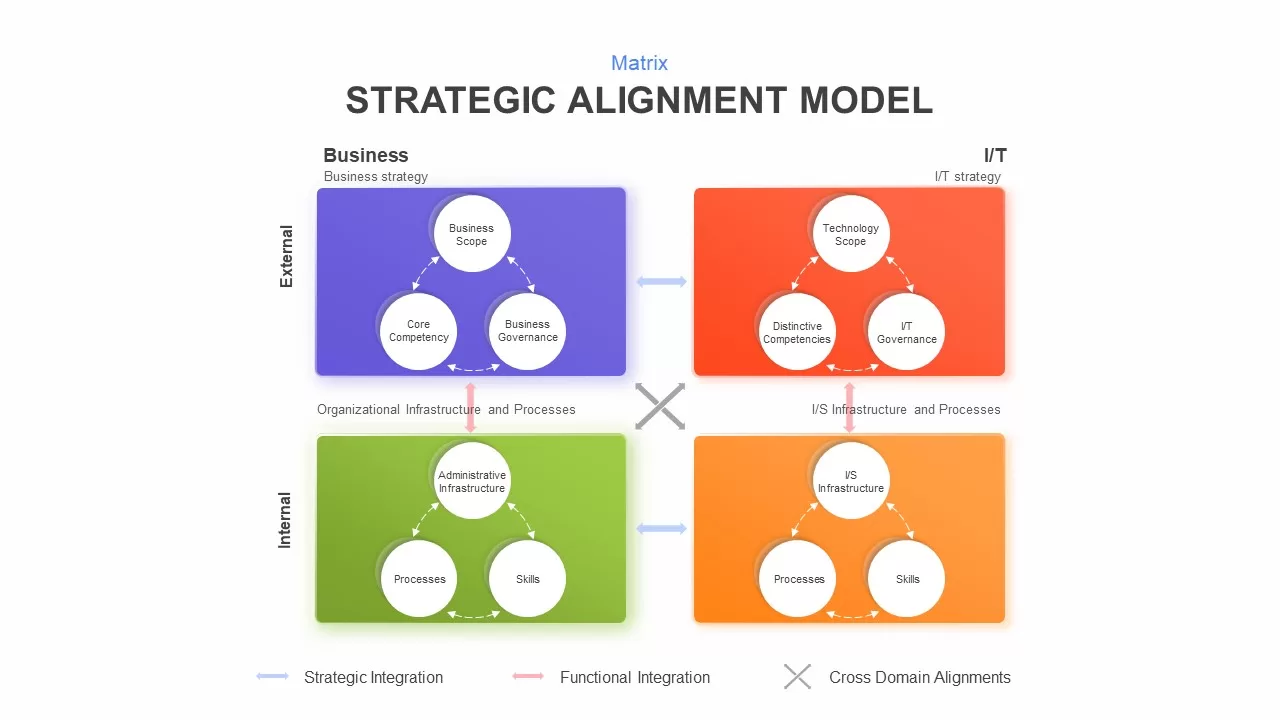
Strategic Alignment Matrix Model Template for PowerPoint & Google Slides
Project
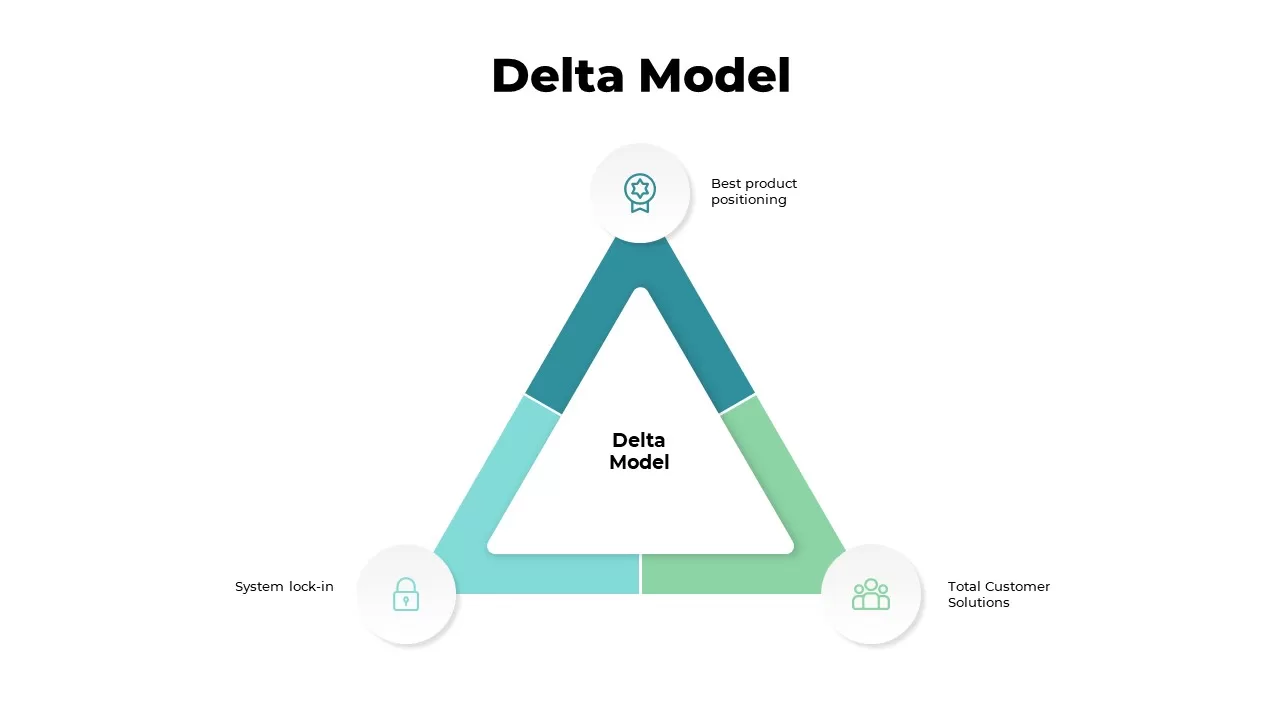
Delta Model Strategic Framework Template for PowerPoint & Google Slides
Business Strategy
Free Strategic Plan Overview template for PowerPoint & Google Slides
Business Strategy
Free
Free Strategic Plan template for PowerPoint & Google Slides
Business Strategy
Free
Four-Step Strategic Table of Contents Template for PowerPoint & Google Slides
Agenda
Strategic Initiatives Overview template for PowerPoint & Google Slides
Business Strategy
4-Item Strategic Initiatives Slide Template for PowerPoint & Google Slides
Process
Strategic Initiatives Pill Shape Slide Template for PowerPoint & Google Slides
Pitch Deck
Four-Step Strategic Initiatives Card Template for PowerPoint & Google Slides
Process
Strategic Initiatives template for PowerPoint & Google Slides
Business
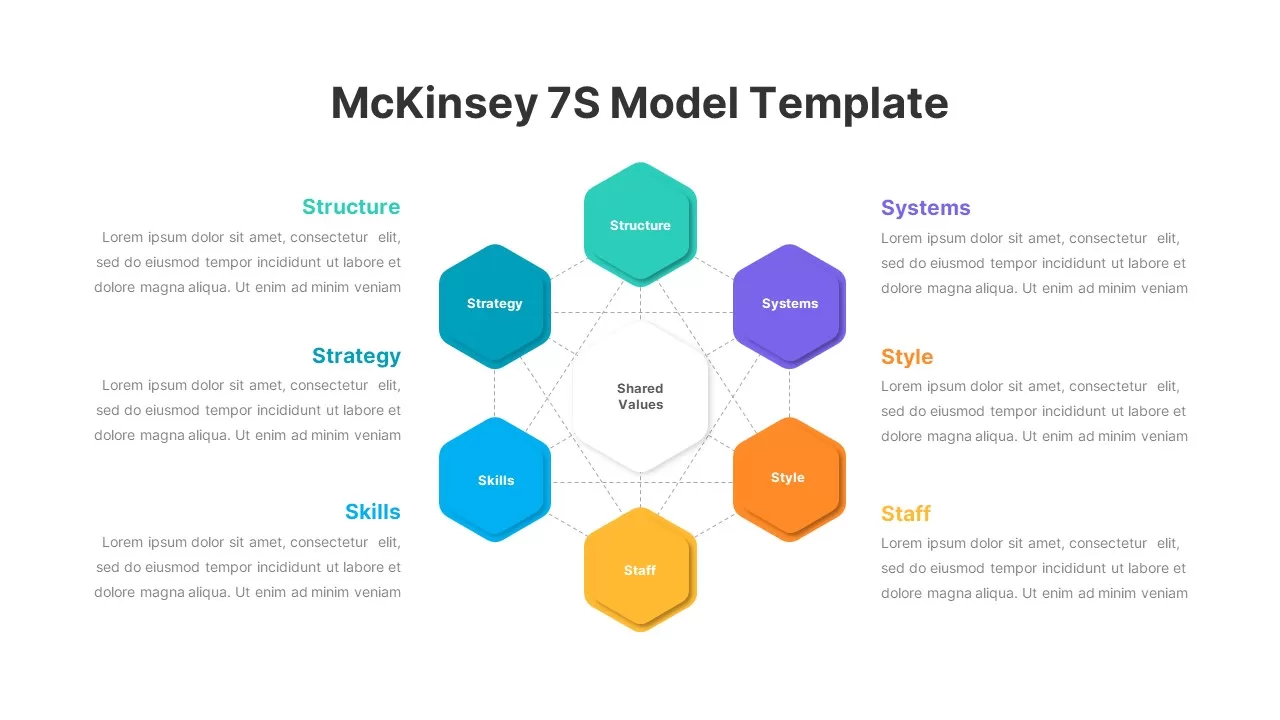
McKinsey 7S Model Strategic Alignment Template for PowerPoint & Google Slides
Circular
McKinsey 7S Strategic Alignment Model Template for PowerPoint & Google Slides
Business Strategy
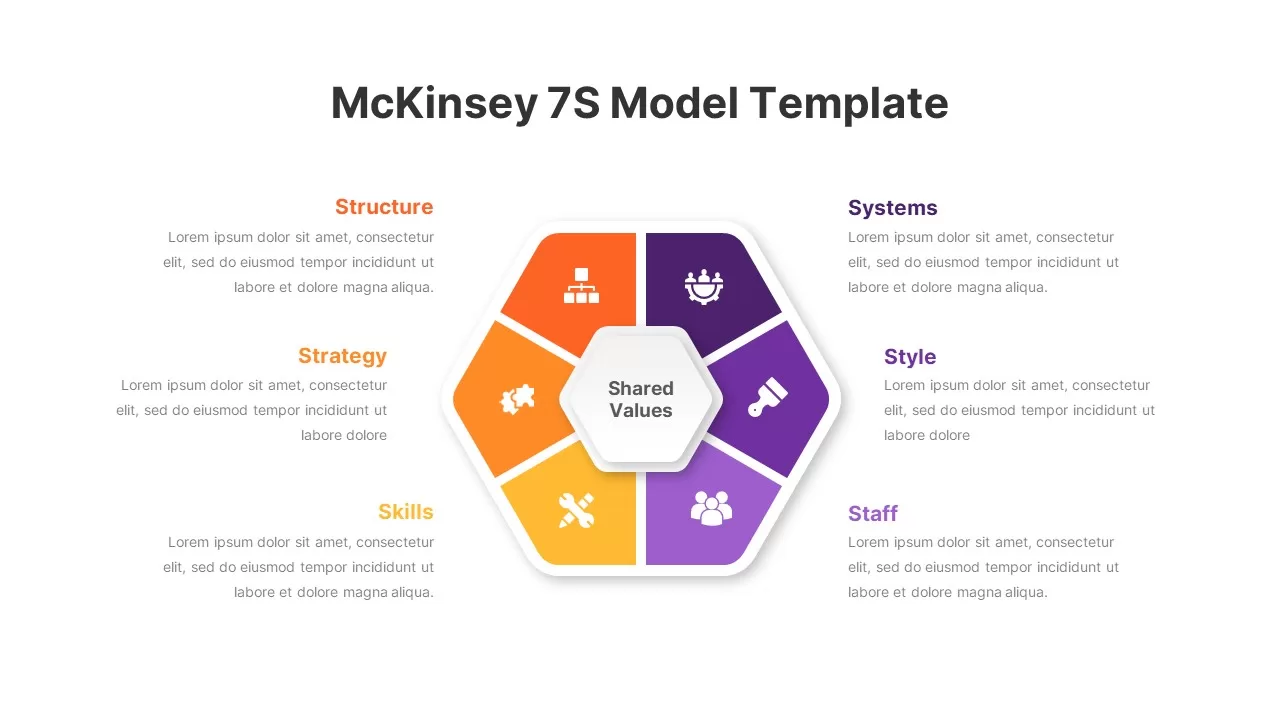
Hexagon 7S Strategic Alignment Model Template for PowerPoint & Google Slides
Business Strategy
Checkmate Slide for Strategic Insights Template for PowerPoint & Google Slides
Accomplishment
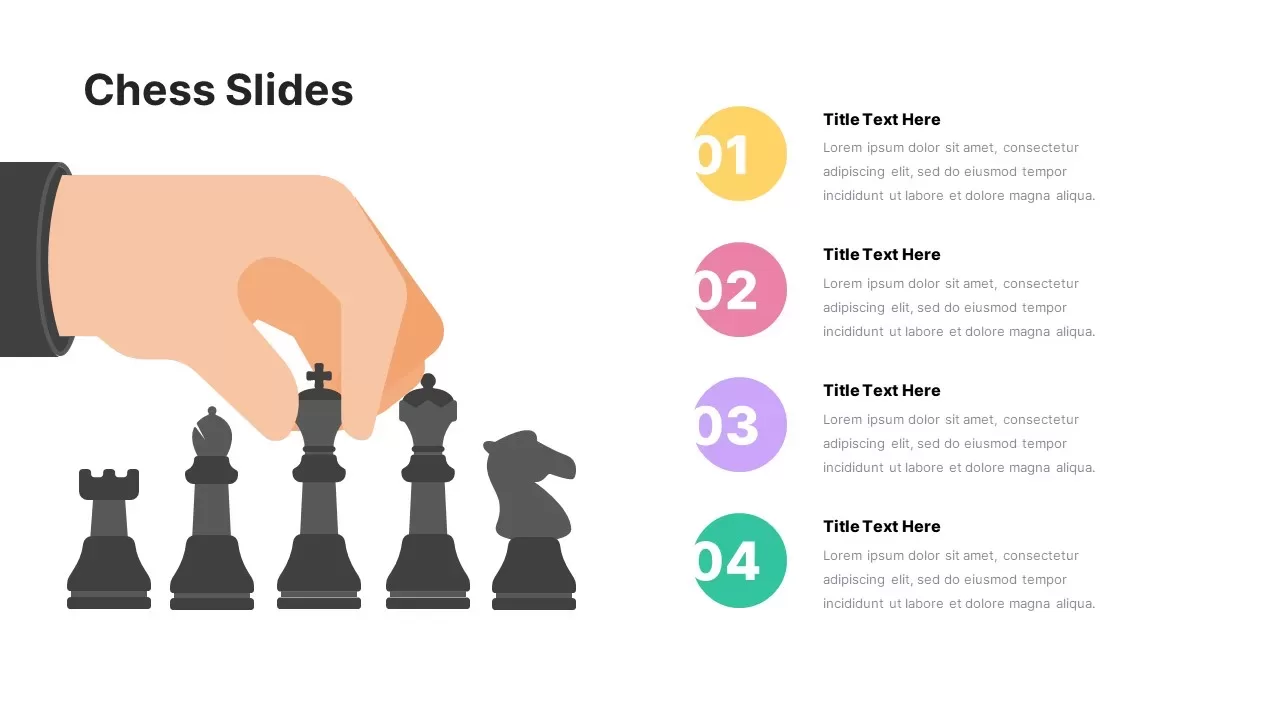
Strategic Chess Four Step Slide Template for PowerPoint & Google Slides
Process
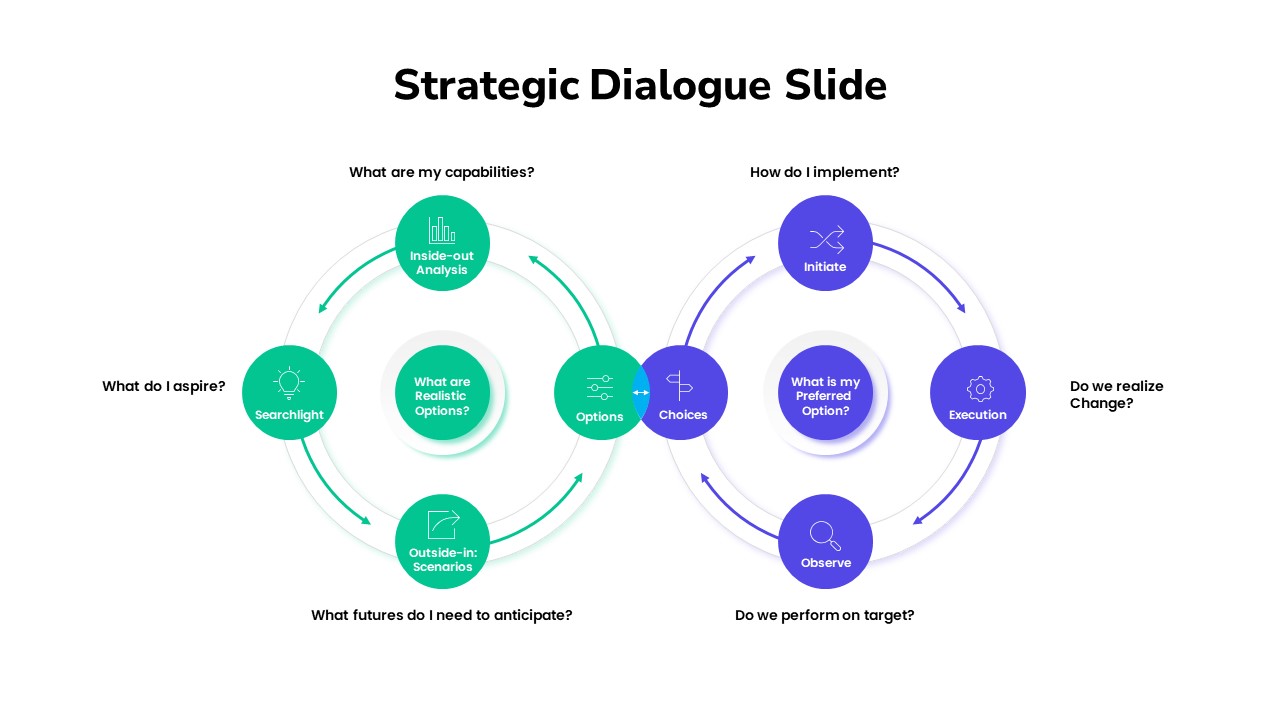
Strategic Dialogue Model Cycle Template for PowerPoint & Google Slides
Circular
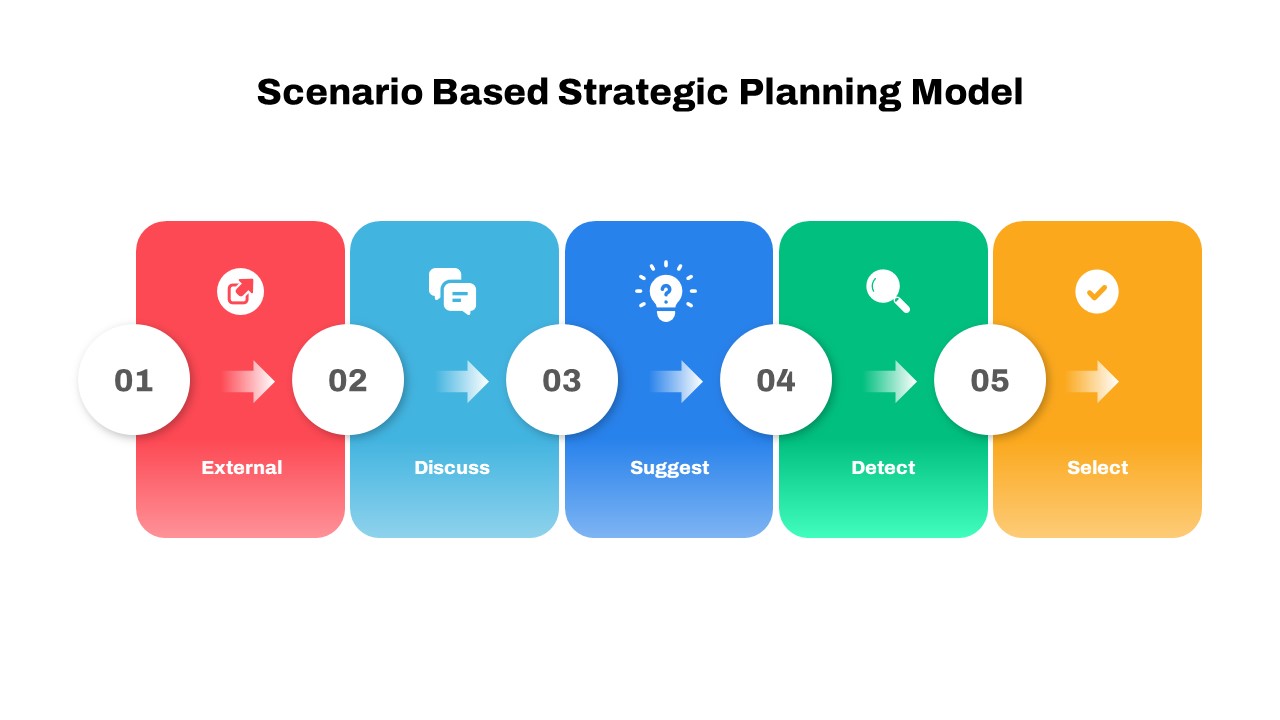
Scenario-Based Strategic Plan Model Template for PowerPoint & Google Slides
Business Plan
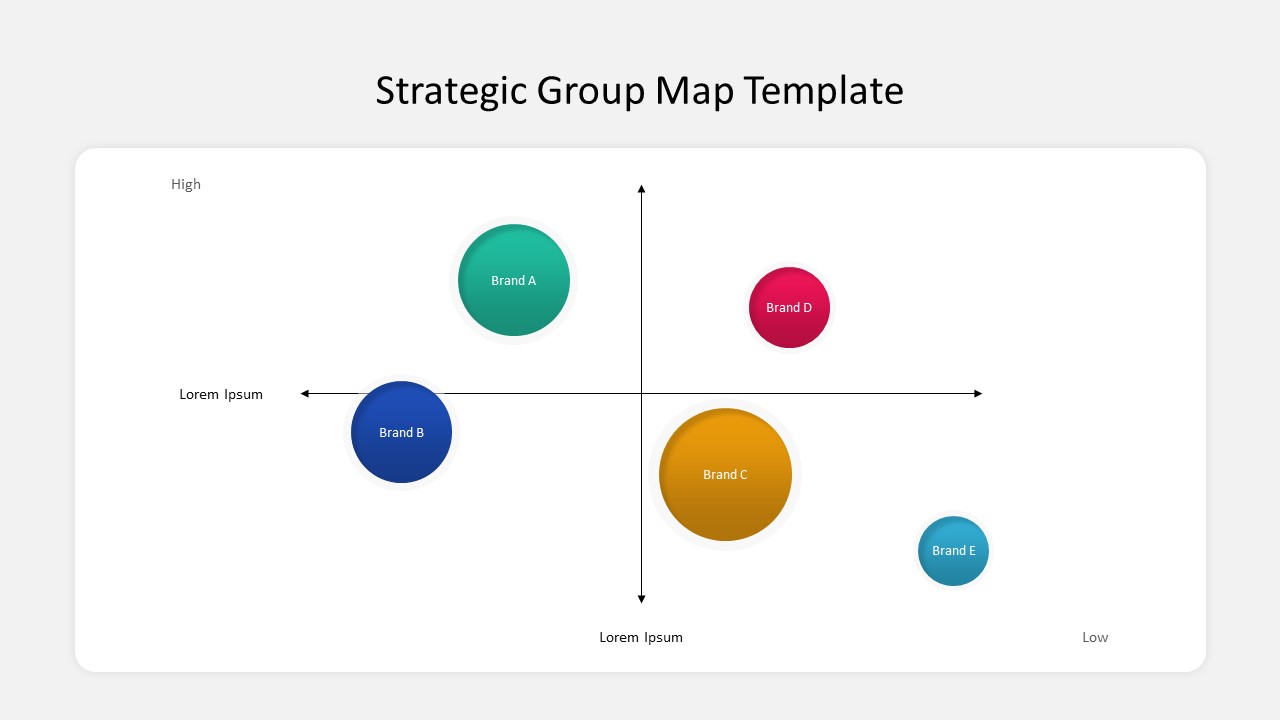
Business Strategic Group Map Analysis Template for PowerPoint & Google Slides
Competitor Analysis
Free
Six-Month Strategic SEO Roadmap Template for PowerPoint & Google Slides
Roadmap
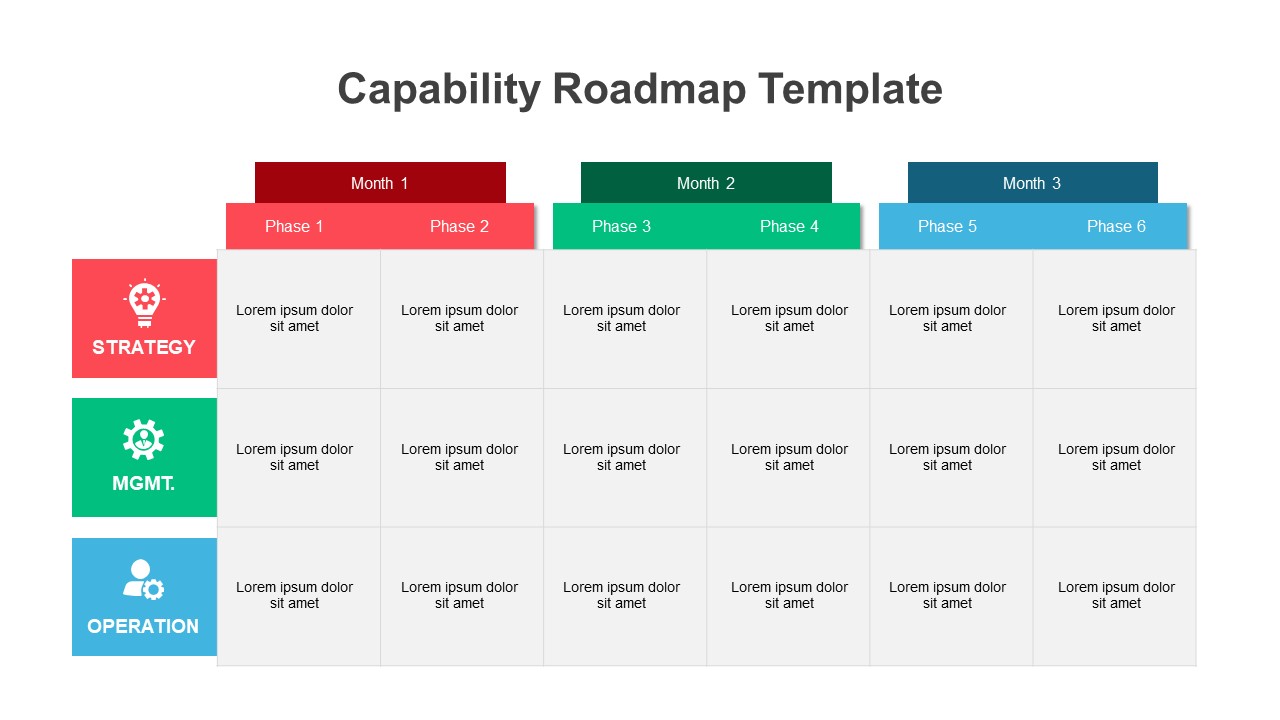
Interactive Strategic Capability Roadmap Template for PowerPoint & Google Slides
Roadmap
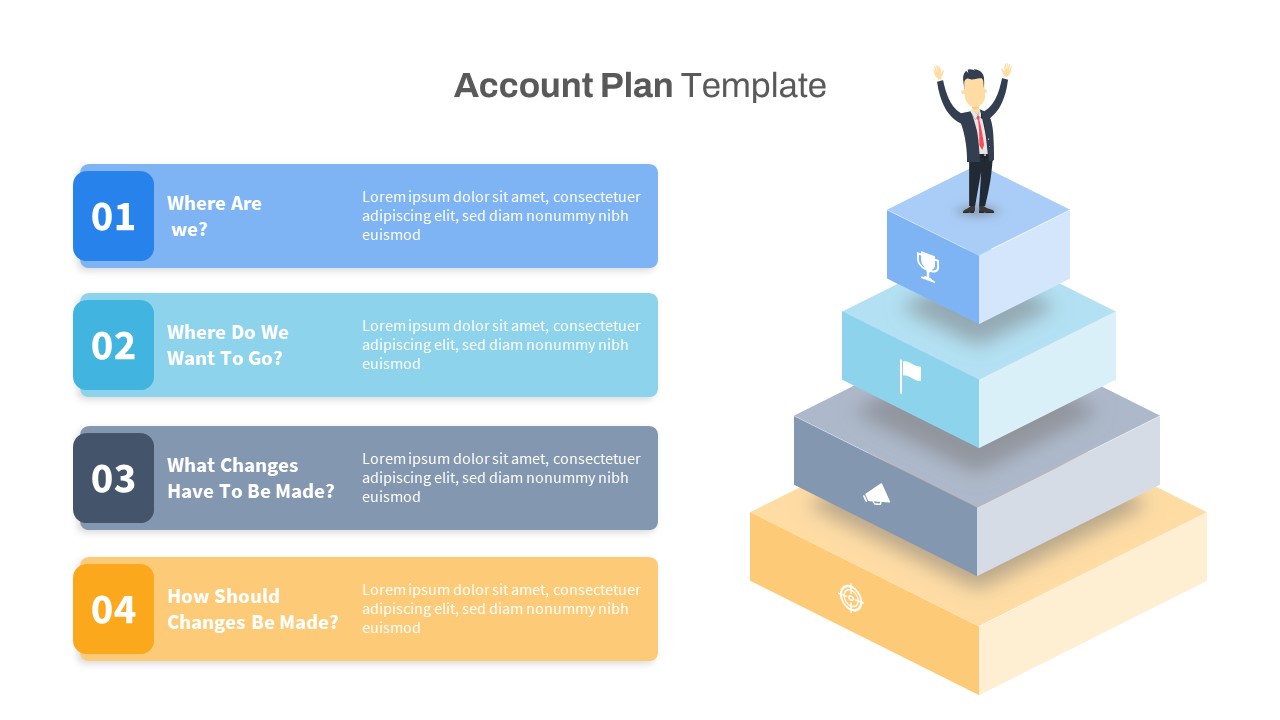
Strategic Account Plan Process Template for PowerPoint & Google Slides
Business Plan
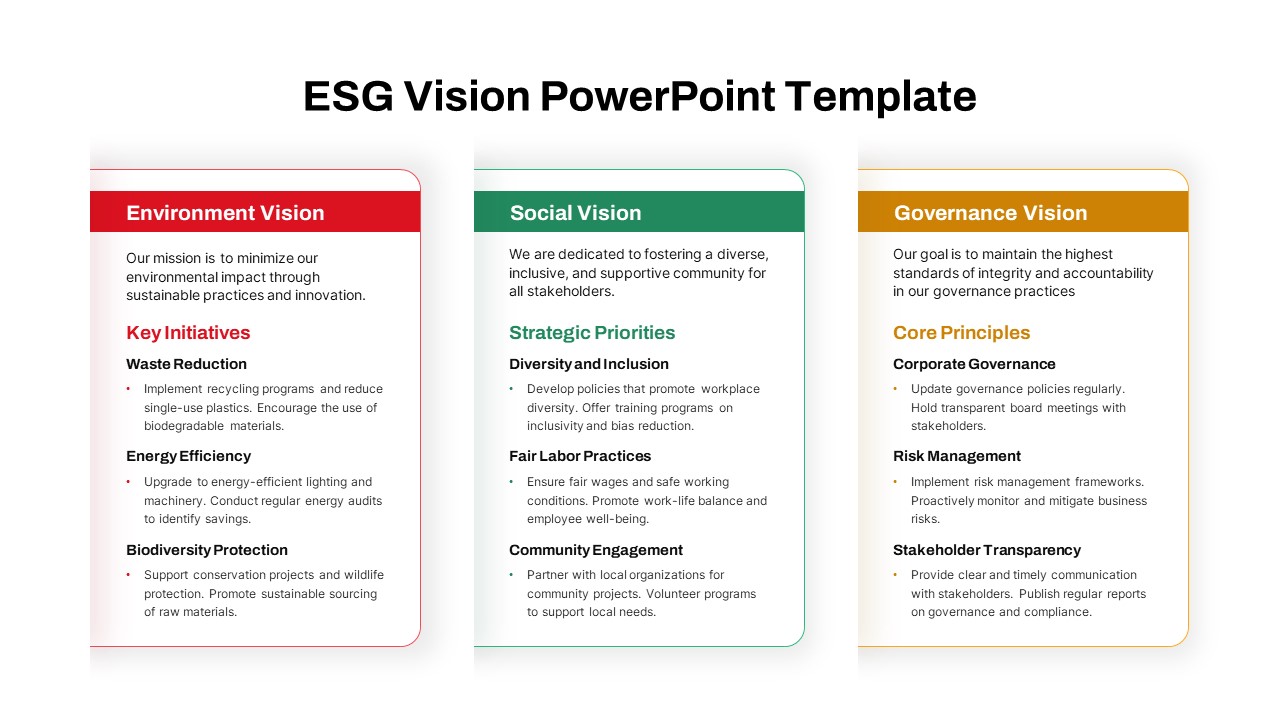
ESG Vision & Strategic Priorities Template for PowerPoint & Google Slides
Business Strategy
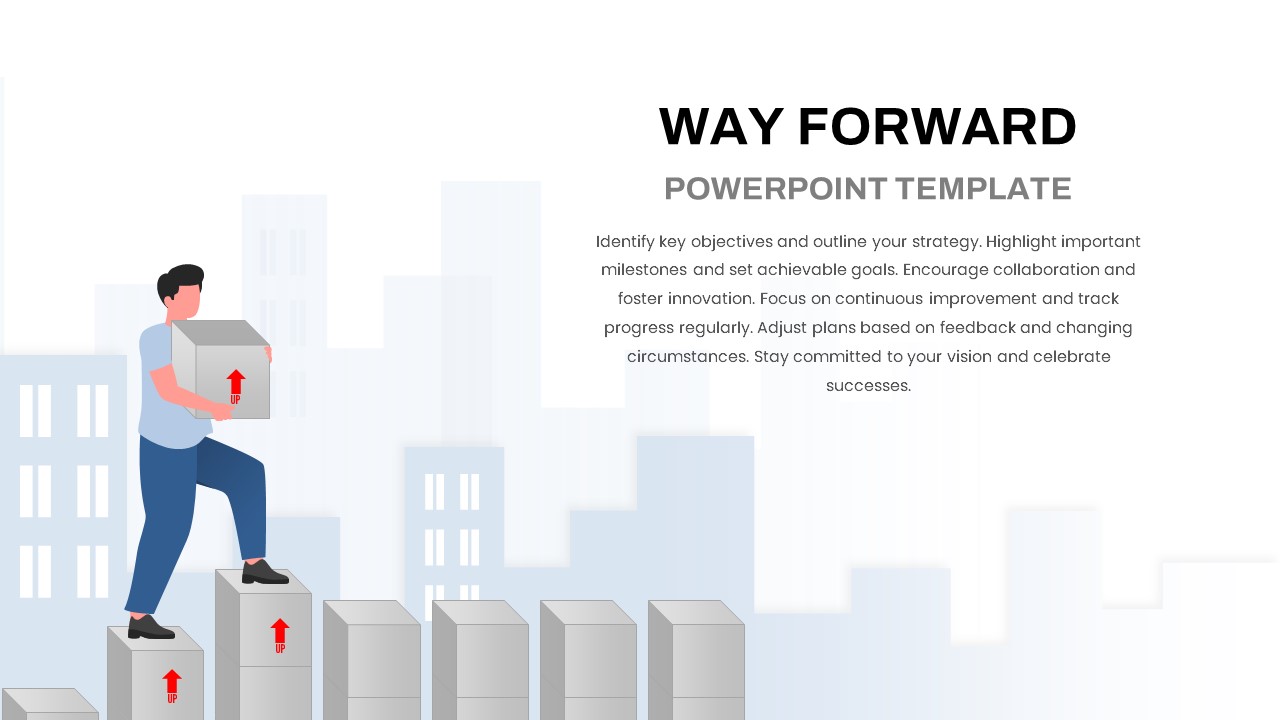
Way Forward Strategic Roadmap & Goals Template for PowerPoint & Google Slides
Goals
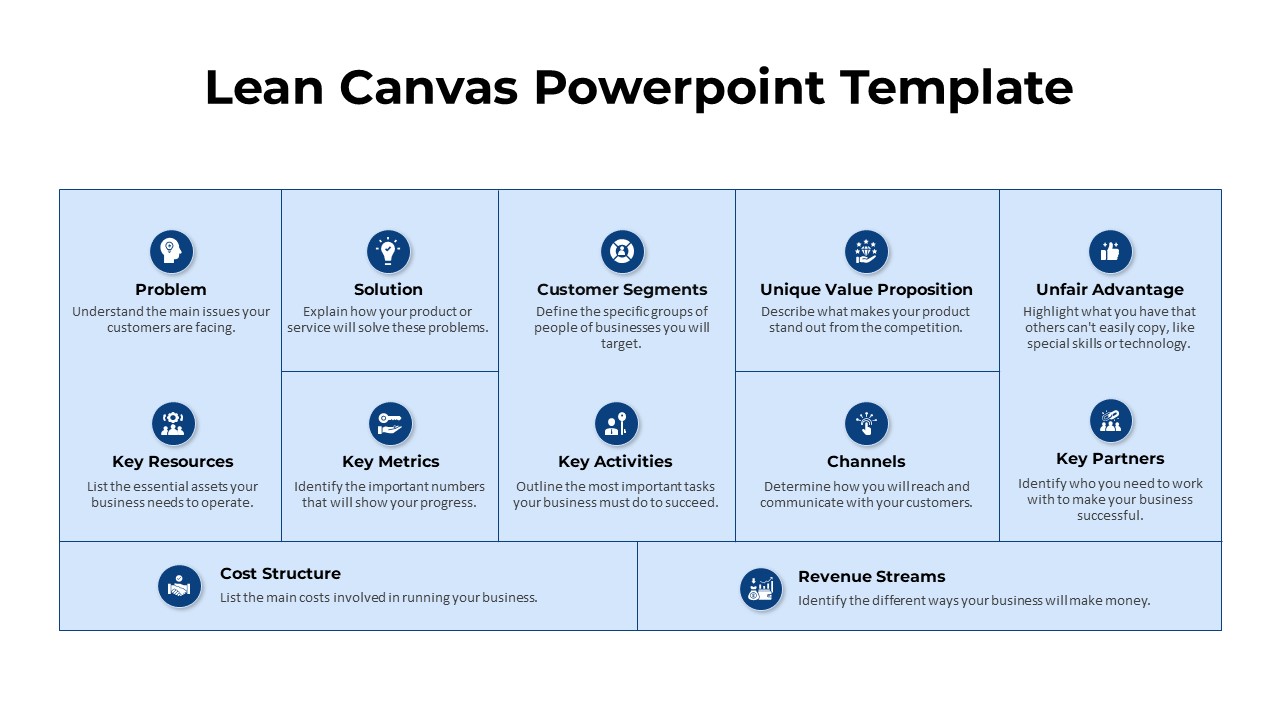
Strategic Lean Canvas Business Model Template for PowerPoint & Google Slides
Business Models
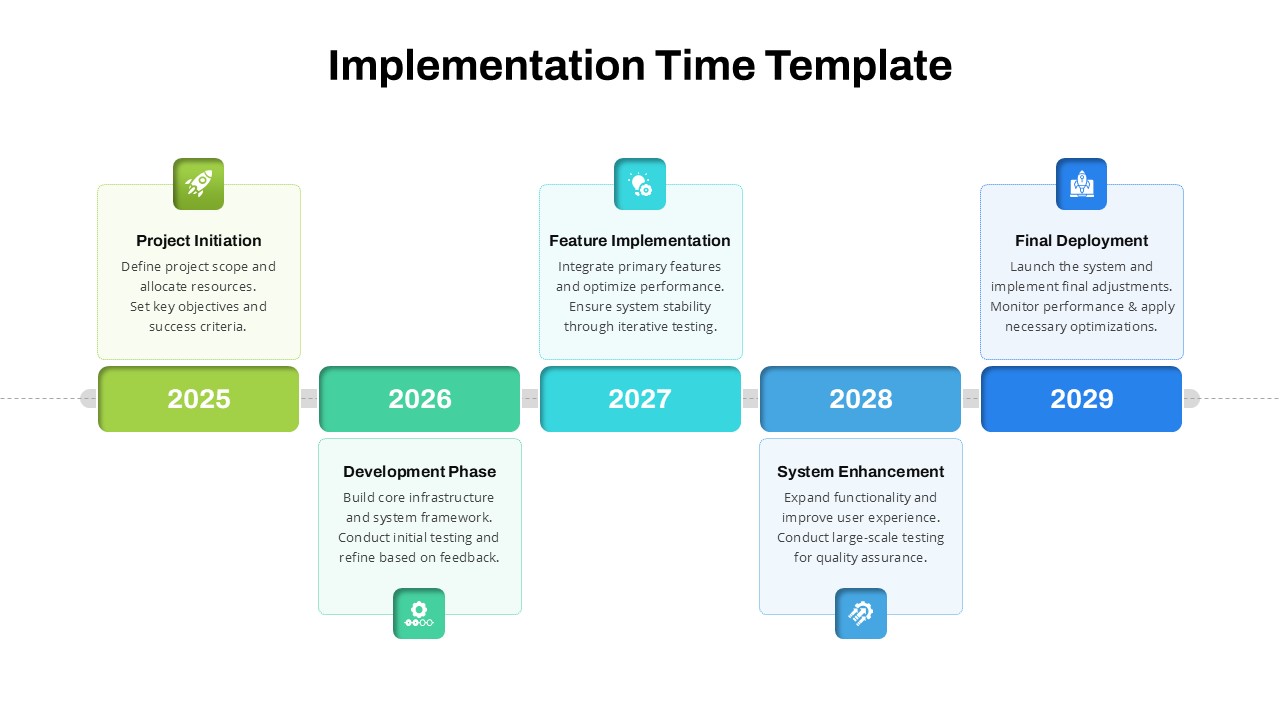
Strategic Implementation Time Timeline Template for PowerPoint & Google Slides
Timeline
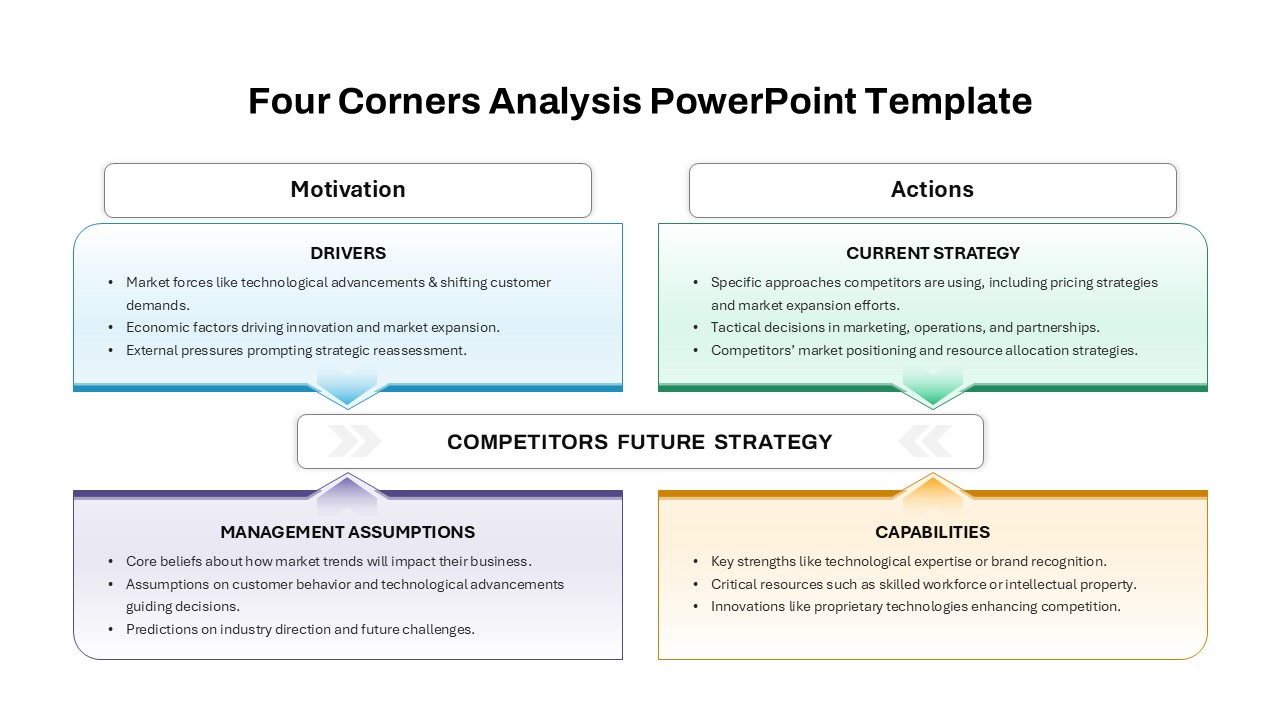
Four-Corners Strategic Analysis Quadrant Template for PowerPoint & Google Slides
SWOT
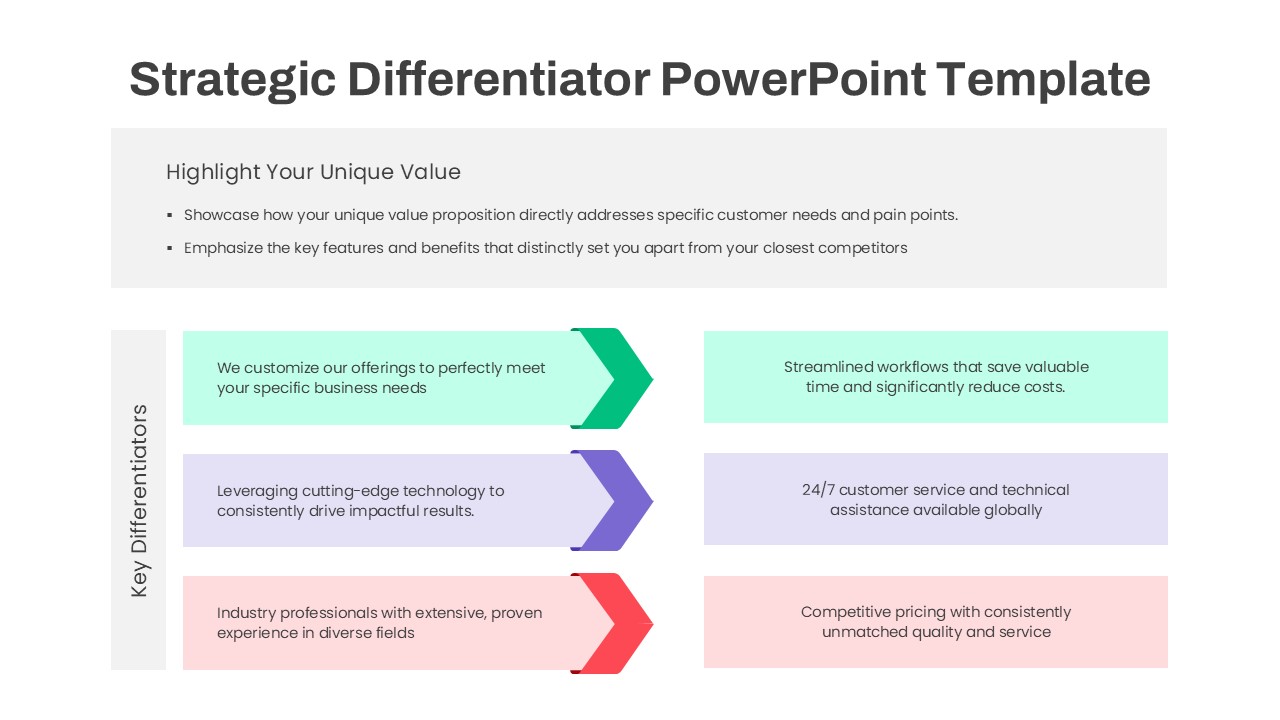
Three-Step Strategic Differentiator Template for PowerPoint & Google Slides
Competitor Analysis
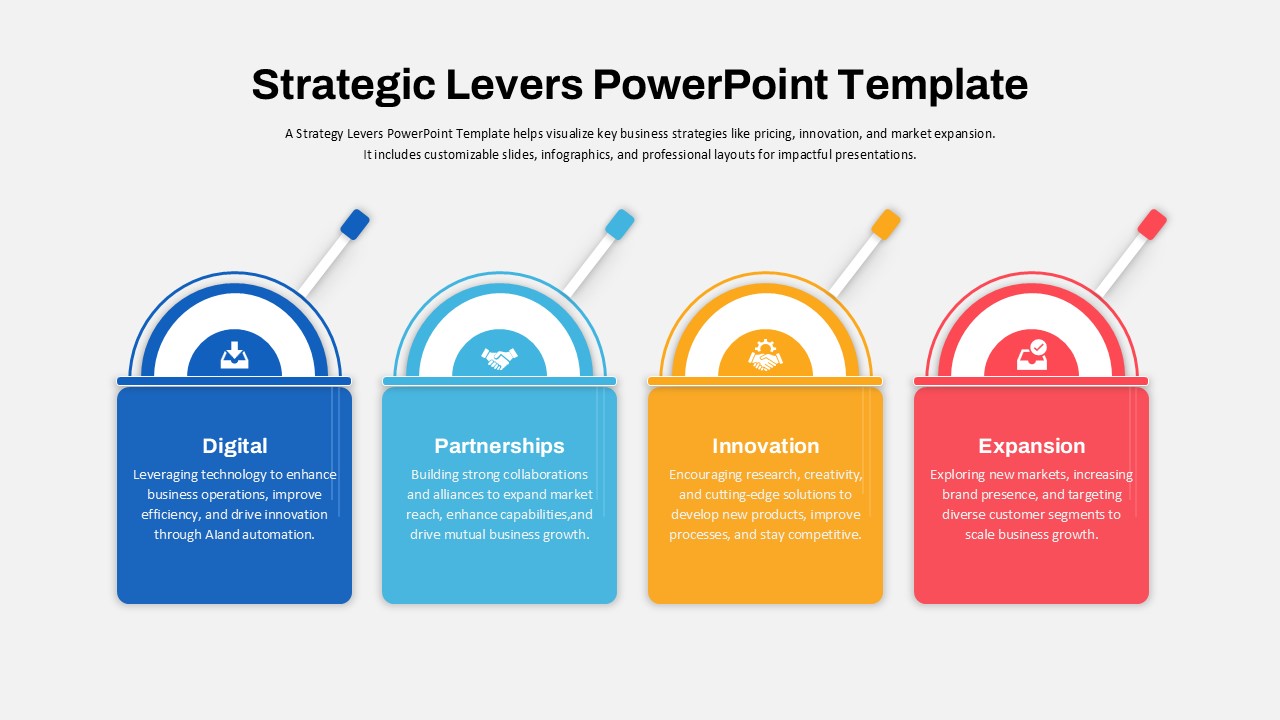
Strategic Levers Business Framework Template for PowerPoint & Google Slides
Business Strategy
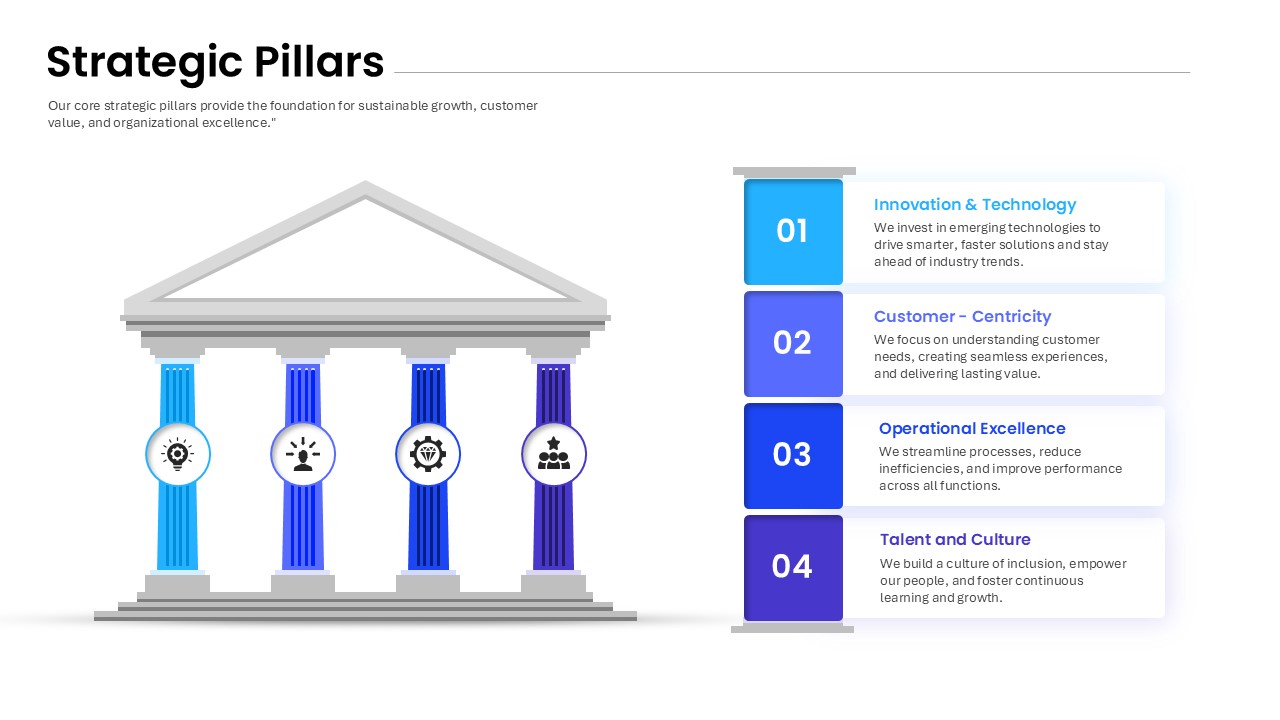
Strategic Pillars Foundation Framework Template for PowerPoint & Google Slides
Business Strategy
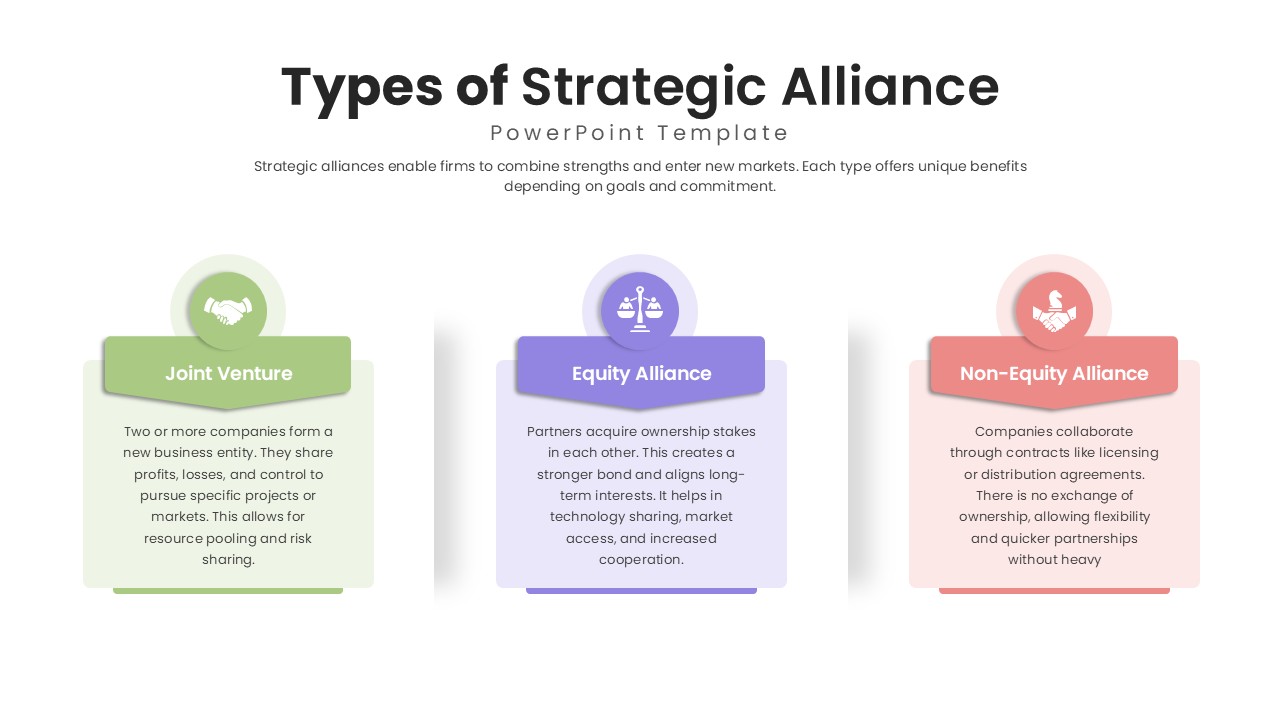
Strategic Alliance Types and Benefits template for PowerPoint & Google Slides
Business Strategy
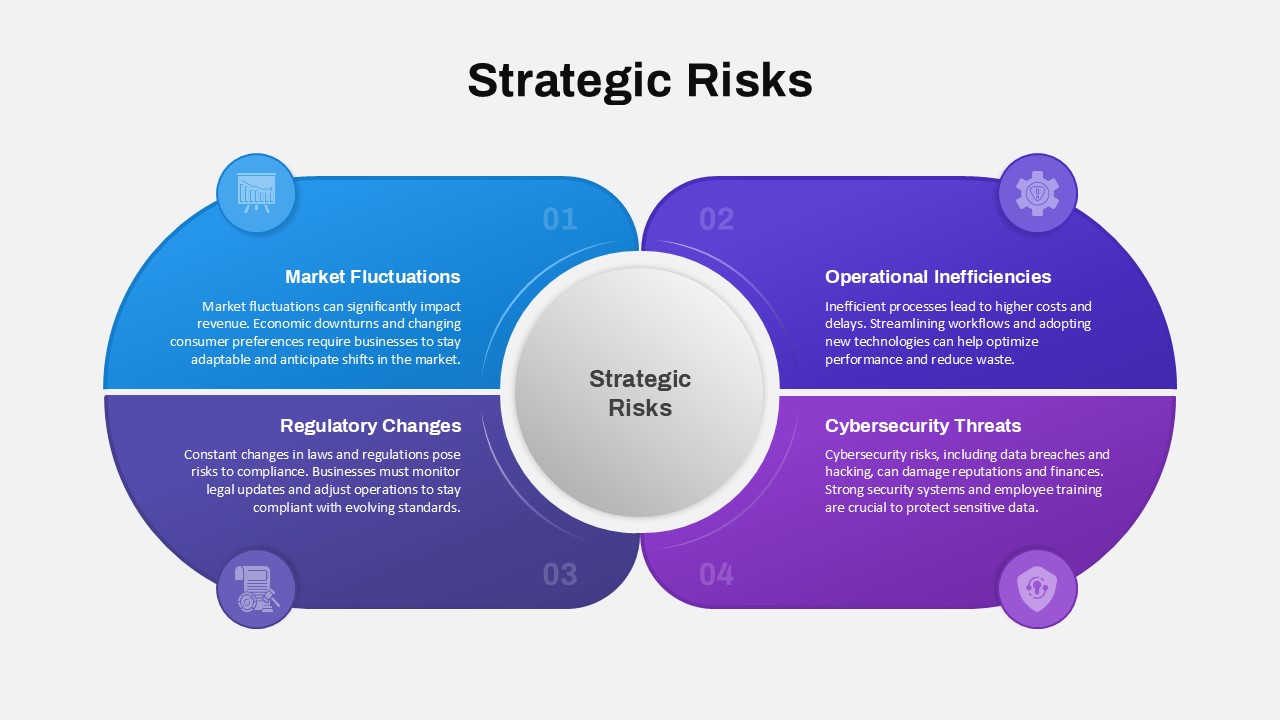
Strategic Risks Overview template for PowerPoint & Google Slides
Risk Management
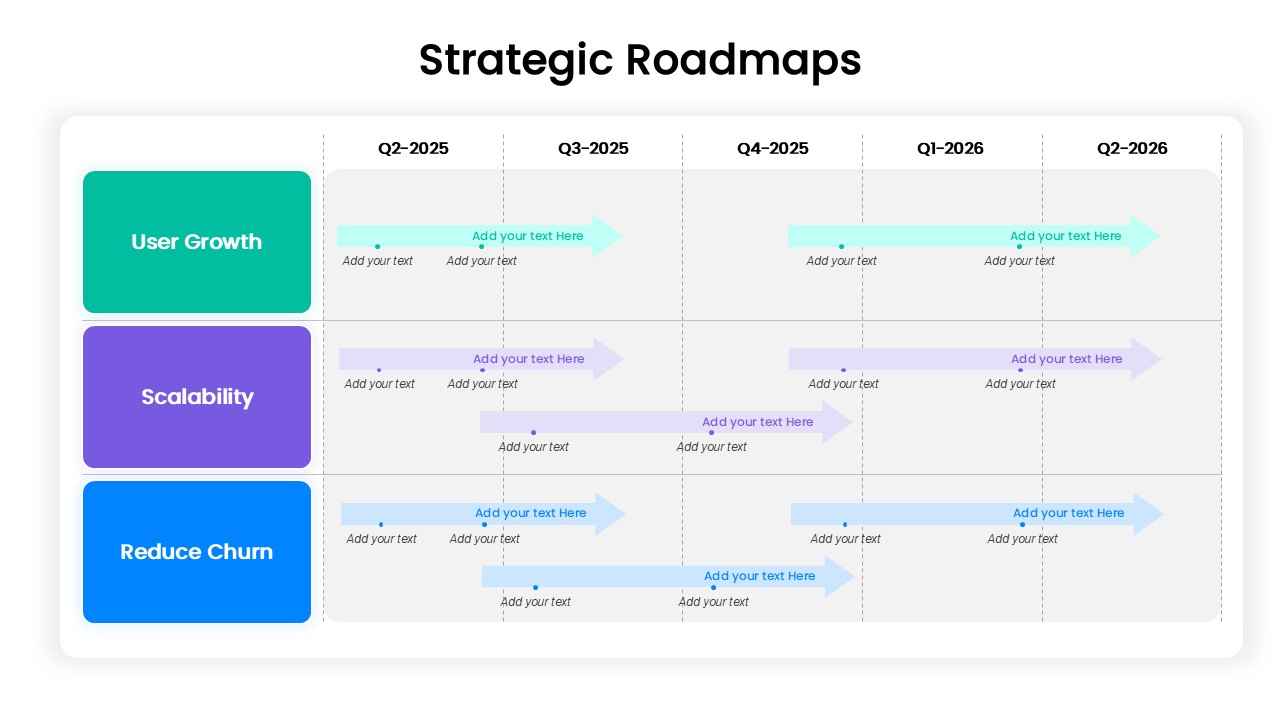
Strategic Roadmap for User Growth, Scalability, and Reducing Churn template for PowerPoint & Google Slides
Business
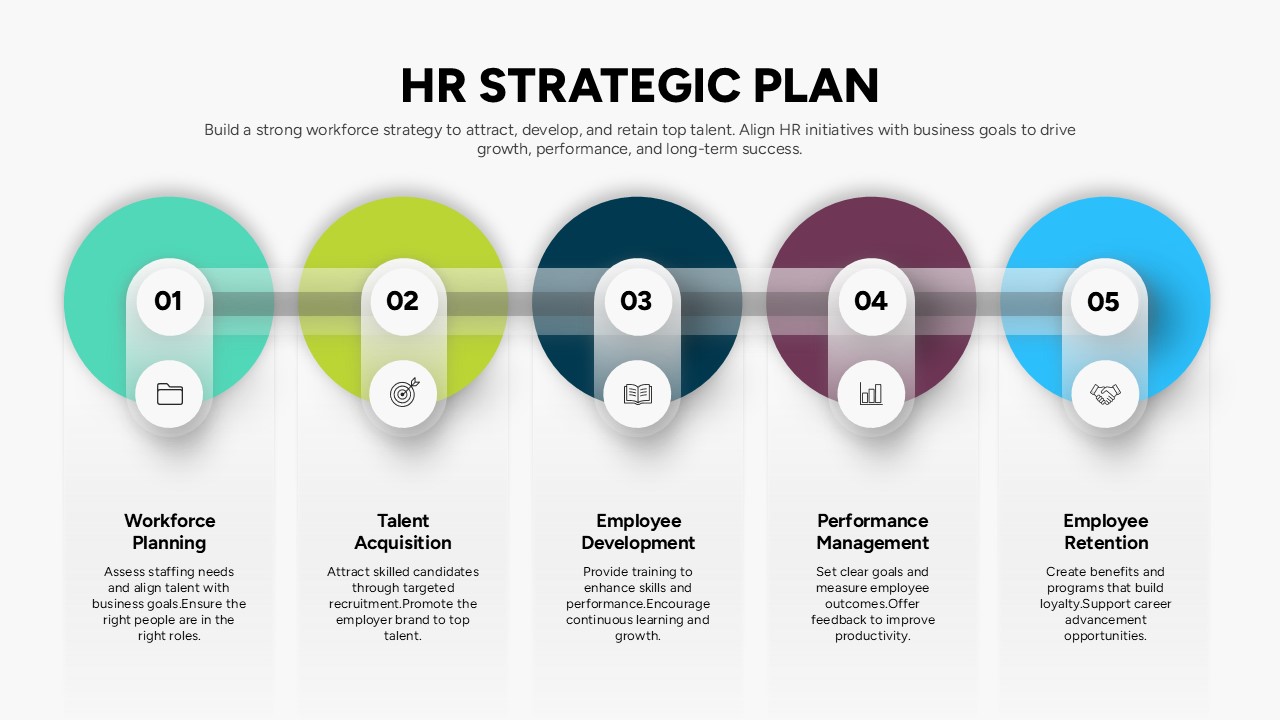
HR Strategic Plan Roadmap Template for PowerPoint & Google Slides
HR
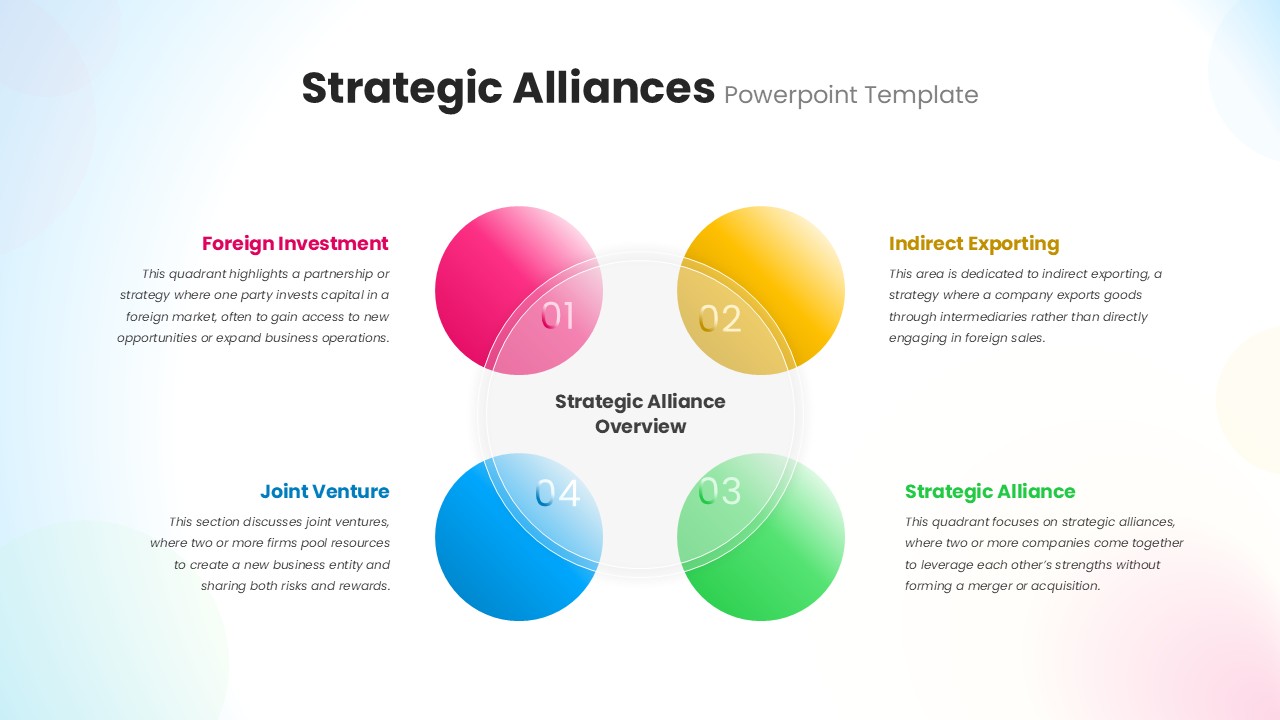
Strategic Alliances Template for PowerPoint & Google Slides
Business Strategy
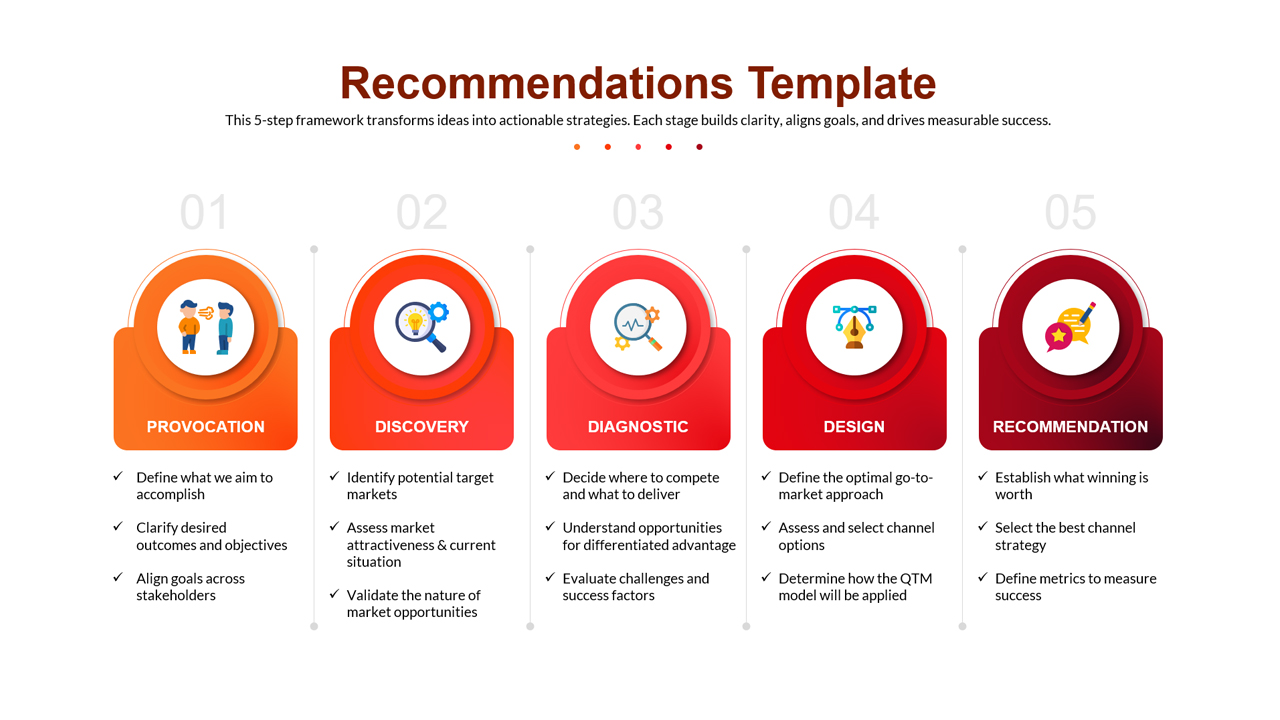
5-Step Strategic Recommendations Template for PowerPoint & Google Slides
Process
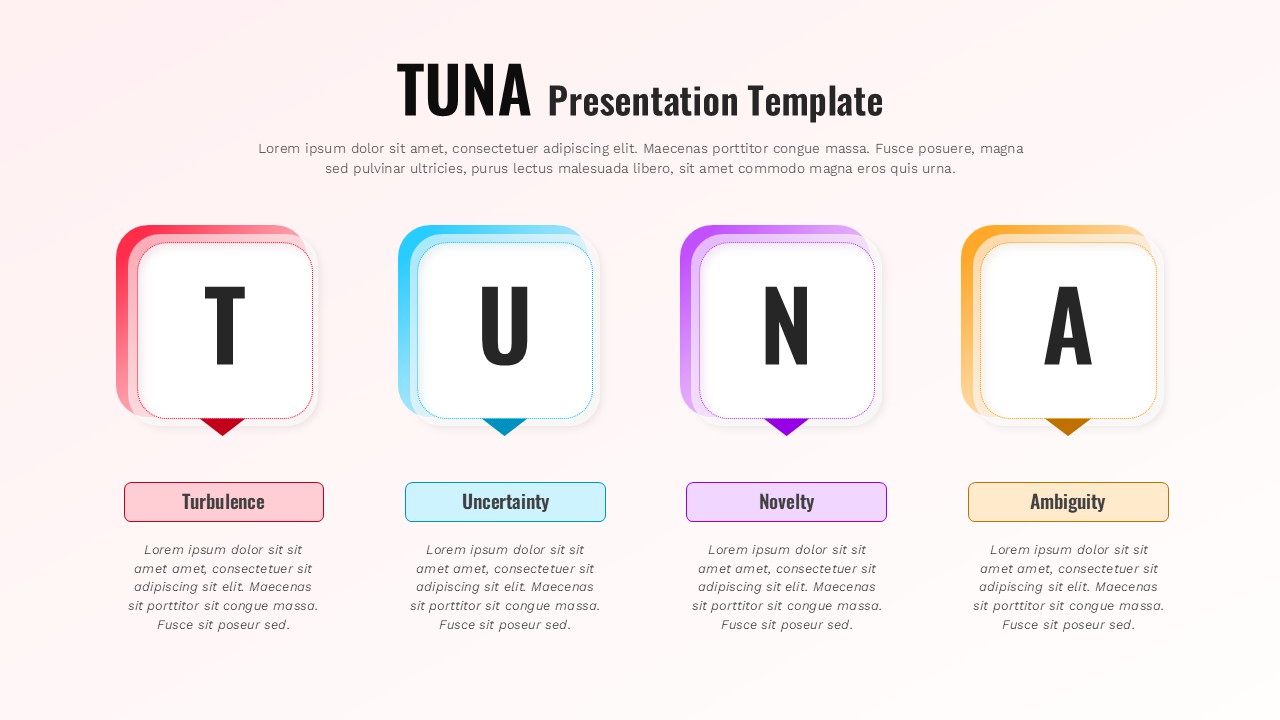
TUNA Framework Strategic Template for PowerPoint & Google Slides
Business Strategy
Headwind and Tailwind Strategic Forces Slide for PowerPoint & Google Slides
Gap
Strategic Options Overview for PowerPoint & Google Slides
Business
Sequential Arrow Timeline and Planning template for PowerPoint & Google Slides
Timeline
Four-Stage Business Planning Table Template for PowerPoint & Google Slides
Business Plan
Goal Planning Ribbon Process Infographic Template for PowerPoint & Google Slides
Goals
Sprint Planning Timeline & Backlog Cards Template for PowerPoint & Google Slides
Timeline
Succession Planning Presentation Template for PowerPoint & Google Slides
Company Profile
Capital Planning Five-Stage Process template for PowerPoint & Google Slides
Process
Release Planning Template for PowerPoint & Google Slides
Scrum
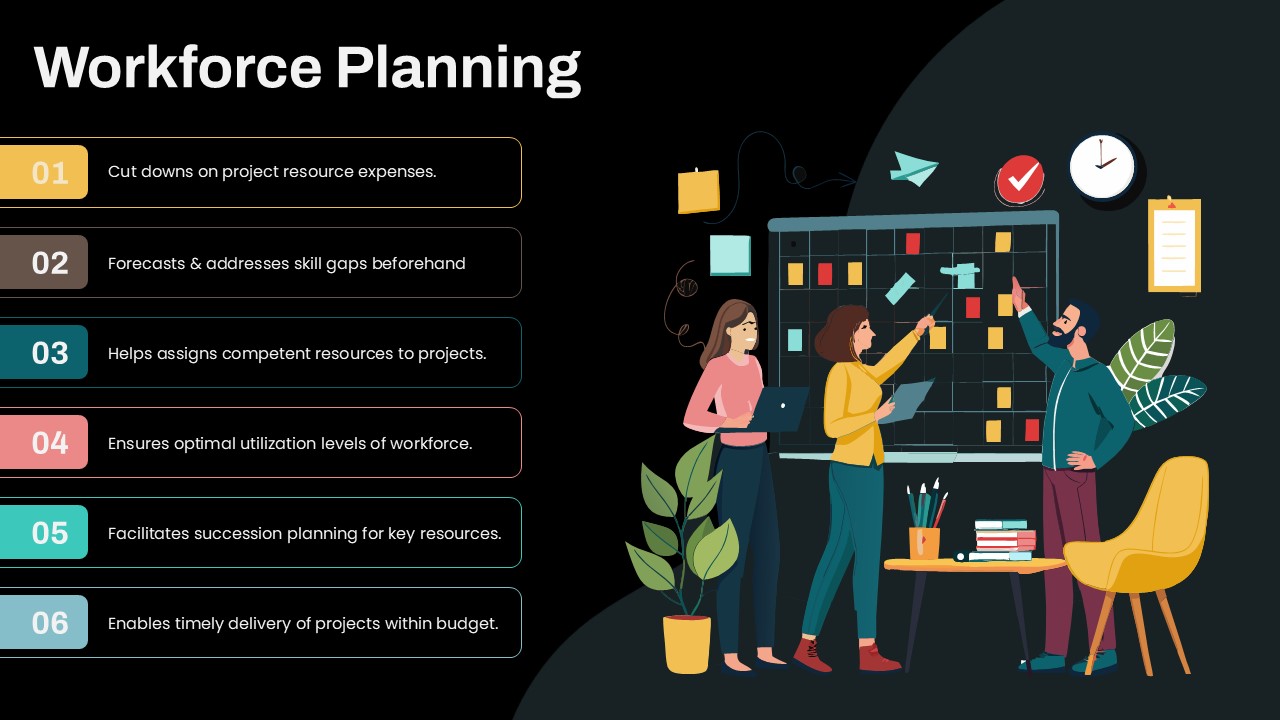
Workforce Planning Benefits Infographic Template for PowerPoint & Google Slides
HR
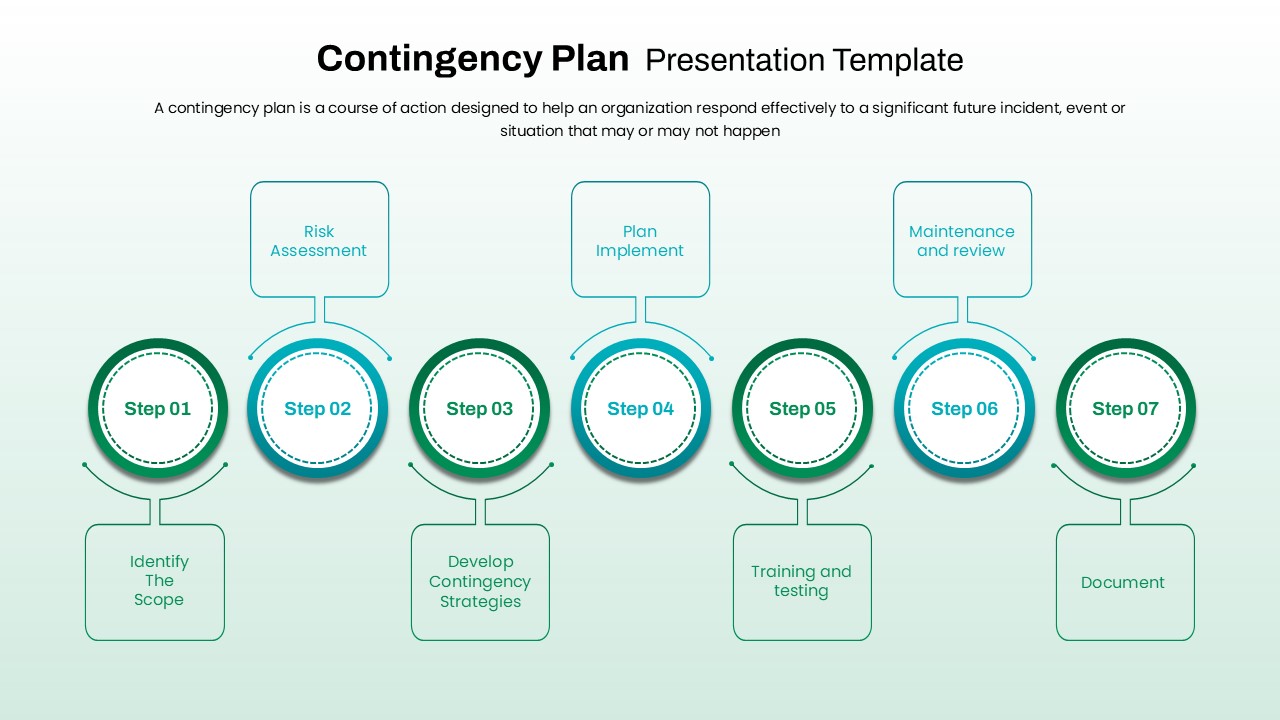
7-Step Contingency Planning Process Template for PowerPoint & Google Slides
Risk Management
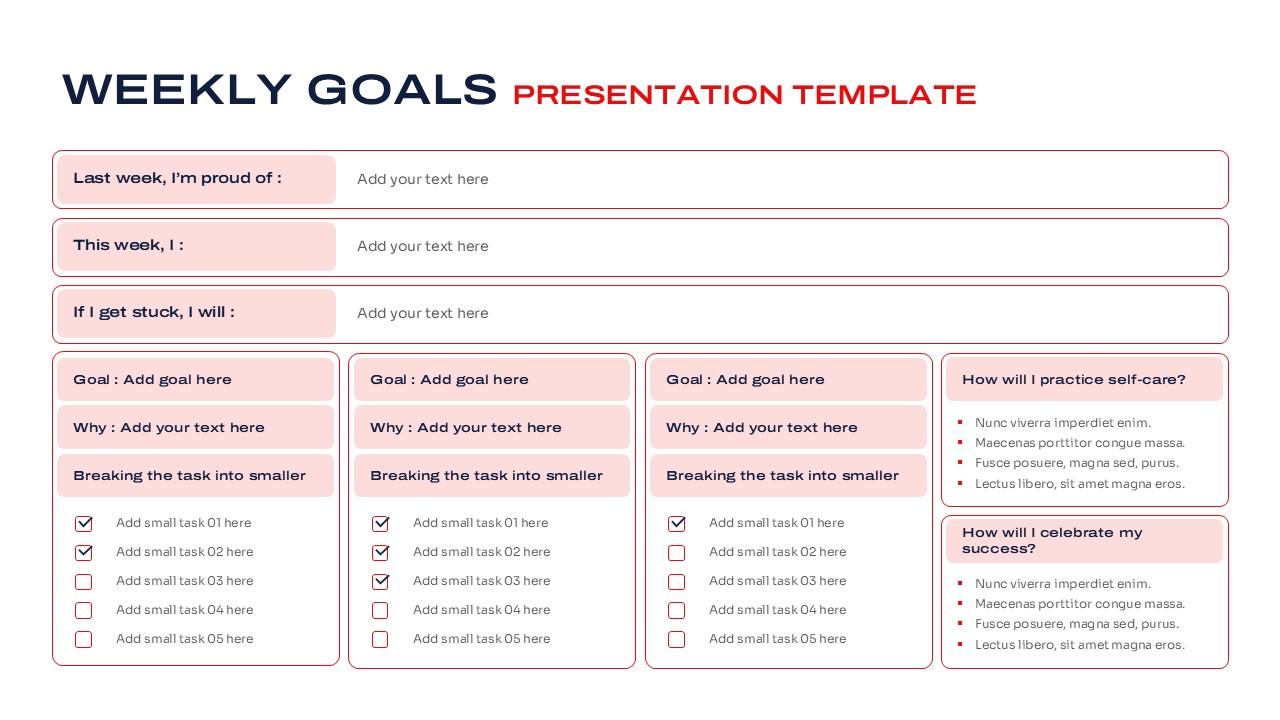
Weekly Goals Planning and Productivity Overview Template for PowerPoint & Google Slides
Goals