Organizational Maturity Model Diagram Template for PowerPoint & Google Slides

Description
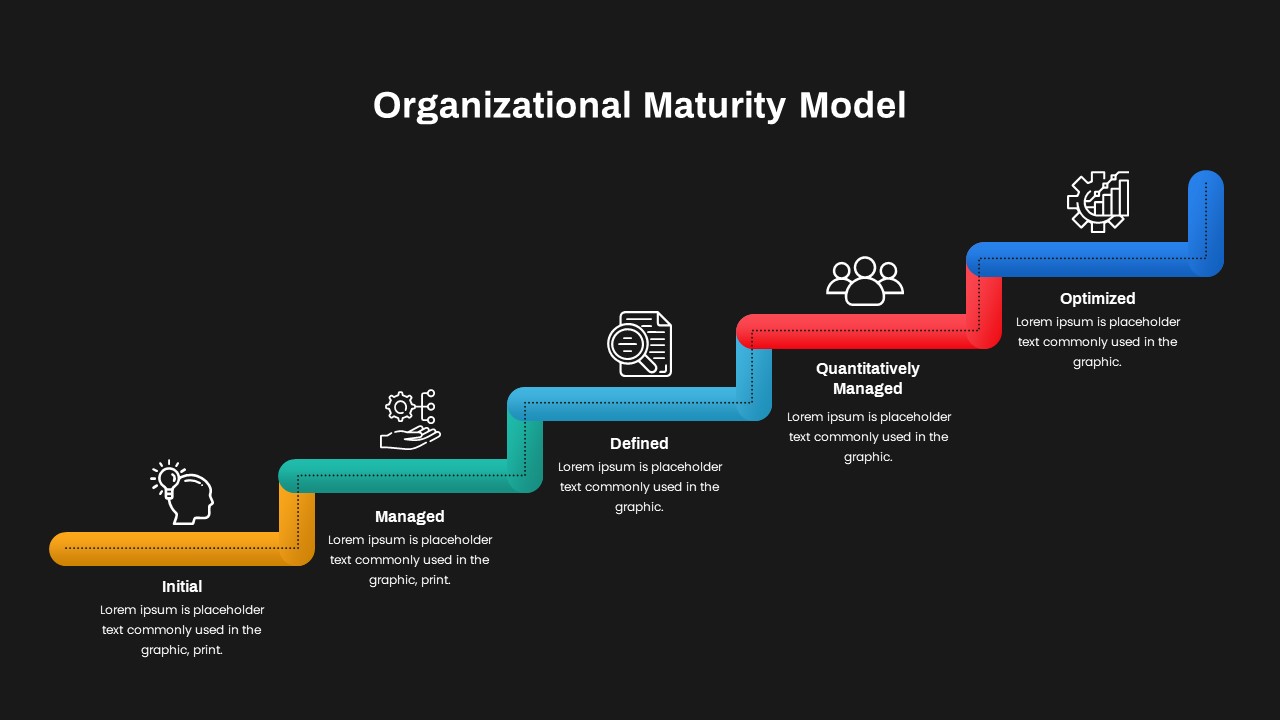
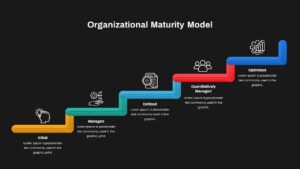
Visualize your organization’s growth trajectory with this maturity model diagram, featuring five ascending steps—Initial, Managed, Defined, Quantitatively Managed, and Optimized—connected by a dotted flow line. Each step is uniquely colored (orange, teal, cyan, red, and blue) and paired with a flat icon to emphasize key process capabilities. The staircase layout underscores the progressive nature of capability development, while subtle drop shadows and a neutral background maintain clarity and professionalism.
Fully editable in PowerPoint and Google Slides, this template offers organized layers, intuitive placeholders, and scalable vector shapes. Easily update step titles, adjust segment colors to match your brand palette, or swap icons to fit specific methodologies. The master slide integration ensures consistency across large decks and simplifies version control for remote collaboration. Adjust step widths to reflect performance metrics or insert data callouts without disrupting the overall design.
Leverage this diagram to map process improvement initiatives, capability maturity assessments, or quality management roadmaps. Highlight current maturity levels, set targets for advancement, or illustrate benchmarking results against industry standards. The balanced composition directs viewer attention sequentially, making complex strategic frameworks immediately accessible.
Who is it for
Business analysts, process improvement teams, and quality managers will find this slide invaluable for presenting maturity assessments, capability roadmaps, and continuous improvement plans to stakeholders or leadership teams.
Other Uses
Repurpose the staircase layout for project phase overviews, product development milestones, risk management stages, or compliance audit workflows by simply renaming steps and updating icons.
Login to download this file

Item ID
SB03432
Related Templates

Four-Phase Maturity Model Diagram Template for PowerPoint & Google Slides
Process

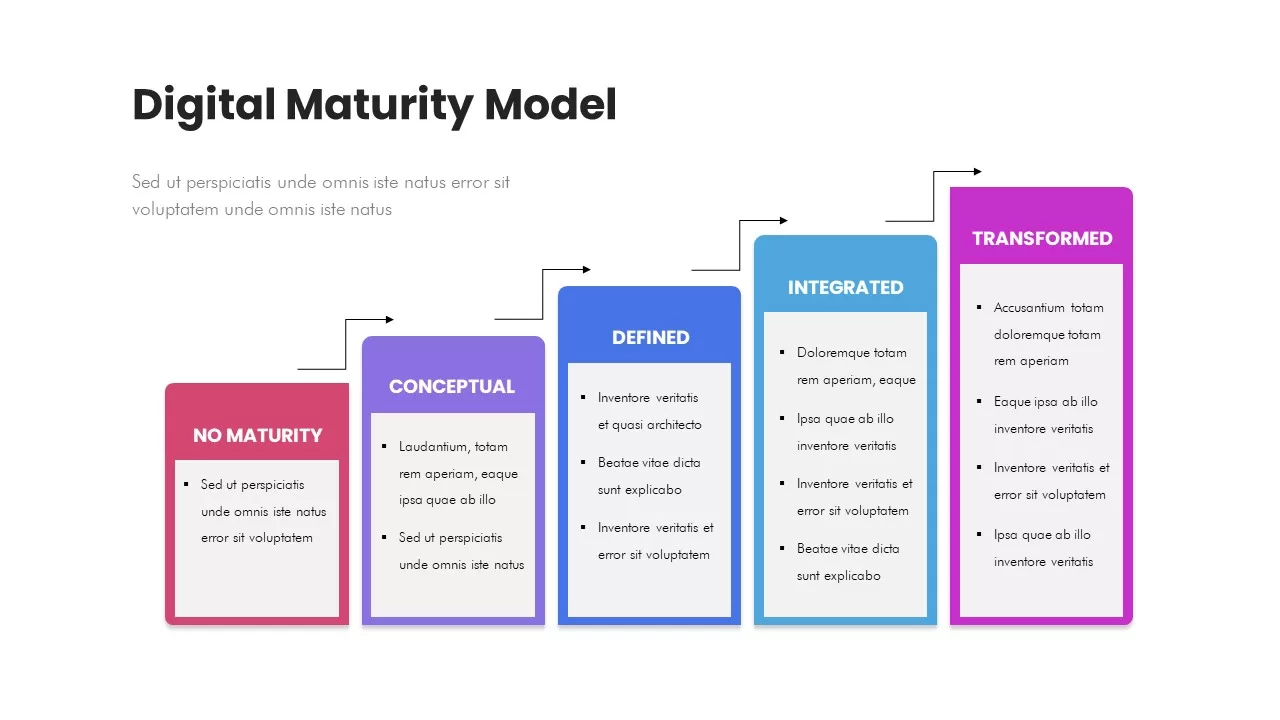
Digital Maturity Model Stages Diagram Template for PowerPoint & Google Slides
Process
Five-Stage Digital Maturity Model Diagram Template for PowerPoint & Google Slides
Process
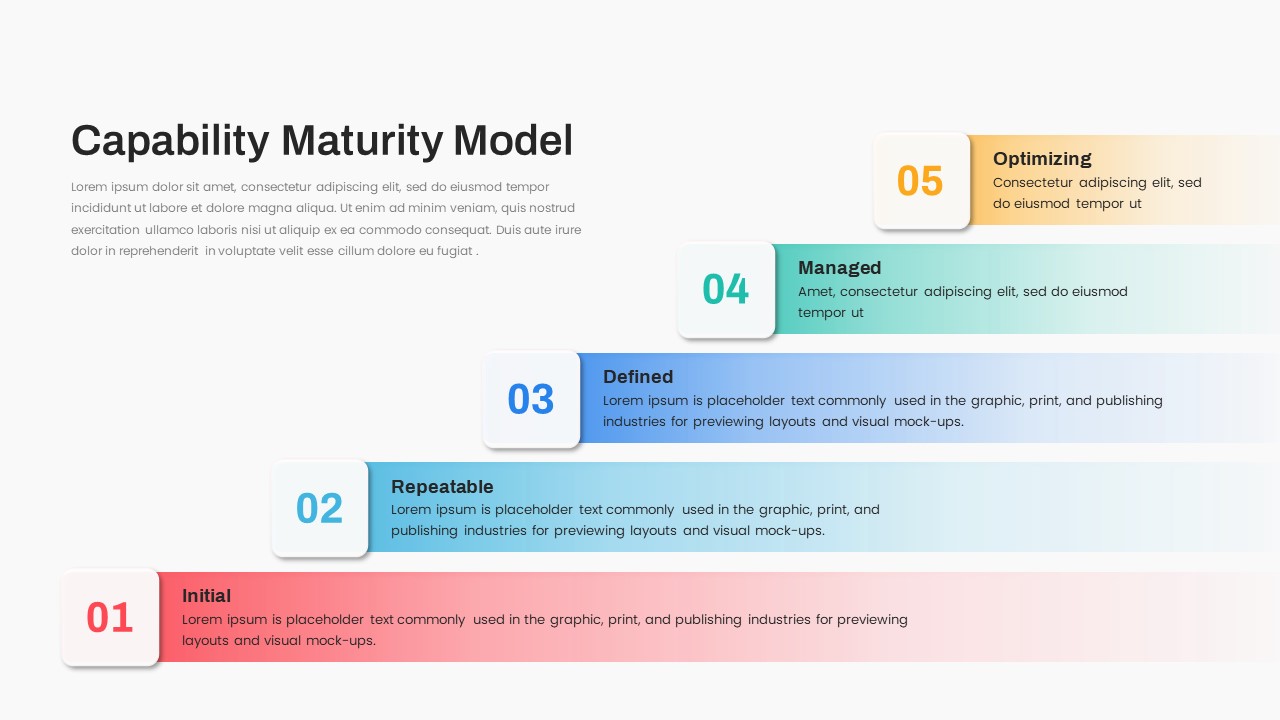
Capability Maturity Model Infographic Template for PowerPoint & Google Slides
Software Development
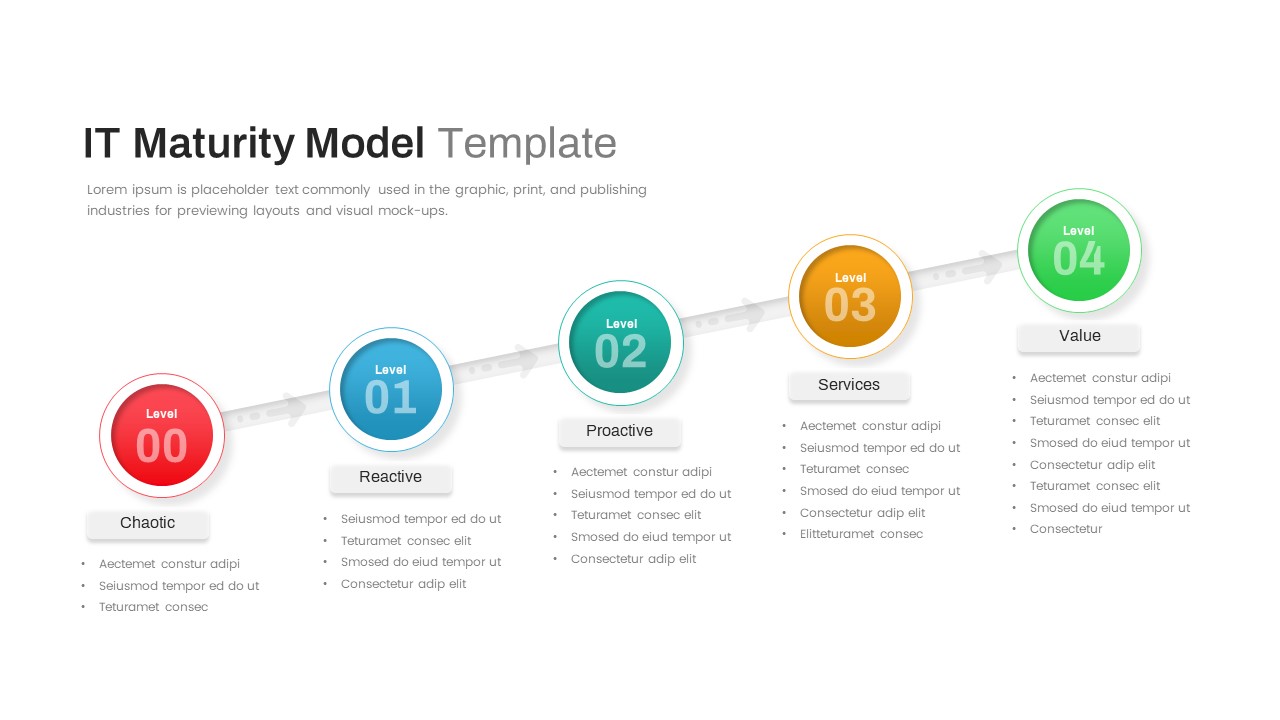
IT Maturity Model with Five Stages Template for PowerPoint & Google Slides
Timeline
Layered Data Governance Maturity Model Template for PowerPoint & Google Slides
Process
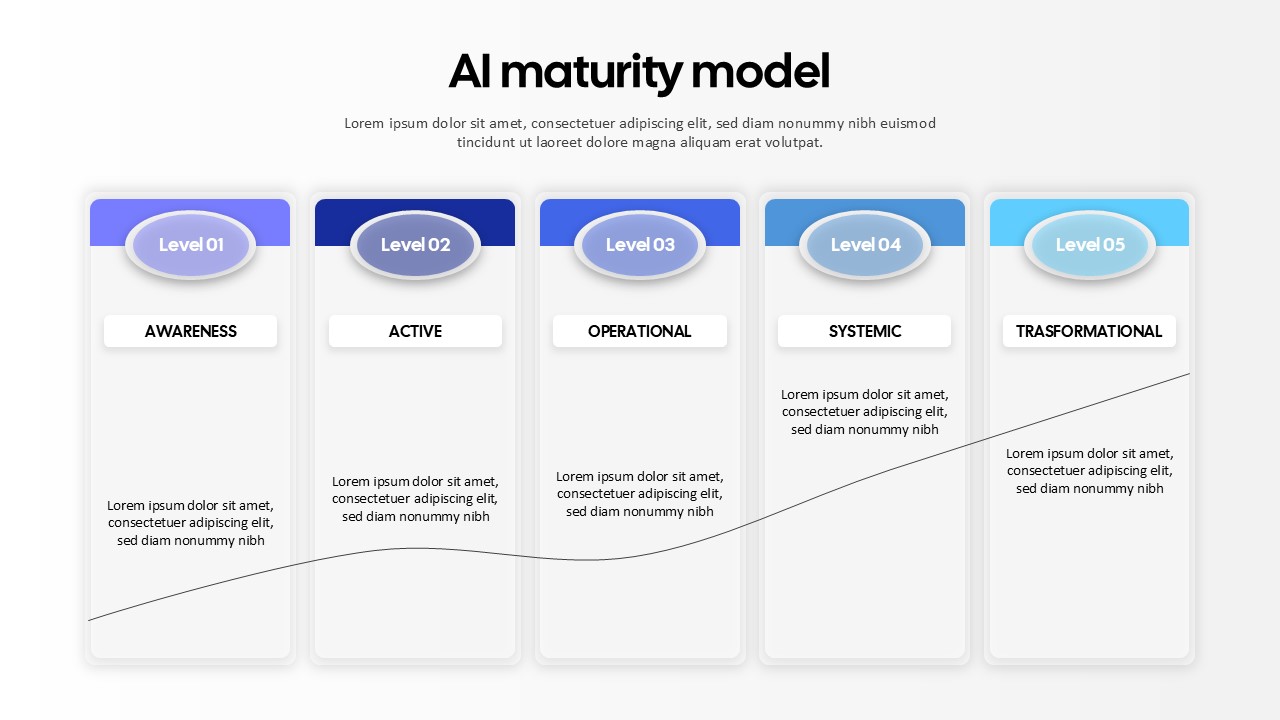
AI Maturity Model Levels template for PowerPoint & Google Slides
Technology
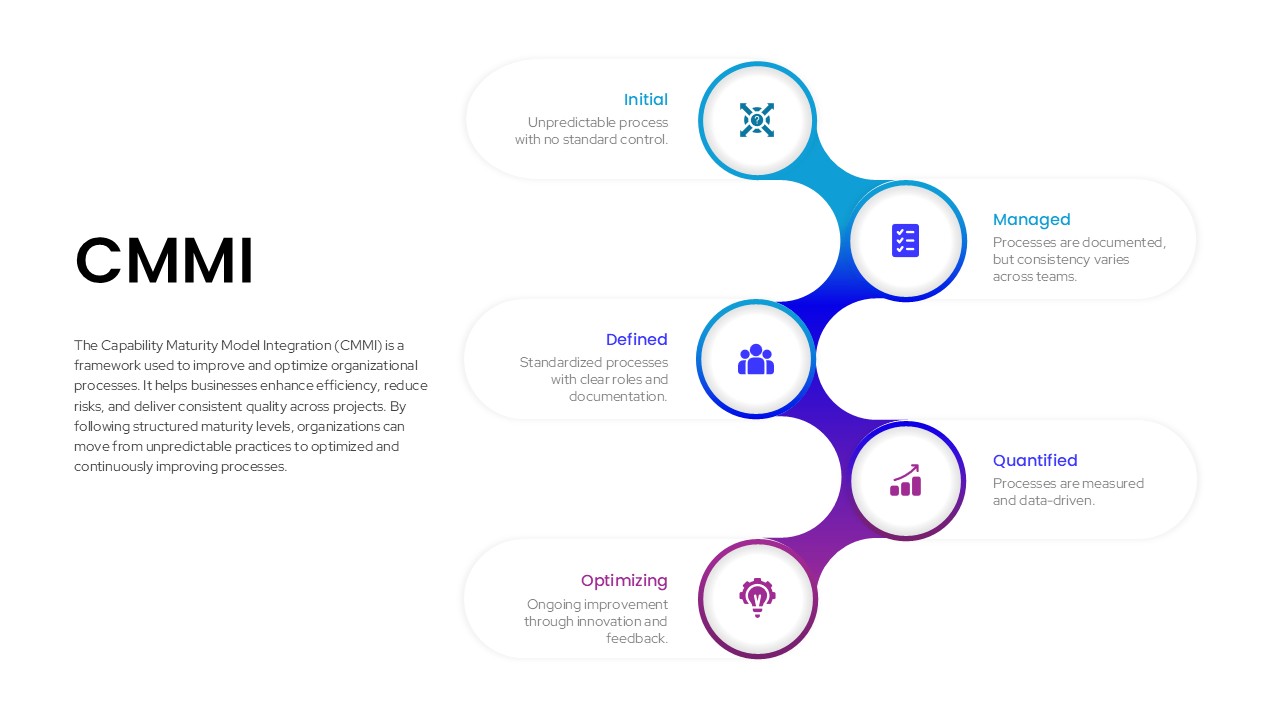
CMMI Process Maturity Model Infographic Template for PowerPoint & Google Slides
Process
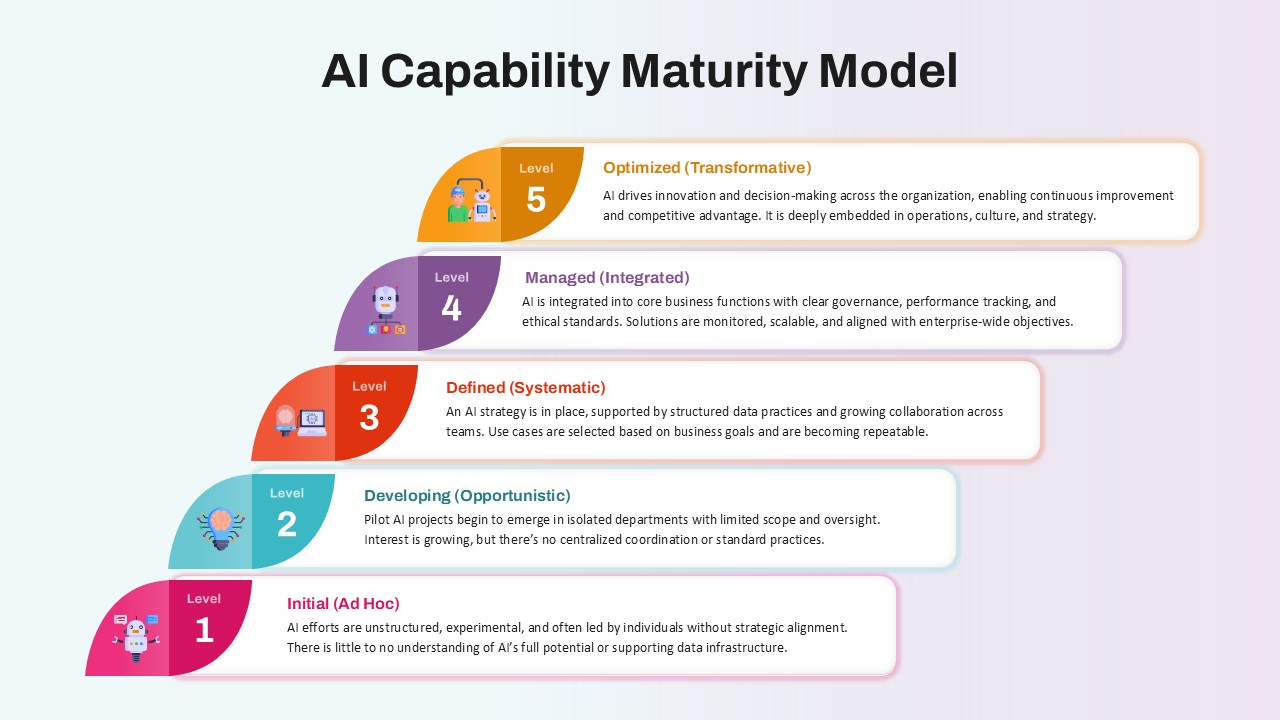
AI Capability Maturity Model Overview for PowerPoint & Google Slides
Technology
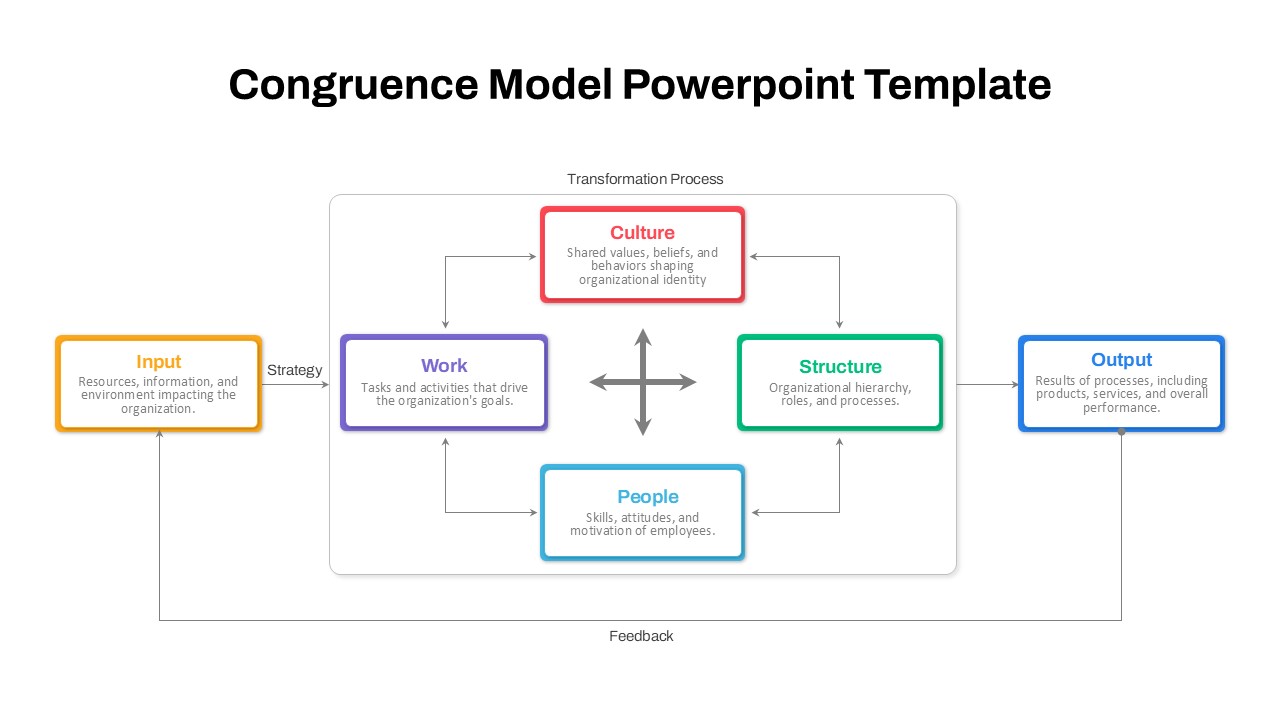
Organizational Congruence Model Diagram Template for PowerPoint & Google Slides
Process
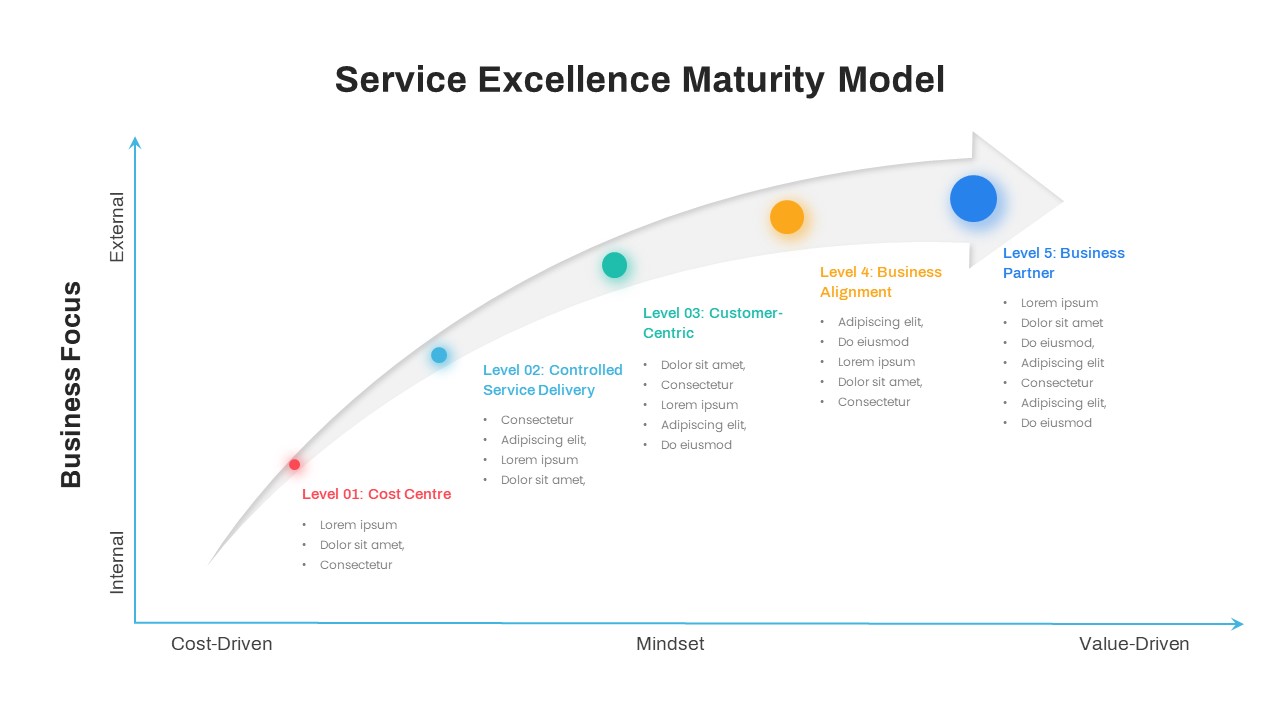
Service Excellence Maturity 5-Stage Template for PowerPoint & Google Slides
Process
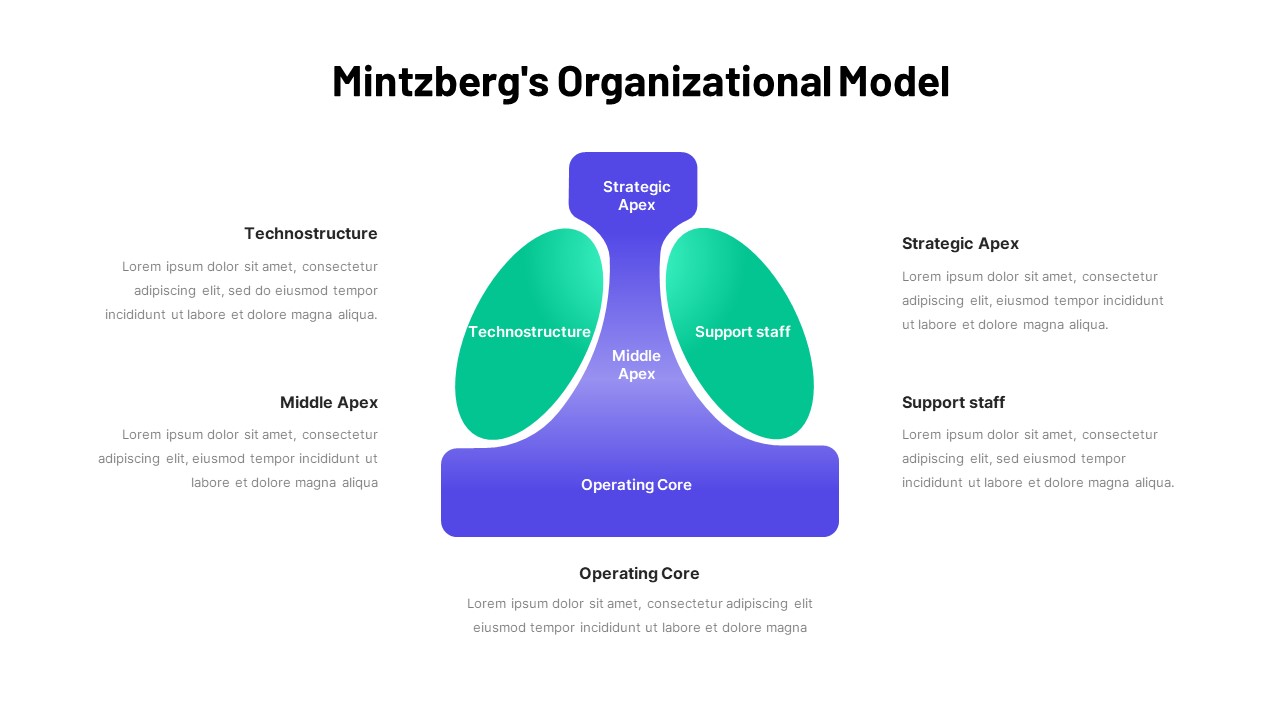
Mintzberg Organizational Model Gradient Template for PowerPoint & Google Slides
Business
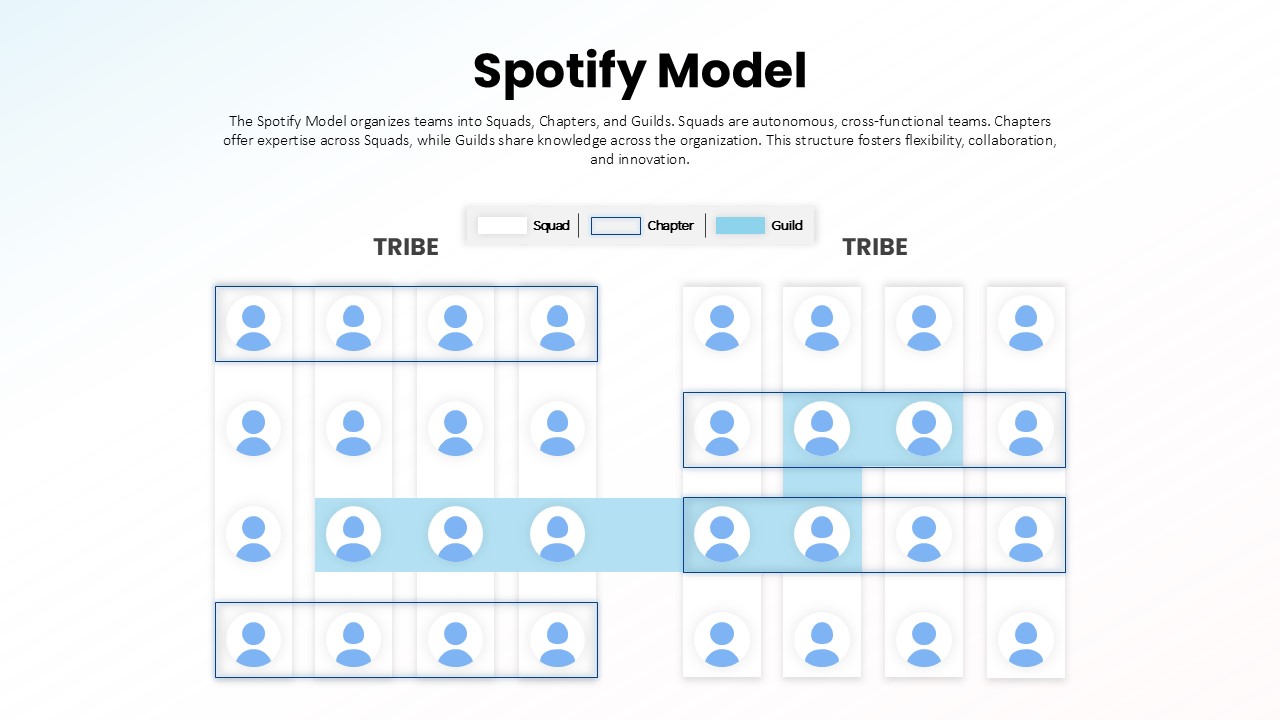
Spotify Model Organizational Structure template for PowerPoint & Google Slides
Business Strategy
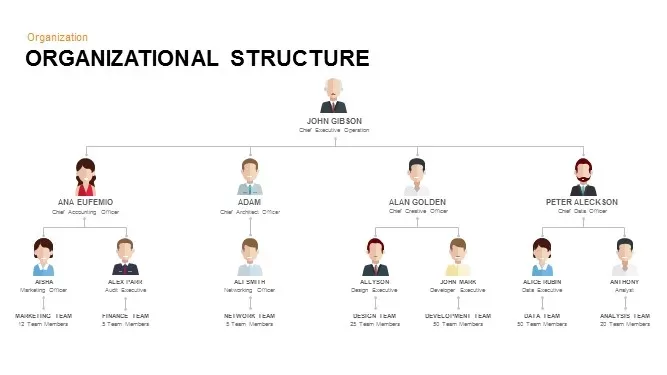
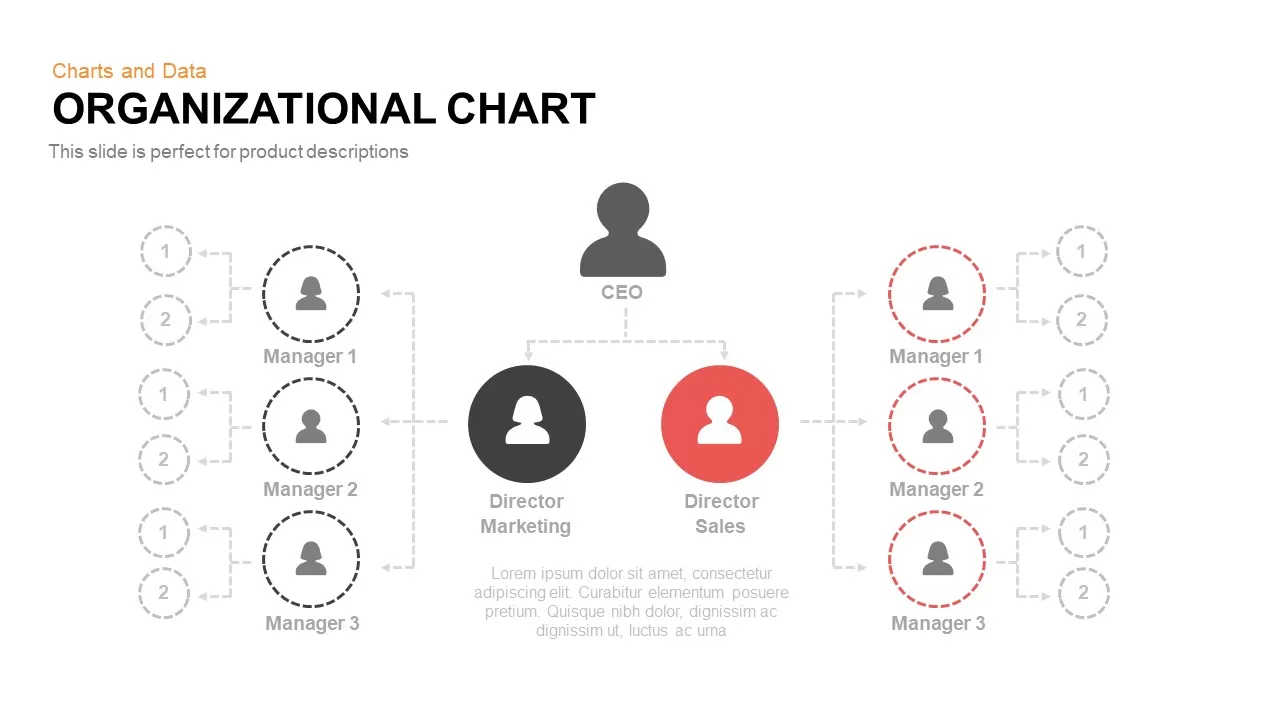
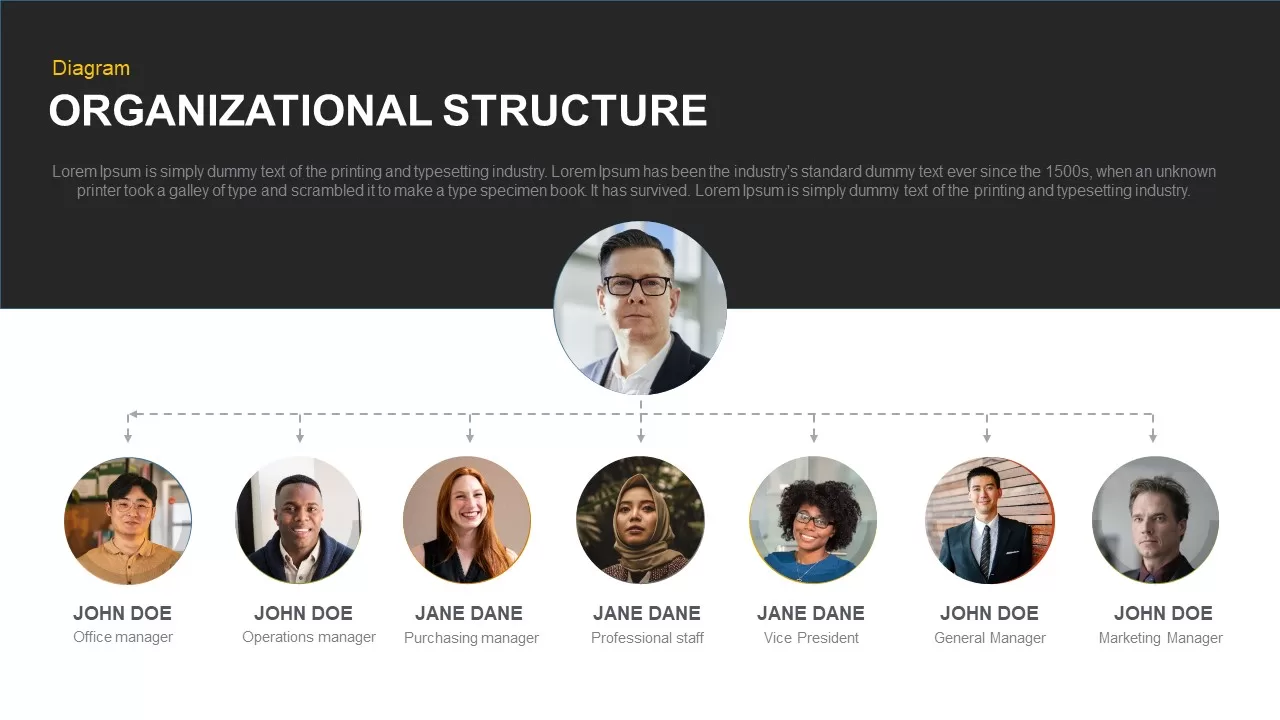
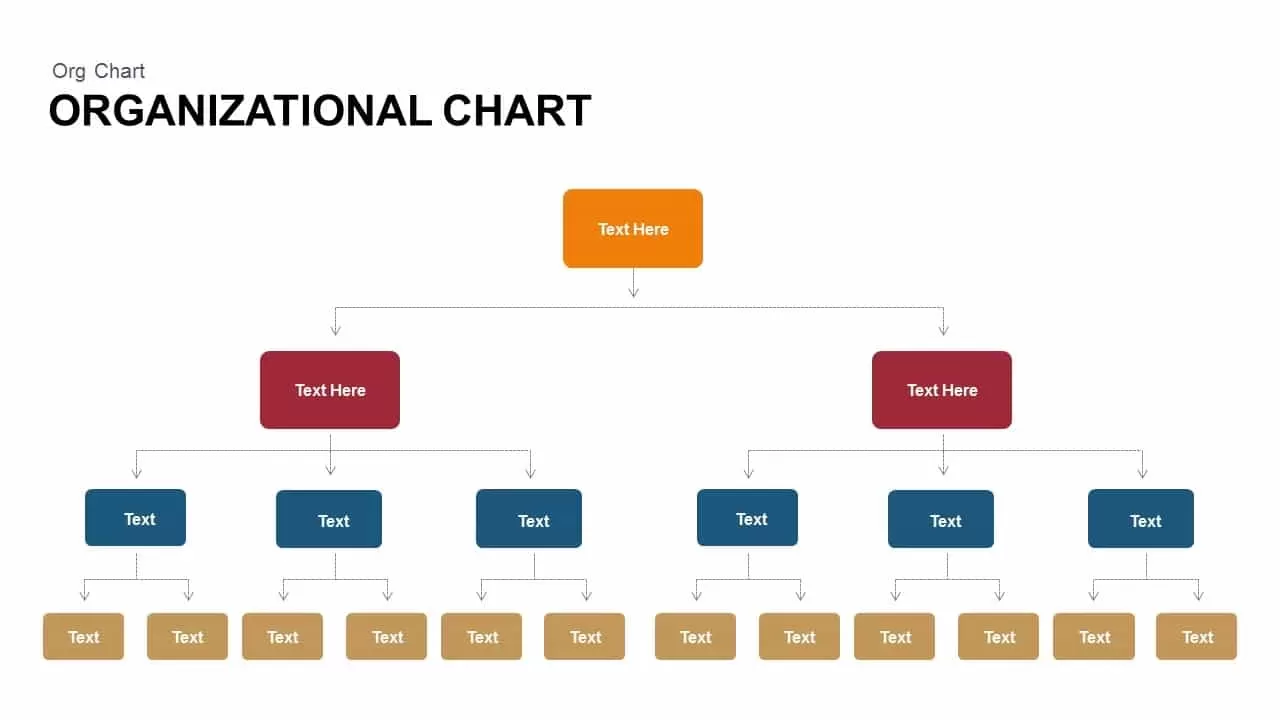
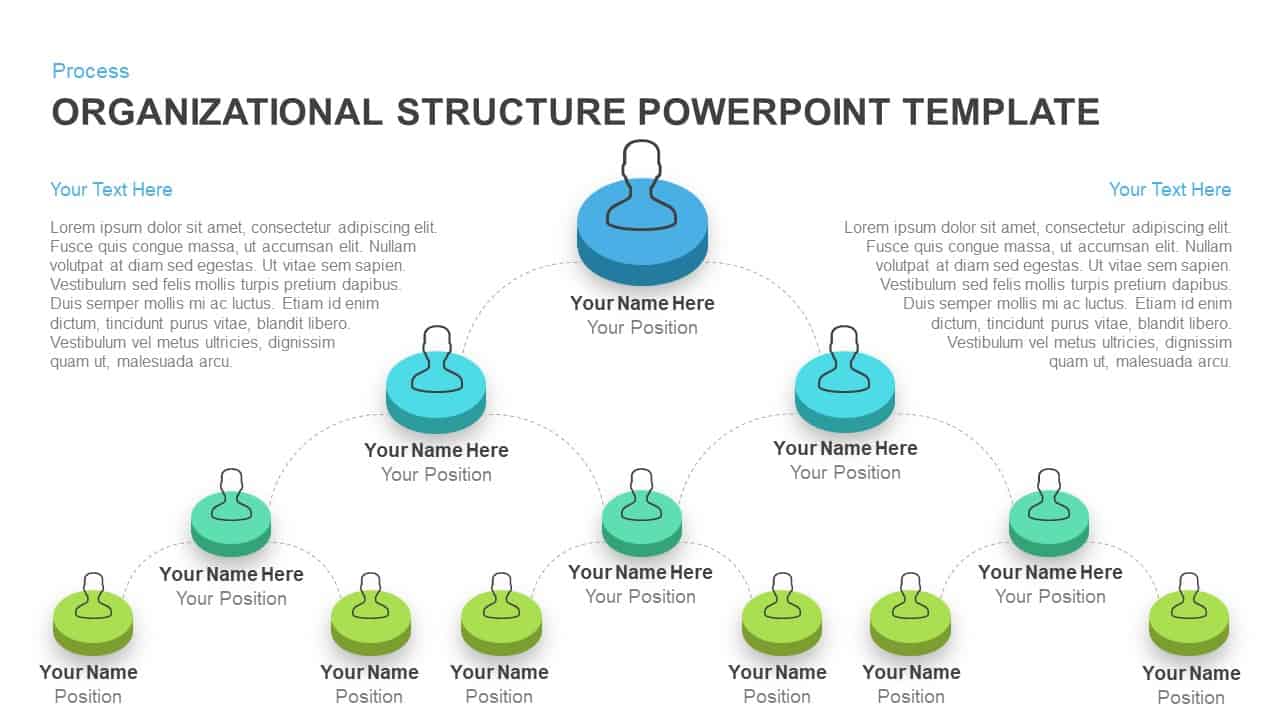
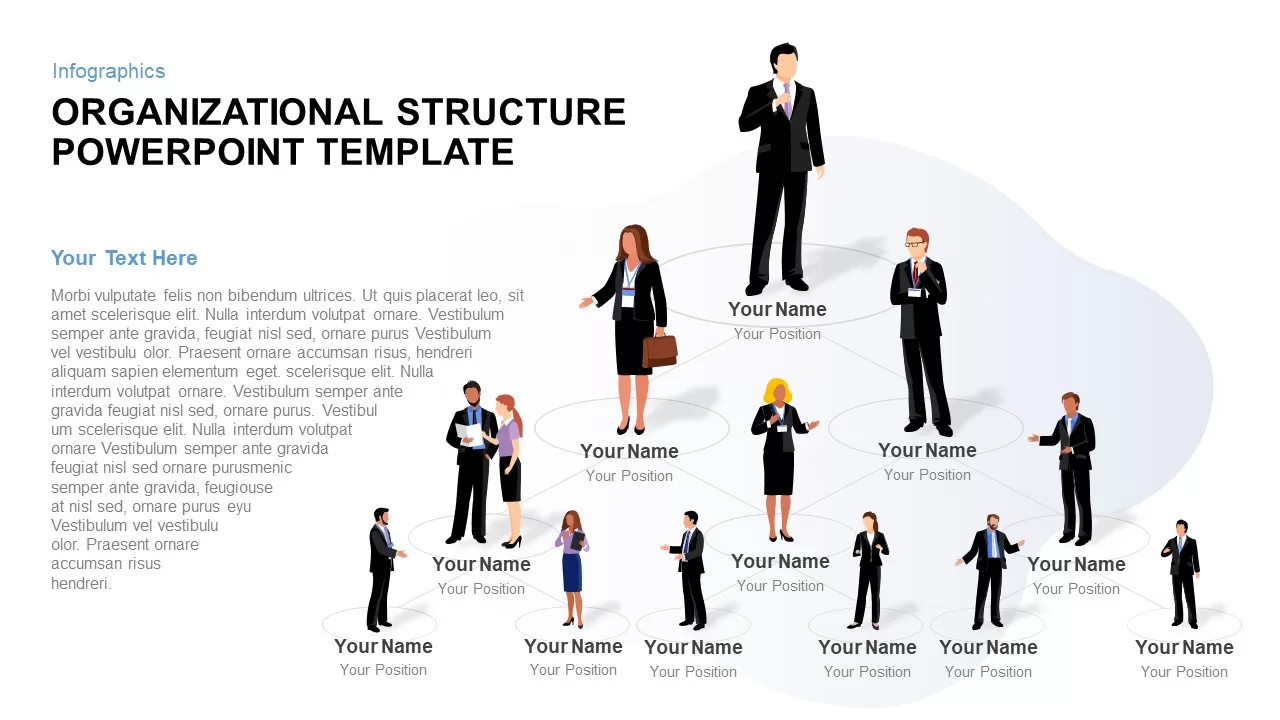
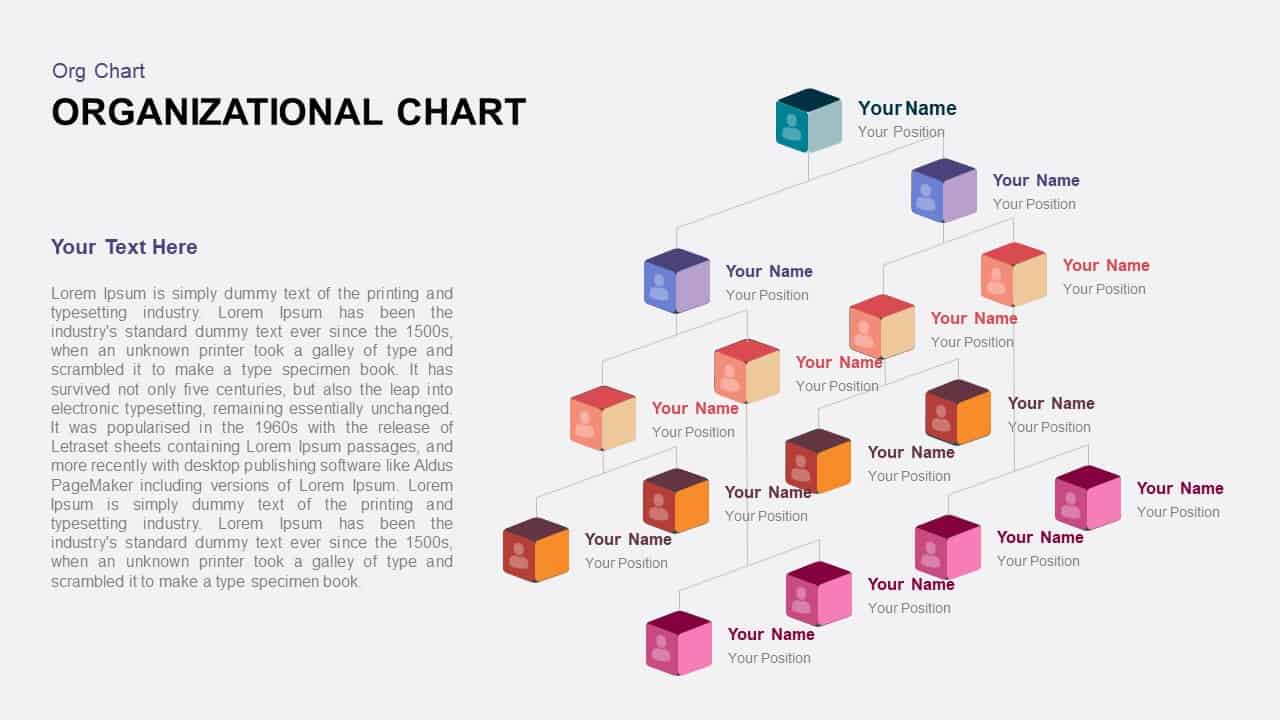
Organizational Structure Diagram Template for PowerPoint & Google Slides
Org Chart
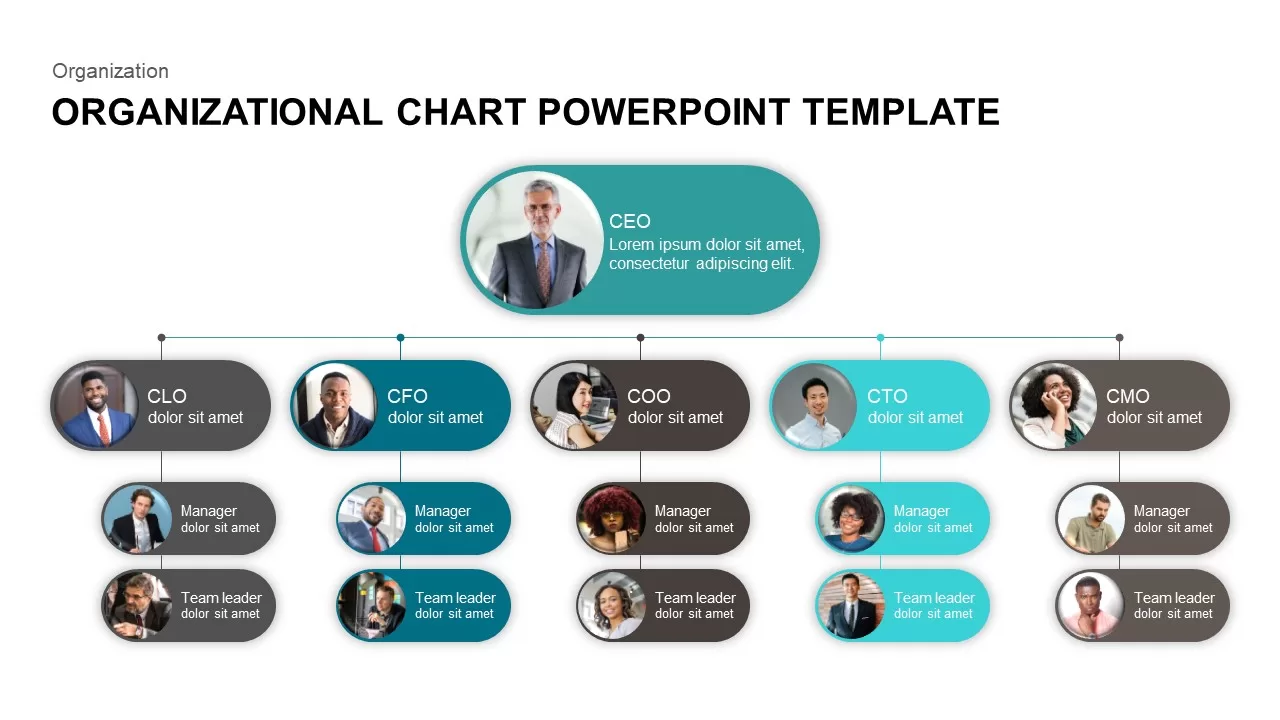
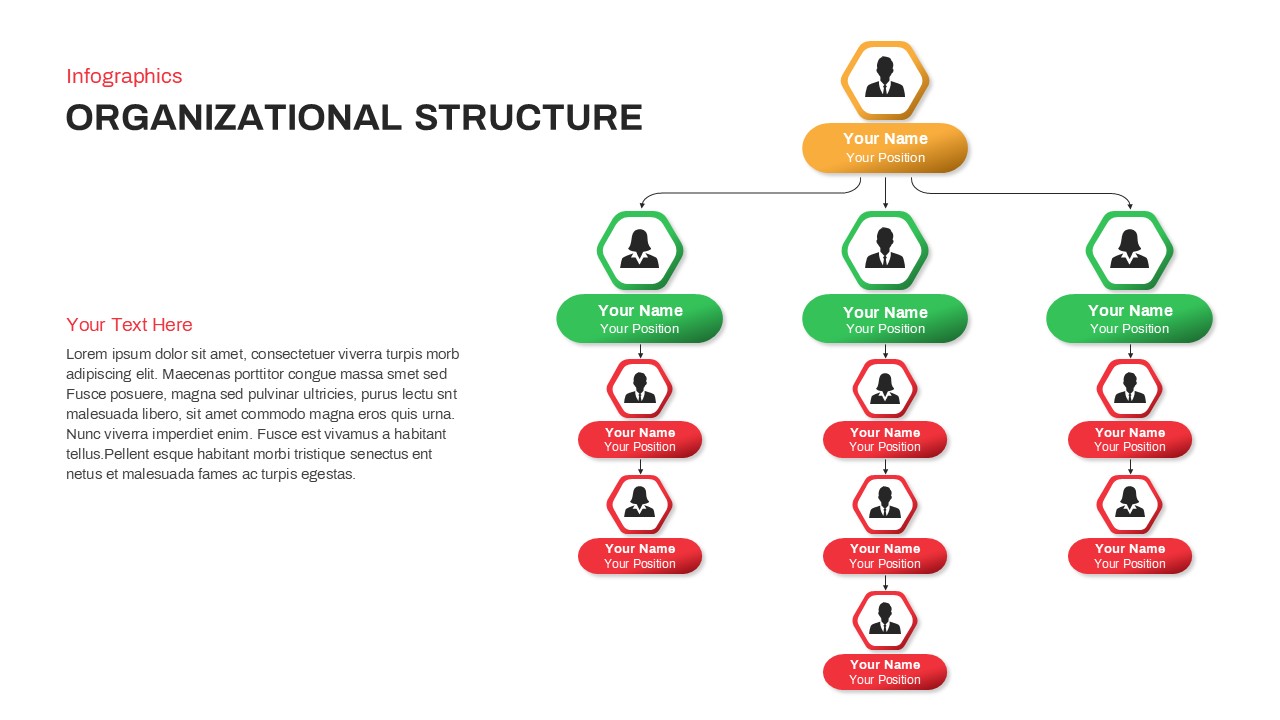
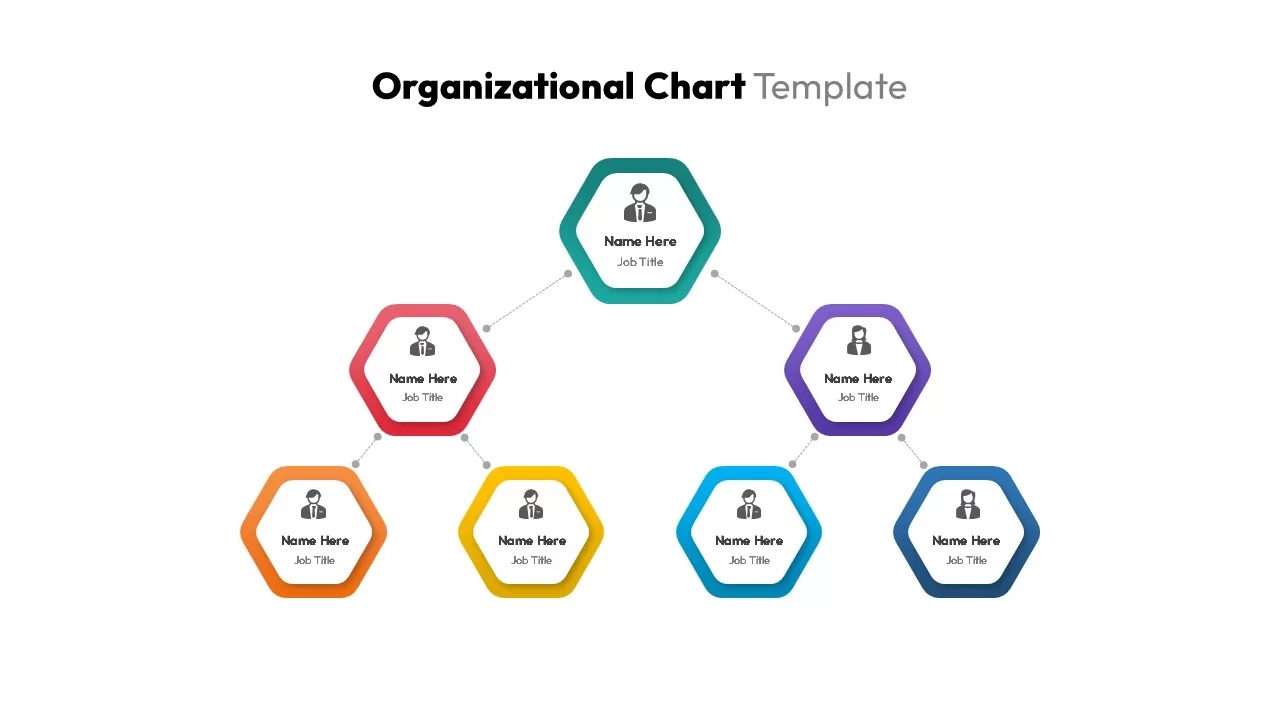
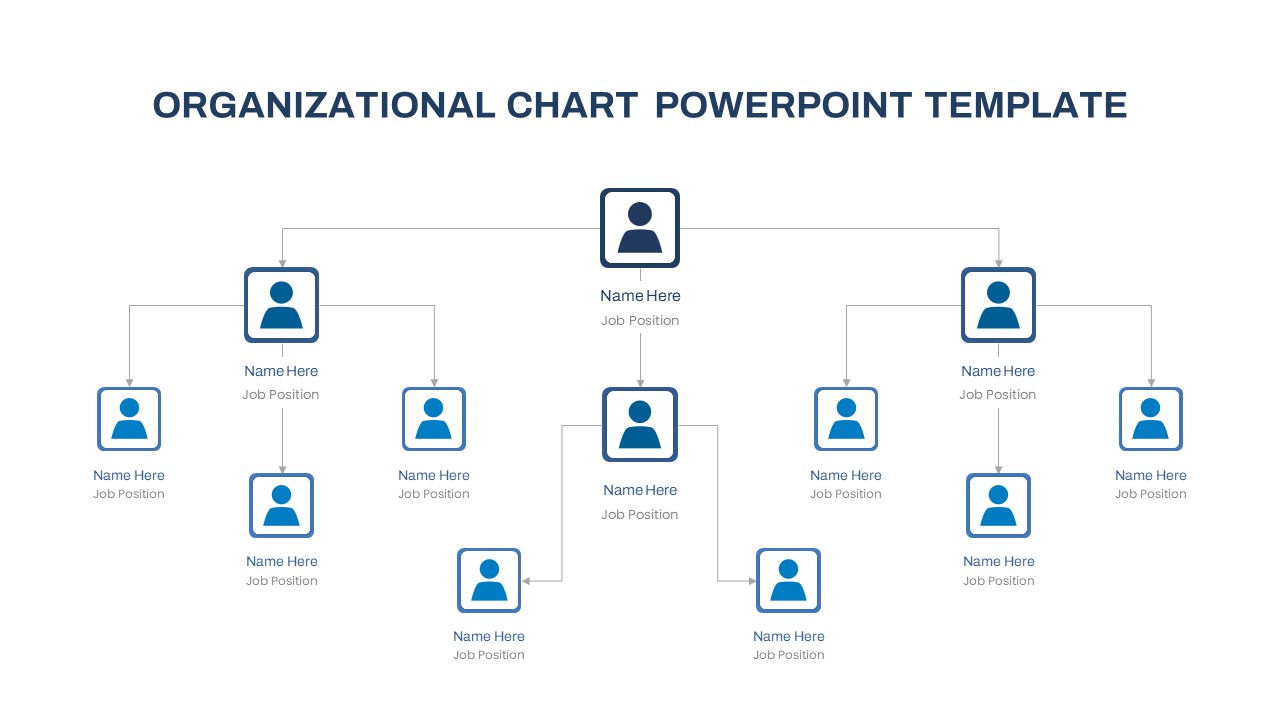
Professional Organizational Chart Diagram Template for PowerPoint & Google Slides
Org Chart
Modern Organizational Hierarchy Diagram Template for PowerPoint & Google Slides
Org Chart
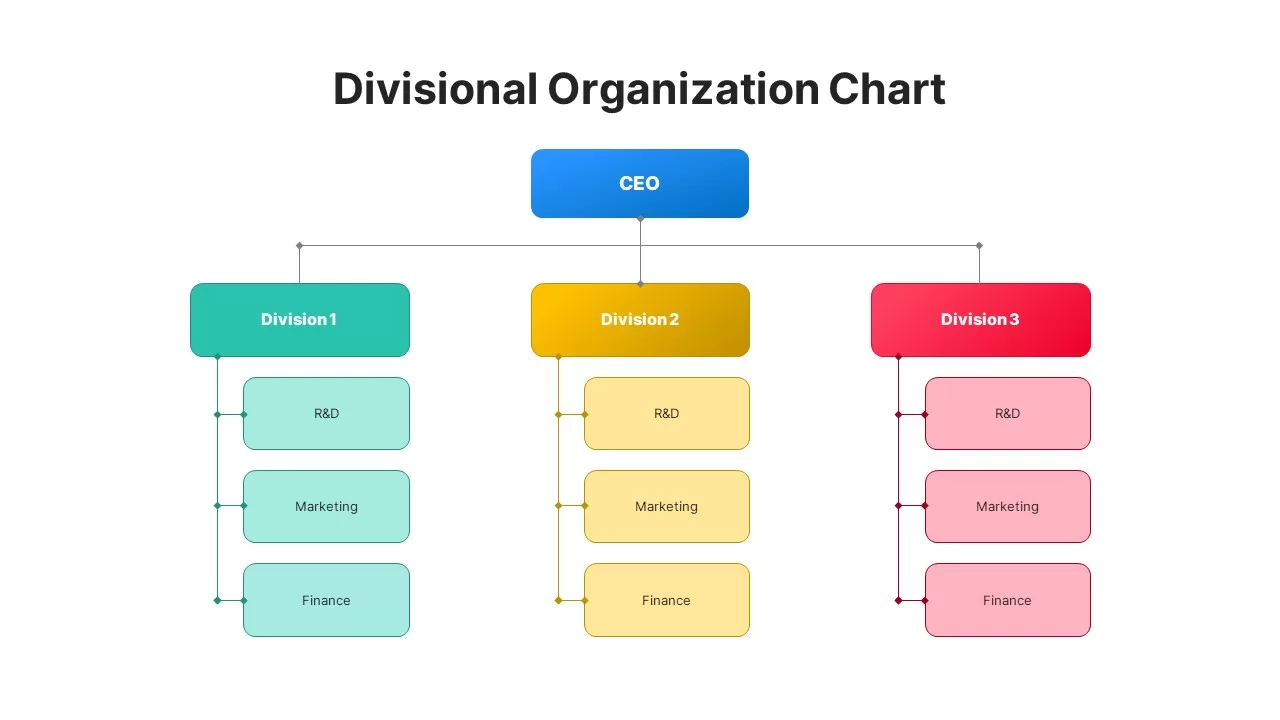
Divisional Organizational Chart Diagram Template for PowerPoint & Google Slides
Org Chart
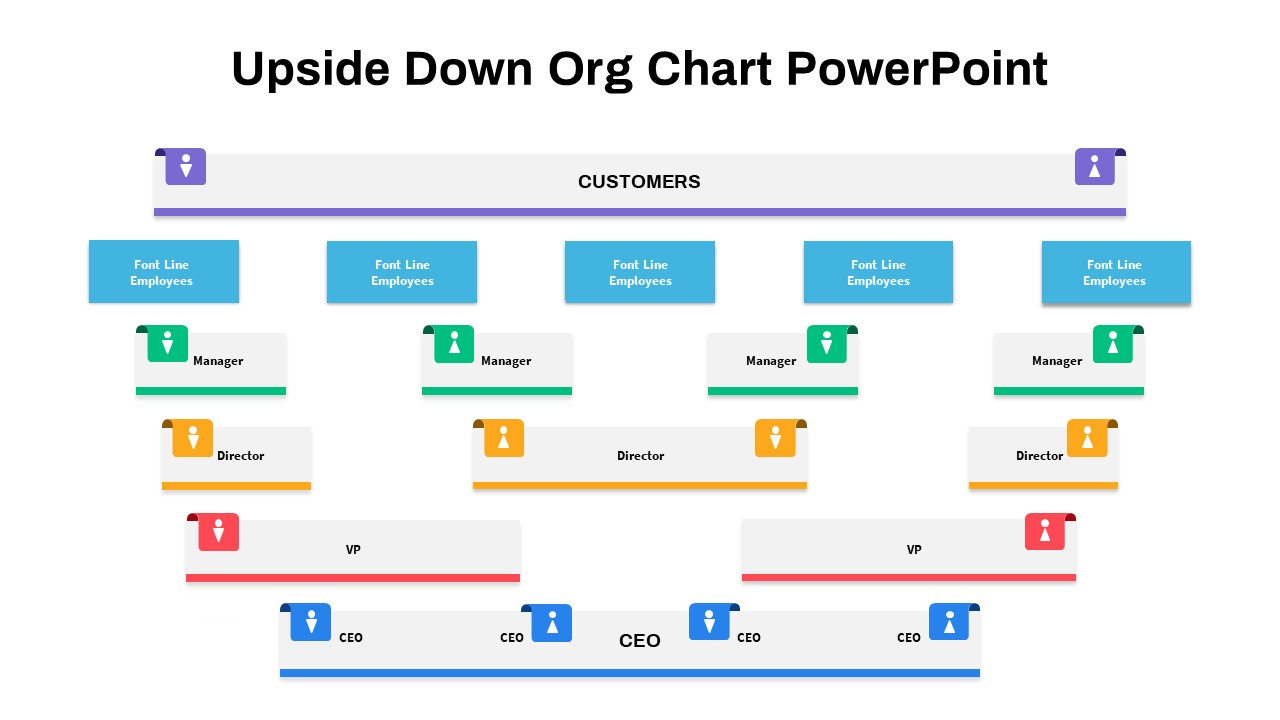
Upside-Down Organizational Chart Diagram Template for PowerPoint & Google Slides
Org Chart
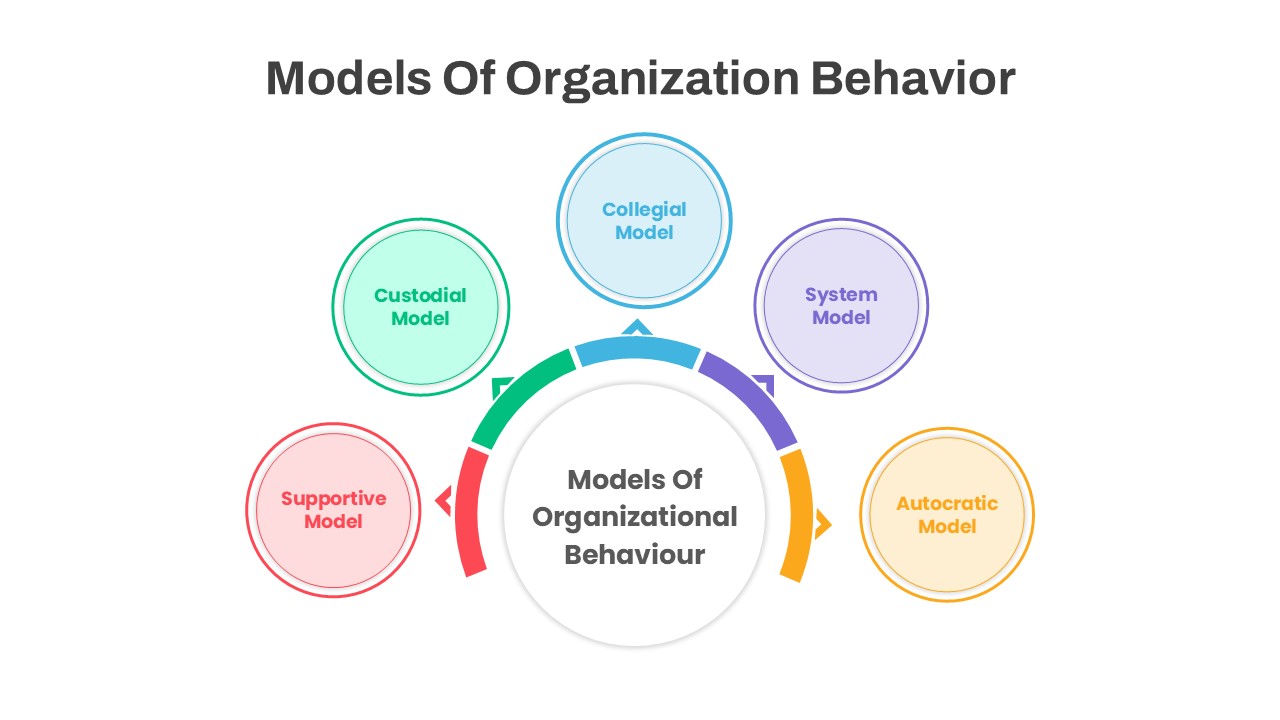
Organizational Behavior Hexagon Diagram Template for PowerPoint & Google Slides
Circular
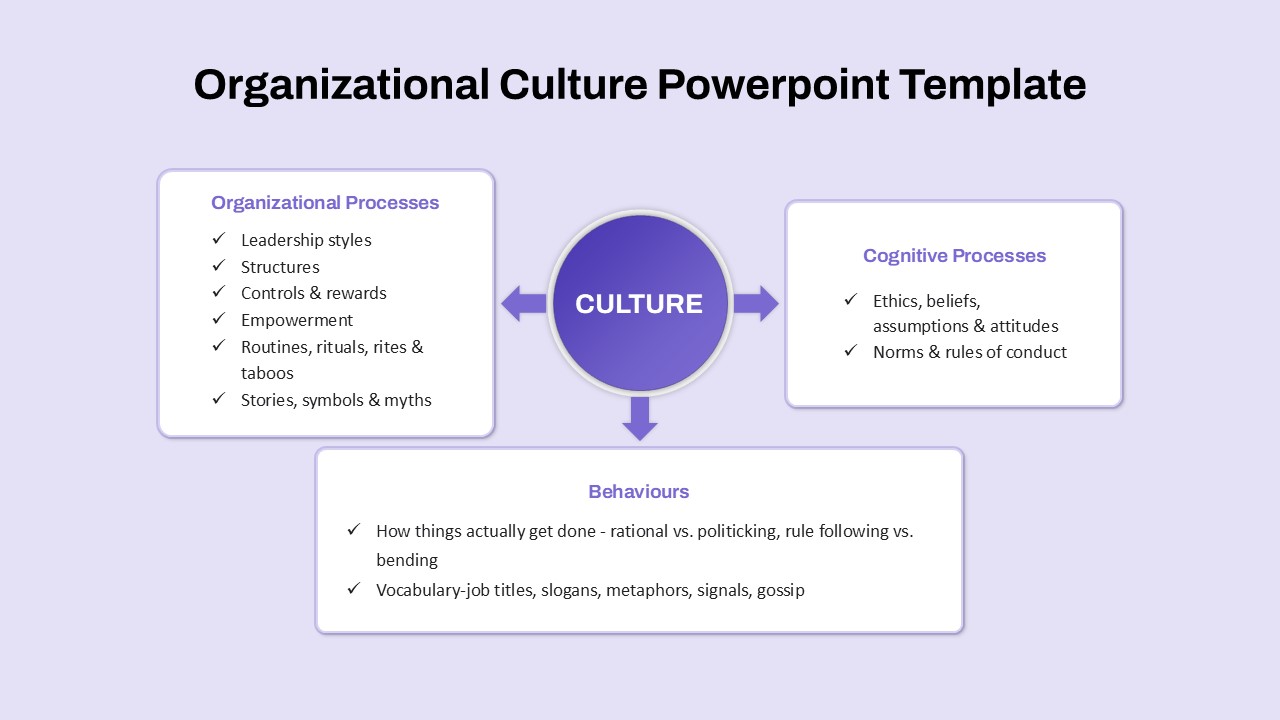
Organizational Culture Framework Diagram Template for PowerPoint & Google Slides
Arrow

Organizational Structure Diagram for PowerPoint & Google Slides
Org Chart
Simple Organizational Chart Infographic Template for PowerPoint & Google Slides
Org Chart
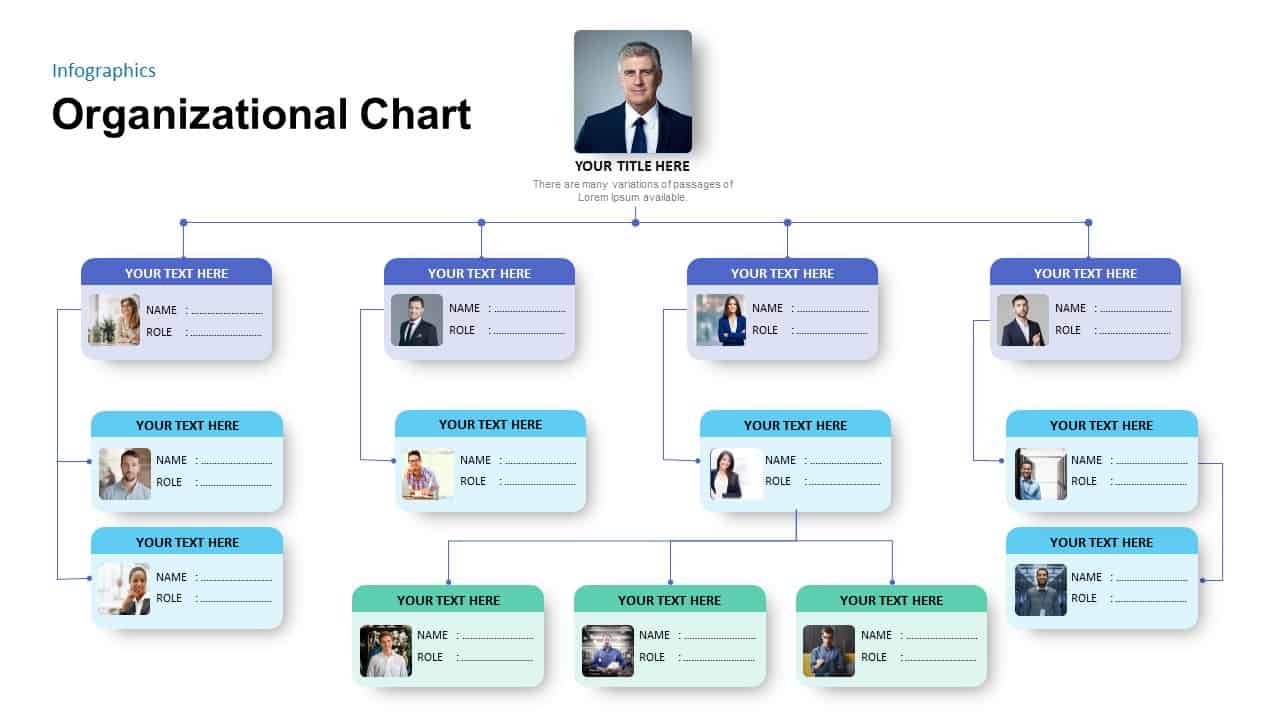
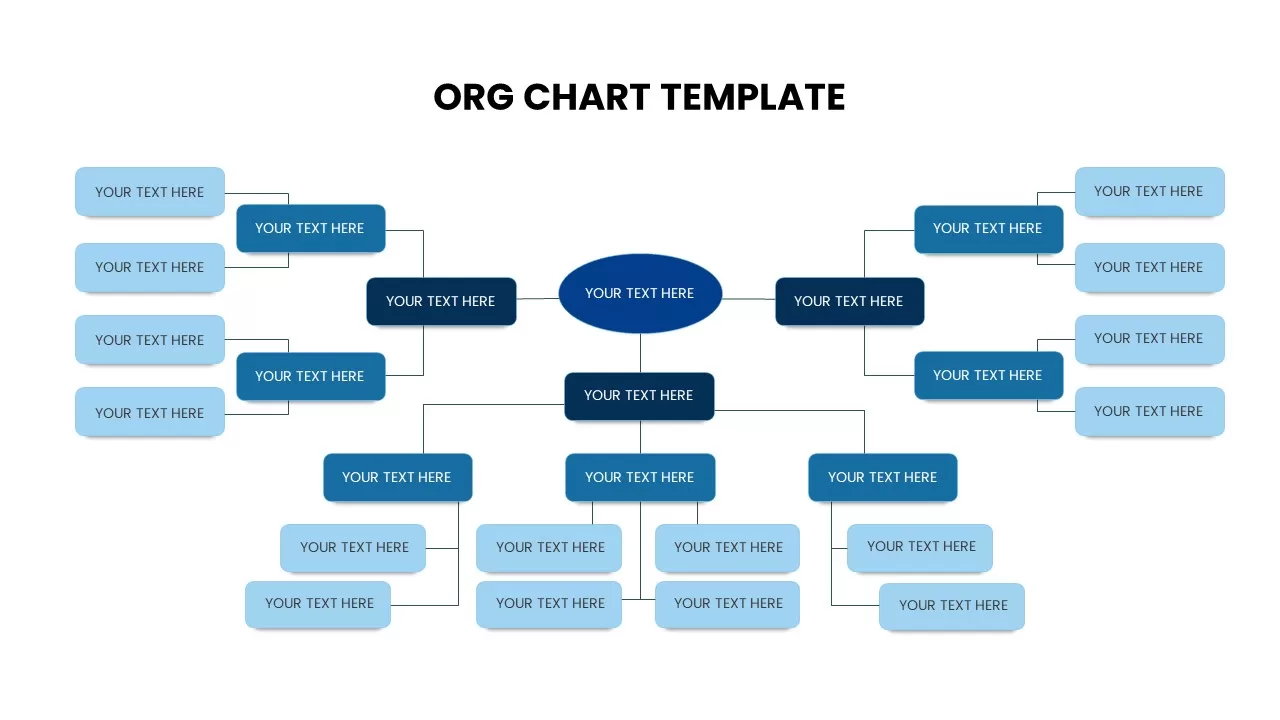
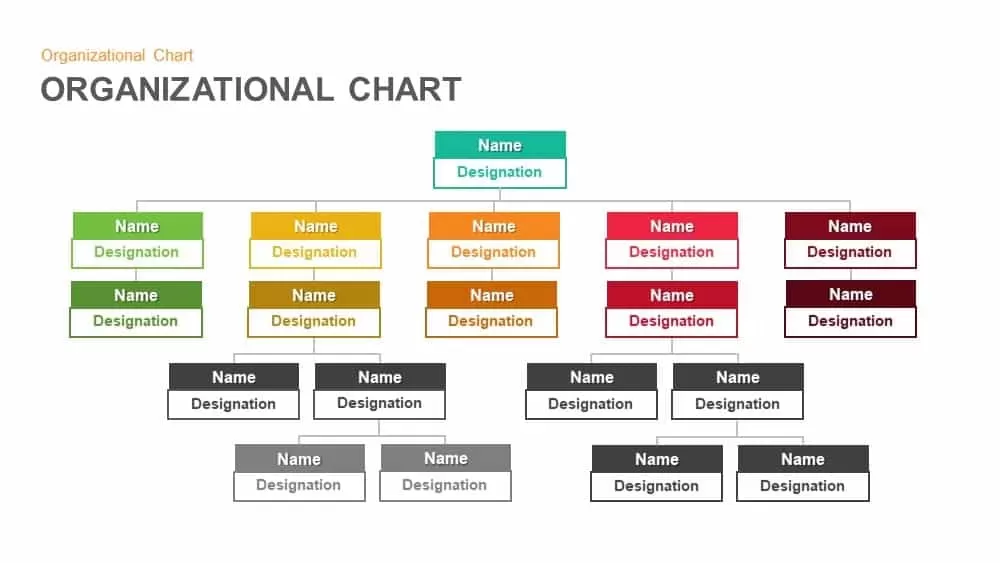
Organizational Chart Template for PowerPoint & Google Slides
Org Chart
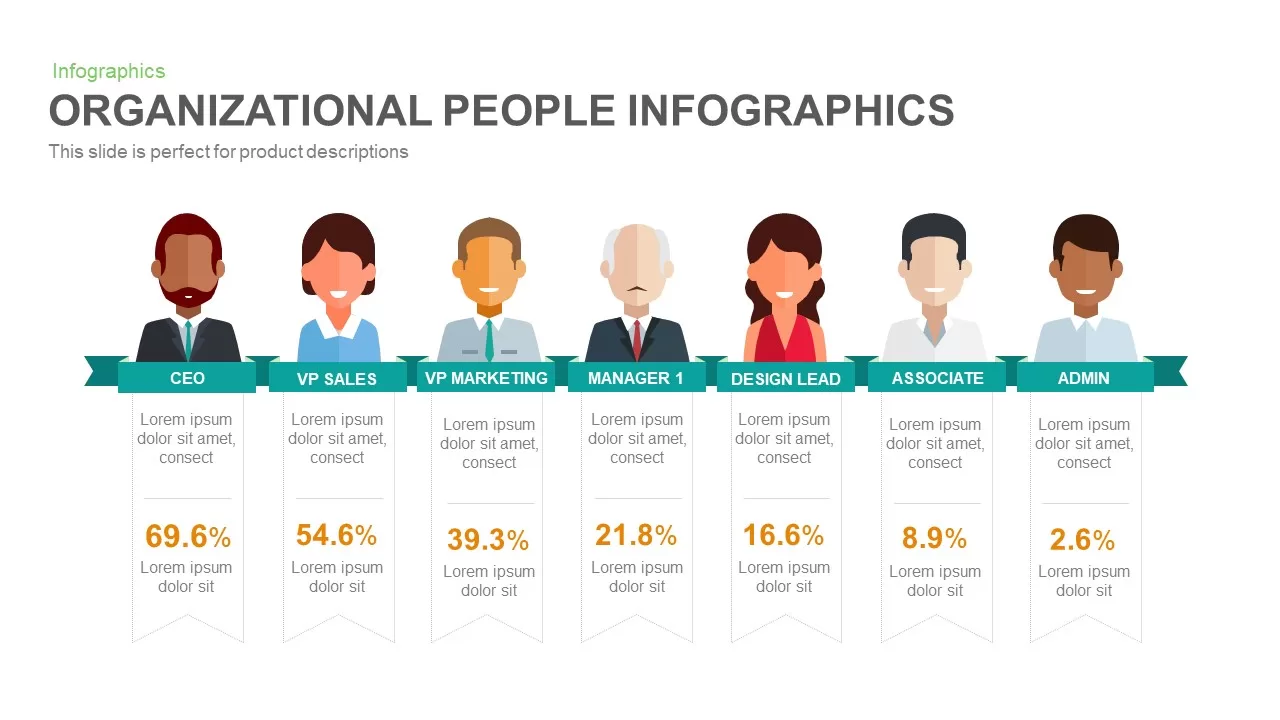
Organizational People Percentage Chart template for PowerPoint & Google Slides
Org Chart
Organizational Structure Org Chart Template for PowerPoint & Google Slides
Org Chart
Organizational Chart Structure template for PowerPoint & Google Slides
Org Chart
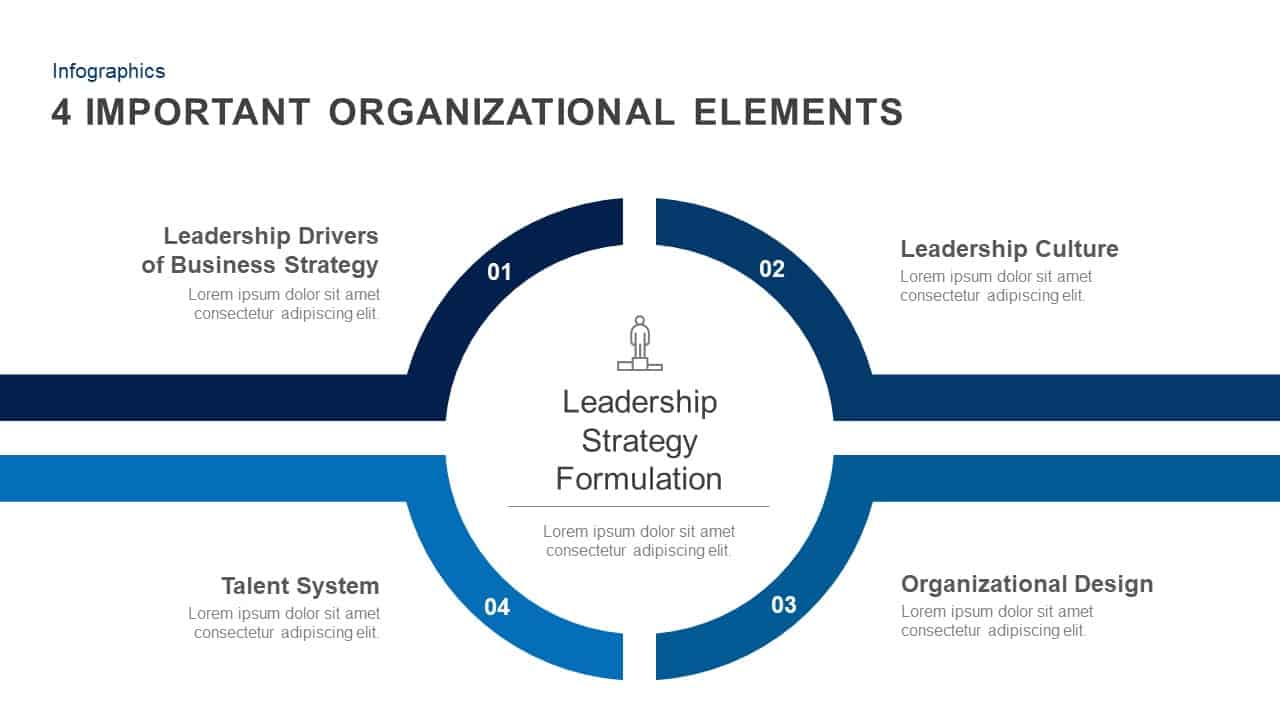
4 Important Organizational Elements template for PowerPoint & Google Slides
Infographics
Isometric Organizational Structure Chart Template for PowerPoint & Google Slides
Org Chart
Corporate Organizational Chart Hierarchy Template for PowerPoint & Google Slides
Org Chart
Hierarchical Organizational Structure Template for PowerPoint & Google Slides
Org Chart
Organizational Structure Hierarchy Chart Template for PowerPoint & Google Slides
Org Chart
Modern Organizational Chart Hierarchy Template for PowerPoint & Google Slides
Org Chart
Creative Organizational Chart Template for PowerPoint & Google Slides
Org Chart
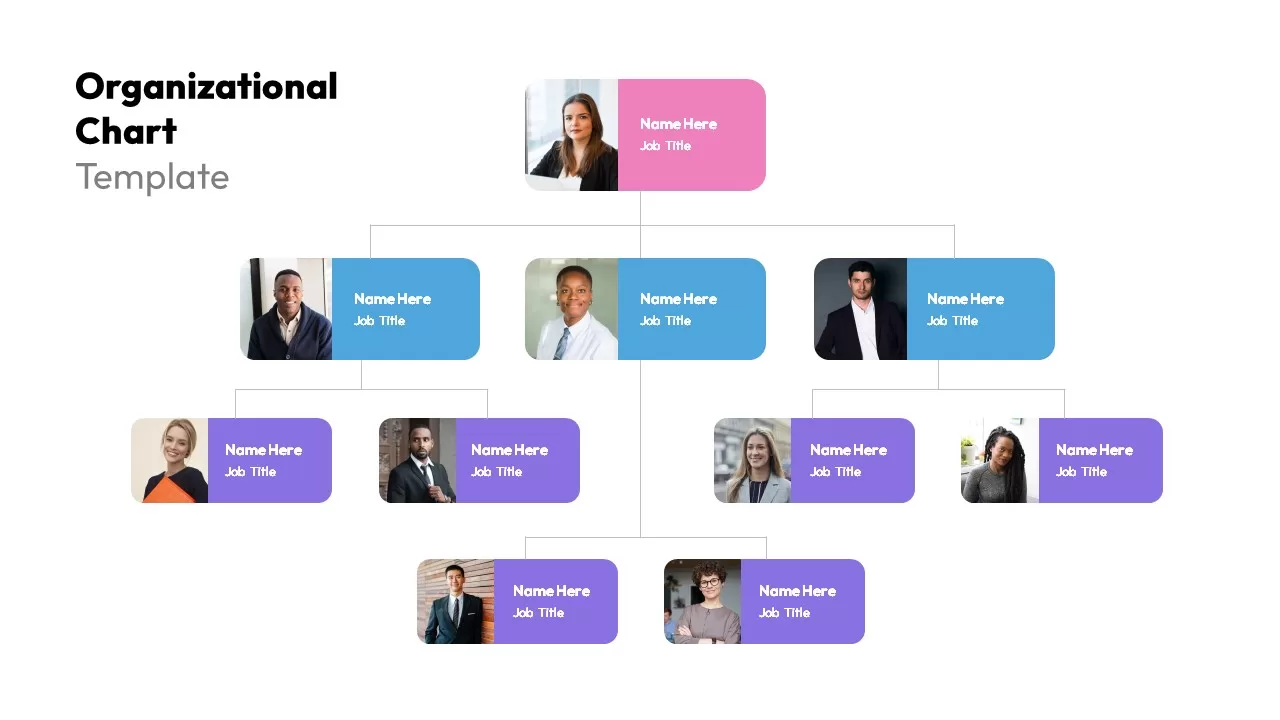
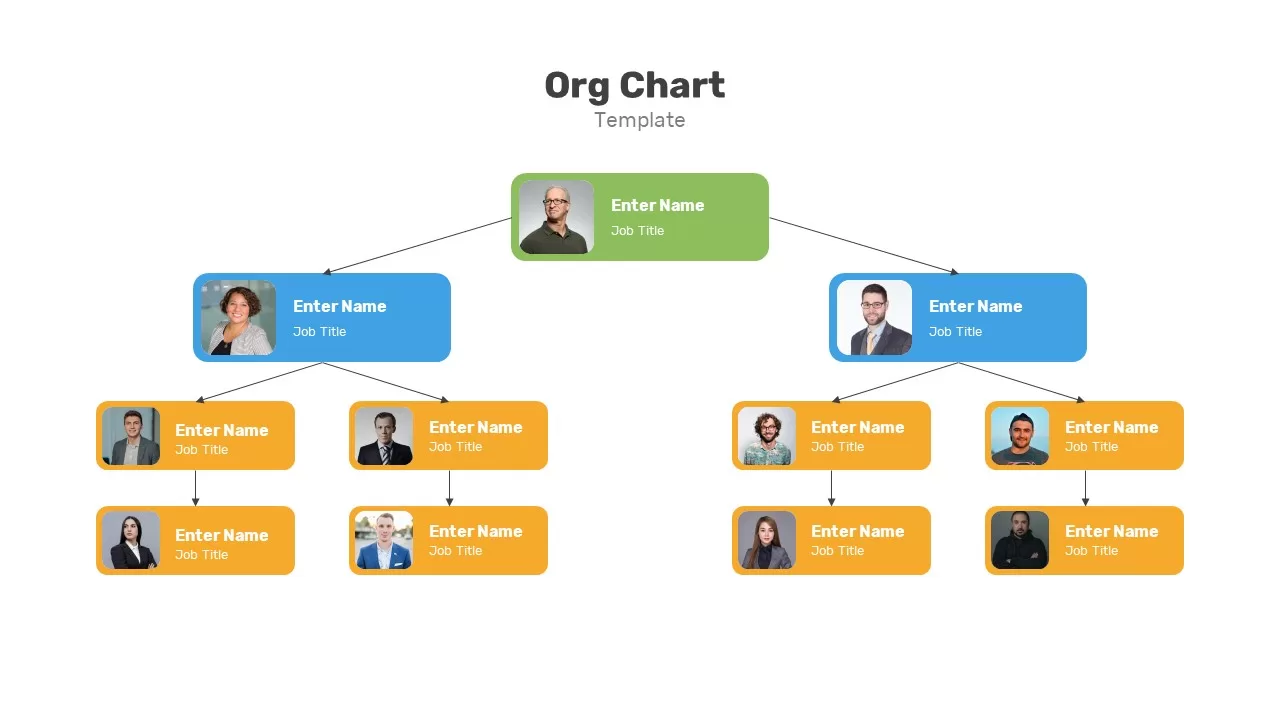
Modern Photo-Based Organizational Chart Template for PowerPoint & Google Slides
Org Chart
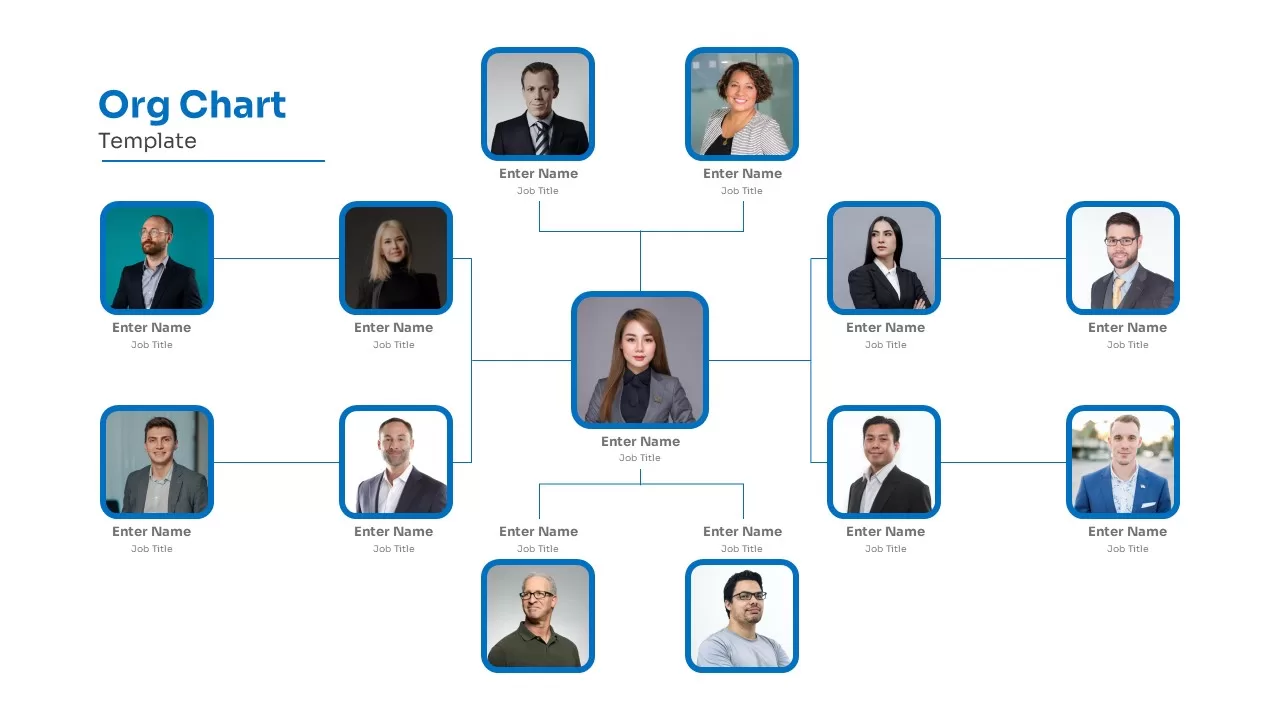
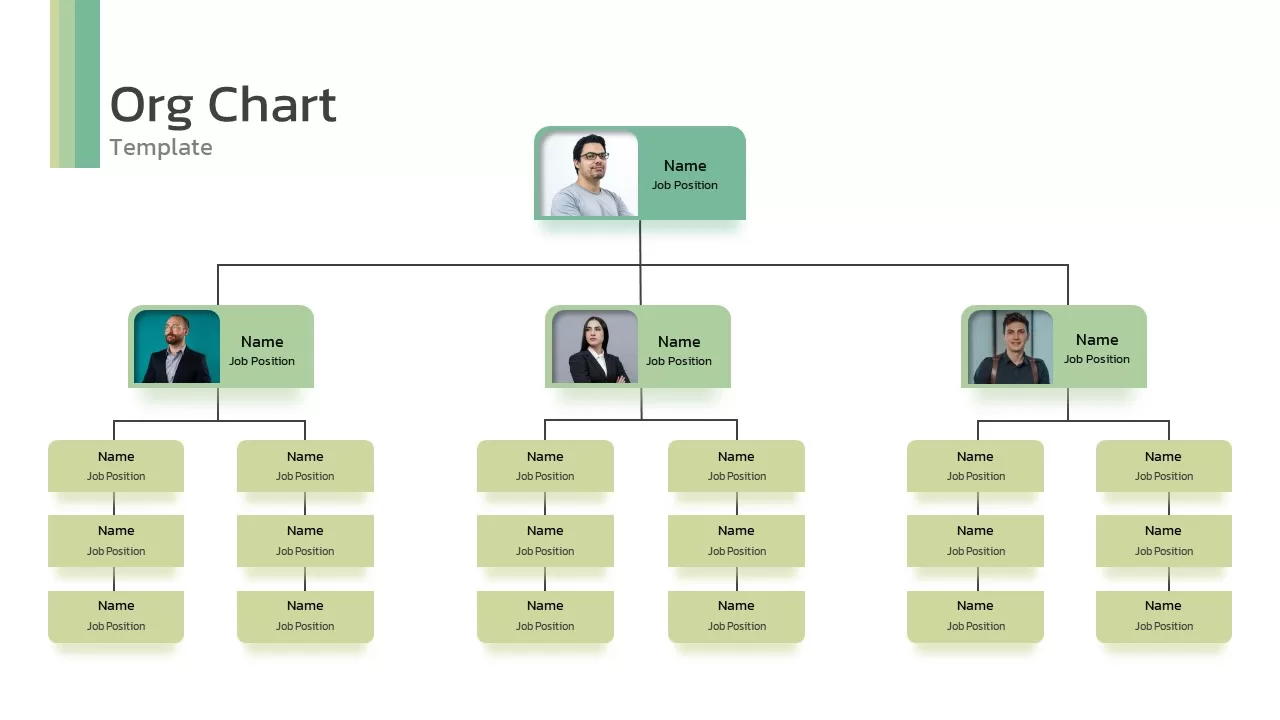
Modern Image-Based Organizational Chart Template for PowerPoint & Google Slides
Infographics
Organizational Chart Overview template for PowerPoint & Google Slides
Org Chart
Organizational Chart Structure template for PowerPoint & Google Slides
Business Plan
Organizational Chart Template for PowerPoint & Google Slides
Our Team
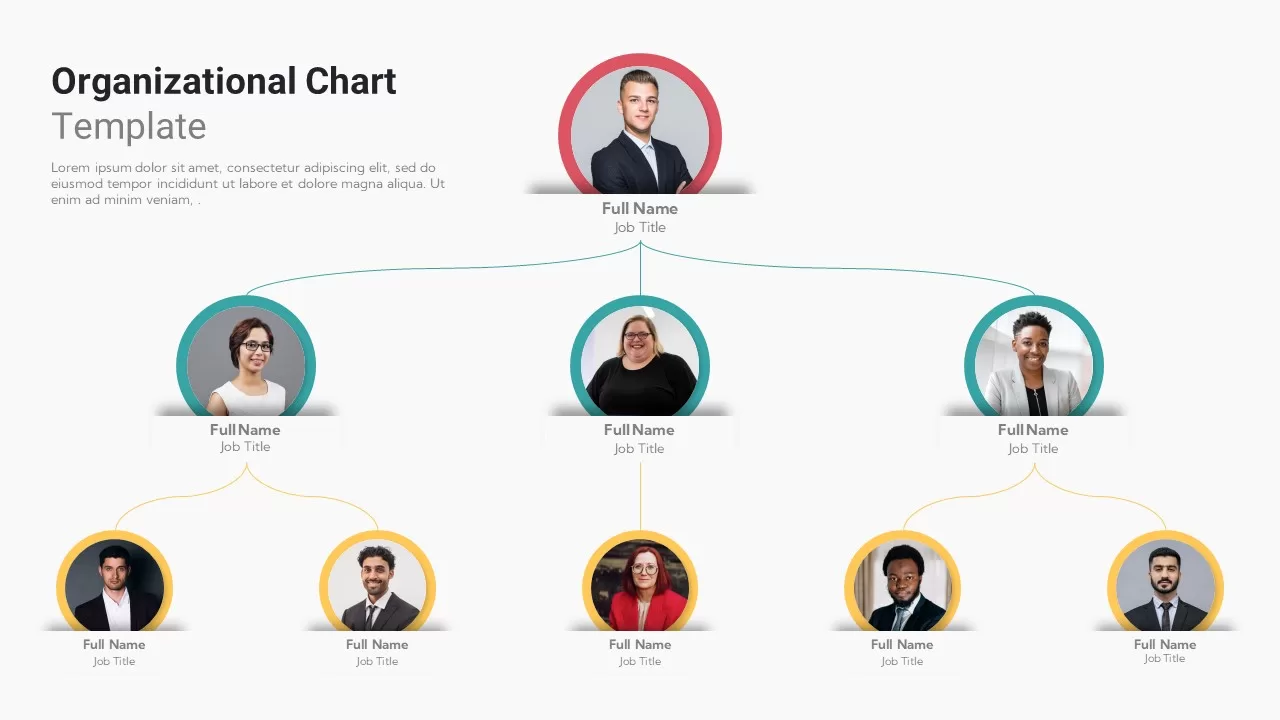
Organizational Chart template for PowerPoint & Google Slides
Org Chart
Organizational Chart template for PowerPoint & Google Slides
Org Chart
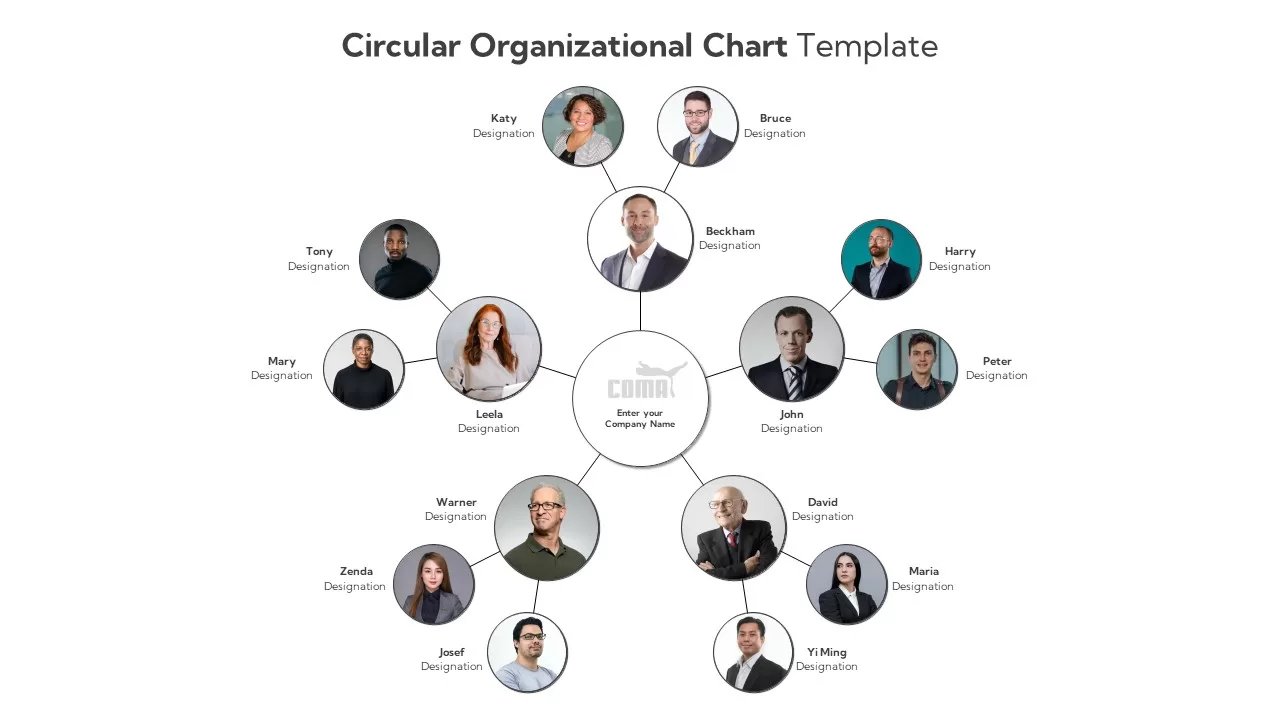
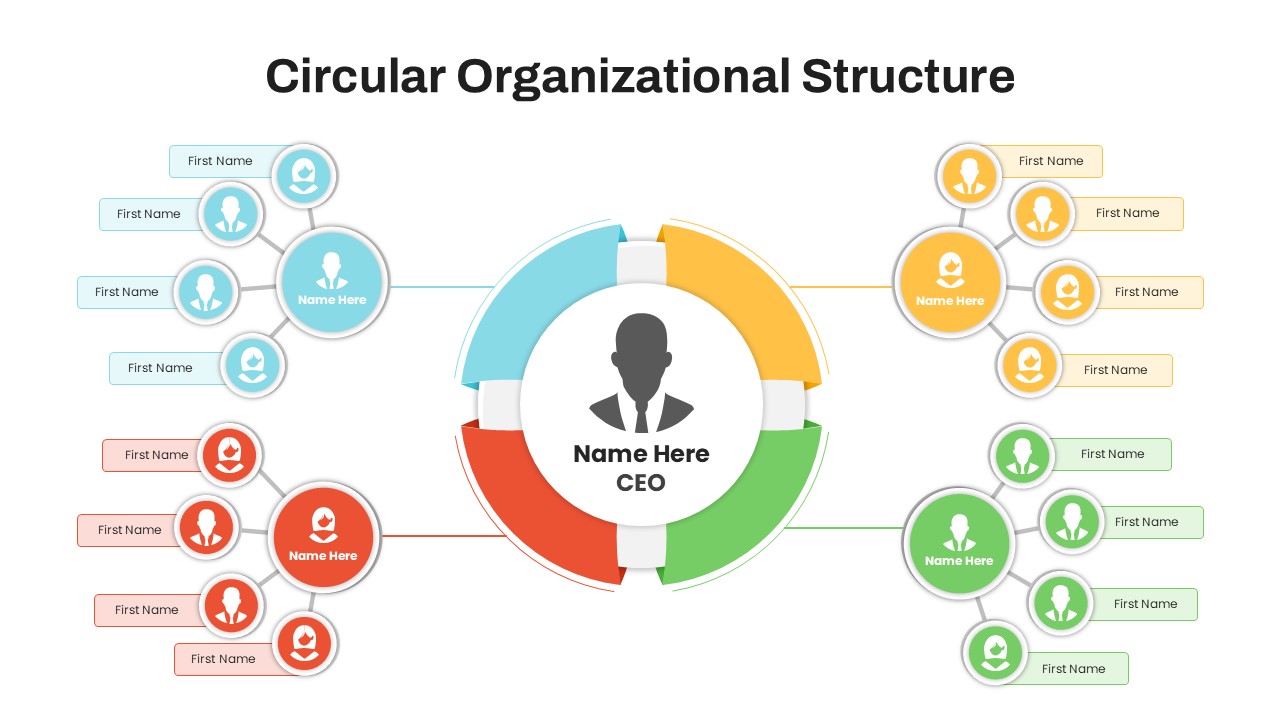
Circular Organizational Structure Layout Template for PowerPoint & Google Slides
Org Chart
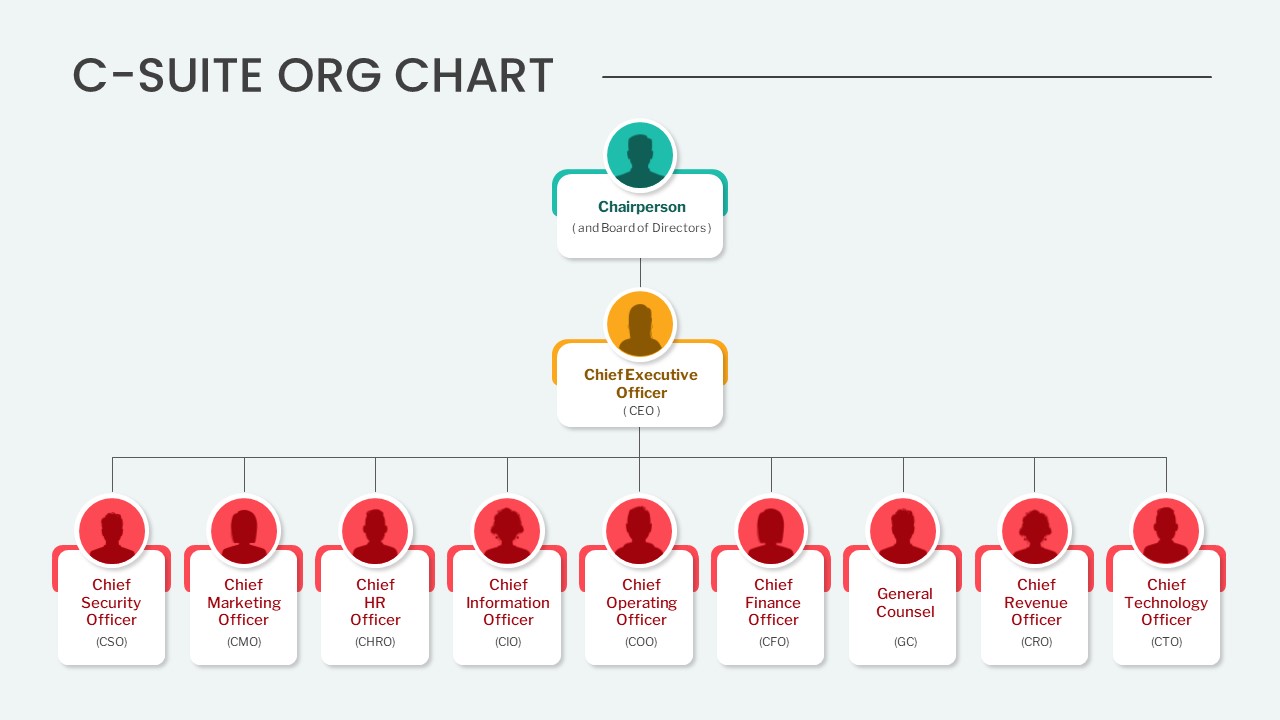
Editable C-Suite Organizational Chart Template for PowerPoint & Google Slides
Org Chart
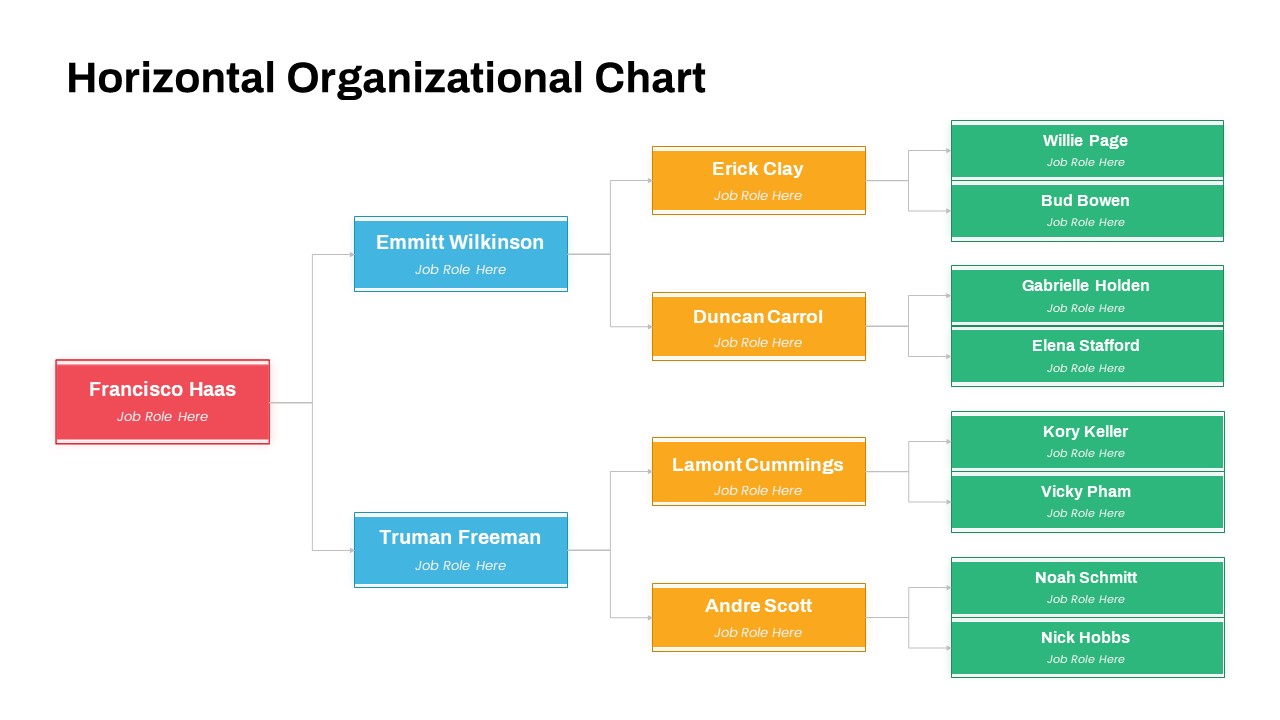
Horizontal Organizational Chart Template for PowerPoint & Google Slides
Org Chart
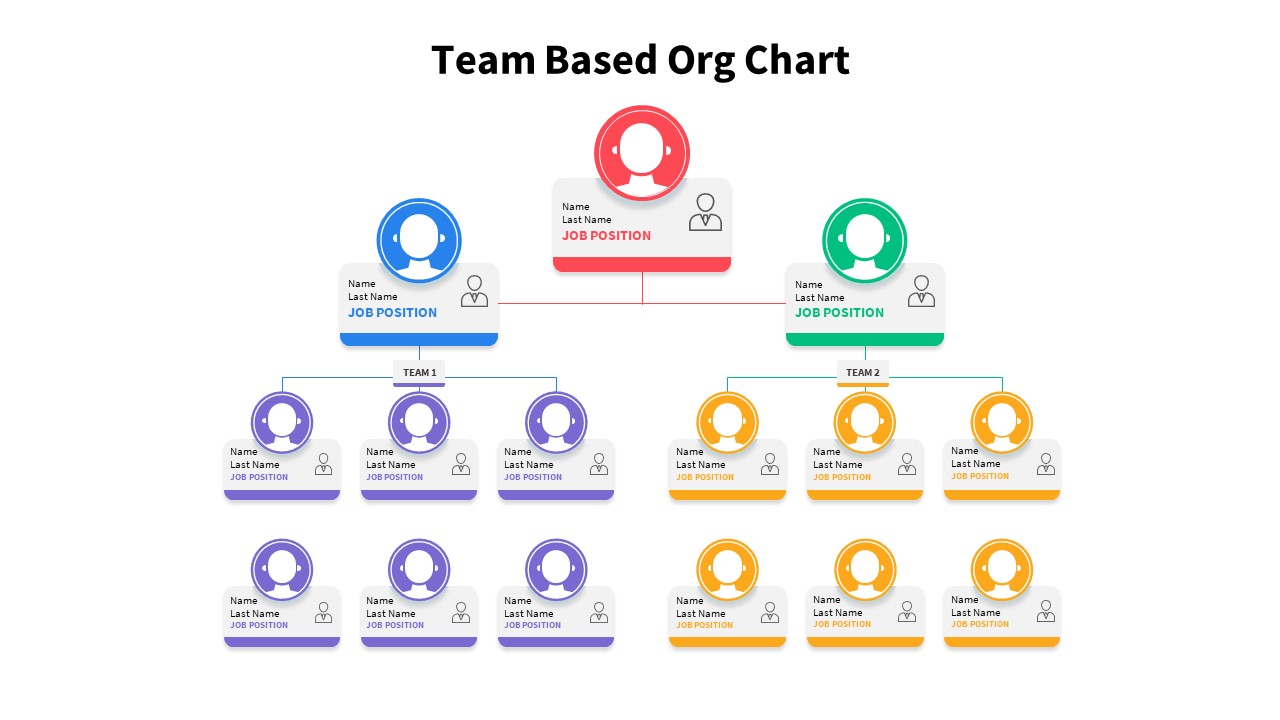
Team-Based Organizational Chart Template for PowerPoint & Google Slides
Org Chart
Free Corporate Hierarchy Organizational Chart Template for PowerPoint & Google Slides
Org Chart
Free
Circular Organizational Structure Template for PowerPoint & Google Slides
Org Chart
Horizontal Organizational Chart Template for PowerPoint & Google Slides
Org Chart
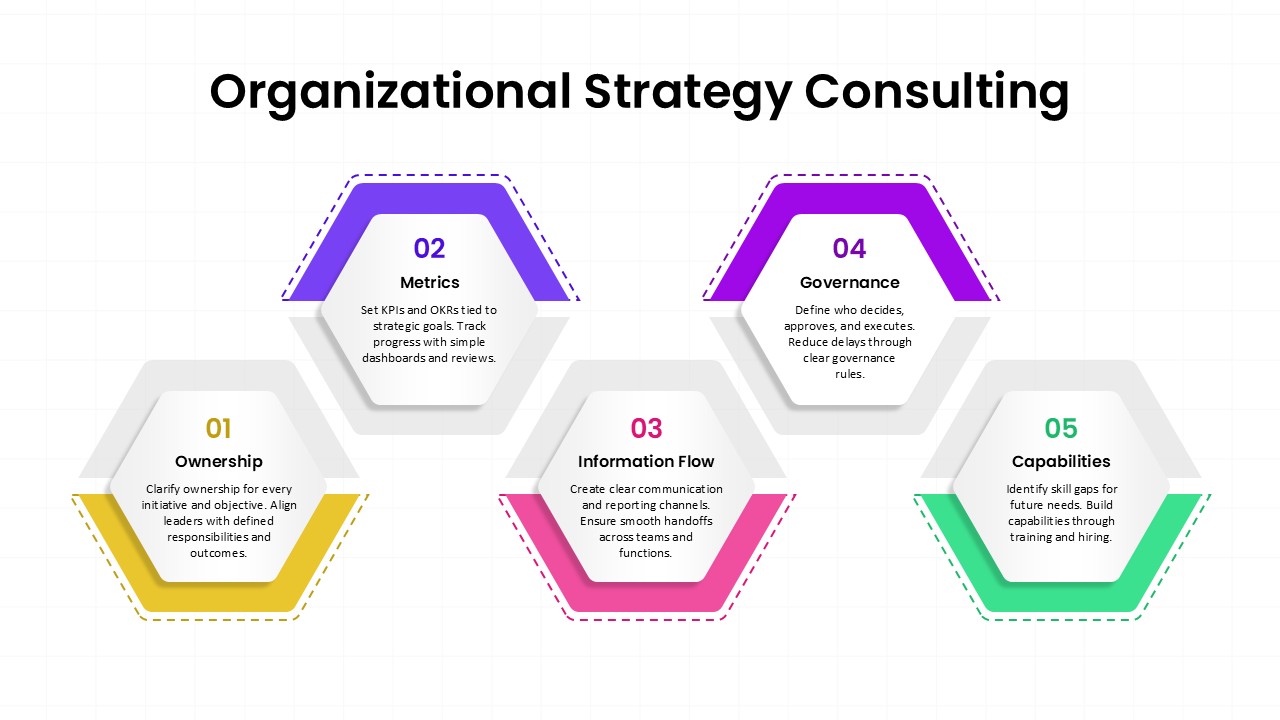
Organizational Strategy Consulting Framework Template for PowerPoint & Google Slides
Consulting

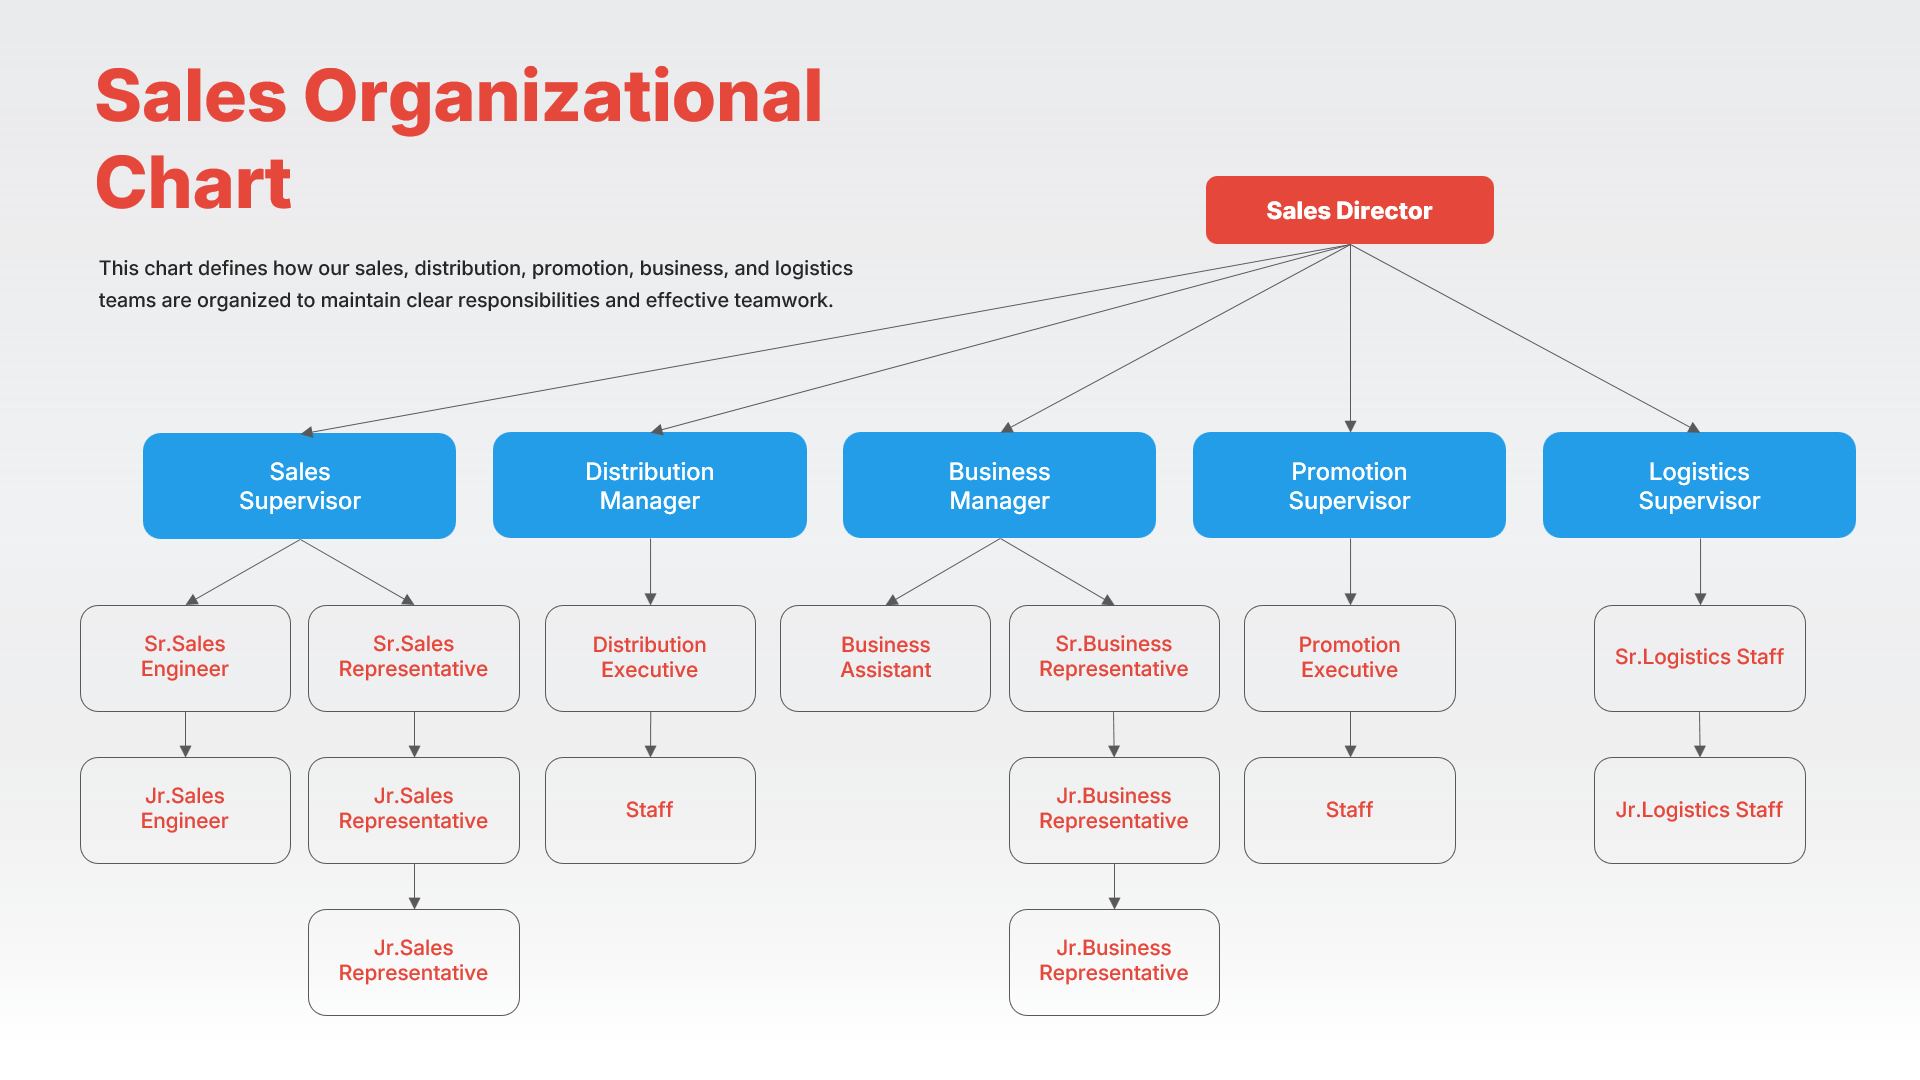
Sales Organizational Chart Hierarchy Template for PowerPoint & Google Slides
Org Chart
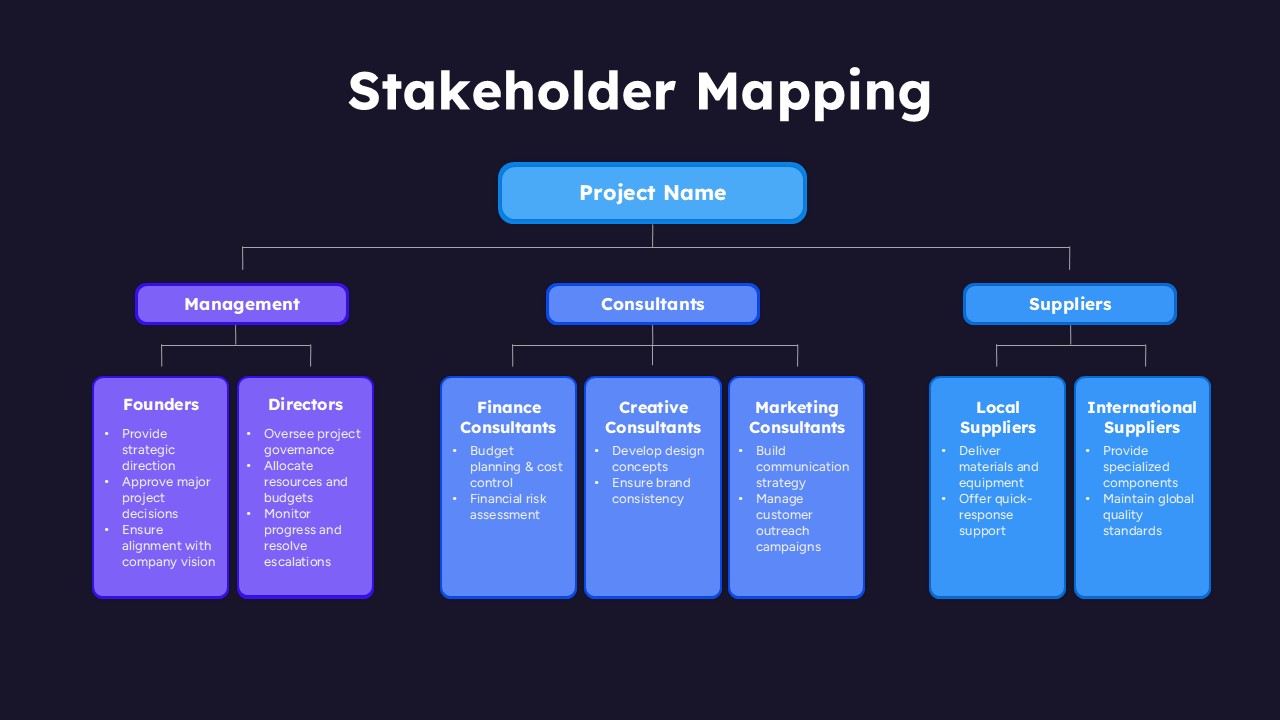
Stakeholder Mapping Organizational Chart Template for PowerPoint & Google Slides
Org Chart

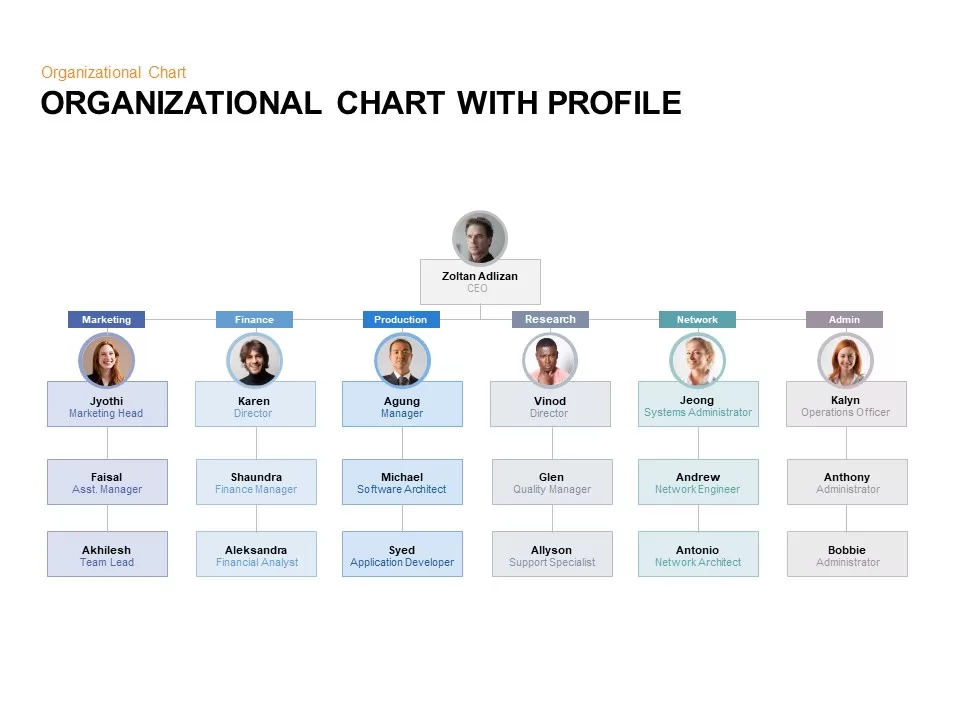
Organizational Chart with Profile for PowerPoint & Google Slides
Org Chart
3D Color Block Organizational Chart Slide for PowerPoint & Google Slides
Org Chart
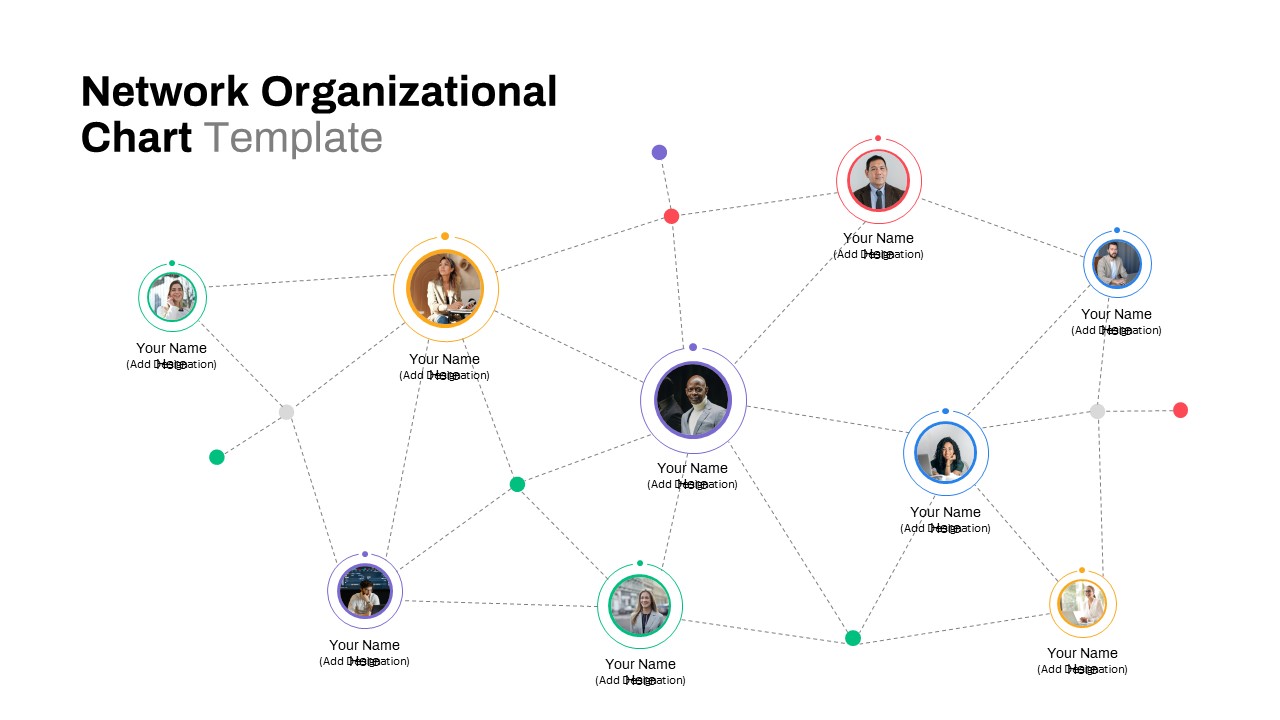
Network Organizational Chart for PowerPoint & Google Slides
Business
Free Organizational Chart for PowerPoint & Google Slides
Business
Free

Organizational Chart Hierarchy Templates for PowerPoint and Keynote
Org Chart
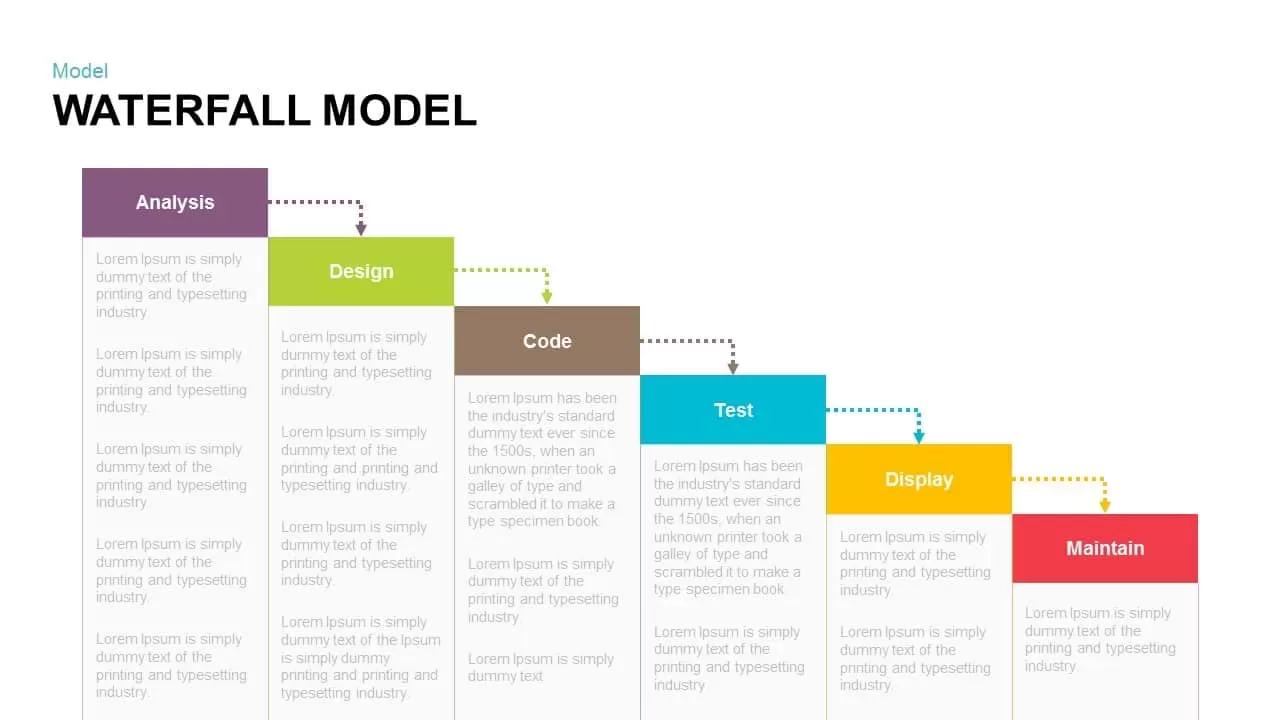
Waterfall Model Diagram Template for PowerPoint & Google Slides
Information Technology
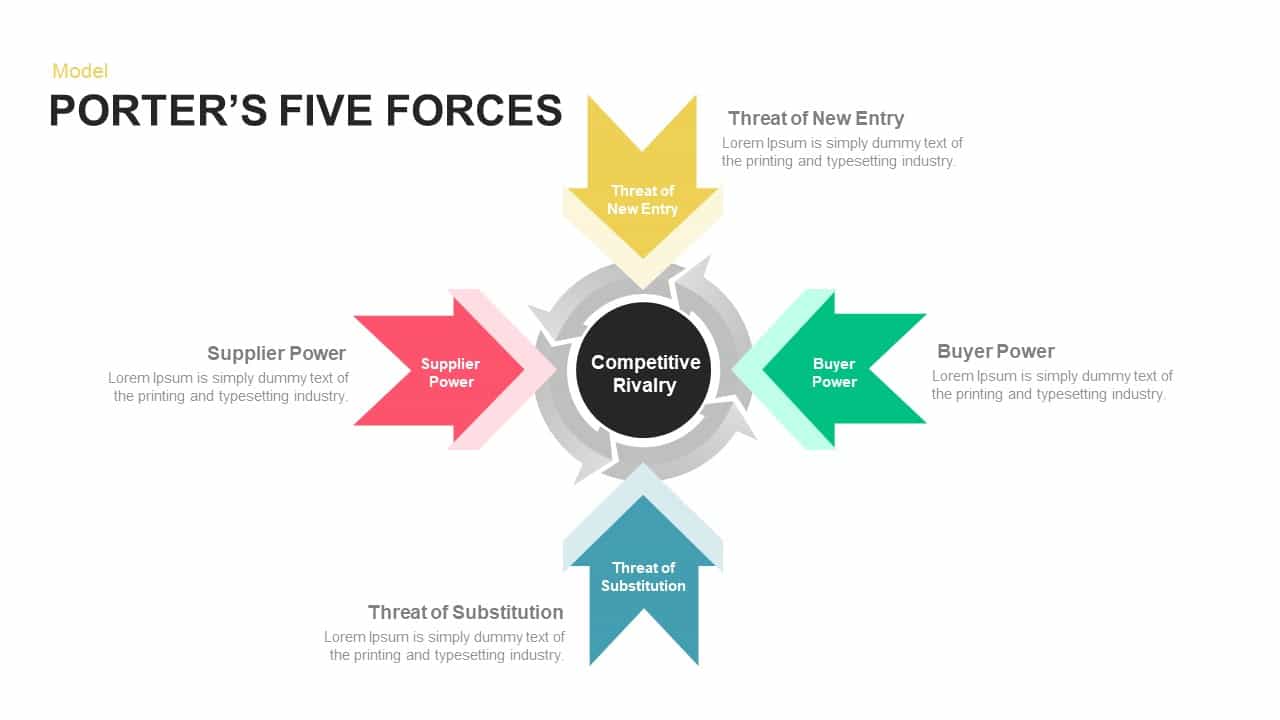
Porter’s Five Forces Model Diagram Template for PowerPoint & Google Slides
Competitor Analysis
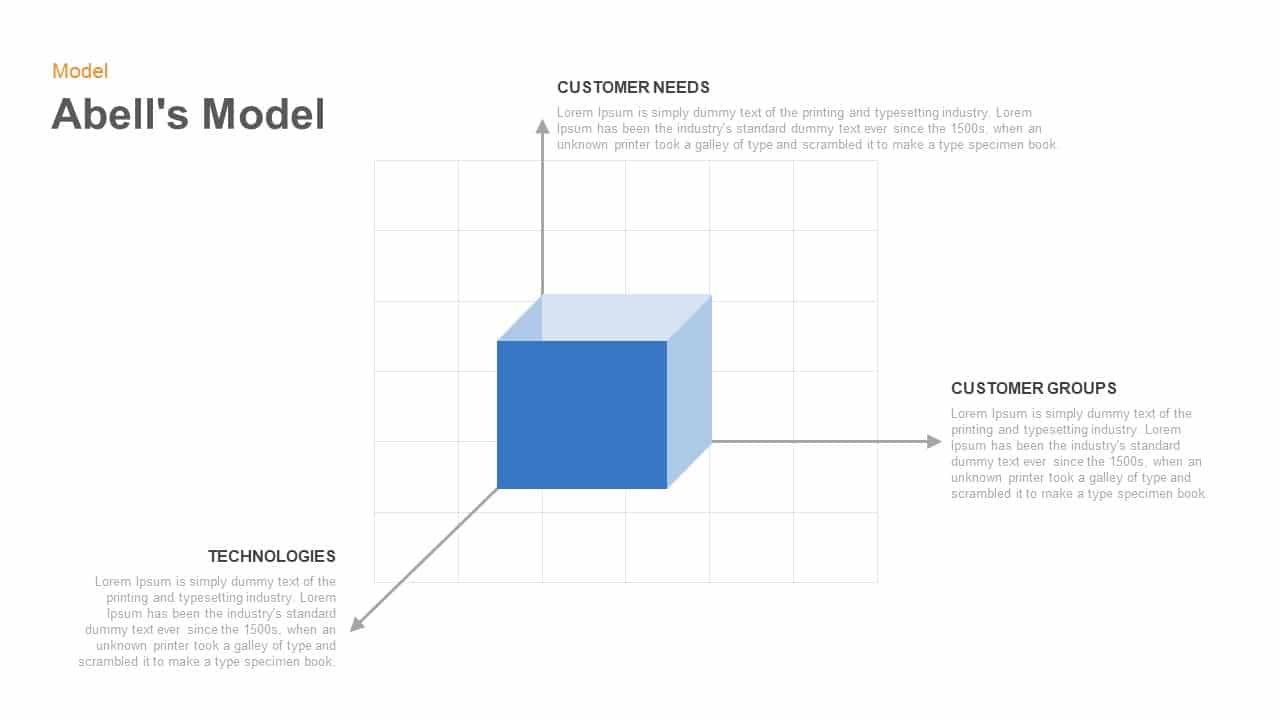
Abell’s 3D Cube Model Diagram Template for PowerPoint & Google Slides
Business Models

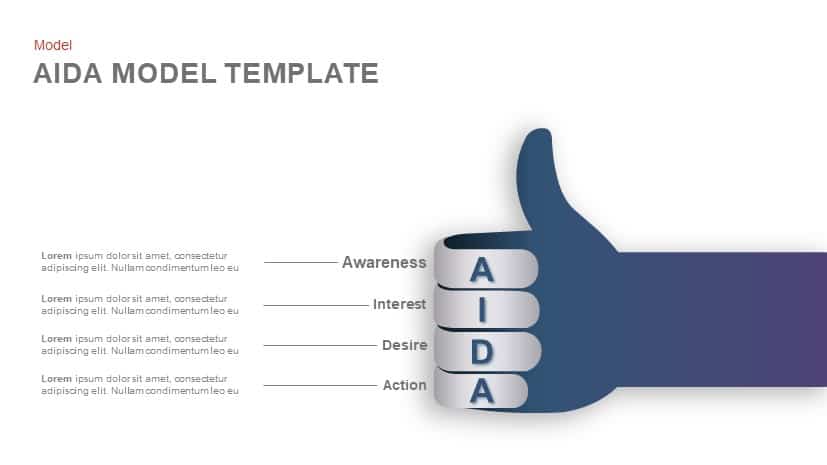
AIDA Model Funnel Thumb Diagram Template for PowerPoint & Google Slides
Process
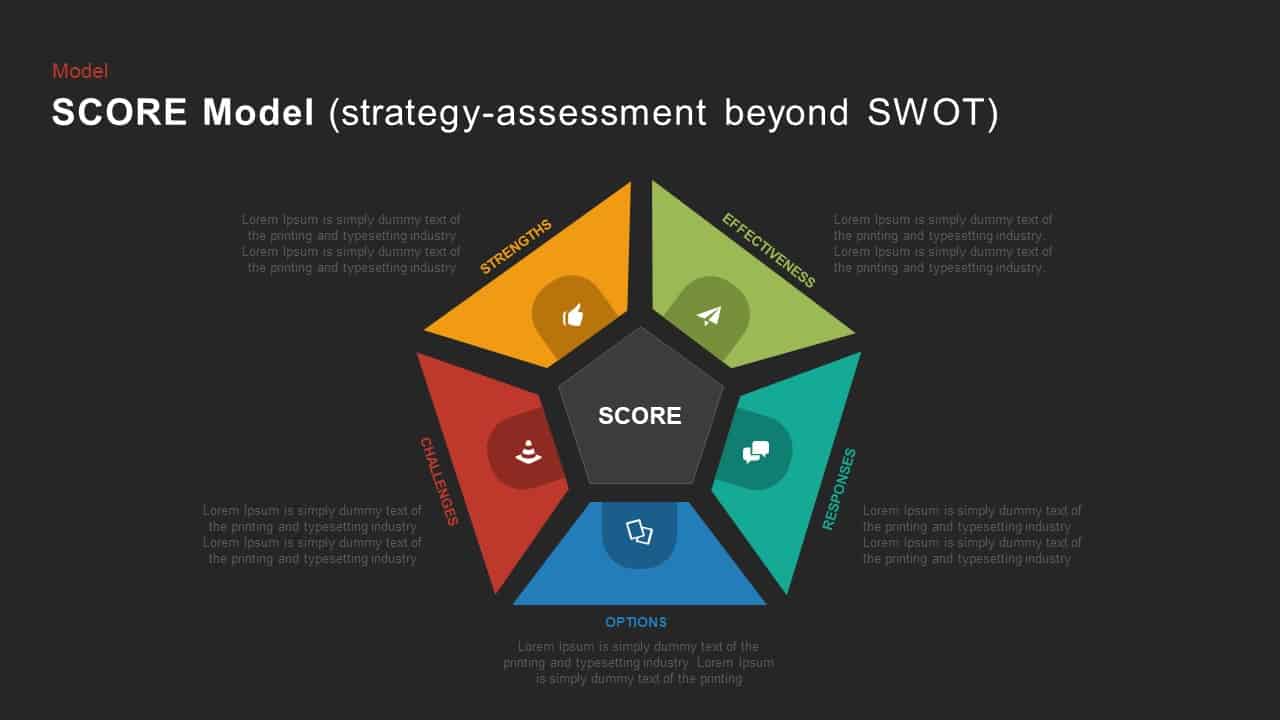
SCORE Model Pentagon Assessment Diagram Template for PowerPoint & Google Slides
Circular
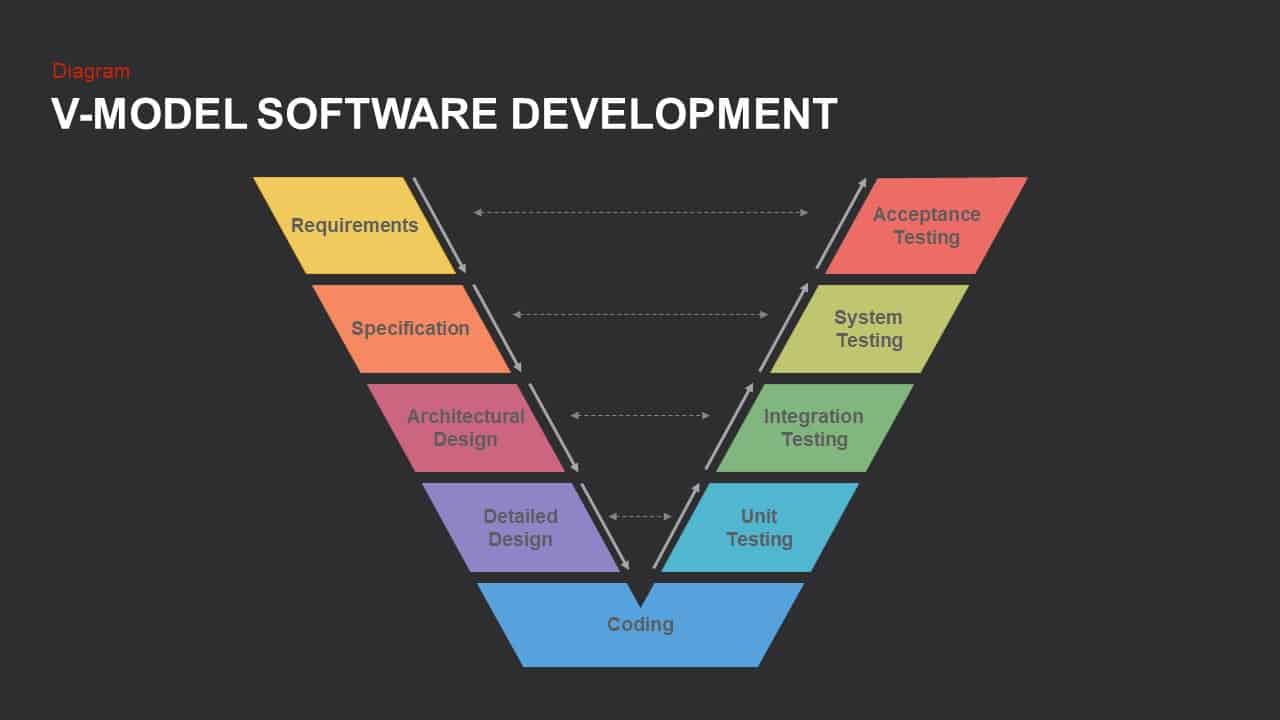
V-Model Software Development Diagram Template for PowerPoint & Google Slides
Software Development
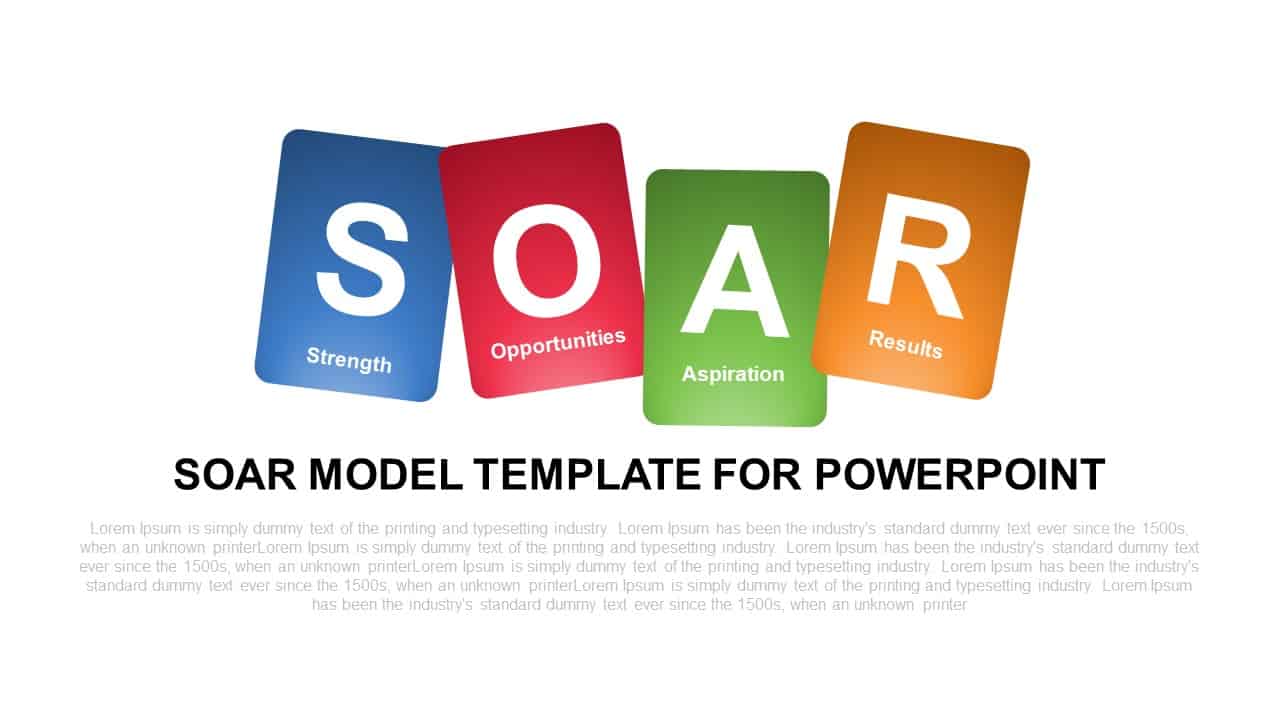
SOAR Strategic Model Card Diagram Template for PowerPoint & Google Slides
Process
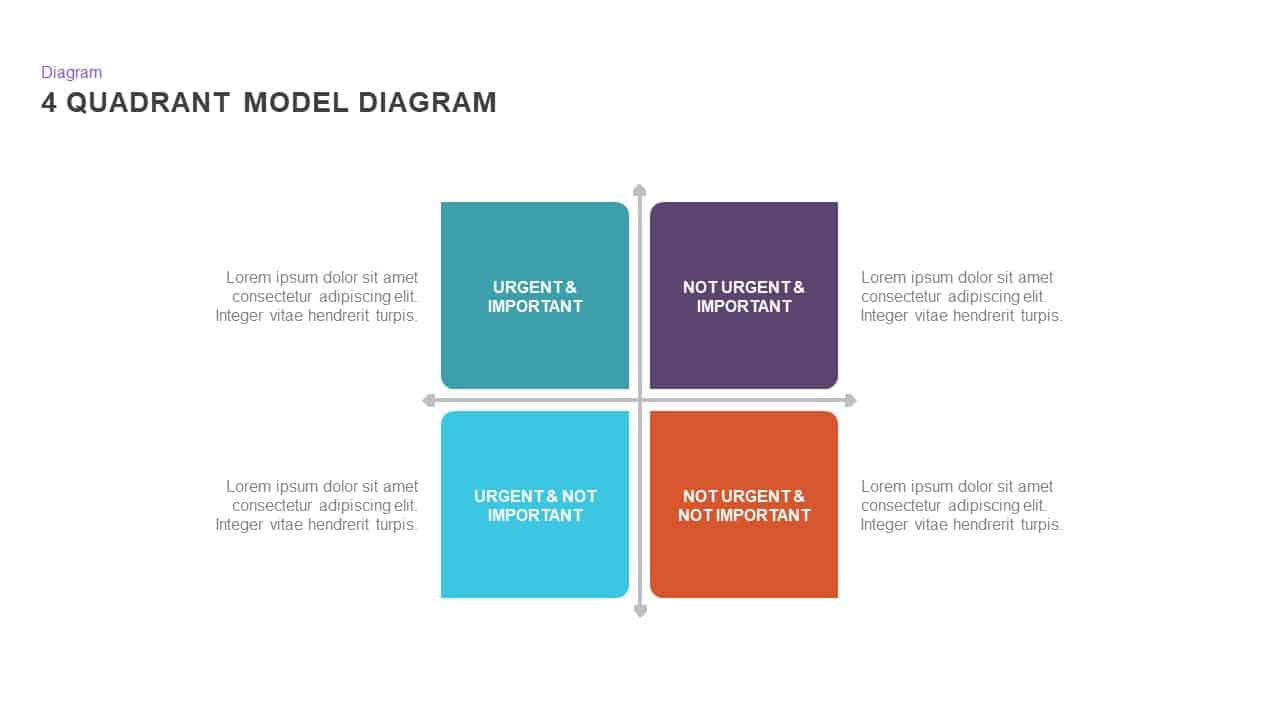
4 Quadrant Model Diagram template for PowerPoint & Google Slides
Process
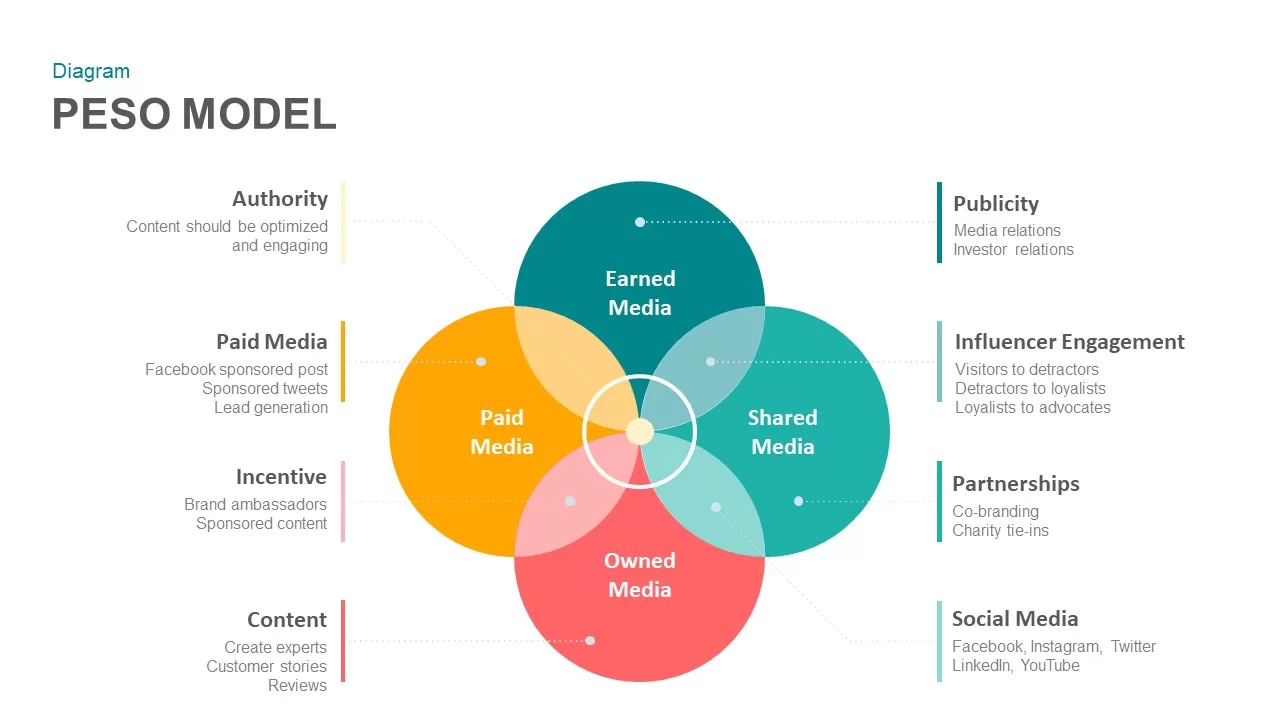
PESO Model Marketing Diagram Template for PowerPoint & Google Slides
Digital Marketing
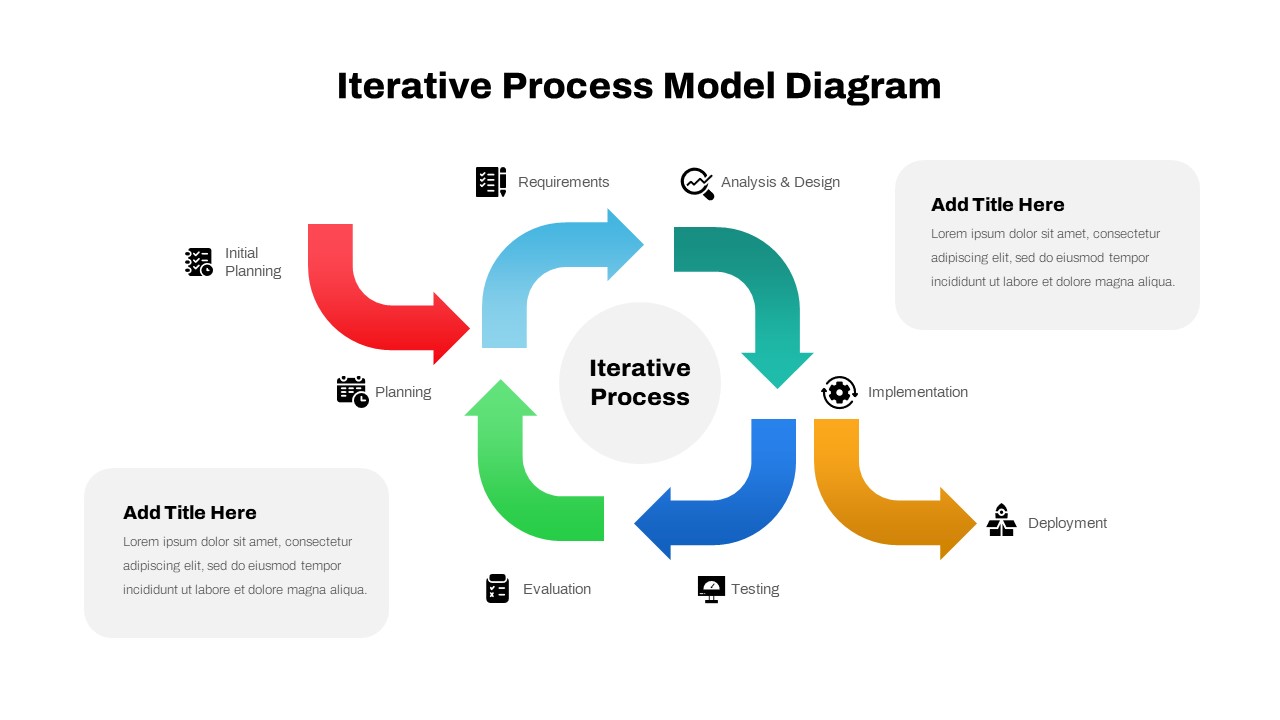
Iterative Process Model Diagram Template for PowerPoint & Google Slides
Process
Greiner Growth Model Six-Phase Diagram Template for PowerPoint & Google Slides
Business Models
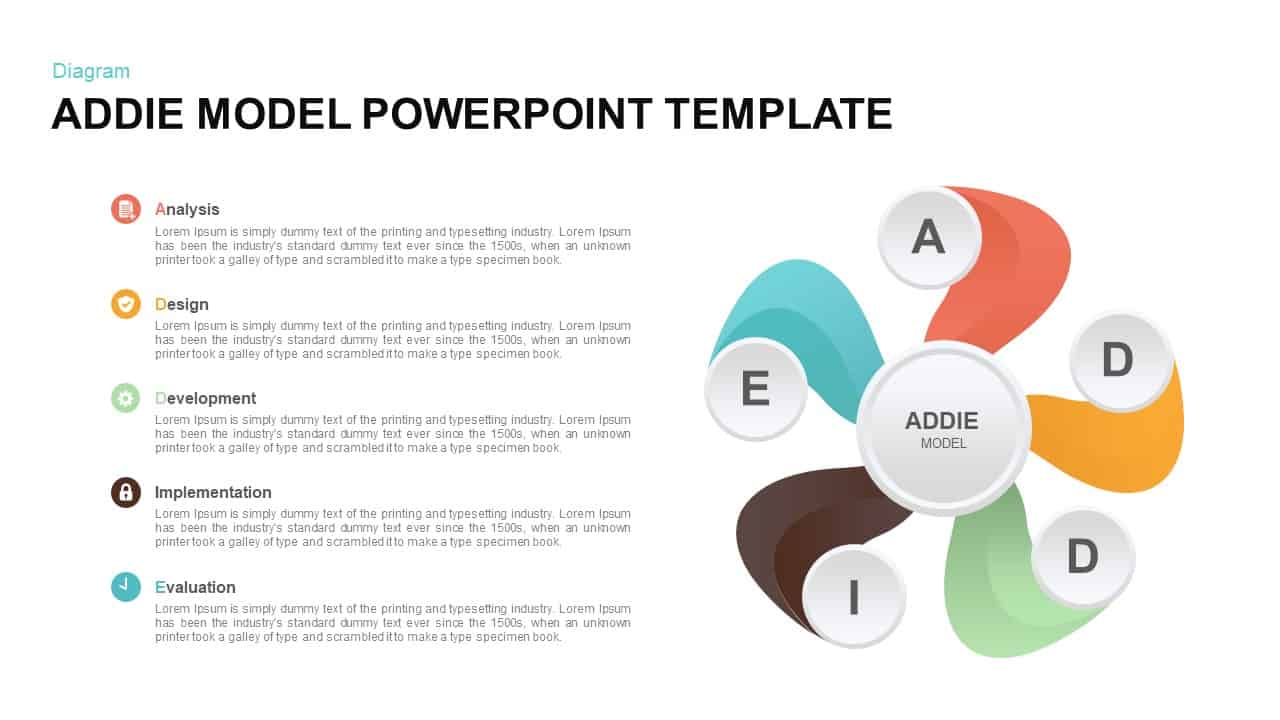
ADDIE Model Hub and Spoke Diagram Template for PowerPoint & Google Slides
Process
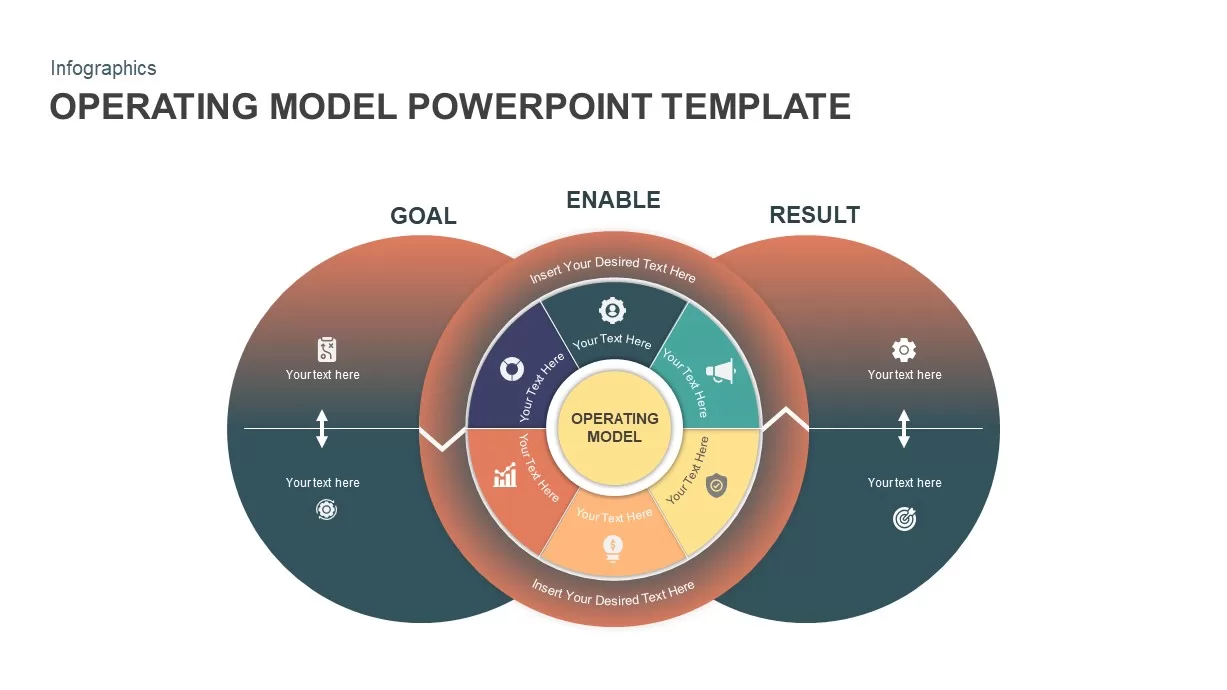
Operating Model Hub-and-Spoke Diagram Template for PowerPoint & Google Slides
Business Models
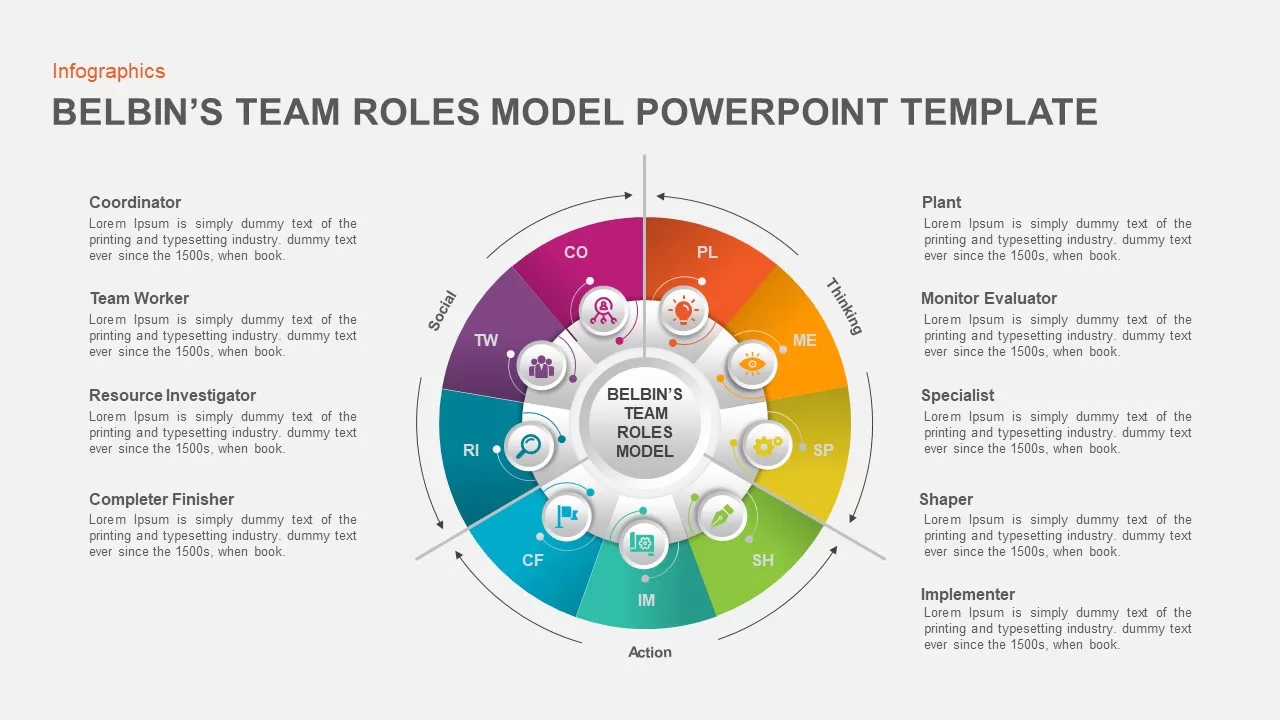
Belbin’s Team Roles Model Diagram Template for PowerPoint & Google Slides
HR
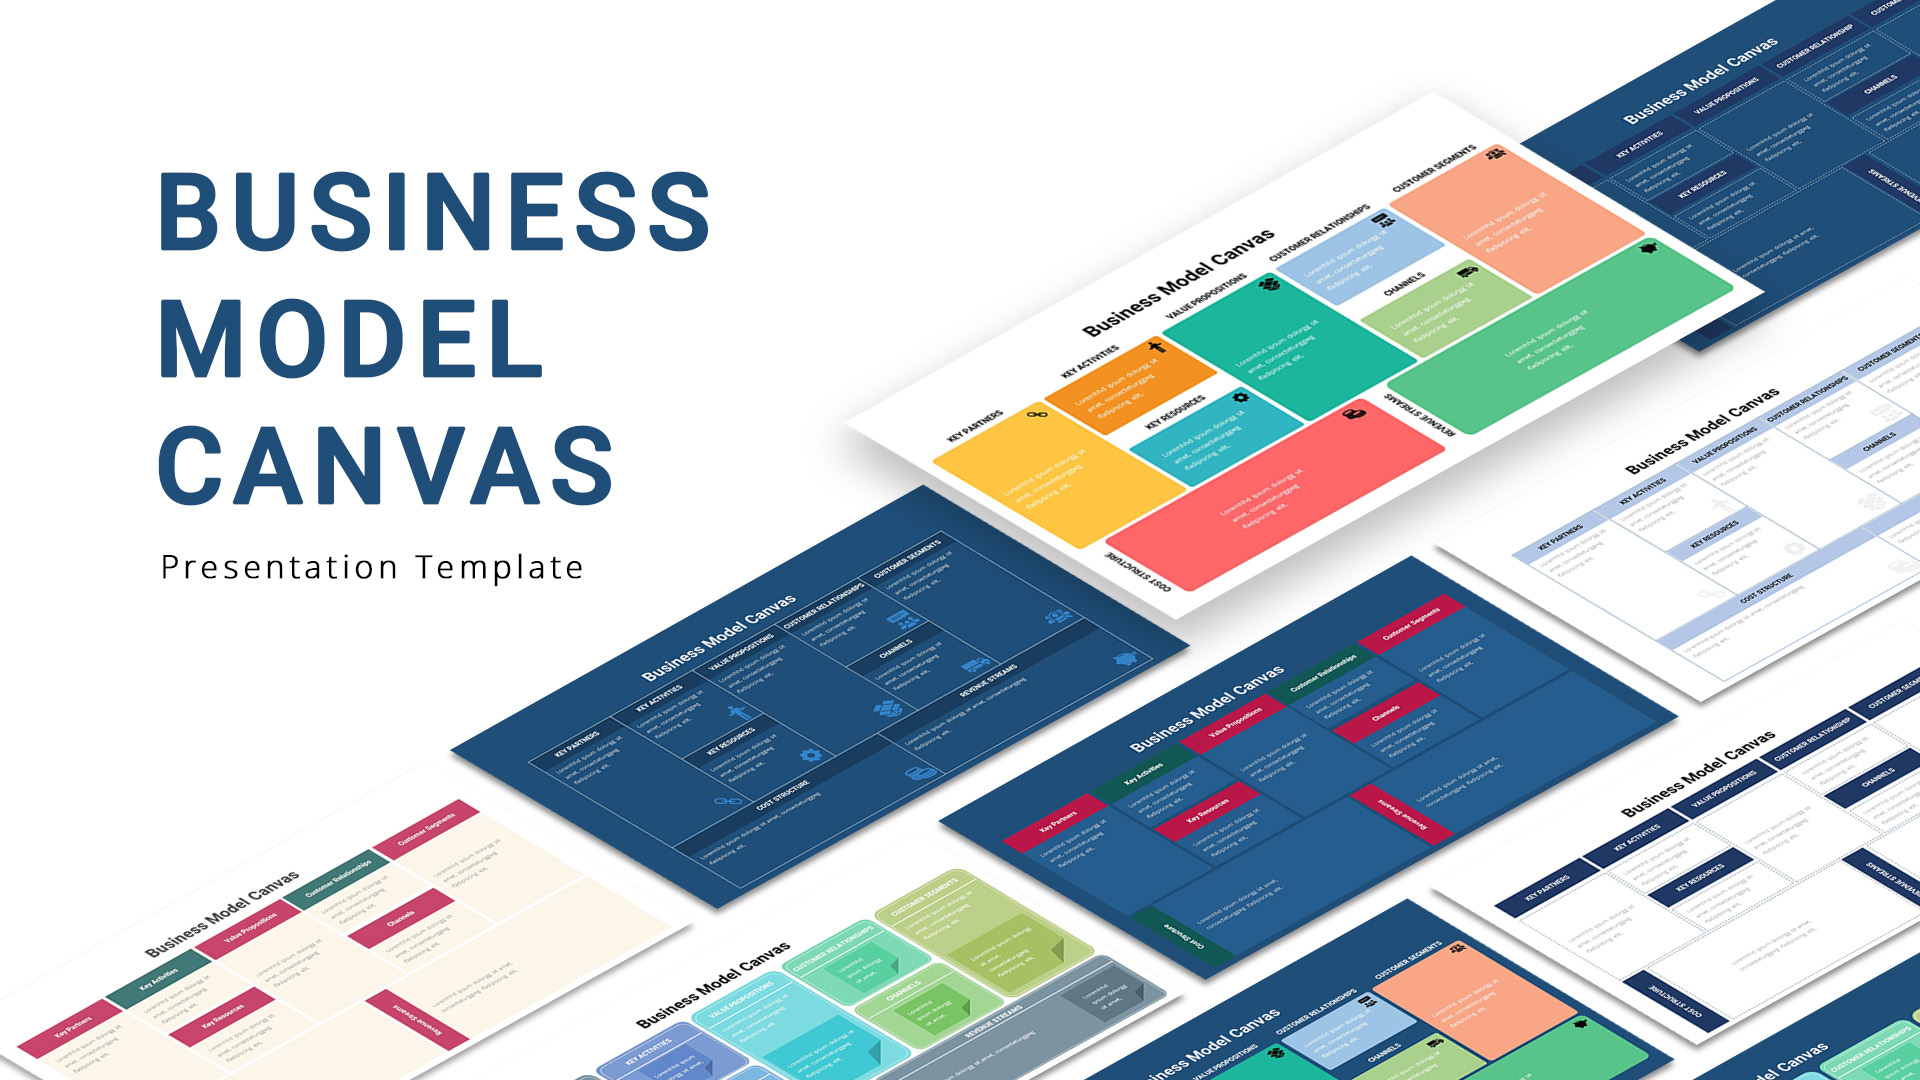
Business Model Canvas Diagram Template for PowerPoint & Google Slides
Business Models
Business Strategy House Model Diagram Template for PowerPoint & Google Slides
Business Strategy
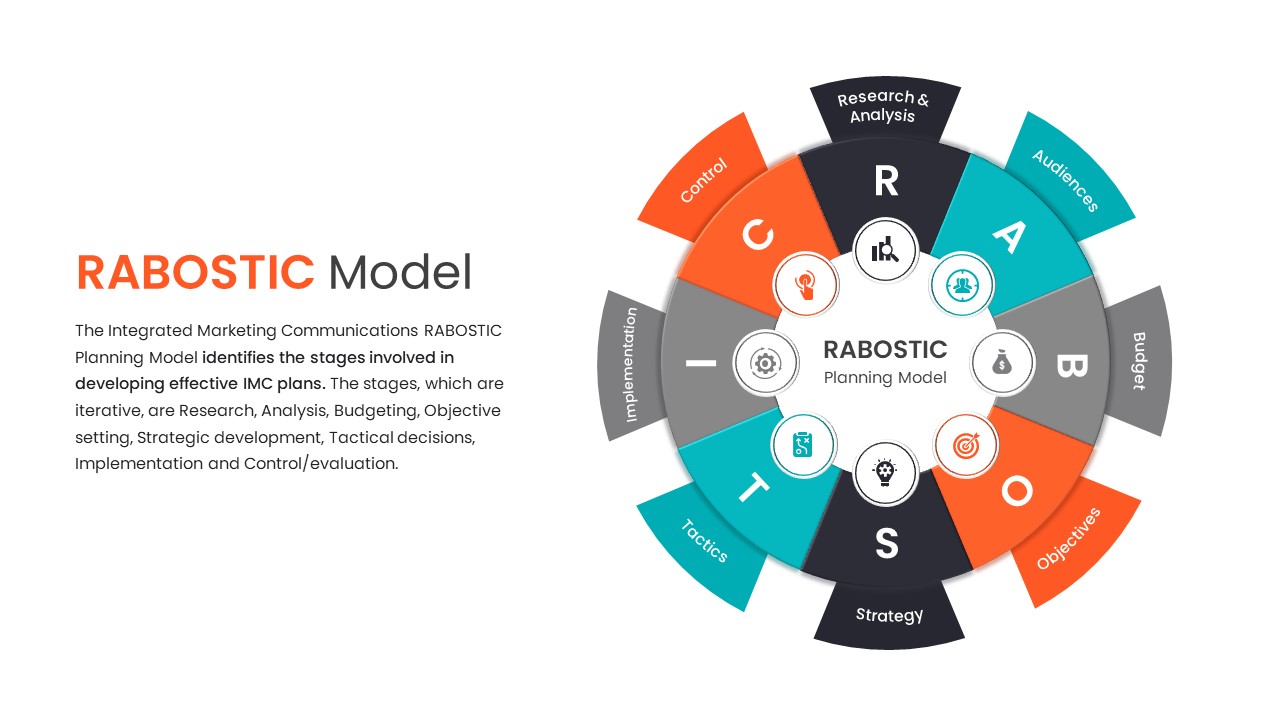
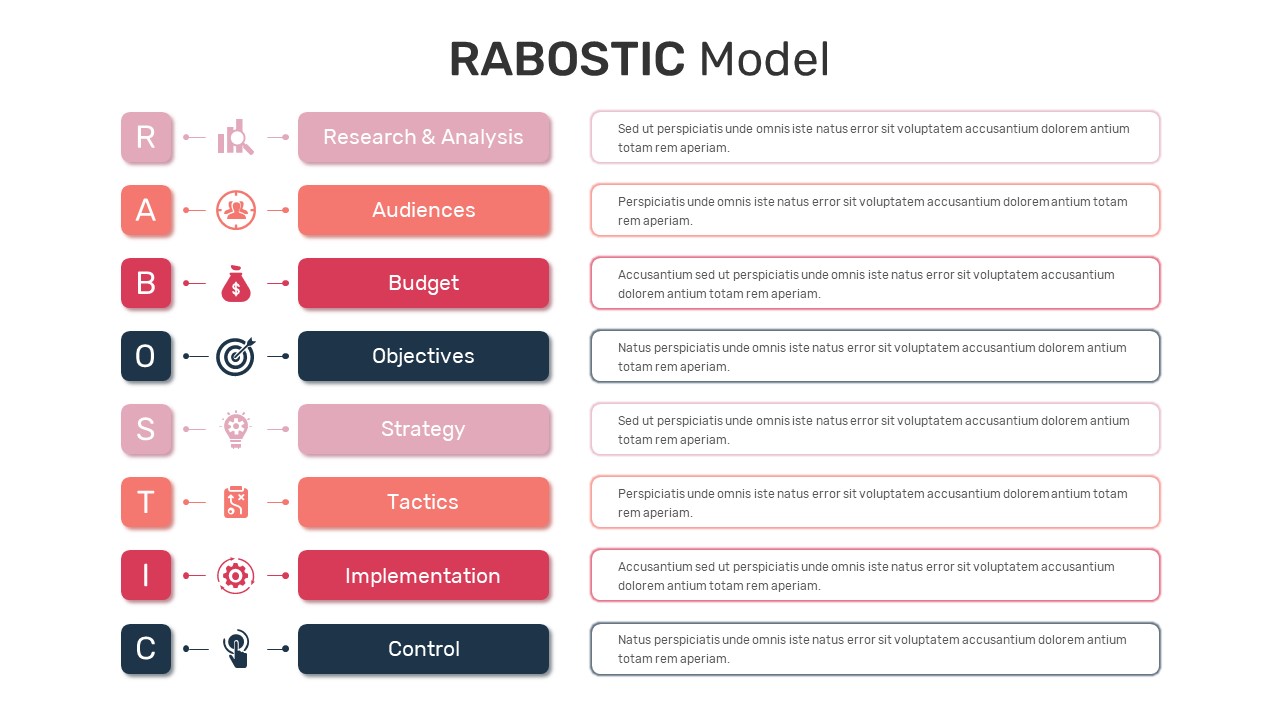
RABOSTIC IMC Planning Model Diagram Template for PowerPoint & Google Slides
Process
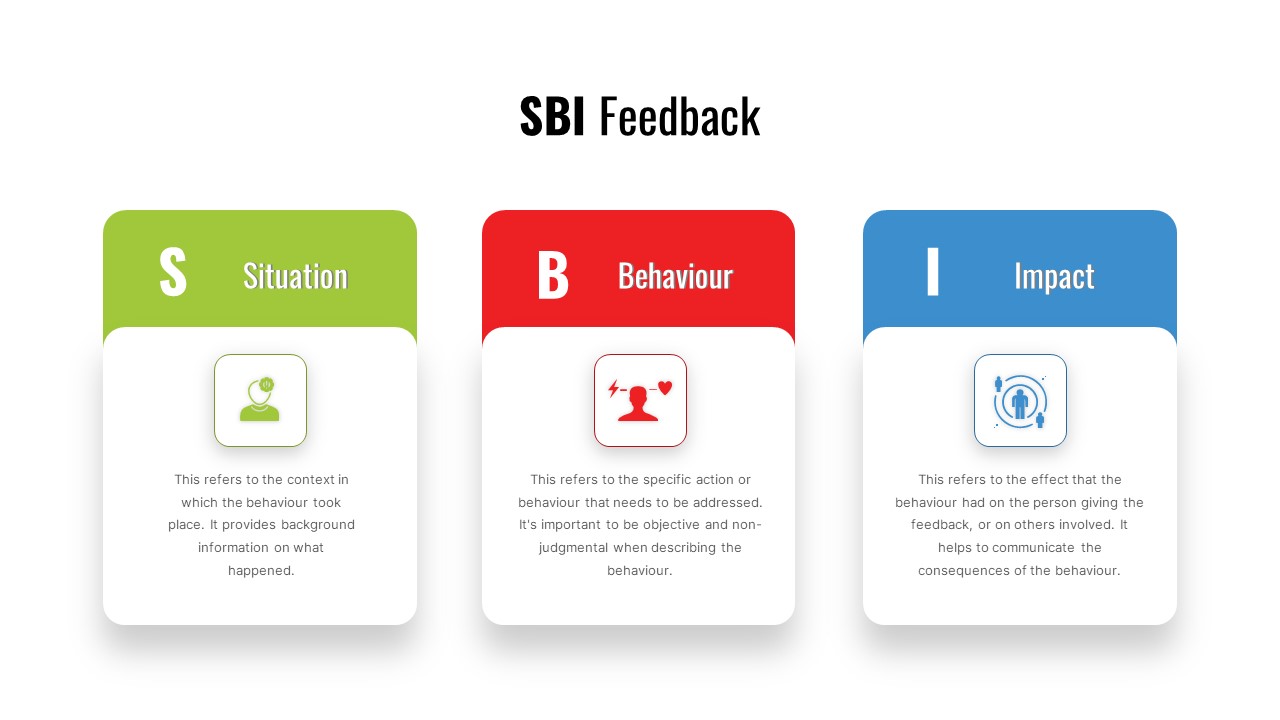
SBI Feedback Model Process Diagram Template for PowerPoint & Google Slides
Process
RABOSTIC Marketing Model Process Diagram Template for PowerPoint & Google Slides
Process
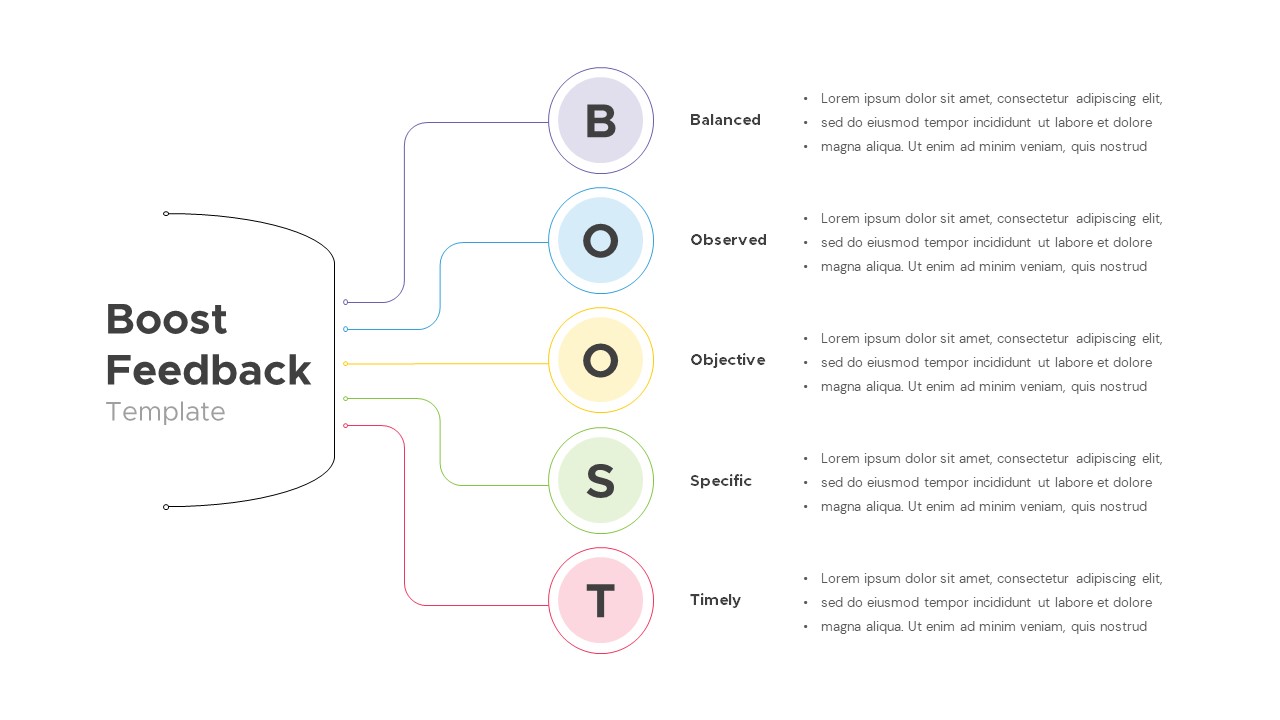
Interactive Boost Feedback Model Diagram Template for PowerPoint & Google Slides
Process
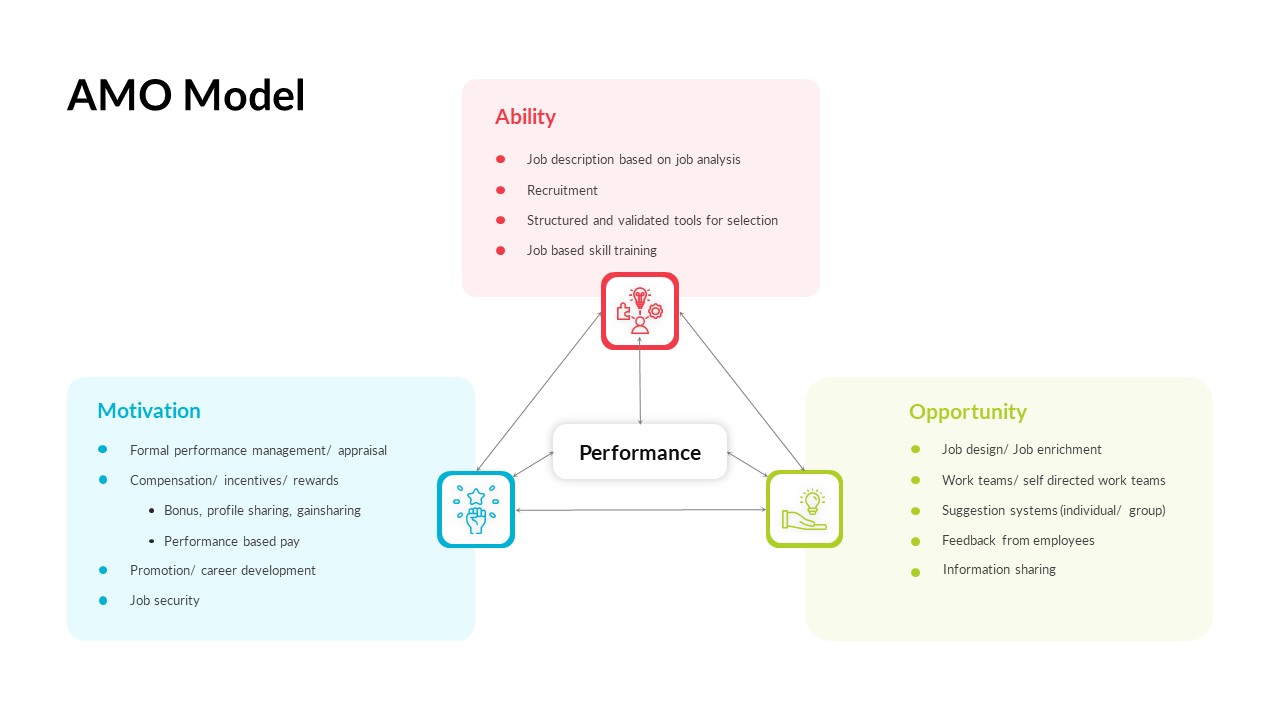
AMO Performance Model Feedback Diagram Template for PowerPoint & Google Slides
Employee Performance
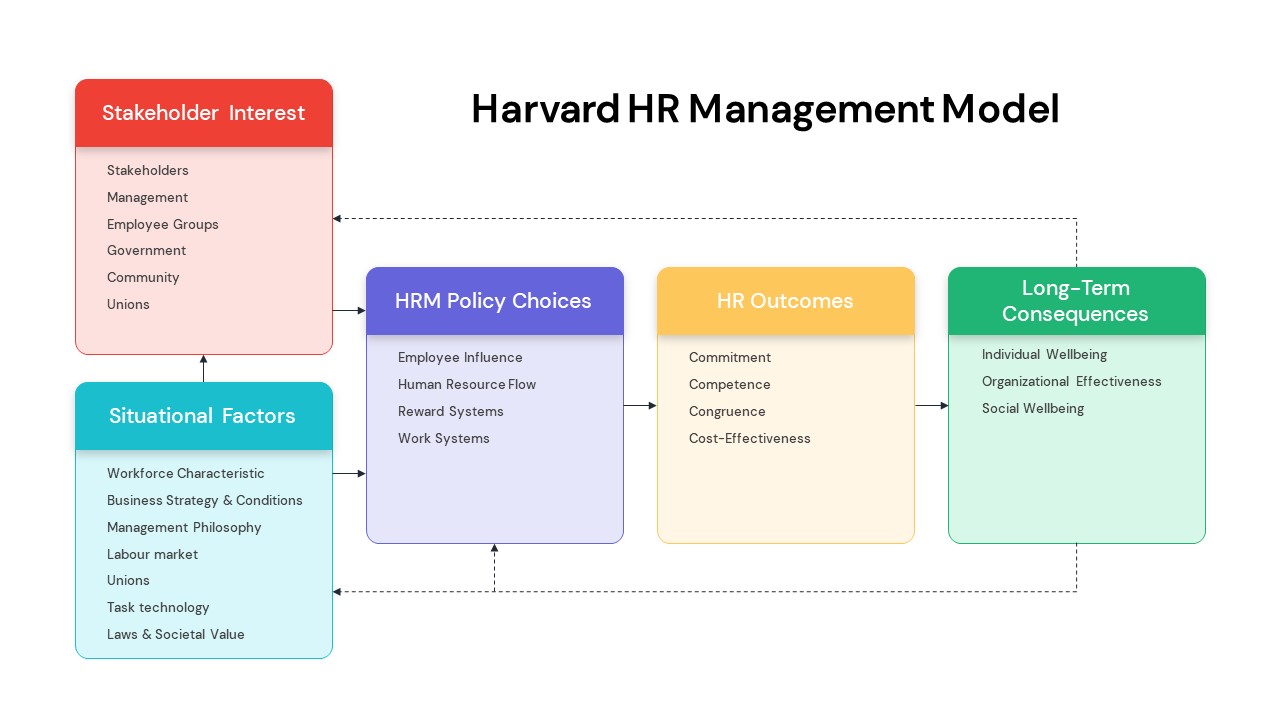
Harvard HR Management Model Diagram Template for PowerPoint & Google Slides
Process
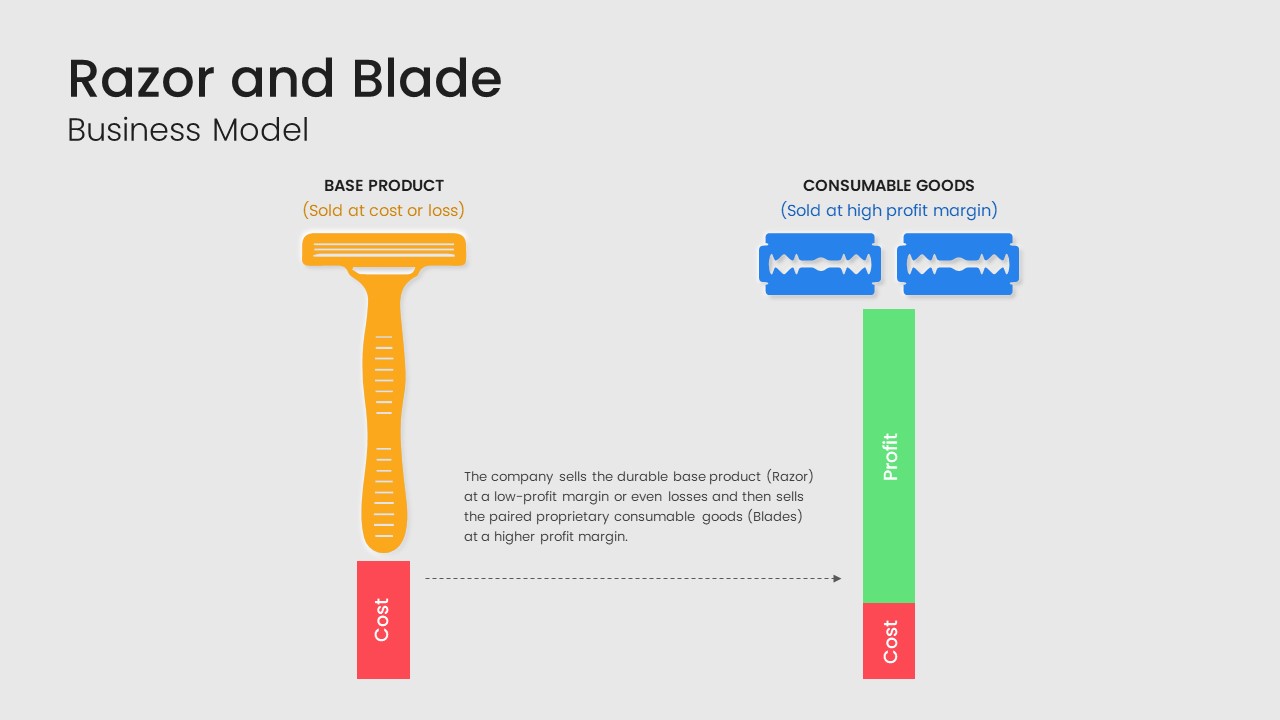
Razor and Blade Business Model Diagram Template for PowerPoint & Google Slides
Business Models
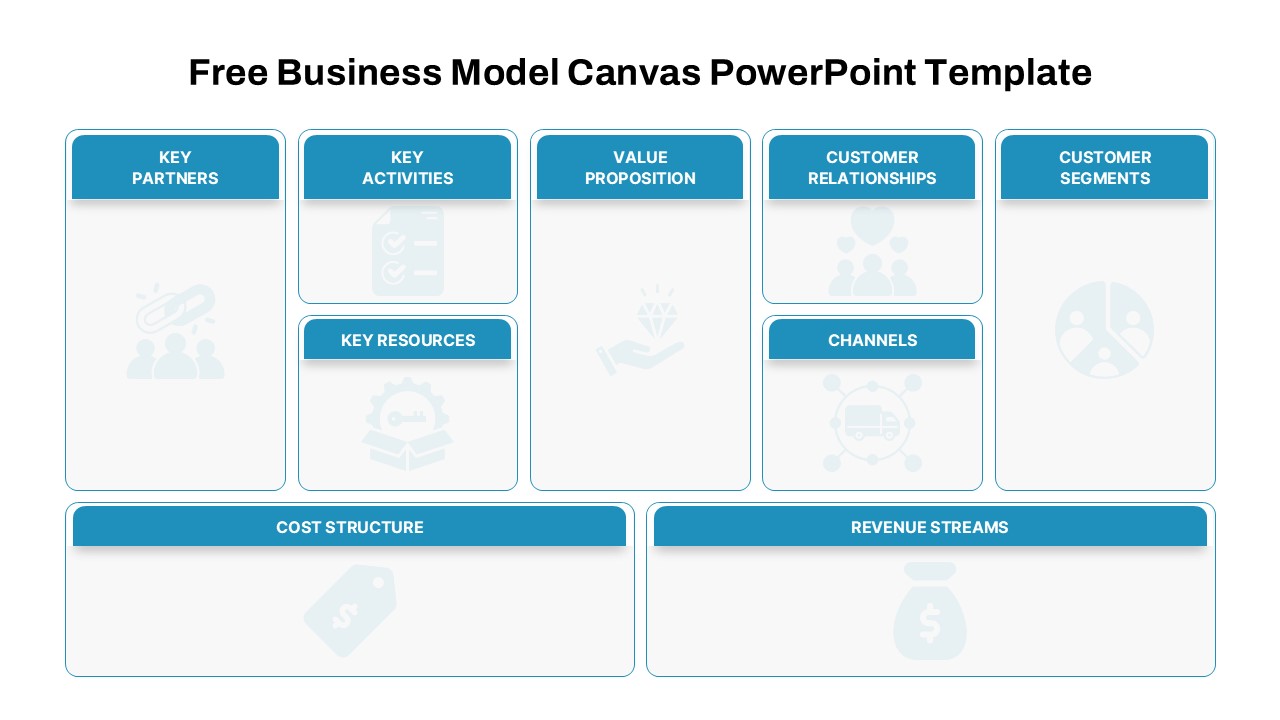
Free Business Model Canvas Diagram Slide Template for PowerPoint & Google Slides
Business Models
Free
Salience Model Venn Diagram Infographic Template for PowerPoint & Google Slides
Circular
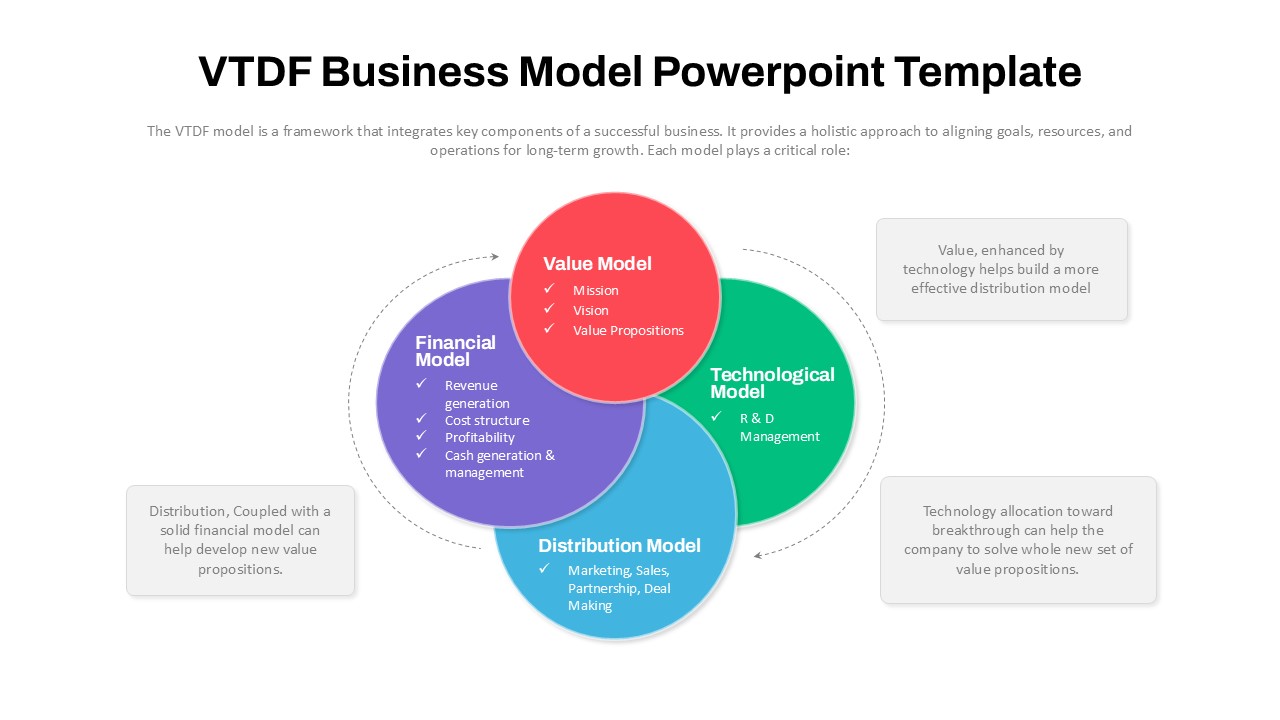
VTDF Business Model Framework Diagram Template for PowerPoint & Google Slides
Business Models
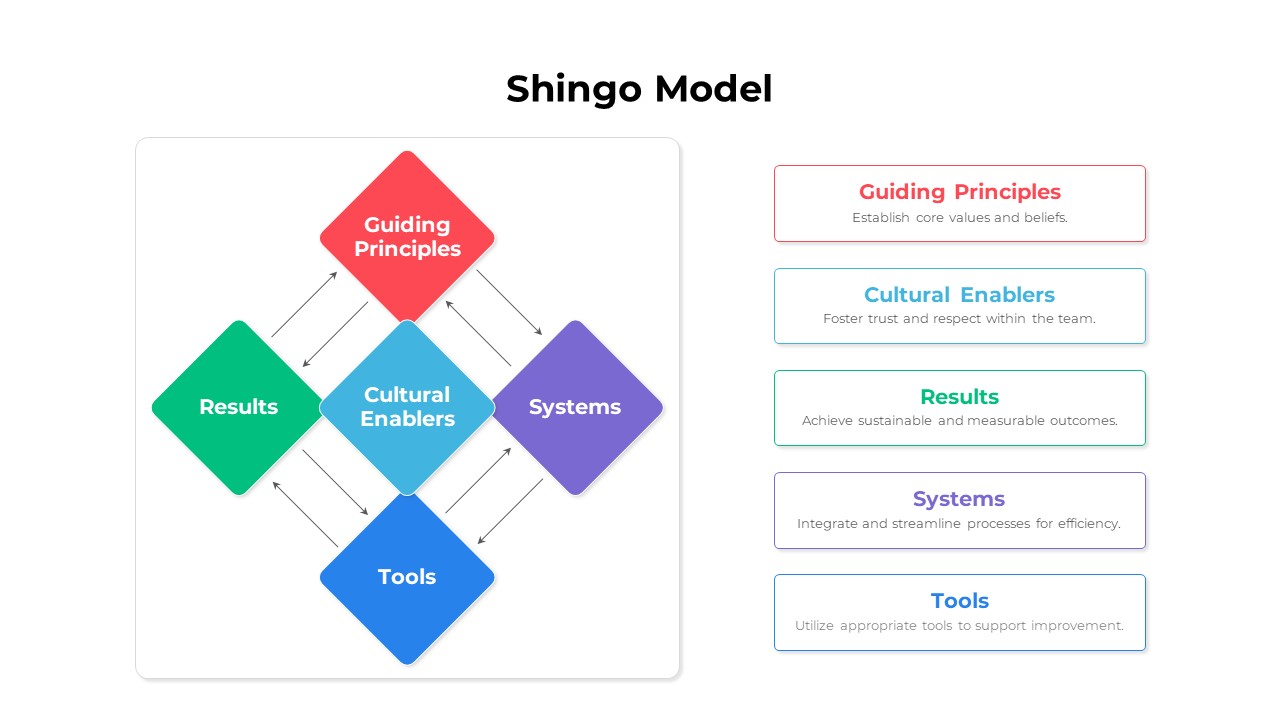
Shingo Model Diagram Template for PowerPoint & Google Slides
Process
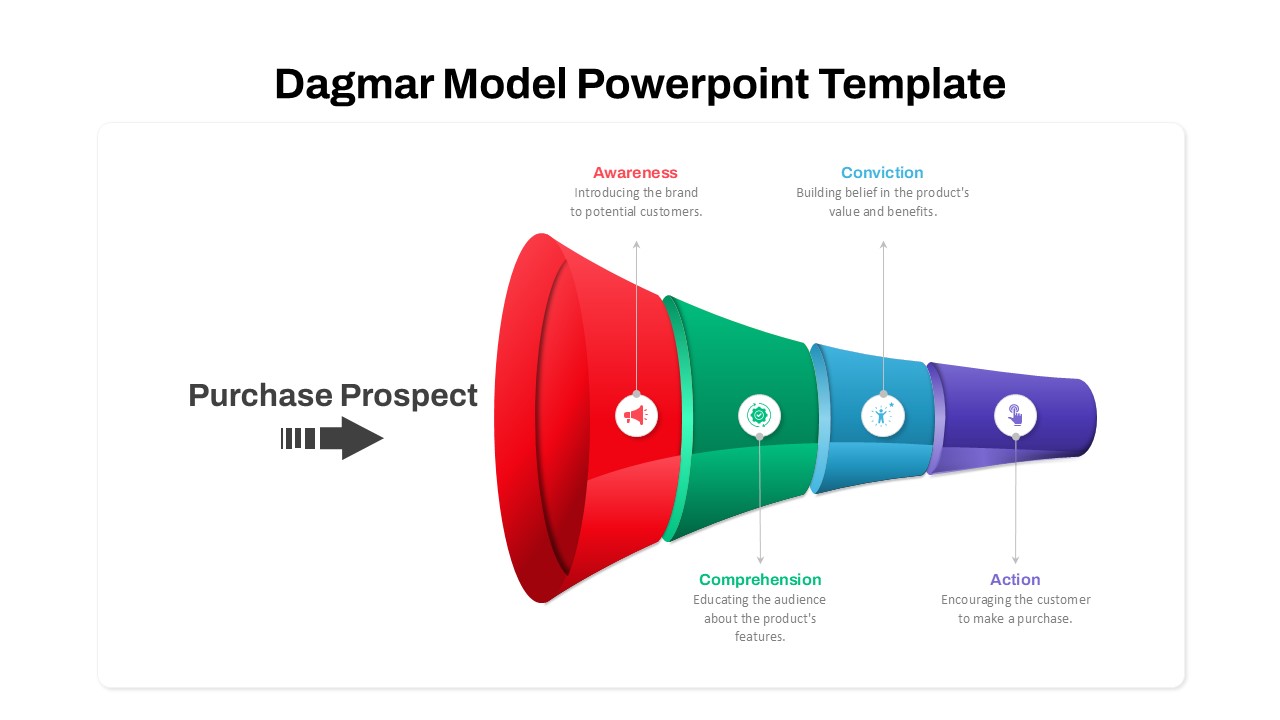
Dagmar Model Marketing Funnel Diagram Template for PowerPoint & Google Slides
Funnel
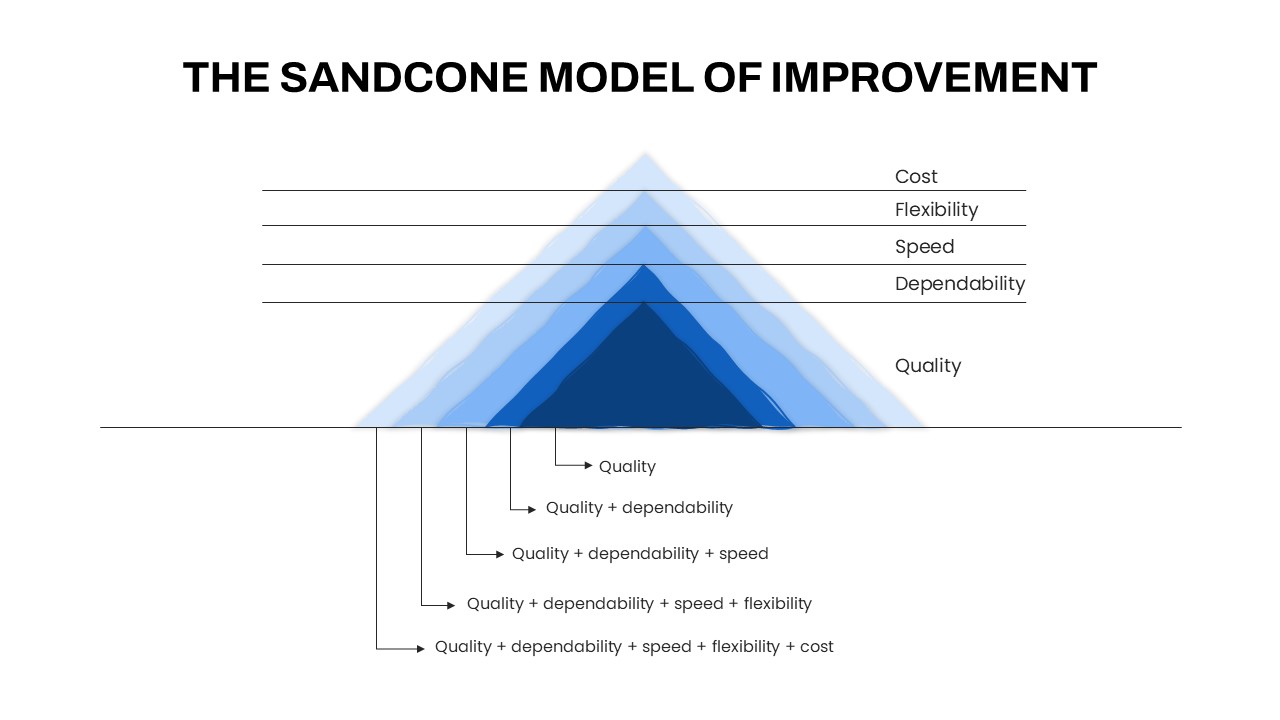
Sandcone Model of Improvement Diagram Template for PowerPoint & Google Slides
Pyramid
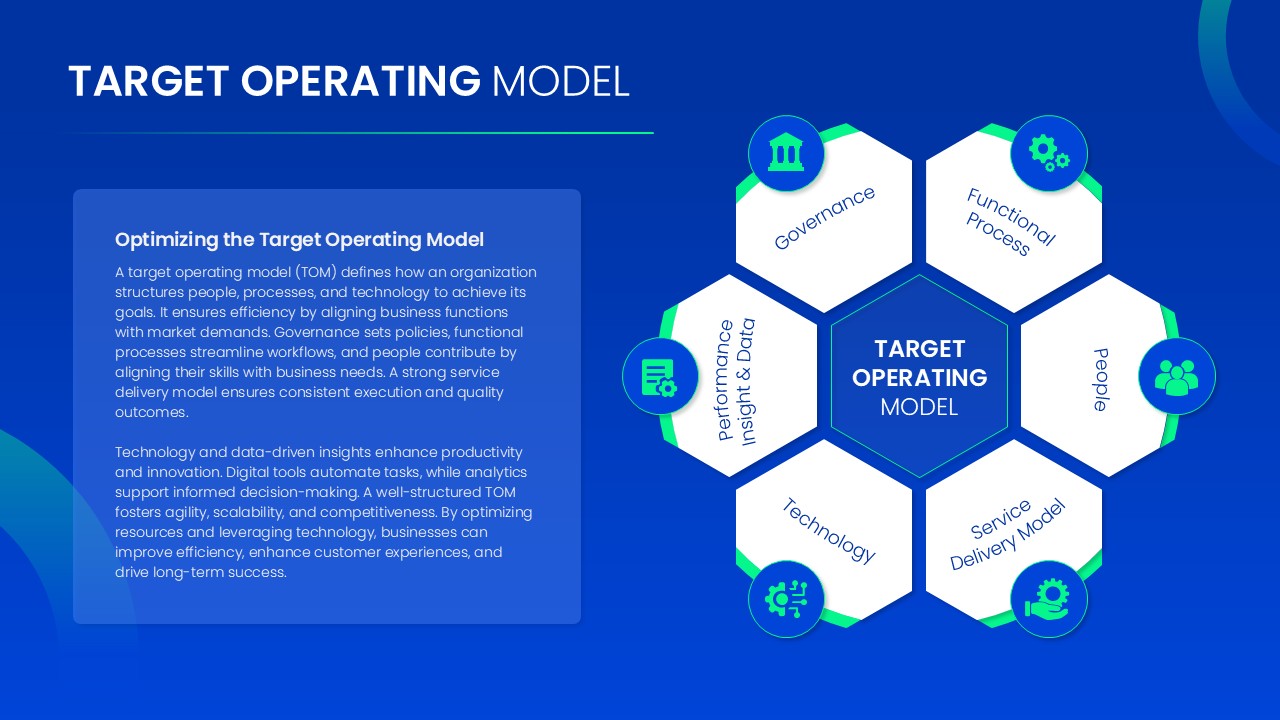
Target Operating Model Diagram Template for PowerPoint & Google Slides
Business Strategy
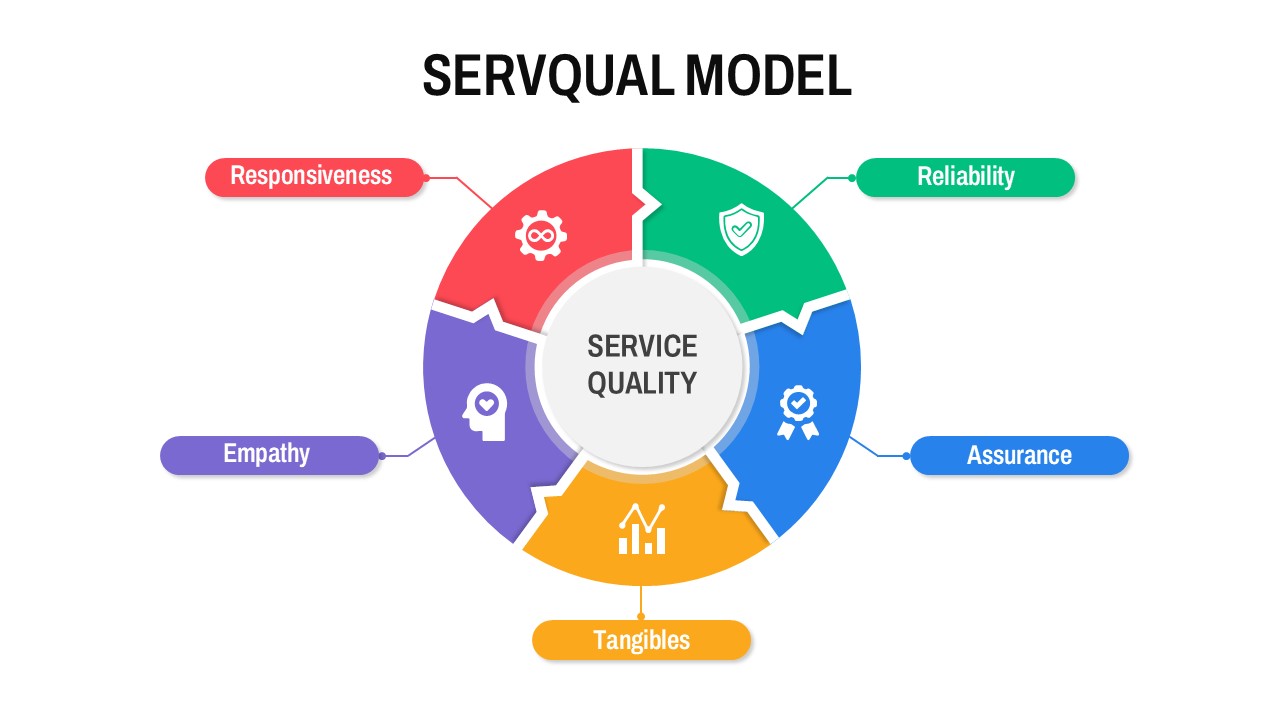
Circular SERVQUAL Model Diagram Template for PowerPoint & Google Slides
Business Strategy
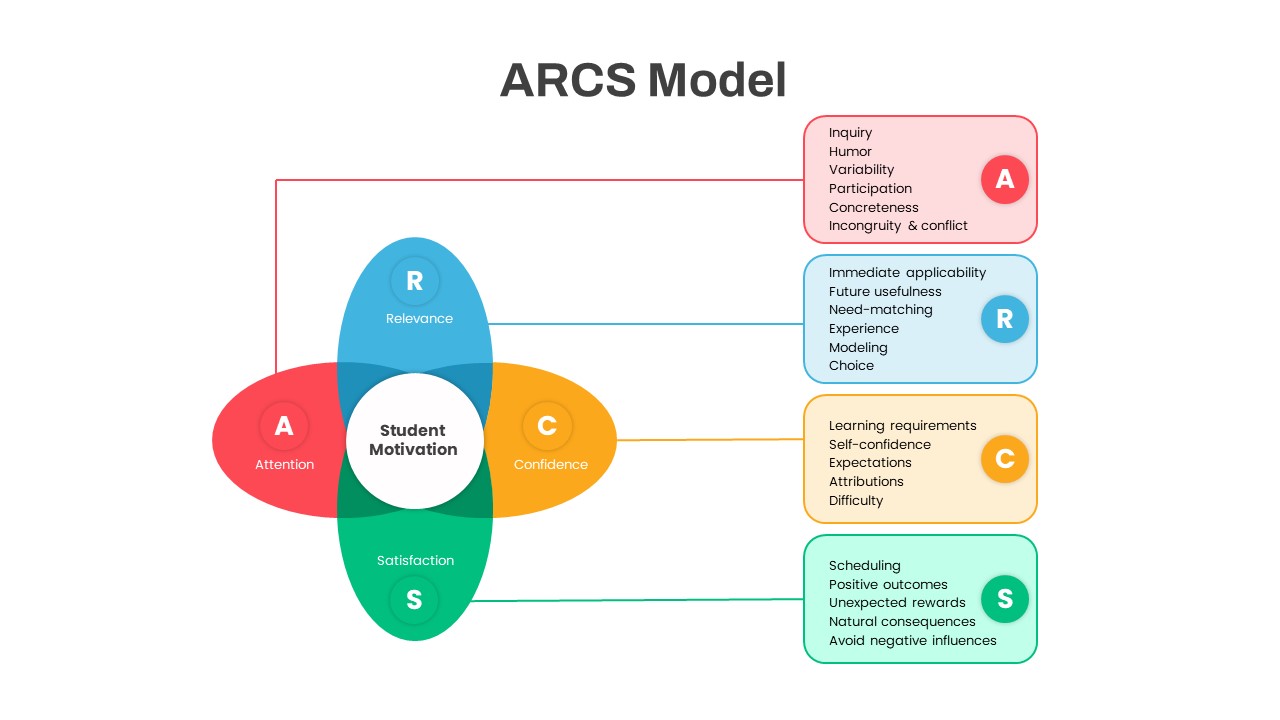
ARCS Student Motivation Model Diagram Template for PowerPoint & Google Slides
Process
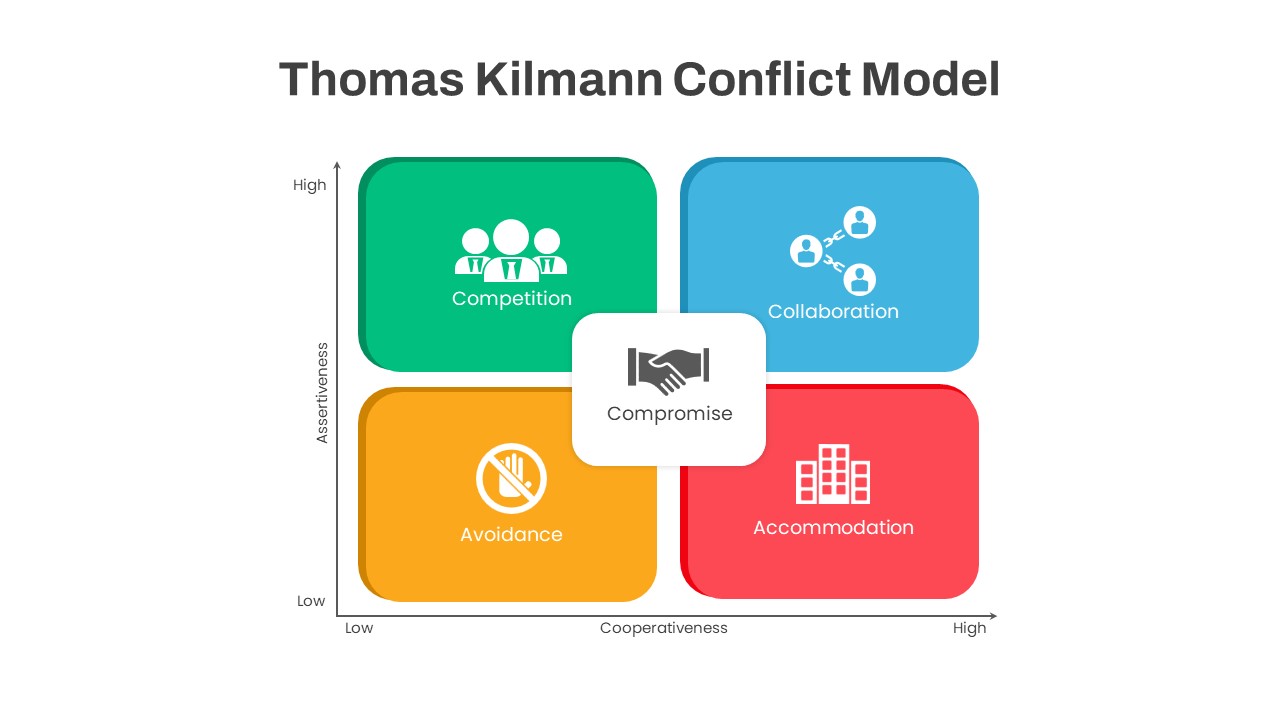
Thomas Kilmann Conflict Model Diagram Template for PowerPoint & Google Slides
Leadership
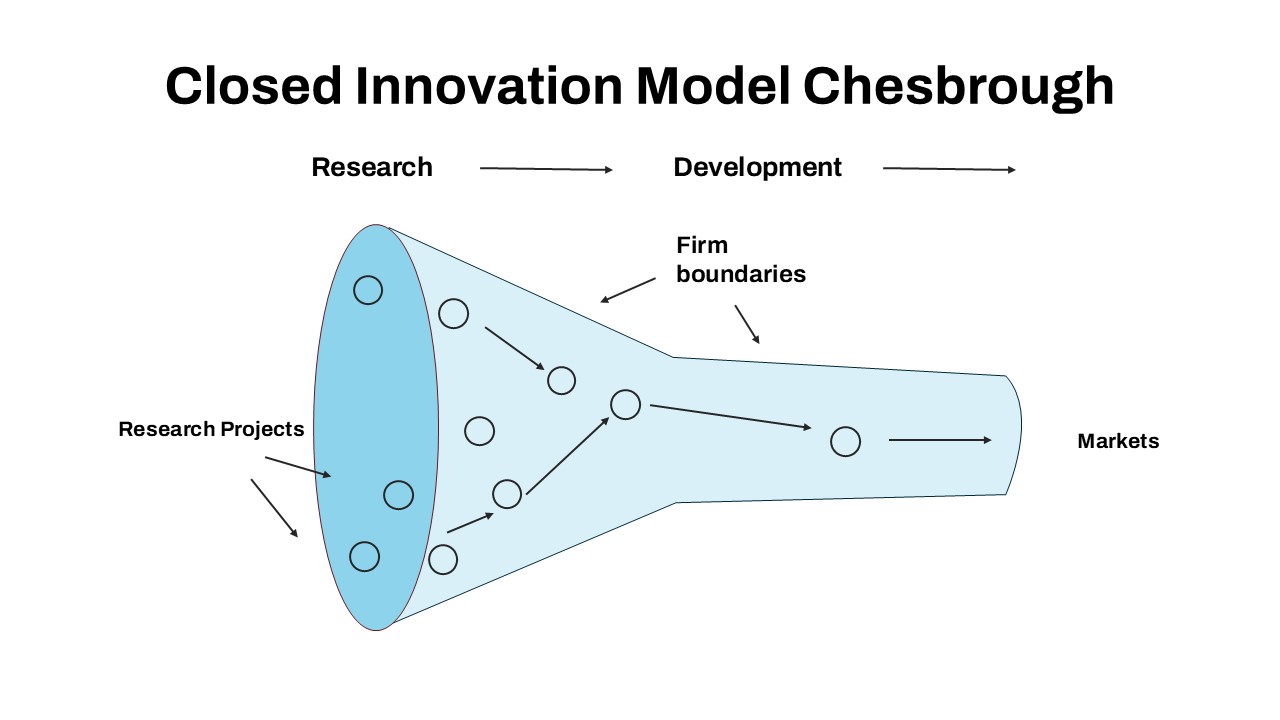
Closed Innovation Model Funnel Diagram Template for PowerPoint & Google Slides
Funnel
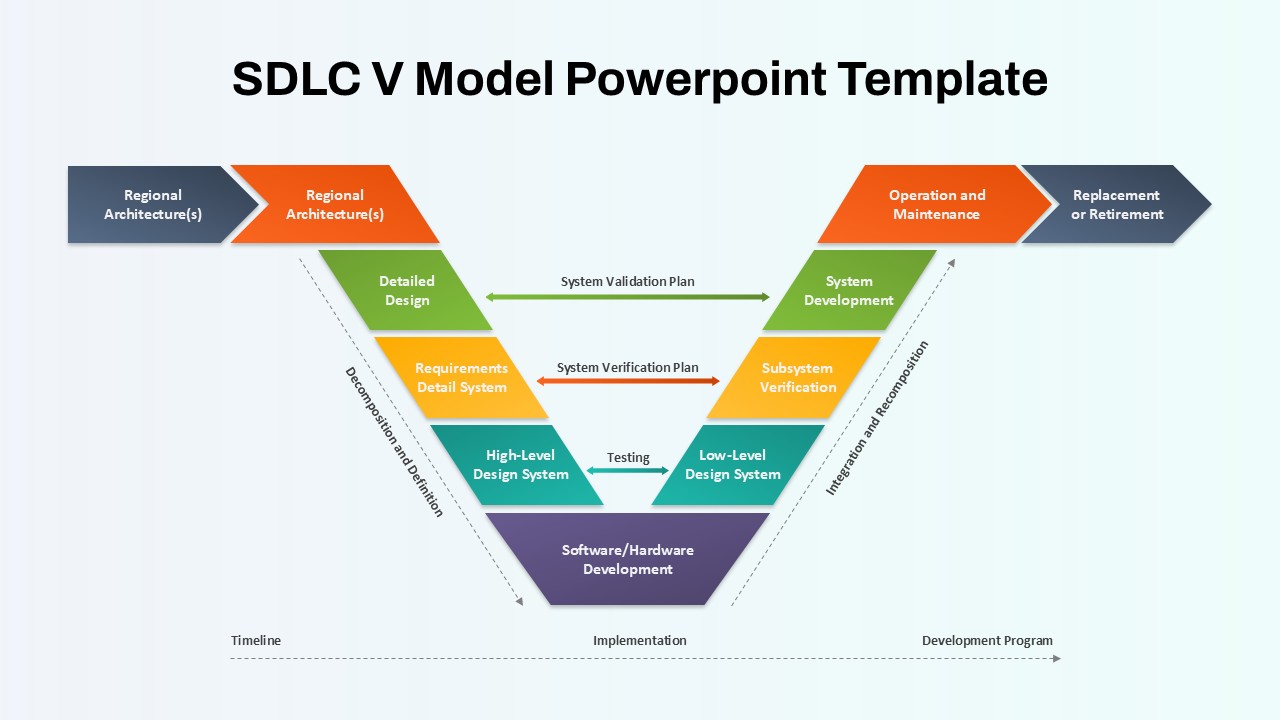
SDLC V Model Lifecycle Diagram Template for PowerPoint & Google Slides
Process
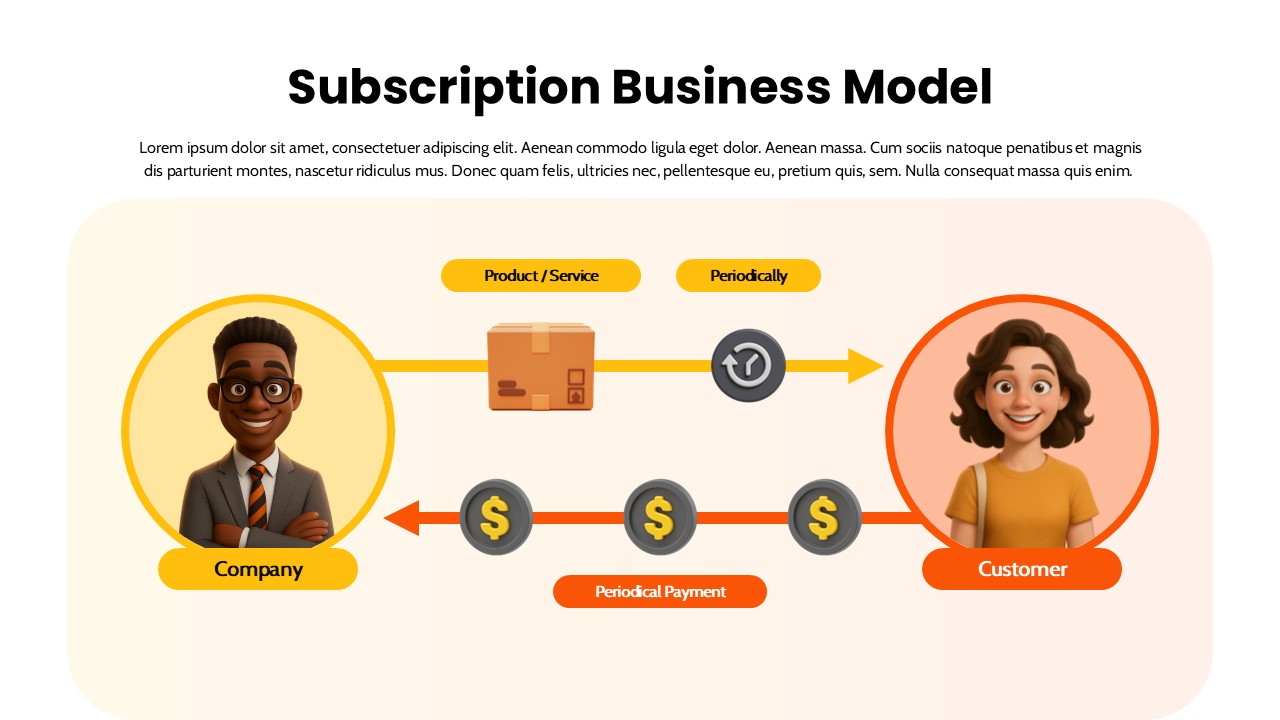
Subscription Business Model Flow Diagram Template for PowerPoint & Google Slides
Business Models
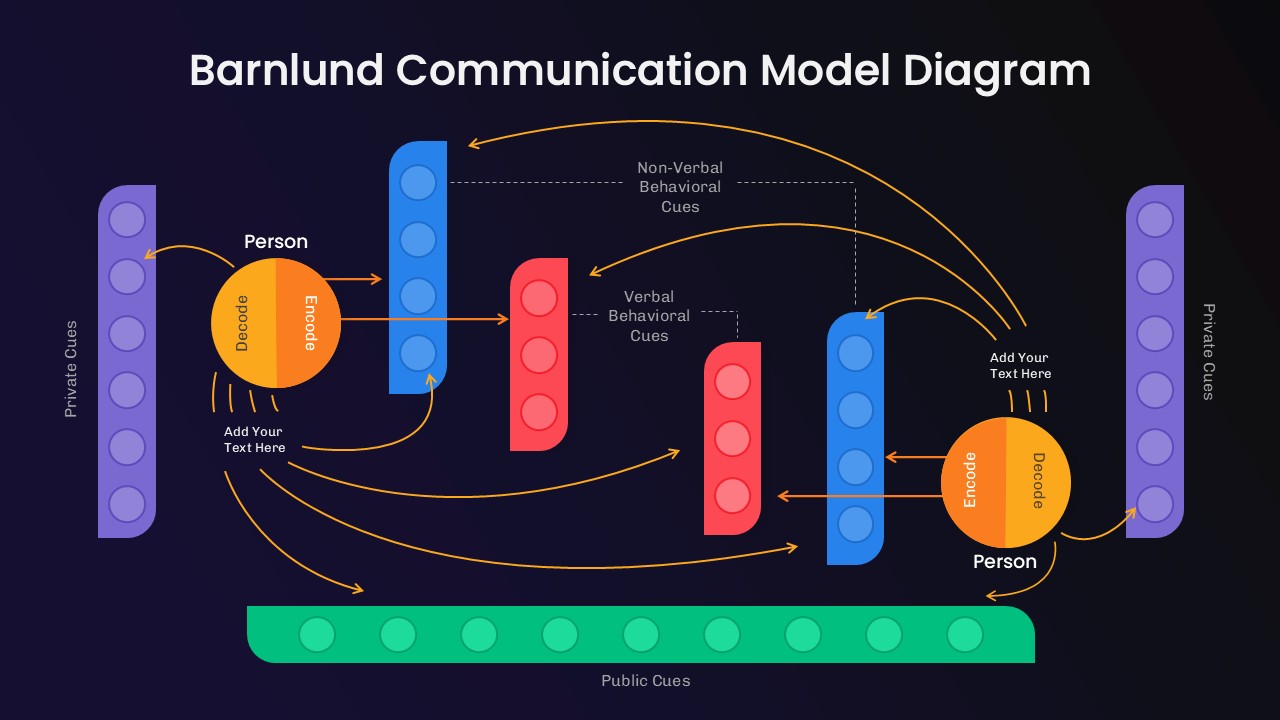
Barnlund Communication Model Diagram Template for PowerPoint & Google Slides
Process
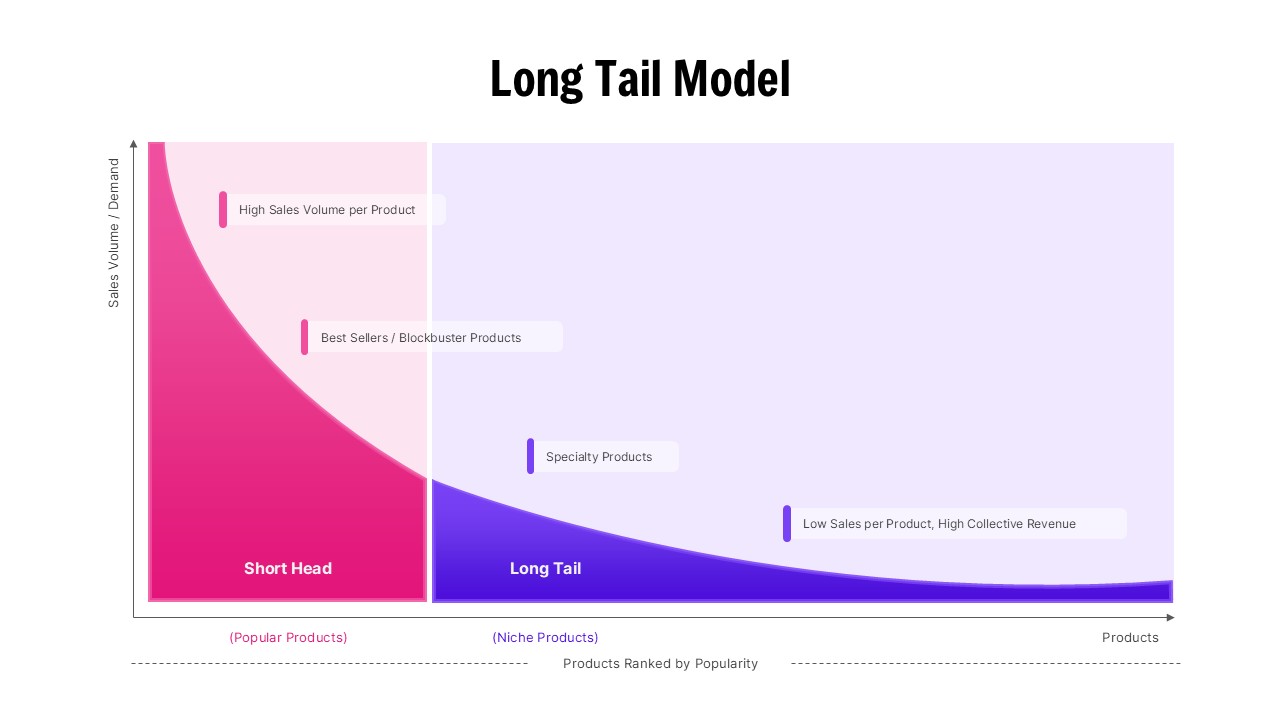
Long Tail Model Business Strategy Diagram Template for PowerPoint & Google Slides
Business
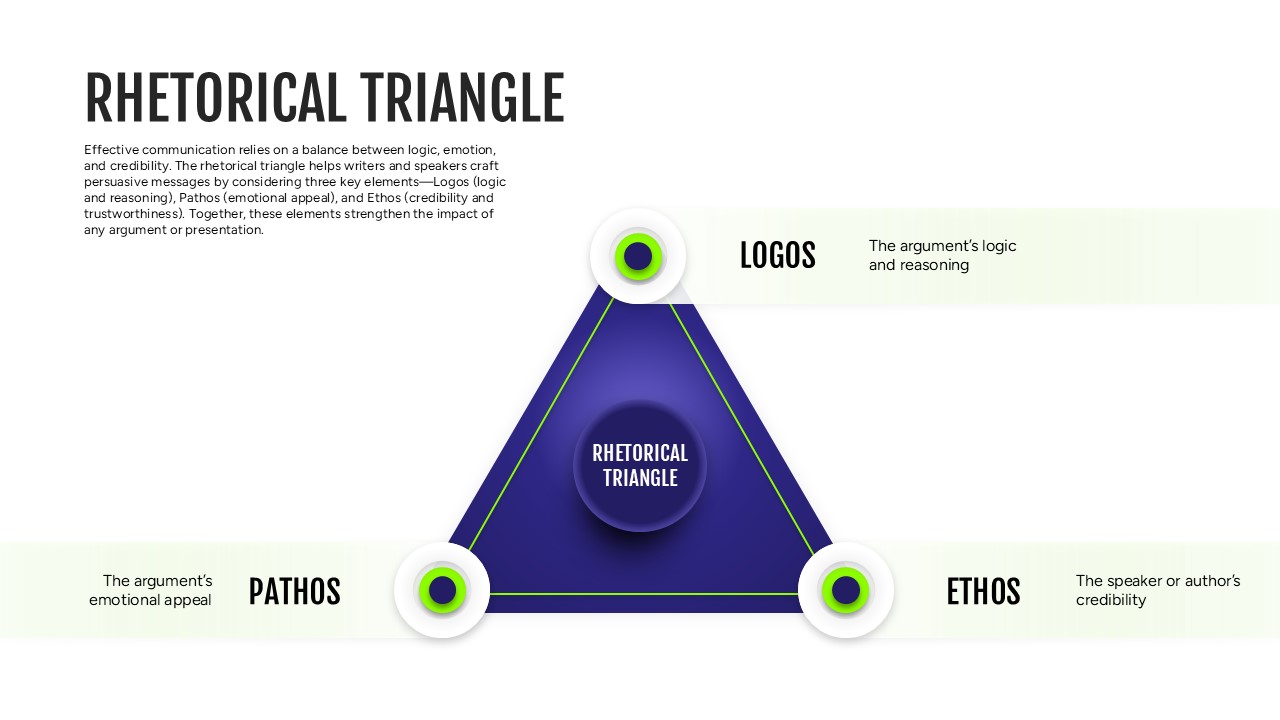
Rhetorical Triangle Model Diagram Template for PowerPoint & Google Slides
Leadership
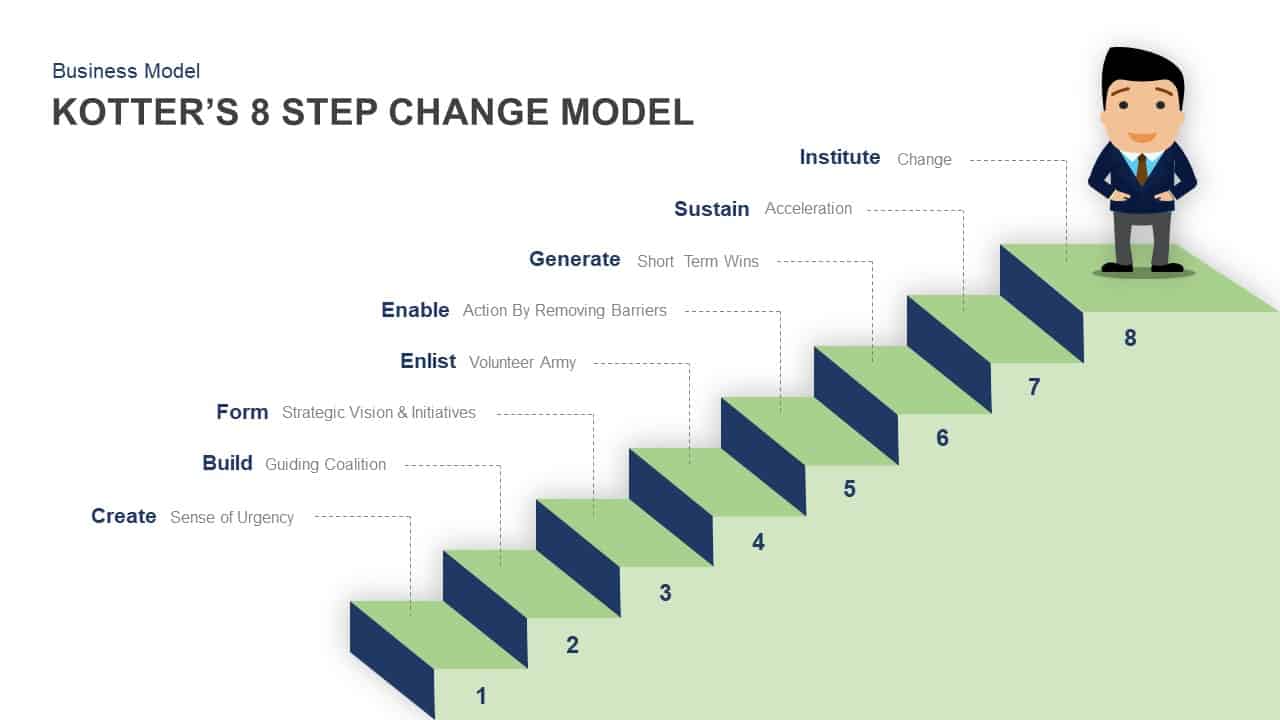
Kotter’s 8 Step Change Model Diagram for PowerPoint & Google Slides
Business Models
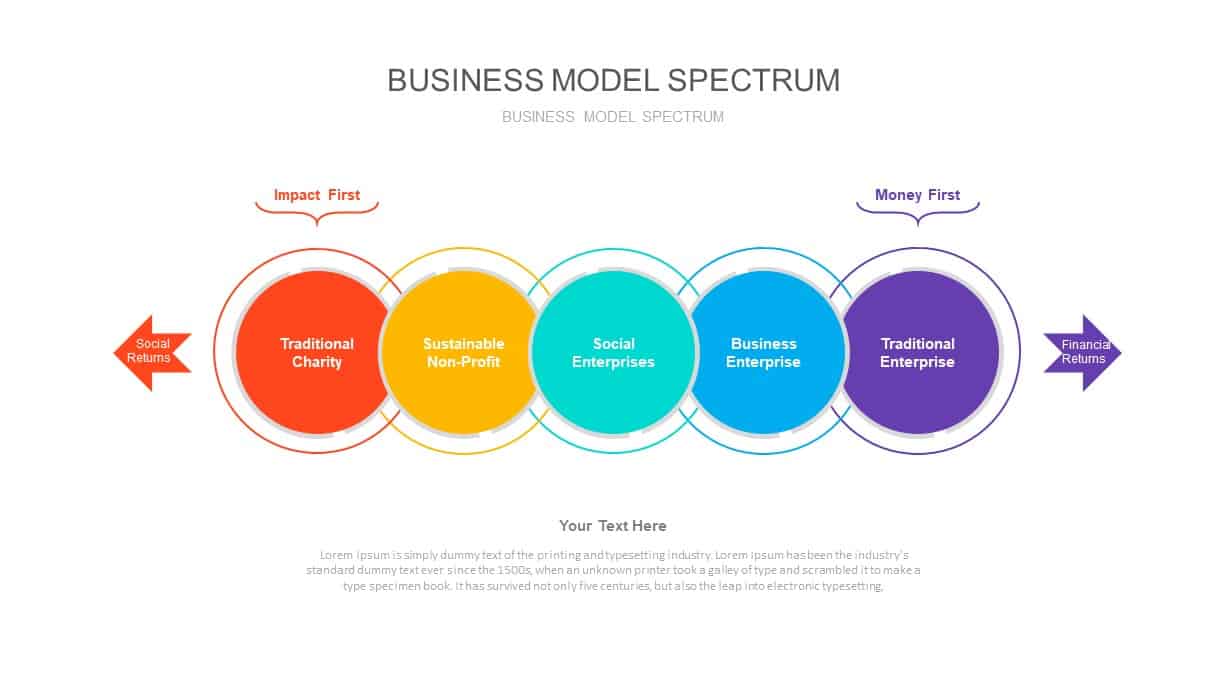
Business Model Spectrum Diagram Pack for PowerPoint & Google Slides
Business Models
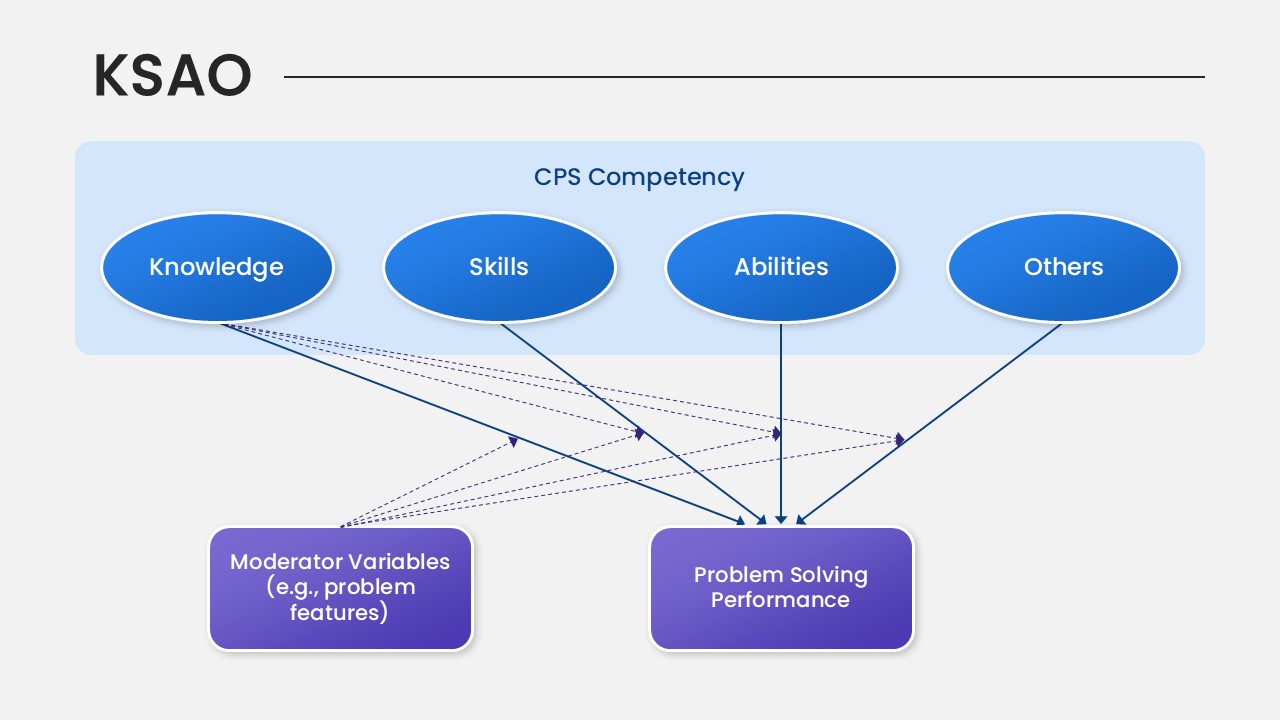
KSAO Model PowerPoint Template for PowerPoint & Google Slides
Business Strategy
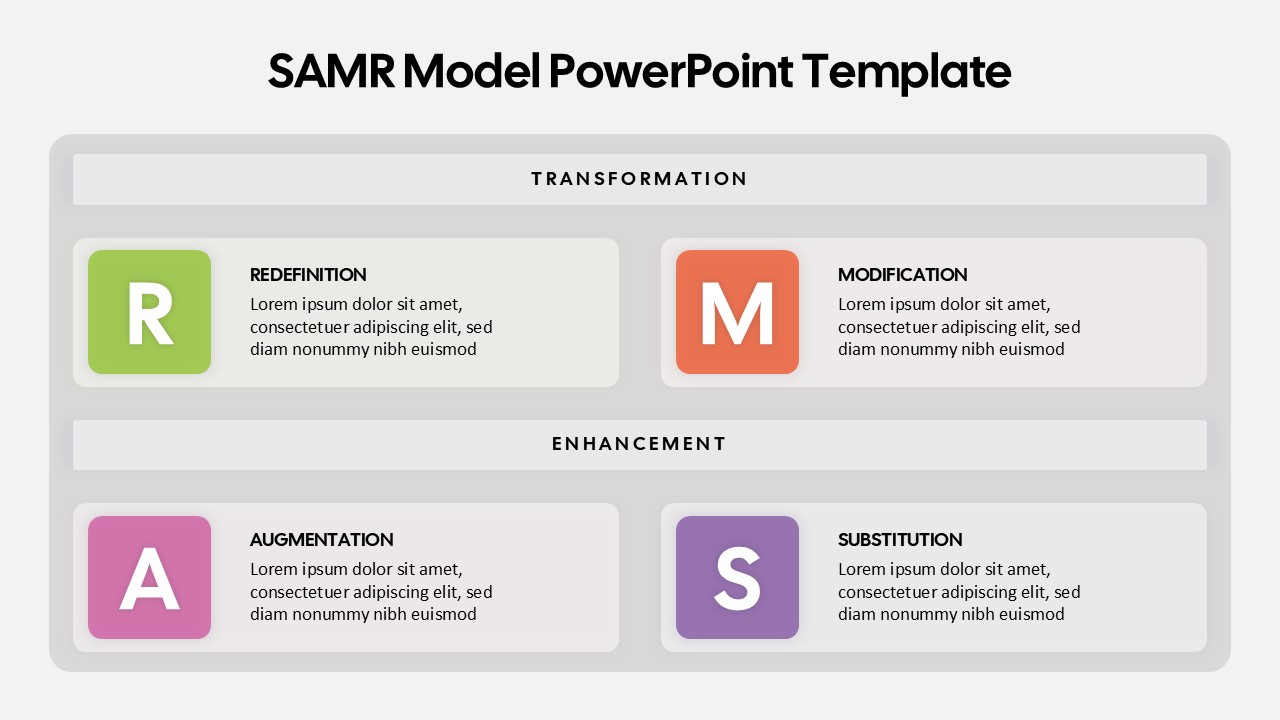
SAMR Model PowerPoint Template for PowerPoint & Google Slides
Business
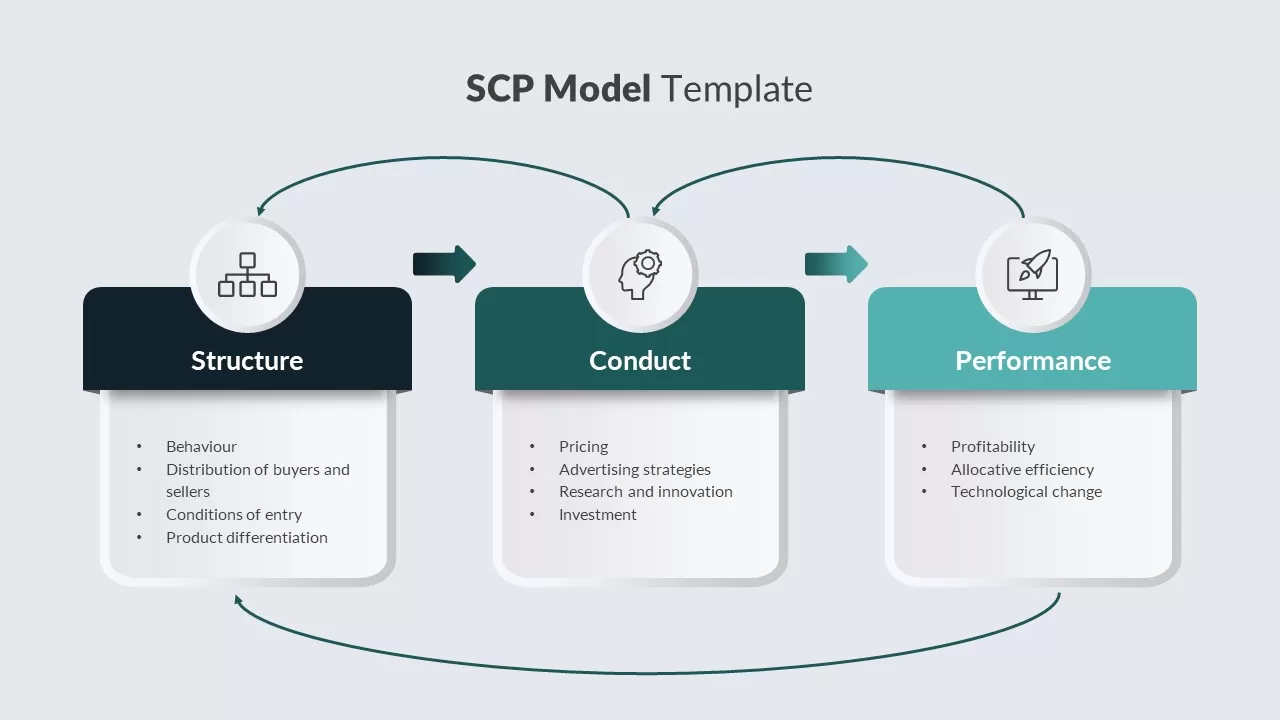
SCP Model Template for PowerPoint & Google Slides
Process
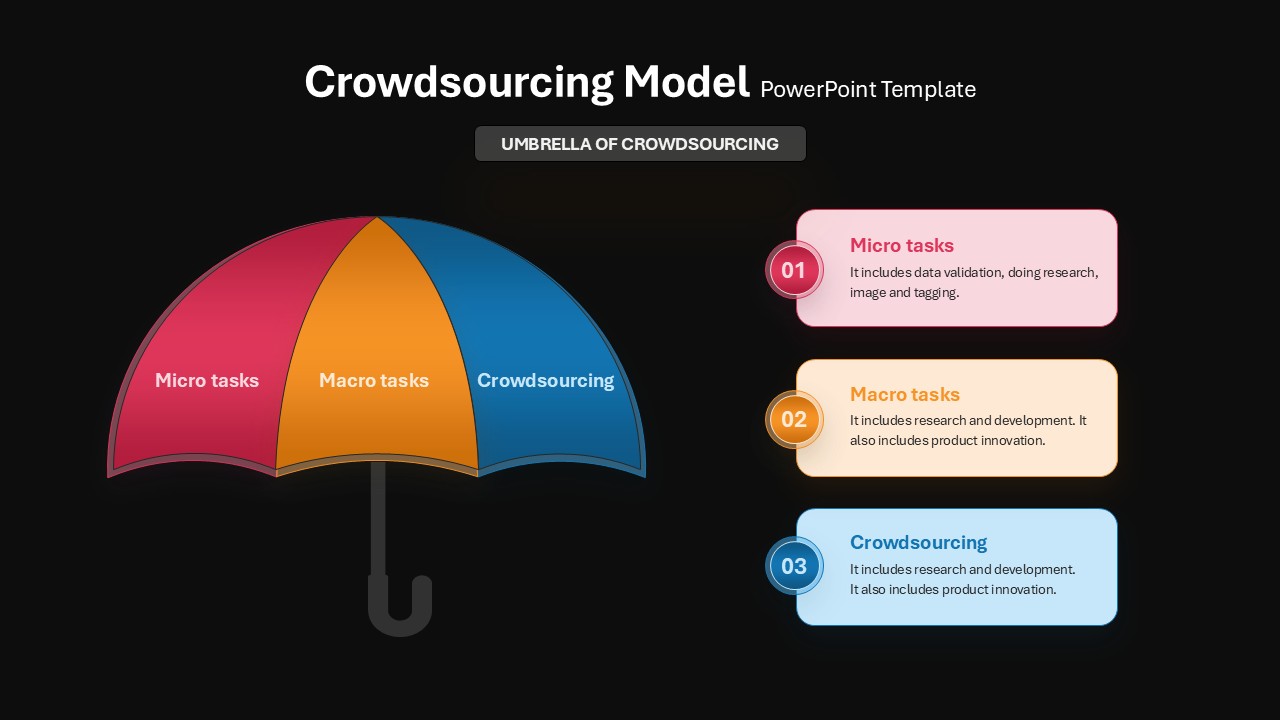
Crowdsourcing Model Umbrella & Process Template for PowerPoint & Google Slides
Infographics