Six-Process Circular Arrow Diagram Template for PowerPoint & Google Slides
Description
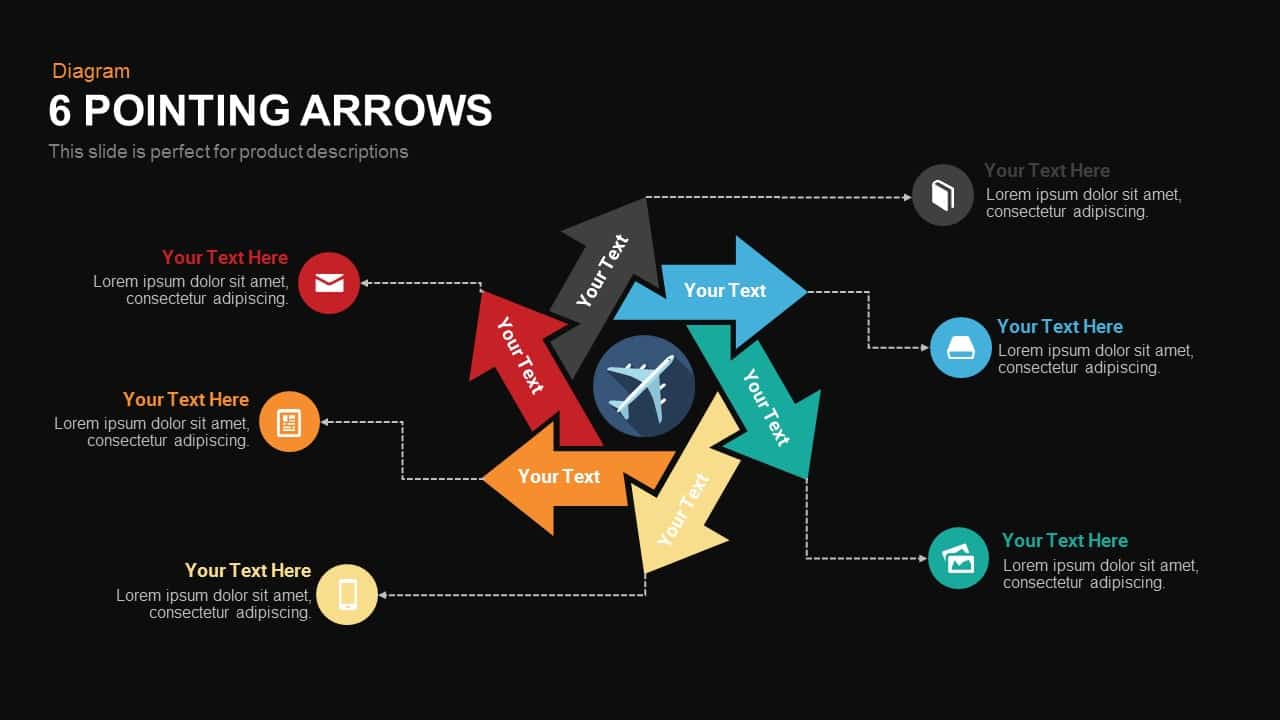
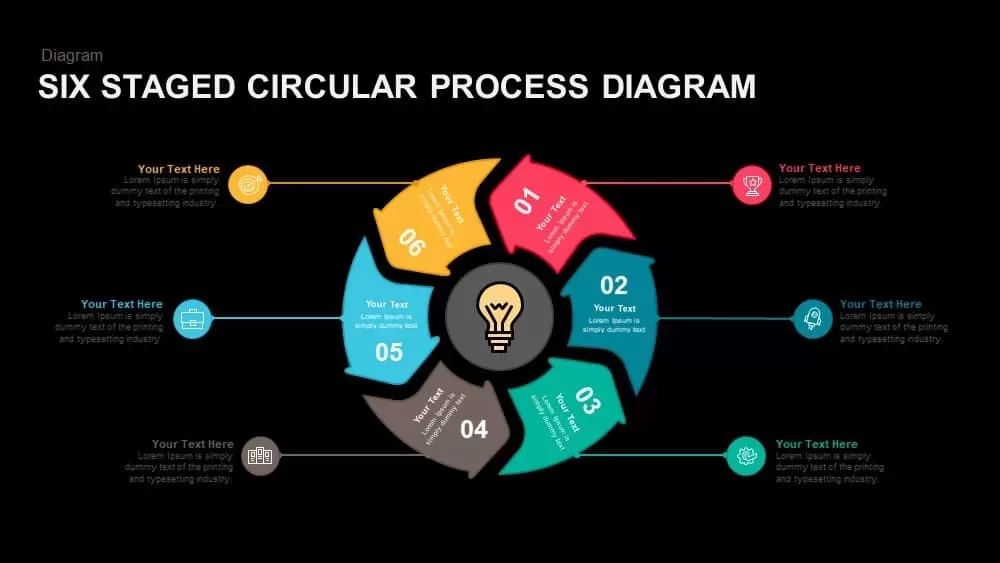
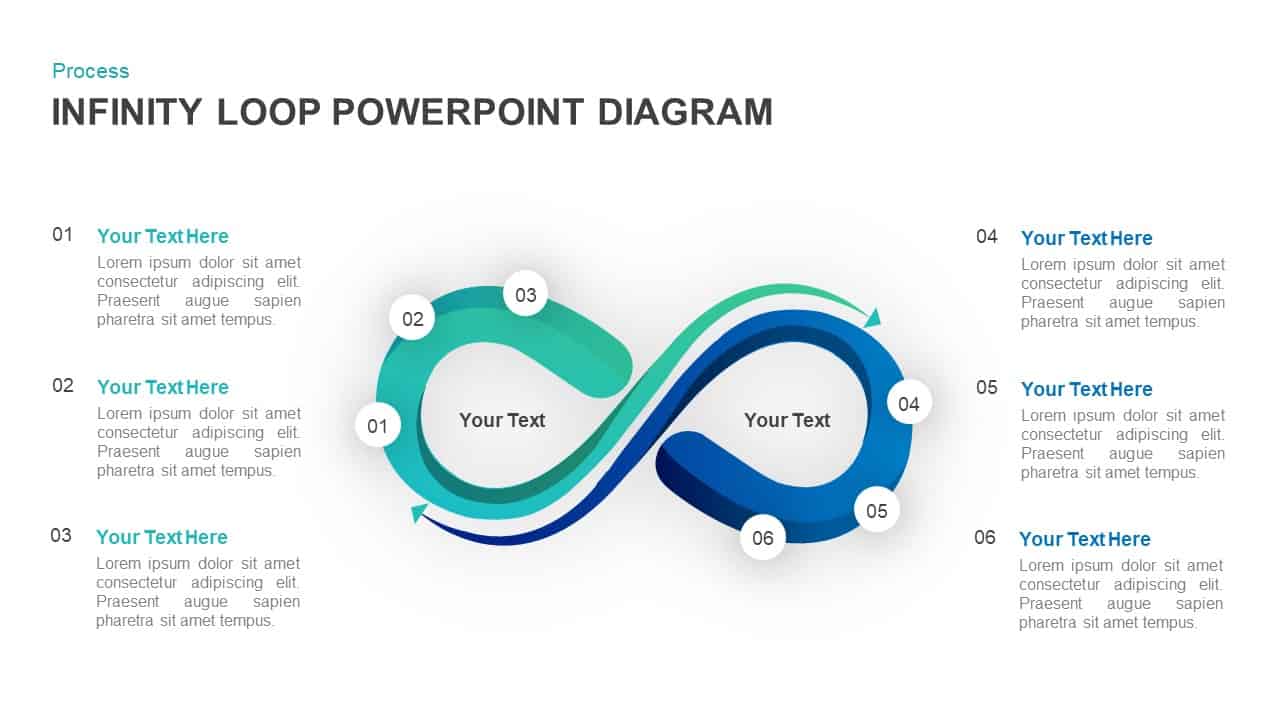
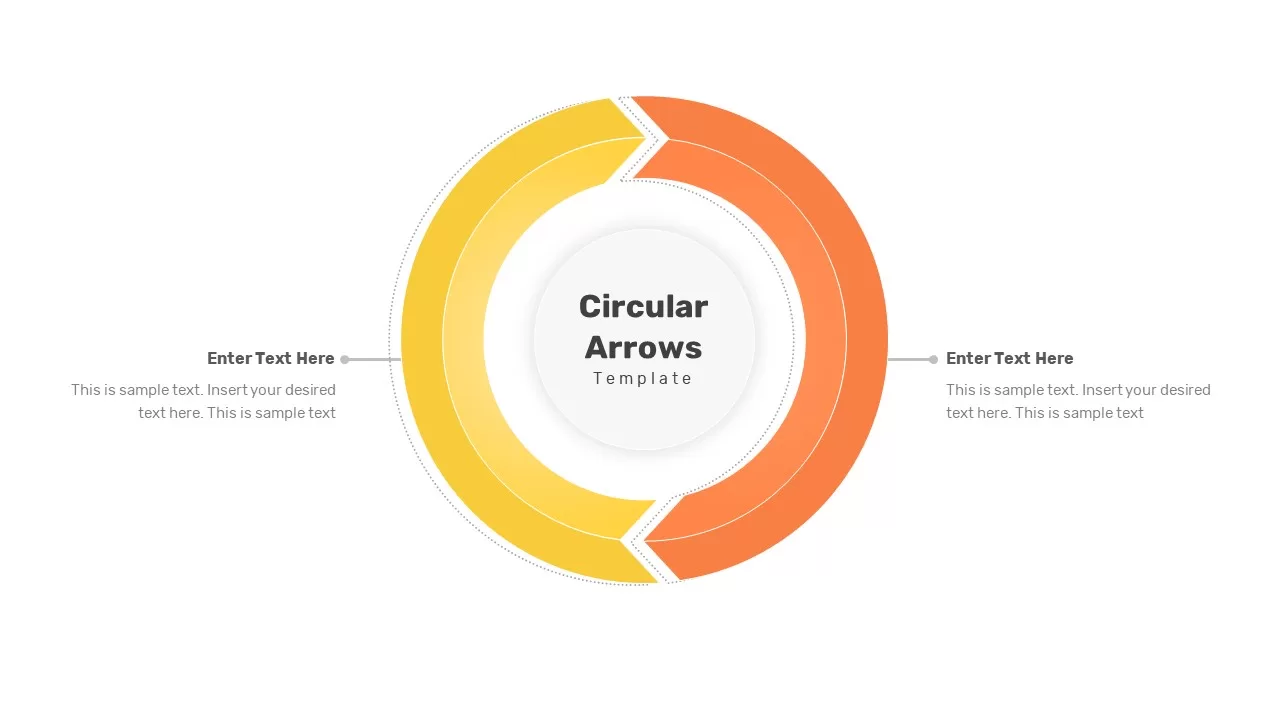
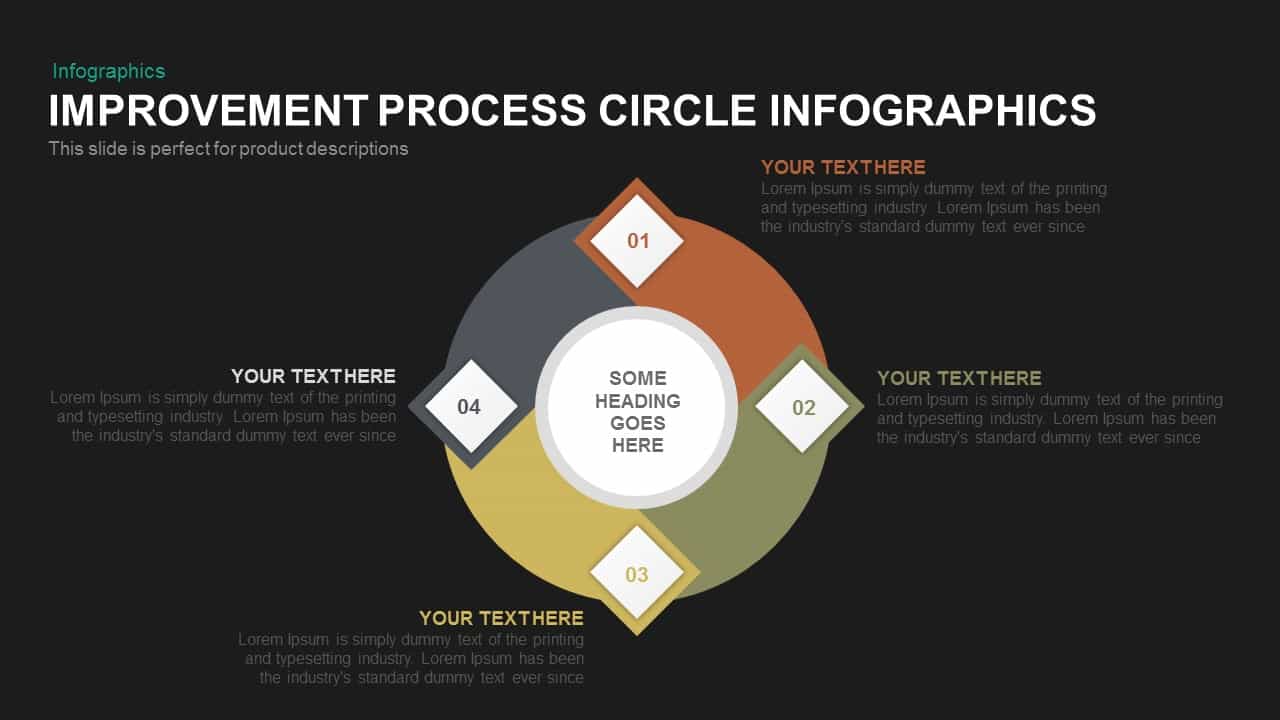
This six-segment circular arrow infographic provides a visually engaging way to map sequential processes, workflows, or project phases around a central hub. Six distinct, color-coded arrow segments—gray, navy, brown, olive, yellow, and orange—radiate clockwise from a central node, each featuring a numbered badge and icon placeholder for clear stage identification. Dotted leader lines connect each arrow to editable text blocks positioned around the perimeter, allowing you to add concise descriptions, metrics, or action items without cluttering the main diagram. Subtle drop shadows and clean sans-serif typography enhance readability and create depth on a minimalist white background.
Built entirely with vector shapes on master slides, this template lets you swap icons with drag-and-drop ease, adjust arrow widths, redefine color palettes, and update text fields in seconds. The modular design supports infinite scaling without loss of quality, ensuring perfect resolution for both on-screen presentations and printed handouts. Preconfigured sequential-reveal animations guide audience focus through each stage in turn, while theme-aware formatting allows instant palette swaps to match corporate branding or event themes.
Use this asset to visualize complex, multi-step workflows—from product development lifecycles and marketing funnels to risk-assessment cycles and customer journey maps. Duplicate or remove segments to customize the number of steps, overlay percentage metrics on numbered badges, or recolor segments to emphasize priority stages. Accessibility features include color-blind–friendly default schemes and straightforward grayscale compatibility, making this slide inclusive for all viewers.
Who is it for
Project managers, business analysts, and marketing strategists will find this infographic invaluable for outlining phased initiatives, status reports, and strategic roadmaps. Consultants, trainers, and operations leaders can also leverage its intuitive structure for stakeholder workshops and executive briefings.
Other Uses
Beyond process mapping, repurpose this diagram to illustrate feature prioritization, quarterly objectives, compliance checklists, or team role assignments. Simply swap icons, update labels, or adjust segment counts to adapt the design to any narrative.
Login to download this file

Item ID
SB00657
Related Templates

Six-Segment Circular Arrow Cycle Template for PowerPoint & Google Slides
Circular
Six-Segment Circular Arrow Infographic Template for PowerPoint & Google Slides
Circular
Six Arrow Radial Process Diagram template for PowerPoint & Google Slides
Infographics
Six Pointing Arrow Process Diagram Template for PowerPoint & Google Slides
Arrow
Free Six-Stage Arrow Process Diagram Template for PowerPoint & Google Slides
Process
Free
Six-Step Linear Arrow Process Diagram Template for PowerPoint & Google Slides
Process

Six-Stage Circular Process Diagram Template for PowerPoint & Google Slides
Process
Six-Stage Circular Diagram Process Template for PowerPoint & Google Slides
Circular
Circular Arrow Process Diagram Template for PowerPoint & Google Slides
Circular
Six-Step Two-Sided Arrow Diagram Template for PowerPoint & Google Slides
Process
Six-Stage Arrow Timeline Diagram Template for PowerPoint & Google Slides
Timeline
Six Step Creative Circular Diagram Template for PowerPoint & Google Slides
Circular
Six Steps Circular CRM Diagram Template for PowerPoint & Google Slides
Customer Journey
Six Section Circular Infographic Diagram Template for PowerPoint & Google Slides
Circular
Six-Part Core Values Circular Diagram Template for PowerPoint & Google Slides
Circular
Six-Stage Circular Cycle Diagram Template for PowerPoint & Google Slides
Process
Six Stage Circular Diagram with Icons Template for PowerPoint & Google Slides
Circular
Six Segment Hexagon Circular Diagram Template for PowerPoint & Google Slides
Circular
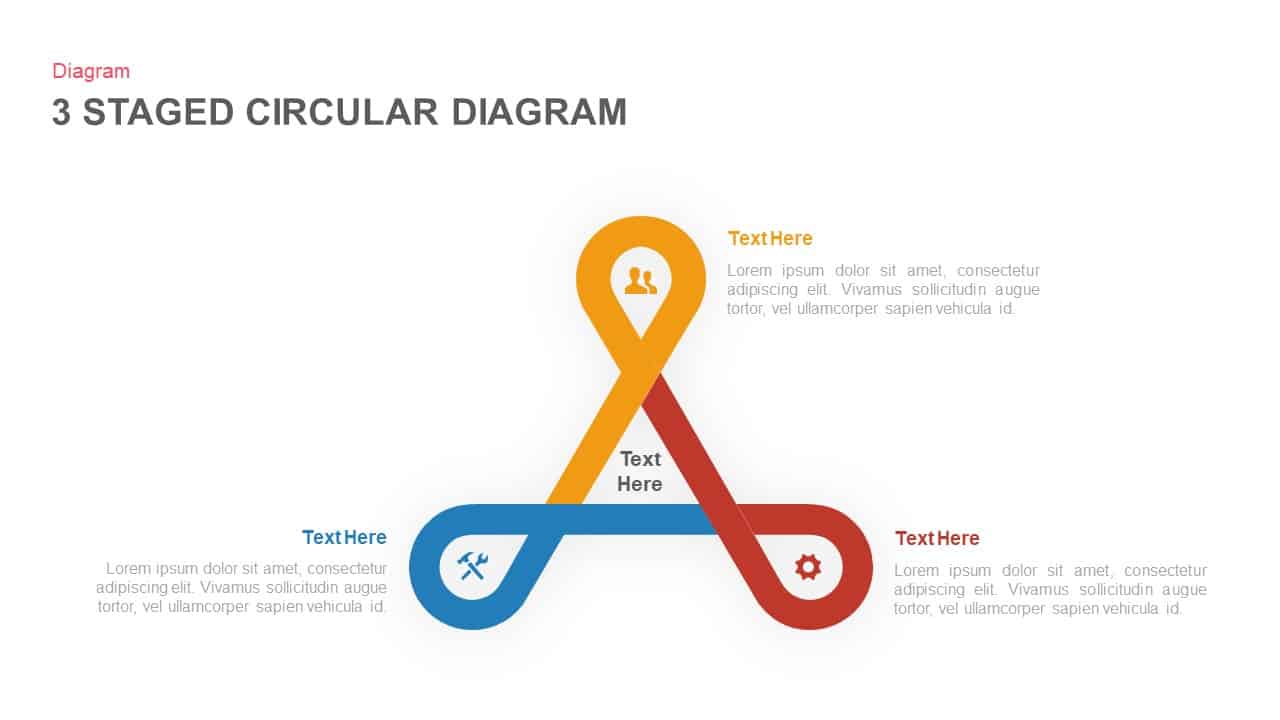
Three to Six Staged Circular Diagram Template for PowerPoint & Google Slides
Process
Six-Stage Clockwise Circular Diagram Template for PowerPoint & Google Slides
Circular
Six-Stage Circular Flow Diagram Template for PowerPoint & Google Slides
Circular
Six-Step Circular Diagram Infographics Template for PowerPoint & Google Slides
Circular
Circular 3D Cube Six-Segment Diagram Template for PowerPoint & Google Slides
Infographics
Six-Stage Time Arrow Infographics Template for PowerPoint & Google Slides
Arrow
Five-Section Circular Arrow Diagram Template for PowerPoint & Google Slides
Circular
Seven-Segment Circular Arrow Diagram Template for PowerPoint & Google Slides
Arrow

8-Step Circular Arrow Diagram Template for PowerPoint & Google Slides
Arrow
Five Stage Circular Arrow Diagram Template for PowerPoint & Google Slides
Process
Concentric Circular Arrow Cycle Diagram Template for PowerPoint & Google Slides
Process

Five Circular Flow Arrow Diagram for PowerPoint & Google Slides
Arrow
Six-Segment Circular Hub Infographic Template for PowerPoint & Google Slides
Circular
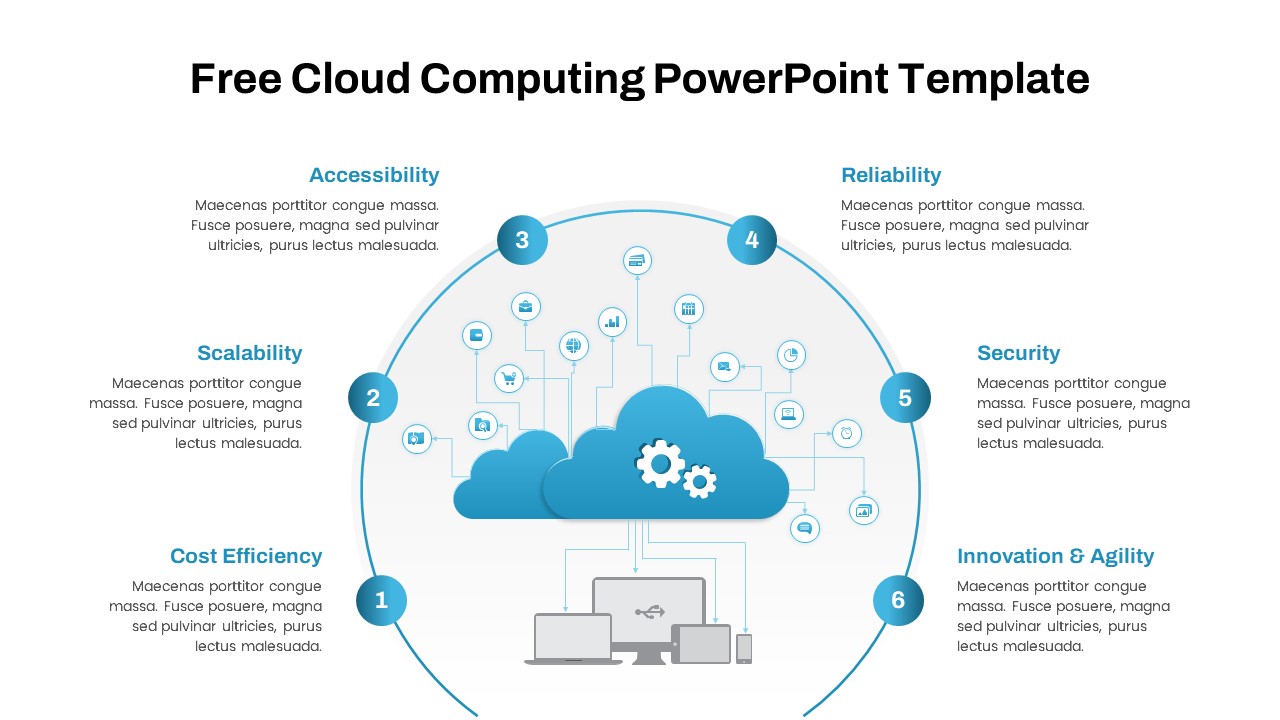
Free Cloud Computing Six-Step Circular Template for PowerPoint & Google Slides
Cloud Computing
Free
Six Hexagon Stages Process Flow Diagram Template for PowerPoint & Google Slides
Process
Six Stage Zigzag Process Diagram Template for PowerPoint & Google Slides
Process
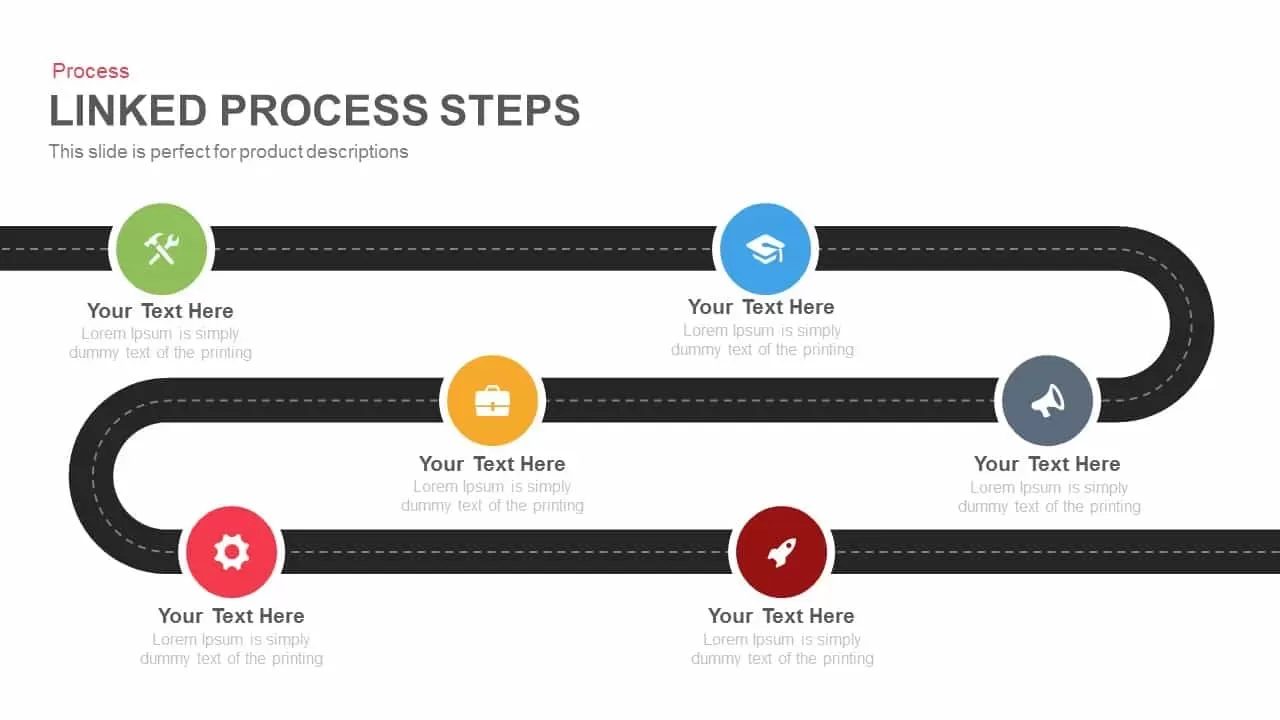
Roadmap Six-Step Process Diagram Template for PowerPoint & Google Slides
Roadmap
Six-Stage Zig-Zag Process Flow Diagram Template for PowerPoint & Google Slides
Process
Six-Sided Shutter Diagram Process Flow Template for PowerPoint & Google Slides
Process
Editable Six-Step Bubble Process Diagram Template for PowerPoint & Google Slides
Process
Six-Step Hexagon Process Diagram Template for PowerPoint & Google Slides
Process
Free Six Stage Bubble Process Diagram template for PowerPoint & Google Slides
Process
Free
Six-Stage Circle Process Diagram Template for PowerPoint & Google Slides
Process
Six-Step Vertical Process Diagram Template for PowerPoint & Google Slides
Process
Six Sigma Gear Process Diagram Template for PowerPoint & Google Slides
Process
Six-Step Hexagon Process Flow Diagram Template for PowerPoint & Google Slides
Process
Six Stage Hexagon Process Diagram Template for PowerPoint & Google Slides
Process
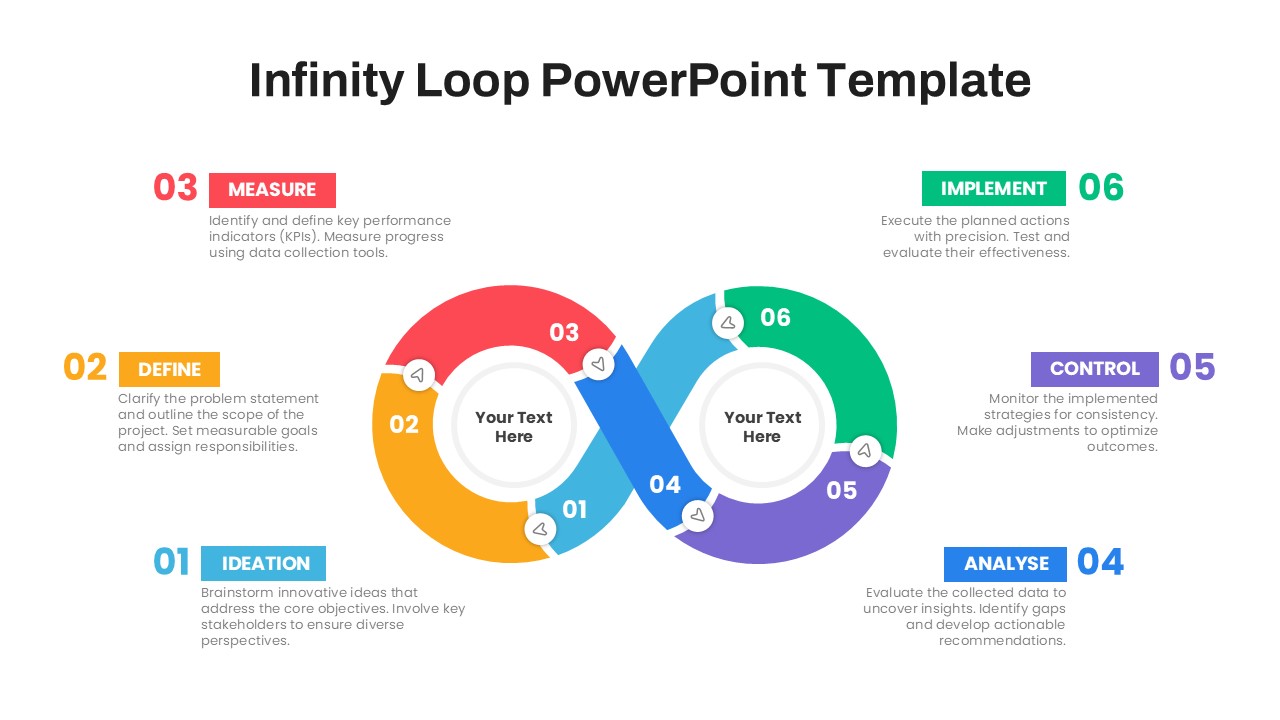
Six-Stage Infinity Loop Process Diagram Template for PowerPoint & Google Slides
Process
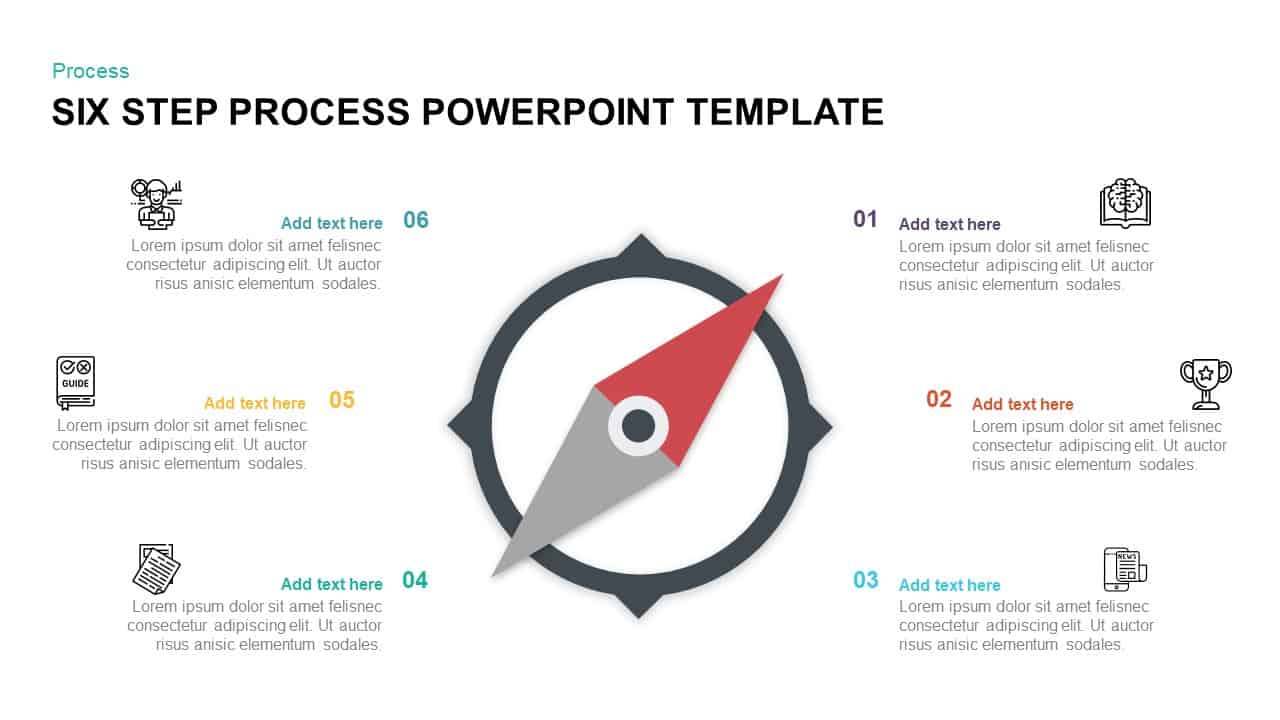
Compass-Themed Six-Step Process Diagram Template for PowerPoint & Google Slides
Process
Six-Step Infinity Loop Process Diagram Template for PowerPoint & Google Slides
Process
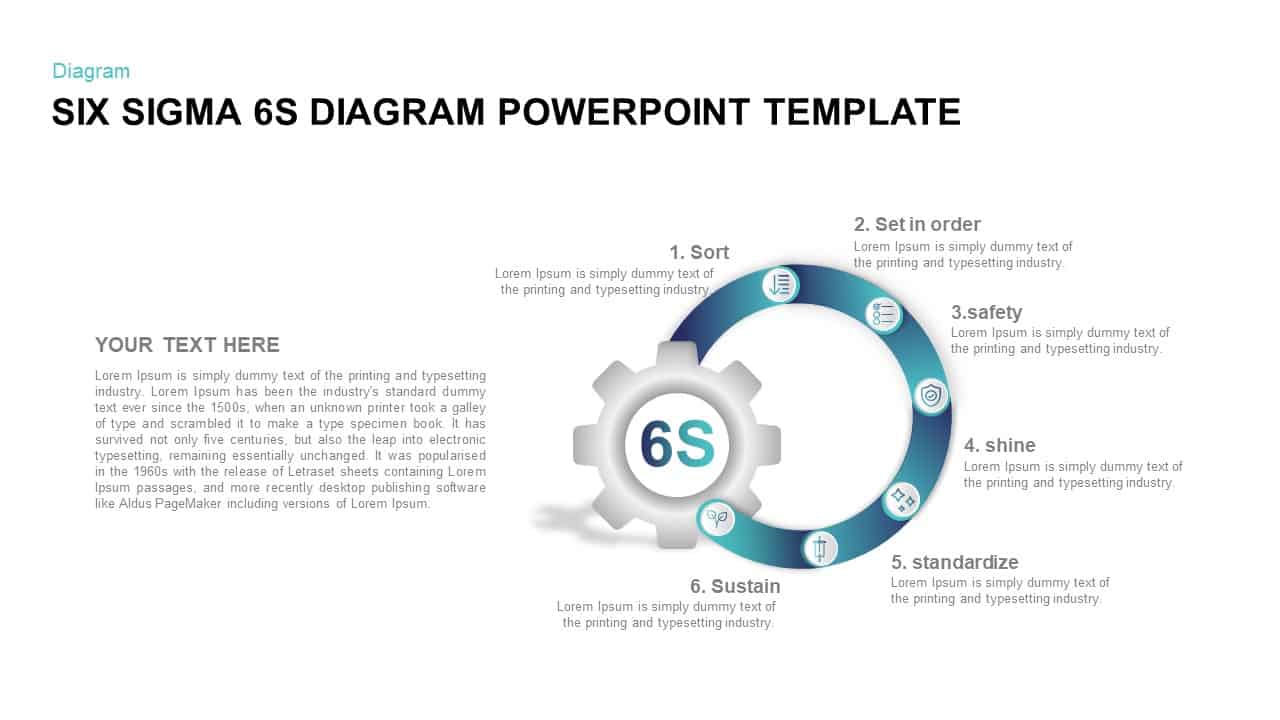
Six Sigma 6S Process Infographic Diagram Template for PowerPoint & Google Slides
Process
Six Sigma 6S Process Diagram Template for PowerPoint & Google Slides
Process
Six-Circle Process Infographic Diagram Template for PowerPoint & Google Slides
Circular

Six-Step Output Process Diagram Template for PowerPoint & Google Slides
Process
Animated Six-Stage 3D Process Diagram Template for PowerPoint & Google Slides
Arrow
Six-Point Star Process Diagram Template for PowerPoint & Google Slides
Process
3D Arrow Infographics Circular Flow Template for PowerPoint & Google Slides
Arrow
Dual-Stage Circular Arrow Cycle Template for PowerPoint & Google Slides
Process
Three-Segment Circular Arrow Cycle Template for PowerPoint & Google Slides
Circular
Four-Segment Circular Arrow Cycle Template for PowerPoint & Google Slides
Circular
Five-Stage Circular Arrow Infographic Template for PowerPoint & Google Slides
Circular
5 Arrow Process Diagram Template for PowerPoint & Google Slides
Infographics
6-Step Arrow Process Diagram Template for PowerPoint & Google Slides
Process
Colorful Arrow Process Diagram Template for PowerPoint & Google Slides
Arrow
Arrow Process Diagram Template for PowerPoint & Google Slides
Process
Three Circle Arrow Process Diagram template for PowerPoint & Google Slides
Circular
3D Sphere Arrow Process Diagram template for PowerPoint & Google Slides
Arrow

Three Stage 3D Arrow Process Diagram Template for PowerPoint & Google Slides
Process
Arrow Stage Process Diagram template for PowerPoint & Google Slides
Arrow
Seven-Stage Arrow Process Diagram Template for PowerPoint & Google Slides
Process

8 Steps Arrow Process Diagram template for PowerPoint & Google Slides
Process
Elegant Process Support Arrow Diagram Template for PowerPoint & Google Slides
Arrow
Five-Stage Cyclic Process Arrow Diagram Template for PowerPoint & Google Slides
Process
Three-Way Decision Process Arrow Diagram Template for PowerPoint & Google Slides
Arrow
Curved Arrow Process Flow Diagram Template for PowerPoint & Google Slides
Process
Curved Arrow Process Flow Diagram Template for PowerPoint & Google Slides
Arrow
Three-Step Curved Arrow Process Diagram Template for PowerPoint & Google Slides
Arrow
Pentagon Arrow Process Diagram Template for PowerPoint & Google Slides
Process
Arrow Process Diagram for PowerPoint & Google Slides
Process
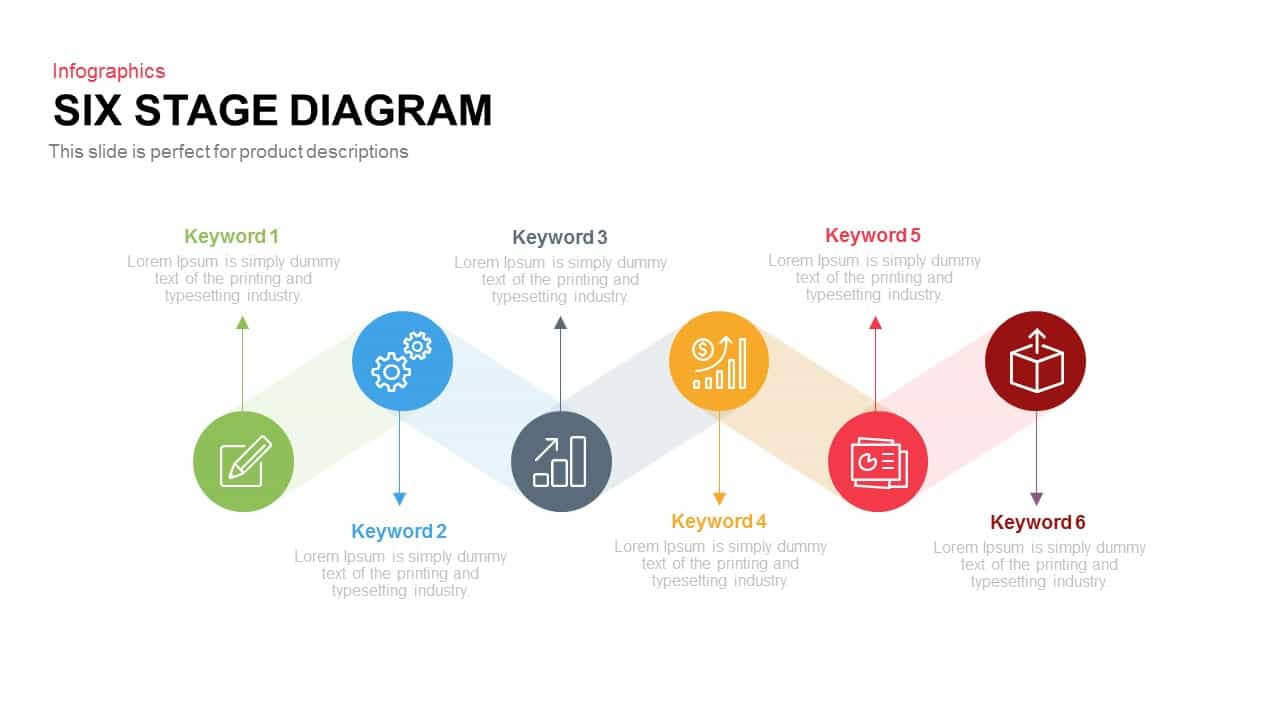
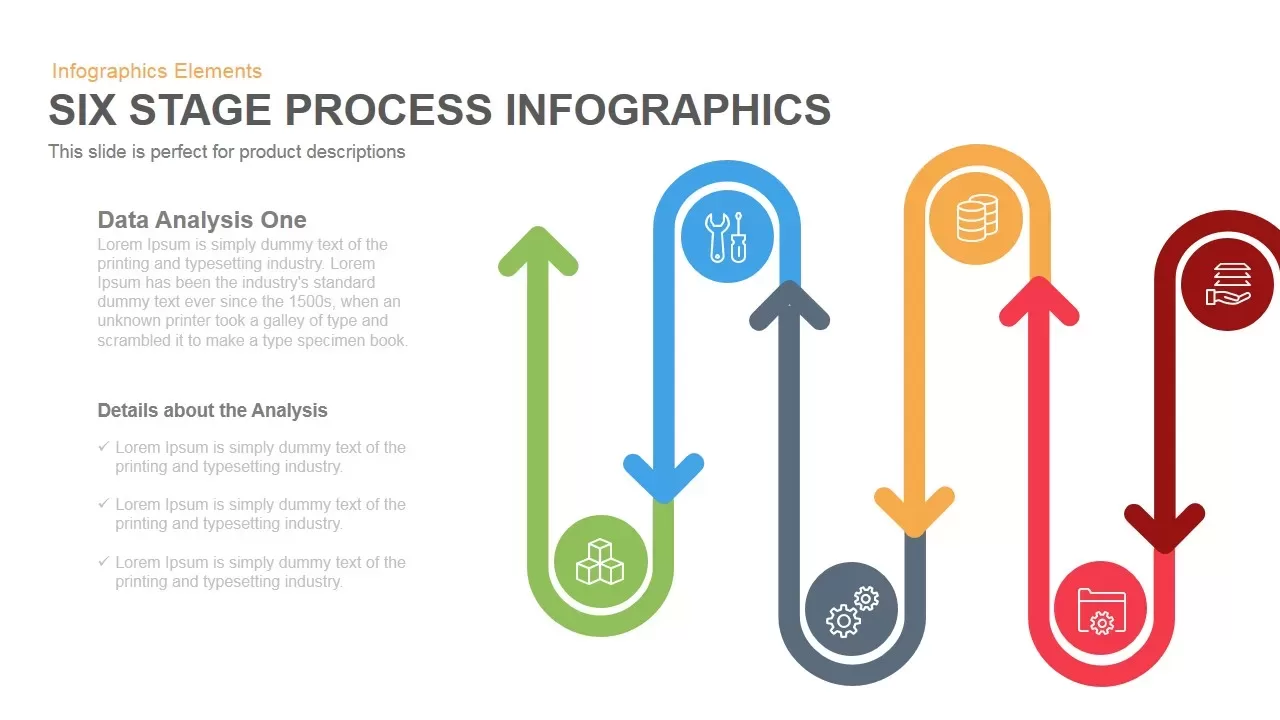
Six-Stage Process Infographics Template for PowerPoint & Google Slides
Process
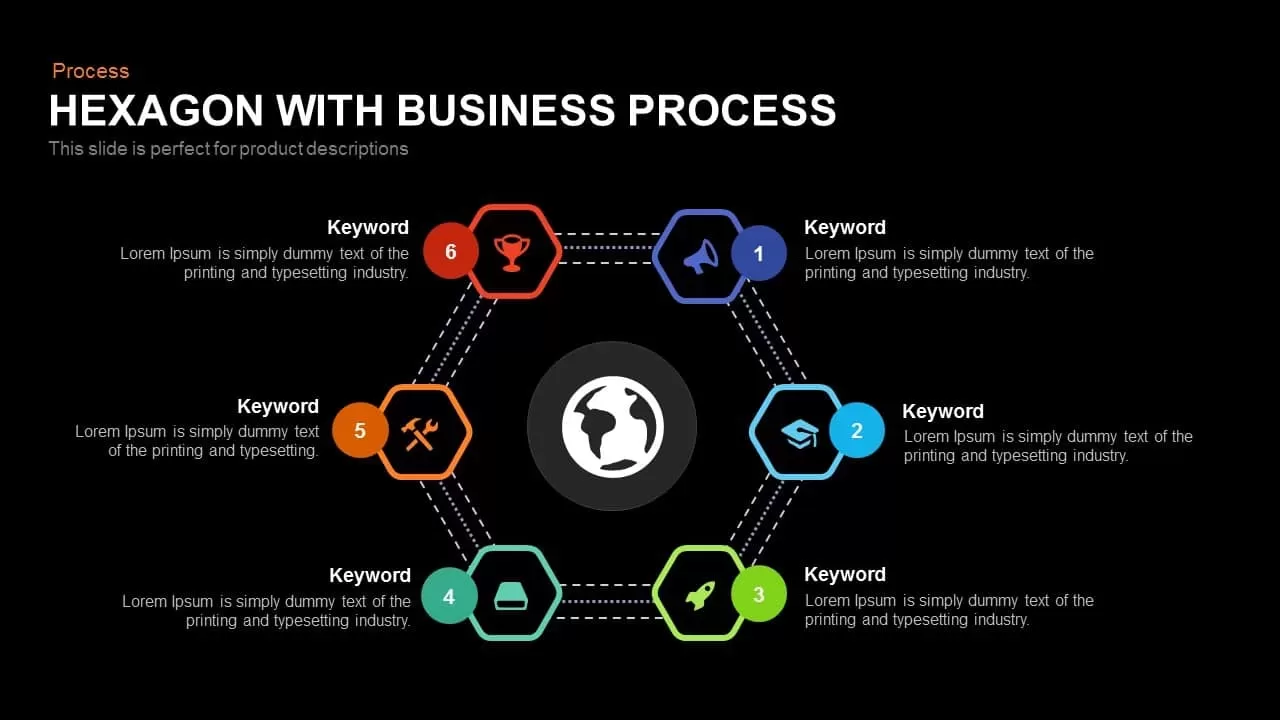
Global Hexagon Six-Step Business Process Template for PowerPoint & Google Slides
Process
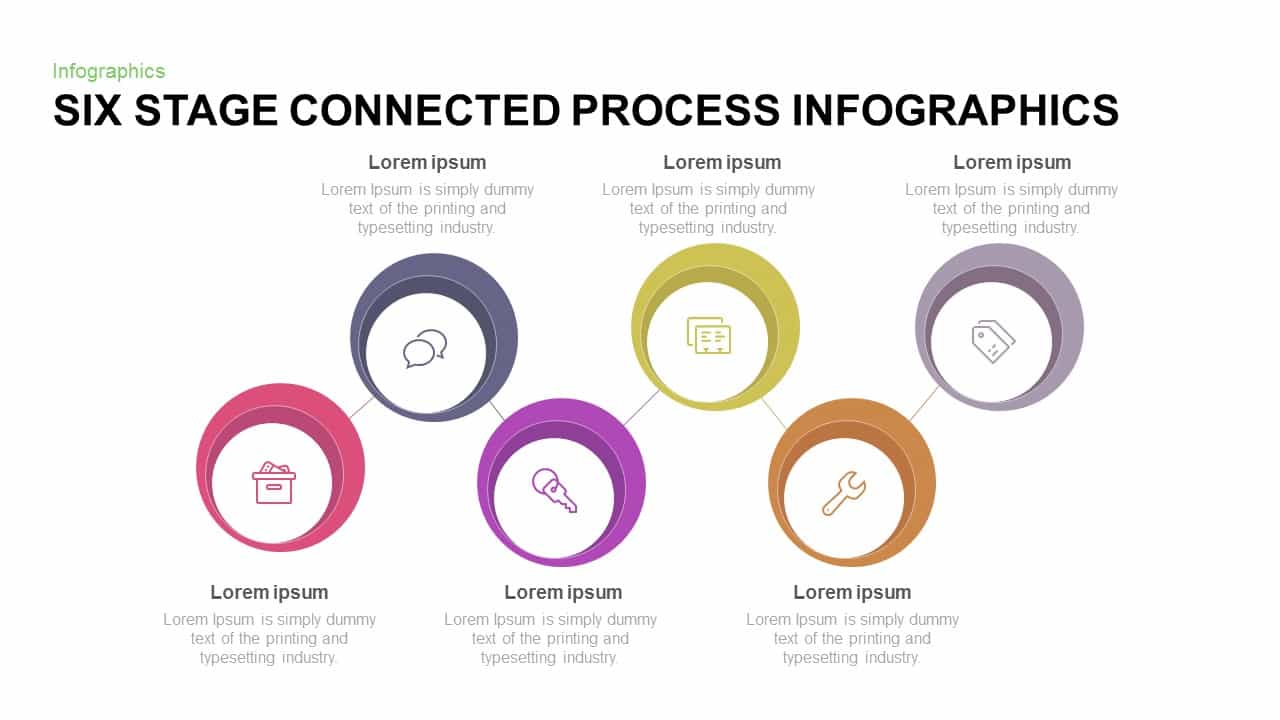
Six-Stage Connected Process Infographics Template for PowerPoint & Google Slides
Process
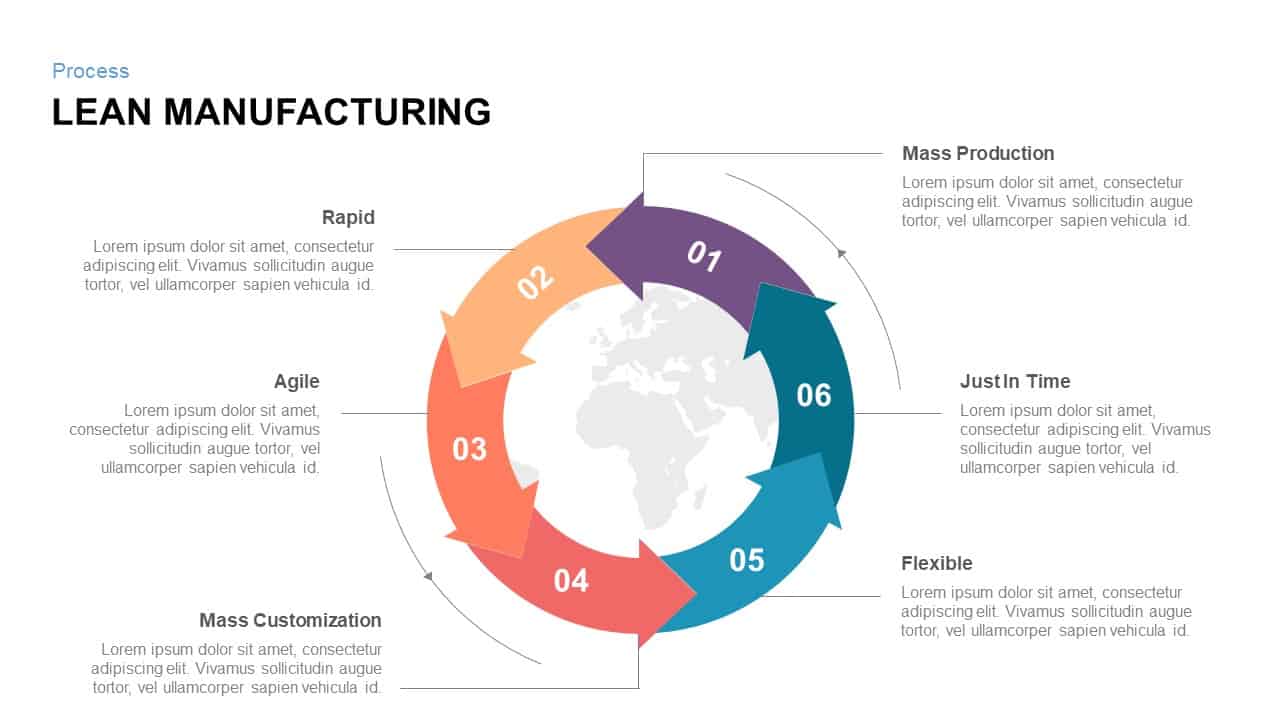
Six-Step Lean Manufacturing Process Template for PowerPoint & Google Slides
Process
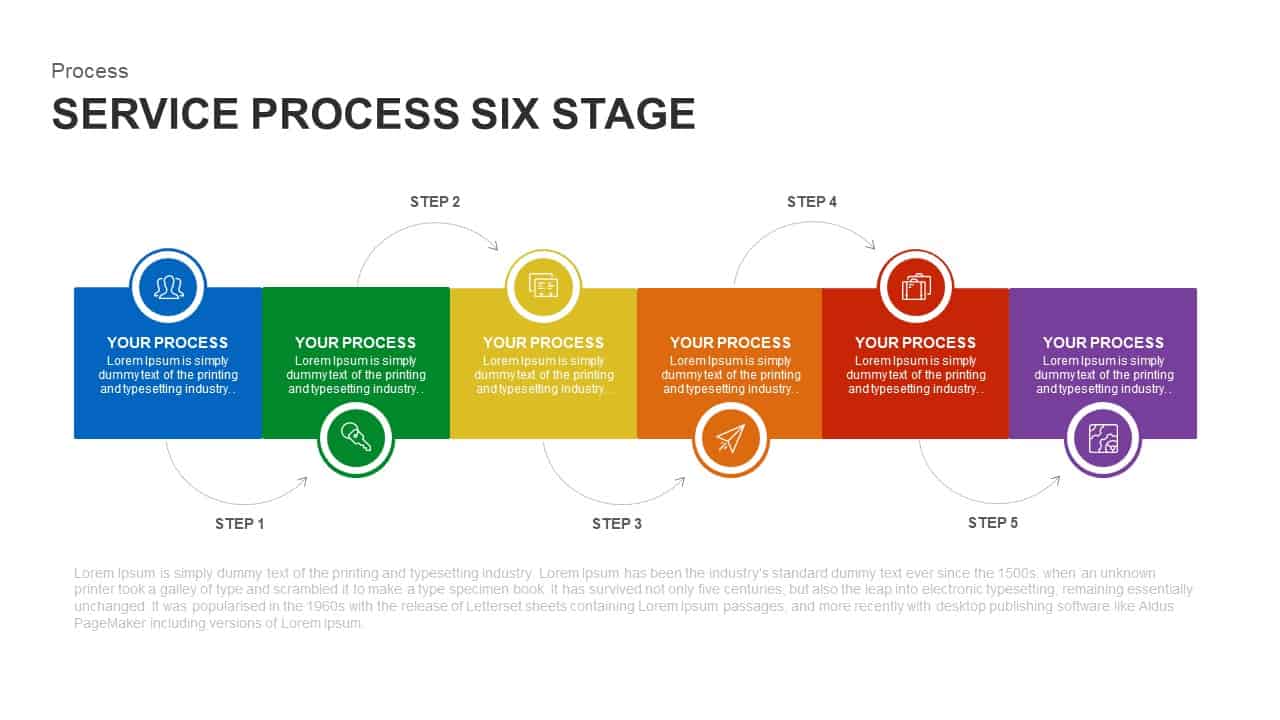
Six-Stage Service Process Workflow Template for PowerPoint & Google Slides
Process
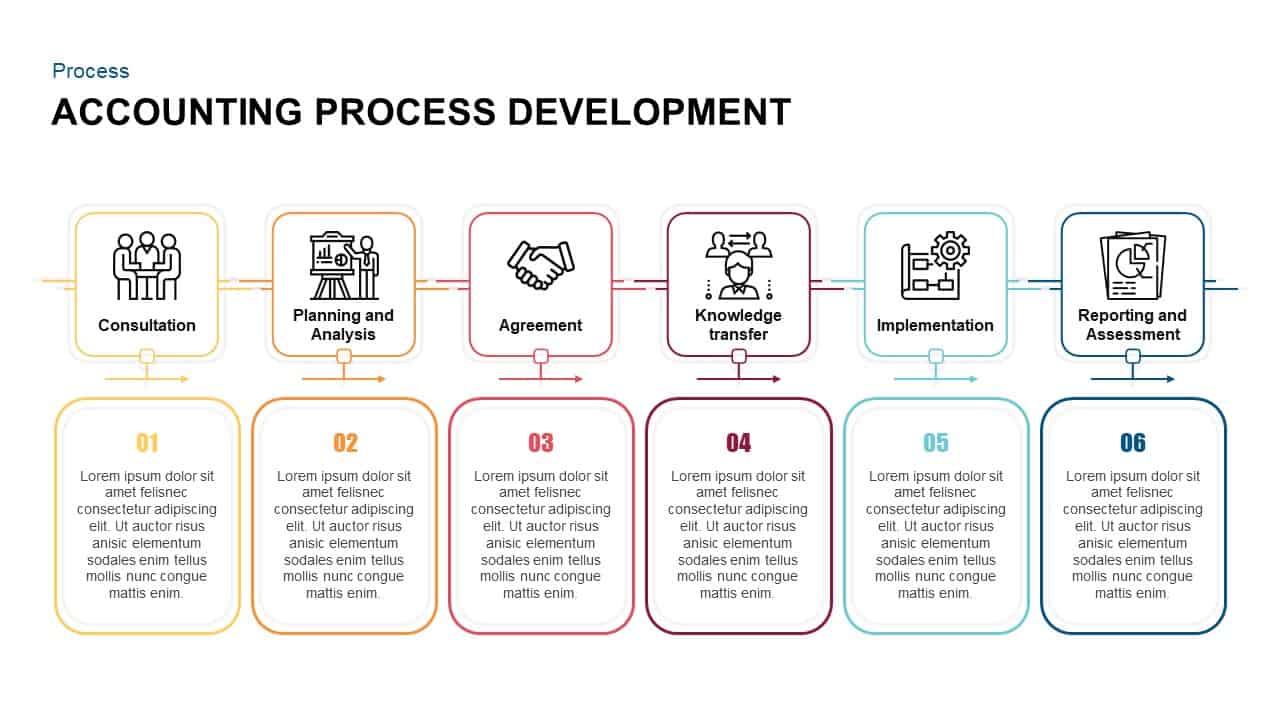
Six-Step Accounting Process Development Template for PowerPoint & Google Slides
Process
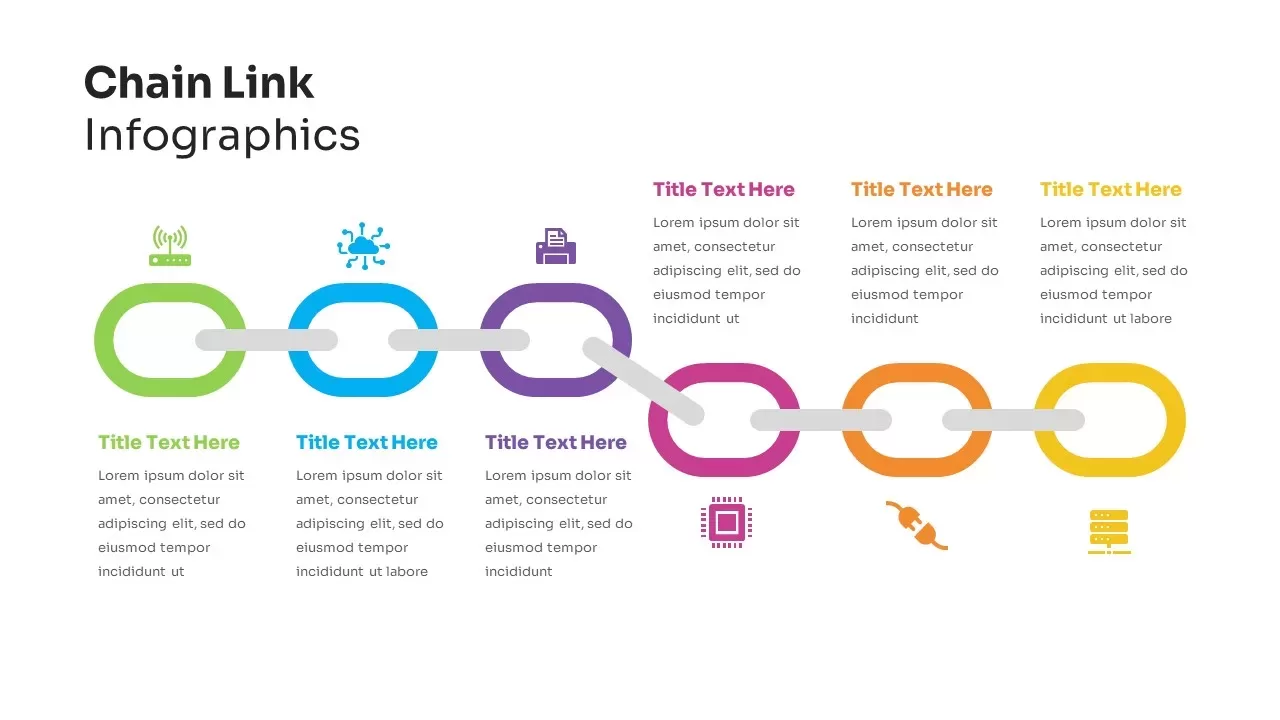
Six-Step Chain Link Technology Process Template for PowerPoint & Google Slides
Process
Six-Stage Pyramid Process Slide Template for PowerPoint & Google Slides
Pyramid
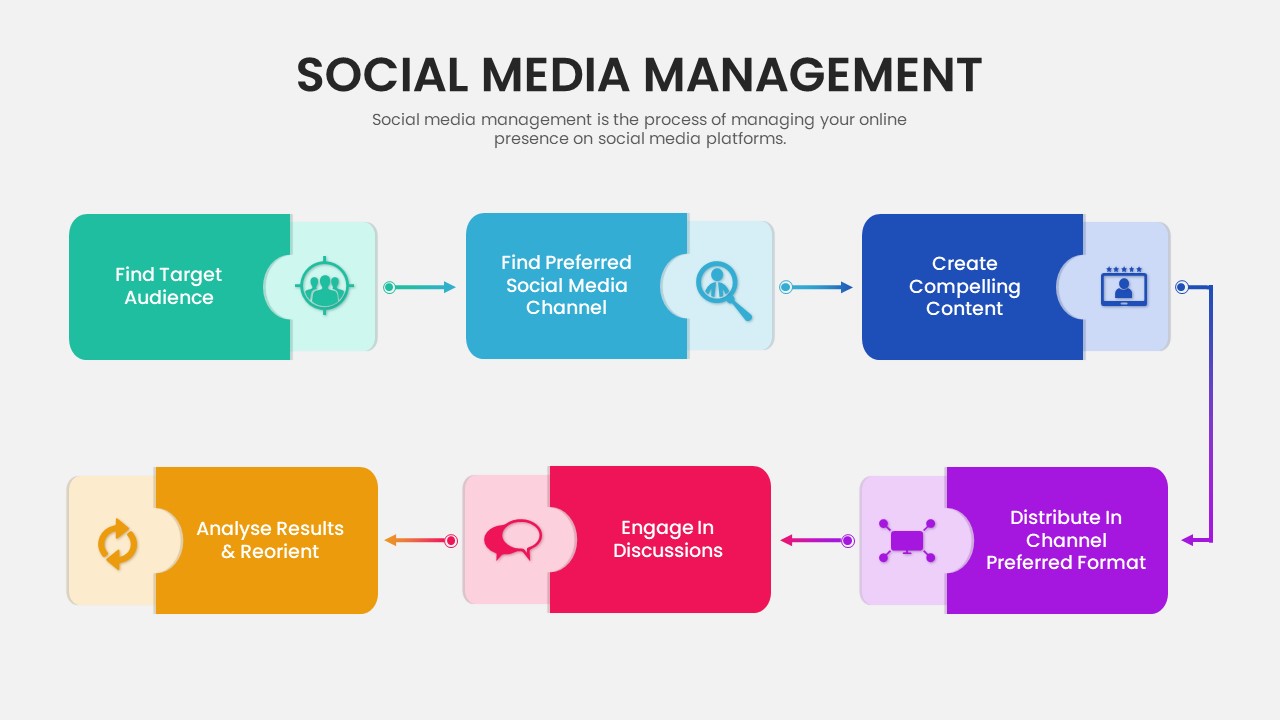
Six-Step Social Media Management Process Template for PowerPoint & Google Slides
Process
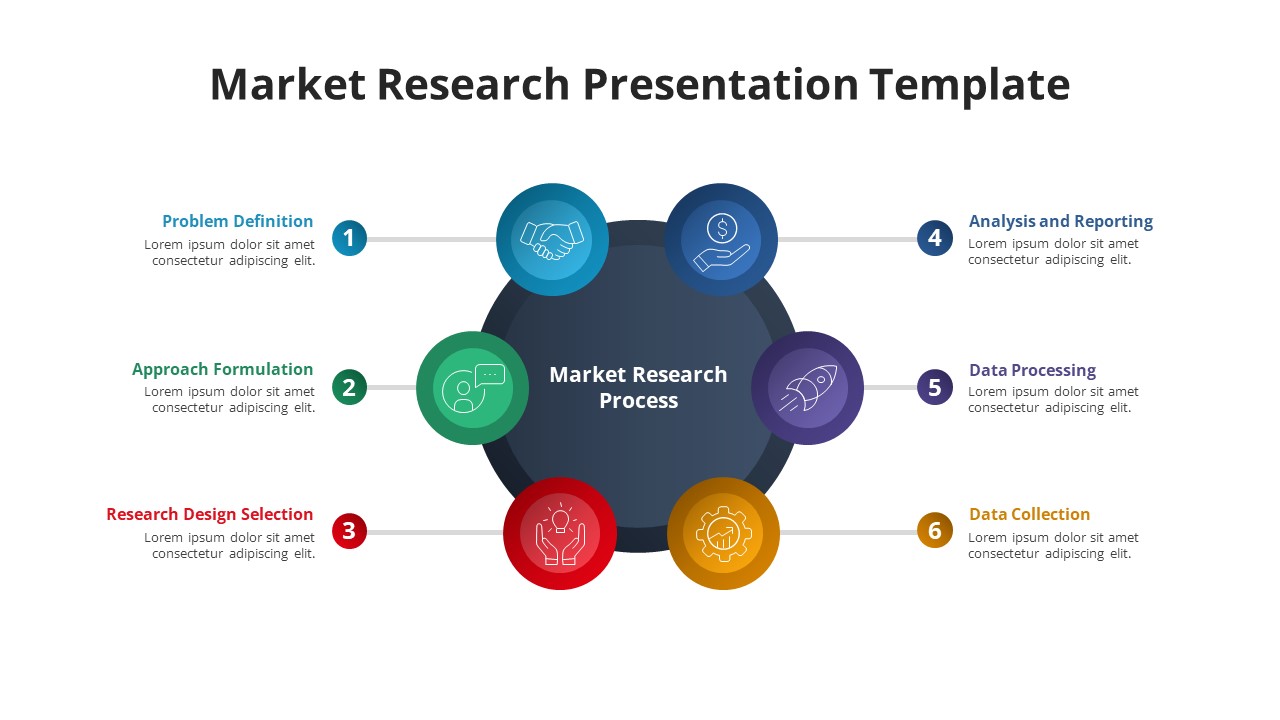
Free Six-Phase Market Research Process Template for PowerPoint & Google Slides
Process
Free
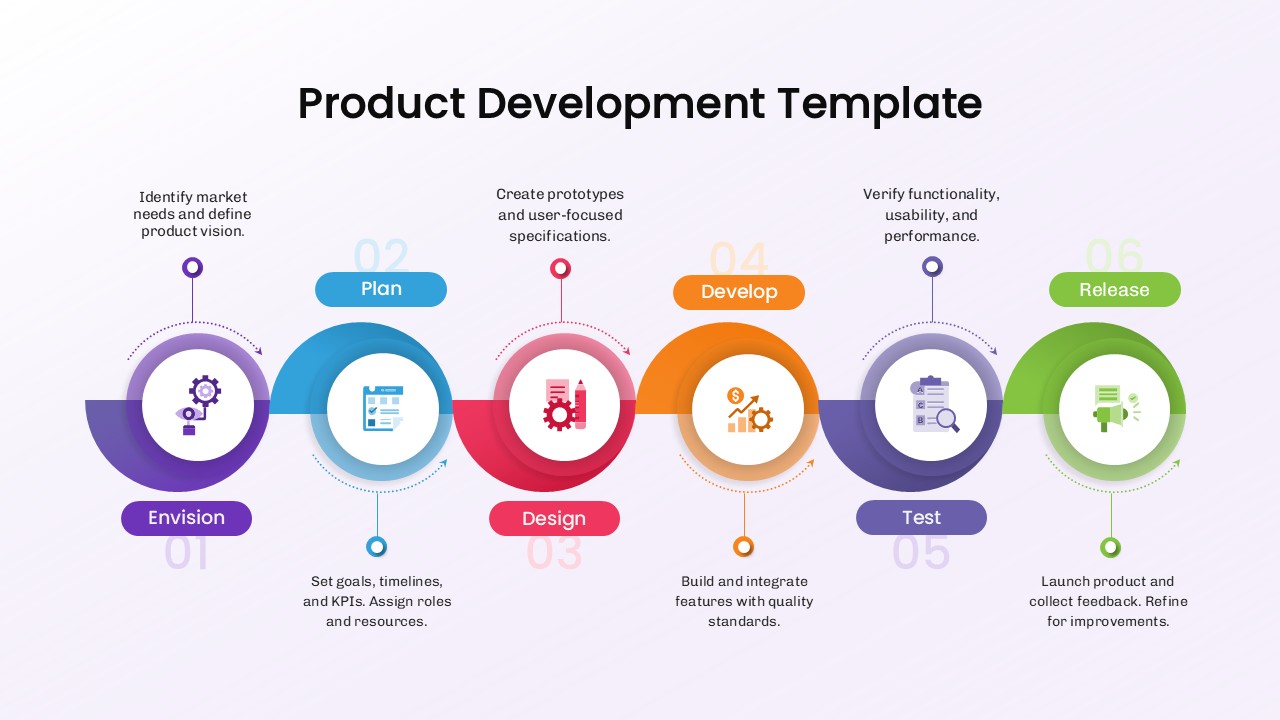
Six Stage Product Development Process Template for PowerPoint & Google Slides
Software Development
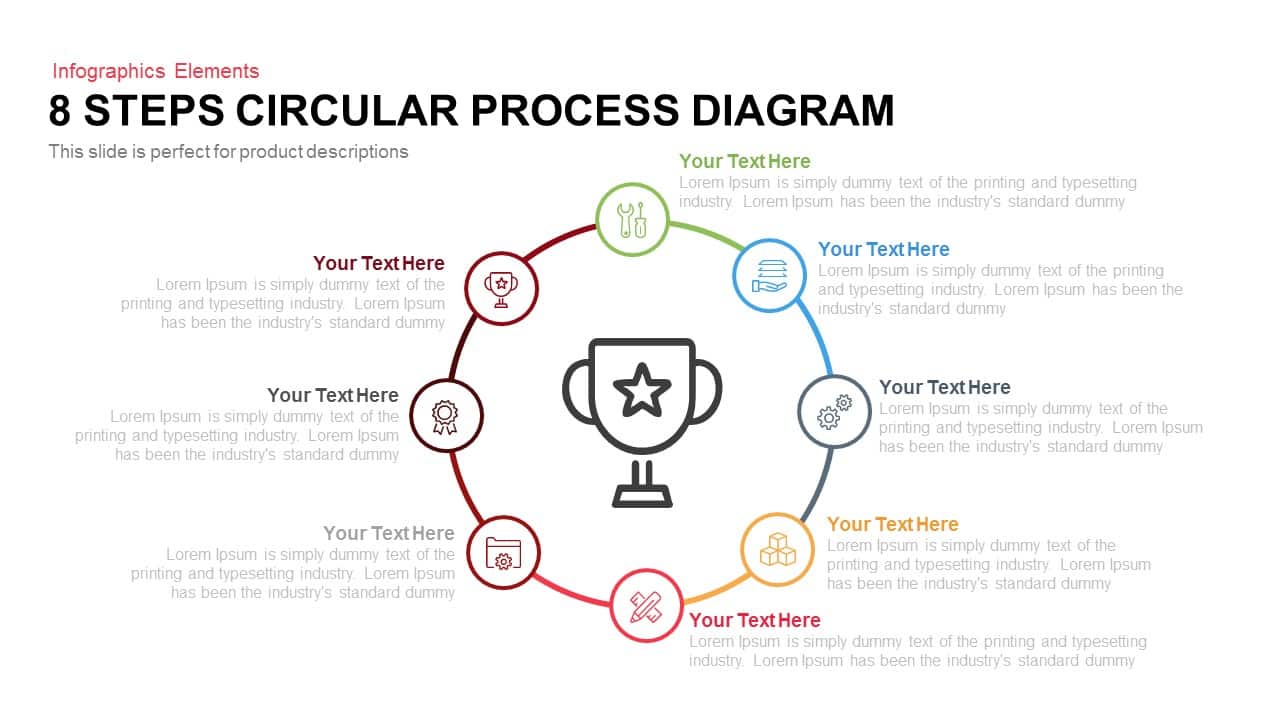
8 Steps Circular Process Diagram Template for PowerPoint & Google Slides
Process
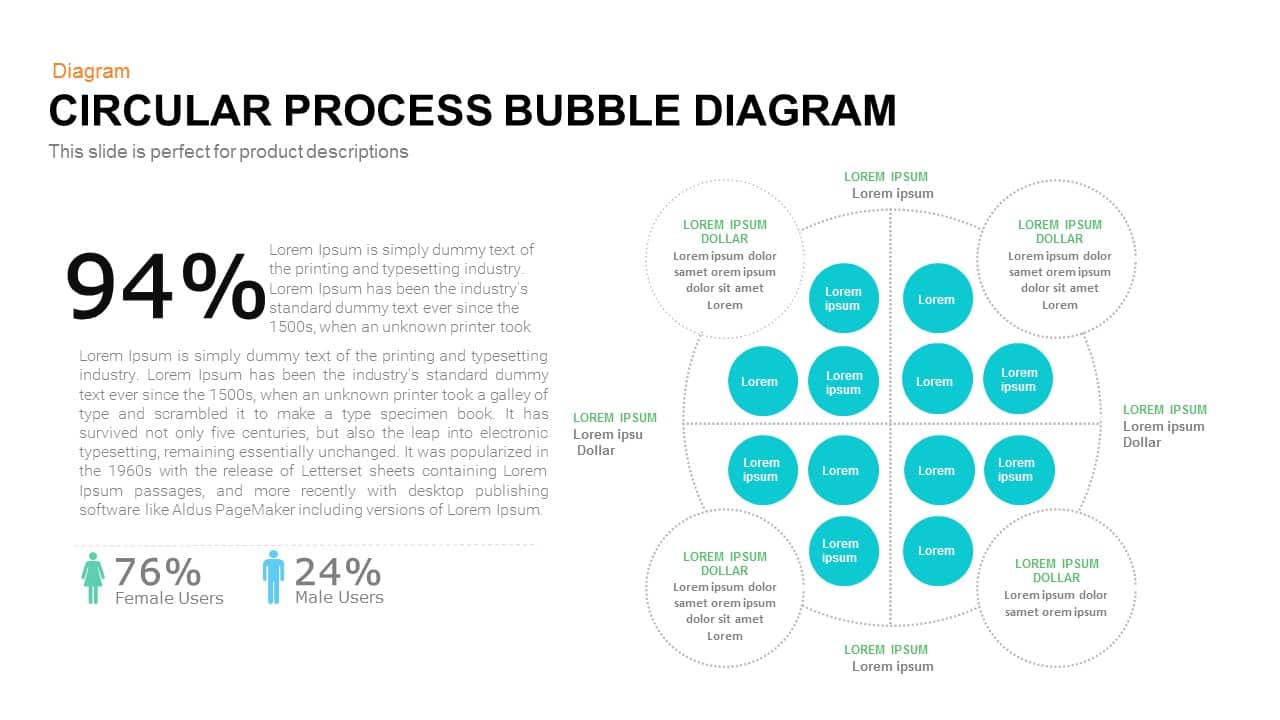
Bubble Circular Process Diagram Template for PowerPoint & Google Slides
Process
Circular Improvement Process Diagram Template for PowerPoint & Google Slides
Process
9-Step Circular Arrows Process Diagram Template for PowerPoint & Google Slides
Process
4 Staged Circular Business Process Diagram template for PowerPoint & Google Slides
Process
Circular CRM Process Diagram Infographic Template for PowerPoint & Google Slides
Circular
Value Chain Circular Process Diagram Template for PowerPoint & Google Slides
Business Models
10-Step Circular Process Diagram Template for PowerPoint & Google Slides
Process
10 Step Circular Process Diagram Template for PowerPoint & Google Slides
Circular
Negotiation Process Circular Diagram Template for PowerPoint & Google Slides
Circular
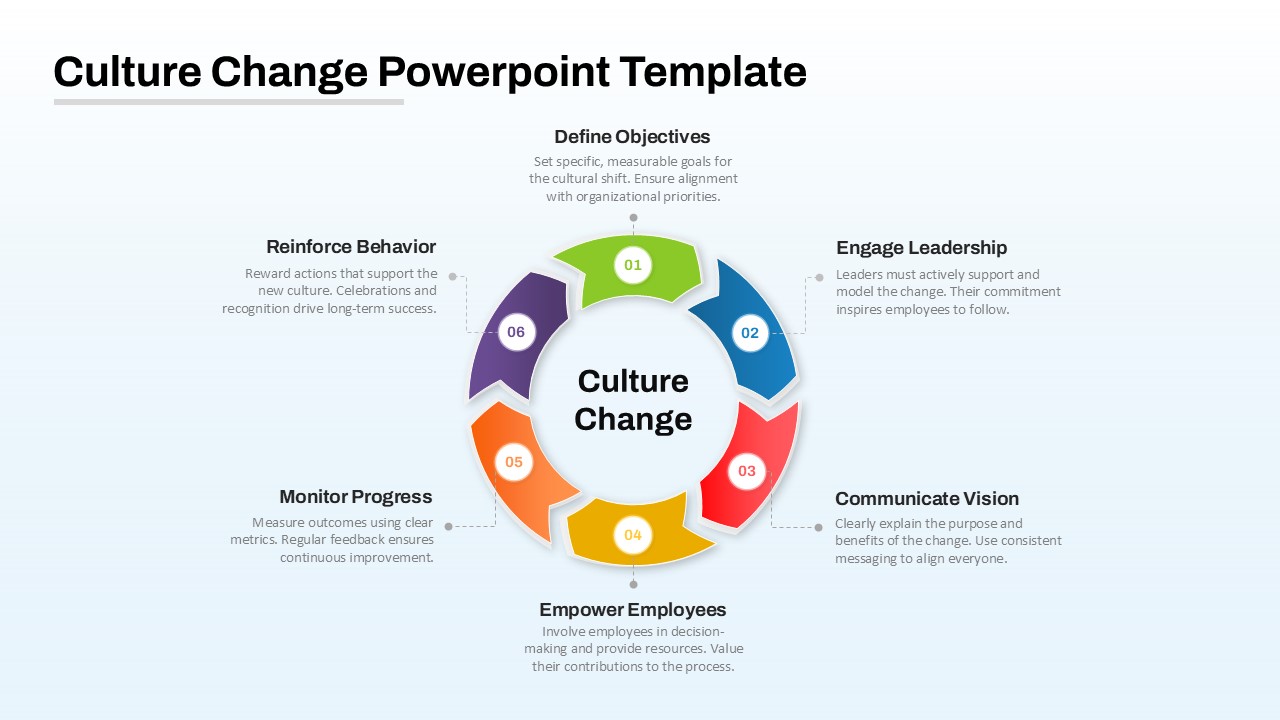
Culture Change Circular Process Diagram Template for PowerPoint & Google Slides
Process
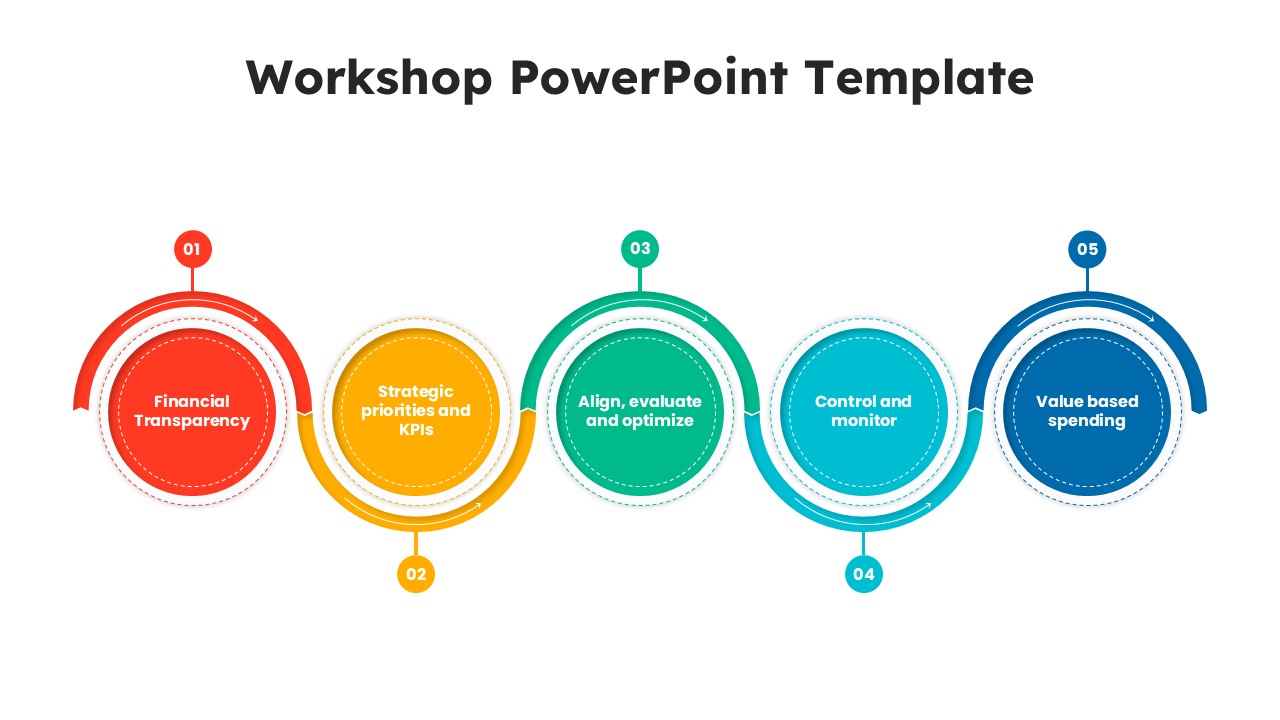
Workshop 5-Step Circular Process Diagram Template for PowerPoint & Google Slides
Circular