Comparison Table Presentation Template for PowerPoint & Google Slides


Description
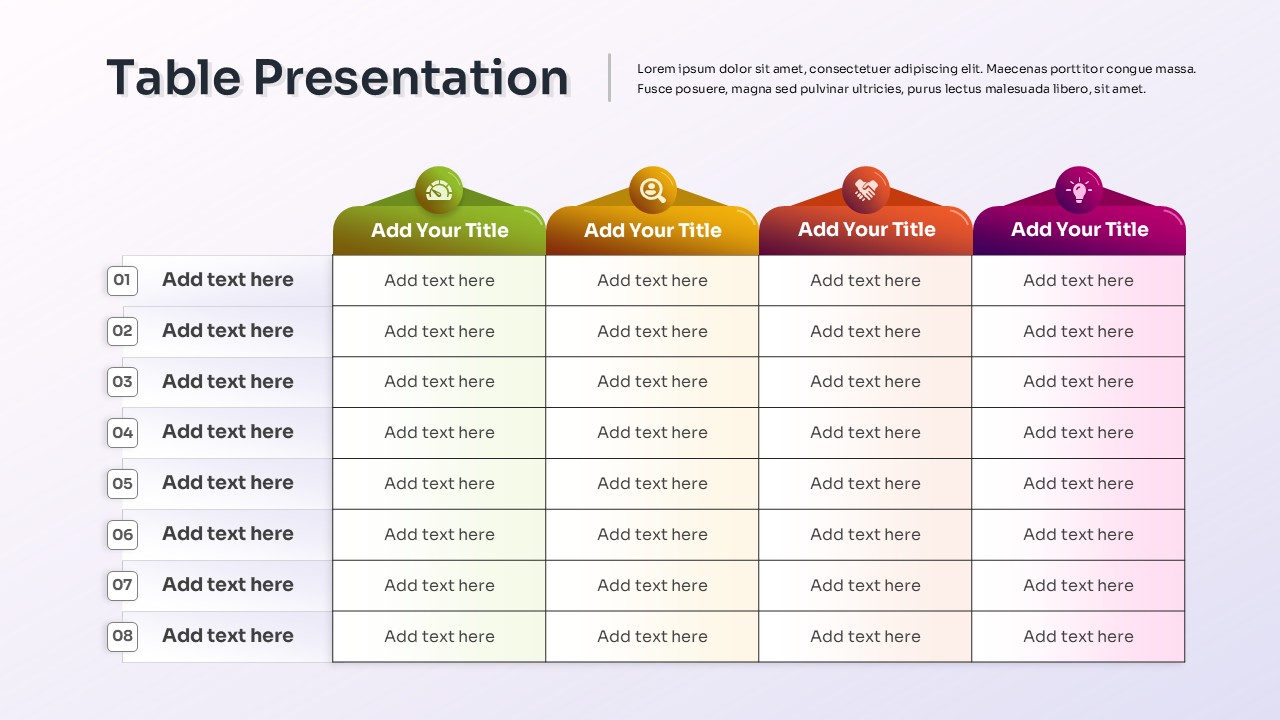
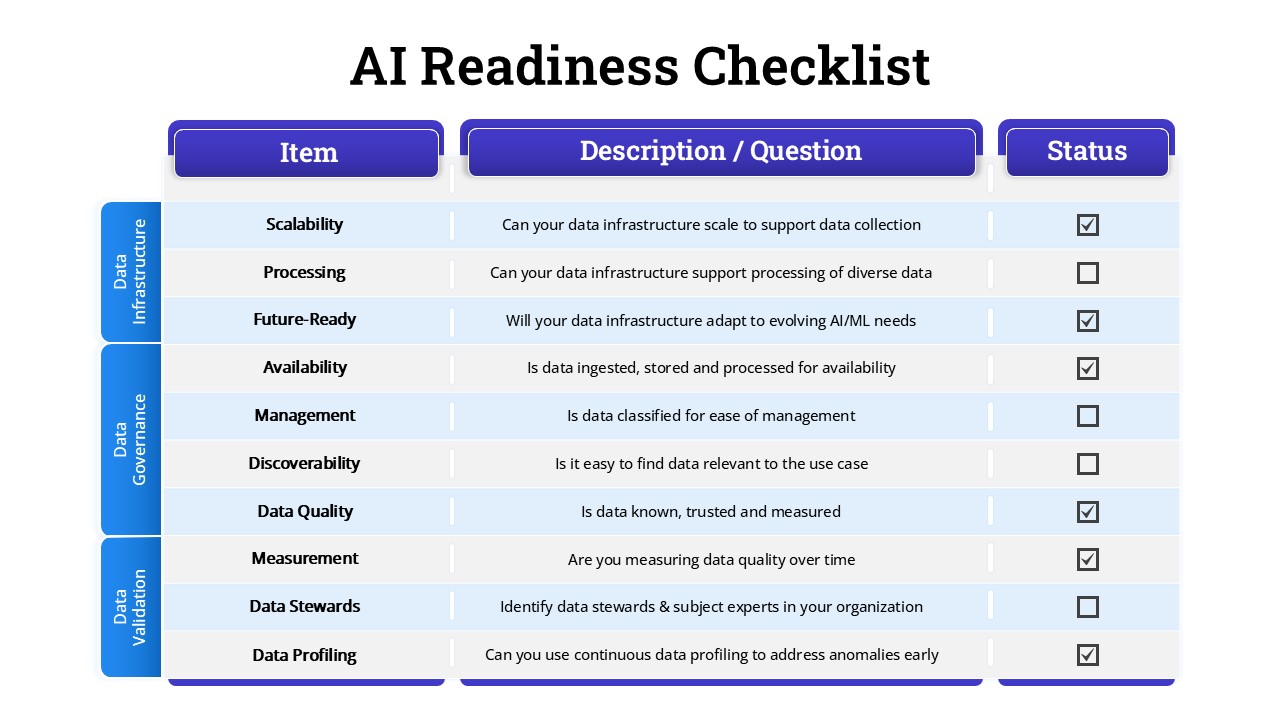
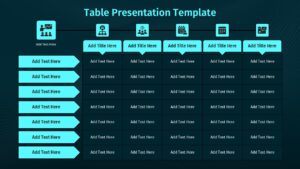
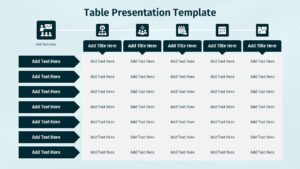
Present complex information with clarity using this six-column comparison table matrix. The slide features a left sidebar of arrow-style row labels and six column headers topped with clean line icons for quick scanning. Callout title tags sit above each column, while a neatly bordered grid organizes content into readable cells—ideal for side-by-side comparisons, status tracking, or structured summaries. The dark background with cyan accents enhances contrast, ensuring headings and data points stand out in larger meeting rooms. Every element is fully editable: rename headers, duplicate rows, adjust column count, swap icons, or match brand colors. Crafted for consistency across decks, this layout keeps typography, spacing, and visual hierarchy polished so teams can focus on the message, not formatting. Optimized for both PowerPoint and Google Slides, it maintains alignment and resolution on any screen, streamlining collaboration and version control.
Who is it for
Product marketers comparing features and plans, operations and project managers mapping deliverables, consultants documenting options, and sales teams aligning pitches will all benefit from this matrix. It also suits HR leads summarizing competencies, educators organizing curricula, and startup founders reporting progress to investors. Anyone who needs a compact, easy-to-read table that synthesizes many variables into one view will find it invaluable.
Other Uses
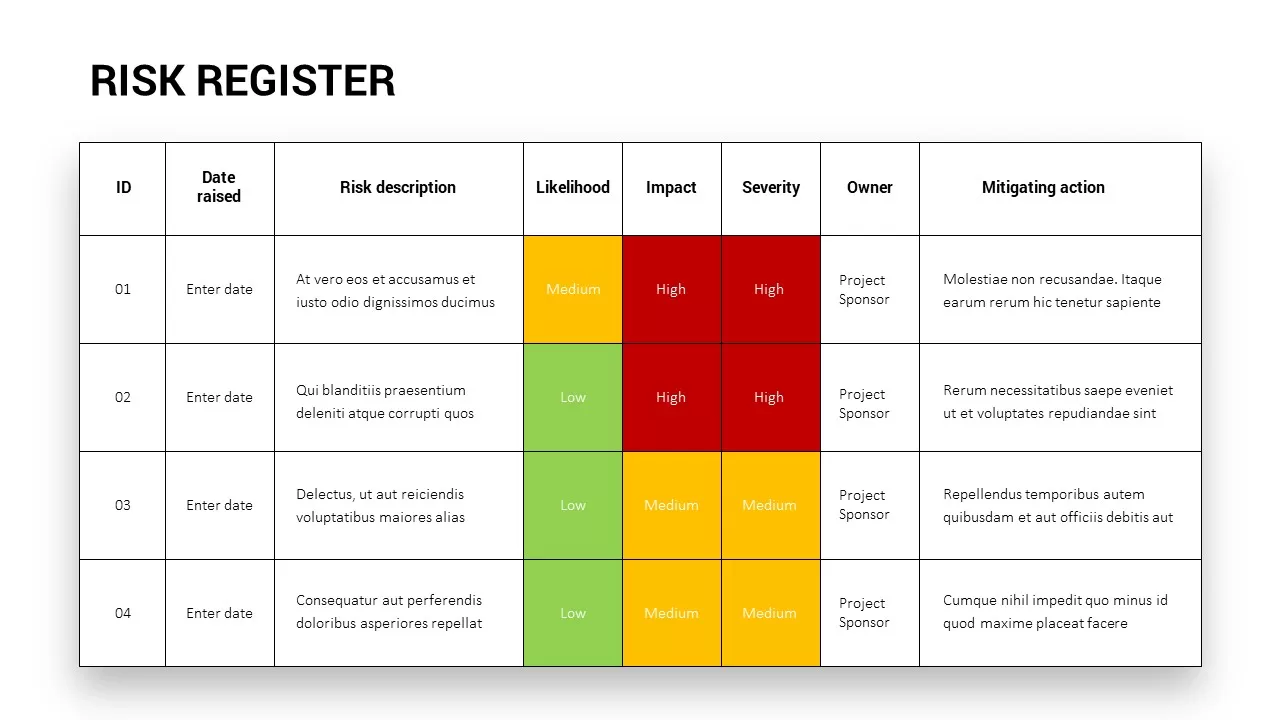
Beyond product or plan comparisons, repurpose this grid for KPI dashboards, RACI responsibility charts, service catalogs, software evaluation matrices, content calendars, risk registers, or sprint summaries. Duplicate slides to create a multi-section report where each page tracks a different workstream while preserving a consistent visual system.
Login to download this file

Item ID
SB05495Designed By
Sharon
Related Templates

Colorful Comparison Table Presentation Template for PowerPoint & Google Slides
Table
Simple Comparison Table Template for PowerPoint & Google Slides
Comparison
Four-Tier Pricing Comparison Table Template for PowerPoint & Google Slides
Comparison
Four-Plan Pricing Table Comparison Template for PowerPoint & Google Slides
Comparison
Dynamic Multicolor Comparison Table Template for PowerPoint & Google Slides
Comparison

Comparison Pricing Table Infographic Template for PowerPoint & Google Slides
Comparison Chart
Five-Option Text Boxes Table Comparison Template for PowerPoint & Google Slides
Business Report
Two-Option Bar Chart Comparison Table Template for PowerPoint & Google Slides
Comparison
Product Feature Comparison Table Template for PowerPoint & Google Slides
Comparison Chart
Sales Growth Comparison Chart & Table Template for PowerPoint & Google Slides
Bar/Column
Colorful Business Data Comparison Table Template for PowerPoint & Google Slides
Table
Five Column Comparison Table Layout Template for PowerPoint & Google Slides
Comparison
Pros and Cons Comparison Table Template for PowerPoint & Google Slides
Comparison Chart
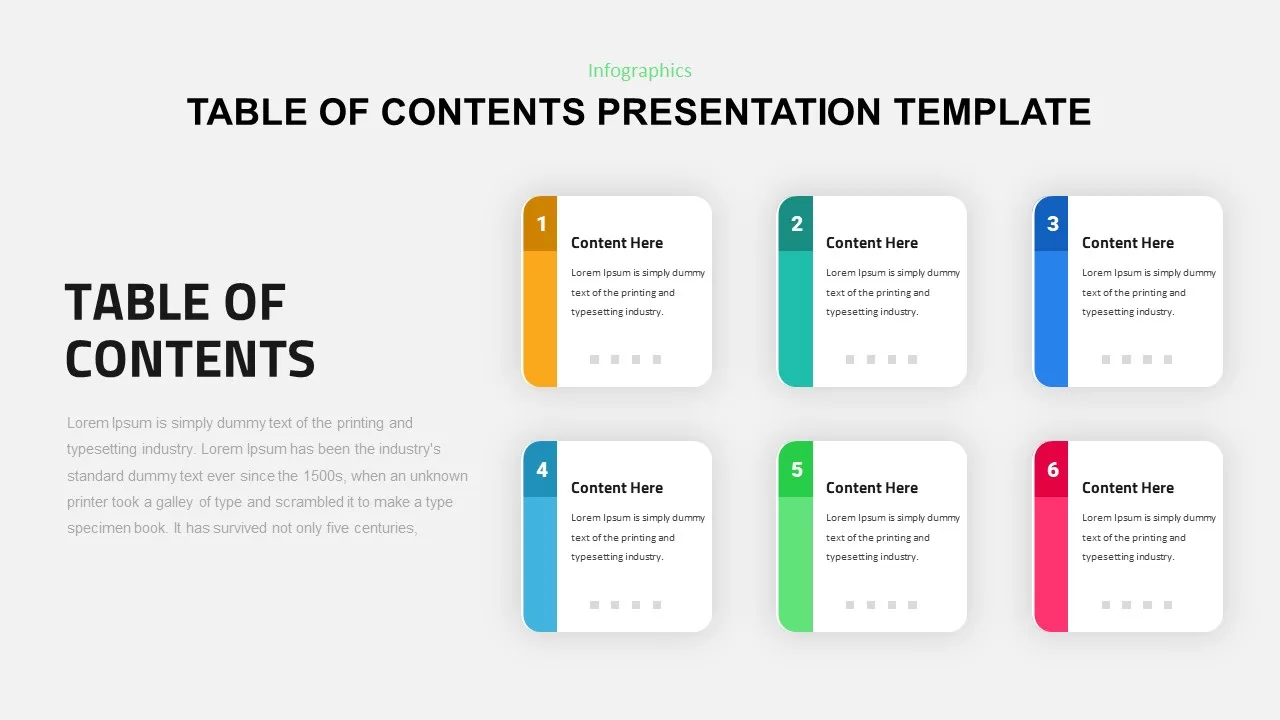
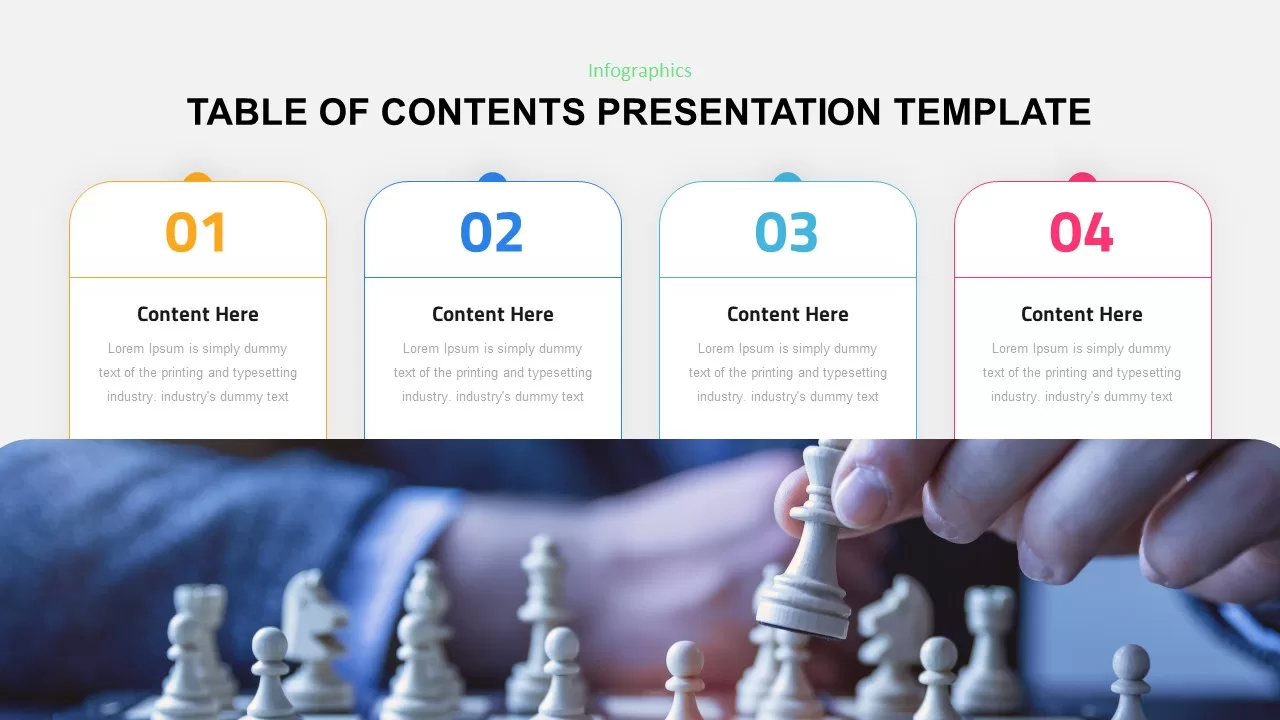
Table of Contents Presentation template for PowerPoint & Google Slides
Agenda
Five-Step Table of Contents Presentation Template for PowerPoint & Google Slides
Agenda
Four-Step Table of Contents Presentation Template for PowerPoint & Google Slides
Agenda
Chevron Table of Contents Presentation Template for PowerPoint & Google Slides
Agenda
Multi-Column Table Presentation Template for PowerPoint & Google Slides
Table
Six-Row Multi-Column Table Presentation Template for PowerPoint & Google Slides
Table
Two-Column Table Presentation Template for PowerPoint & Google Slides
Table
Colorful Table Presentation Template for PowerPoint & Google Slides
Table
Service Zoom Feature Slides Comparison template for PowerPoint & Google Slides
Process
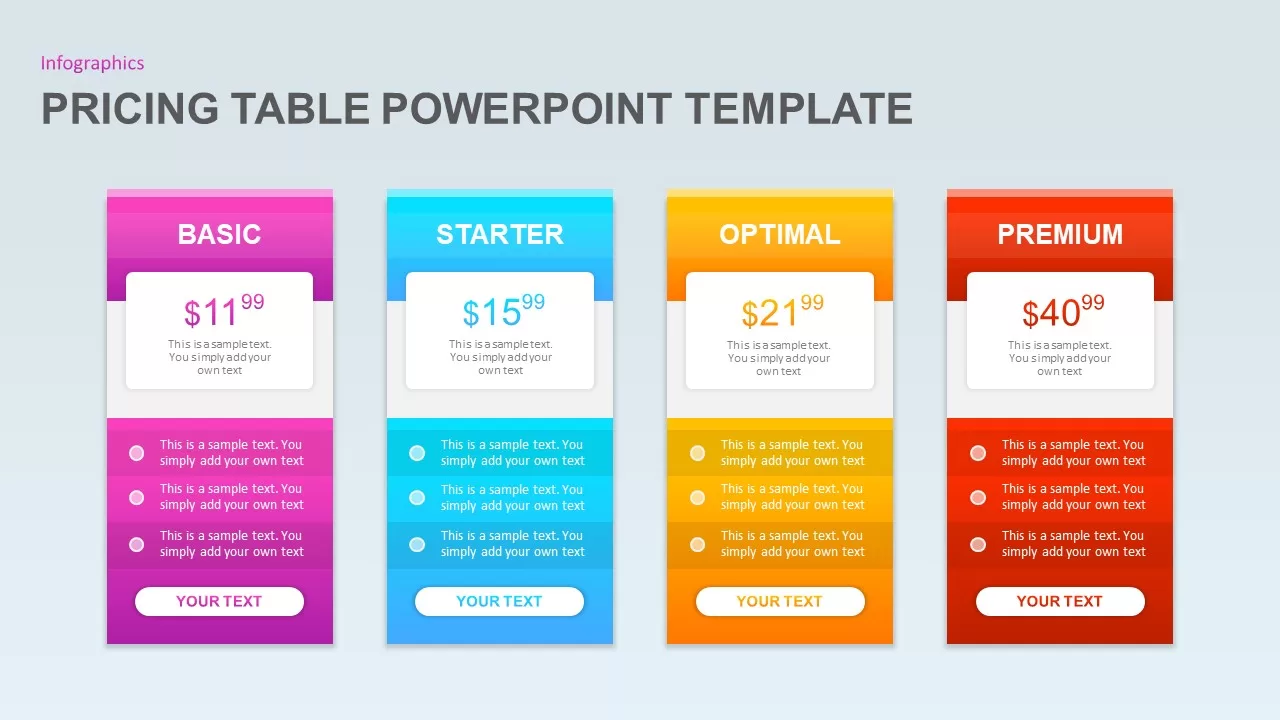
Pricing Table PowerPoint Template for PowerPoint & Google Slides
Infographics
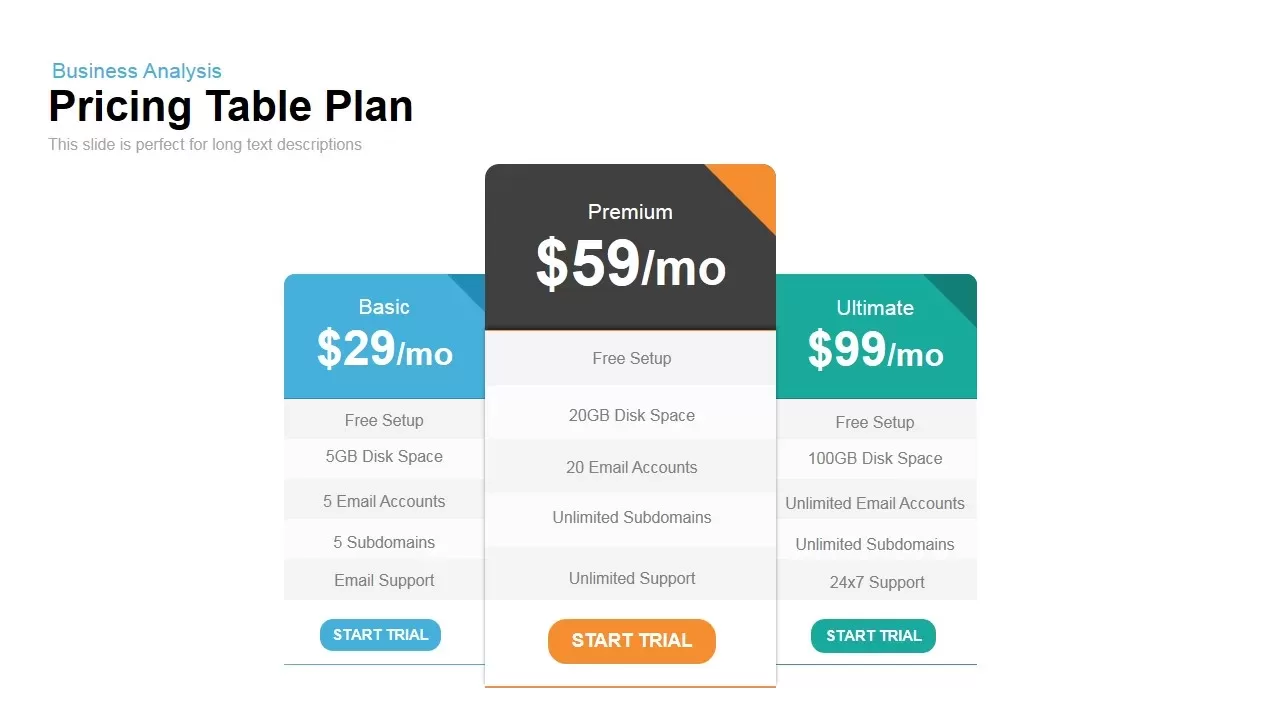
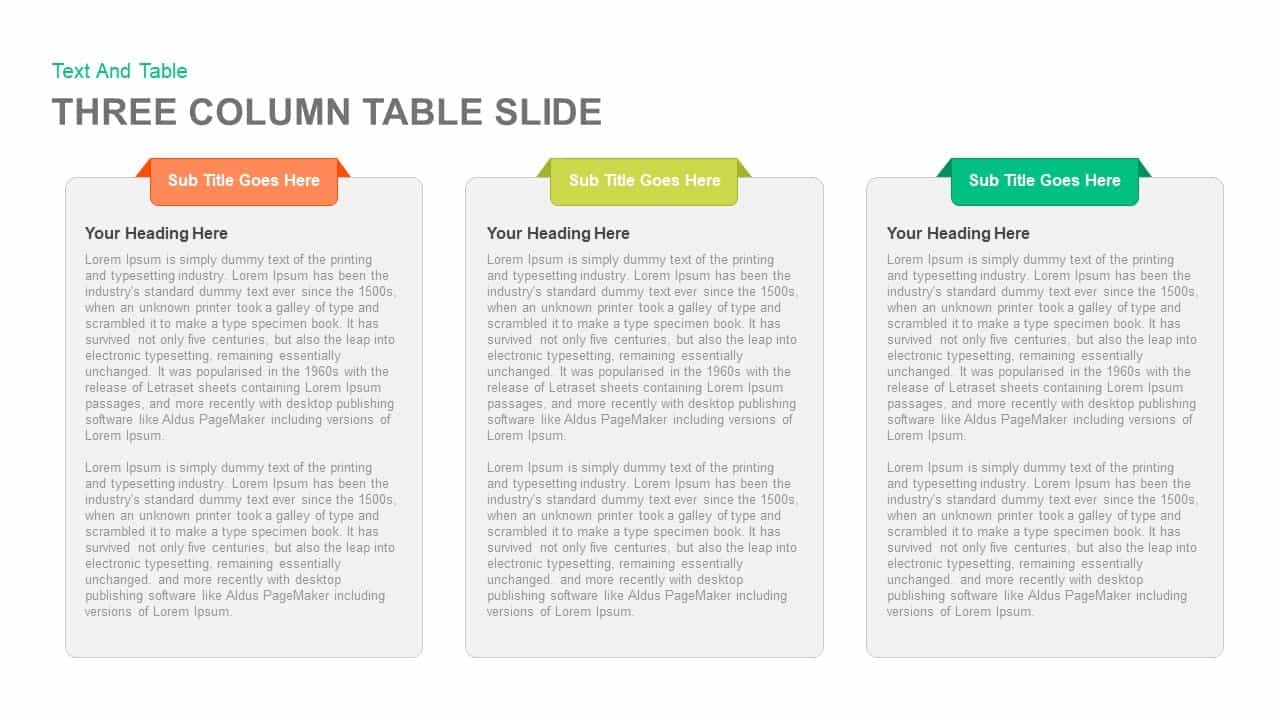
Three-Tier Pricing Table Slide Template for PowerPoint & Google Slides
Comparison
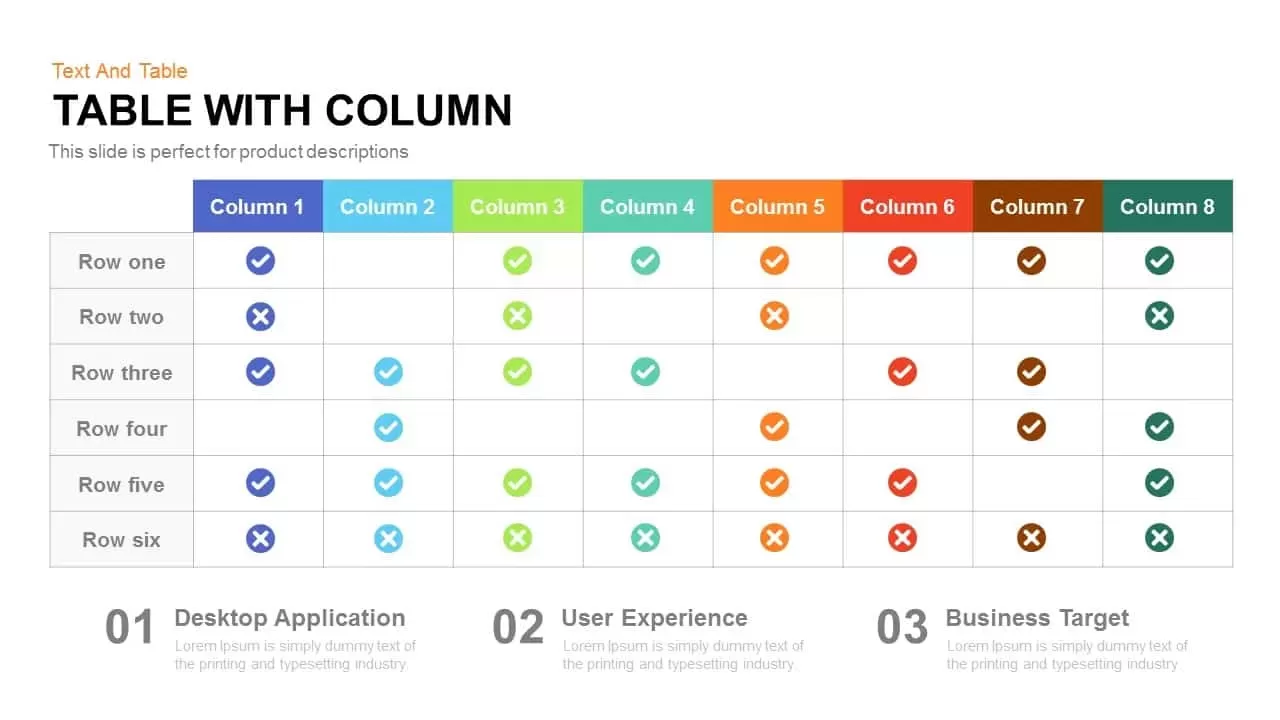
Table with Columns template for PowerPoint & Google Slides
Comparison Chart
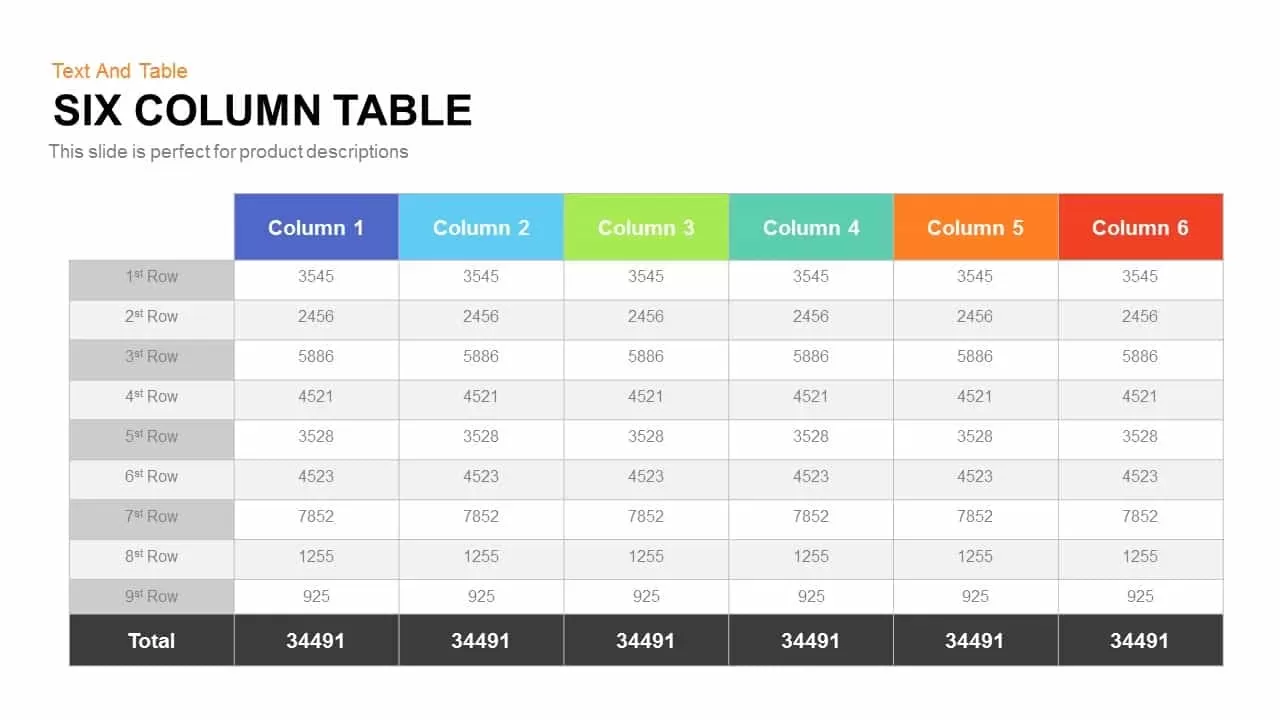
Six Column Table template for PowerPoint & Google Slides
Table

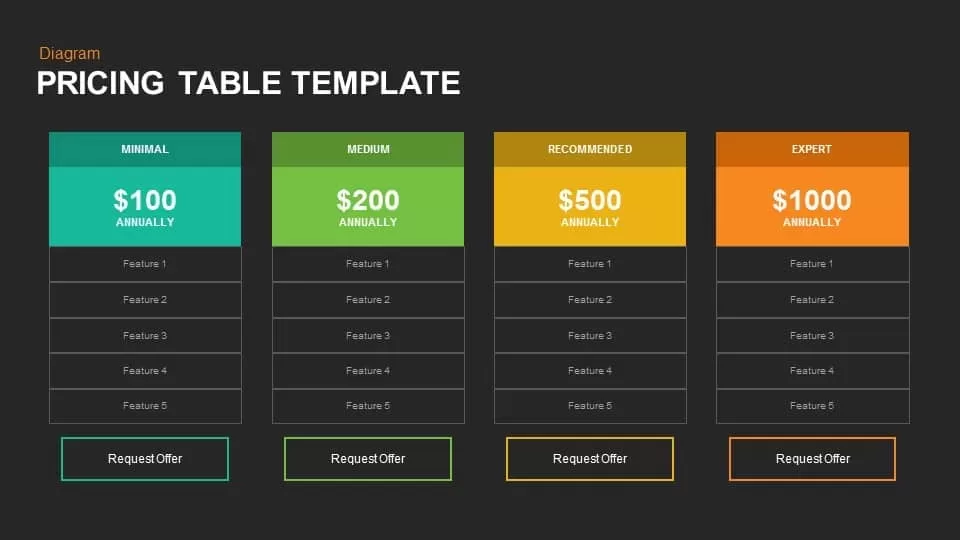
Pricing Table Template for PowerPoint & Google Slides
Business Proposal
Puzzle-Style SWOT Analysis Table Diagram Template for PowerPoint & Google Slides
SWOT
PESTLE Analysis Table Layout Diagram Template for PowerPoint & Google Slides
PEST
Clean Three-Four Column Table Slide Template for PowerPoint & Google Slides
Business Report
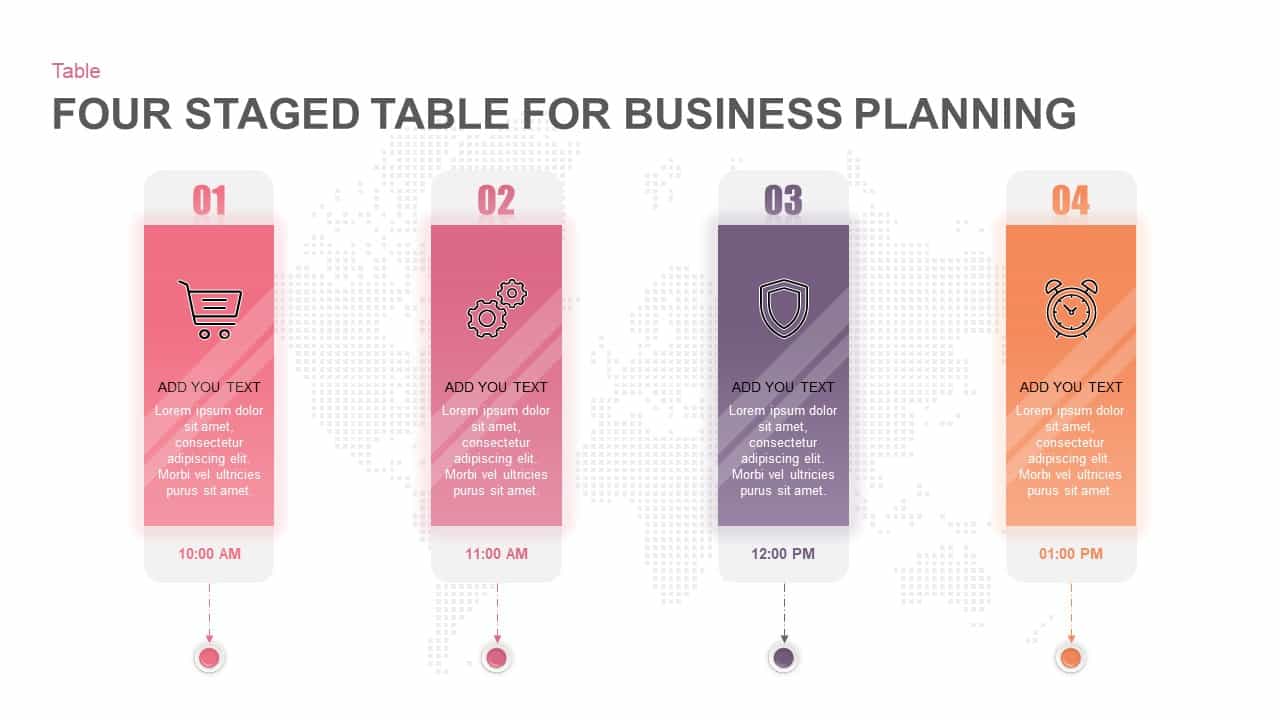
Four-Stage Business Planning Table Template for PowerPoint & Google Slides
Business Plan
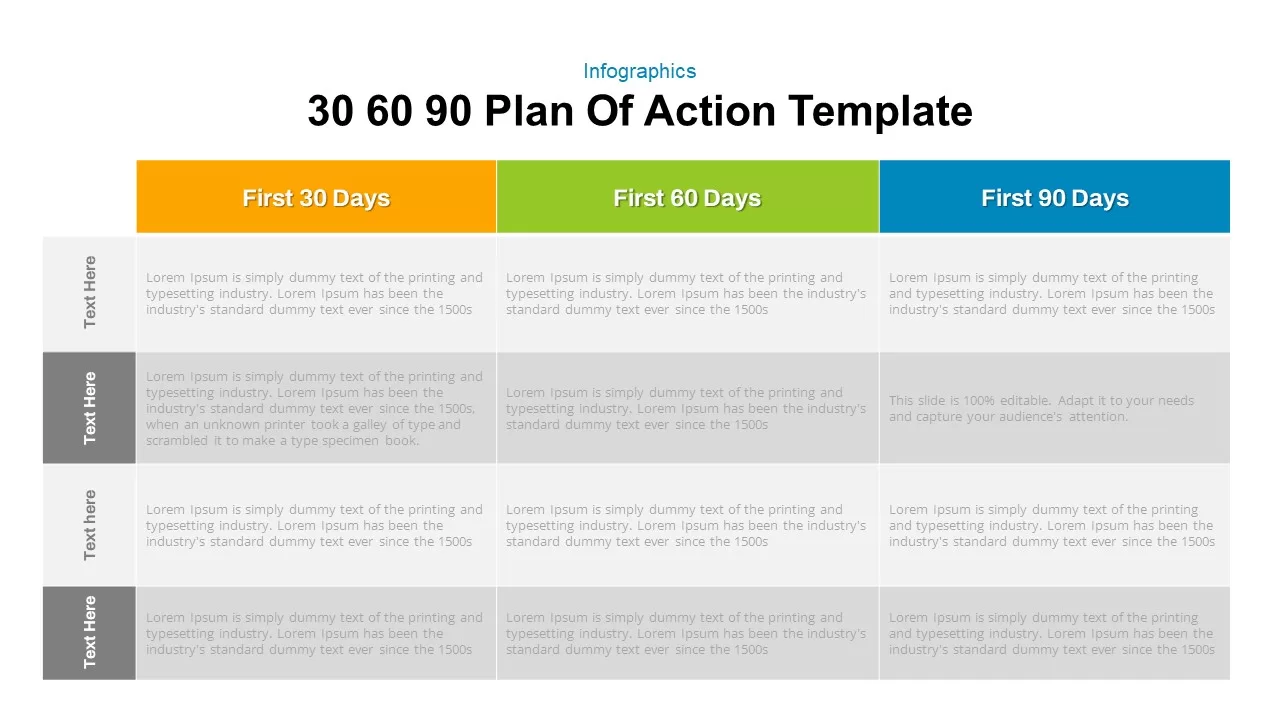
30 60 90 Day Plan Matrix Table Template for PowerPoint & Google Slides
Timeline
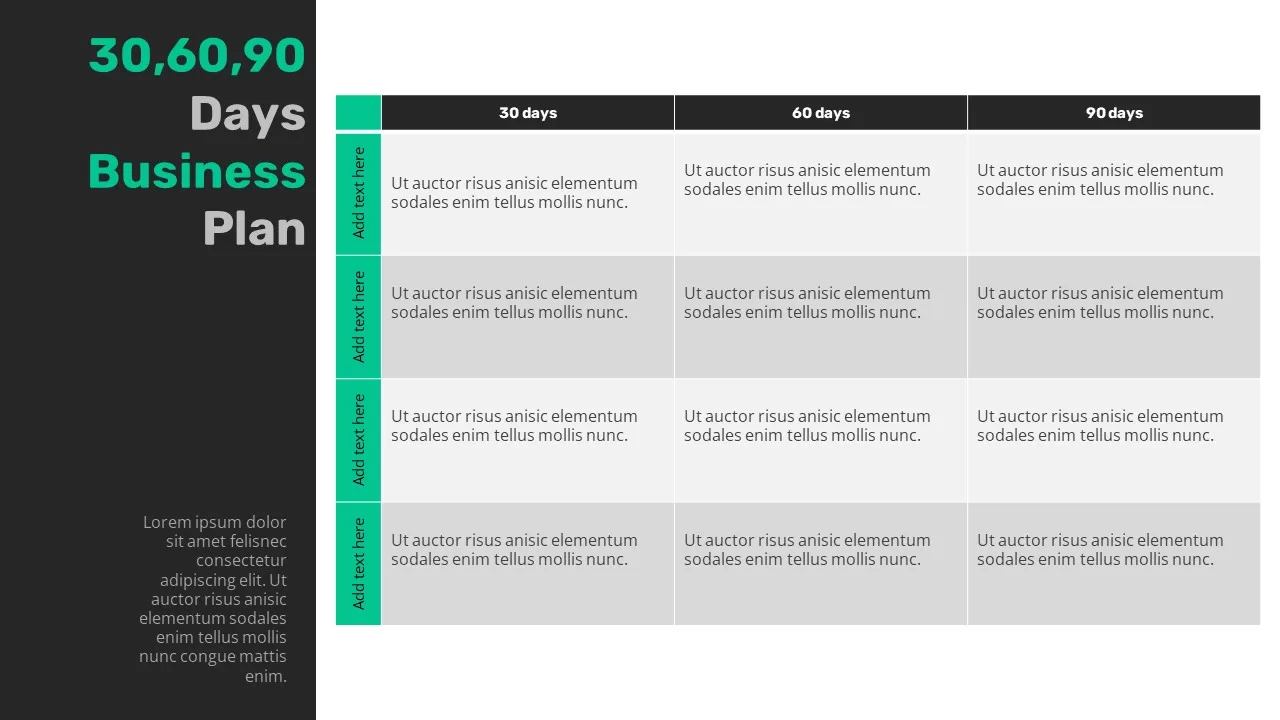
30-60-90 Business Plan Table Template for PowerPoint & Google Slides
Timeline
Six-Step Color-Coded Table of Contents Template for PowerPoint & Google Slides
Agenda
Table of Contents Infographic Slide template for PowerPoint & Google Slides
Agenda
Six-Step Table of Contents Infographic Template for PowerPoint & Google Slides
Agenda
Eight-Step Colorful Table of Contents Template for PowerPoint & Google Slides
Infographics
Four-Section Table of Contents Template for PowerPoint & Google Slides
Agenda
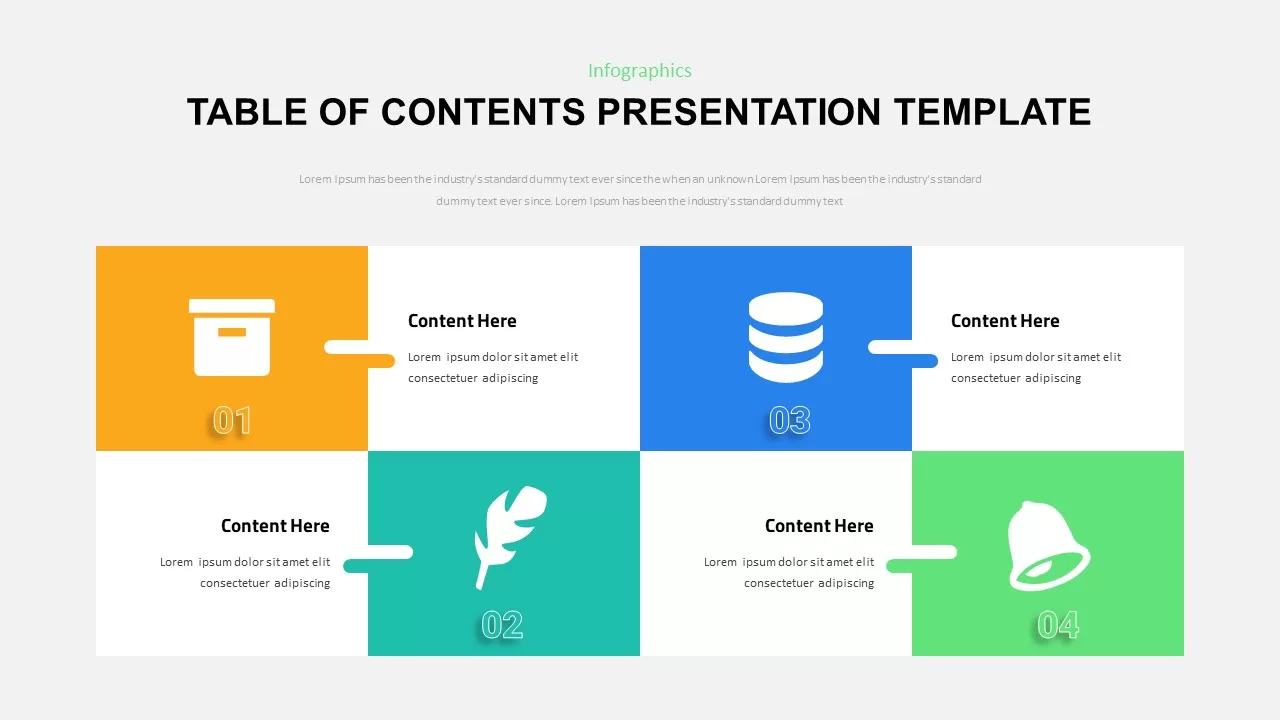
Four-Part Table of Contents Infographic Template for PowerPoint & Google Slides
Agenda
Four-Step Numbered Table of Contents Template for PowerPoint & Google Slides
Agenda
Four-Step Agenda Table of Contents Template for PowerPoint & Google Slides
Agenda
Modern Four-Step Table of Contents Template for PowerPoint & Google Slides
Agenda
Four-Step Strategic Table of Contents Template for PowerPoint & Google Slides
Agenda
Table of Contents Infographics template for PowerPoint & Google Slides
Company Profile
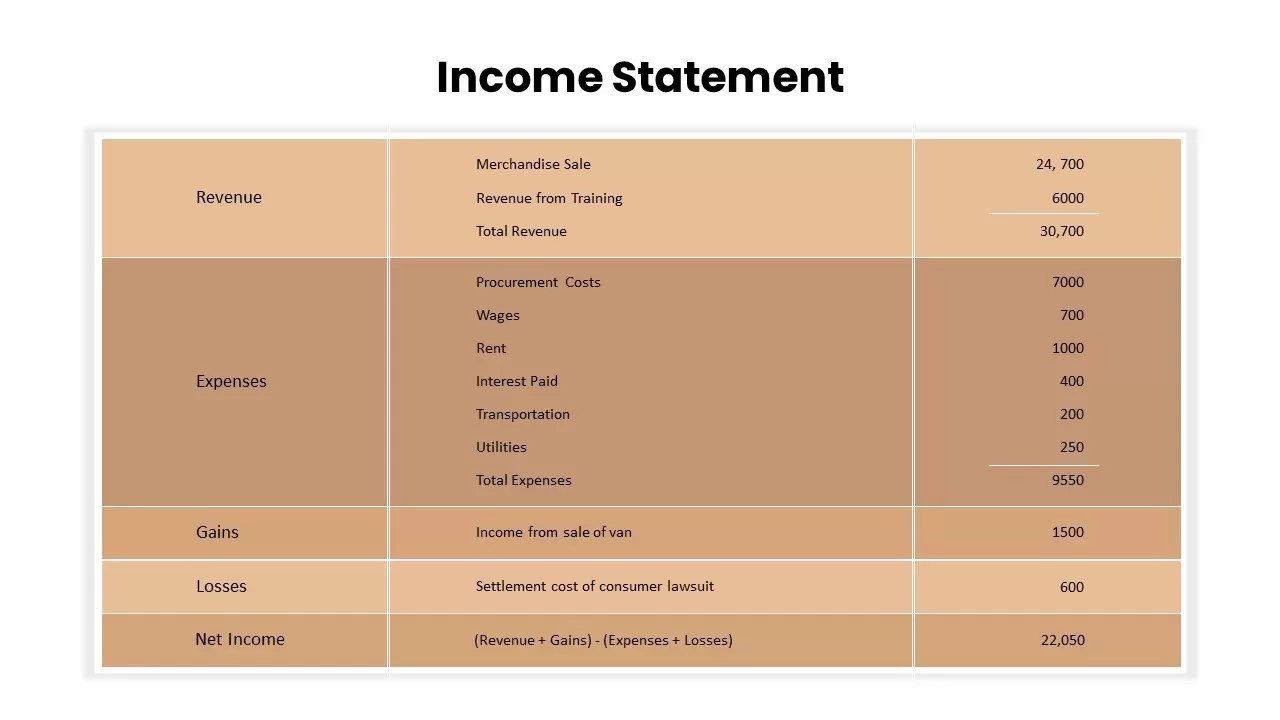
Income Statement Overview Table Template for PowerPoint & Google Slides
Finance
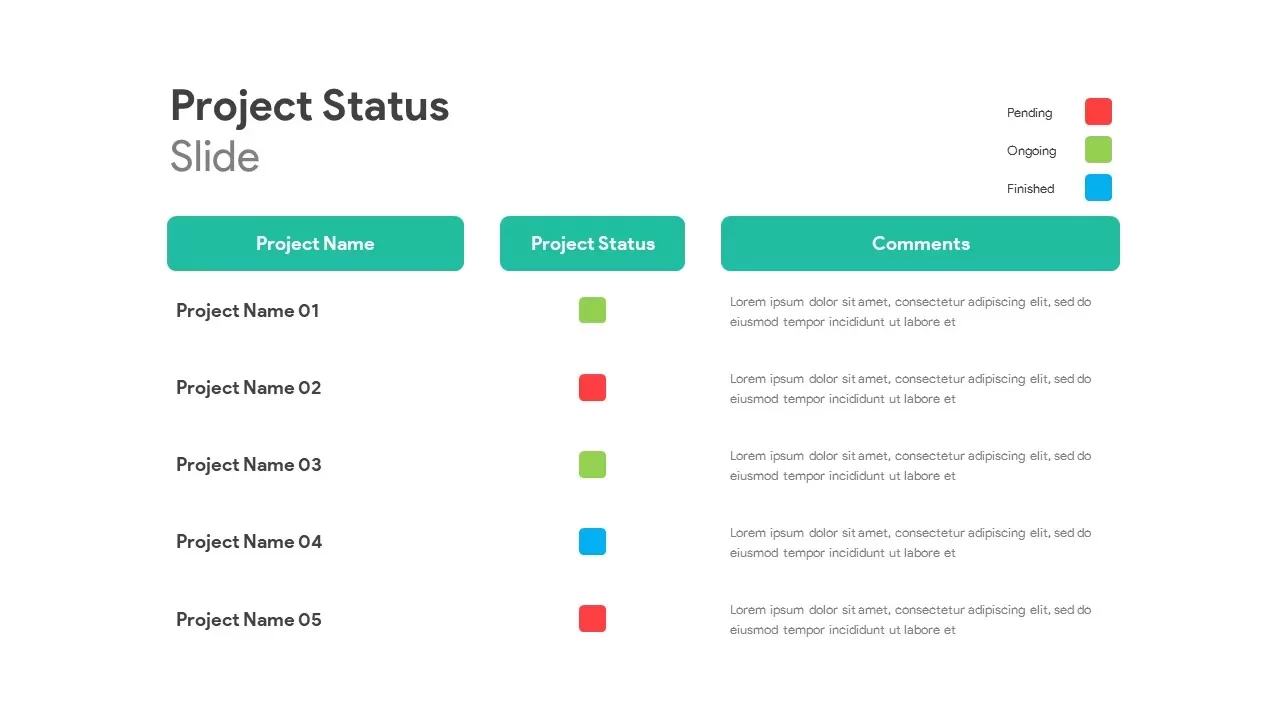
Project Status Dashboard Table Template for PowerPoint & Google Slides
Project Status
Project Status Table Template for PowerPoint & Google Slides
Project Status
Comprehensive Risk Register Table Template for PowerPoint & Google Slides
Risk Management
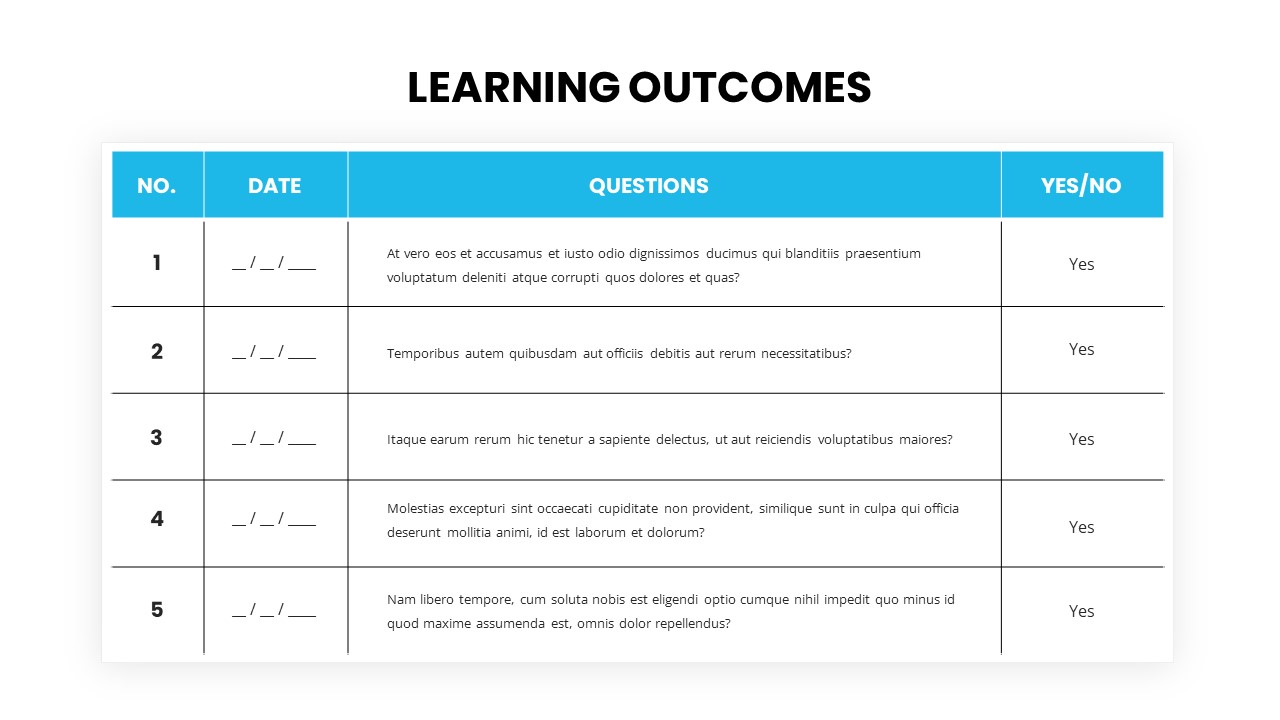
Learning Outcomes table template for PowerPoint & Google Slides
Charts
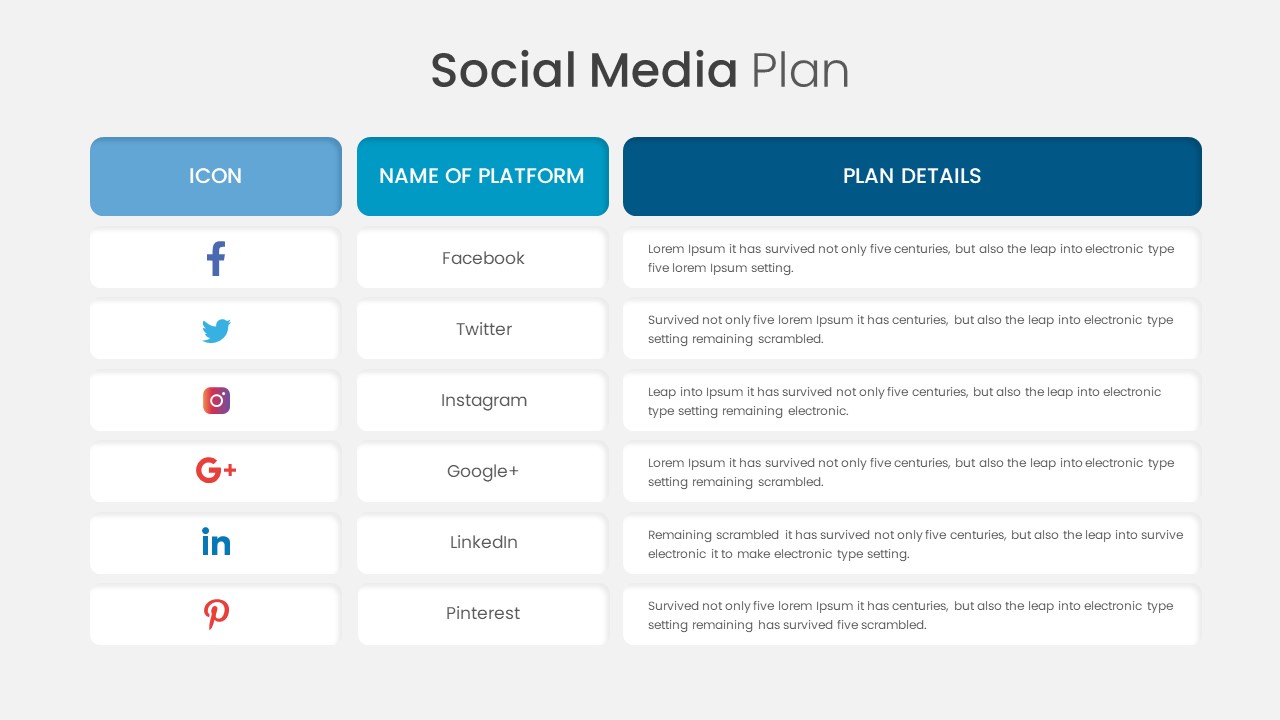
Social Media Plan Table Slide Deck Template for PowerPoint & Google Slides
Process
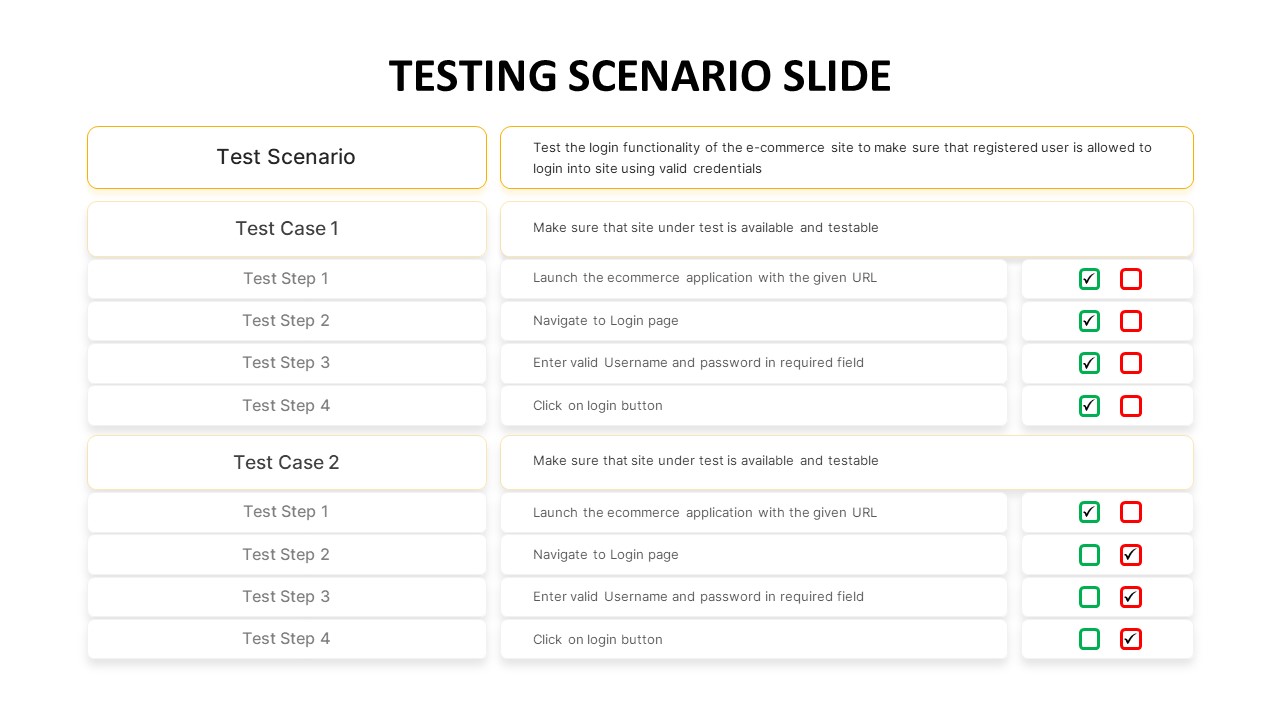
Testing Scenario Table Template for PowerPoint & Google Slides
Business Requirements
Comprehensive Resource Planning Table Template for PowerPoint & Google Slides
Project
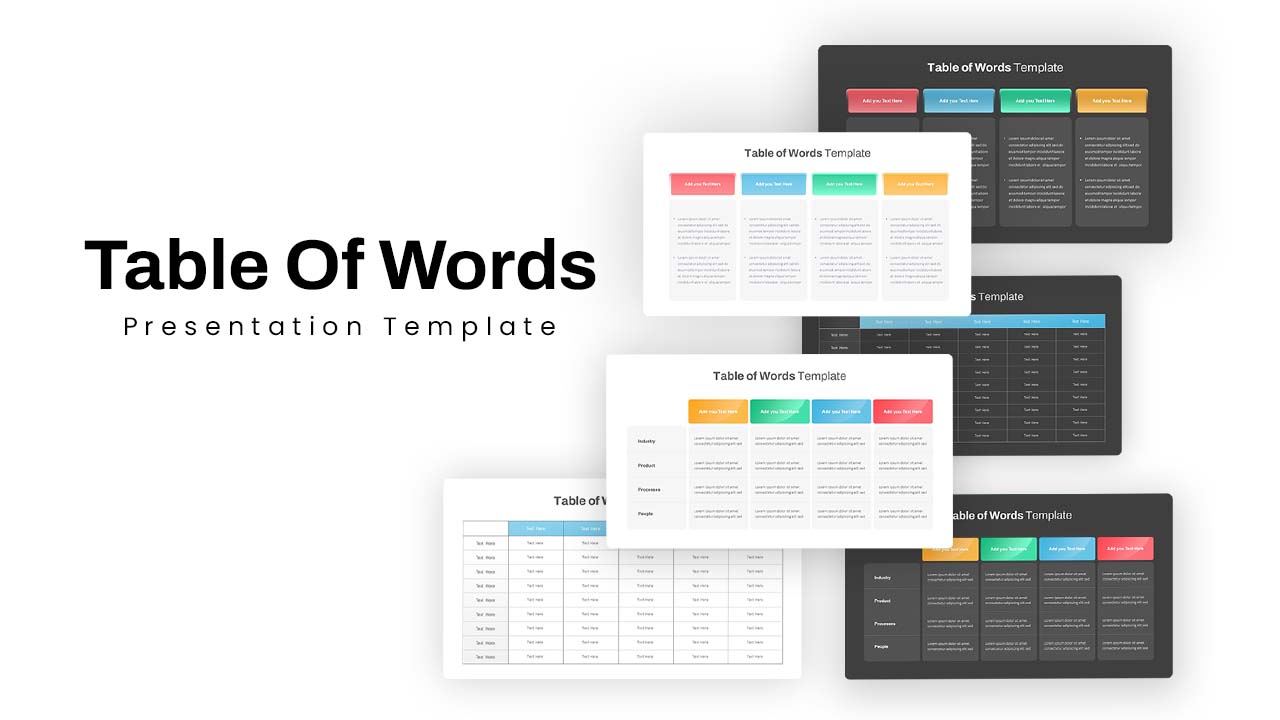
Versatile Table of Words Layout Template for PowerPoint & Google Slides
Table
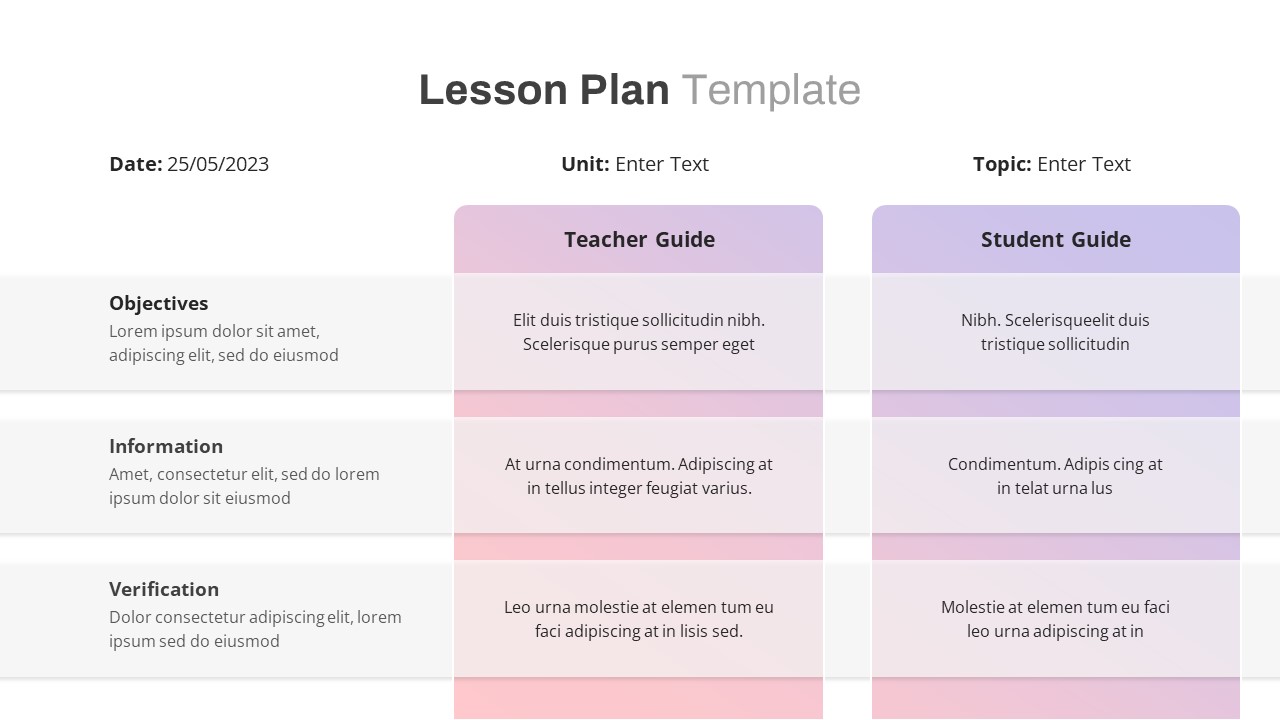
Free Lesson Plan Table Slide Template for PowerPoint & Google Slides
Agenda
Free
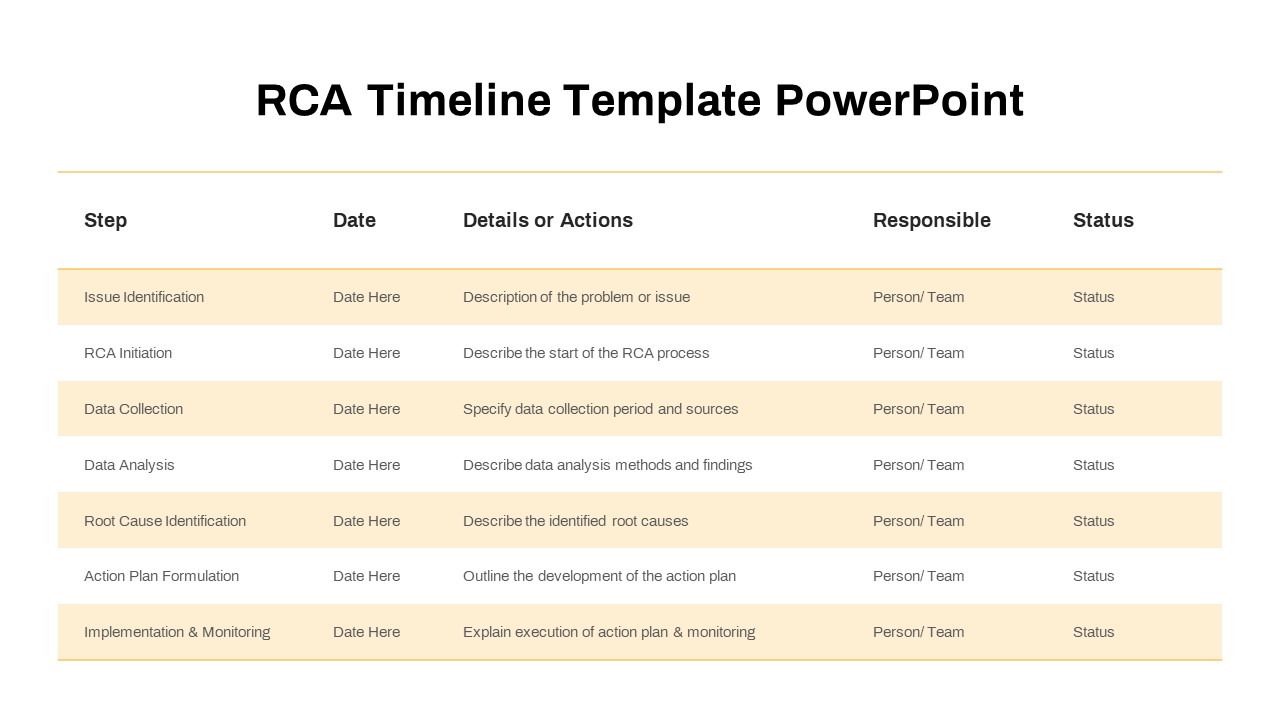
RCA Process Timeline Table Slide Template for PowerPoint & Google Slides
Timeline
Free Minimal Multi-Color Table of Contents Template for PowerPoint & Google Slides
Agenda
Free
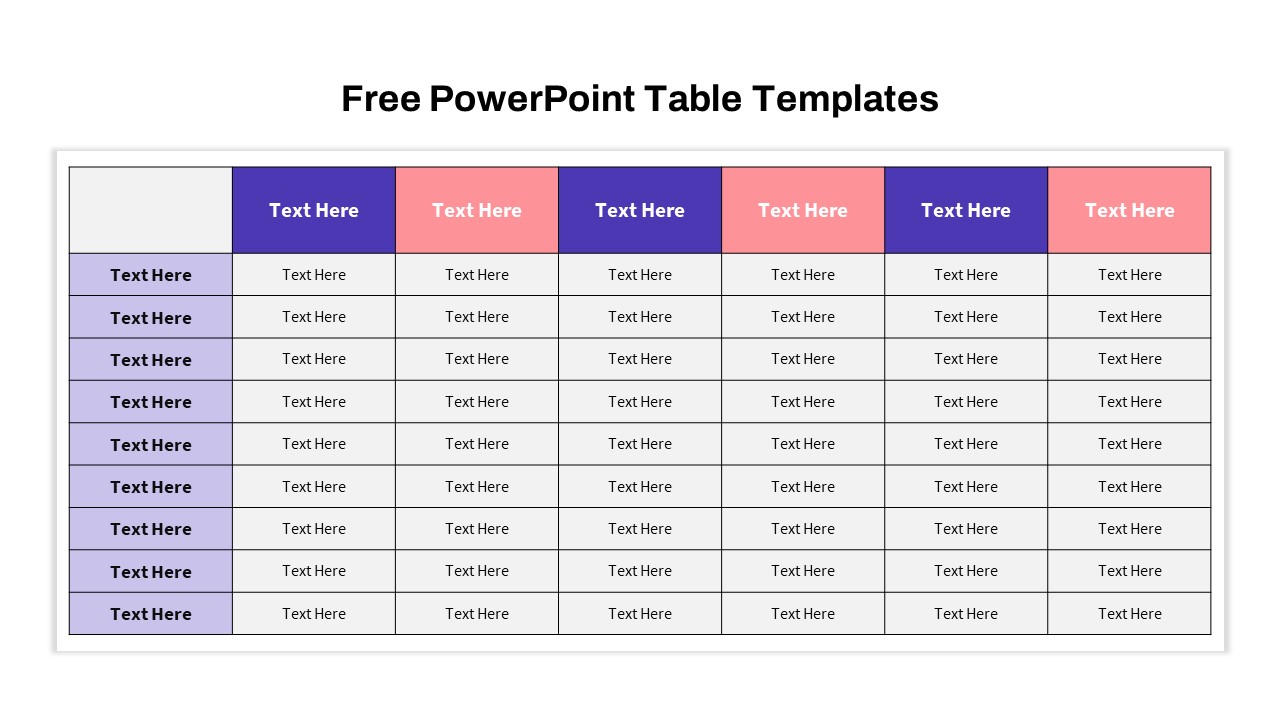
Free Versatile Table Collection Template for PowerPoint & Google Slides
Pitch Deck
Free
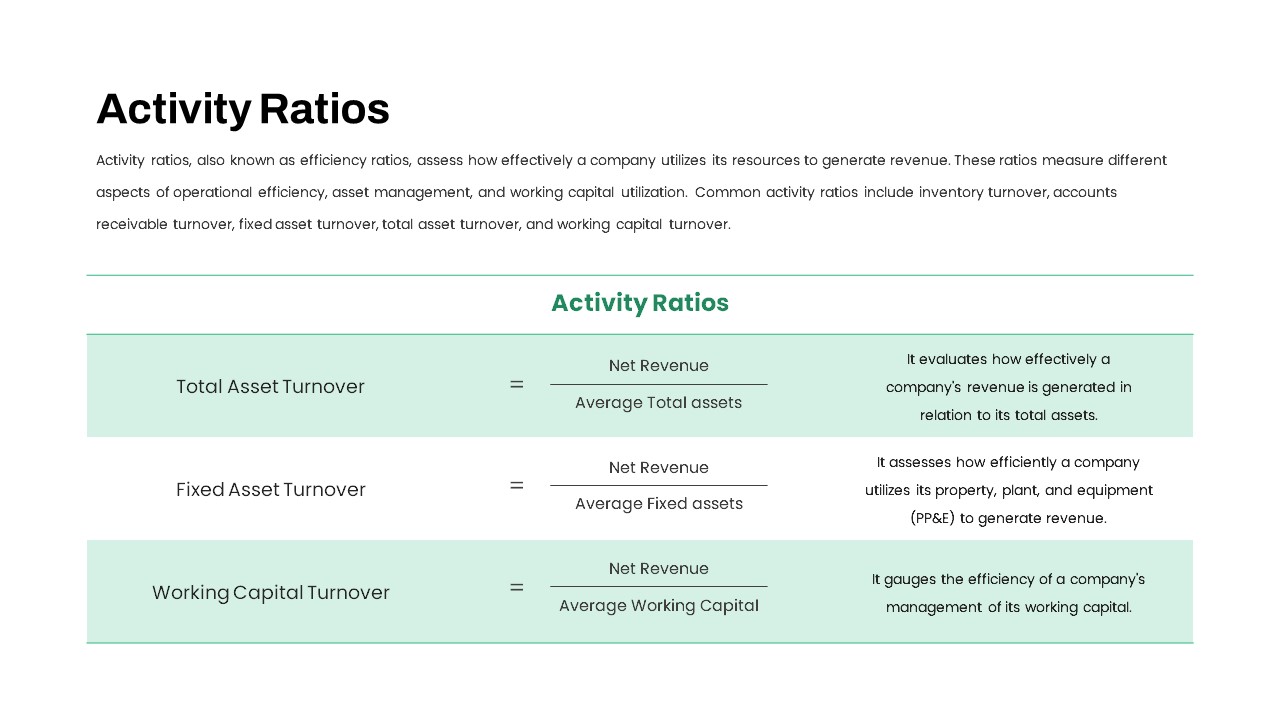
Activity Ratios Formula Table Slide Template for PowerPoint & Google Slides
Comparison Chart
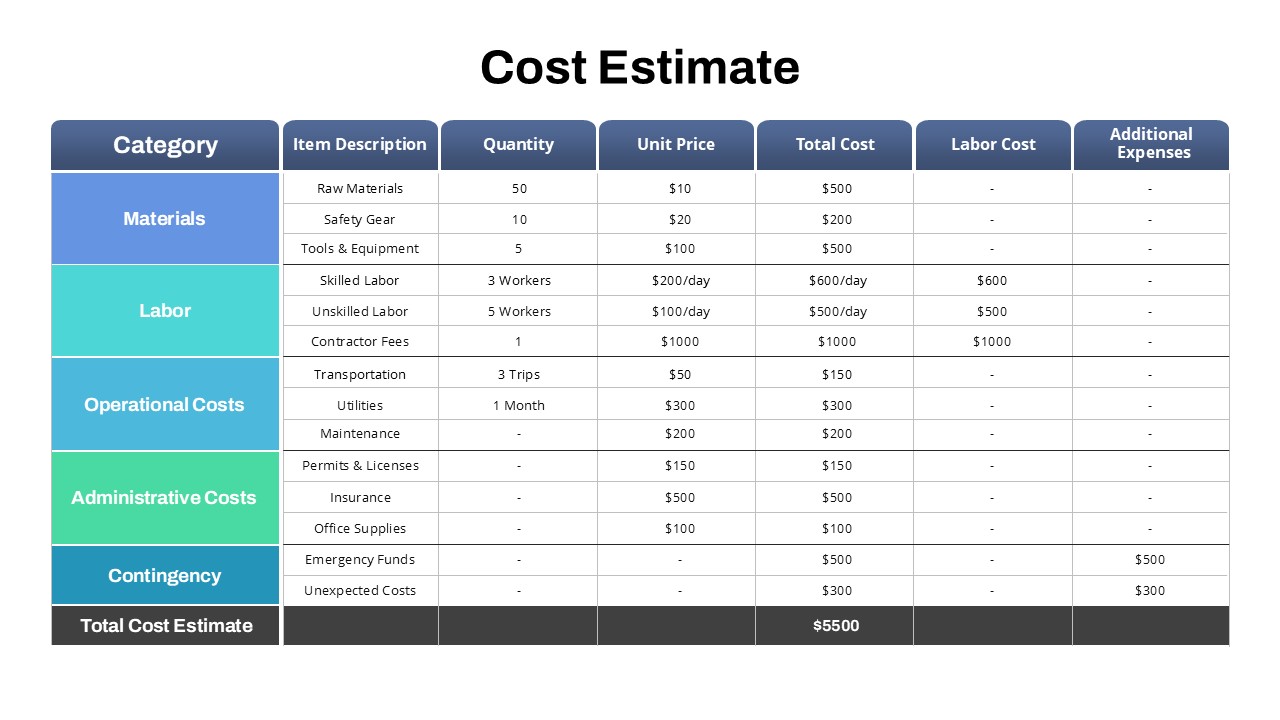
Project Detailed Cost Estimate Table Template for PowerPoint & Google Slides
Project
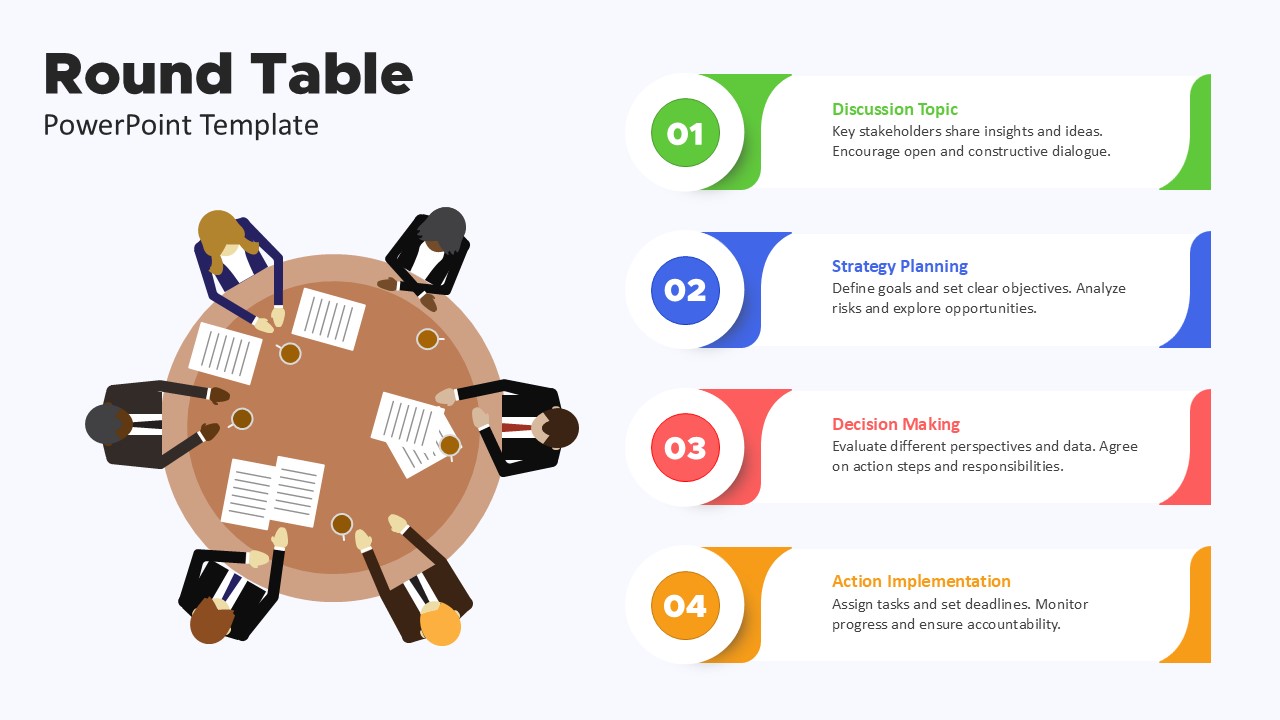
Title: Round Table Meeting Discussion Process Template for PowerPoint & Google Slides
Process
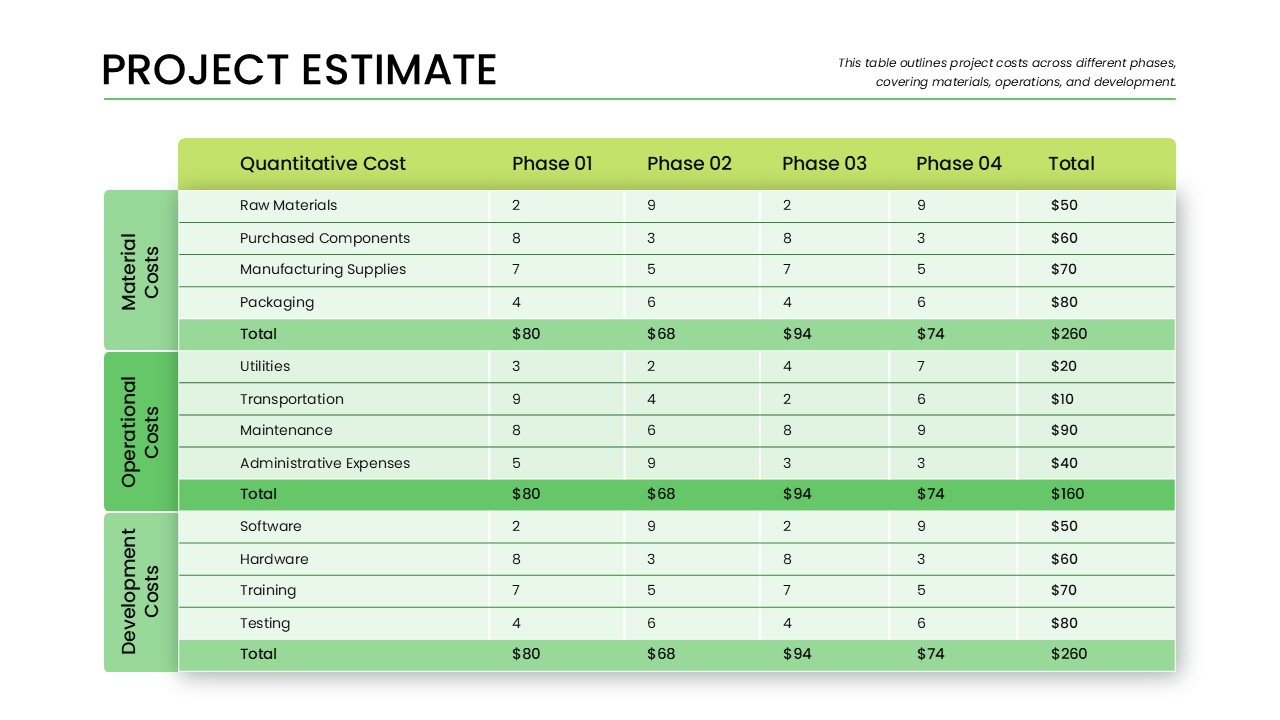
Phase-Wise Project Estimate Table Template for PowerPoint & Google Slides
Business Report
Professional Table of Organization Chart Template for PowerPoint & Google Slides
Org Chart
Progression Track Milestone Table Template for PowerPoint & Google Slides
Project Status
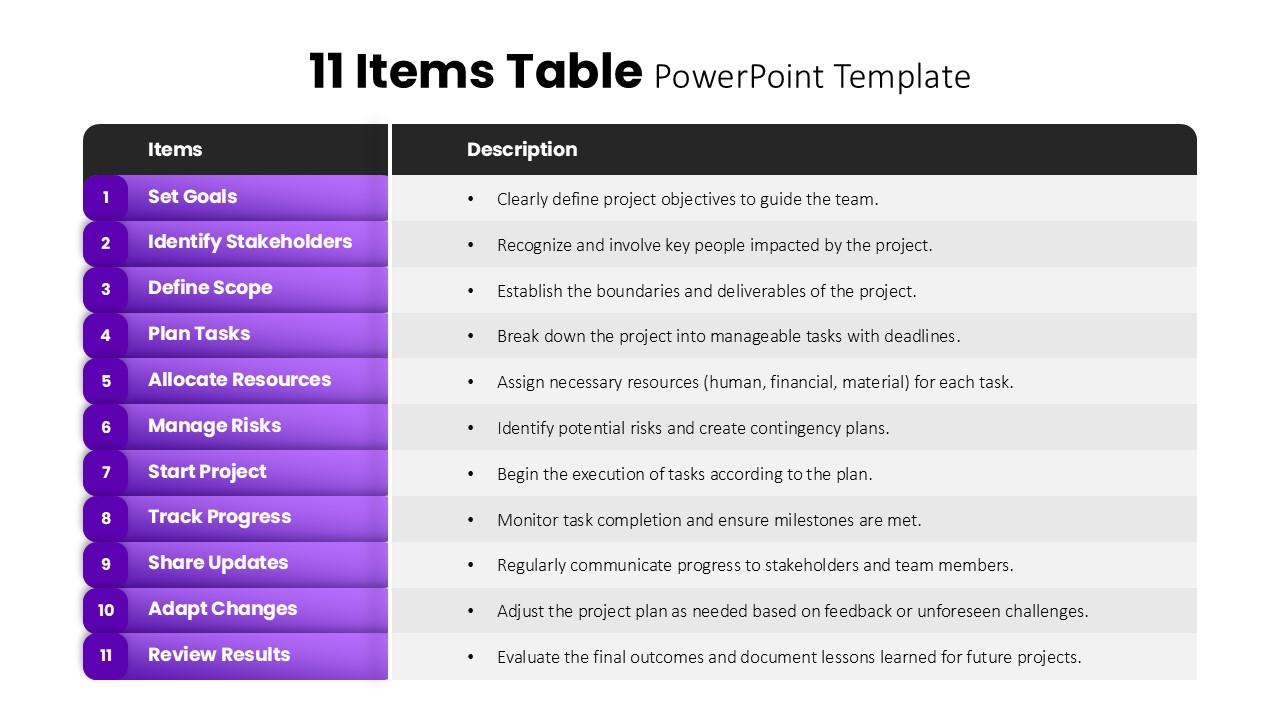
11 Items Table Project Planning Steps template for PowerPoint & Google Slides
Business
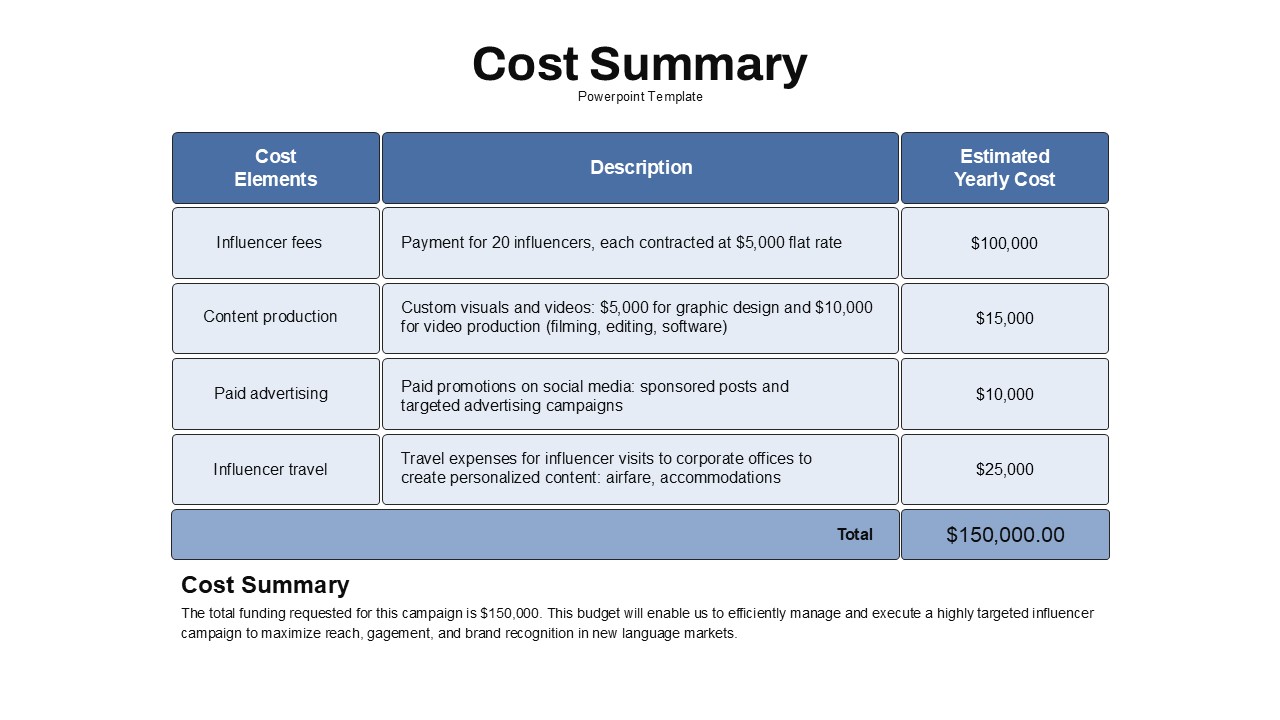
Cost Summary Table Template for PowerPoint & Google Slides
Business Report
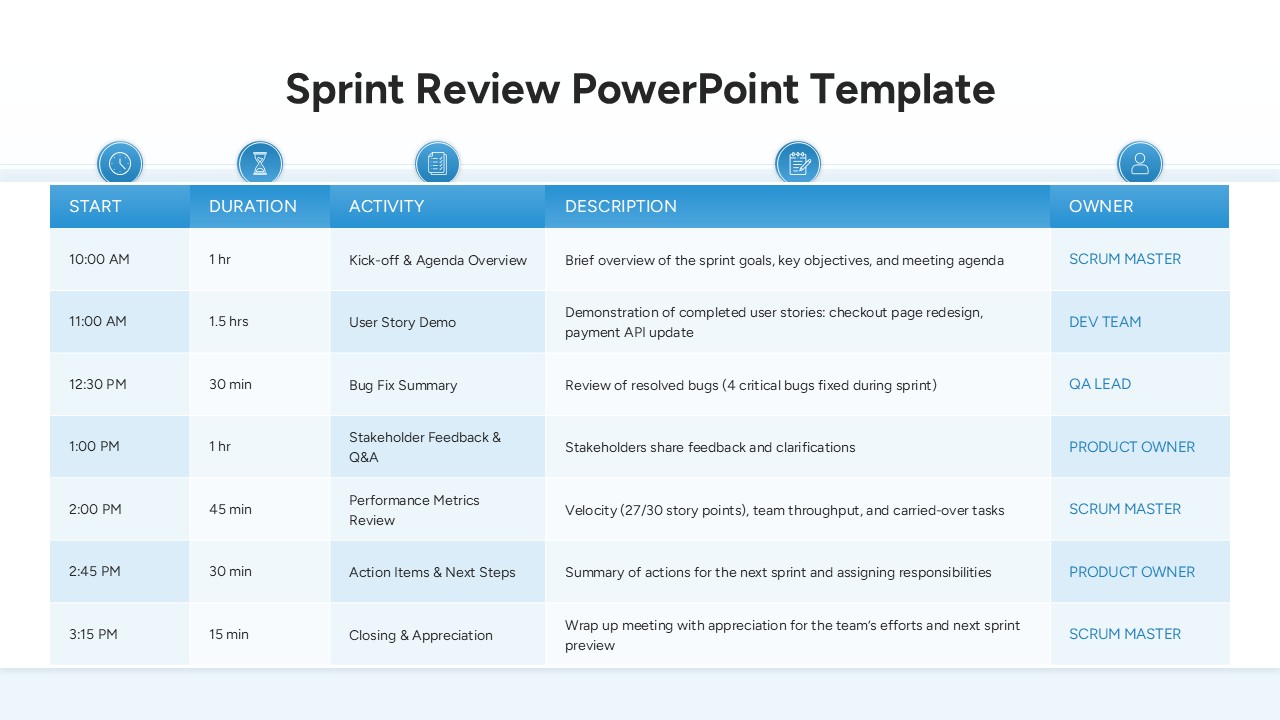
Sprint Review Meeting Agenda Table Template for PowerPoint & Google Slides
Agenda
Project Tracking Dashboard Table Template for PowerPoint & Google Slides
Project Status
Action Items Management Dashboard Table Template for PowerPoint & Google Slides
Project Status
Comprehensive Action Tracker Table Template for PowerPoint & Google Slides
Business
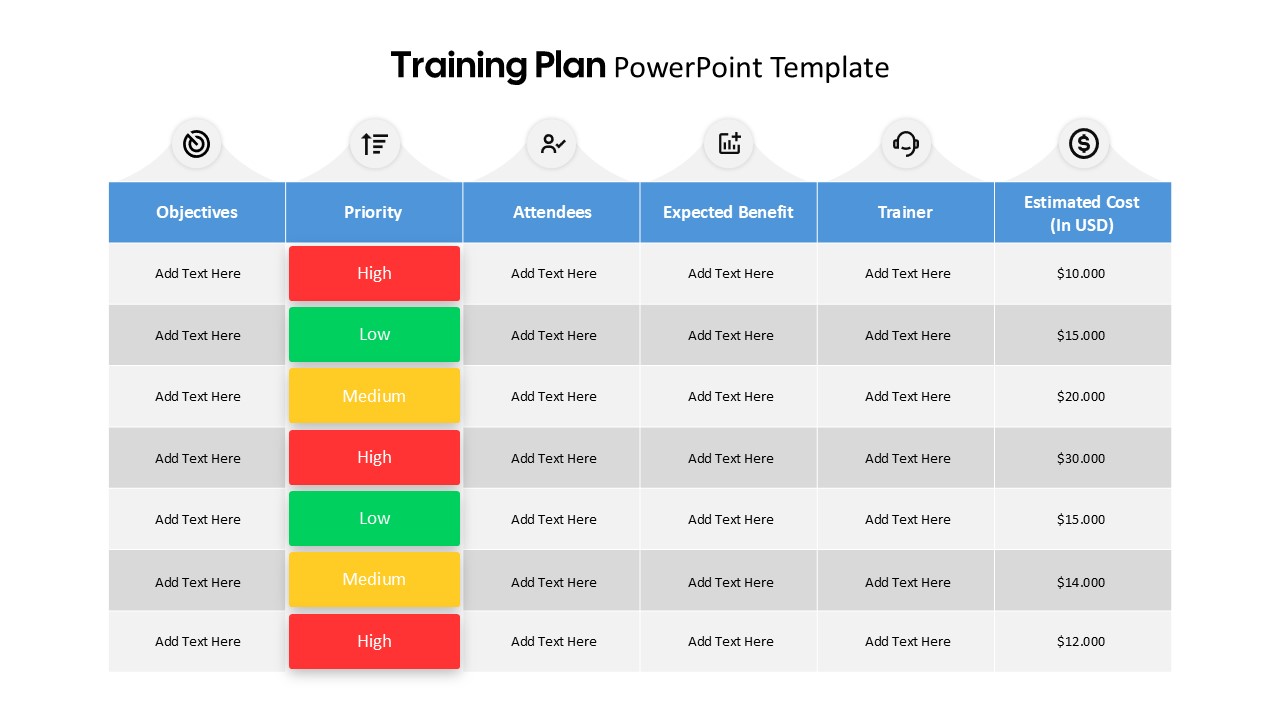
Training Plan Table Layout Template for PowerPoint & Google Slides
Employee Performance
AI Readiness Checklist Table Slide Template for PowerPoint & Google Slides
Process
Business Data Table Template for PowerPoint & Google Slides
Table
Dynamic Project Status Tracking Table Template for PowerPoint & Google Slides
Project Status
Marketing Budget Table Template for PowerPoint & Google Slides
Business
Project Status Update Dashboard Table Template for PowerPoint & Google Slides
Project Status
Colorful Four-Column Table Layout Template for PowerPoint & Google Slides
Table
Blank Table Template for PowerPoint & Google Slides
Table
Six Column Data Table Template for PowerPoint & Google Slides
Table
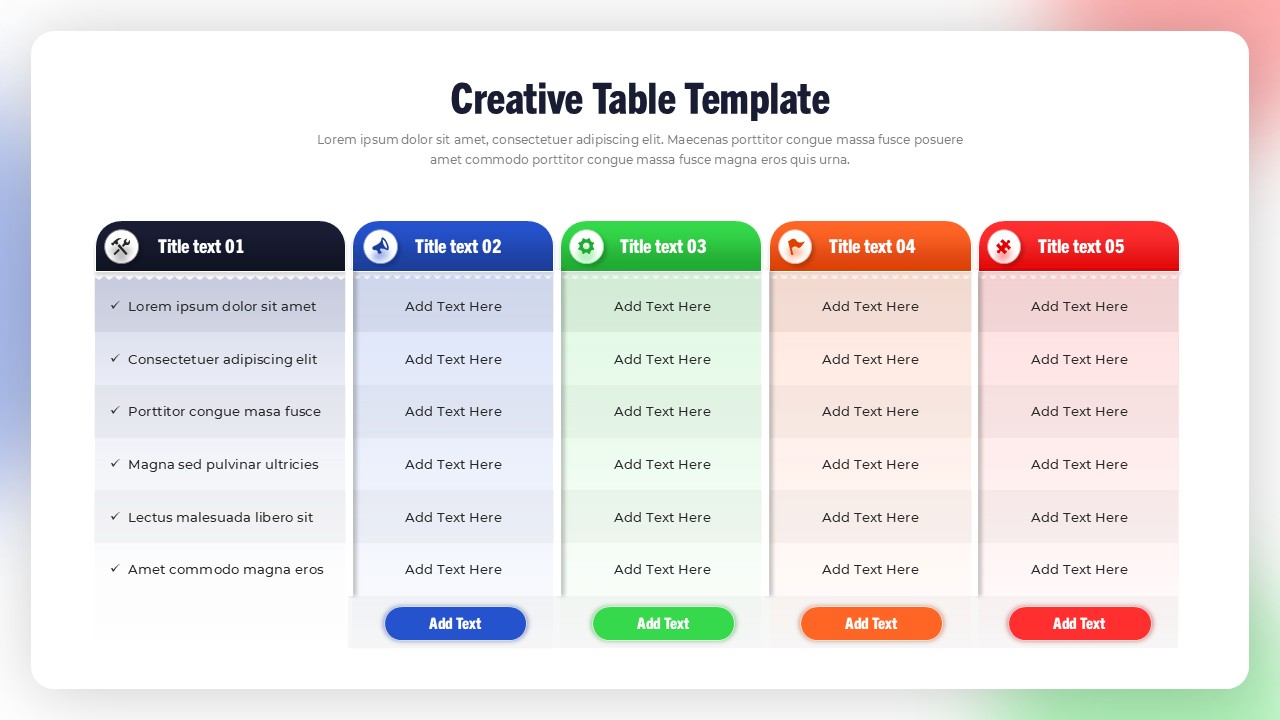
Creative Table Template for PowerPoint & Google Slides
Table
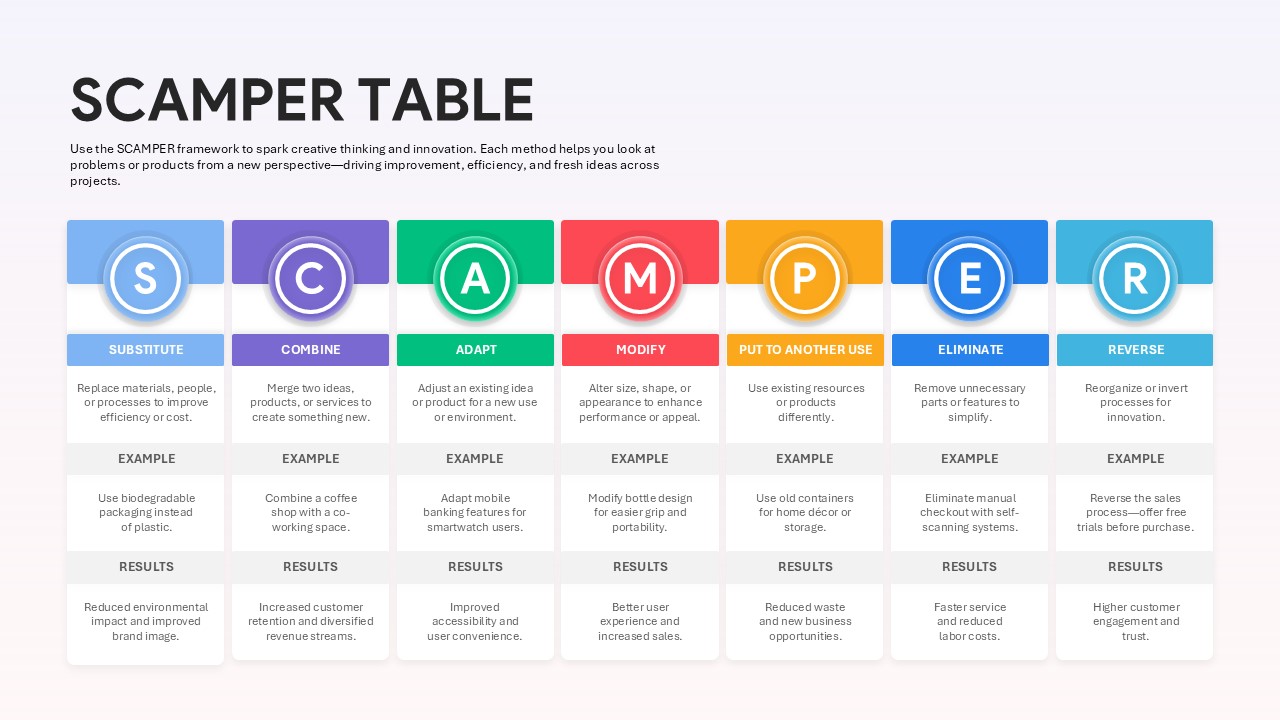
Scamper Table Template for PowerPoint & Google Slides
Table

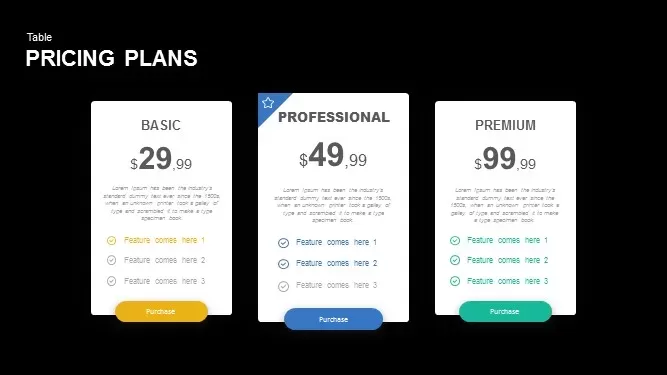
Pricing Plans Table for PowerPoint & Google Slides
Business Proposal
3D Column Chart with Data Table for PowerPoint & Google Slides
Bar/Column
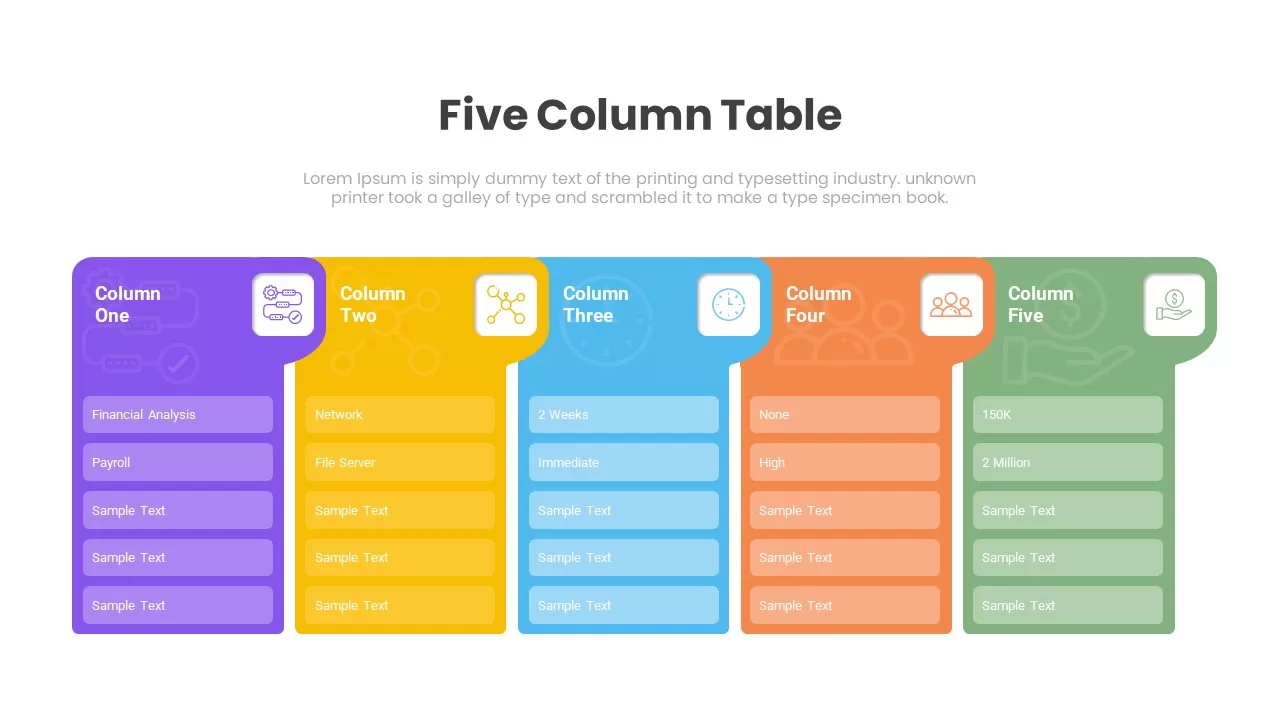
Five Column Table Infographics for PowerPoint & Google Slides
Business
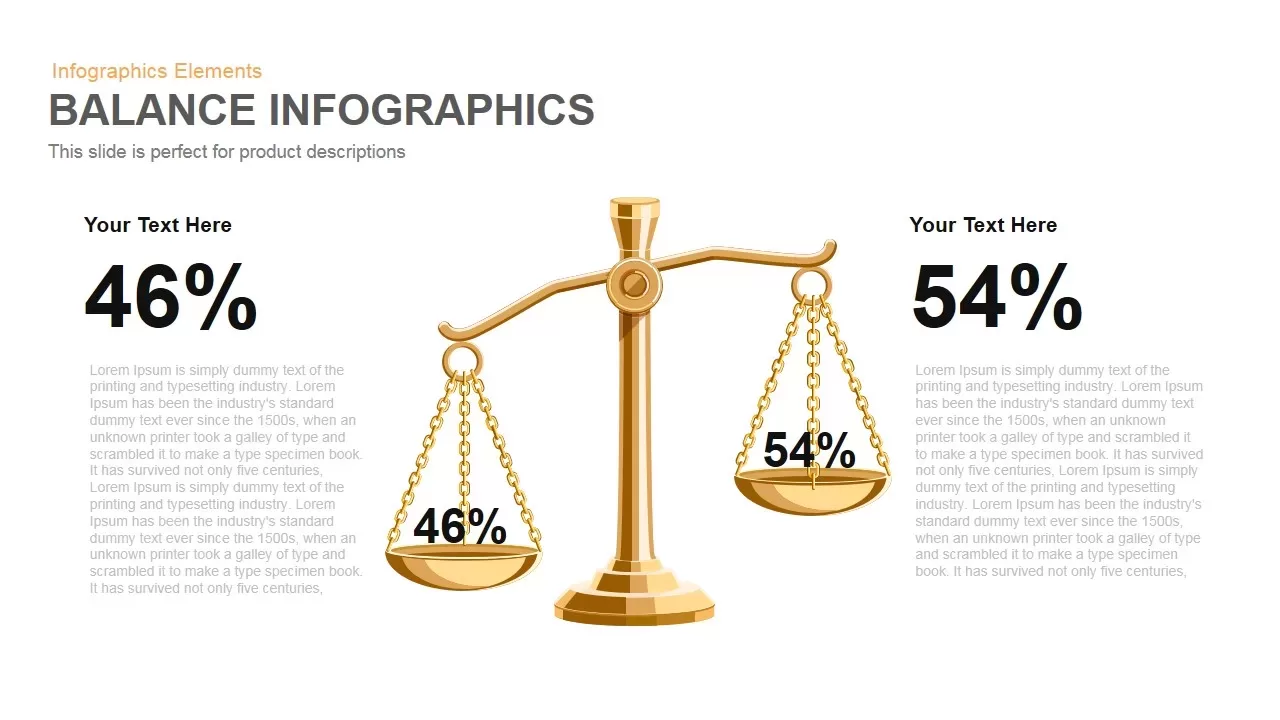
Gold Scales Balance Comparison Template for PowerPoint & Google Slides
Comparison
Comparison Bar Chart template for PowerPoint & Google Slides
Comparison Chart
Gender Comparison People Infographic Template for PowerPoint & Google Slides
Comparison
Four Business Structure Types Comparison Diagram Template for PowerPoint & Google Slides
Business Strategy
Theory X and Theory Y Comparison Template for PowerPoint & Google Slides
Comparison
Current vs Future State Comparison Slide Template for PowerPoint & Google Slides
Comparison Chart
Dynamic Bar-of-Pie Chart Comparison Template for PowerPoint & Google Slides
Pie/Donut
Types of AI Comparison Infographic Template for PowerPoint & Google Slides
AI
Regional Revenue Comparison Overview Template for PowerPoint & Google Slides
Comparison
Profile Comparison Chart template for PowerPoint & Google Slides
Comparison Chart
Integrative Thinking Comparison Diagram Template for PowerPoint & Google Slides
Comparison
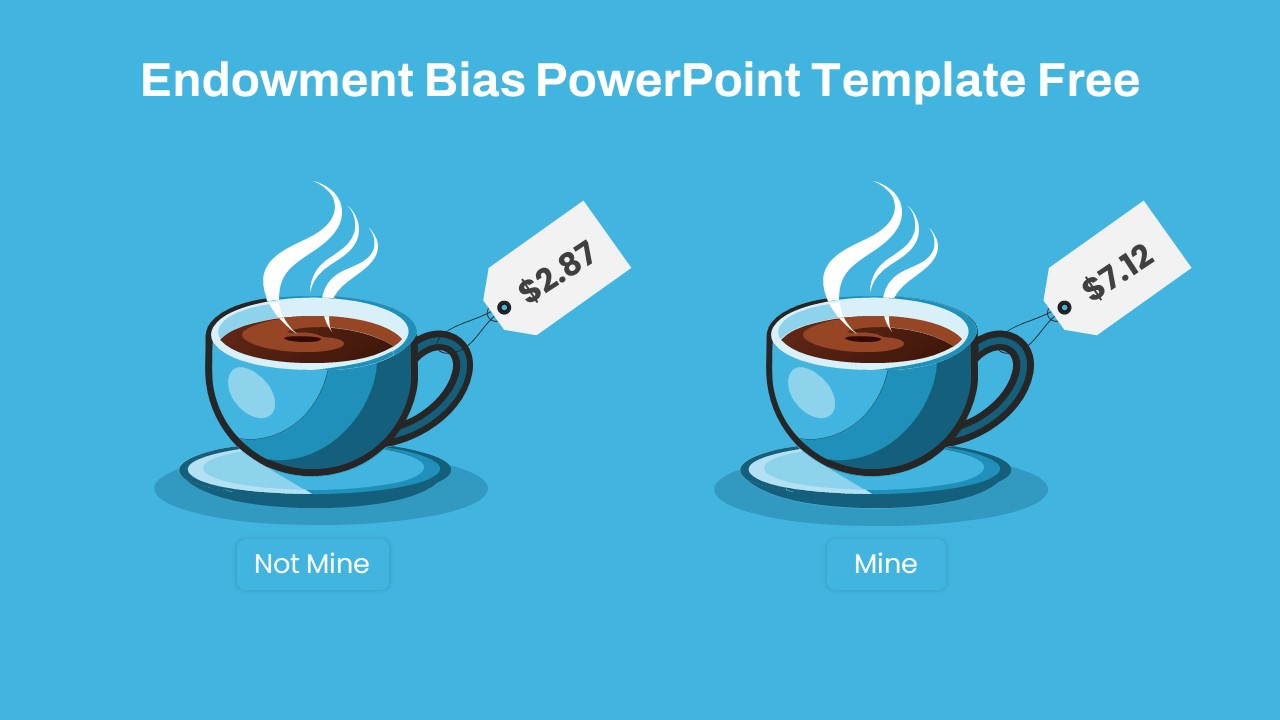
Endowment Bias Coffee Price Comparison Template for PowerPoint & Google Slides
Comparison
Free
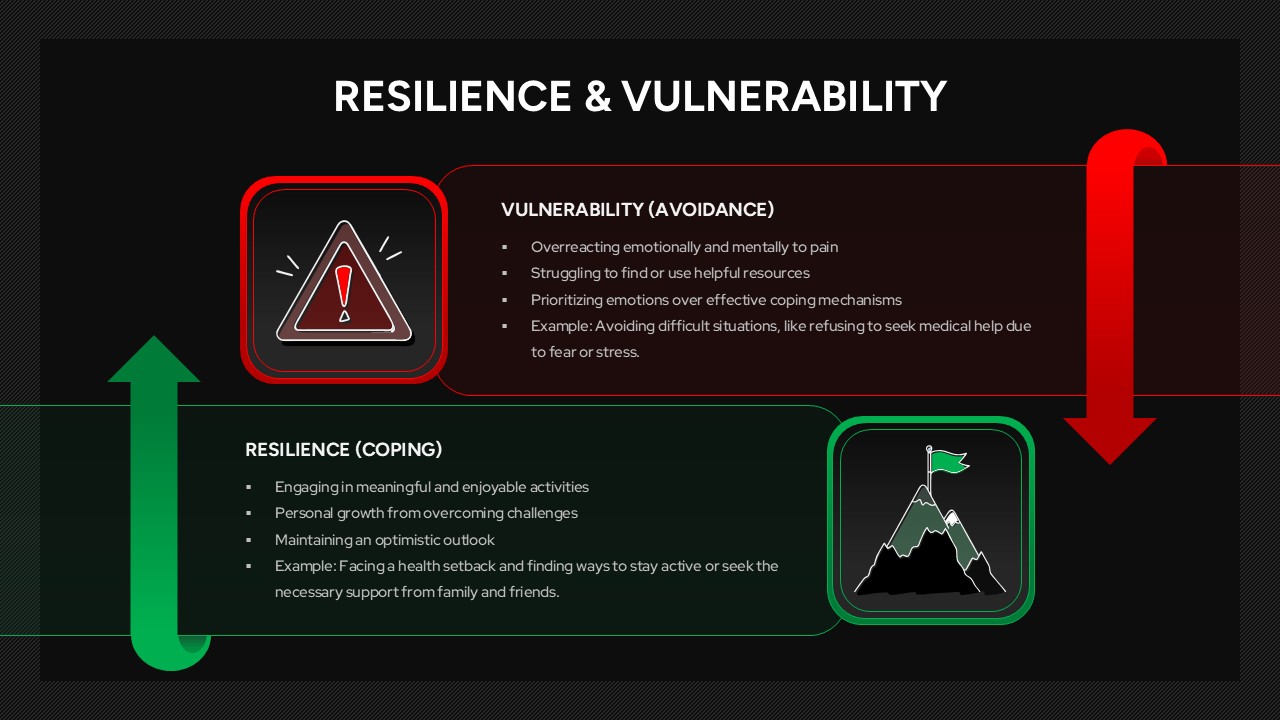
Resilience & Vulnerability Comparison Template for PowerPoint & Google Slides
Comparison
Skills Gap Analysis Comparison Chart Template for PowerPoint & Google Slides
Gap
Attribution Models Comparison Diagram Template for PowerPoint & Google Slides
Comparison
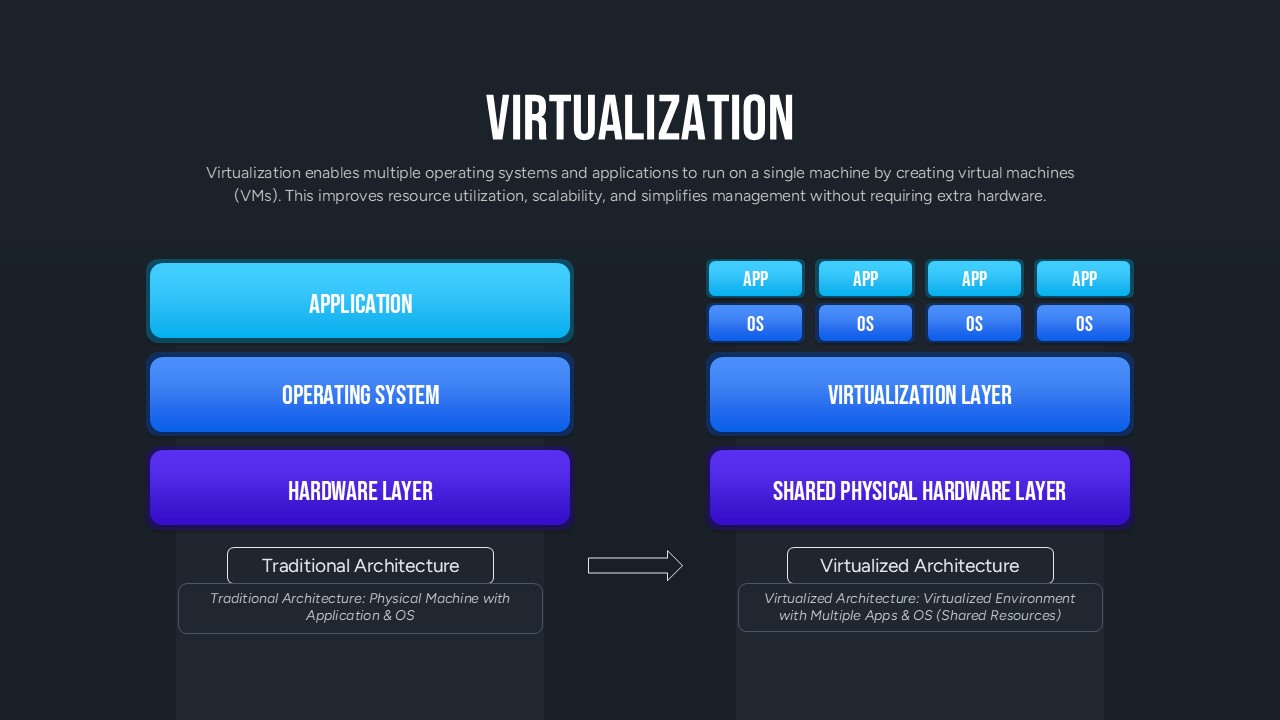
Virtualization Architecture Comparison Template for PowerPoint & Google Slides
Comparison Chart
Year-over-Year Performance Comparison Template for PowerPoint & Google Slides
Comparison Chart