Four SIPOC Diagram Infographic Templates for PowerPoint & Google Slides

Description
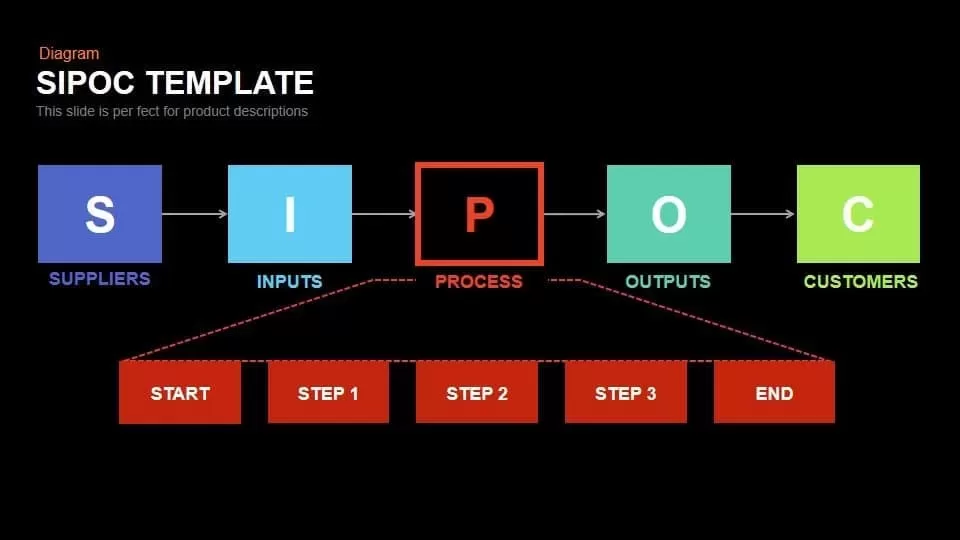
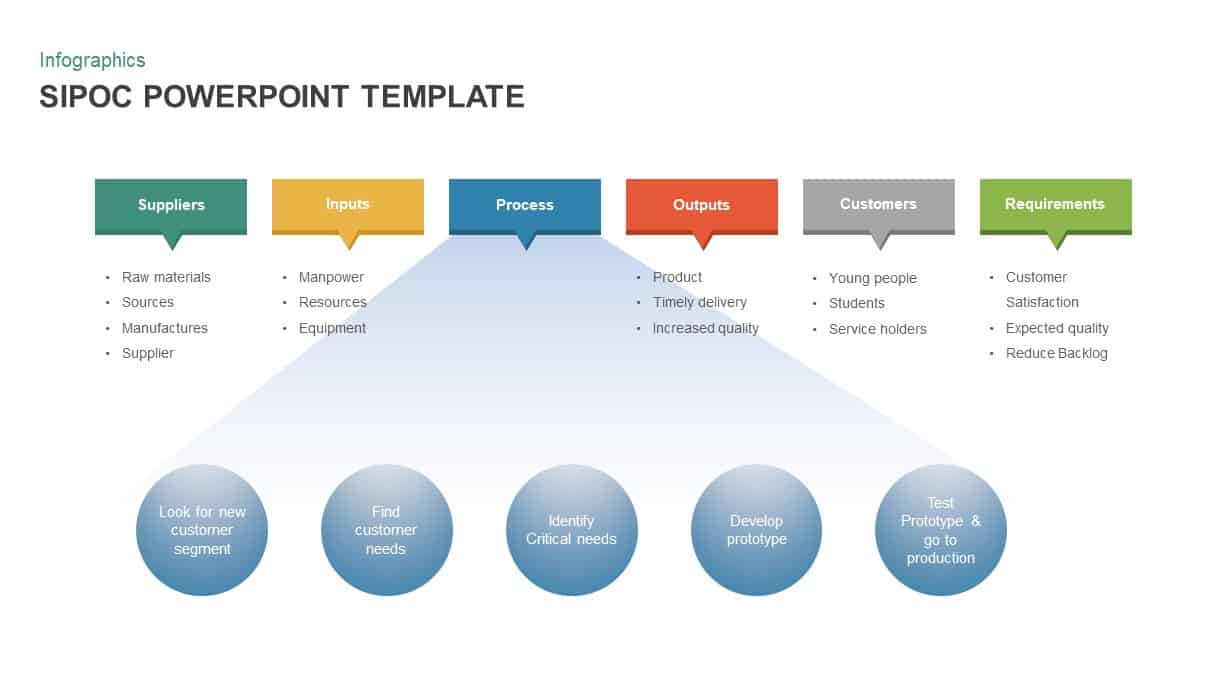
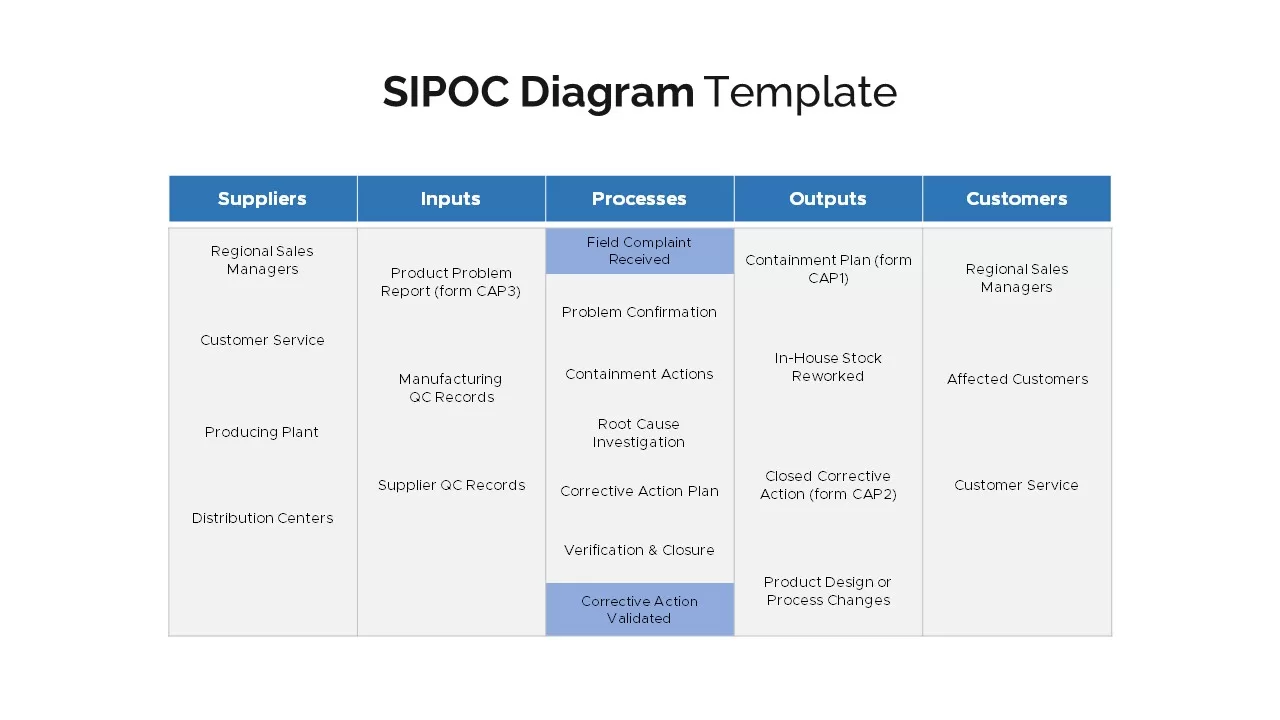
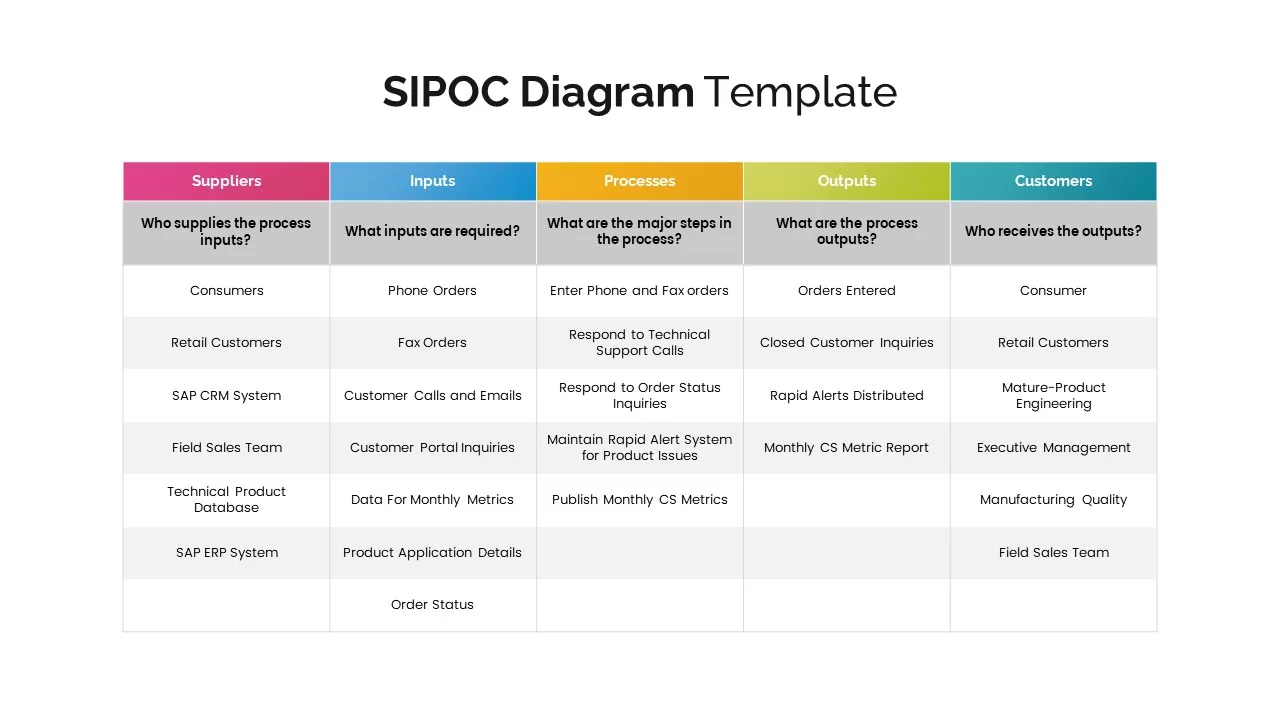
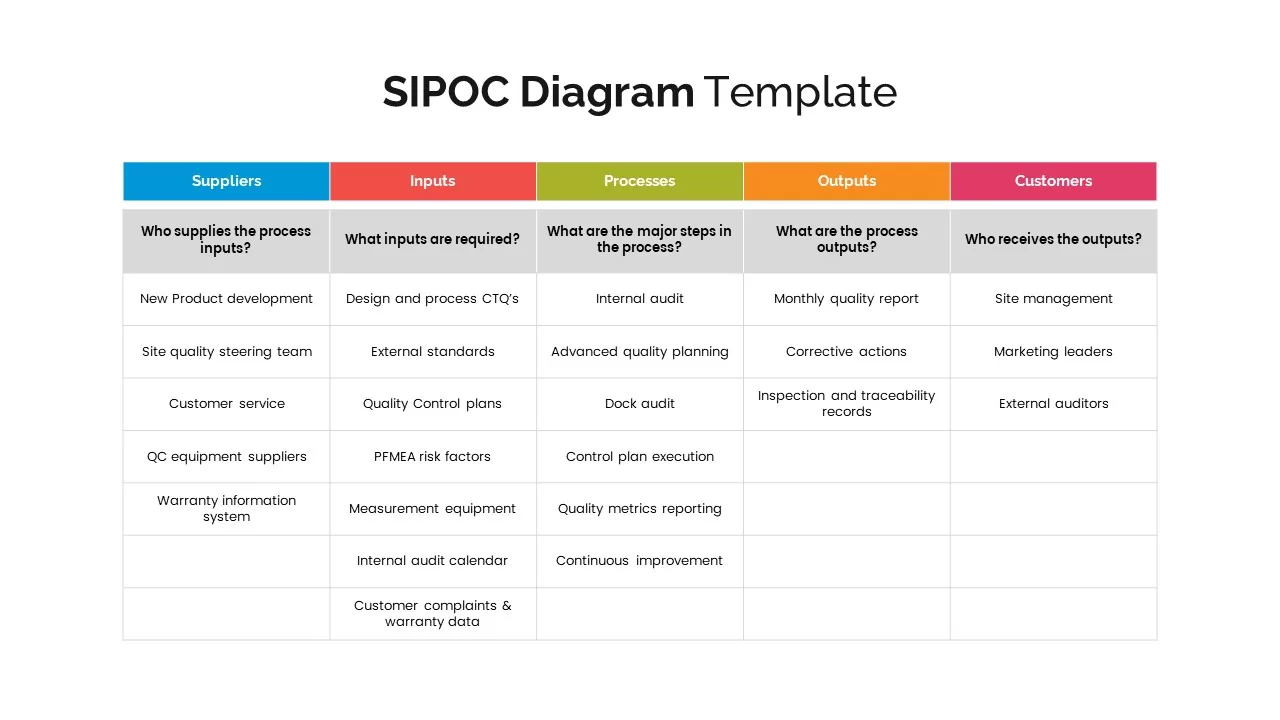
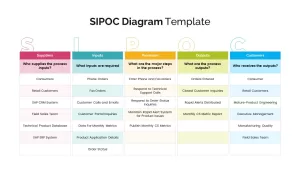
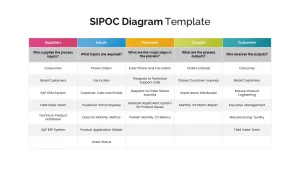
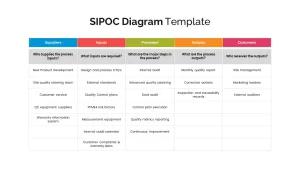
Visualize end-to-end process mapping with this pack of four SIPOC (Suppliers, Inputs, Processes, Outputs, Customers) infographic slides. Each variation features a streamlined table layout with five clearly labeled columns, color-coded headers, and alternating row fills to ensure data readability. Customize each slide by editing supplier lists, input requirements, process steps, output deliverables, and customer segments using drag-and-drop table cells. Auto-align guides, grouping features, and locked layers preserve consistent spacing and alignment when you add or remove rows or adjust column widths. High-contrast typography, subtle drop shadows, and vector-based graphics deliver a polished, professional look that scales crisply across projectors, large-format displays, and remote-meeting screens. Built on fully editable master slides, these infographics allow you to apply your corporate color palette, swap icons inline, and update headers in seconds—eliminating layout headaches and version-control issues between PowerPoint and Google Slides.
Who is it for
Process improvement teams, quality managers, and operational analysts can leverage these SIPOC templates to define process boundaries and align cross-functional stakeholders. Project managers, Six Sigma practitioners, and business consultants will find them ideal for workshop facilitation, root-cause analysis, and stakeholder presentations.
Other Uses
Beyond process mapping, repurpose these tables for RACI matrices, vendor scorecards, input-output analyses, or capability assessments. Use the modular five-column framework to compare business units, audit compliance steps, or illustrate data flow diagrams in any industry context.
Login to download this file

Item ID
SB02338
Related Templates

SIPOC Diagram with Process Breakdown Template for PowerPoint & Google Slides
Process

Color-Coded SIPOC Diagram with Process Flow for PowerPoint & Google Slides
Process
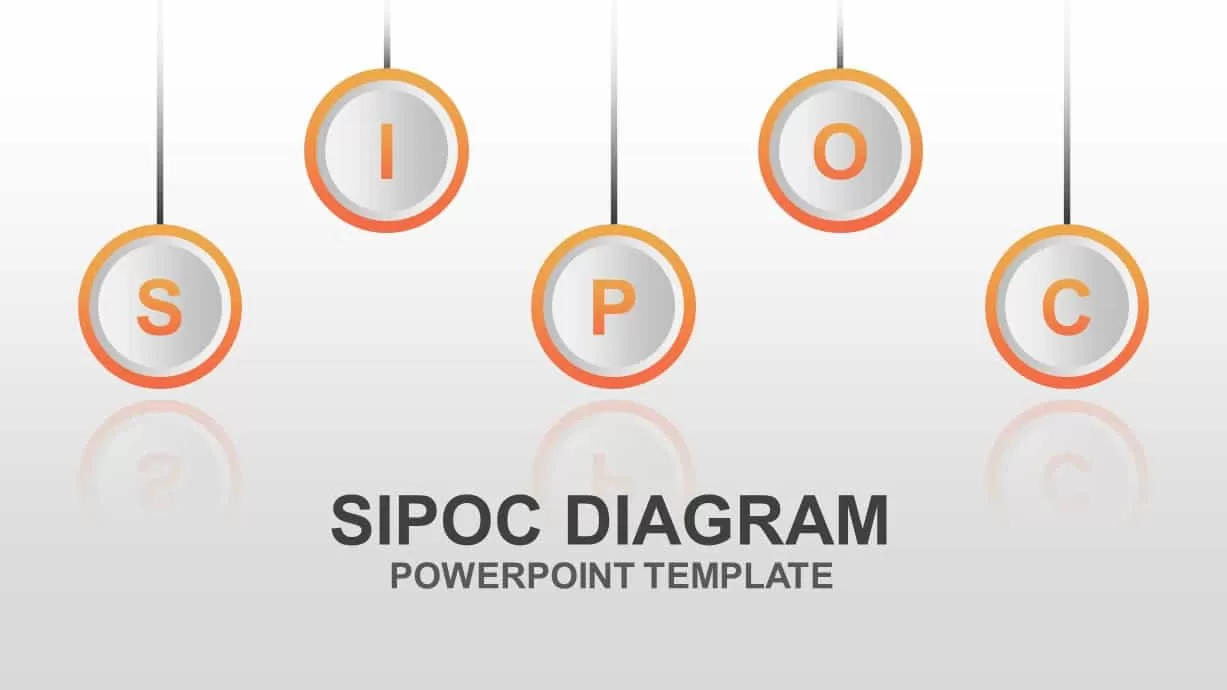
Editable SIPOC Process Diagram Deck Template for PowerPoint & Google Slides
Pitch Deck

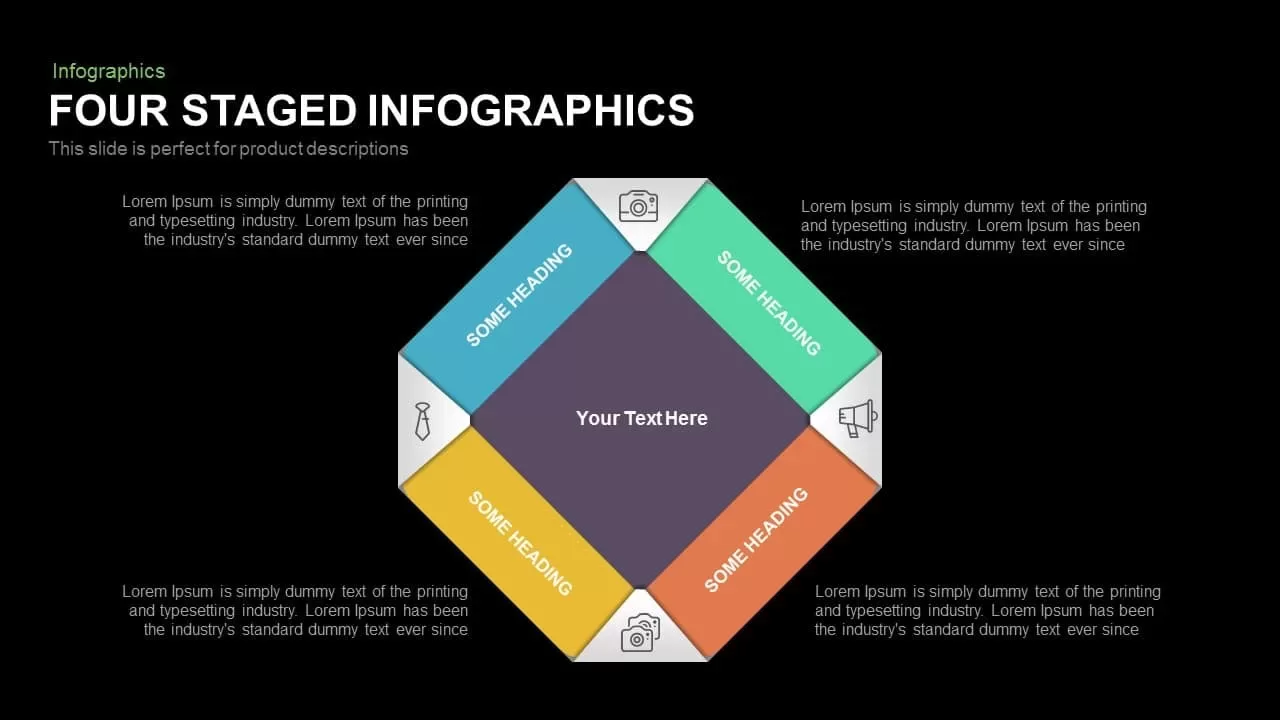
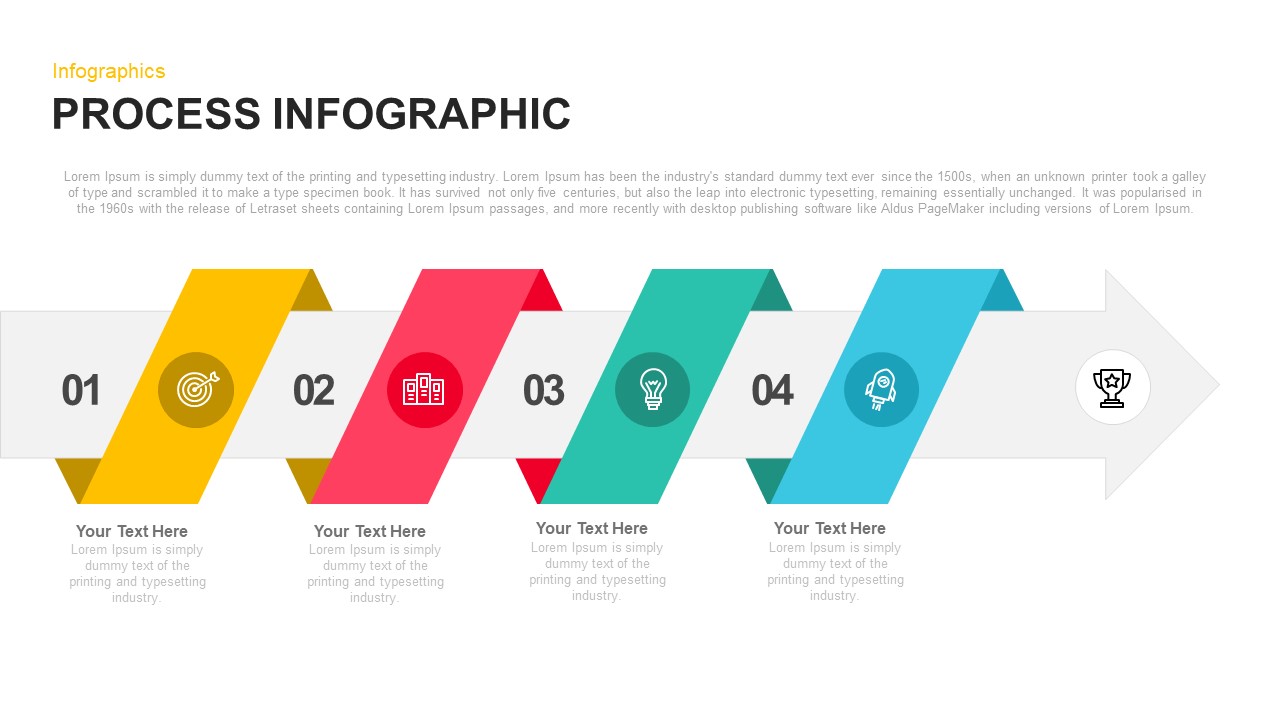
Four-Stage Linear Infographic Diagram Template for PowerPoint & Google Slides
Process
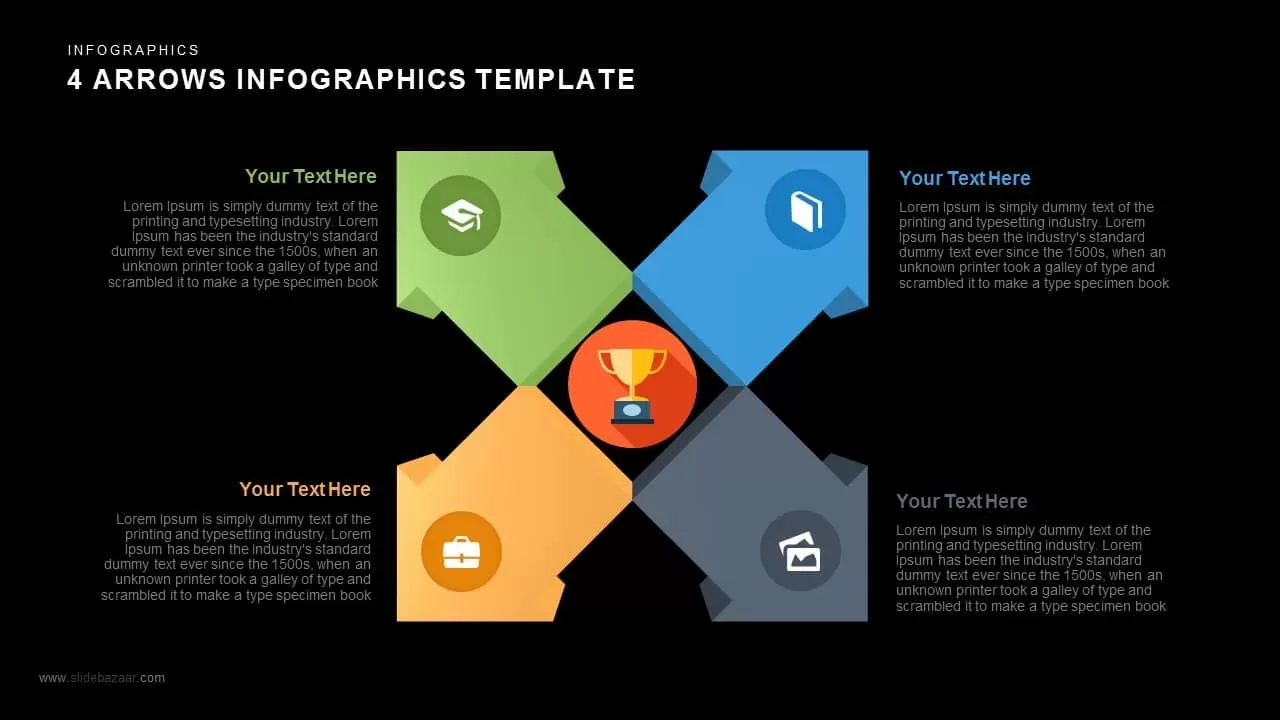
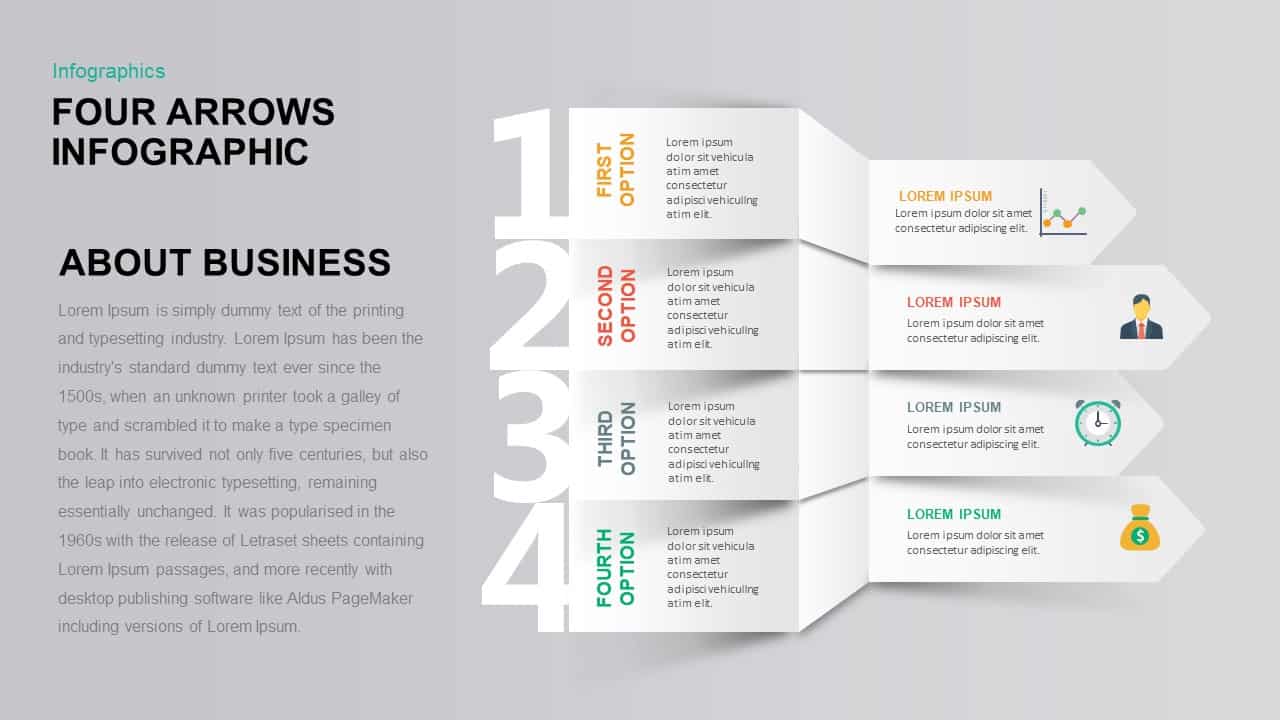
Four-Section Arrow Infographic Diagram Template for PowerPoint & Google Slides
Arrow
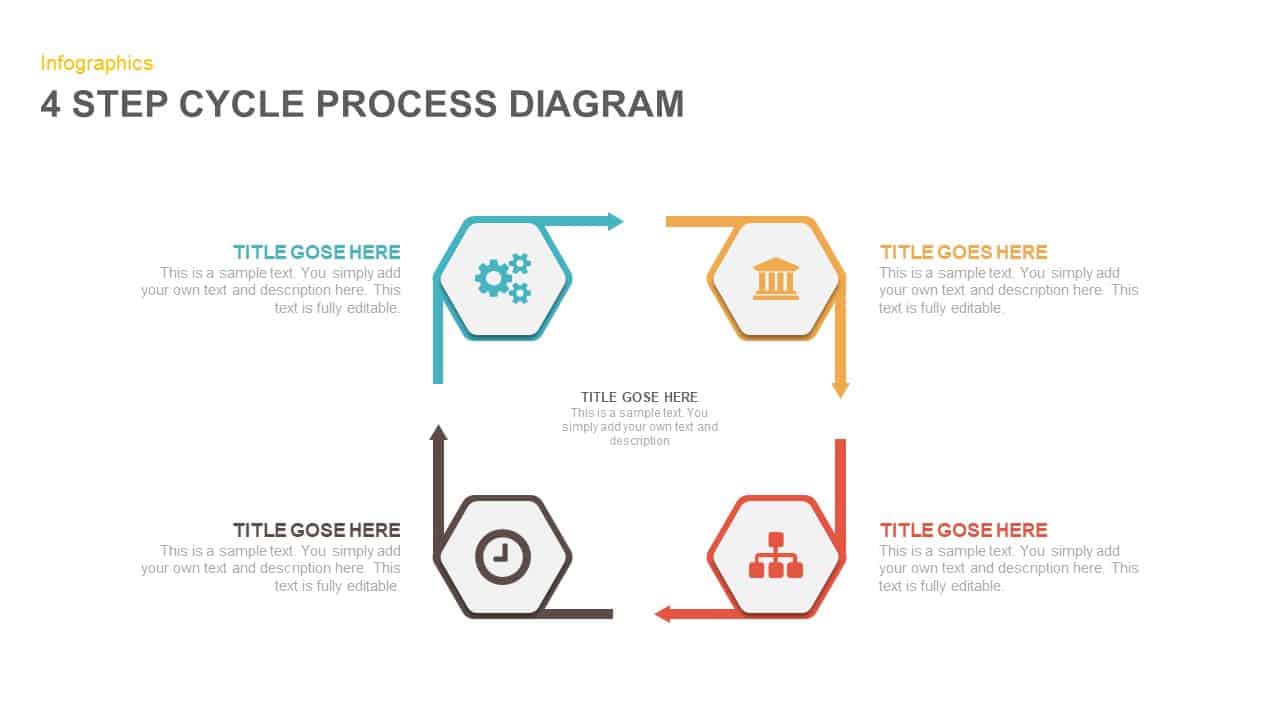
Four-Stage Circular Diagram Infographic Template for PowerPoint & Google Slides
Circular
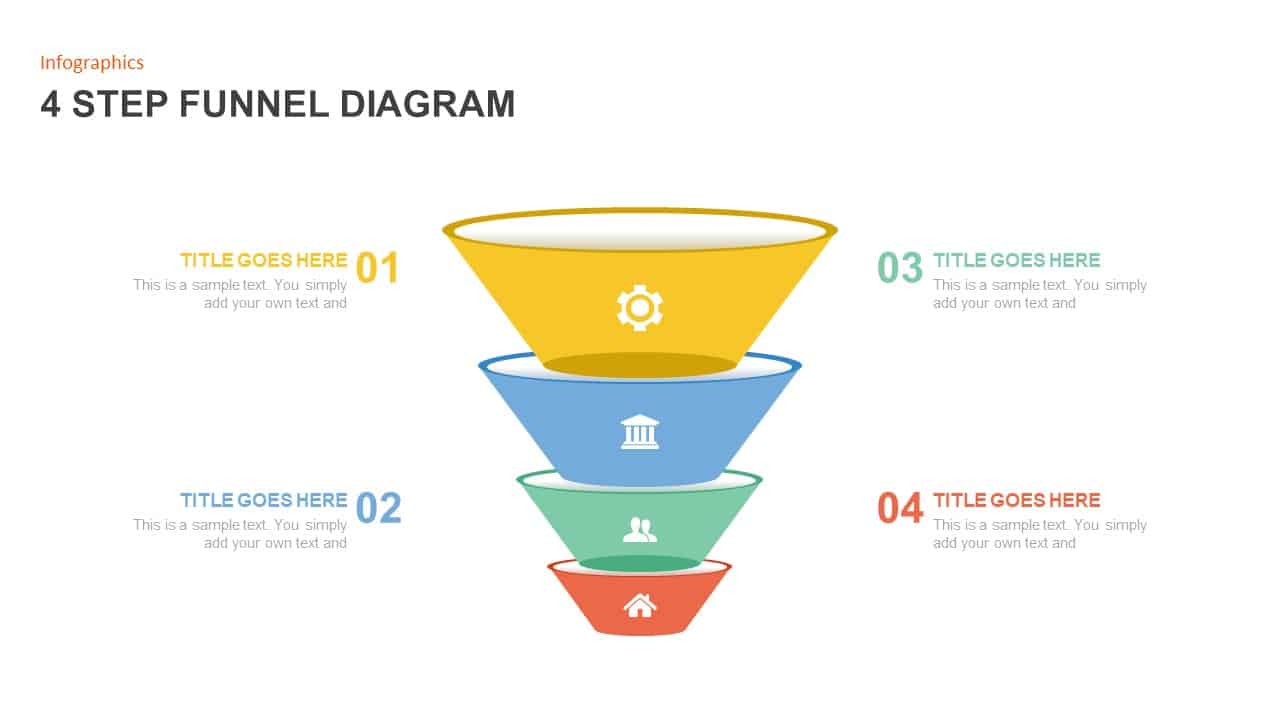
Four-Stage Funnel Diagram Infographic Template for PowerPoint & Google Slides
Funnel
Four-Step Puzzle Diagram Infographic Template for PowerPoint & Google Slides
Process
Four-Stage Funnel Diagram Infographic Template for PowerPoint & Google Slides
Funnel
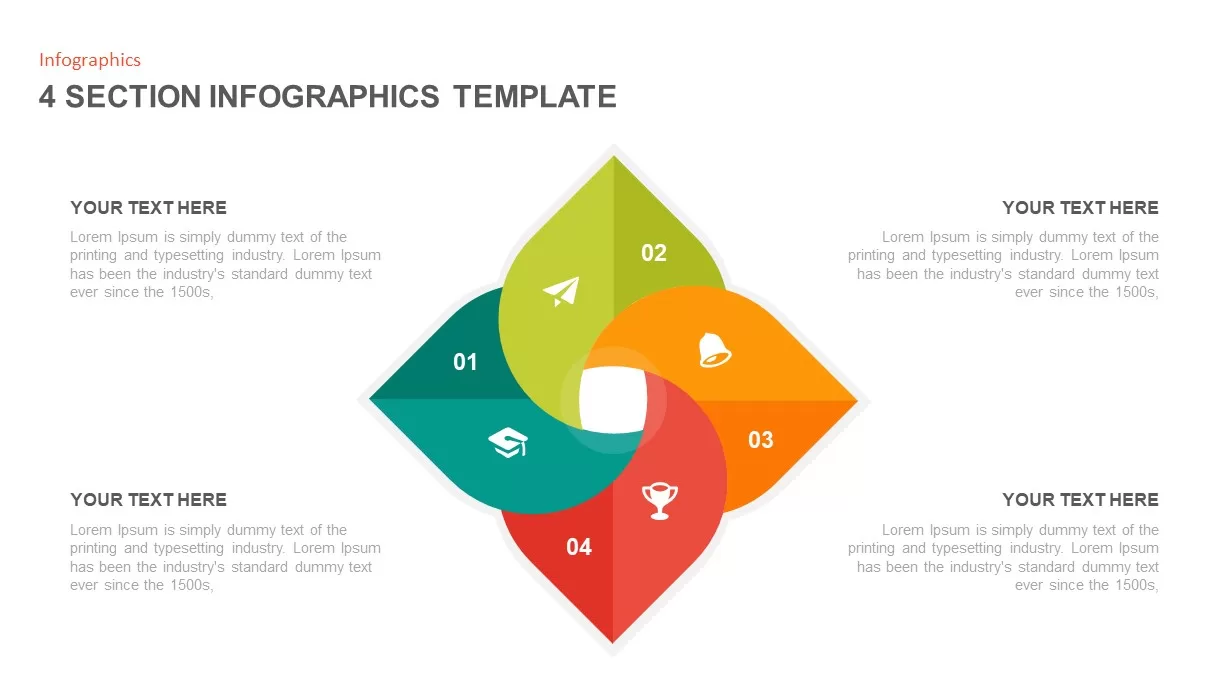
Four Section Infographic Diagram Template for PowerPoint & Google Slides
Circular
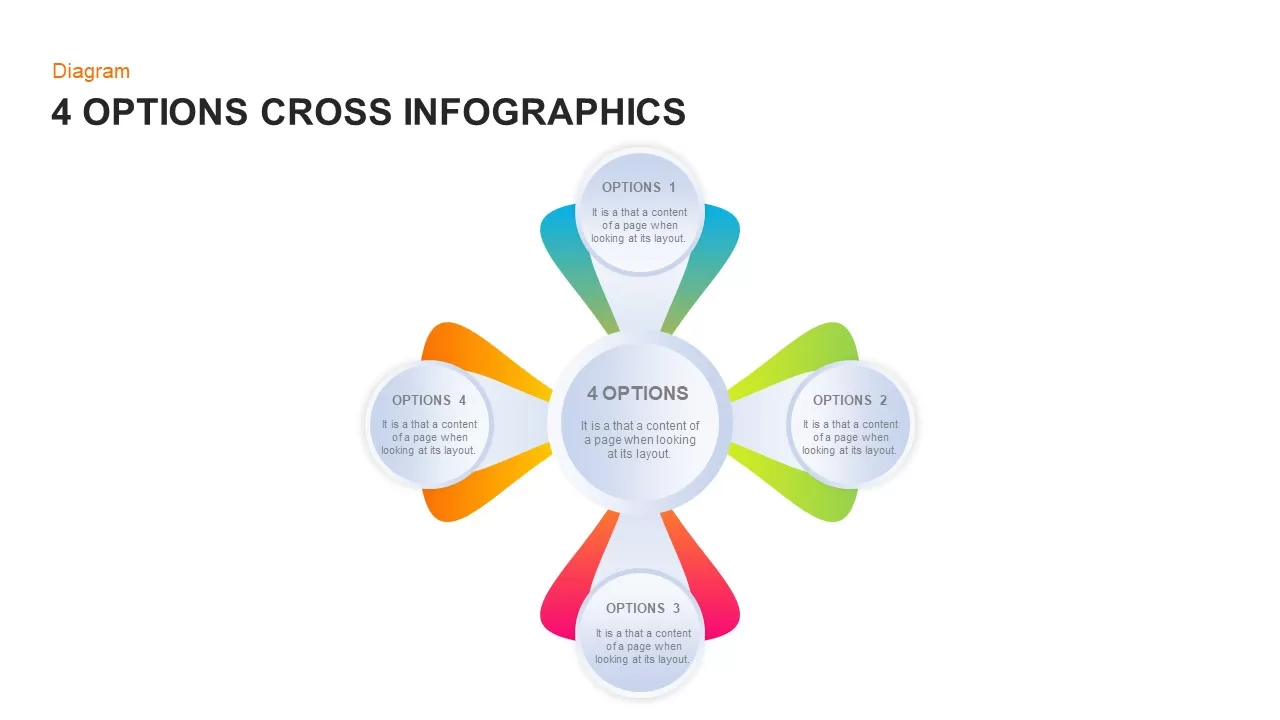
Four-Option Cross Infographic Diagram Template for PowerPoint & Google Slides
Comparison
Four Options Infographic Slides Template for PowerPoint & Google Slides
Comparison
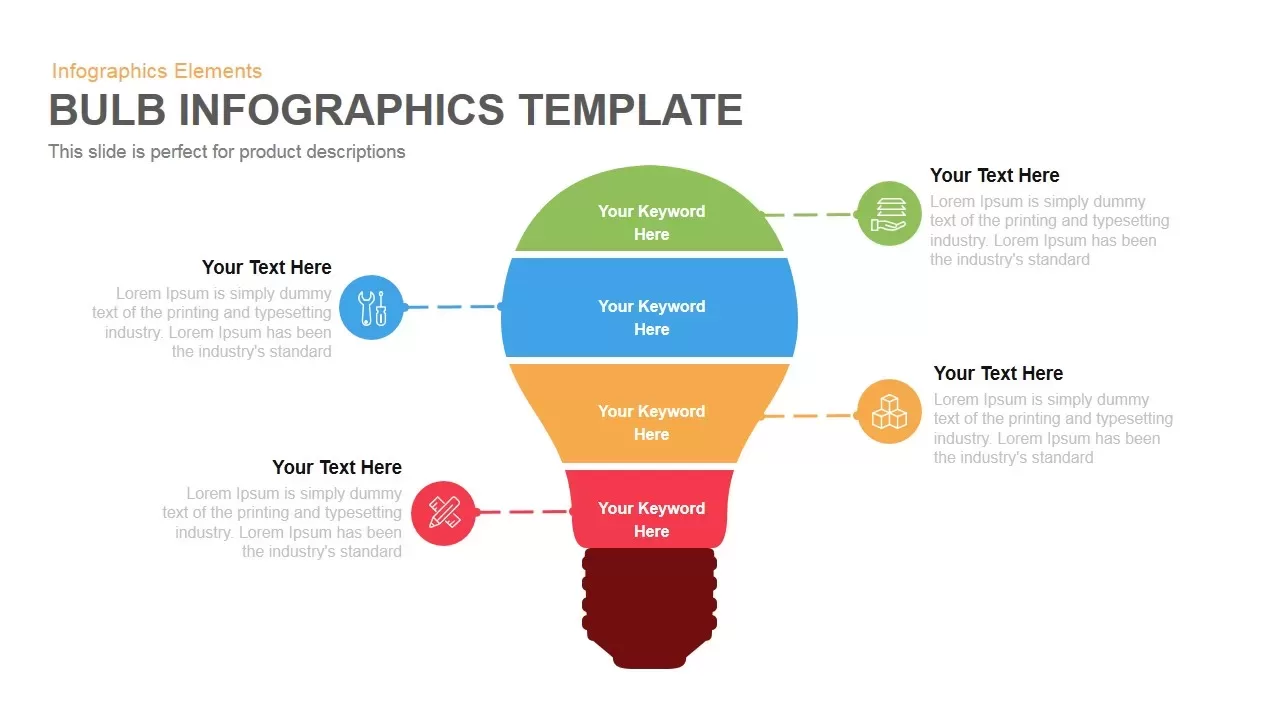
Layered Bulb Infographic Four Segments Template for PowerPoint & Google Slides
Funnel
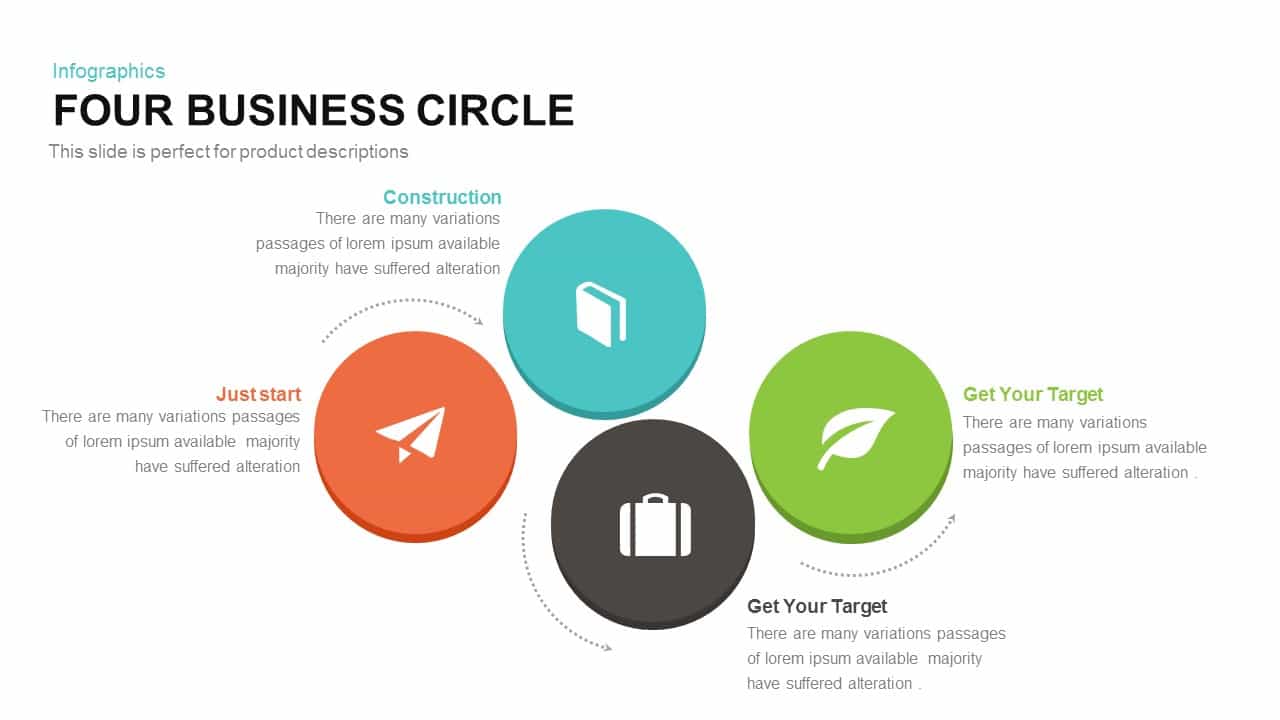
Four-Circle Business Process Infographic Template for PowerPoint & Google Slides
Circular
Three Four Five Stage Timeline Infographic Template for PowerPoint & Google Slides
Timeline
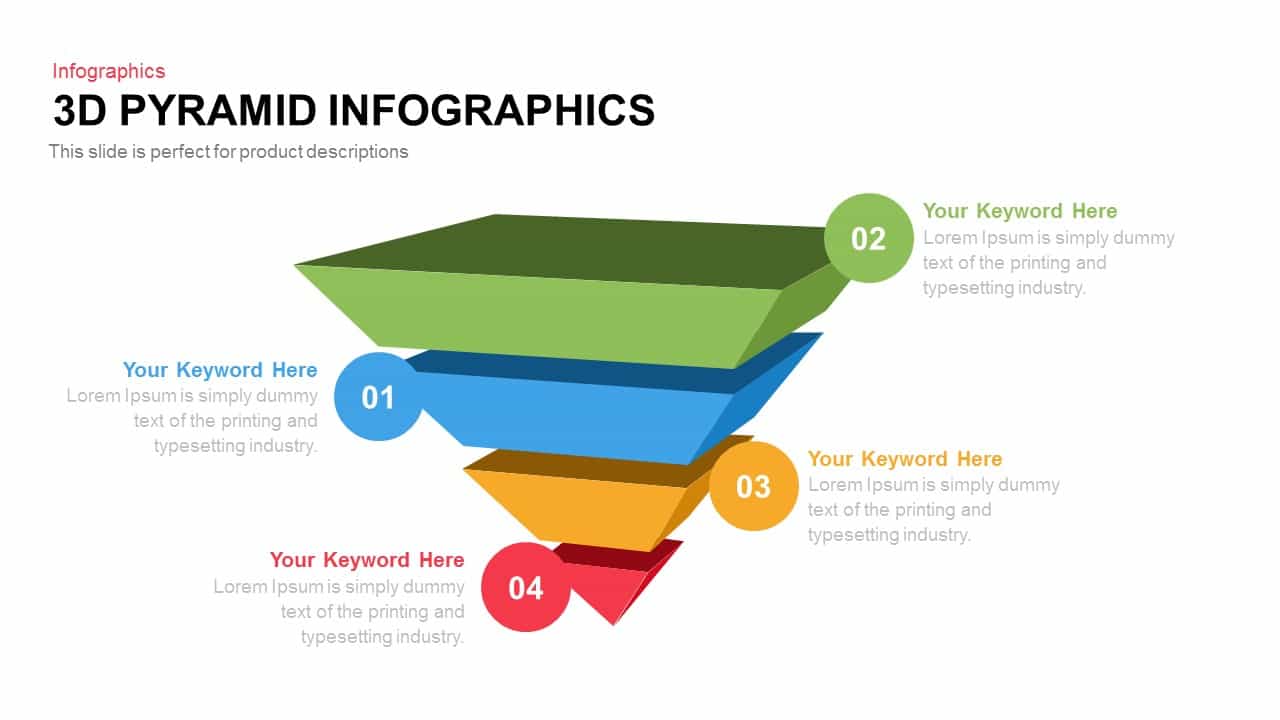
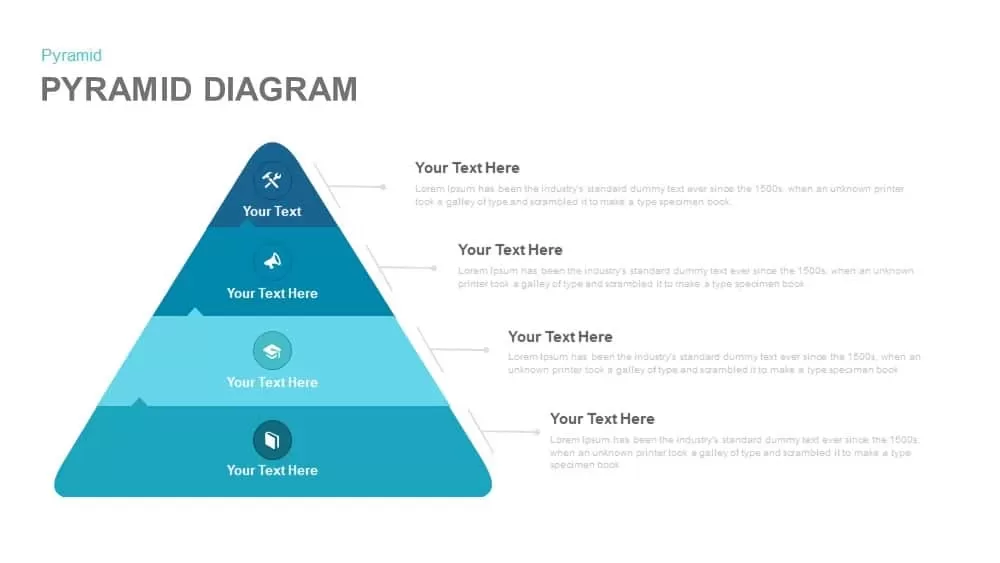
Four-Level 3D Pyramid Infographic Template for PowerPoint & Google Slides
Pyramid
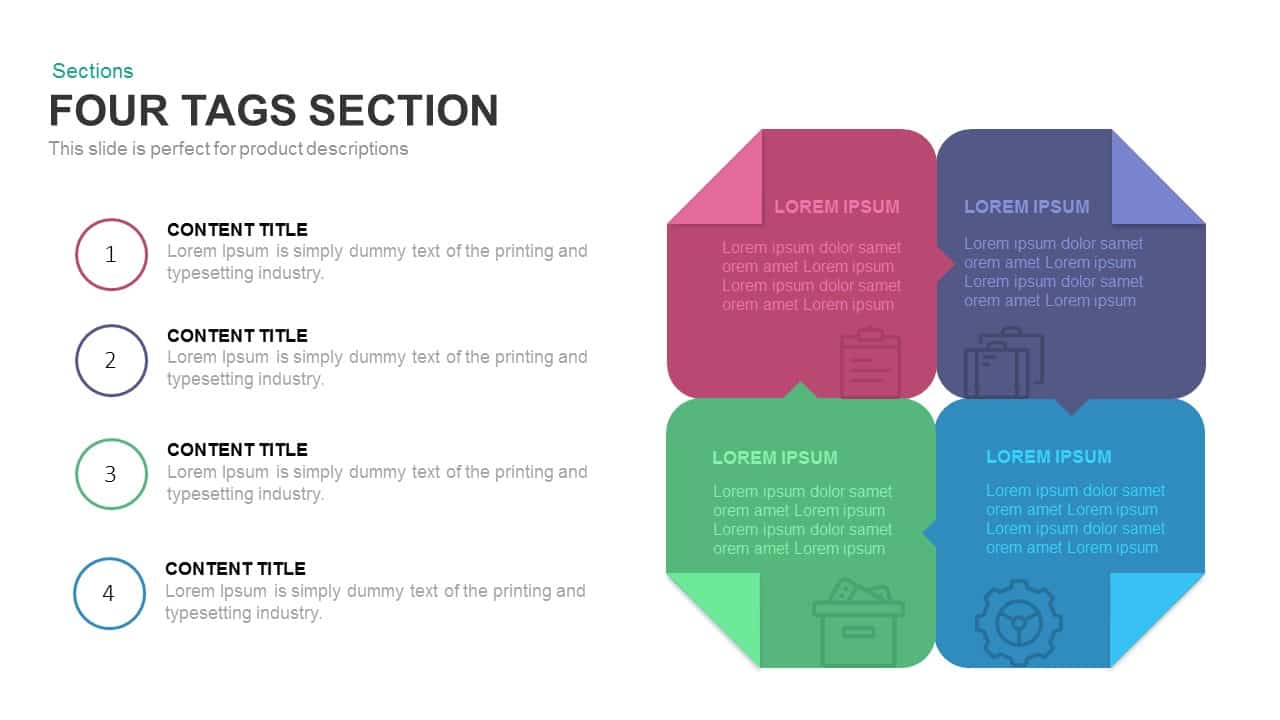
Four-Tag Section Ribbon Infographic Template for PowerPoint & Google Slides
Comparison
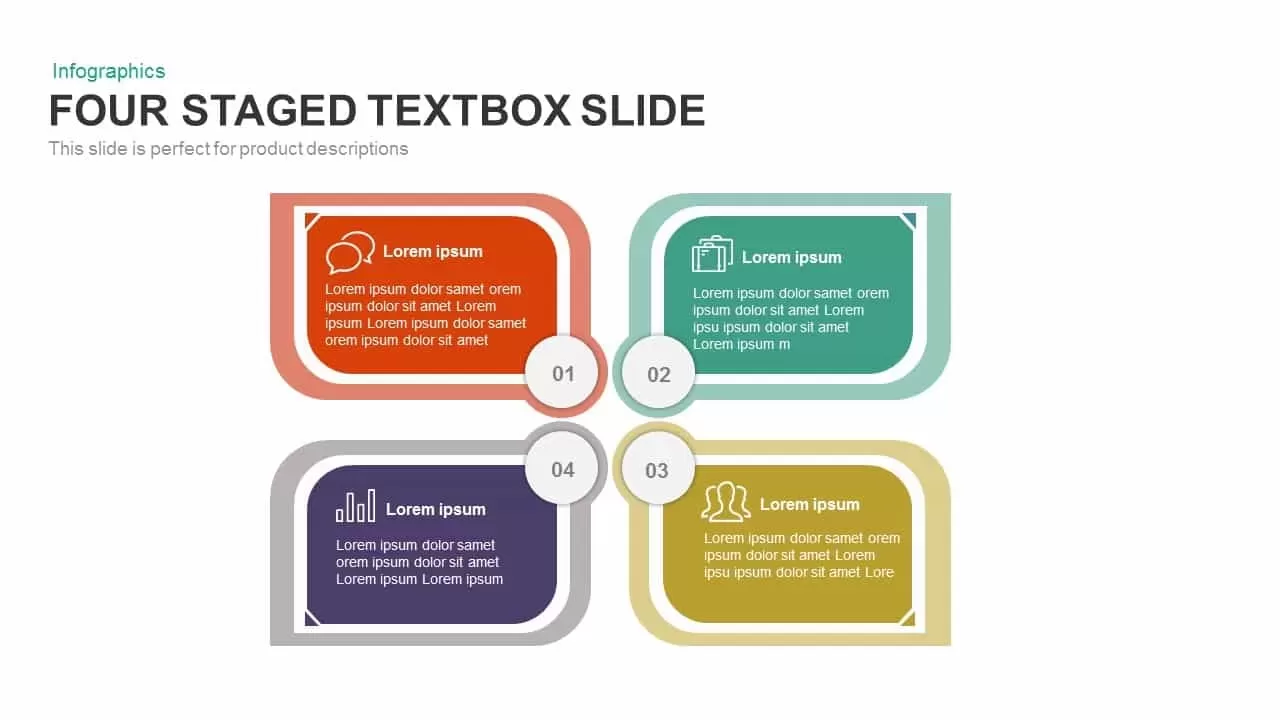
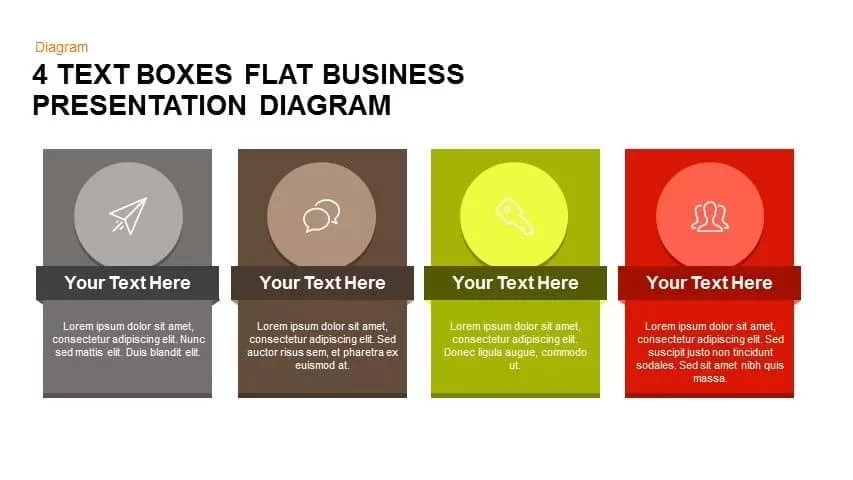
Four-Staged Textbox Infographic Template for PowerPoint & Google Slides
Process
Colorful Four-Stage Infographic Process Template for PowerPoint & Google Slides
Process
Four Arrows Layout Infographic with Icon Template for PowerPoint & Google Slides
Arrow
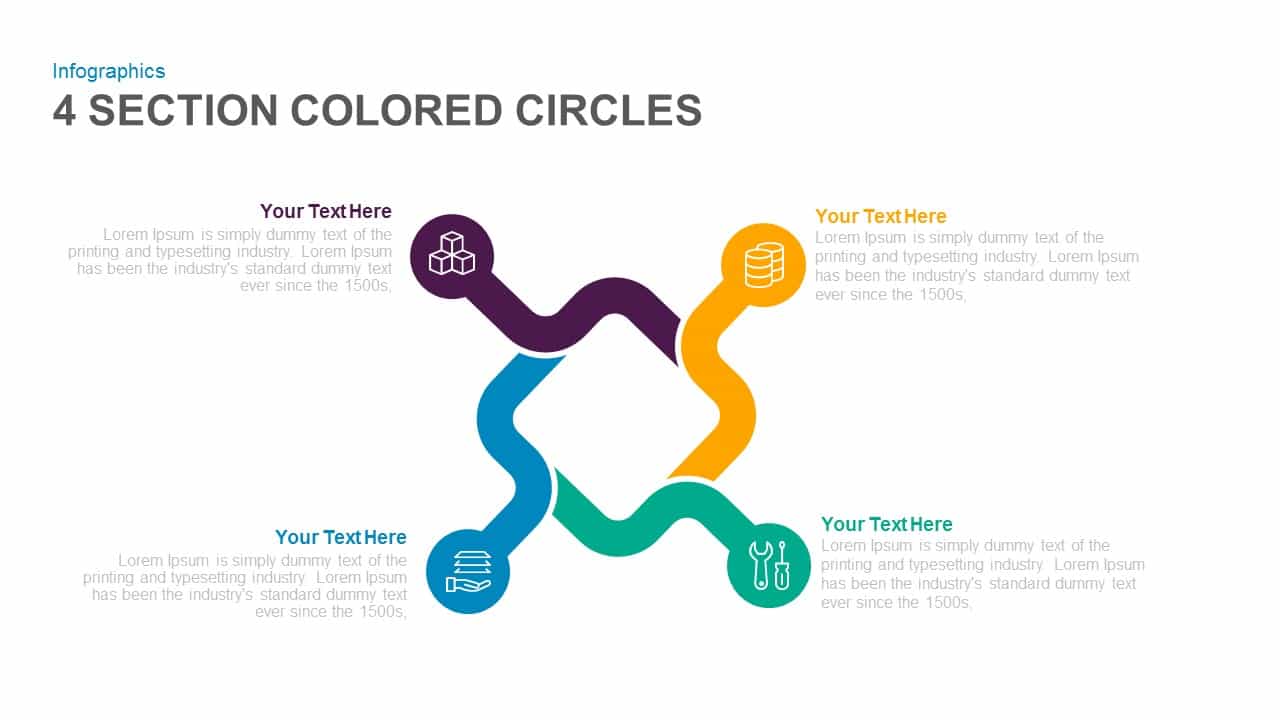
Four-Section Colored Circle Infographic Template for PowerPoint & Google Slides
Circular

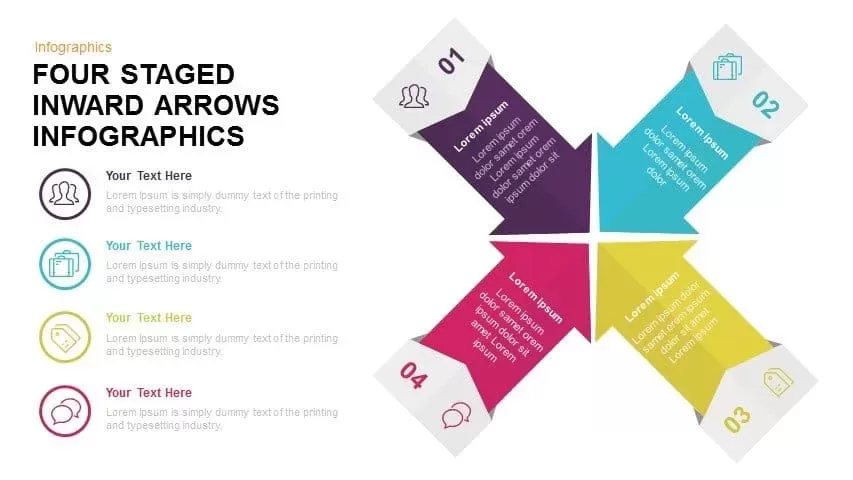
Four Staged Inward Arrows Infographic Template for PowerPoint & Google Slides
Arrow
Four-Step Arrow Process Infographic Template for PowerPoint & Google Slides
Arrow
Four-Option 4-Step Arrow Infographic Template for PowerPoint & Google Slides
Arrow
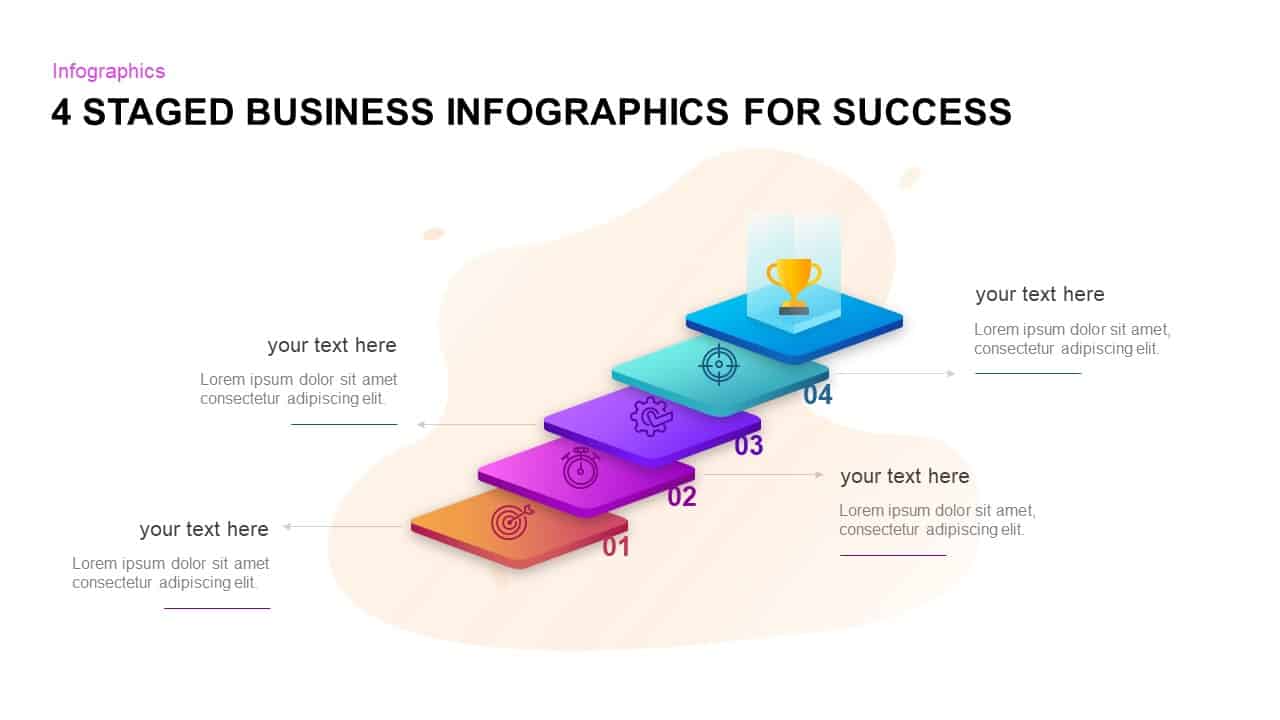
Four-Stage Business Success Infographic Template for PowerPoint & Google Slides
Process
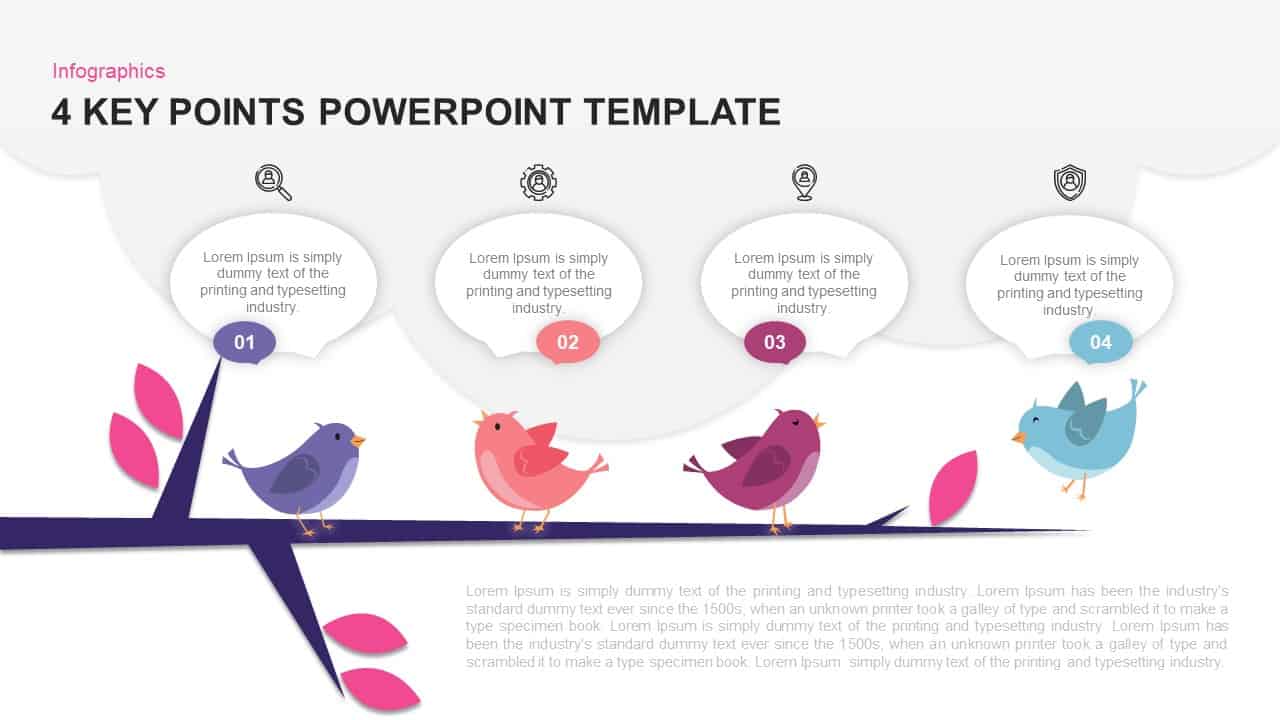
Bird Branch Four Key Points Infographic Template for PowerPoint & Google Slides
Agenda
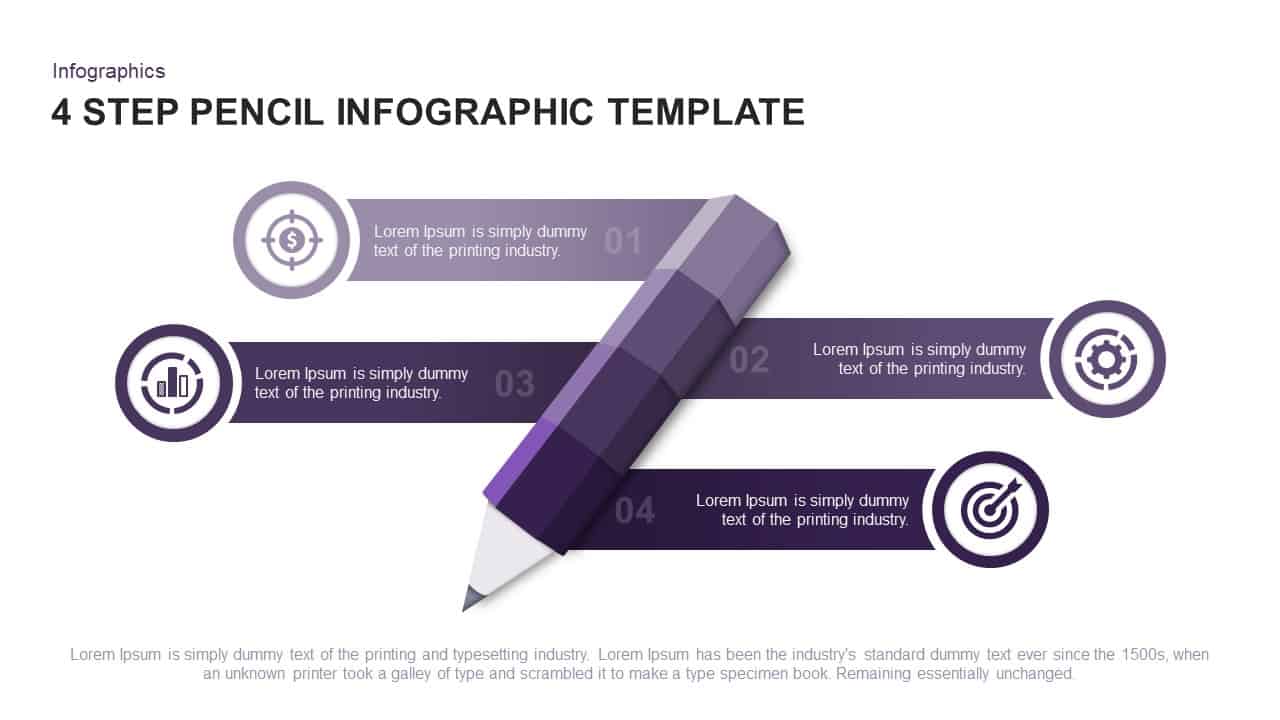
Four-Step Pencil Infographic Process Template for PowerPoint & Google Slides
Process
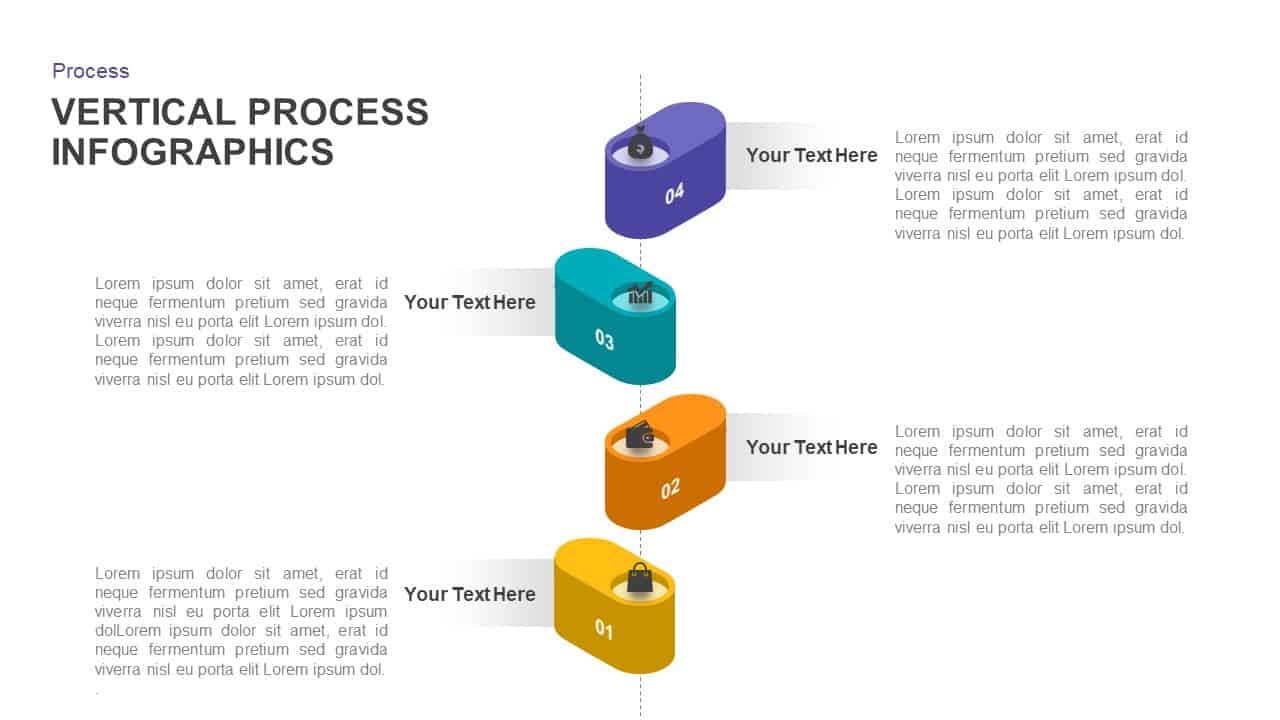
Vertical Four-Step Process Infographic Template for PowerPoint & Google Slides
Process
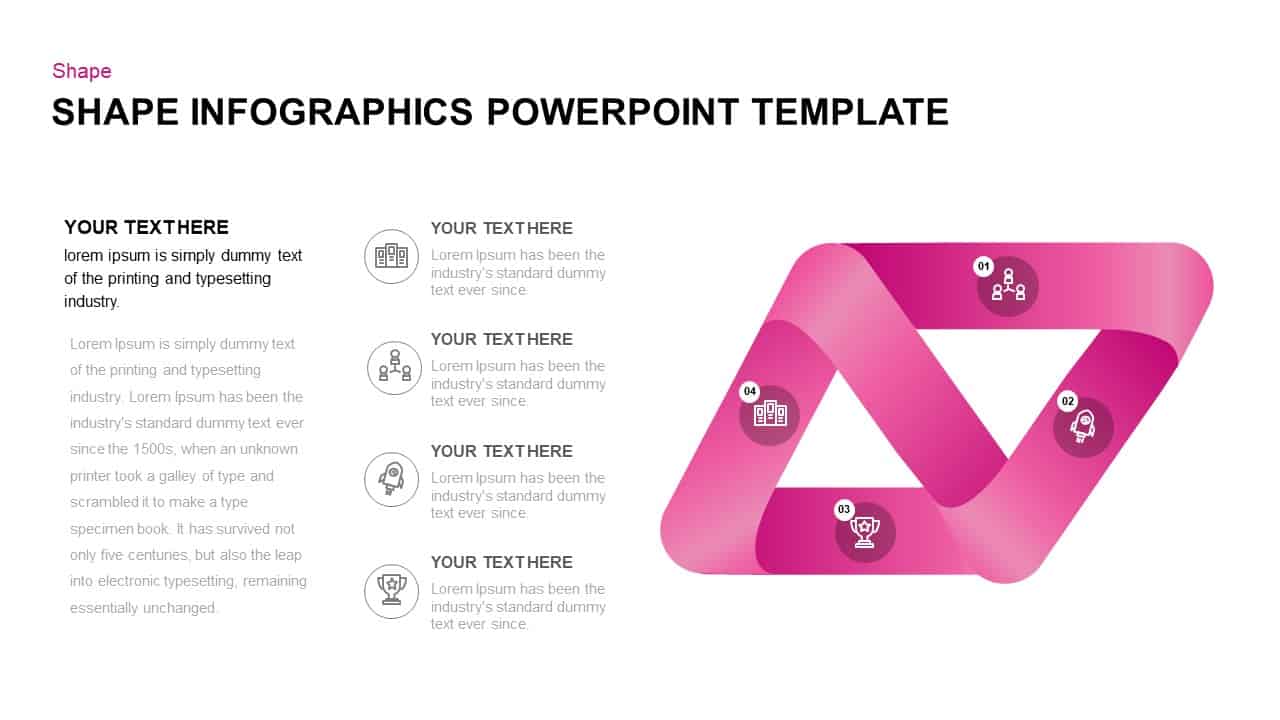
Shape Loop Four-Step Infographic Slide Template for PowerPoint & Google Slides
Process
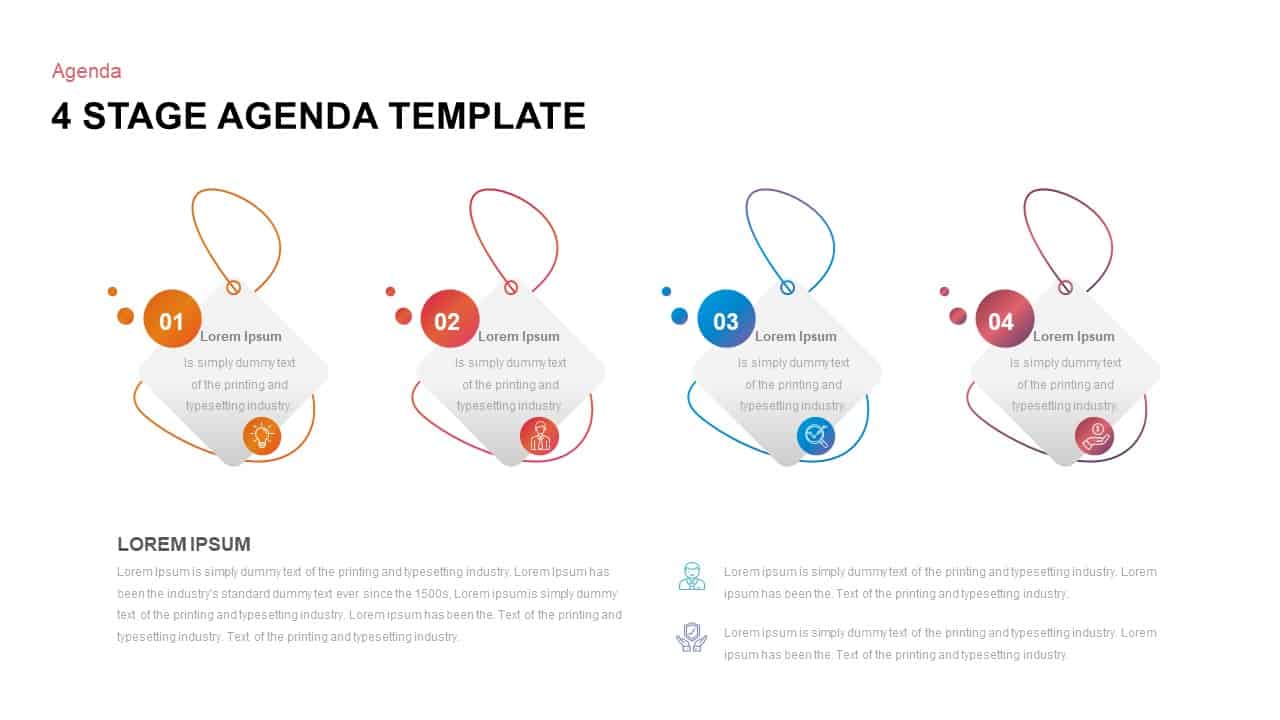
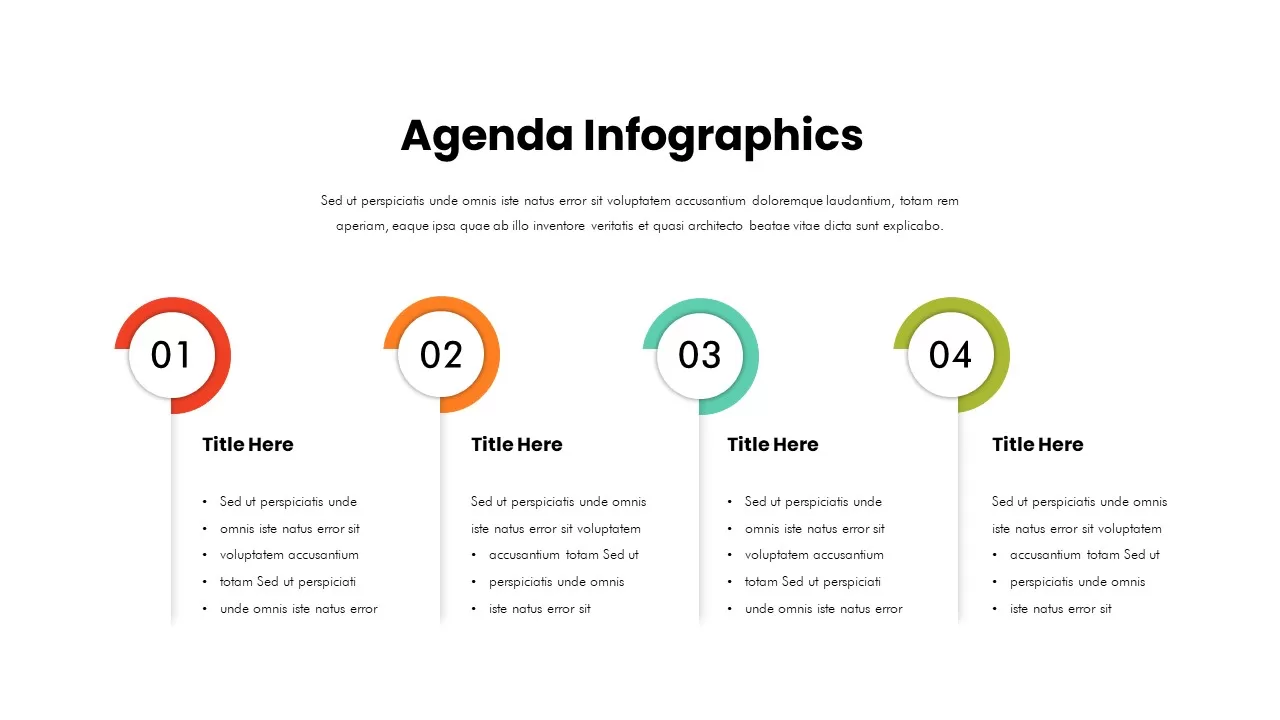
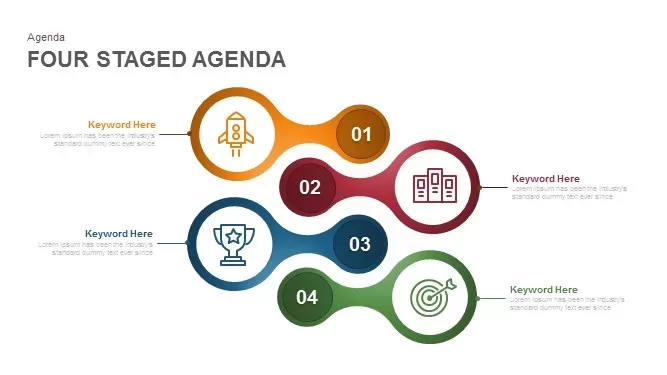
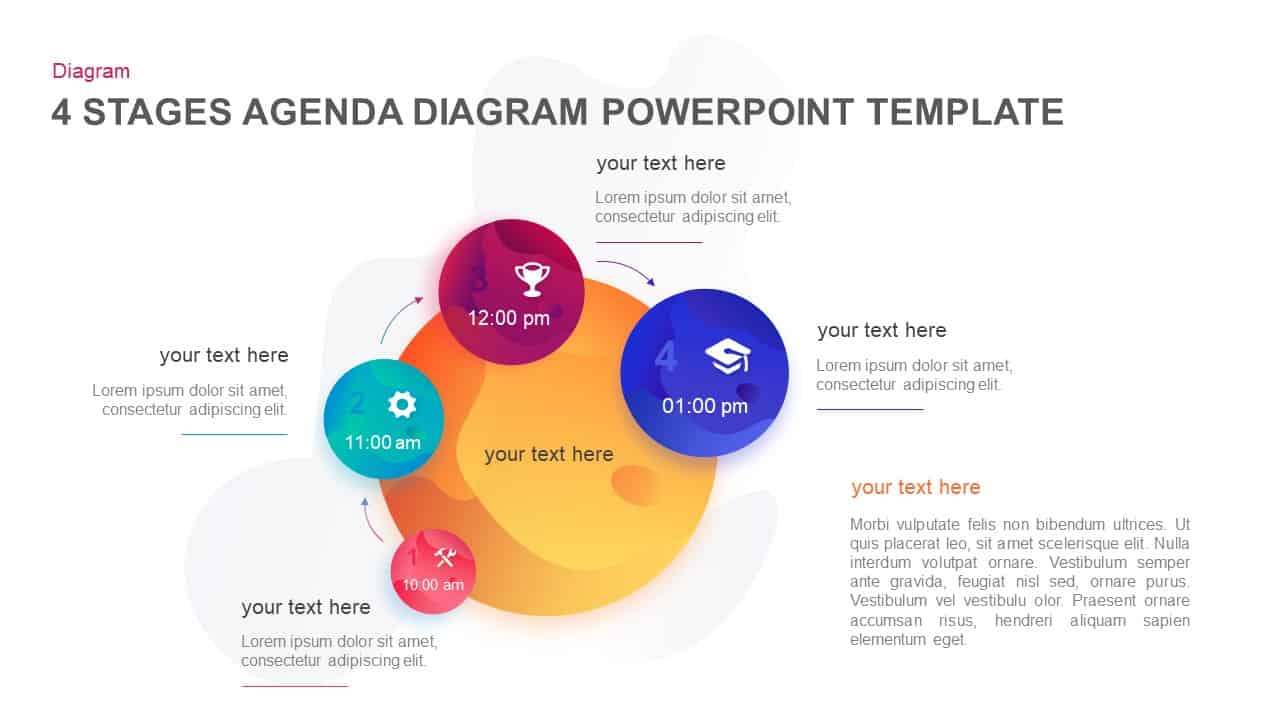
Four-Stage Agenda Infographic Slide Template for PowerPoint & Google Slides
Agenda
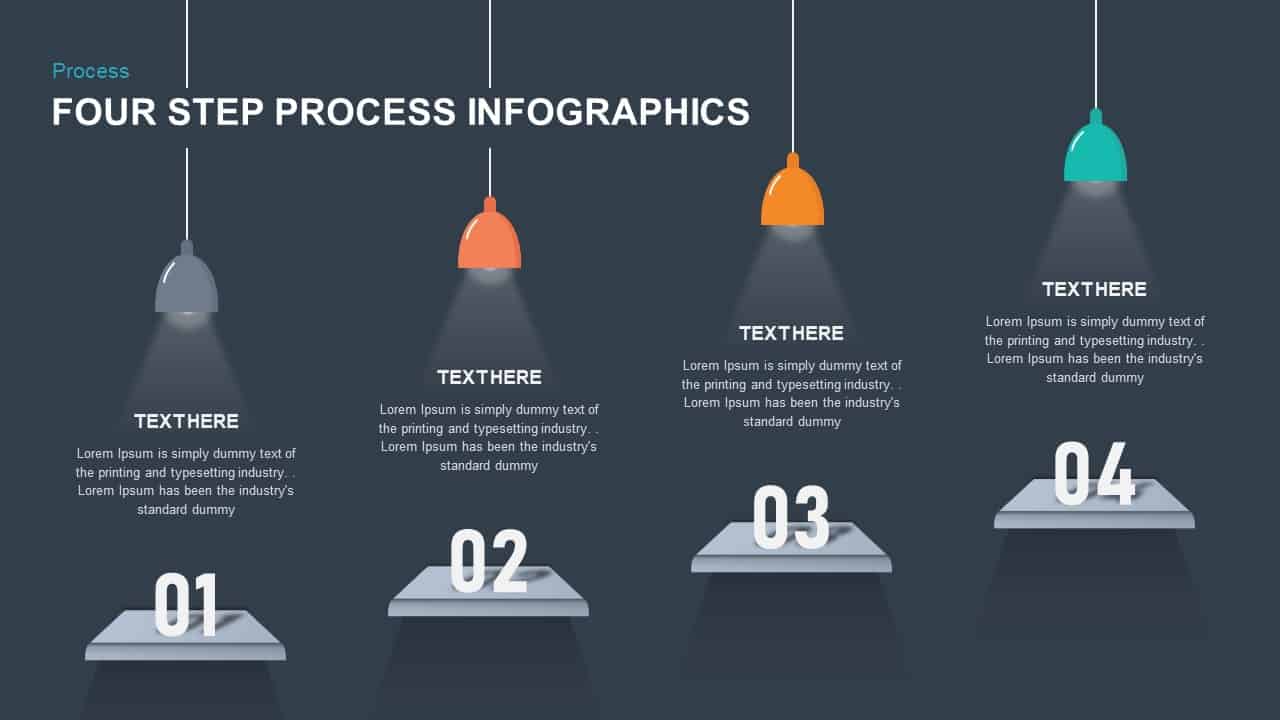
Four Step Process Infographic Slide Template for PowerPoint & Google Slides
Process
Four-Step Hexagon Process Infographic Template for PowerPoint & Google Slides
Process
Four-Step Funnel Infographic Pack Template for PowerPoint & Google Slides
Funnel
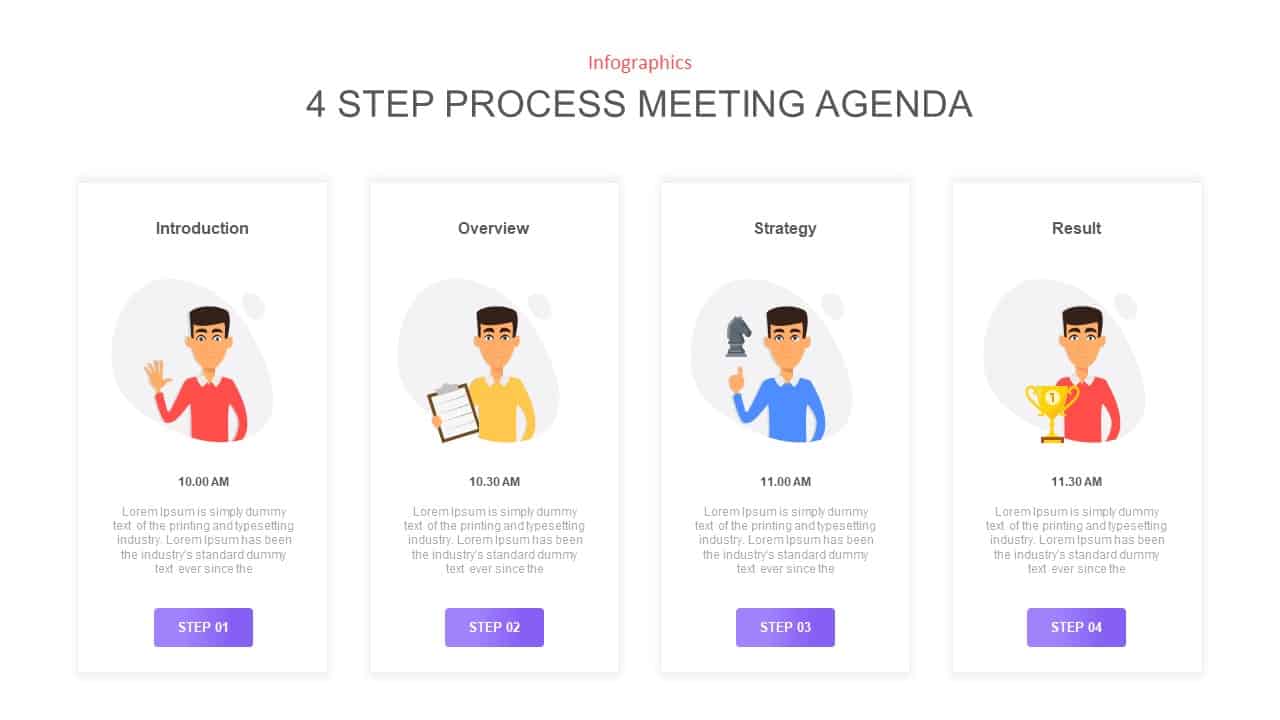
Four-Step Meeting Agenda Infographic Template for PowerPoint & Google Slides
Agenda
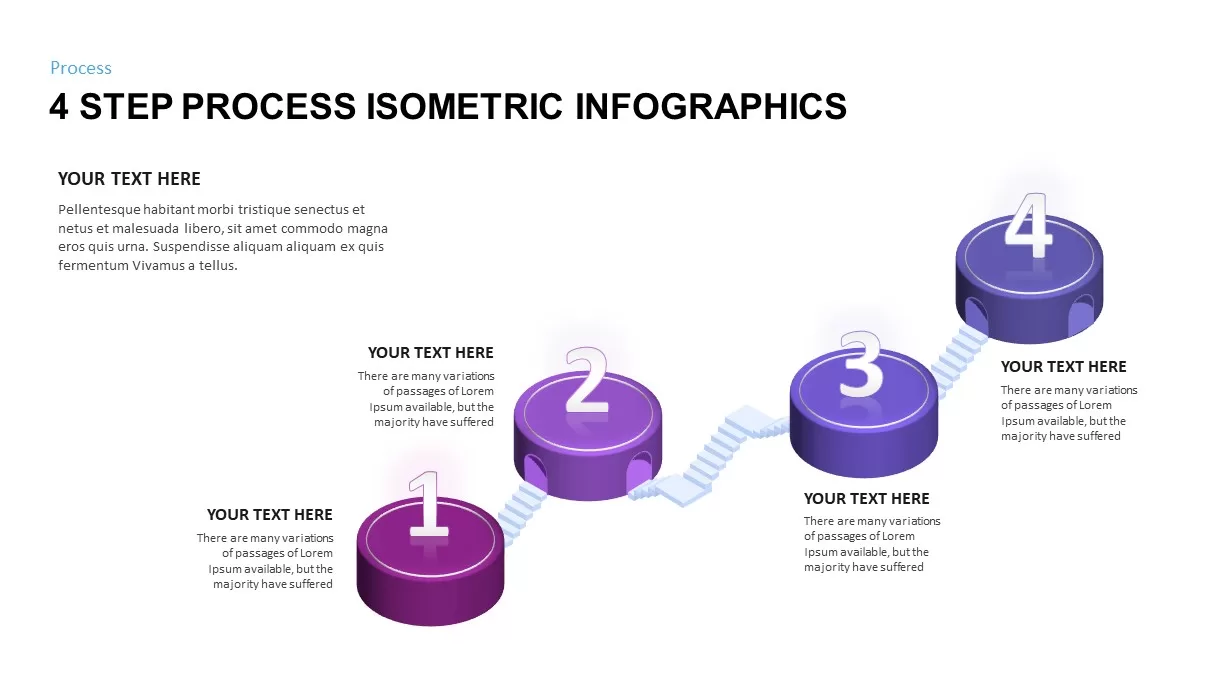
Four-Step Isometric Process Infographic Template for PowerPoint & Google Slides
Process
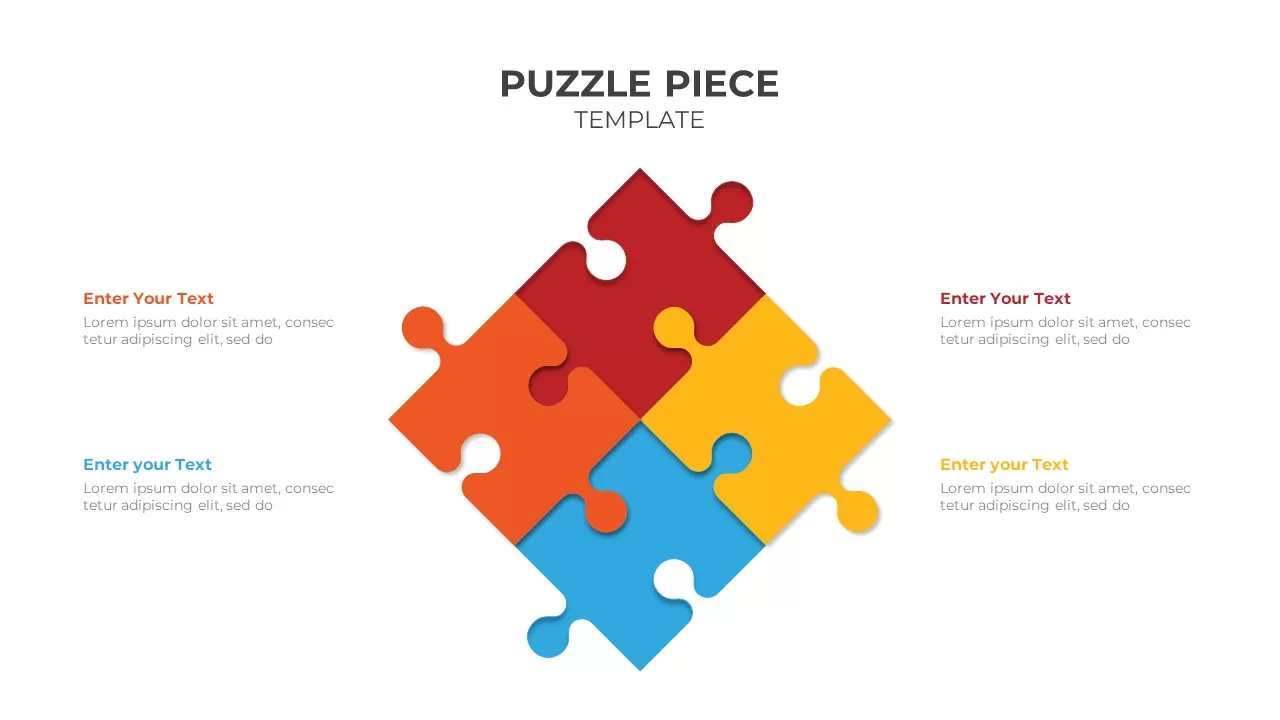
Four-Part Puzzle Piece Infographic Template for PowerPoint & Google Slides
Infographics
Free Modern Four-Step Agenda Infographic Template for PowerPoint & Google Slides
Agenda
Free
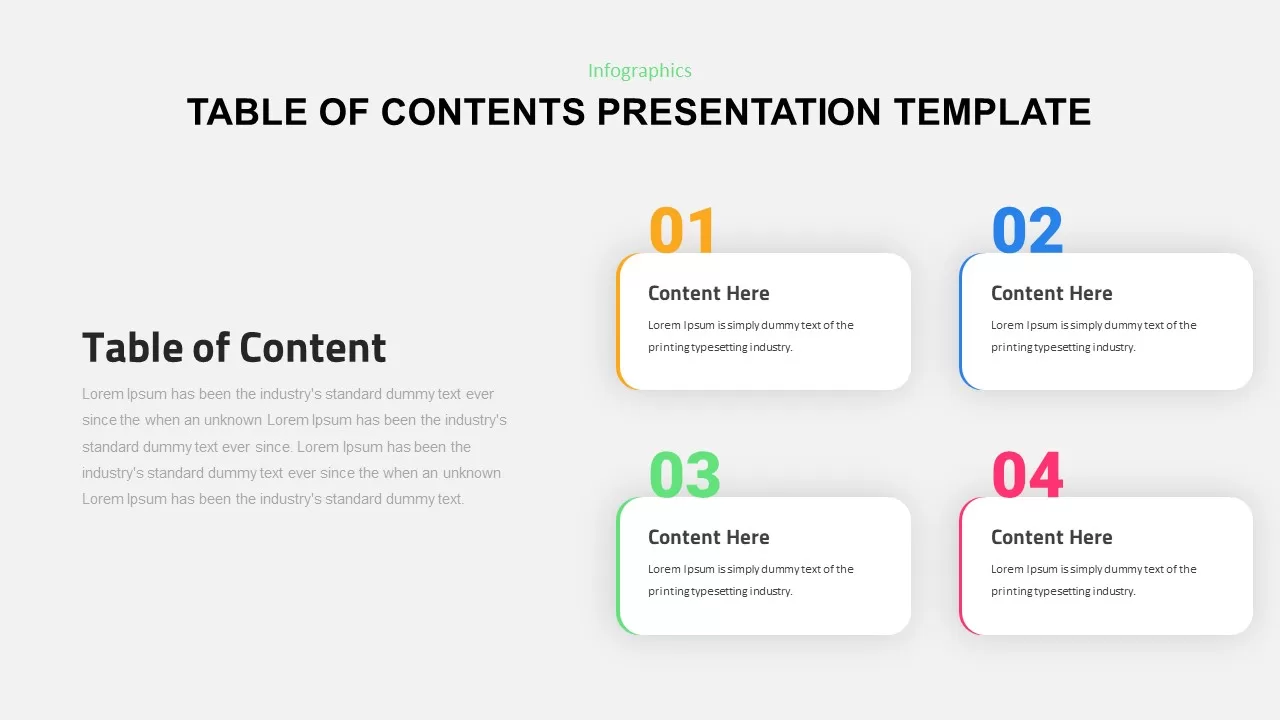
Four-Part Table of Contents Infographic Template for PowerPoint & Google Slides
Agenda
Four-Stage Circle Arrow Infographic Template for PowerPoint & Google Slides
Circular
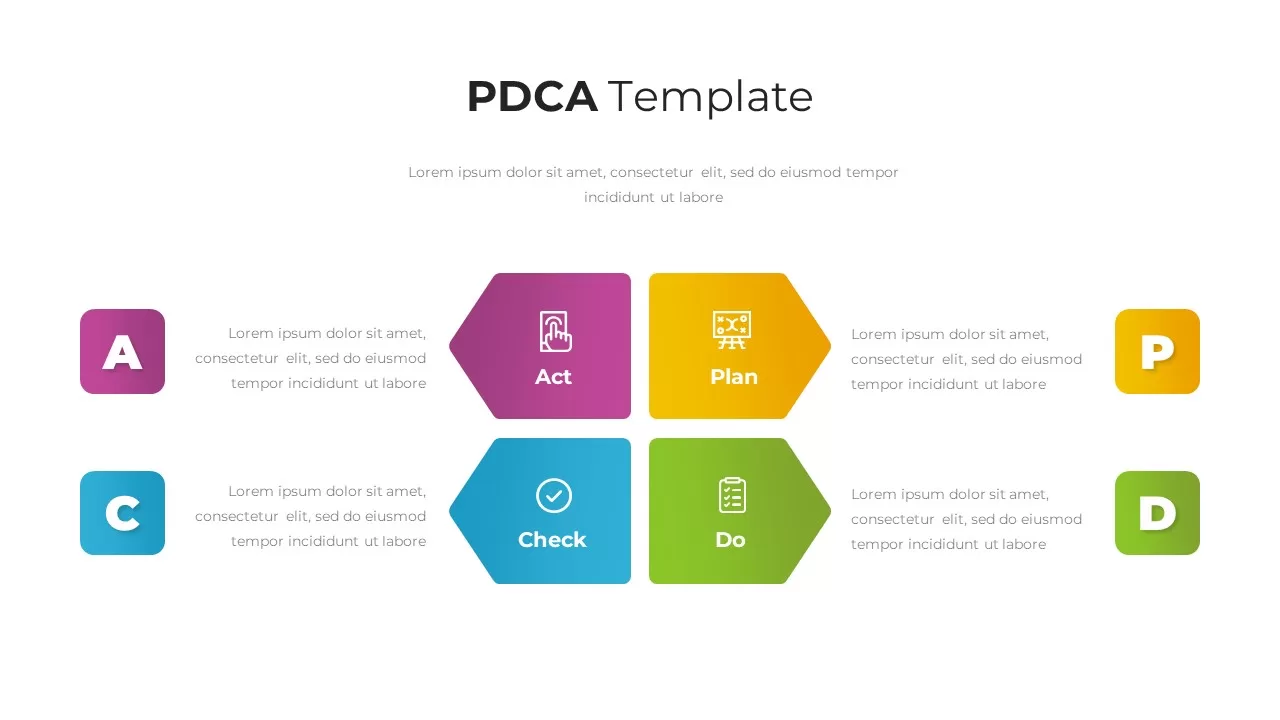
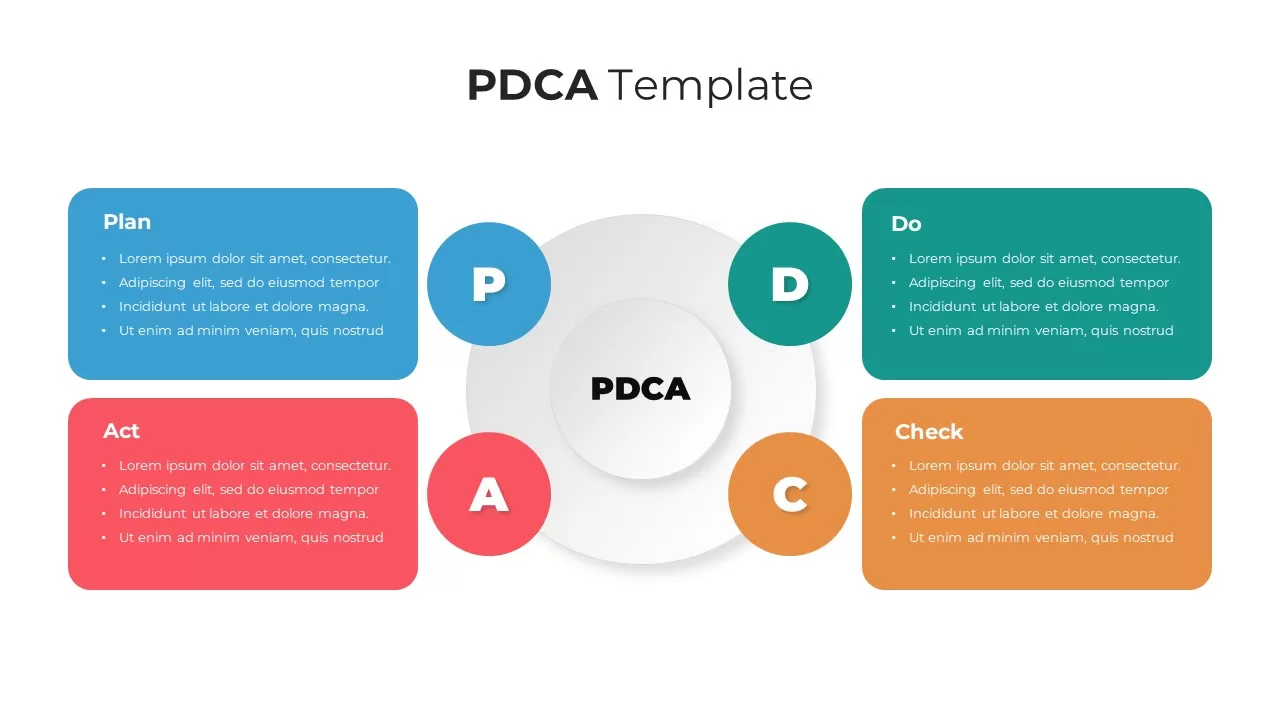
PDCA Cycle Infographic with Four Stages Template for PowerPoint & Google Slides
Process
Four-Stage Circle Arrow Infographic Template for PowerPoint & Google Slides
Circular
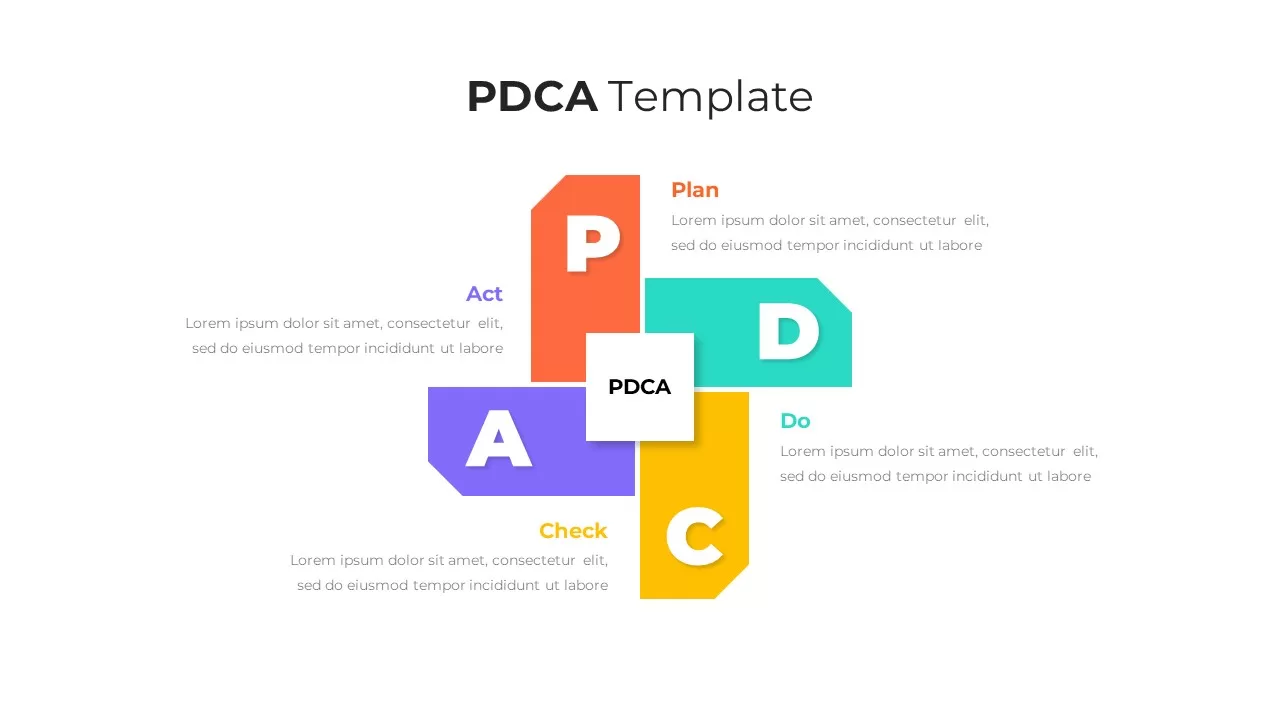
PDCA Four-Stage Cycle Infographic Template for PowerPoint & Google Slides
Process
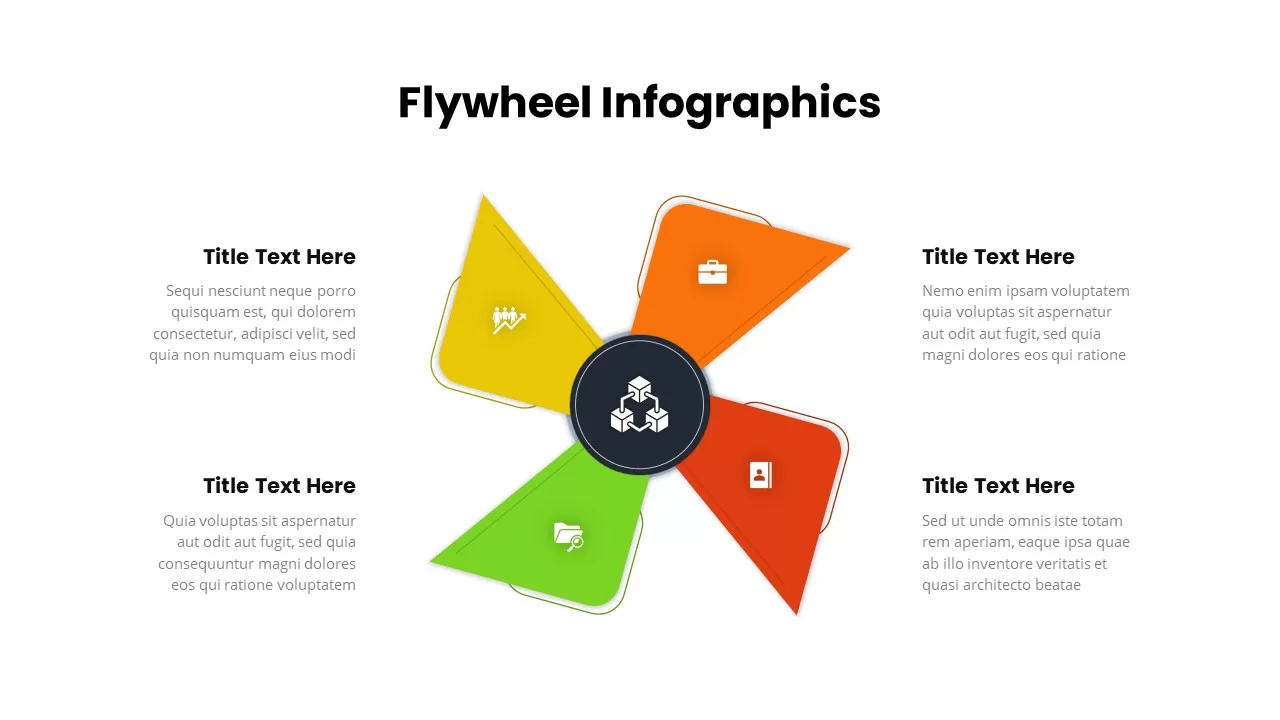
Four-Segment Flywheel Infographic Model Template for PowerPoint & Google Slides
Process
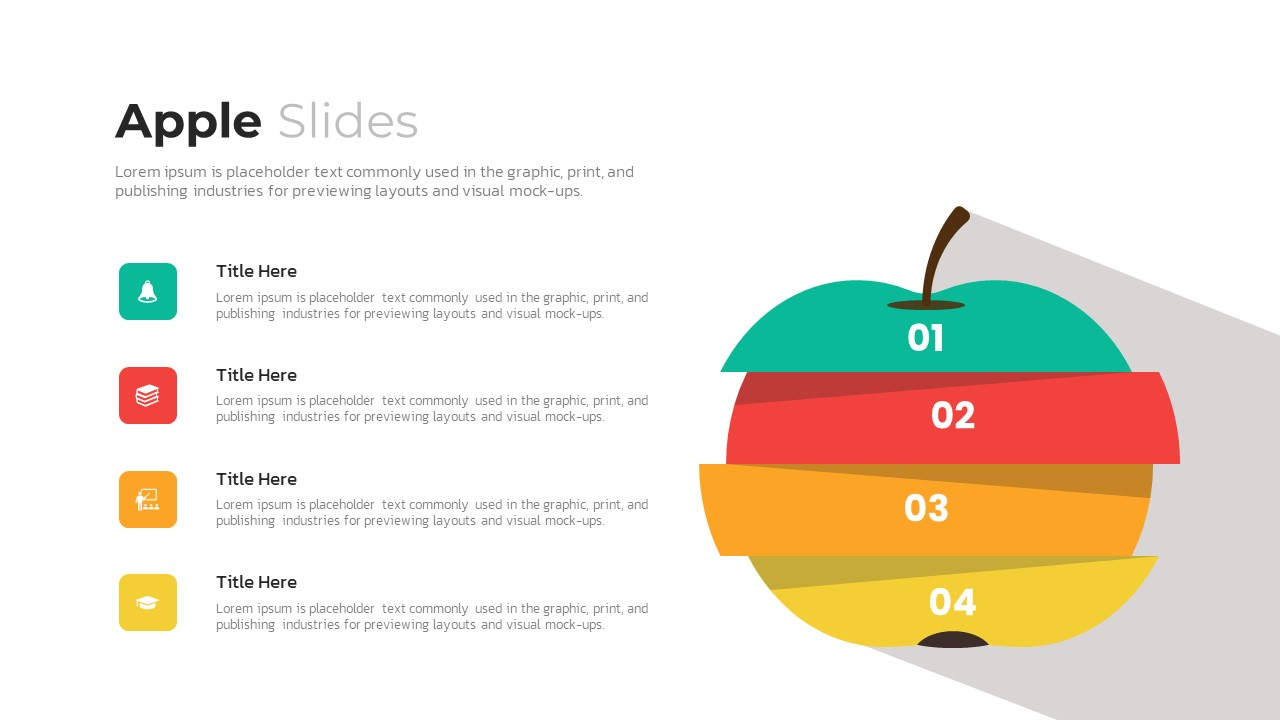
Apple Four-Step Process Infographic Template for PowerPoint & Google Slides
Process
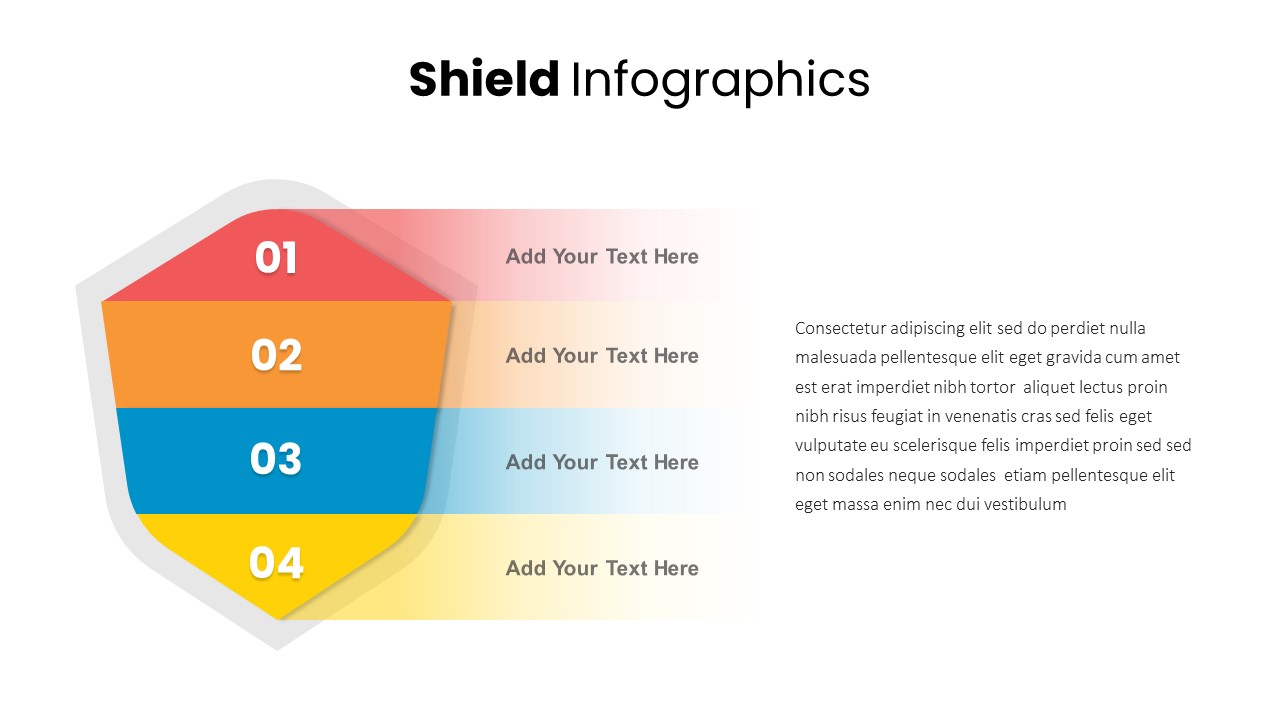
Shield Four-Segment Infographic Template for PowerPoint & Google Slides
Process
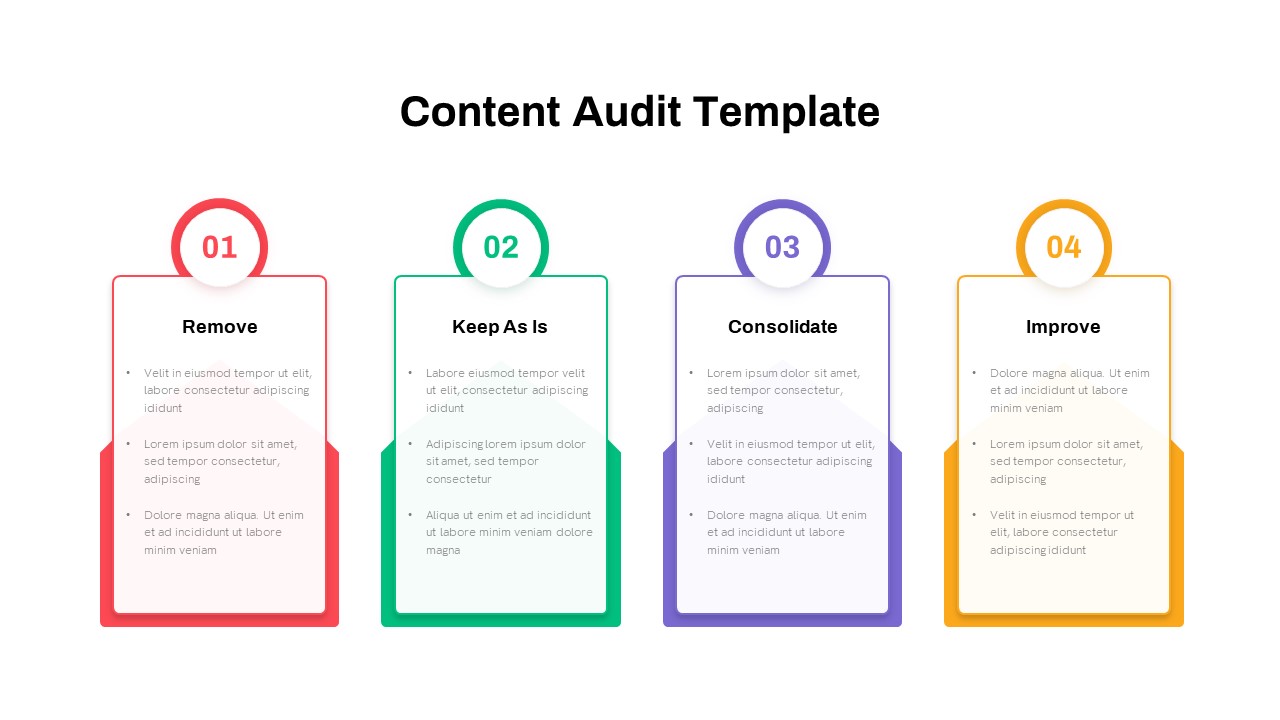
Four-Step Content Audit Infographic Template for PowerPoint & Google Slides
Process
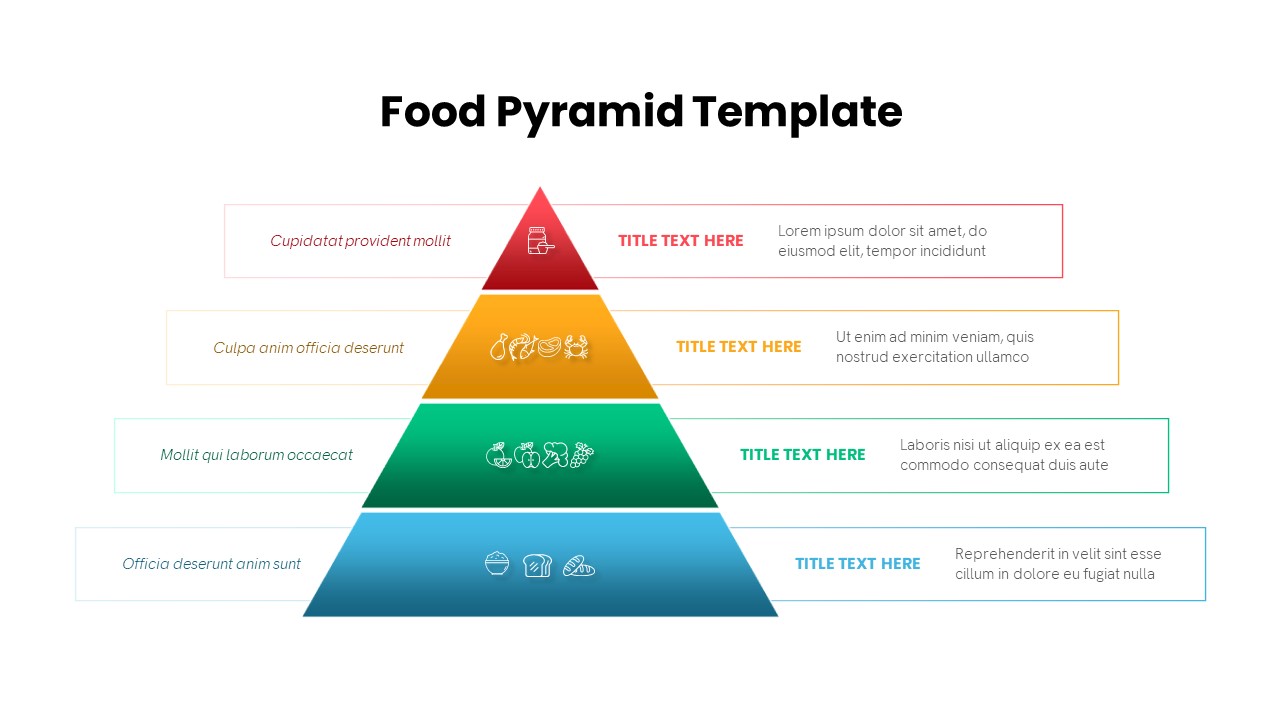
Four-Level Food Pyramid Infographic Template for PowerPoint & Google Slides
Pyramid
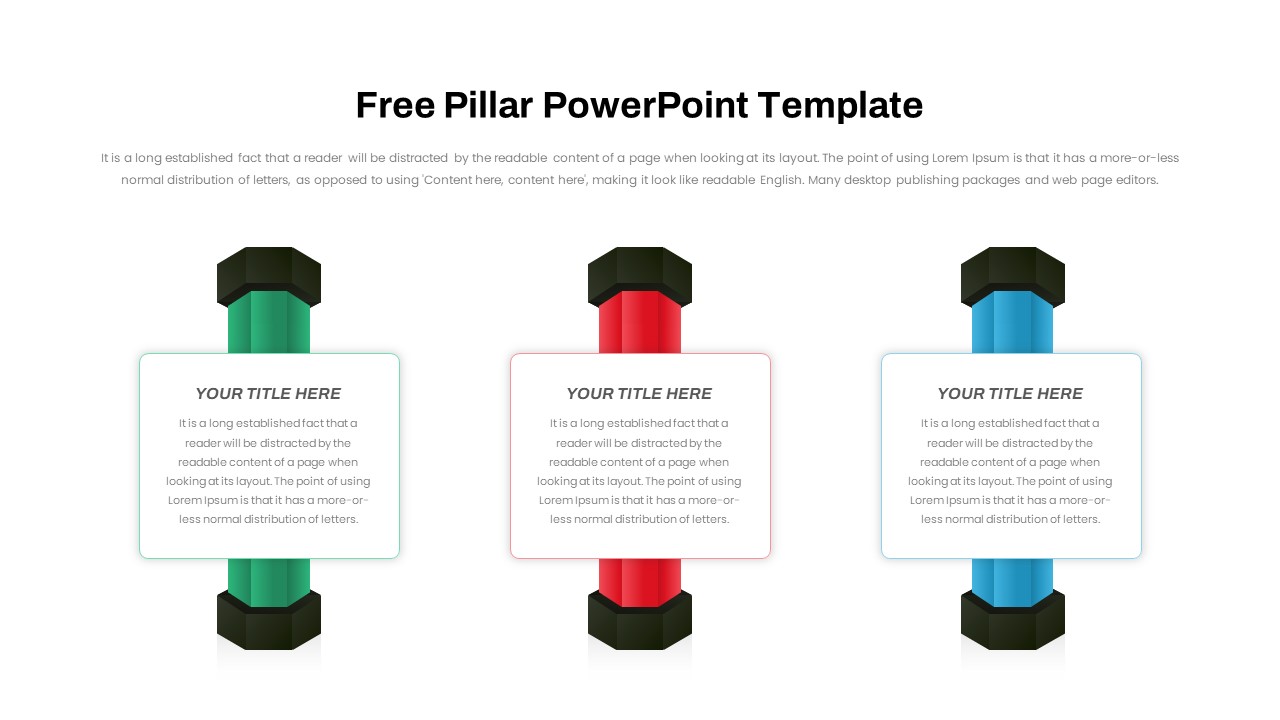
Free Three and Four Pillar Infographic Pack Template for PowerPoint & Google Slides
Process
Free
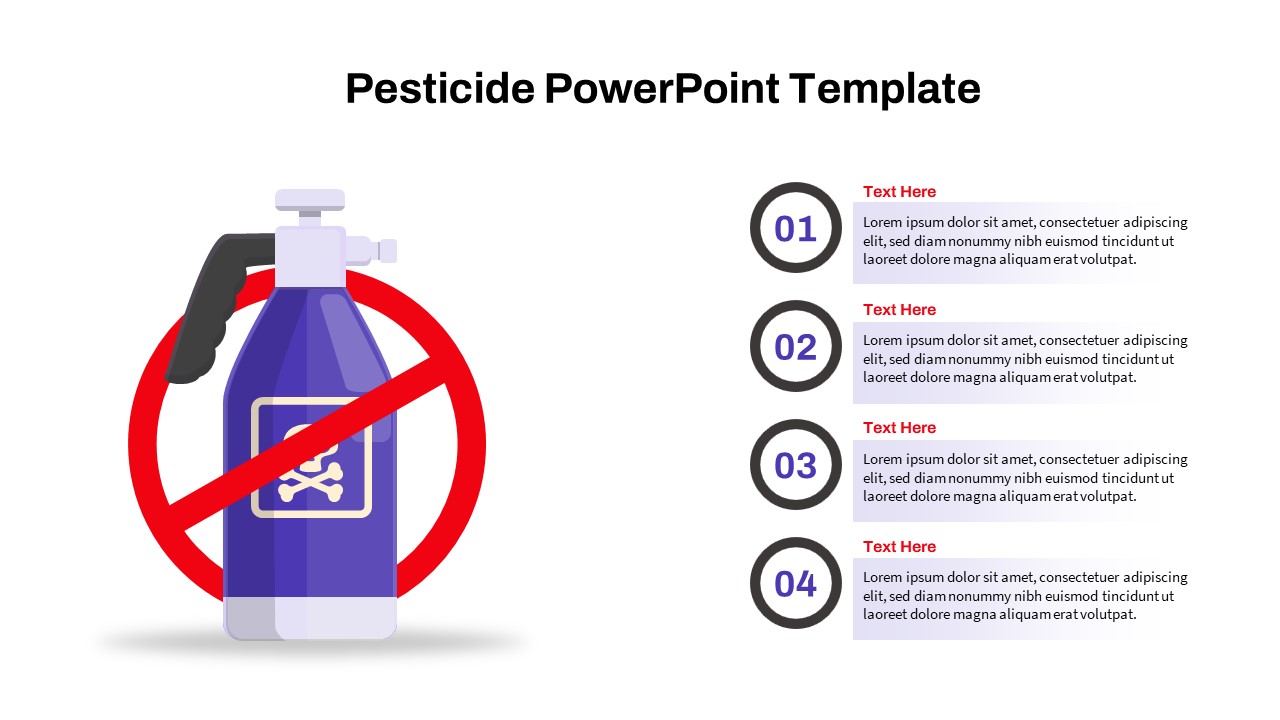
Pesticide Four-Step Process Infographic Template for PowerPoint & Google Slides
Process
Four Level Pyramid Infographic Template for PowerPoint & Google Slides
Pyramid
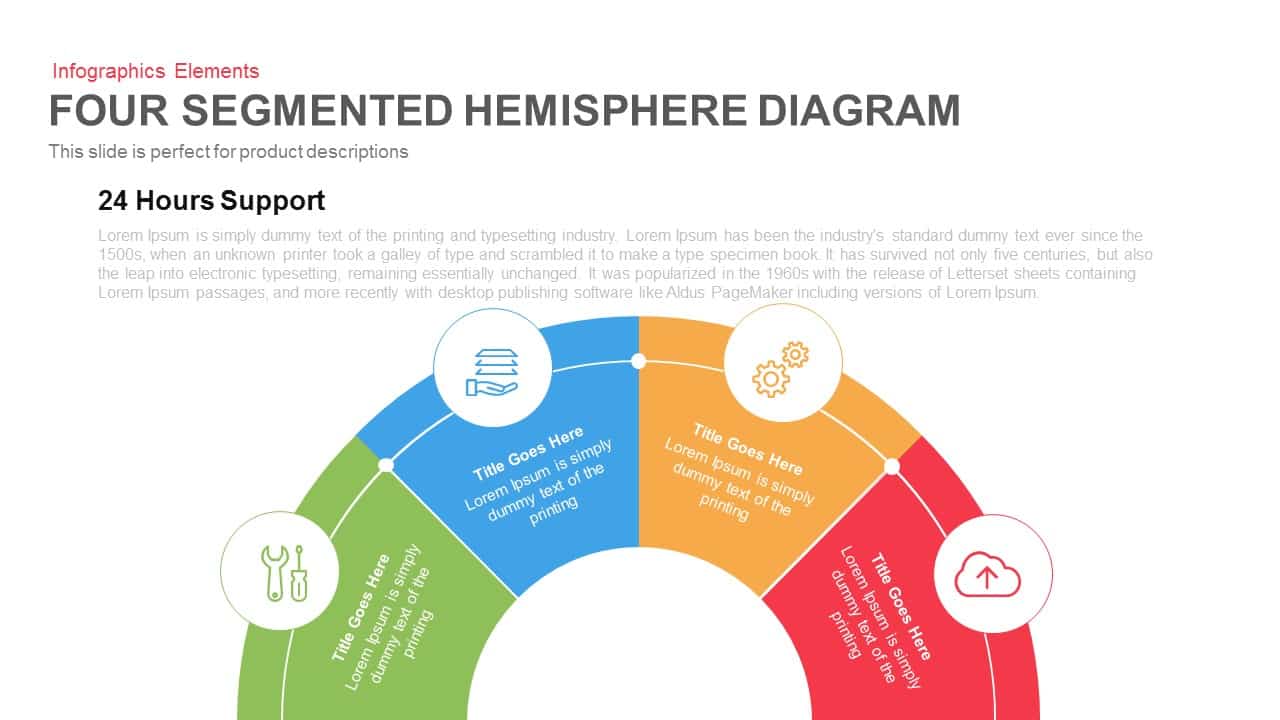
Four Segmented Hemisphere Diagram Template for PowerPoint & Google Slides
Process
Diamond Mind Map Diagram Four Branches Template for PowerPoint & Google Slides
Mind Maps
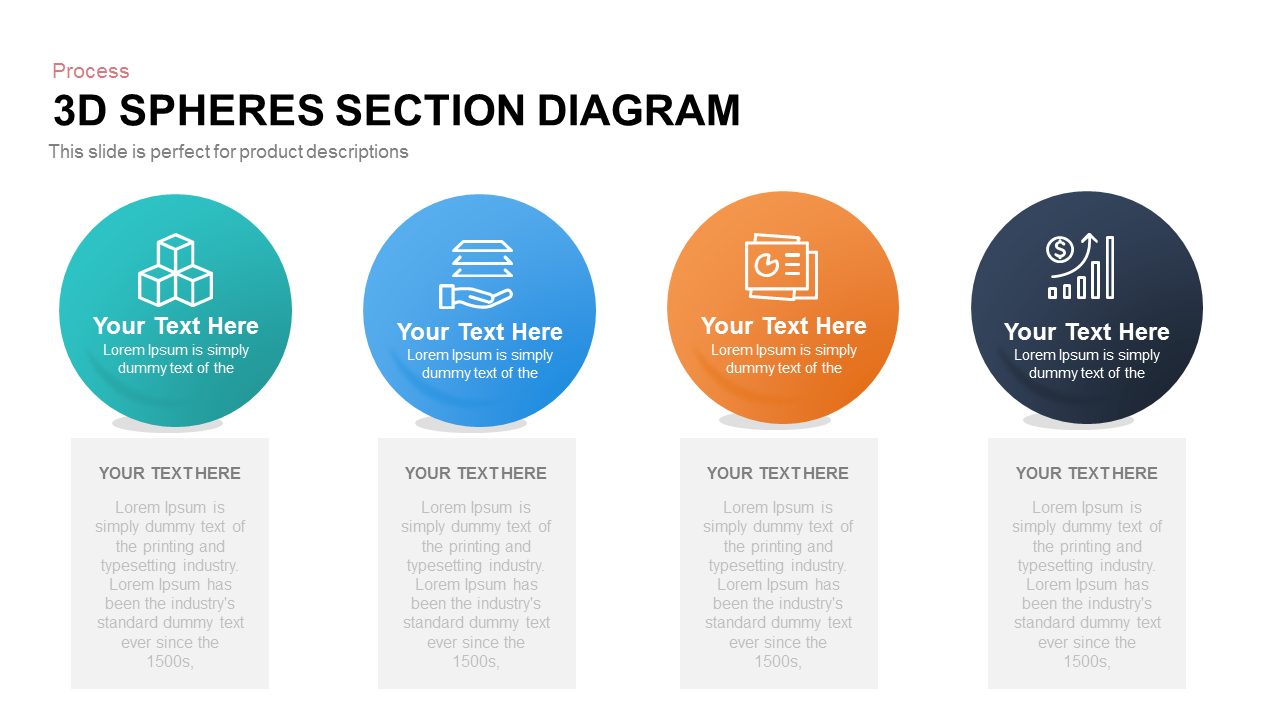
Four-Part 3D Spheres Section Diagram template for PowerPoint & Google Slides
Process
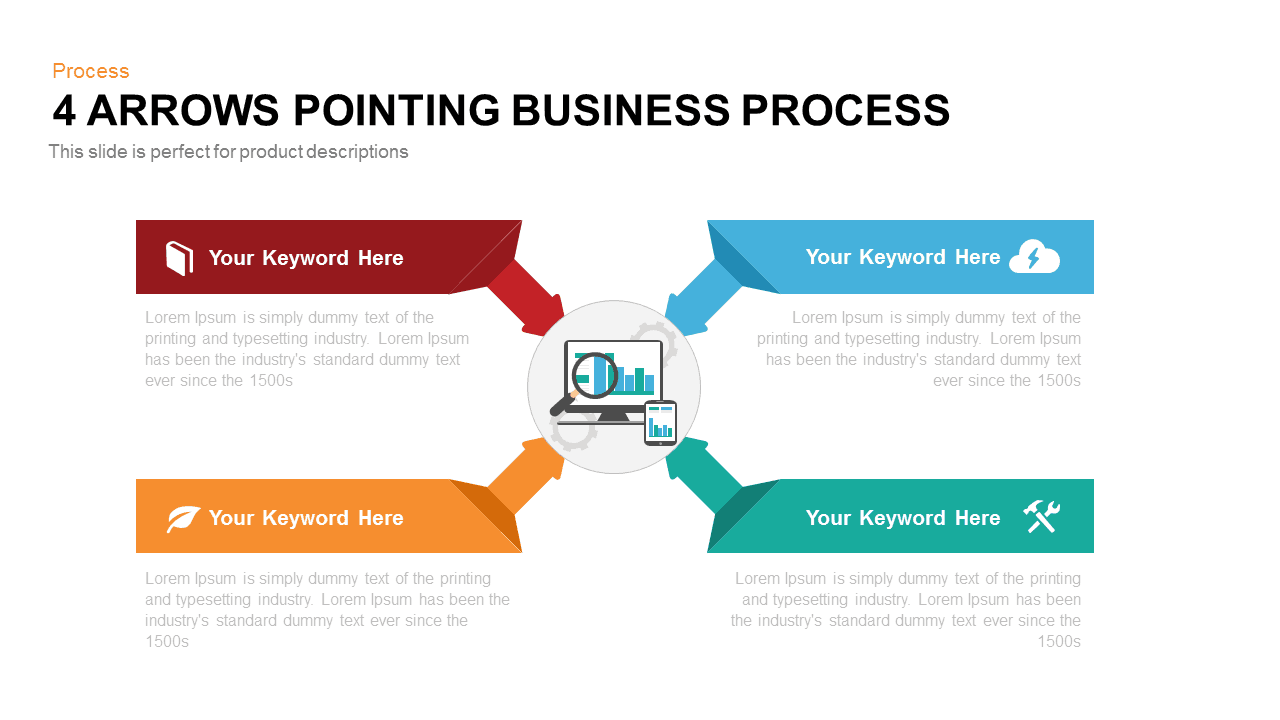
Four Arrows Business Process Diagram template for PowerPoint & Google Slides
Process
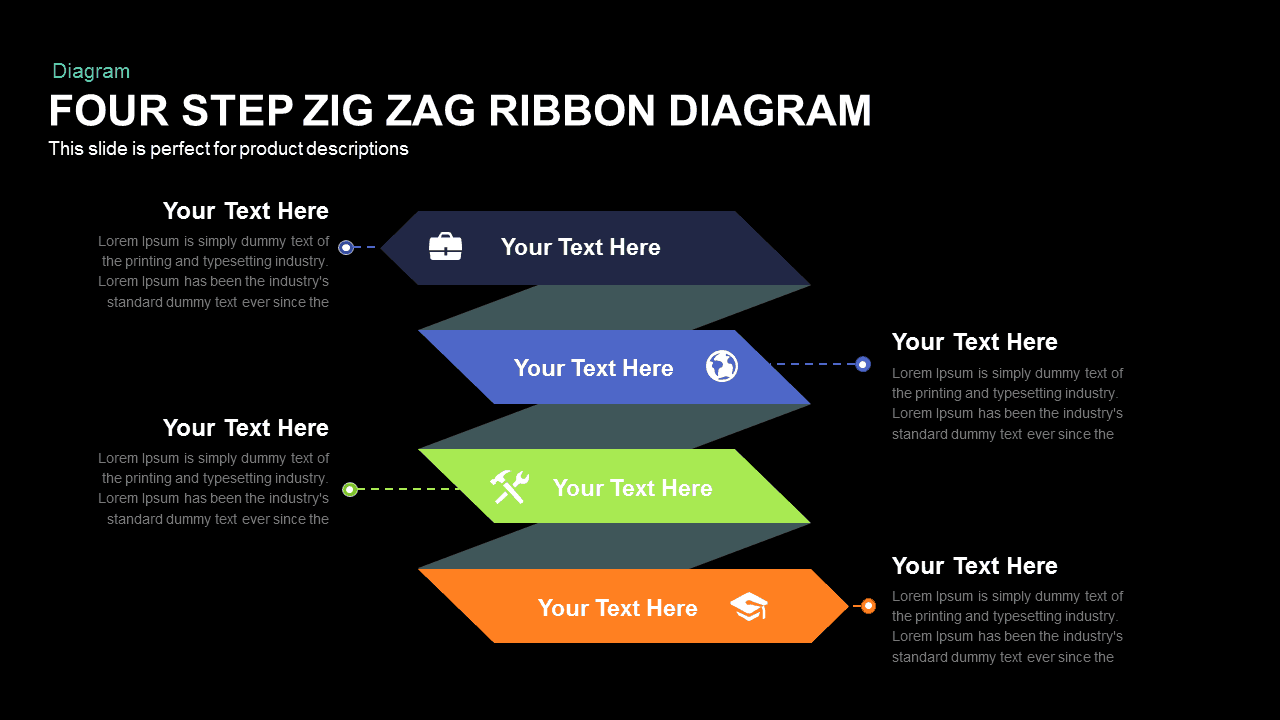
Four-Step Zigzag Ribbon Diagram template for PowerPoint & Google Slides
Arrow
Four-Circle Venn Process Diagram template for PowerPoint & Google Slides
Process
Four Directional Arrow Diagram Template for PowerPoint & Google Slides
Arrow
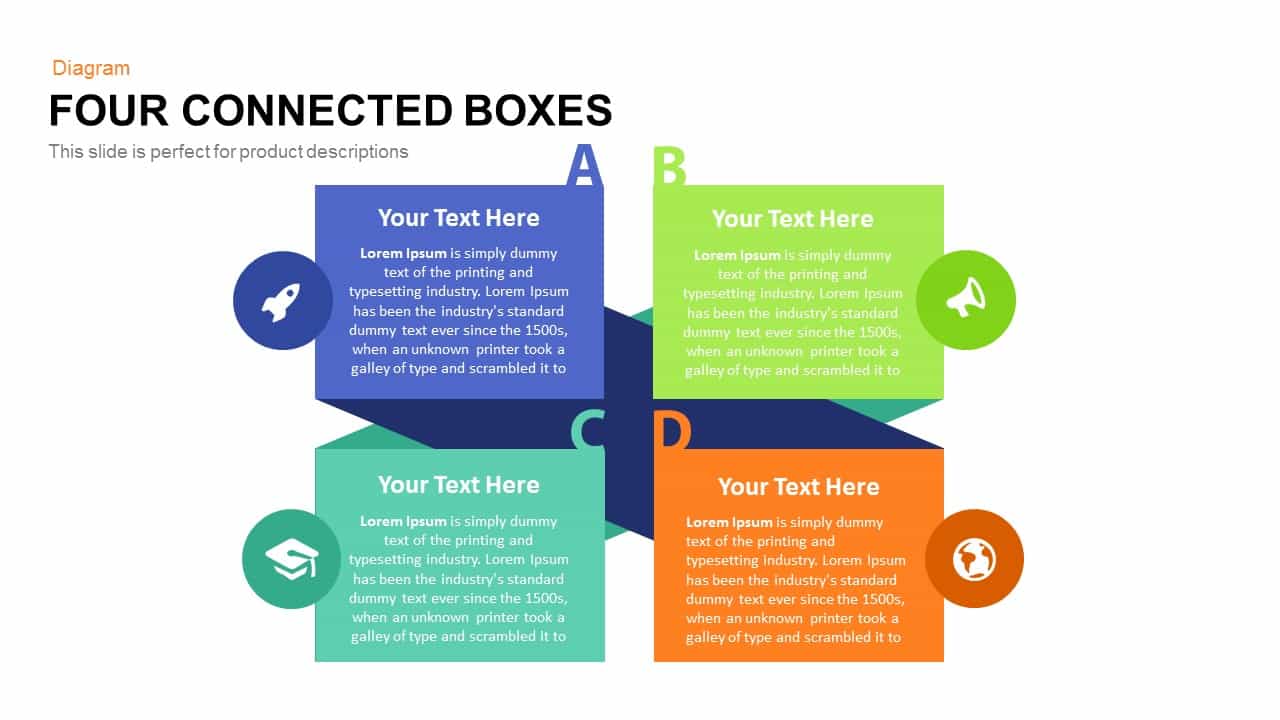
Simple Four Connected Boxes Diagram Template for PowerPoint & Google Slides
Business Models
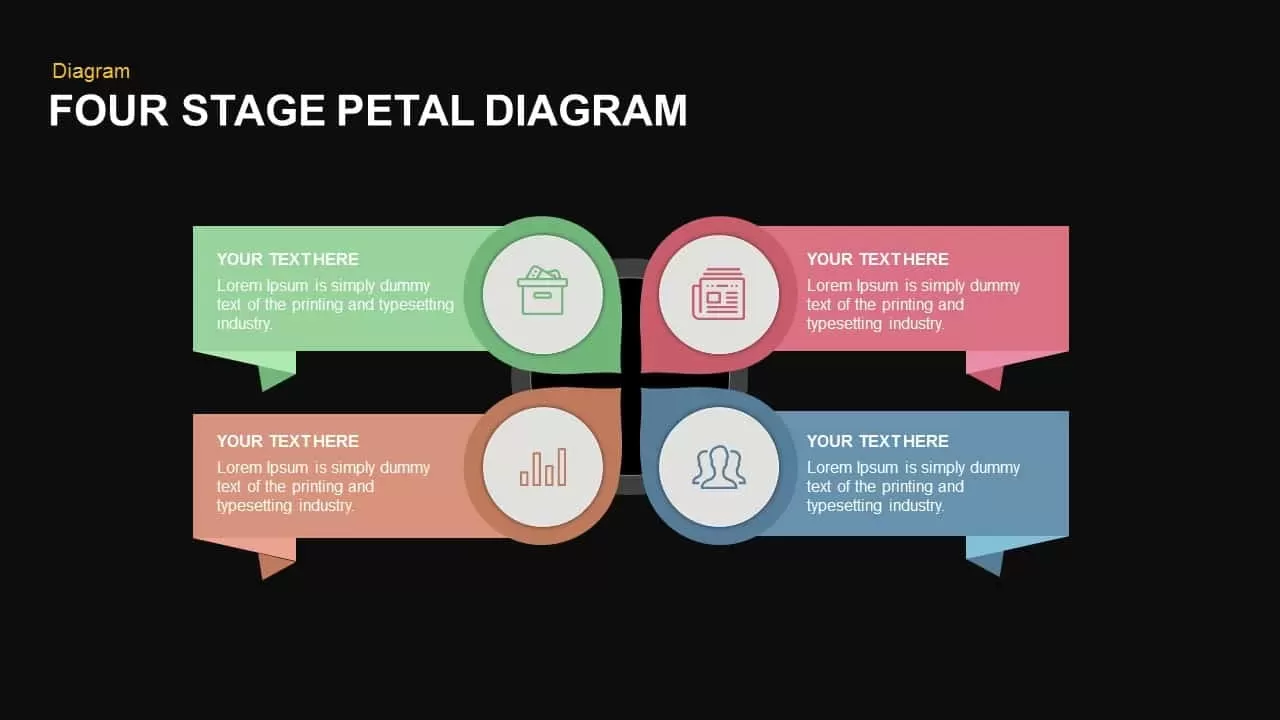
Modern Four-Stage Petal Diagram Template for PowerPoint & Google Slides
Circular
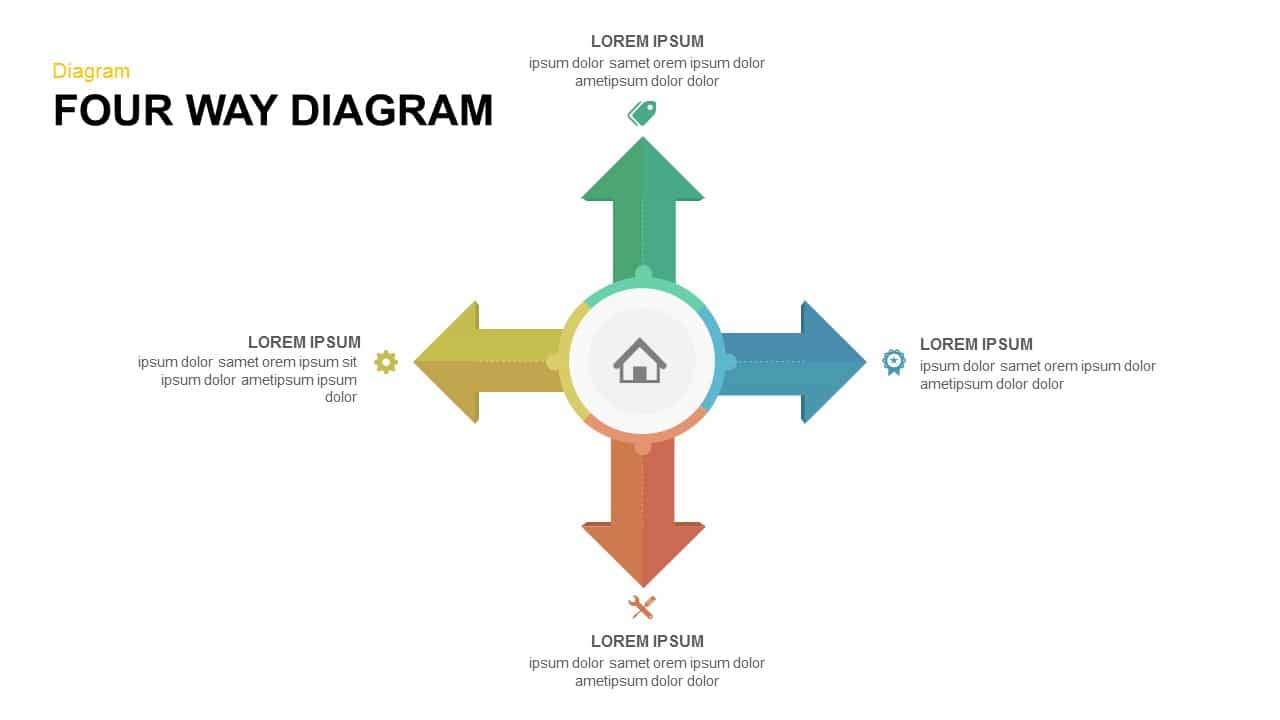
Four-Way Directional Arrow Diagram Template for PowerPoint & Google Slides
Arrow
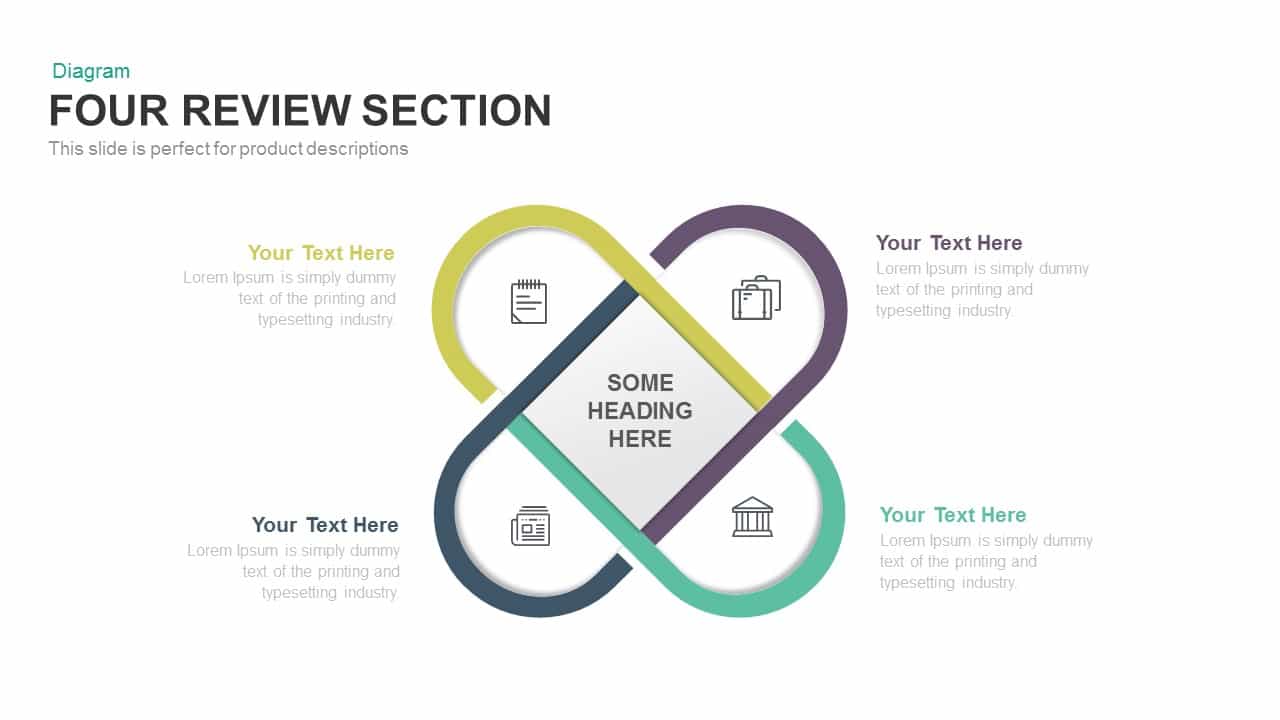
Clean Four-Section Review Diagram Template for PowerPoint & Google Slides
Agenda
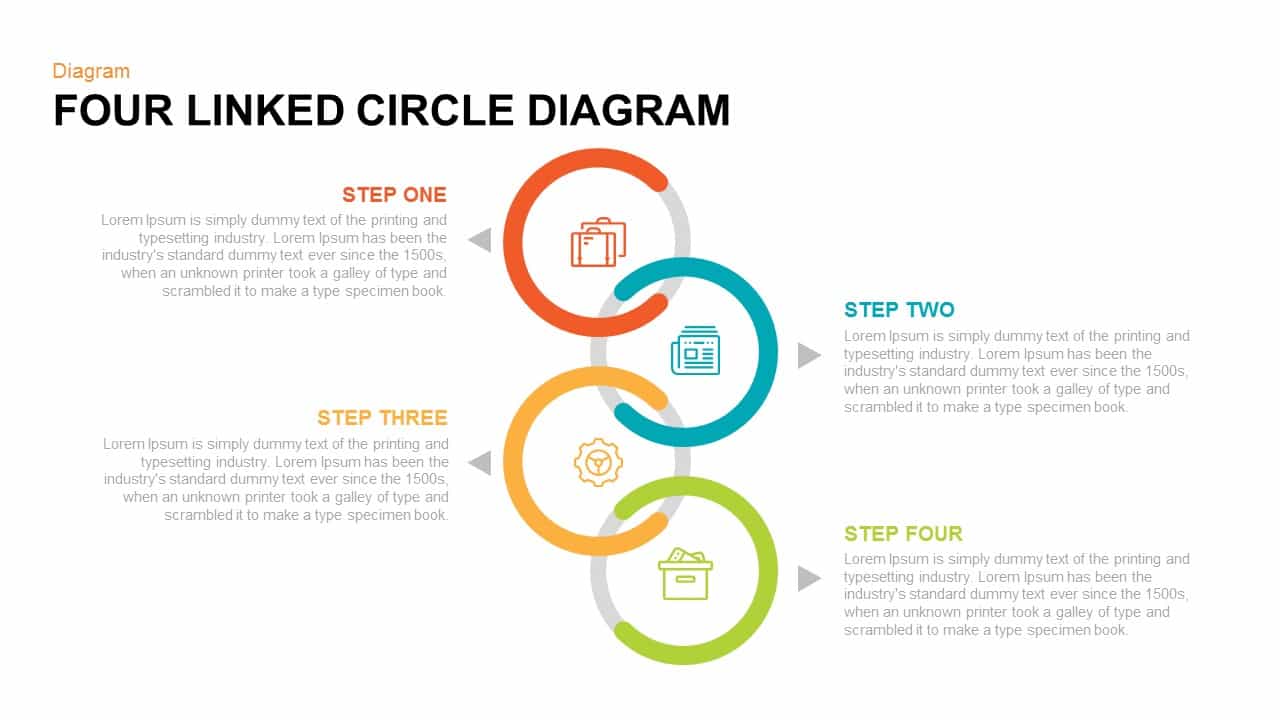
Four Linked Circle Diagram for PowerPoint & Google Slides
Process
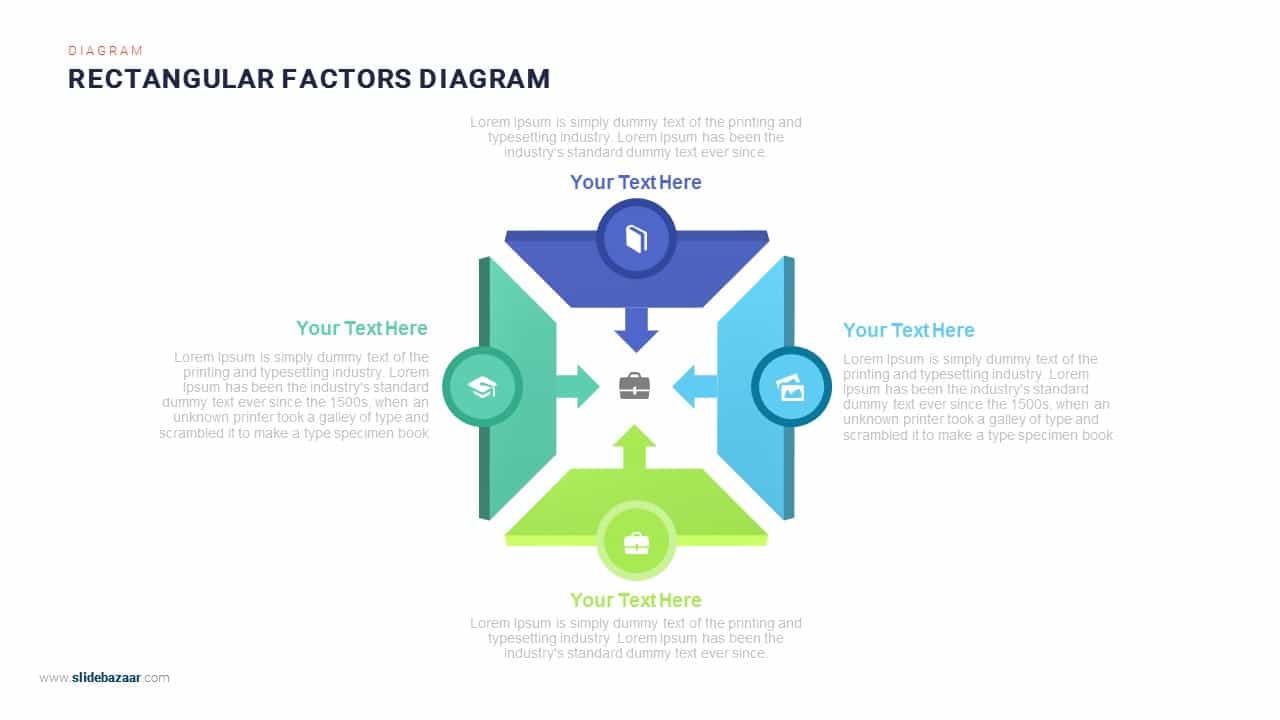
Four-Arrows Rectangular Factors Diagram Template for PowerPoint & Google Slides
Process
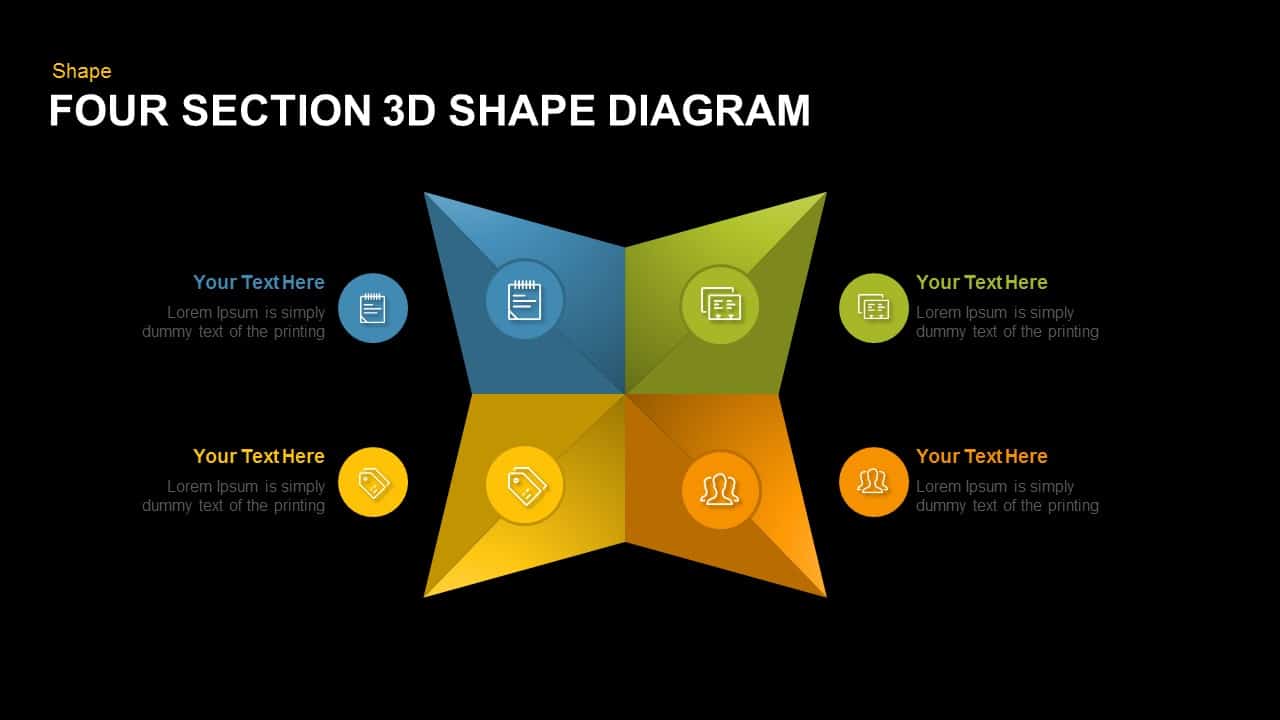
Editable Four-Section 3D Shape Diagram Template for PowerPoint & Google Slides
Comparison
Four-Circle Hub and Spoke Diagram Template for PowerPoint & Google Slides
Process
Flat Four-Box Business Layout Diagram Template for PowerPoint & Google Slides
Process

Four Staged Agenda Diagram for PowerPoint & Google Slides
Agenda
Four-Point Arrow Cycle Diagram Template for PowerPoint & Google Slides
Arrow

Four-Level Business Pyramid Diagram Template for PowerPoint & Google Slides
Pyramid
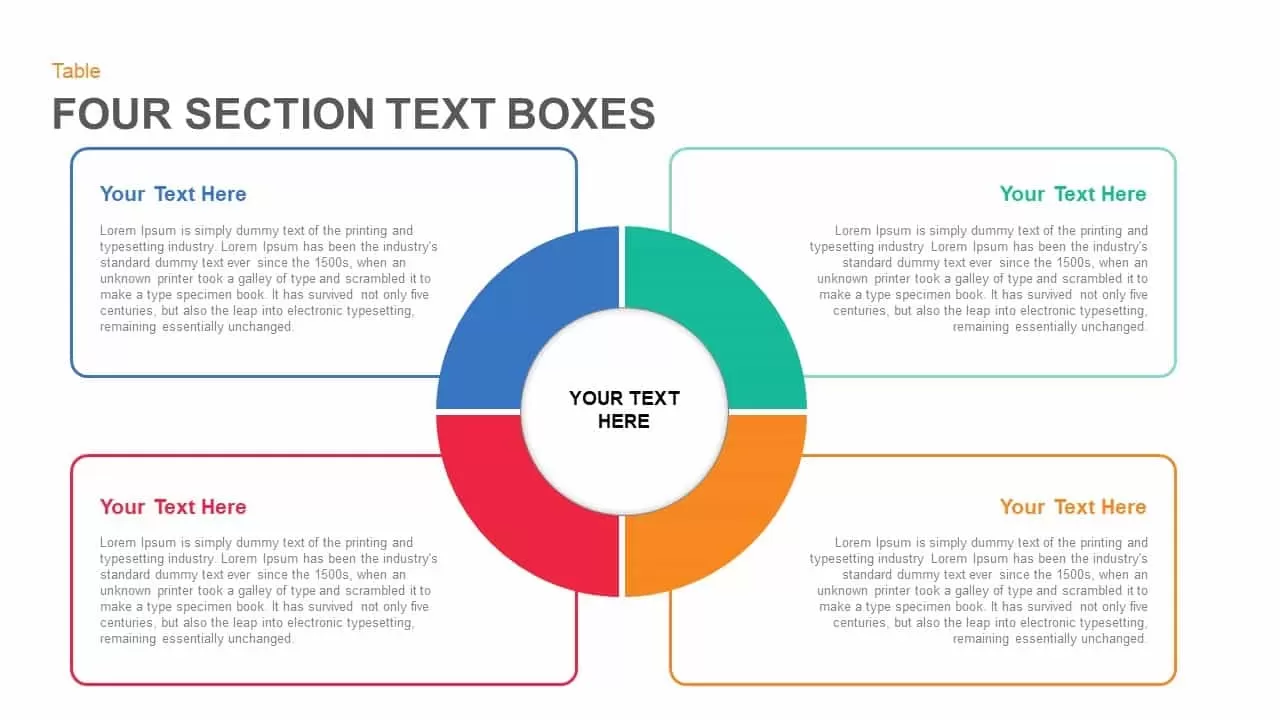
Four Section Circular Text Boxes Diagram Template for PowerPoint & Google Slides
Circular
Four-Staged Business Arrow Diagram Template for PowerPoint & Google Slides
Process

Four-Plus Process Flow Diagram Template for PowerPoint & Google Slides
Process
Modern Four Stage Gear Diagram Template for PowerPoint & Google Slides
Process
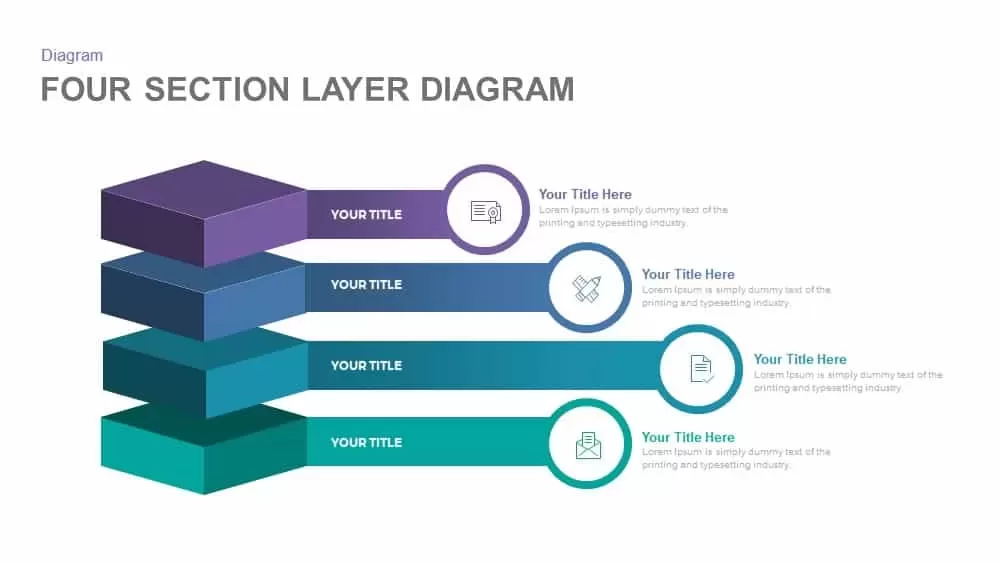
Professional Four-Section Layer Diagram Template for PowerPoint & Google Slides
Process
Four-Stage Agenda Circle Diagram Slide Template for PowerPoint & Google Slides
Agenda
Four-Stage Gear Process Diagram Template for PowerPoint & Google Slides
Process
Four-Stage Cycle Process Diagram Template for PowerPoint & Google Slides
Process
Four-Quadrant SWOT Analysis Diagram Template for PowerPoint & Google Slides
SWOT
Concentric Four-Layer Core Diagram Template for PowerPoint & Google Slides
Circular
Four-Stage Linear Process Flow Diagram Template for PowerPoint & Google Slides
Process
Four-Stage Circular Flow Diagram Template for PowerPoint & Google Slides
Circular
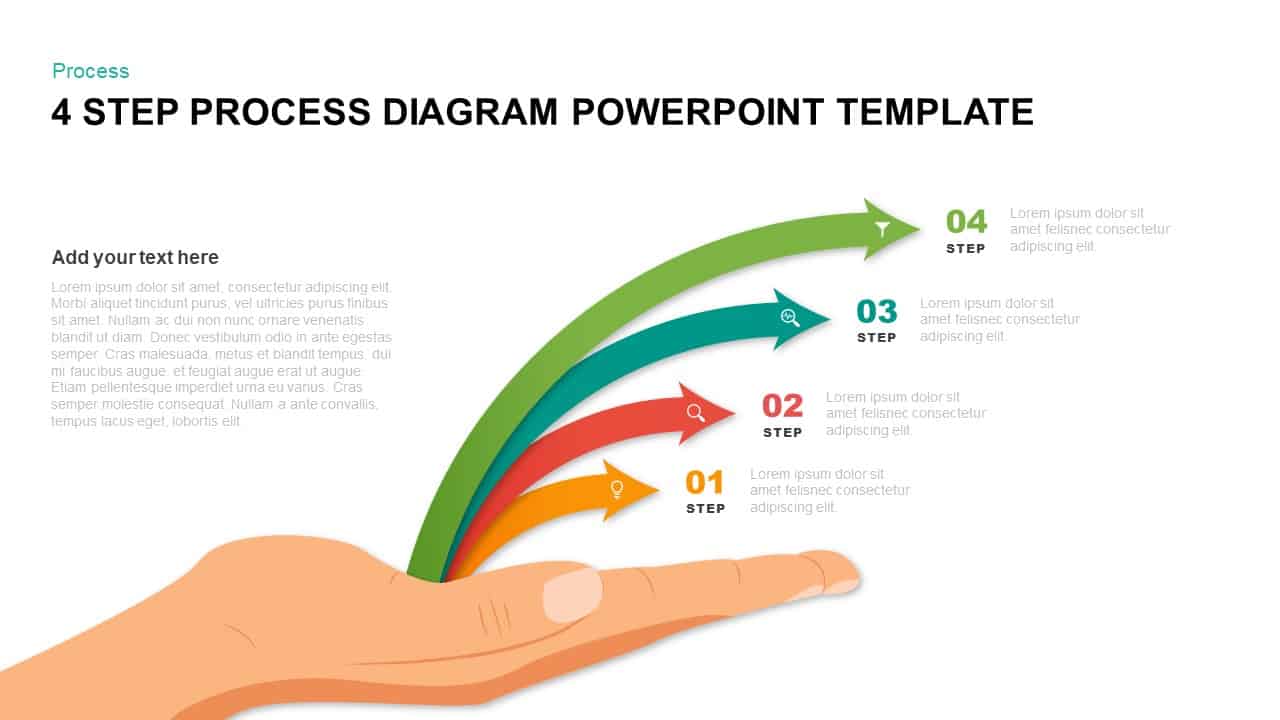
Hand-Held Four-Step Process Diagram Template for PowerPoint & Google Slides
Process
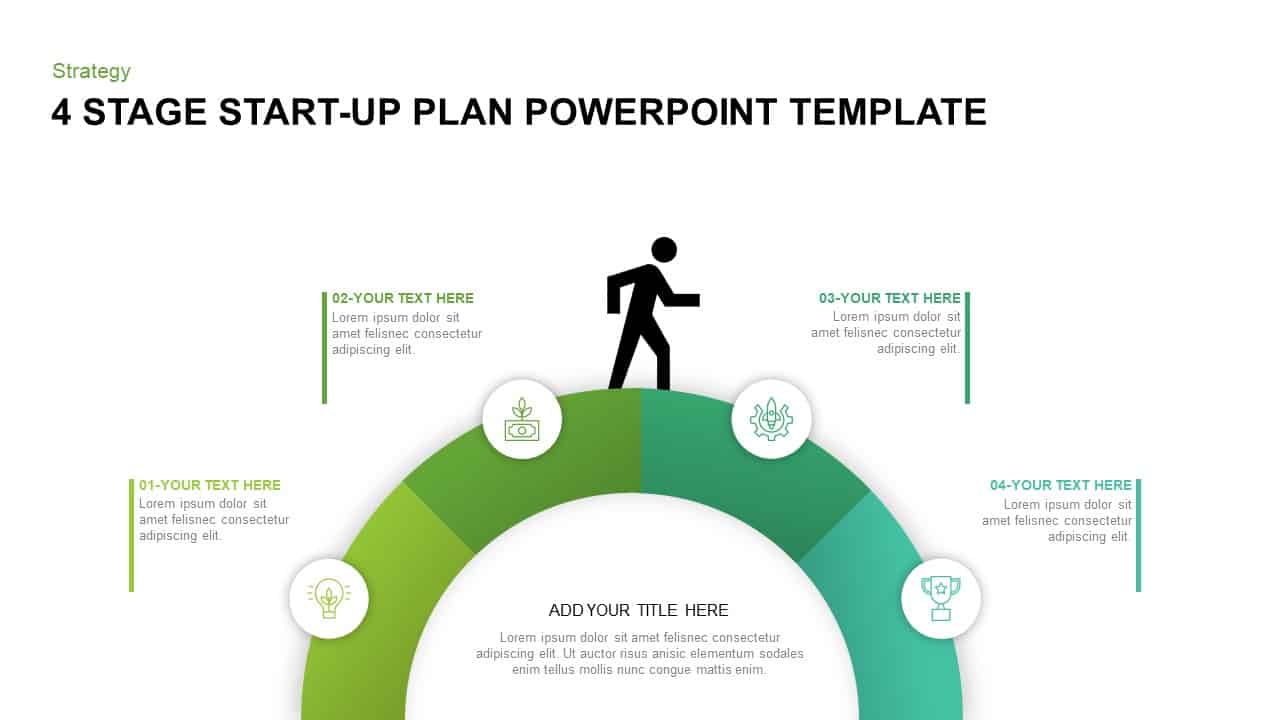
Four-Stage Start-Up Plan Arc Diagram Template for PowerPoint & Google Slides
Process
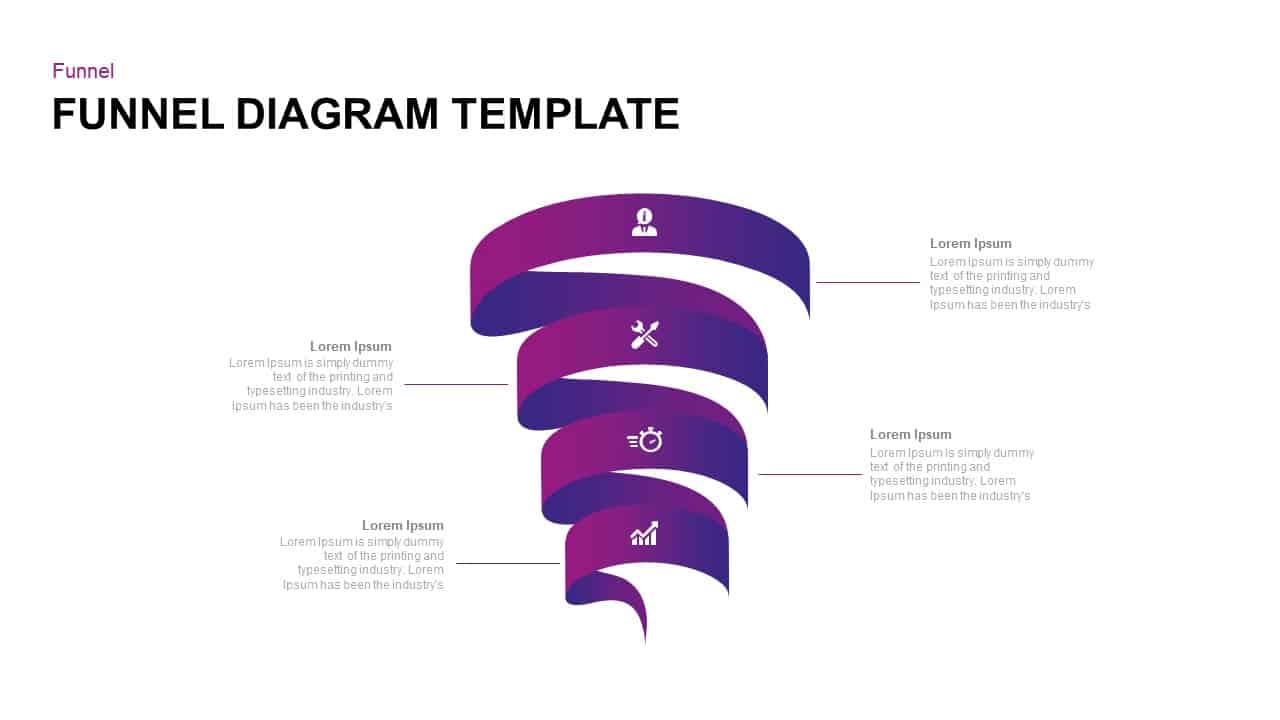
Four-Step Spiral Funnel Diagram Template for PowerPoint & Google Slides
Funnel
Four Section Diagram Infographics template for PowerPoint & Google Slides
Process
Four-Phase Maturity Model Diagram Template for PowerPoint & Google Slides
Process
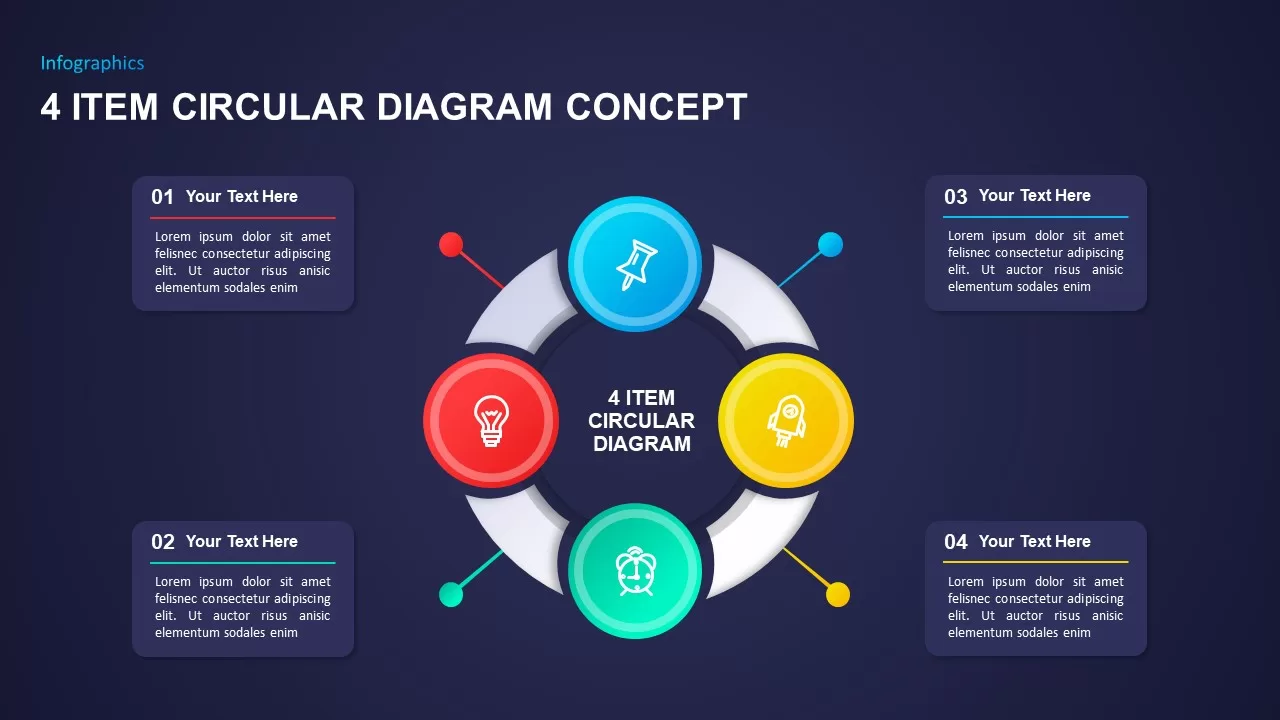
Four-Item Circular Diagram Concept Template for PowerPoint & Google Slides
Circular
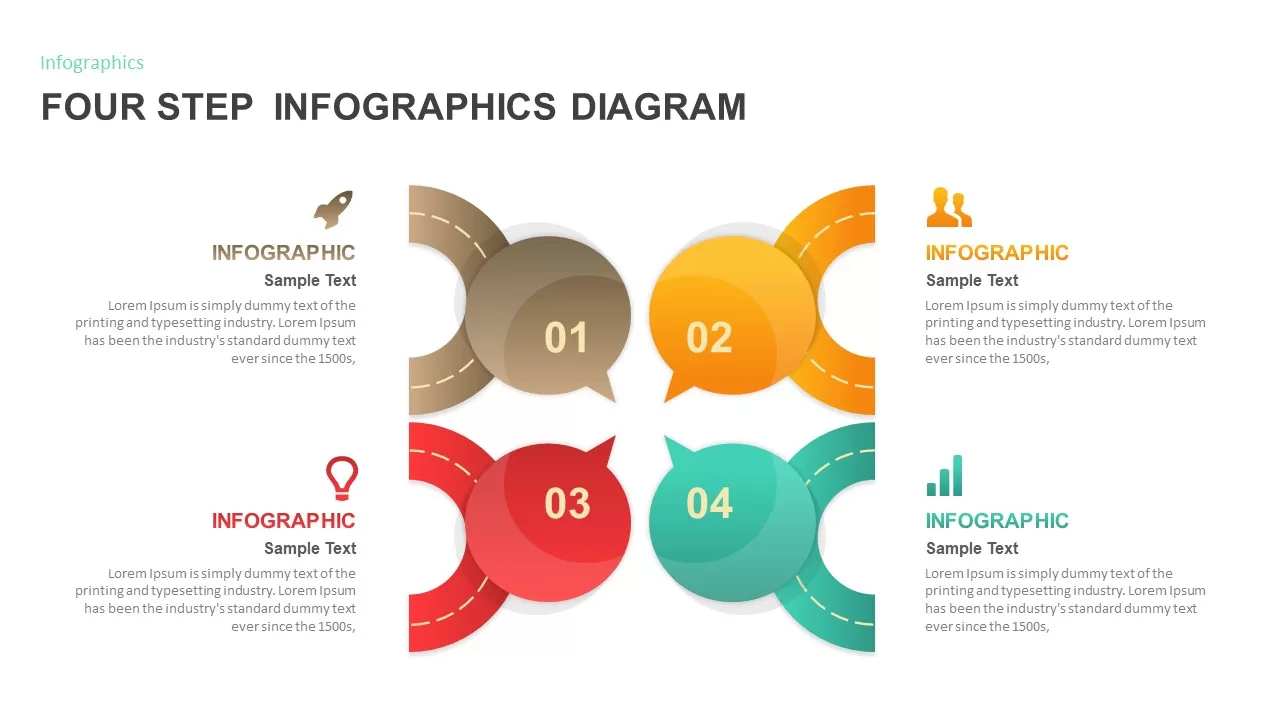
Four Step Infographics Diagram for PowerPoint & Google Slides
Process
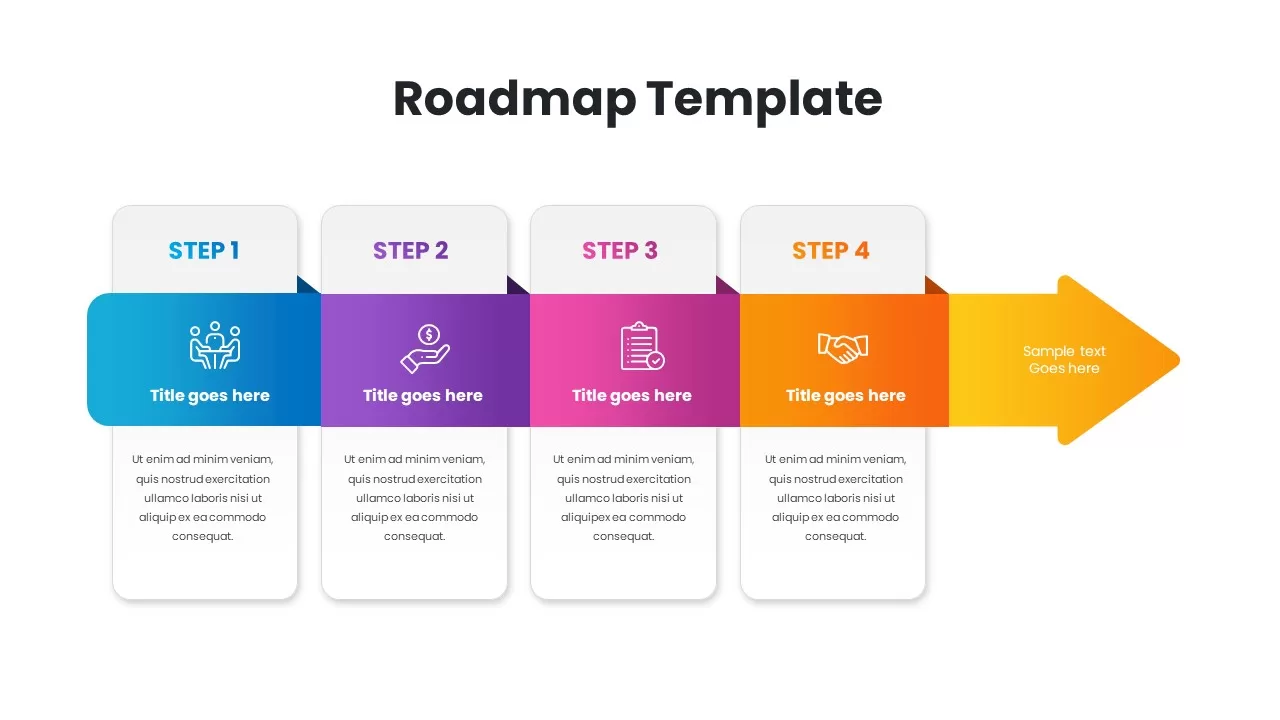
Gradient Four-Step Roadmap Diagram Template for PowerPoint & Google Slides
Roadmap
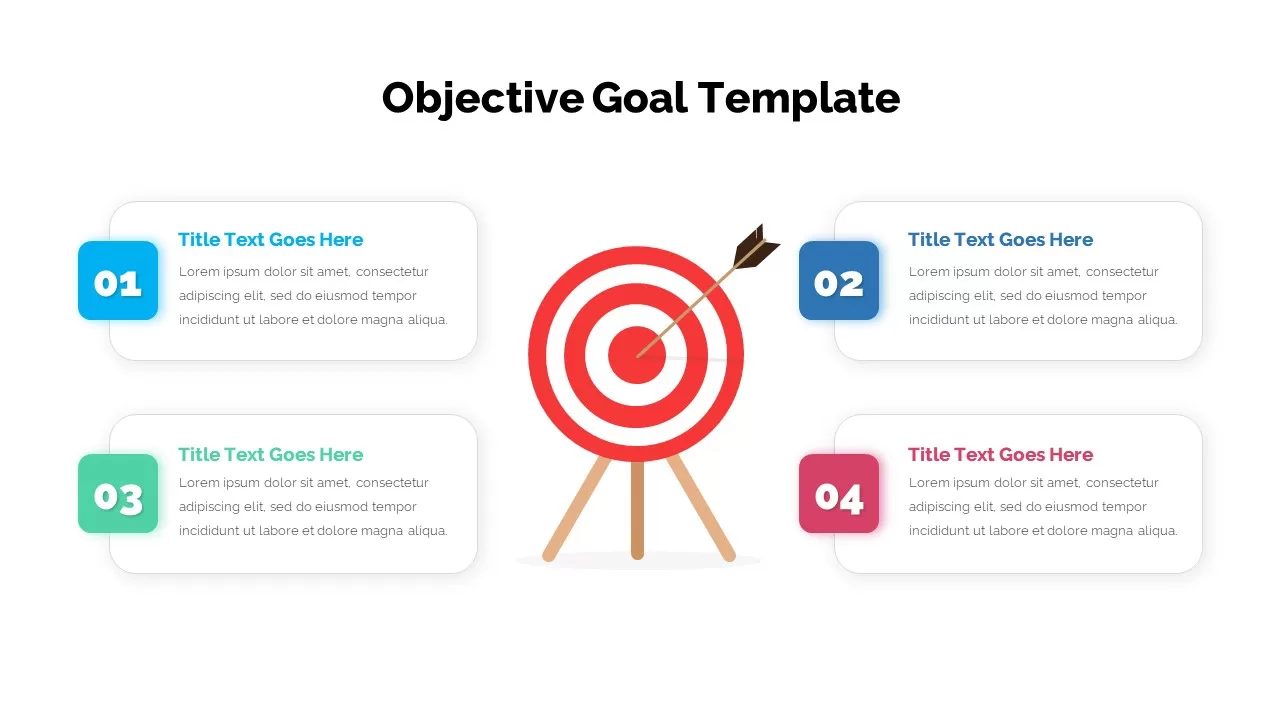
Four-Step Objective Goal Diagram Template for PowerPoint & Google Slides
Goals
Elegant PDCA Four-Step Process Diagram Template for PowerPoint & Google Slides
Process
Hand-Drawn Four-Step Curved Arrow Diagram Template for PowerPoint & Google Slides
Arrow
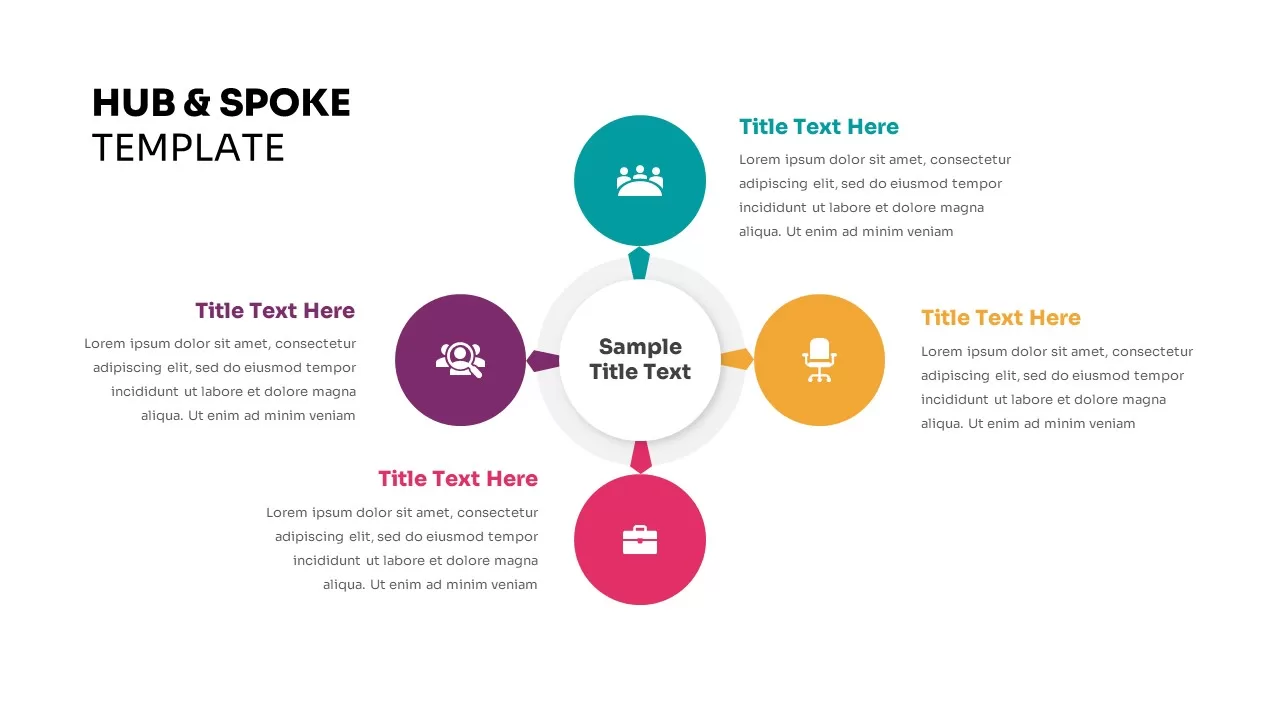
Four-Point Hub and Spoke Diagram Template for PowerPoint & Google Slides
Business Strategy
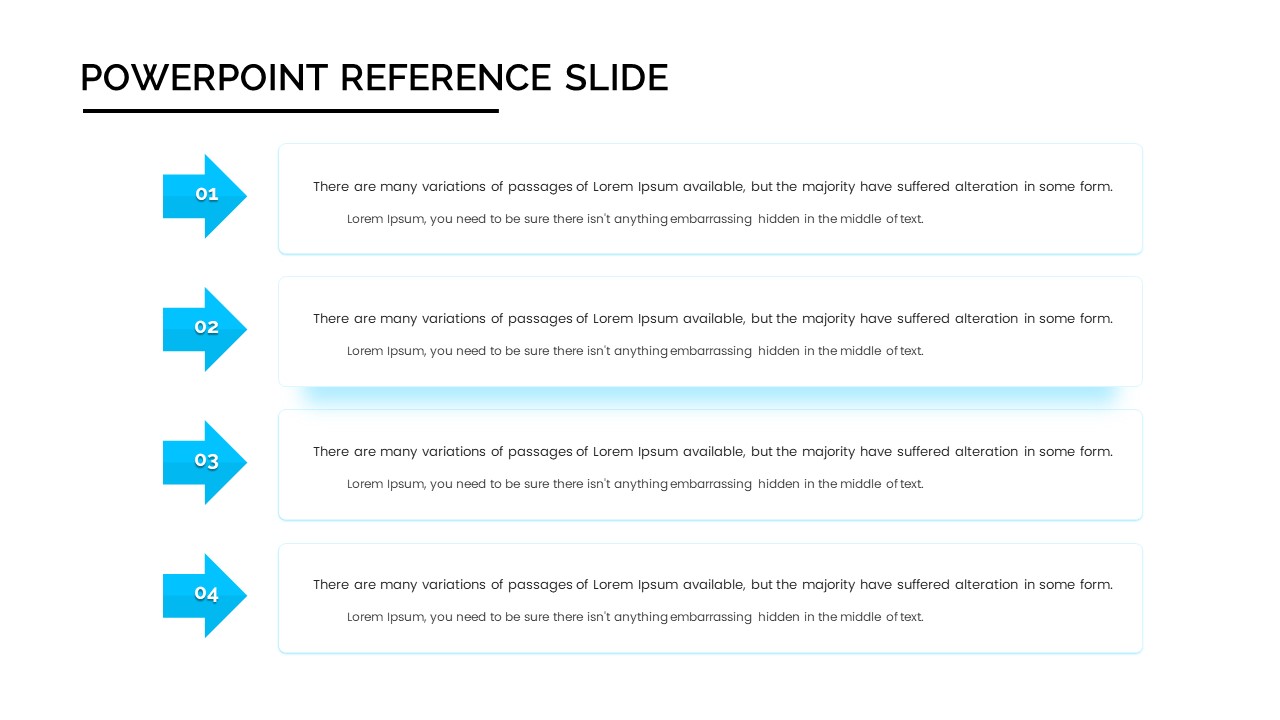
Four-Step Arrow Reference Diagram Slide Template for PowerPoint & Google Slides
Arrow
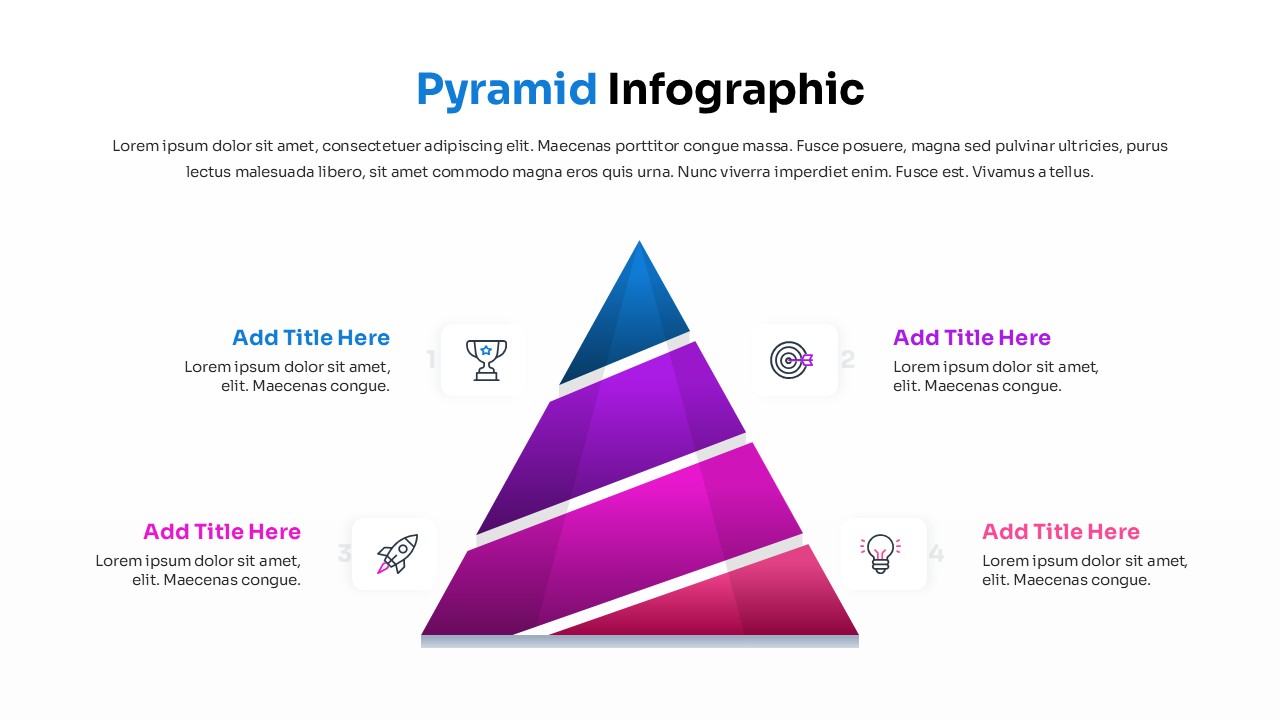
Four-Level Colorful Pyramid Diagram Template for PowerPoint & Google Slides
Pyramid
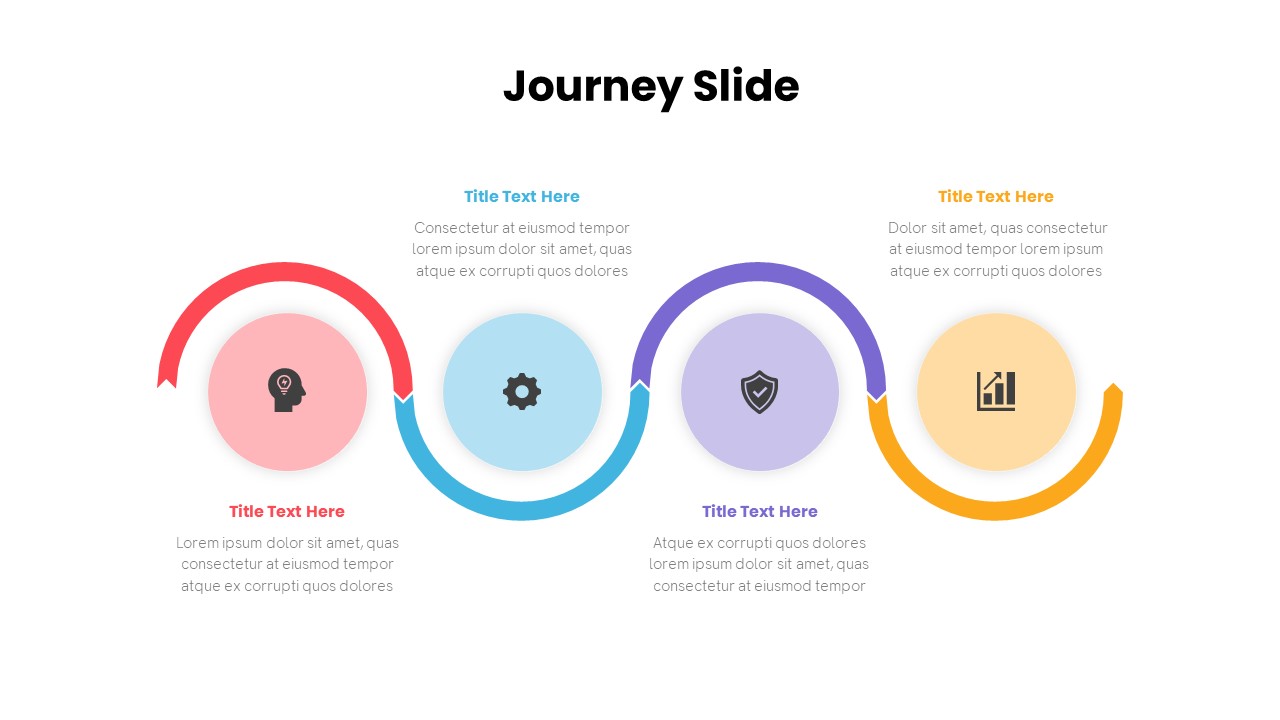
Free Journey Slide with Four Icons Diagram Template for PowerPoint & Google Slides
Process
Free
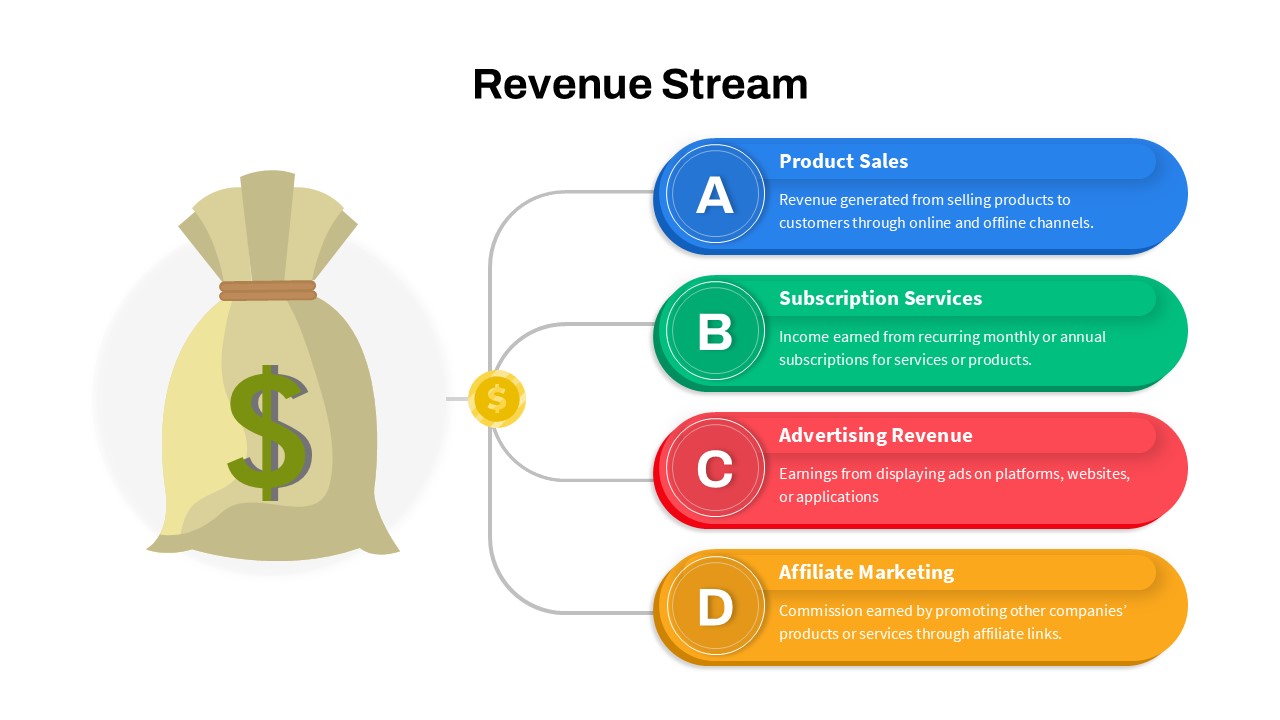
Revenue Streams: Four Channels Diagram Template for PowerPoint & Google Slides
Business Models
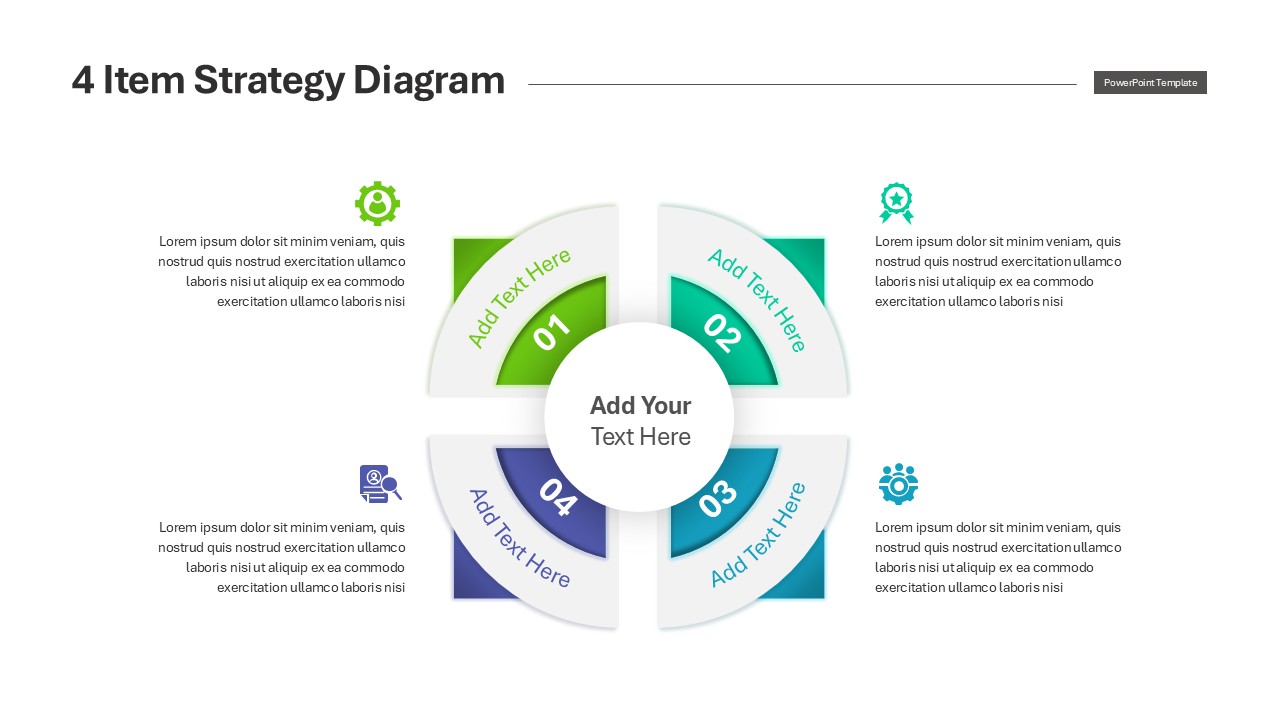
Engaging Four-Option Strategy Diagram Template for PowerPoint & Google Slides
Business Strategy
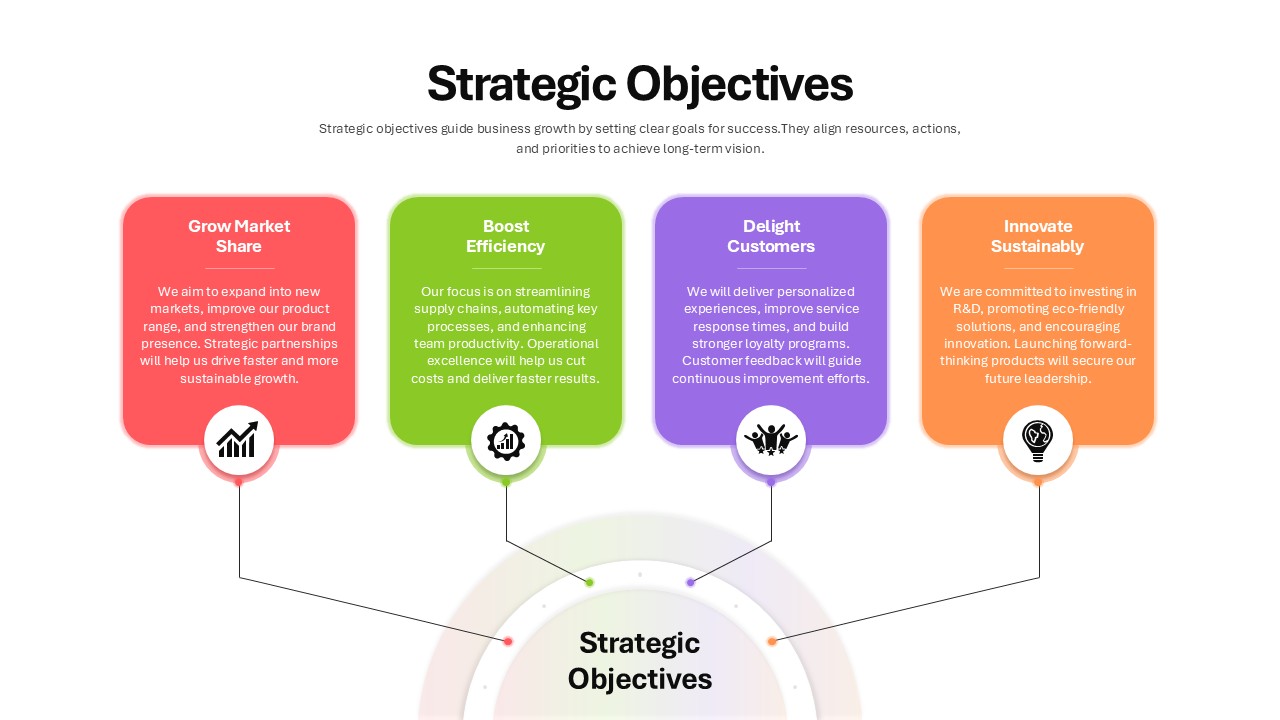
Four Strategic Objectives Radial Diagram Template for PowerPoint & Google Slides
Business Strategy
Four-Level Colorful Pyramid Diagram Template for PowerPoint & Google Slides
Pyramid