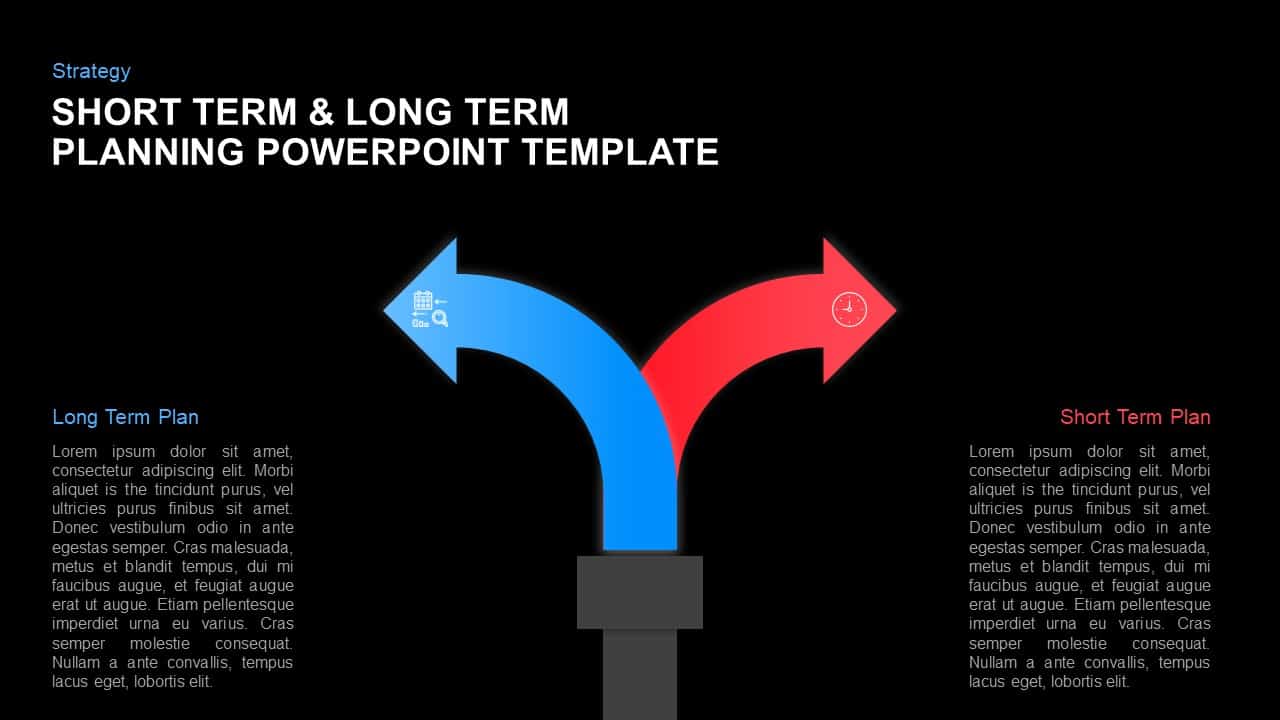
Long-Term vs Short-Term Planning Diagram Template for PowerPoint & Google Slides


Description
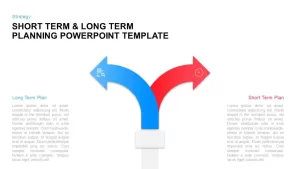
Leverage this dual-path infographic slide to illustrate and compare short-term and long-term planning strategies in a clear, visually engaging format. A central pillar splits into two outward arrows—blue for long-term initiatives and red for short-term goals—each adorned with customizable icons and text placeholders for detailed explanations. Editable vector shapes and master-slide integration allow you to swap icons, adjust arrow directions, or modify gradient fills effortlessly. The minimalist white background, subtle drop shadows, and crisp typography ensure audience focus remains on your content and key takeaways.
Optimized for PowerPoint and Google Slides, this template uses SmartArt-like elements and built-in animations for sequential reveals, helping presenters guide listeners through each planning horizon step-by-step. You can hide or highlight individual arrows to emphasize specific timelines, recolor gradients to match corporate branding, and tweak typography styles via the slide master to maintain consistency across your deck. High-contrast color pairings and accessible font sizes enable clear reading for all viewers, while vector-based graphics guarantee pixel-perfect scaling across devices.
Each arrow segment includes optional numeric labels or timeline markers to anchor your narrative and reinforce data-driven storytelling. Master slide customization ensures global updates to color schemes and fonts, eliminating version-control headaches when collaborating in teams.
Designed for flexibility, this slide extends beyond temporal planning: repurpose it to map decision trees, illustrate diverging project paths, compare strategic options, or depict process forks. Whether you’re a business strategist outlining multi-horizon objectives, a project manager prioritizing roadmap milestones, or a consultant presenting alternative solutions, this dual-path diagram empowers you to present complex comparisons with confidence and precision.
Who is it for
Strategists, project managers, consultants, business analysts, and team leads will benefit from this slide when presenting comparative planning horizons or alternative strategic paths.
Other Uses
Repurpose this template to visualize decision trees, compare divergent project scenarios, illustrate product development options, map out workflow forks, or present risk-reward trade-offs.
Login to download this file

Item ID
SB01333
Related Templates

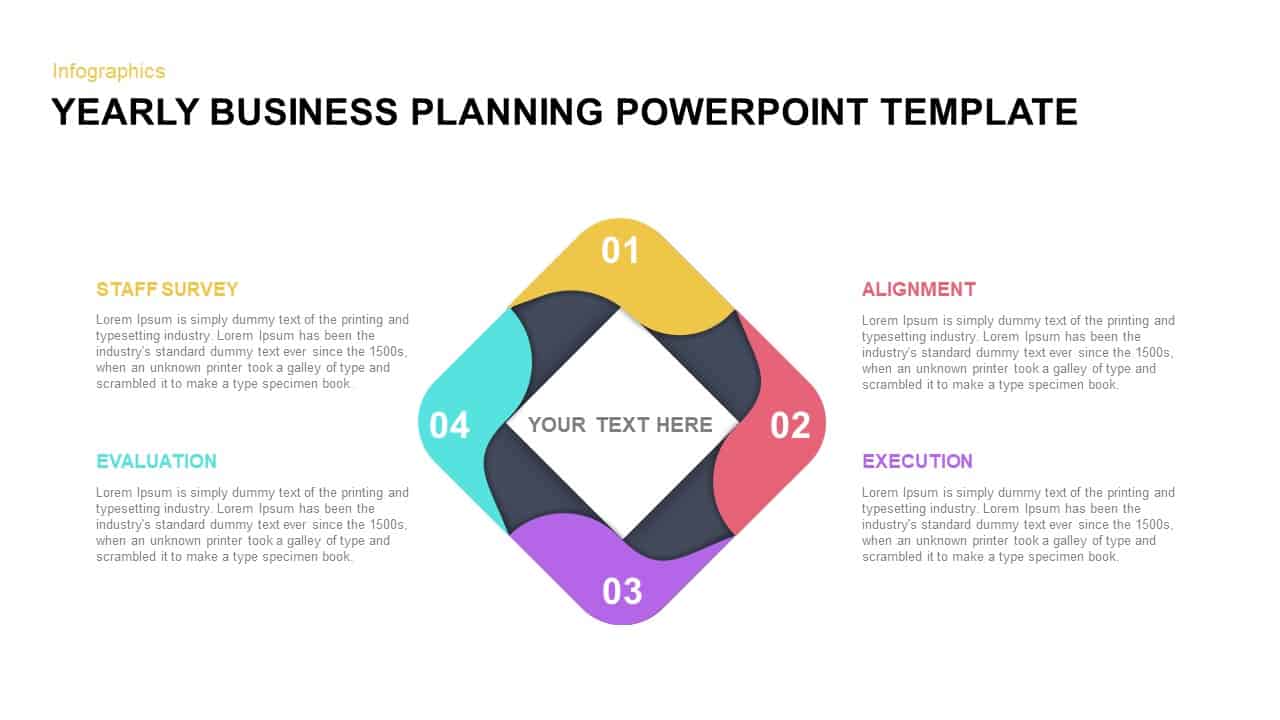
Yearly Business Planning Diamond Diagram Template for PowerPoint & Google Slides
Process

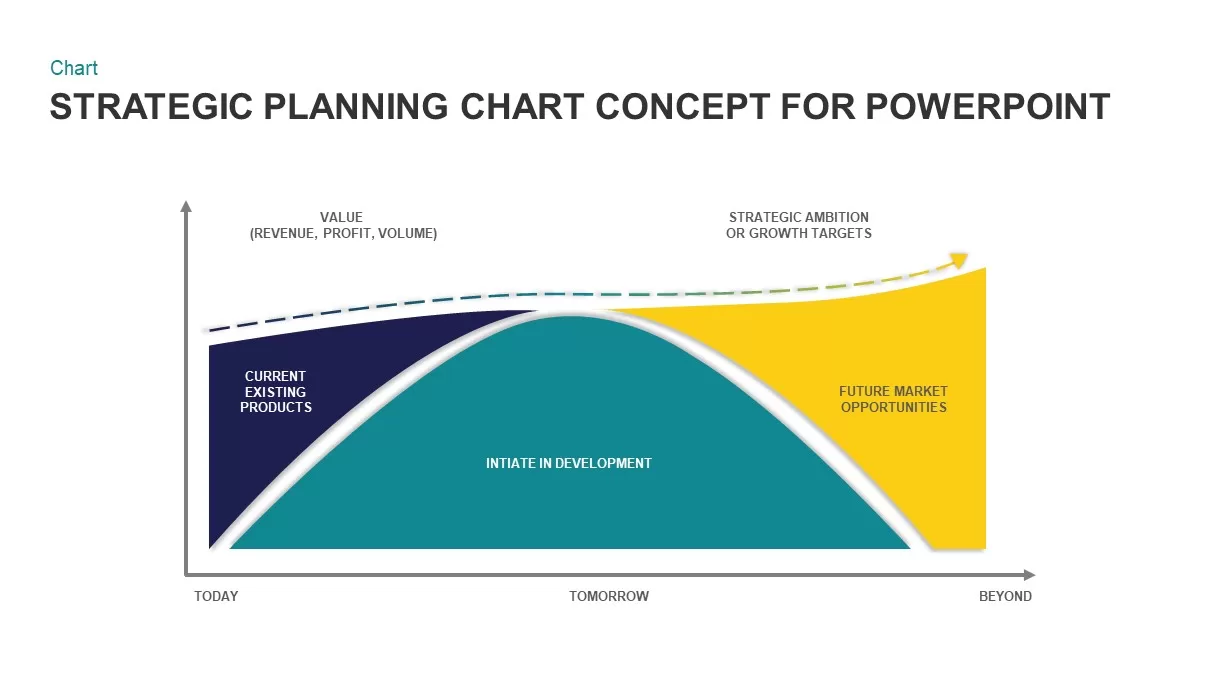
Strategic Planning Curve Diagram Template for PowerPoint & Google Slides
Charts
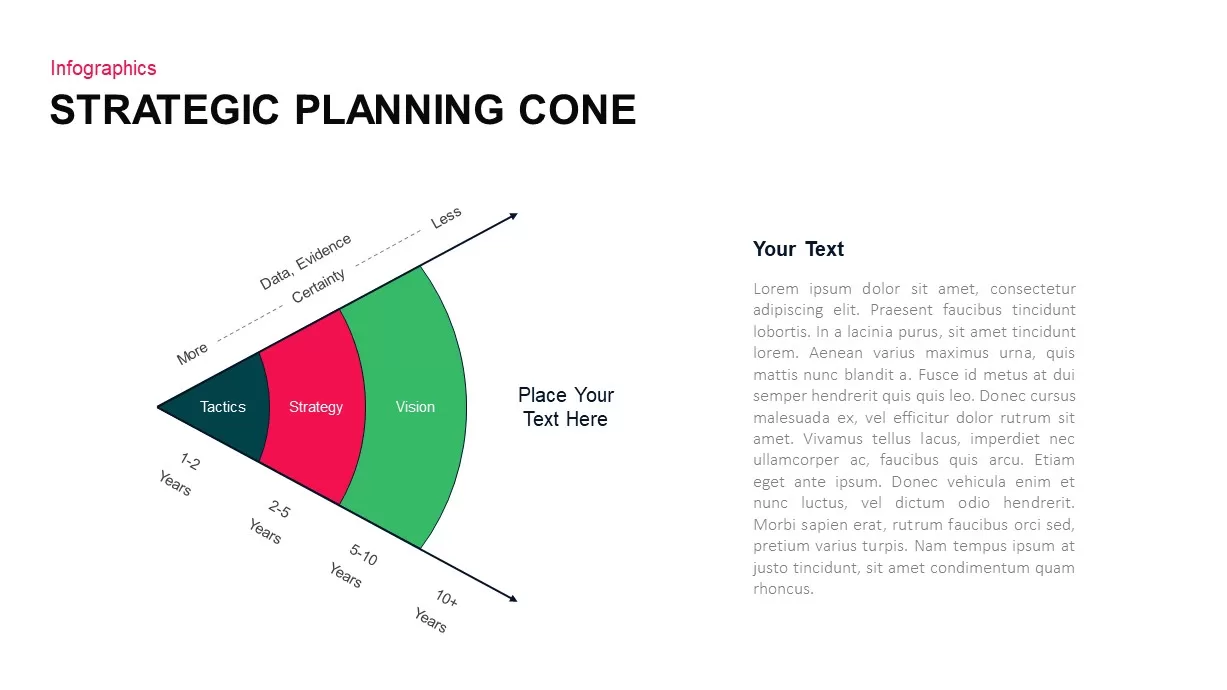
3-Part Strategic Planning Cone Diagram Template for PowerPoint & Google Slides
Process
Capacity Planning Circular Diagram Template for PowerPoint & Google Slides
Circular
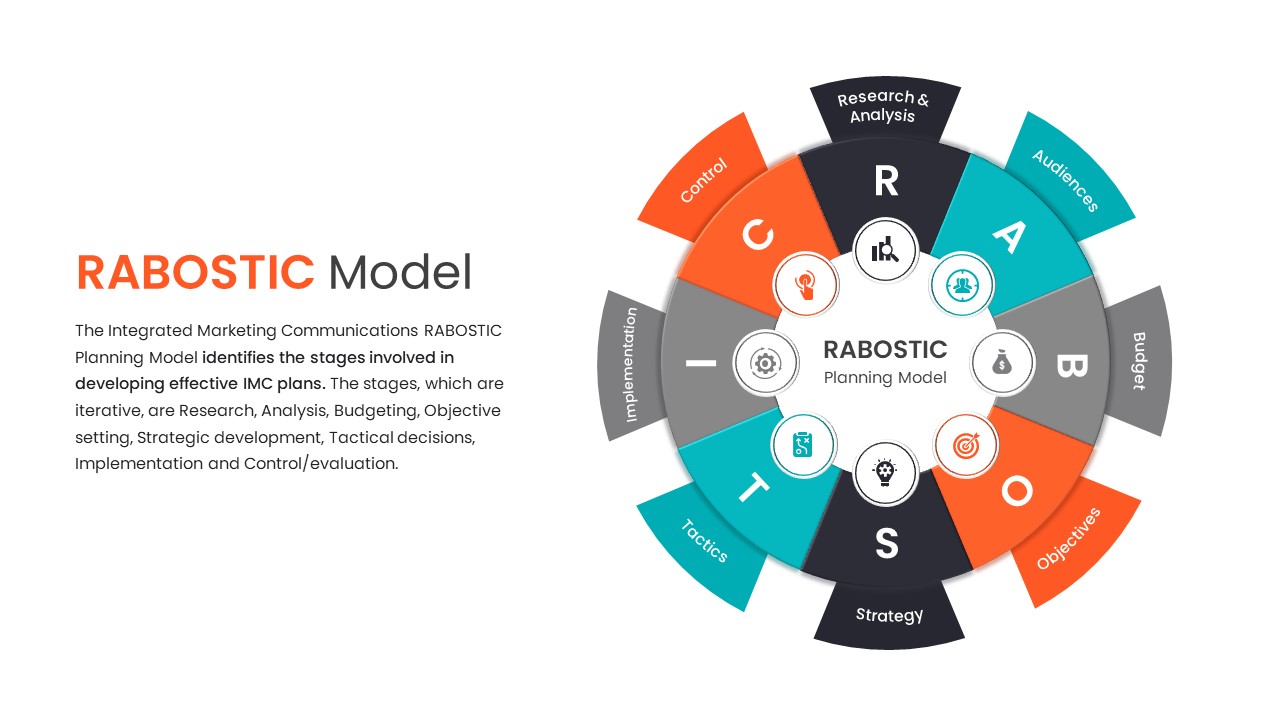
RABOSTIC IMC Planning Model Diagram Template for PowerPoint & Google Slides
Process
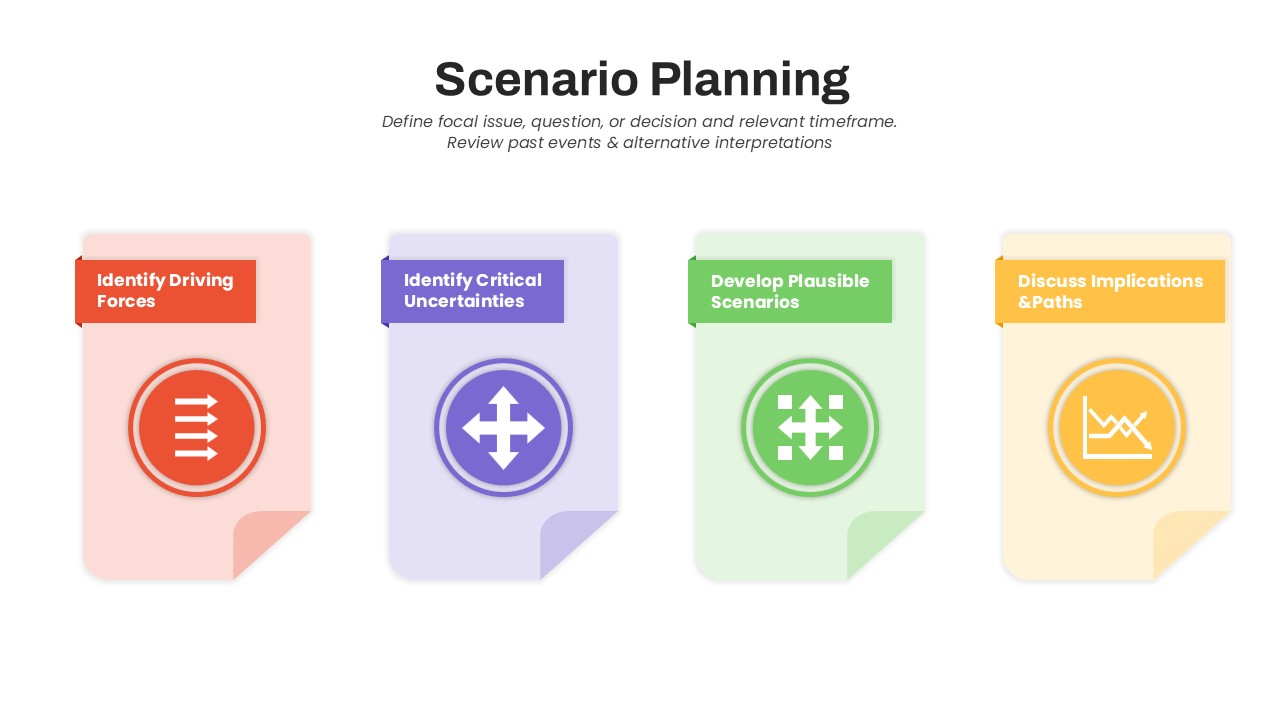
Scenario Planning Process Diagram Template for PowerPoint & Google Slides
Process
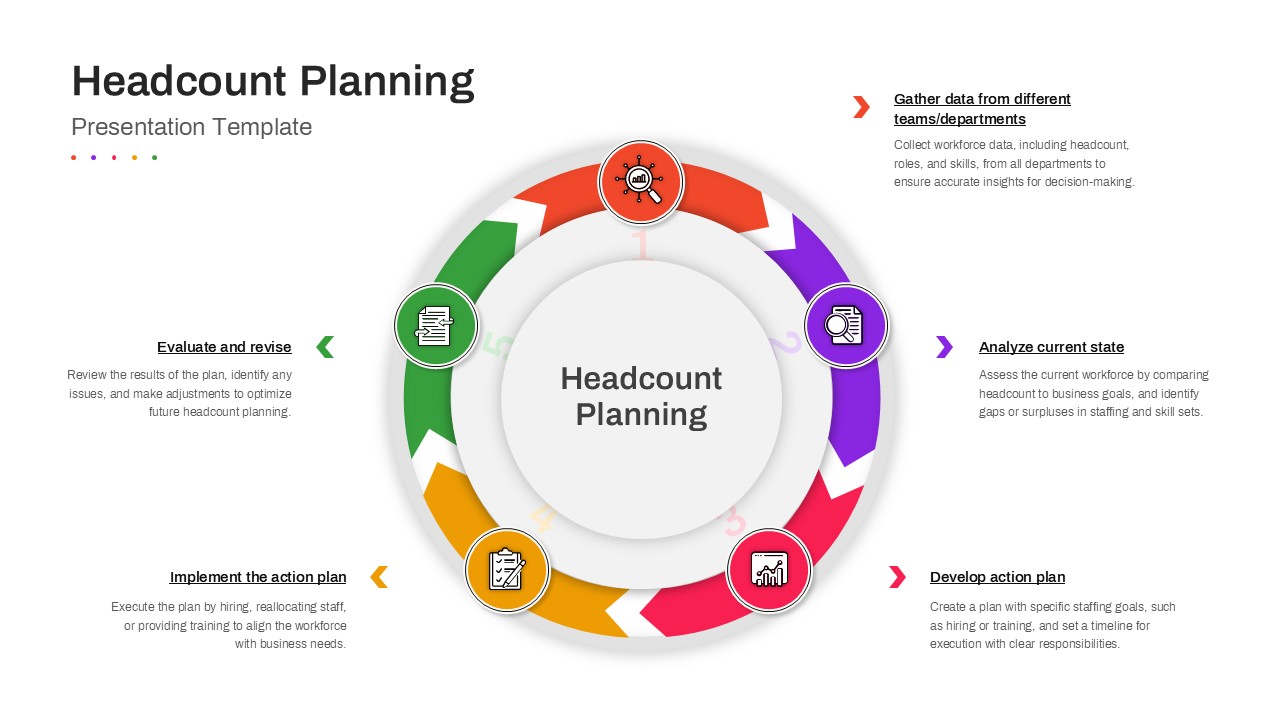
Headcount Planning Circular Process Diagram Template for PowerPoint & Google Slides
HR
Sequential Arrow Timeline and Planning template for PowerPoint & Google Slides
Timeline

Planning Metaphor Flowchart Slide Template for PowerPoint & Google Slides
Process
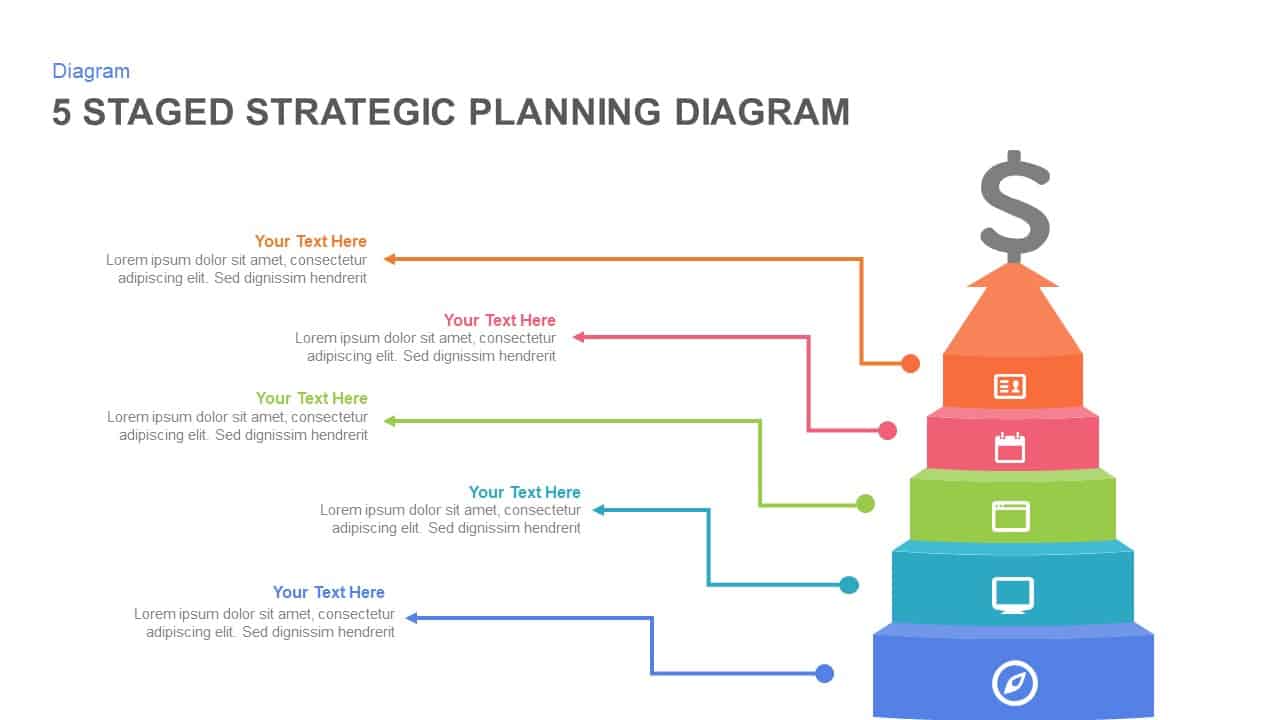
5-Stage Strategic Planning Pyramid Template for PowerPoint & Google Slides
Business Strategy
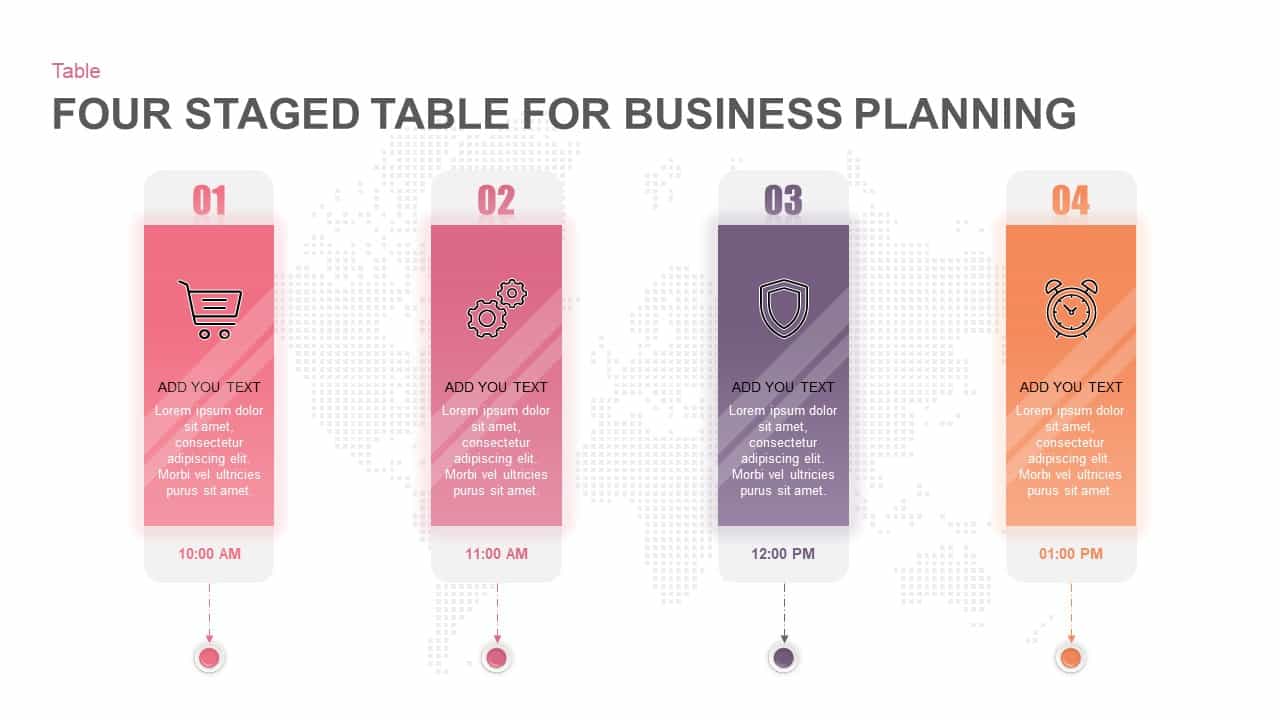
Four-Stage Business Planning Table Template for PowerPoint & Google Slides
Business Plan
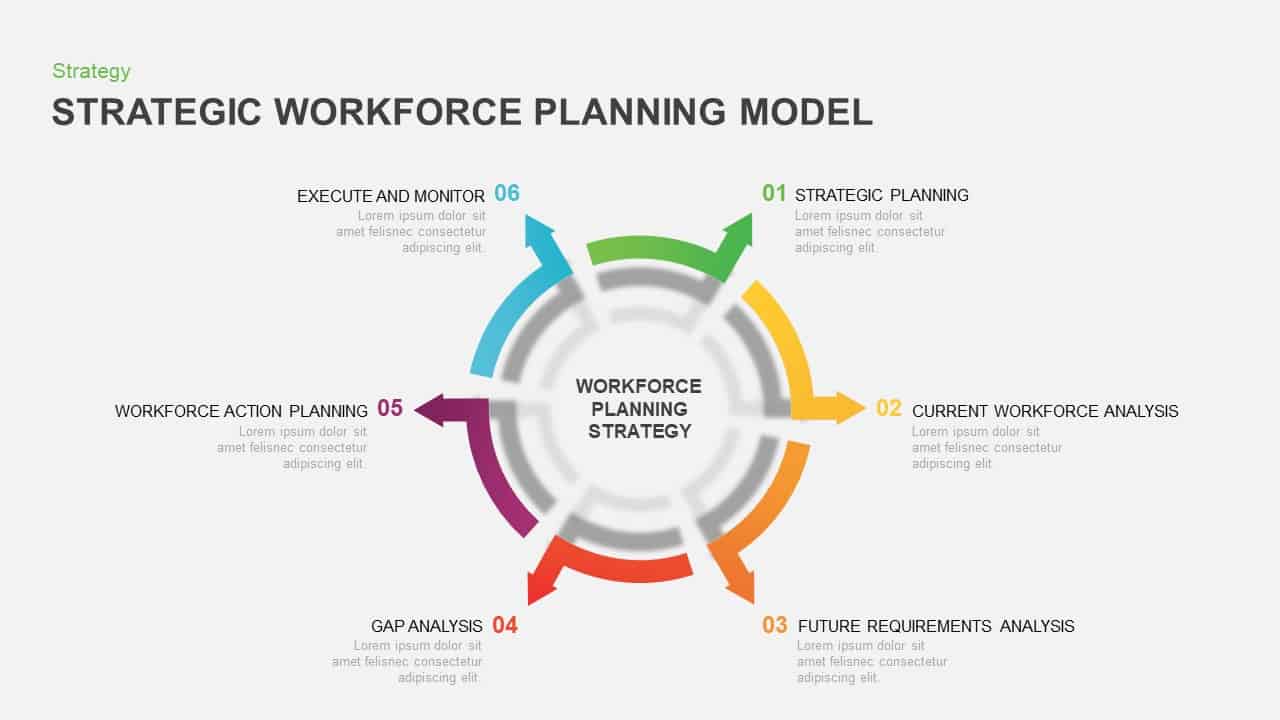
Strategic Workforce Planning Circular Template for PowerPoint & Google Slides
Circular
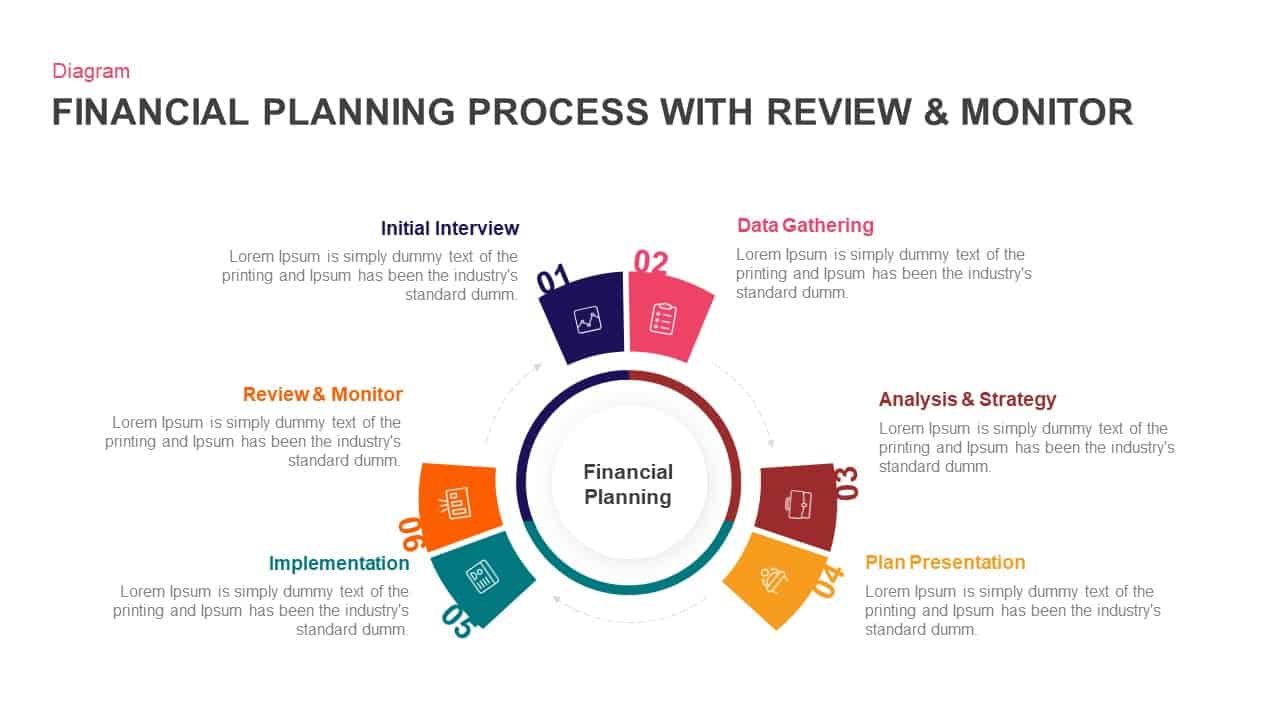
Financial Planning Circular Process Template for PowerPoint & Google Slides
Process
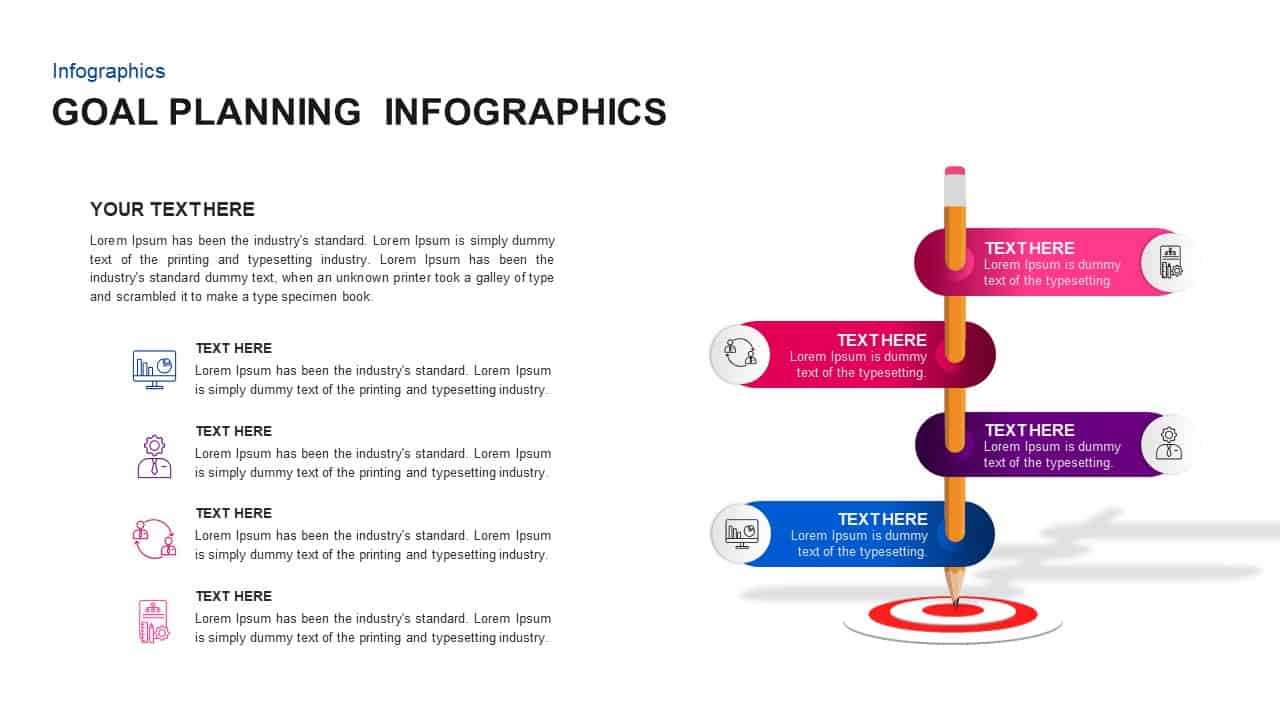
Goal Planning Ribbon Process Infographic Template for PowerPoint & Google Slides
Goals
SOAR Strategic Planning Infographic Template for PowerPoint & Google Slides
Process
Three-Phase Planning Gear Infographic Template for PowerPoint & Google Slides
Process
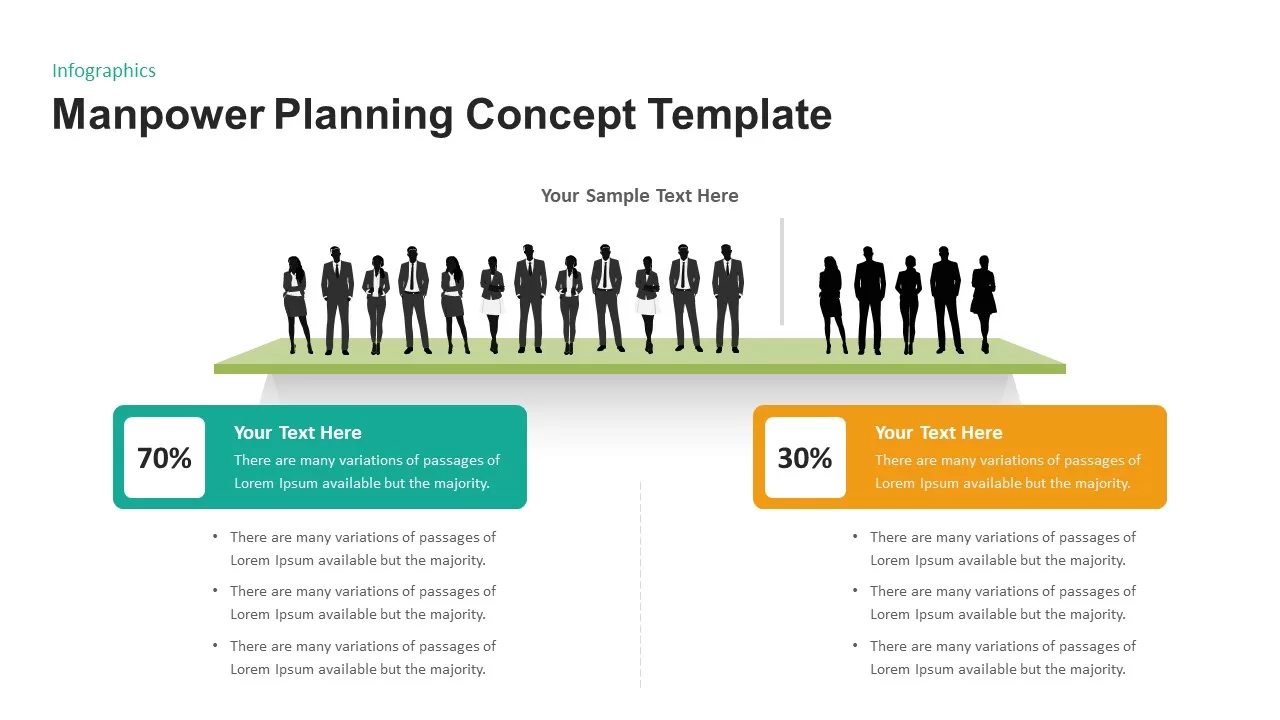
Manpower Planning Concept Comparison Template for PowerPoint & Google Slides
Comparison Chart
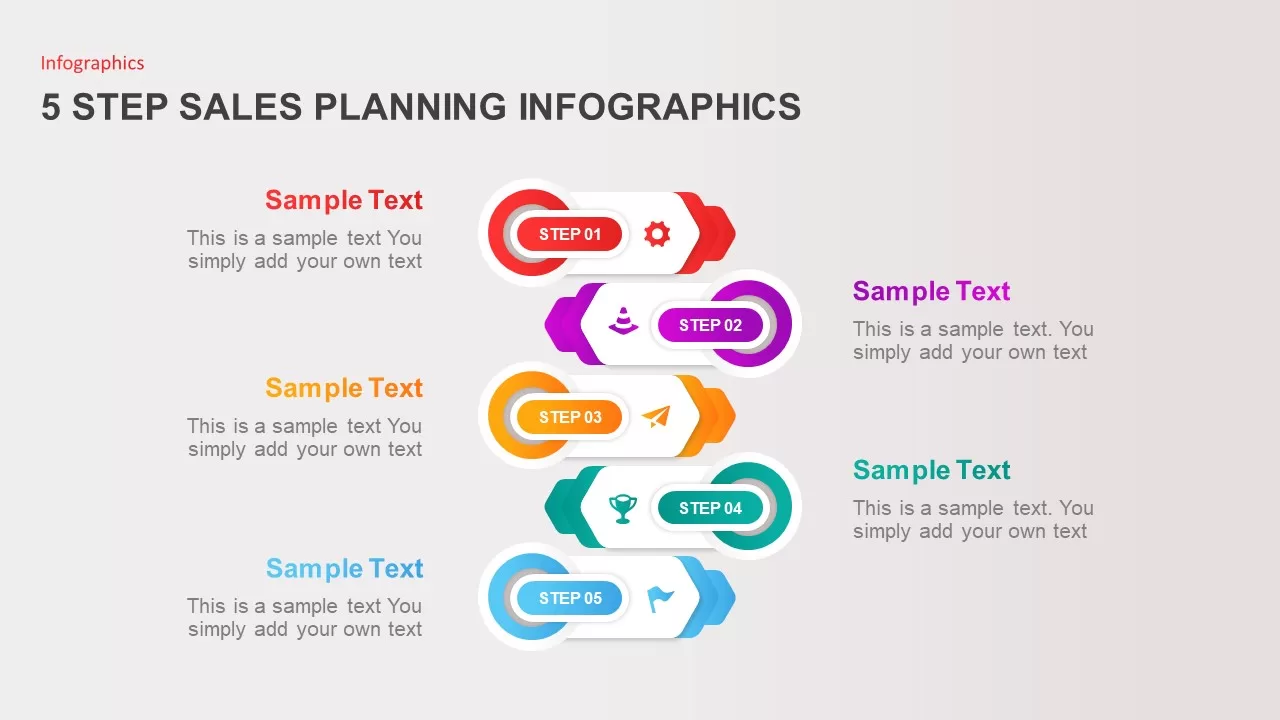
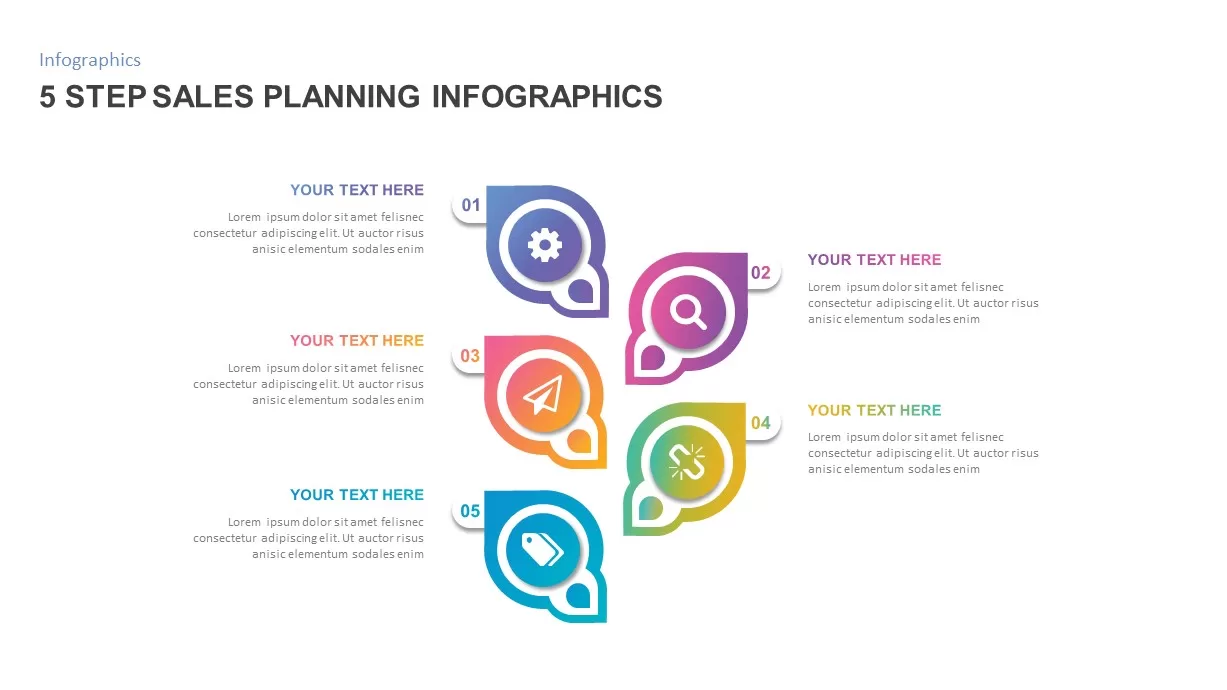
5 Step Sales Planning Infographics Template for PowerPoint & Google Slides
Process
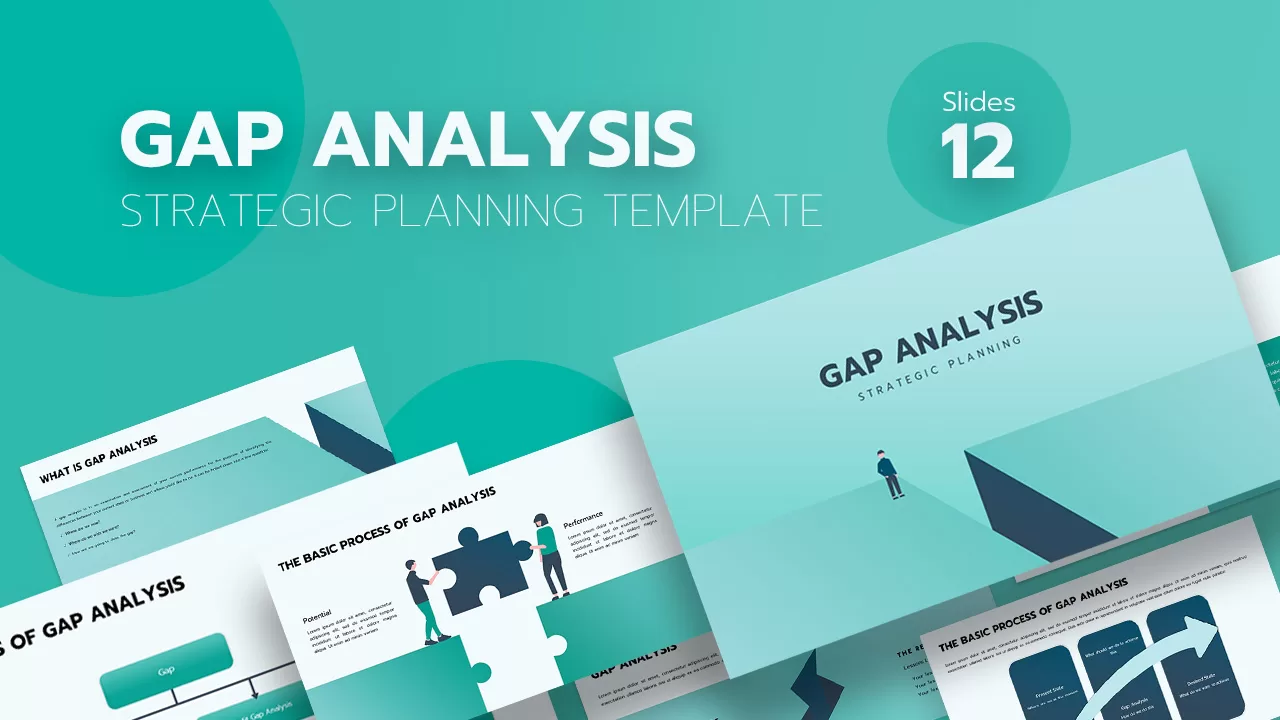
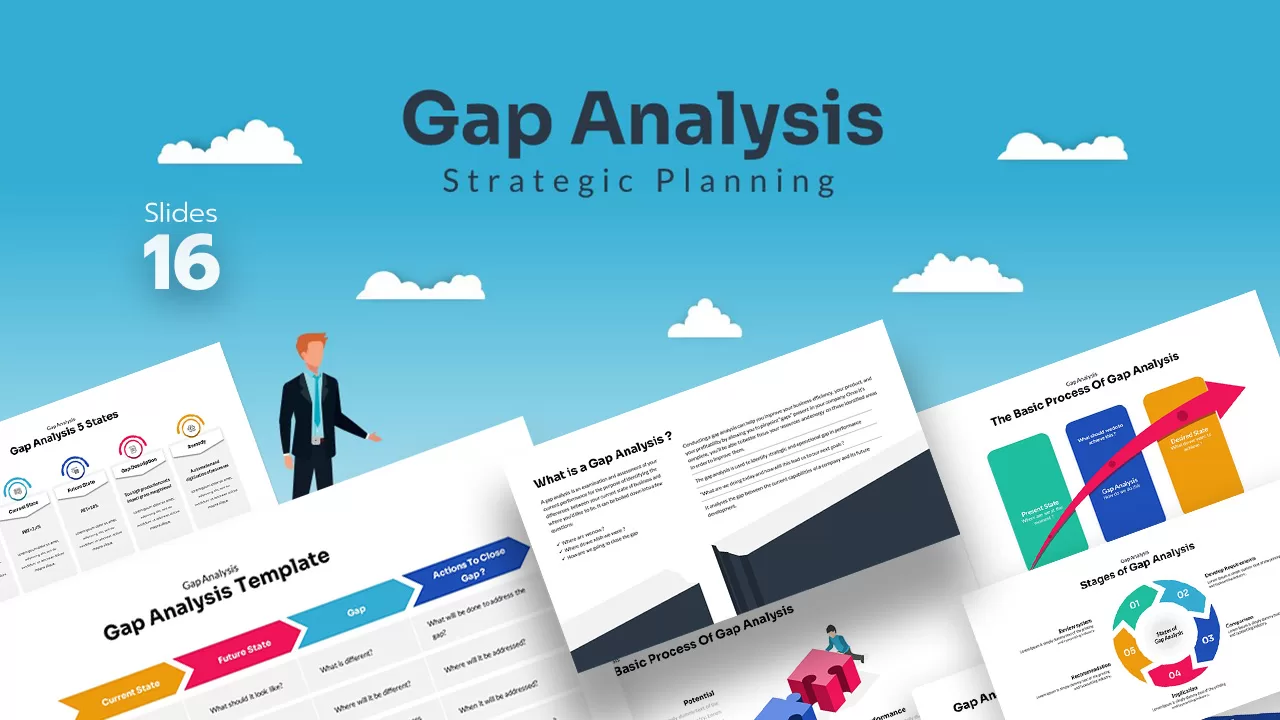
Gap Analysis Strategic Planning Template for PowerPoint & Google Slides
Gap
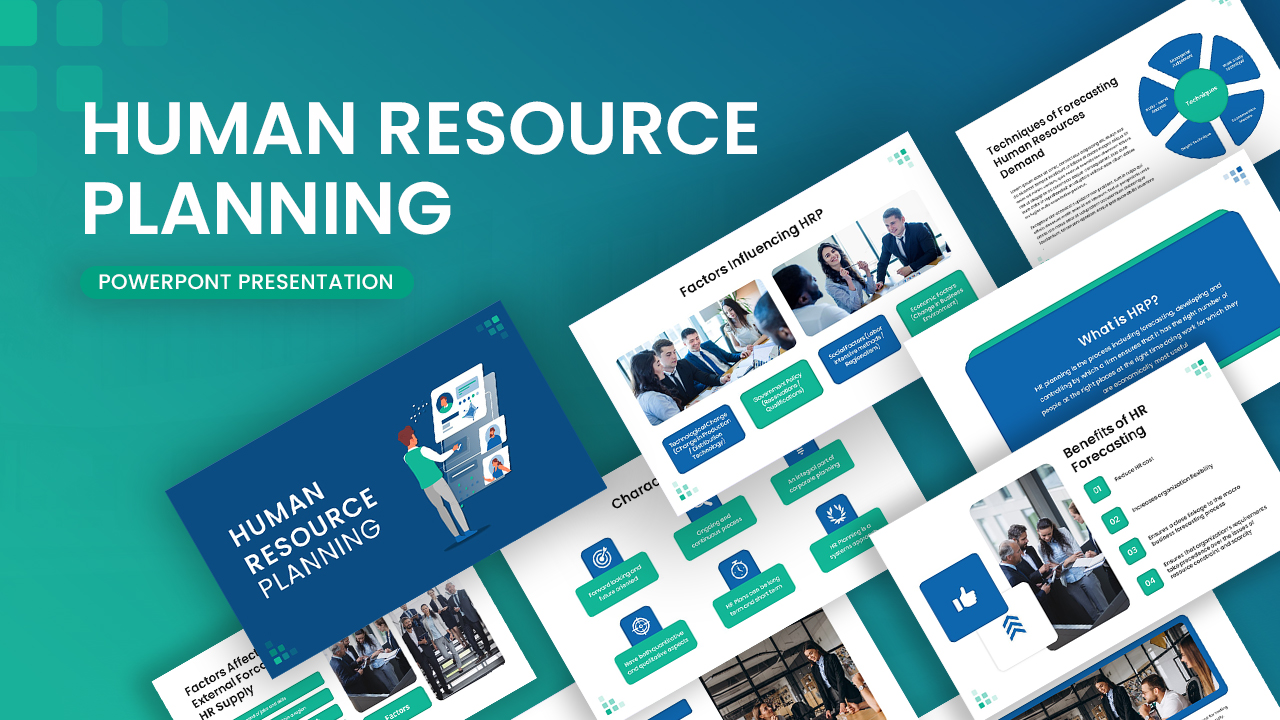
Human Resource Planning Template for PowerPoint & Google Slides
Decks
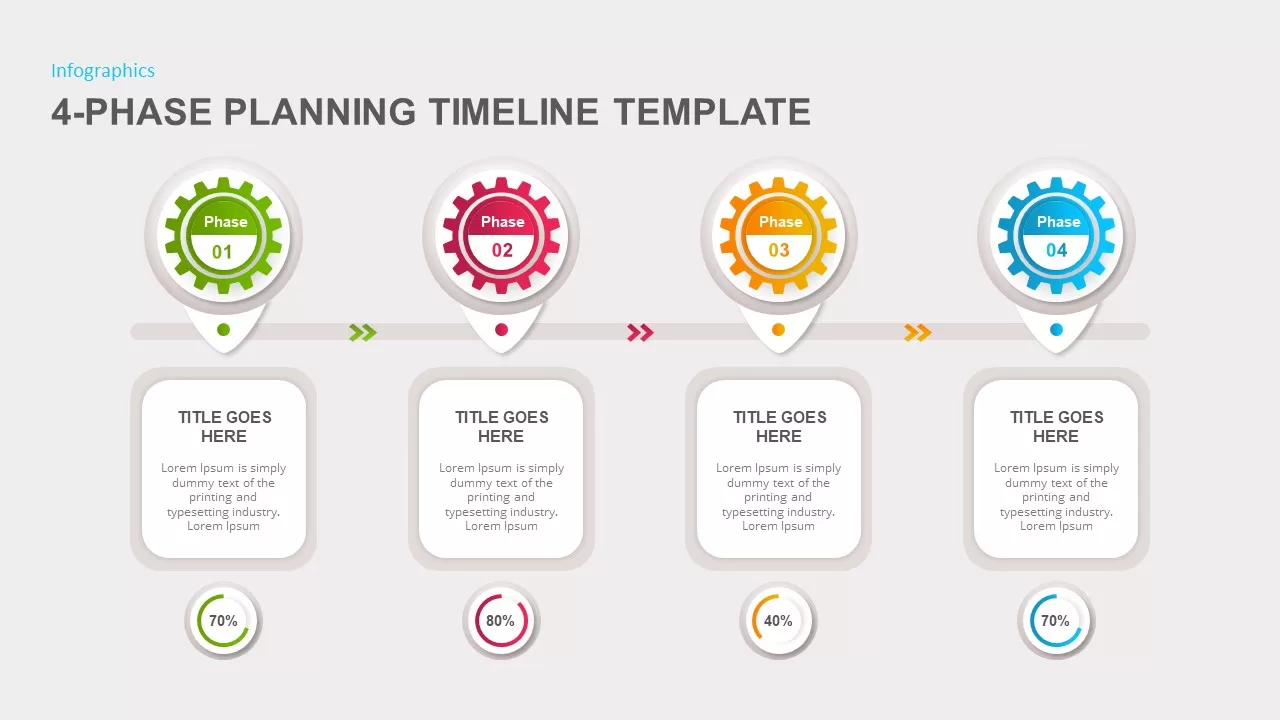
4-Phase Planning Timeline template for PowerPoint & Google Slides
Infographics
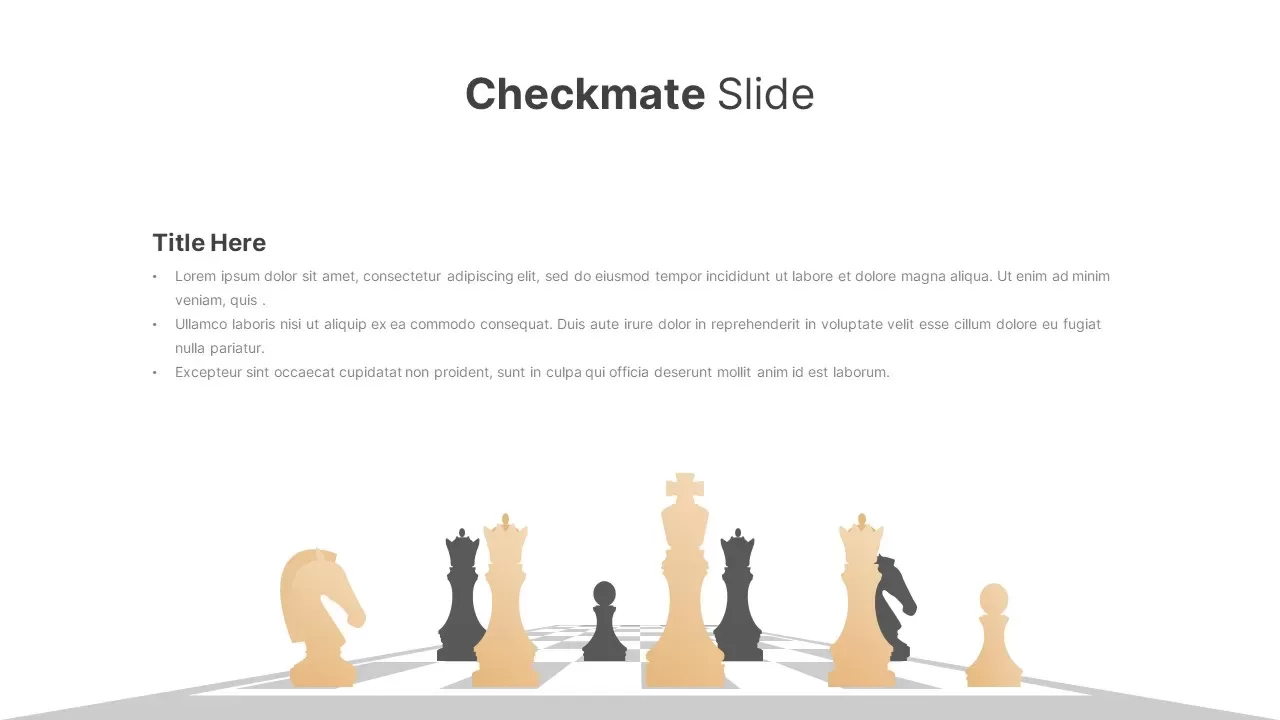
Strategic Checkmate Slide for Planning Template for PowerPoint & Google Slides
Business Report
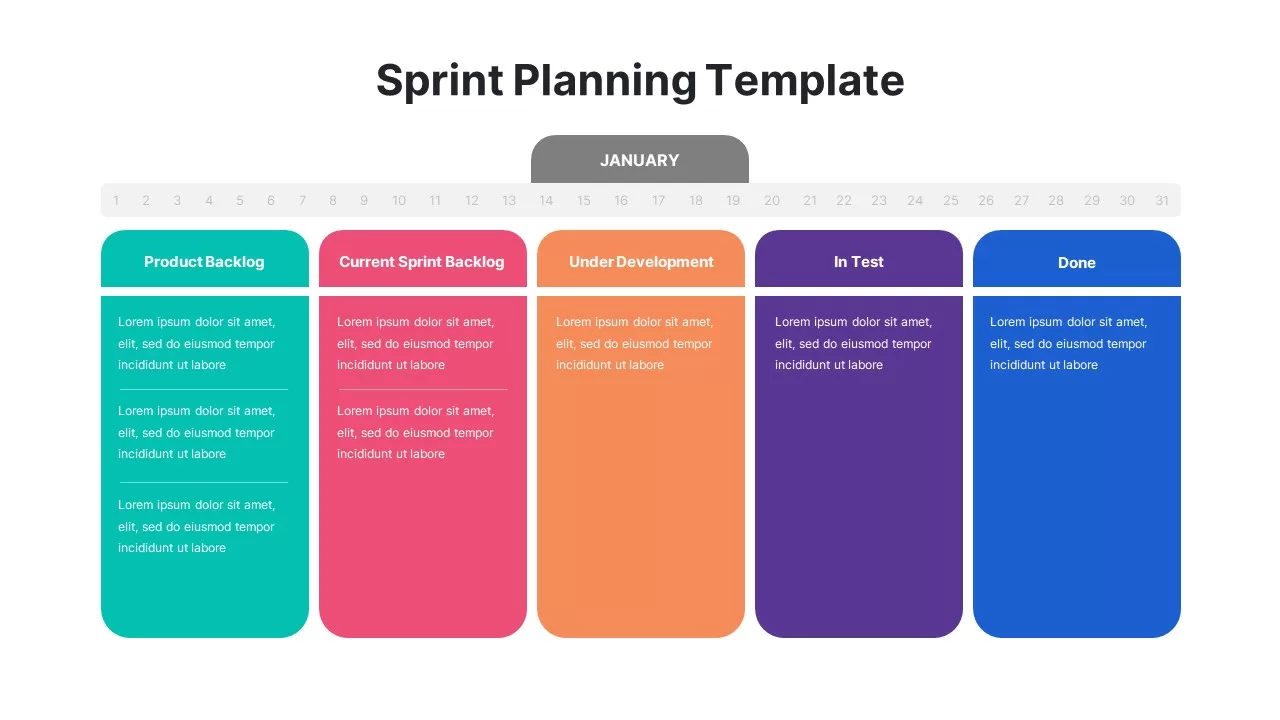
Sprint Planning Timeline & Backlog Cards Template for PowerPoint & Google Slides
Timeline
Comprehensive Resource Planning Table Template for PowerPoint & Google Slides
Project
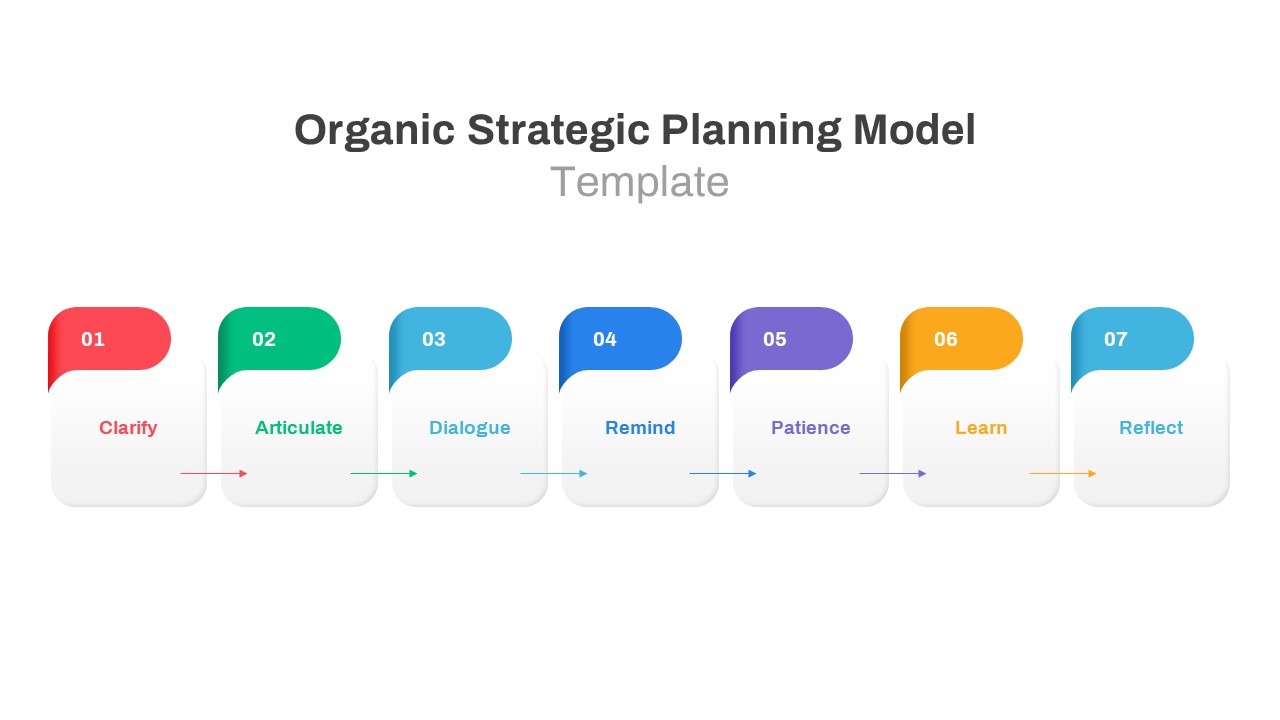
Organic Strategic Planning Model Template for PowerPoint & Google Slides
Business Strategy
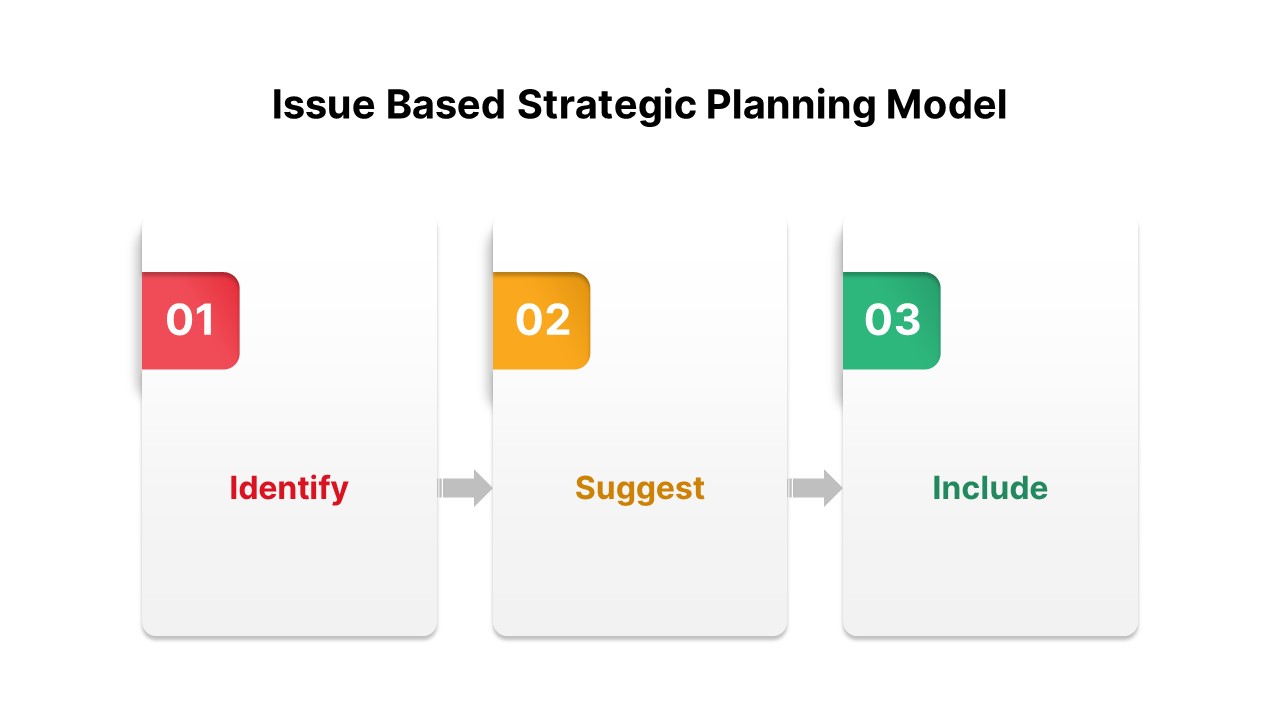
Issue-Based Strategic Planning Model Template for PowerPoint & Google Slides
Business Strategy
Iterative Strategic Planning Cycle Template for PowerPoint & Google Slides
Business Strategy
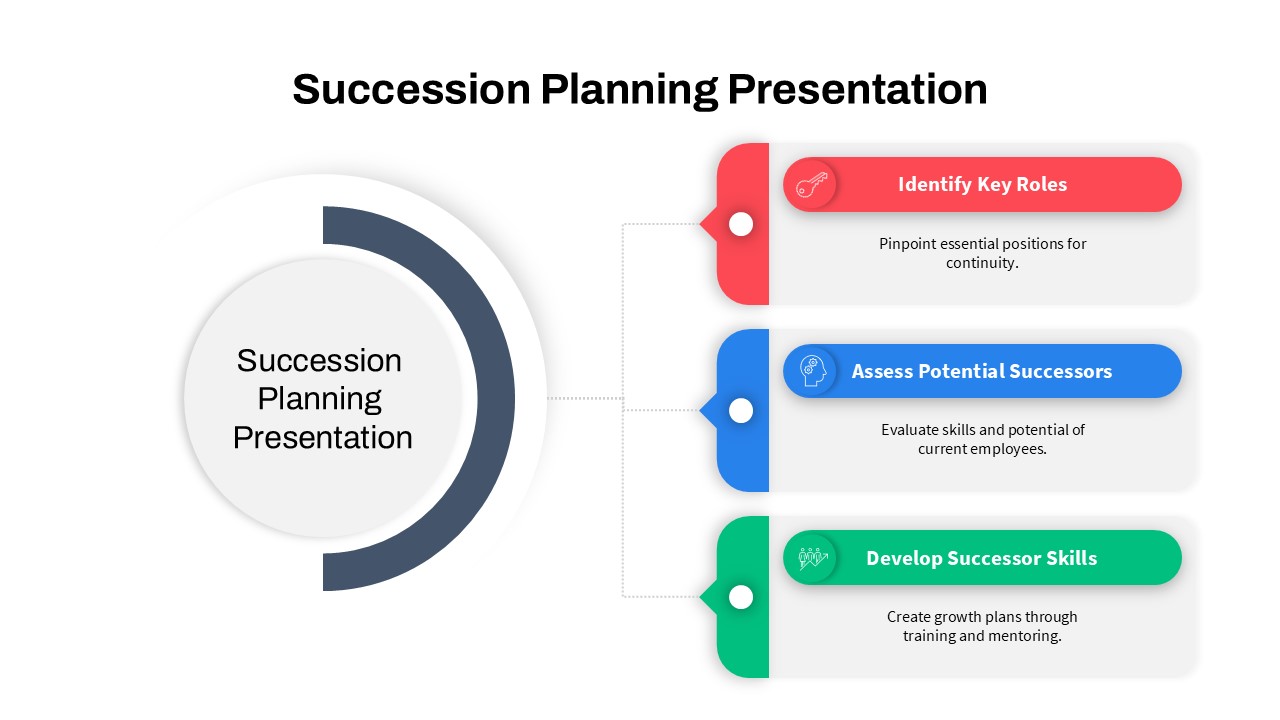
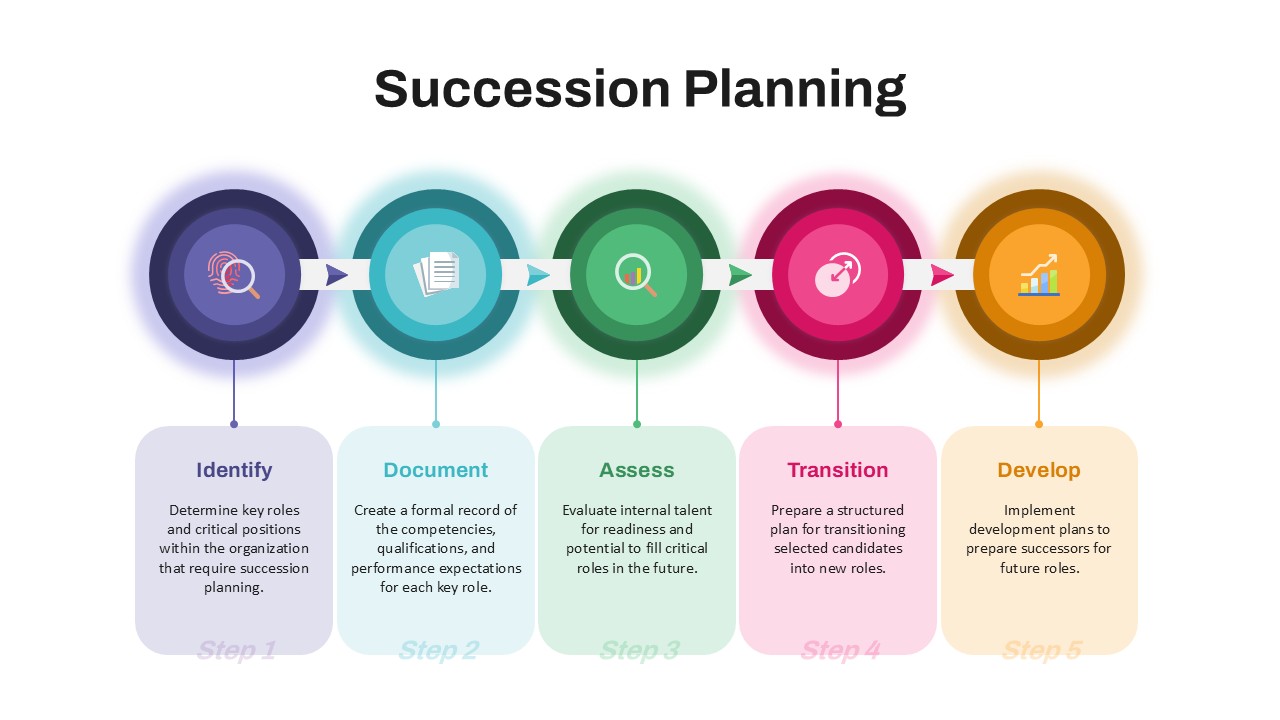
Succession Planning Presentation Template for PowerPoint & Google Slides
Company Profile
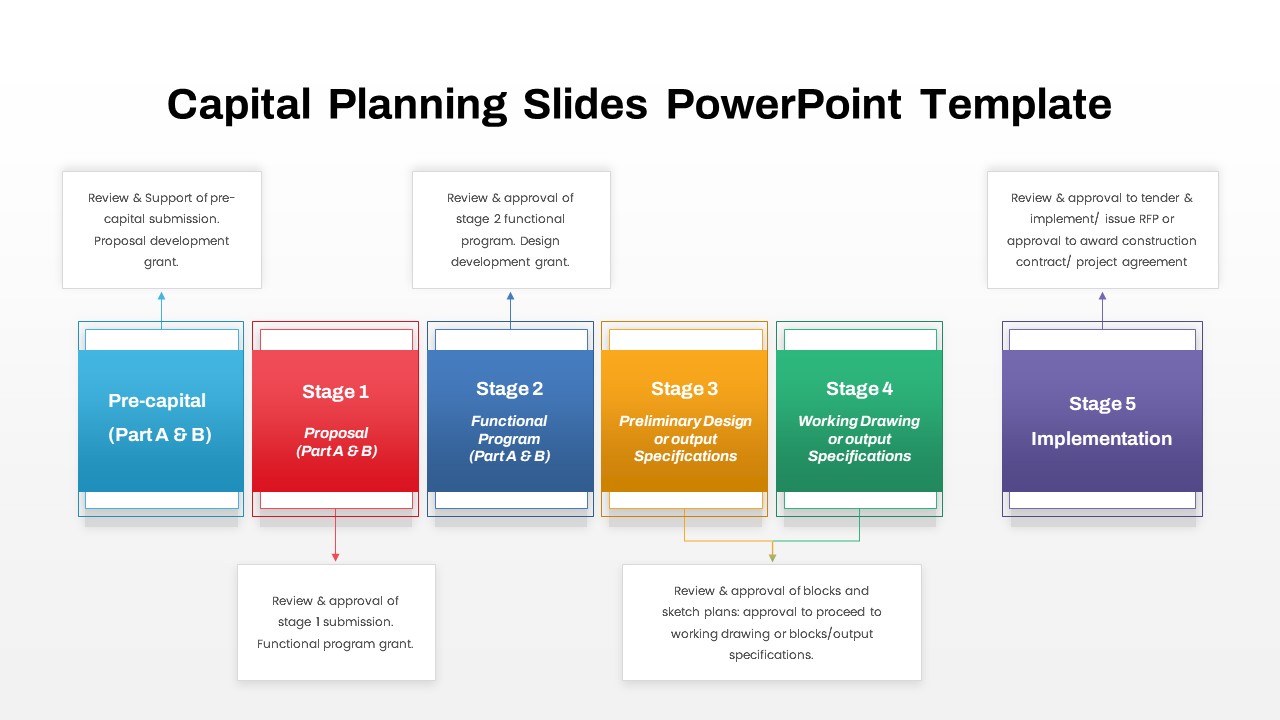
Capital Planning Five-Stage Process template for PowerPoint & Google Slides
Process
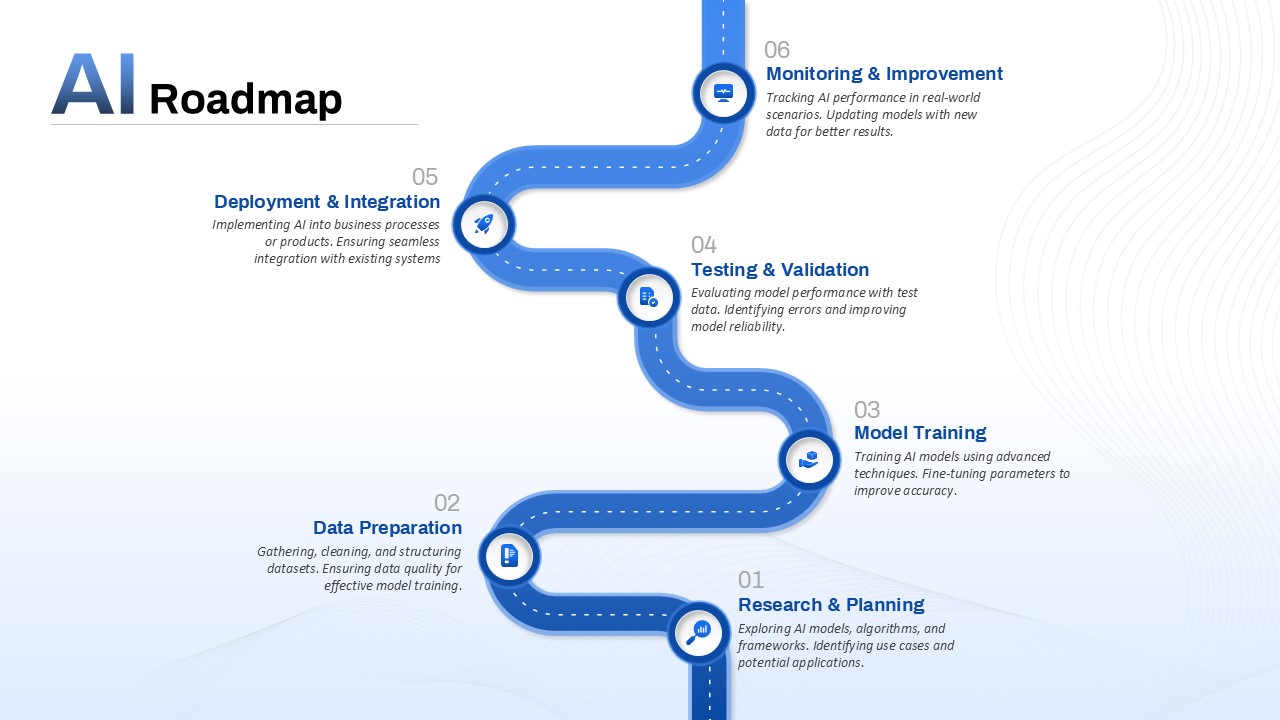
AI Roadmap & Planning Timeline Template for PowerPoint & Google Slides
Roadmap
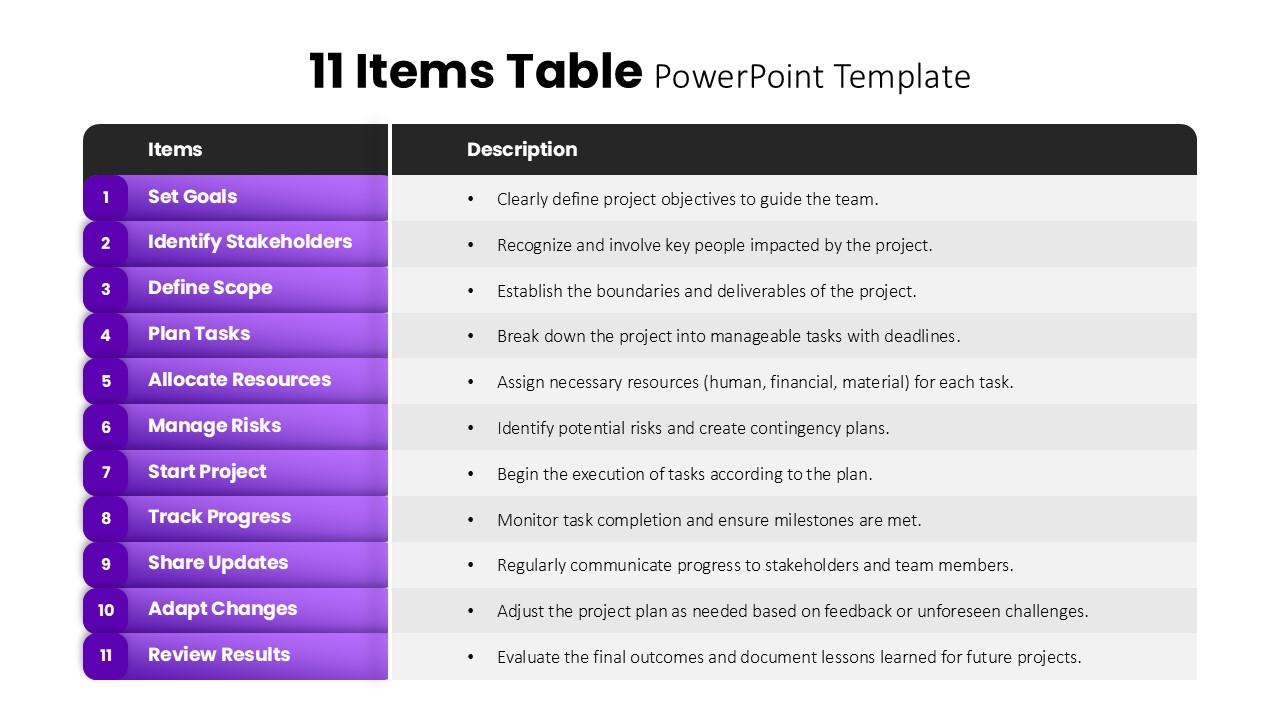
11 Items Table Project Planning Steps template for PowerPoint & Google Slides
Business
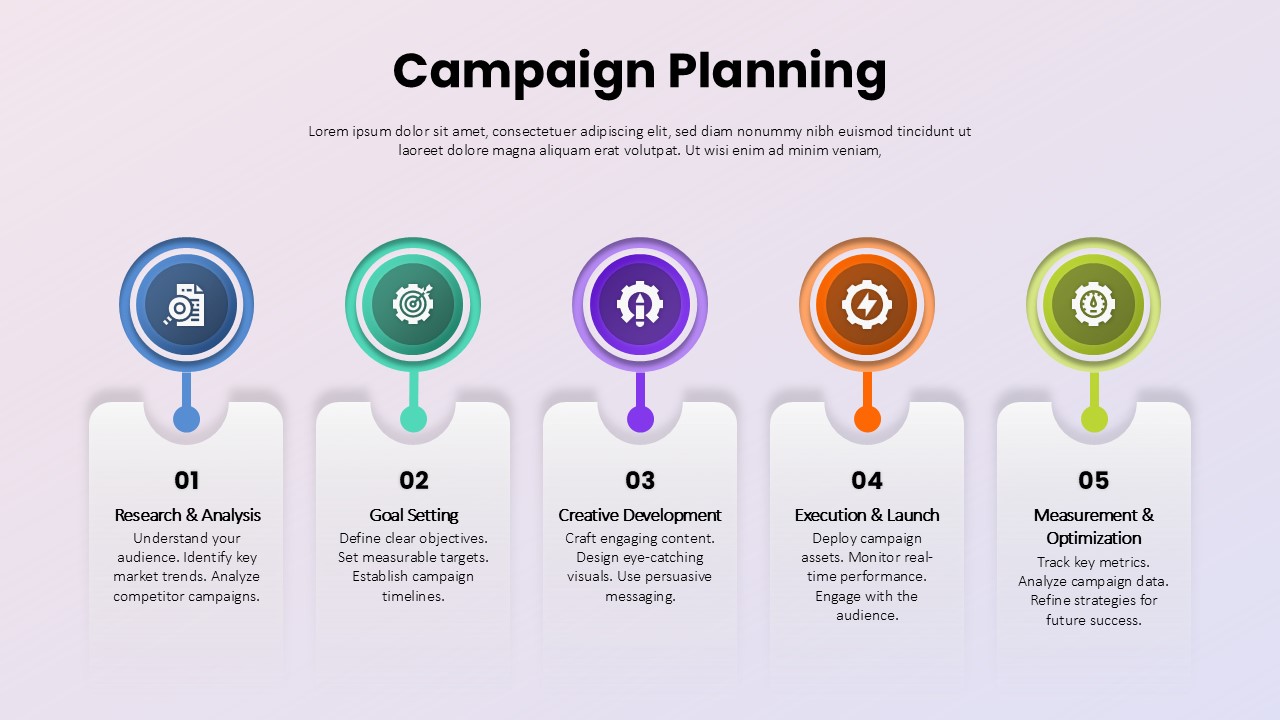
Campaign Planning Process template for PowerPoint & Google Slides
Process
Strategic Planning Consulting Template for PowerPoint & Google Slides
Business Strategy
Event Planning Gantt Chart template for PowerPoint & Google Slides
Business
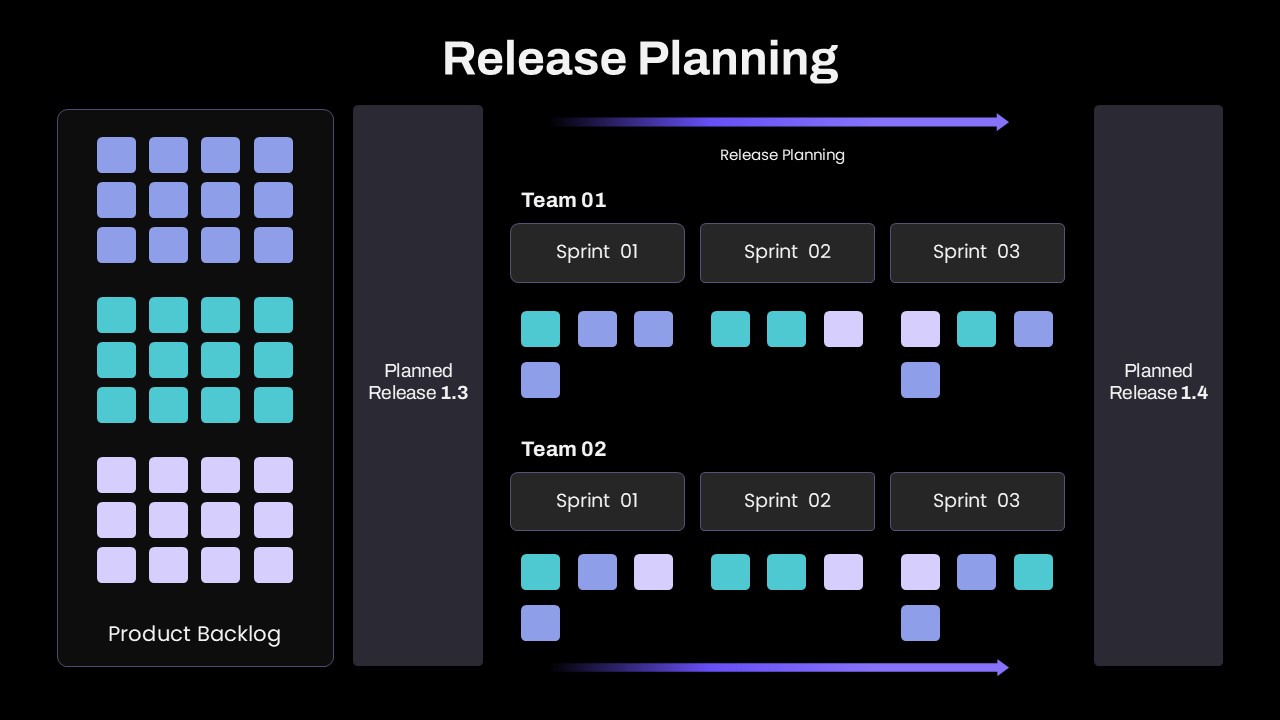
Release Planning Template for PowerPoint & Google Slides
Scrum
Advanced Succession Planning Workflow Template for PowerPoint & Google Slides
Employee Performance
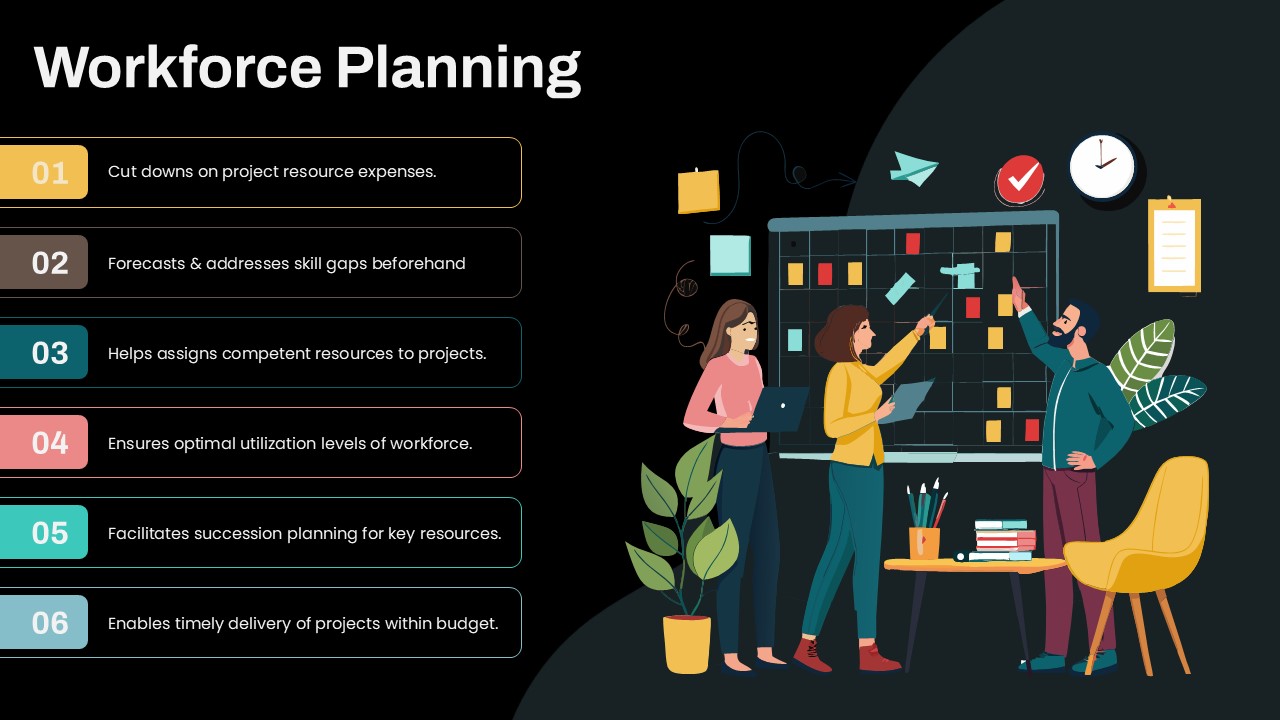
Workforce Planning Benefits Infographic Template for PowerPoint & Google Slides
HR
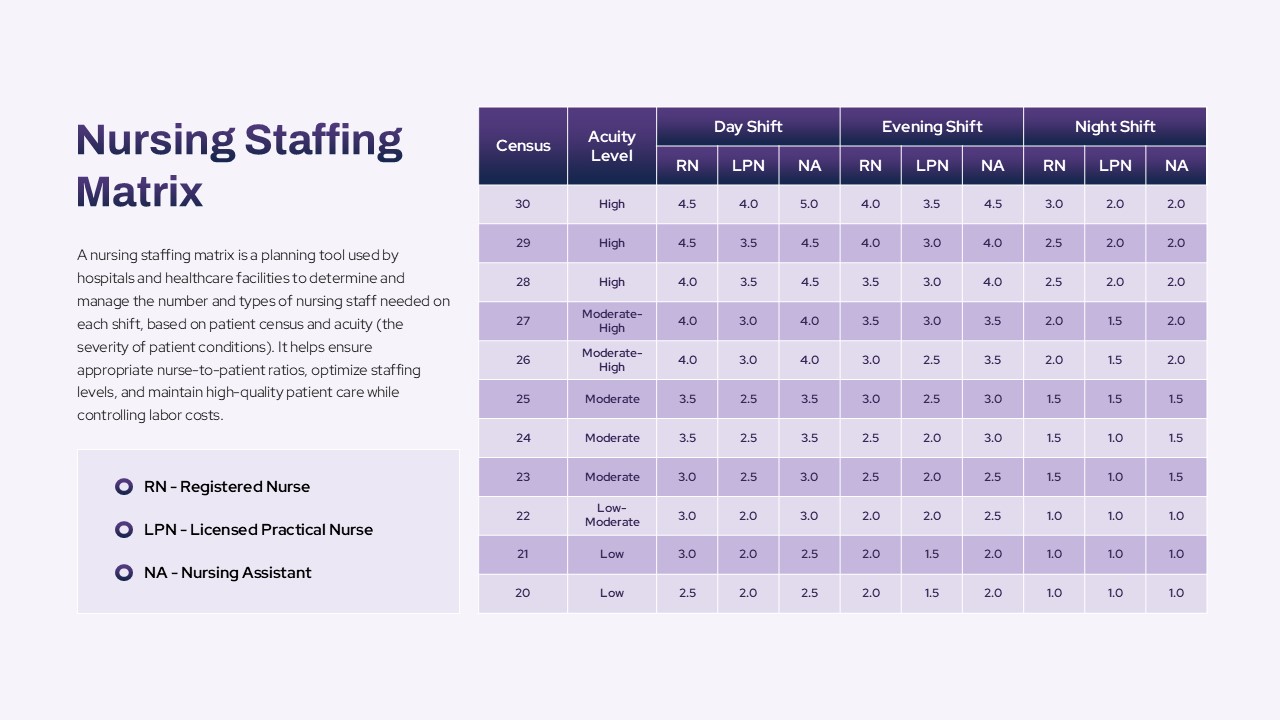
Nursing Staffing Matrix Planning Template for PowerPoint & Google Slides
Nursing
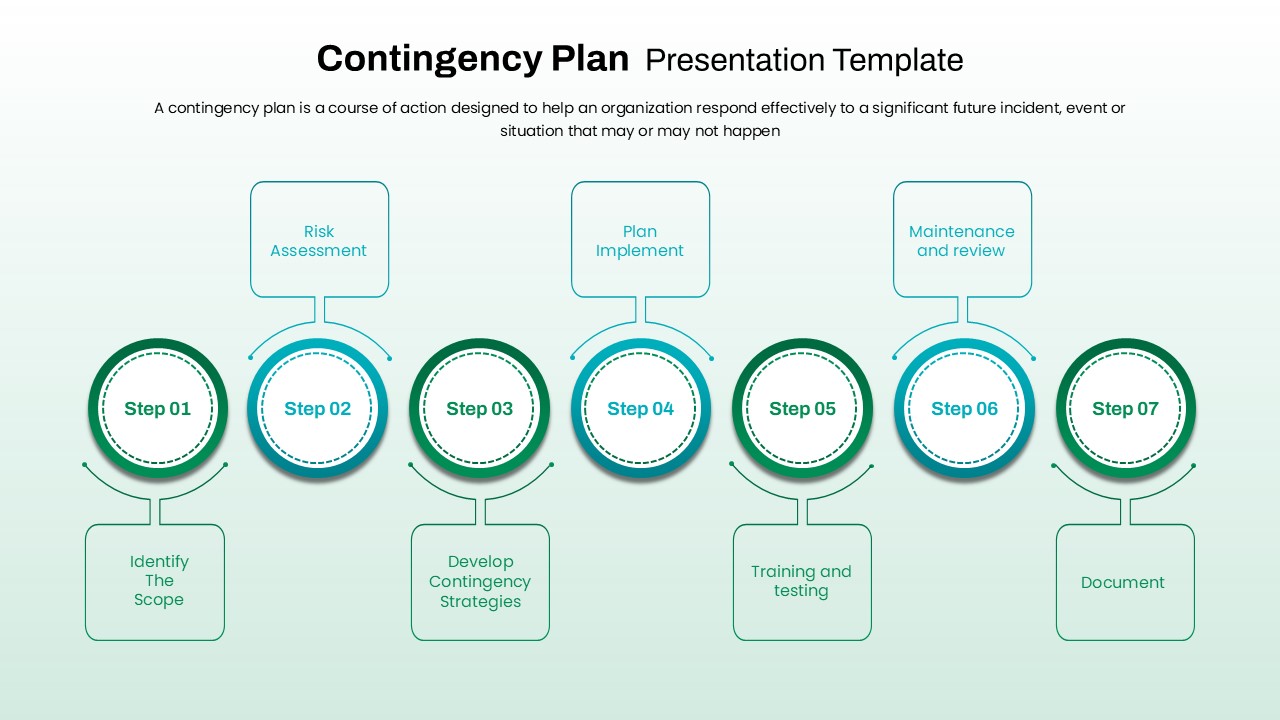
7-Step Contingency Planning Process Template for PowerPoint & Google Slides
Risk Management
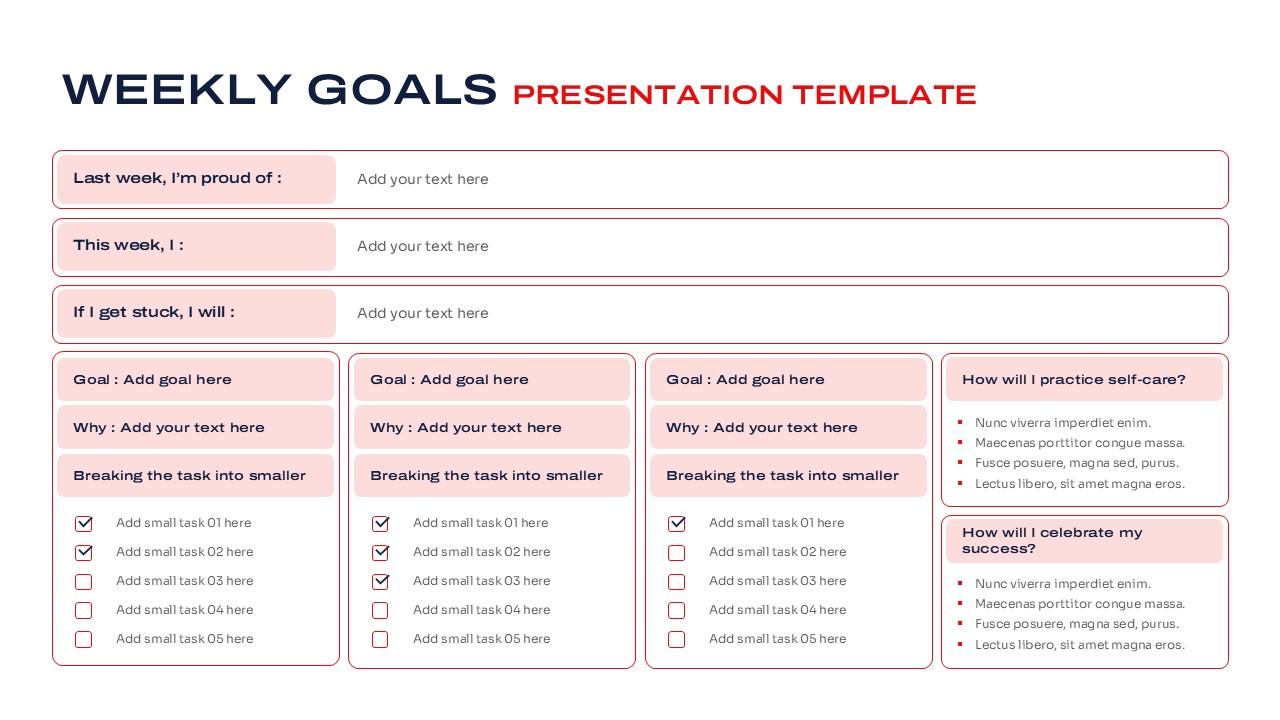
Weekly Goals Planning and Productivity Overview Template for PowerPoint & Google Slides
Goals
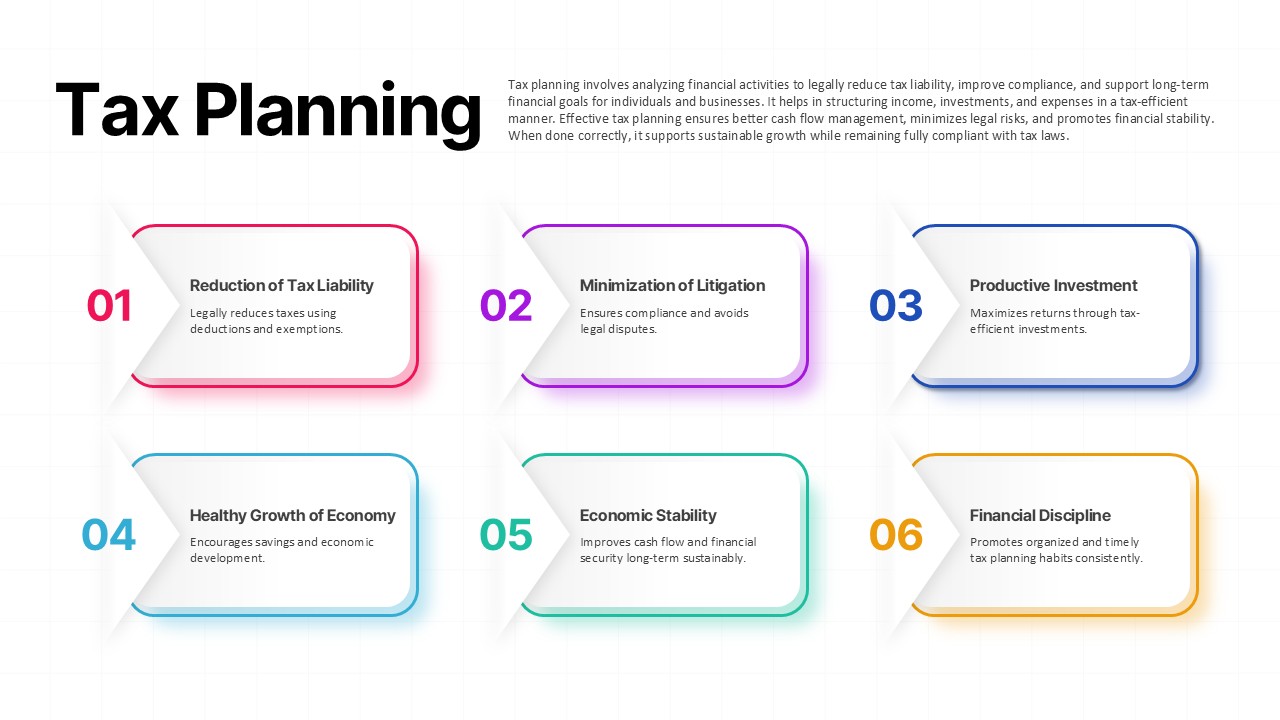
Tax Planning Template for PowerPoint & Google Slides
Finance
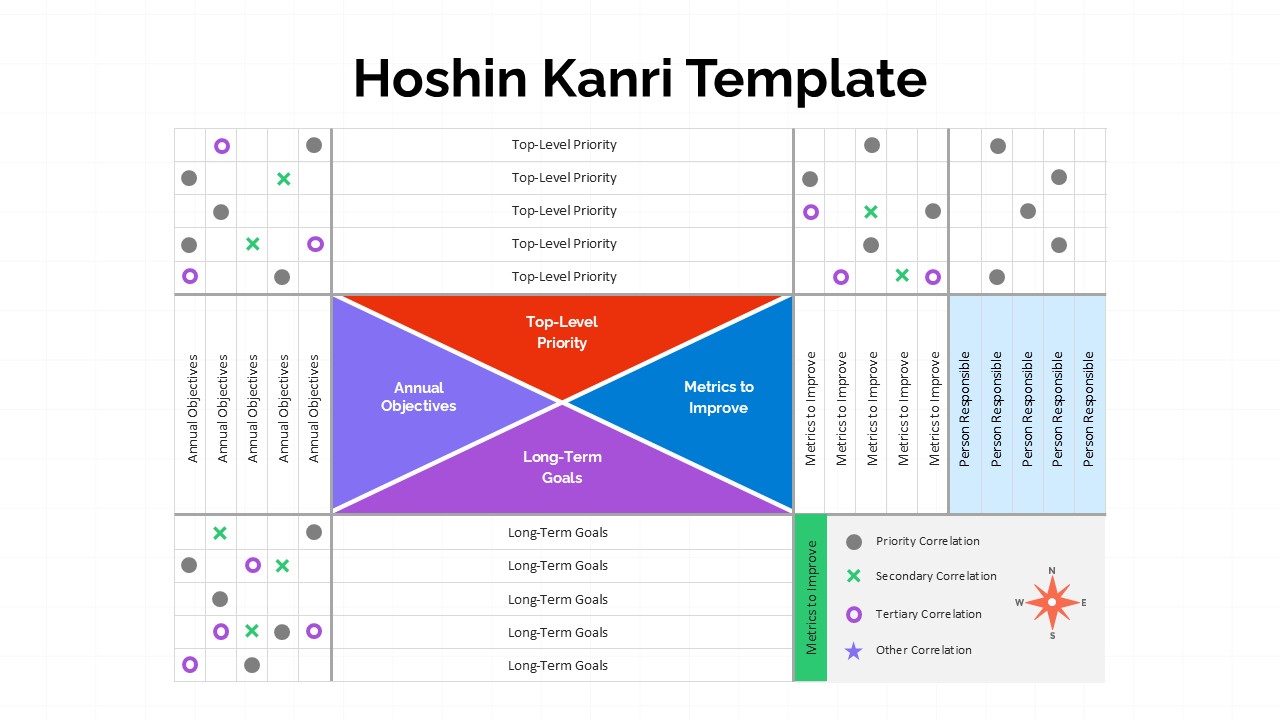
Hoshin Kanri Strategic Planning Matrix Template for PowerPoint & Google Slides
Business Strategy
5 Step Sales Planning Infographics for PowerPoint & Google Slides
Infographics
Gap Analysis Strategic Planning for PowerPoint & Google Slides
Business
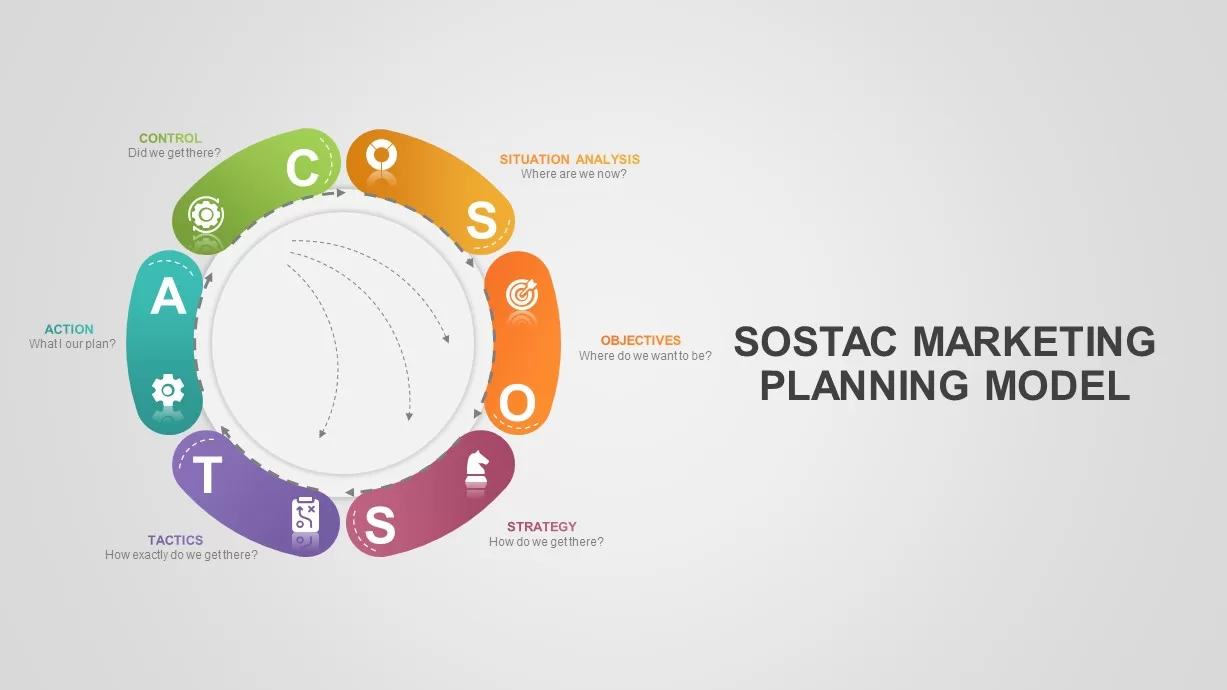
SOSTAC Marketing Planning Model for PowerPoint & Google Slides
Business
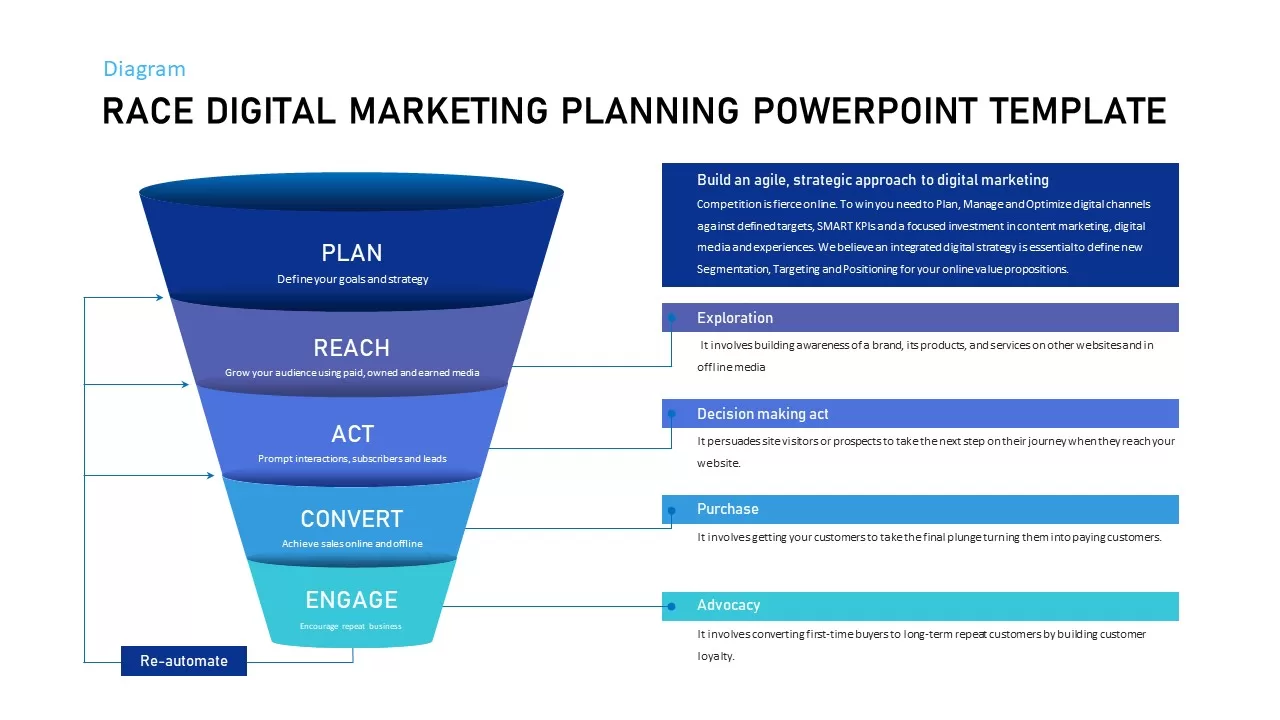
Race Digital Marketing Planning Templates for PowerPoint & Google Slides
Digital Marketing
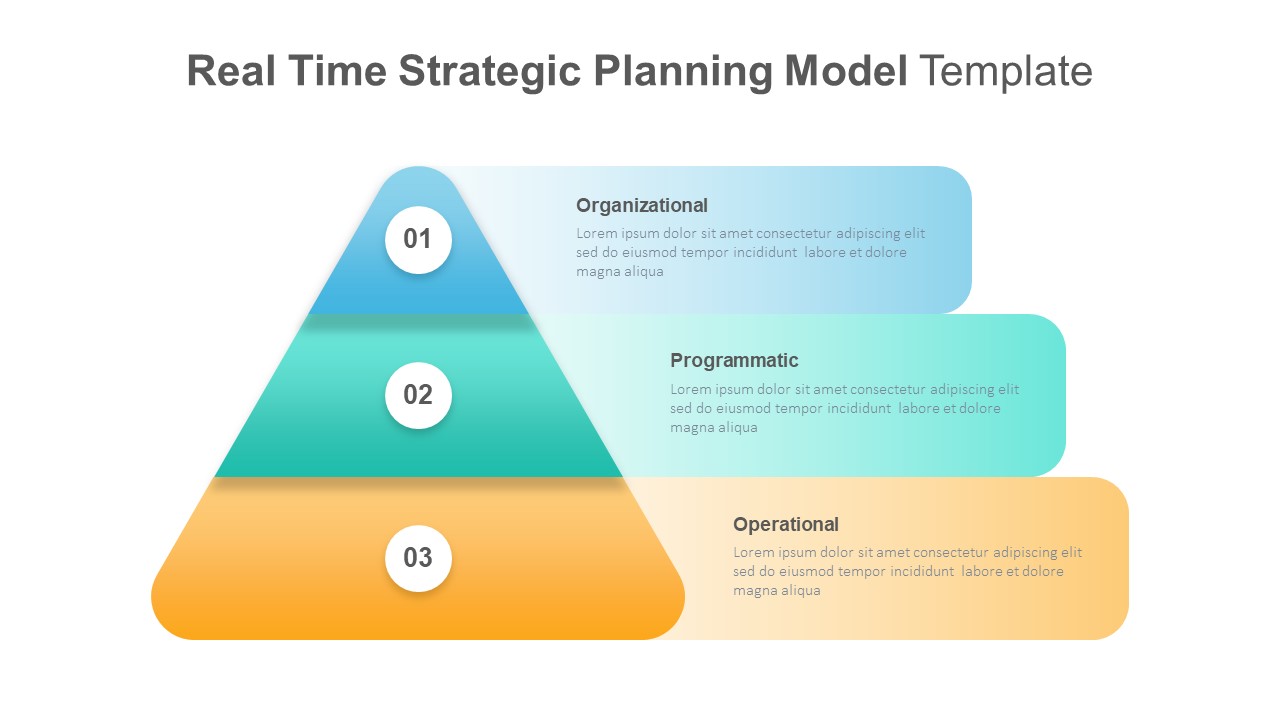
Real-Time Strategic Planning Pyramid Slide for PowerPoint & Google Slides
Business Strategy
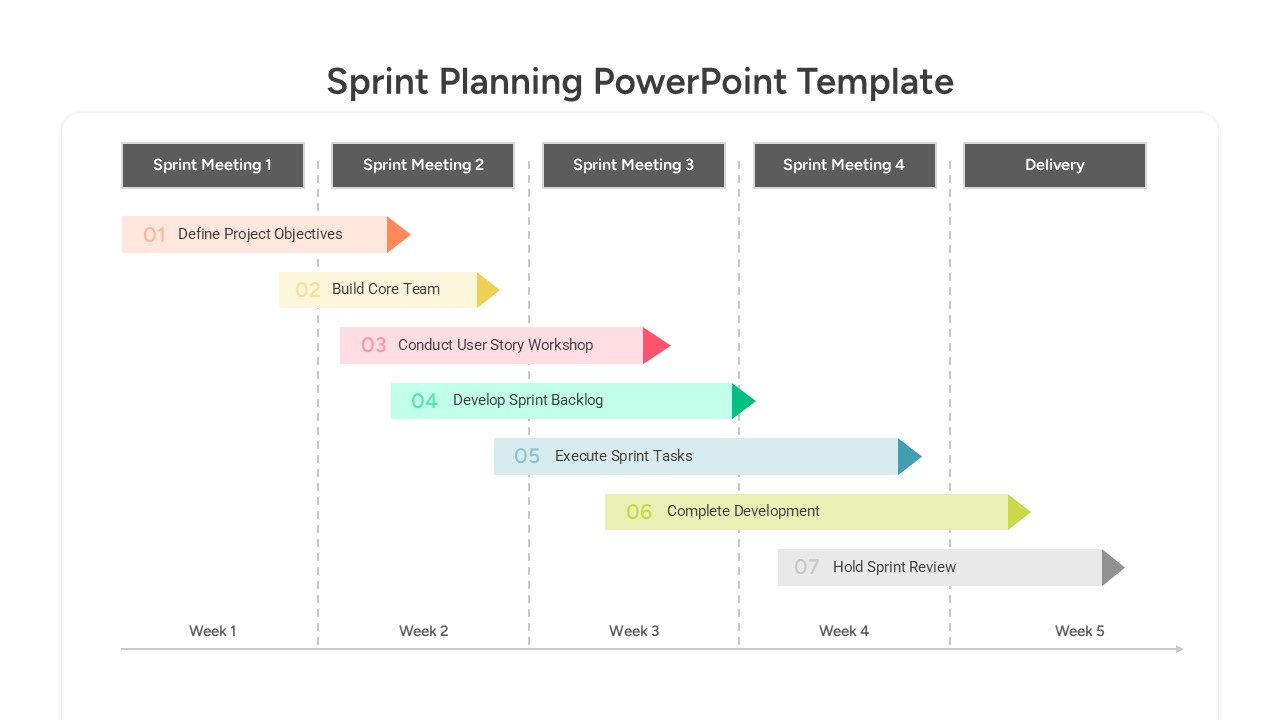
Sprint Planning PowerPoint Template
Timeline
Snake Diagram Pack of 8 Slides template for PowerPoint & Google Slides
Process
Gear Process Diagram PowerPoint Template for PowerPoint & Google Slides
Process
Sales Process Workflow Funnel Diagram PowerPoint Template for PowerPoint & Google Slides
Funnel
Puzzle Diagram PowerPoint Template for PowerPoint & Google Slides
Process
Transportation Logistics PowerPoint Diagram template for PowerPoint & Google Slides
Process
Emoji Scale PowerPoint Diagram for PowerPoint & Google Slides
Infographics
4 Step Problem Solving PowerPoint Diagram for PowerPoint & Google Slides
Process
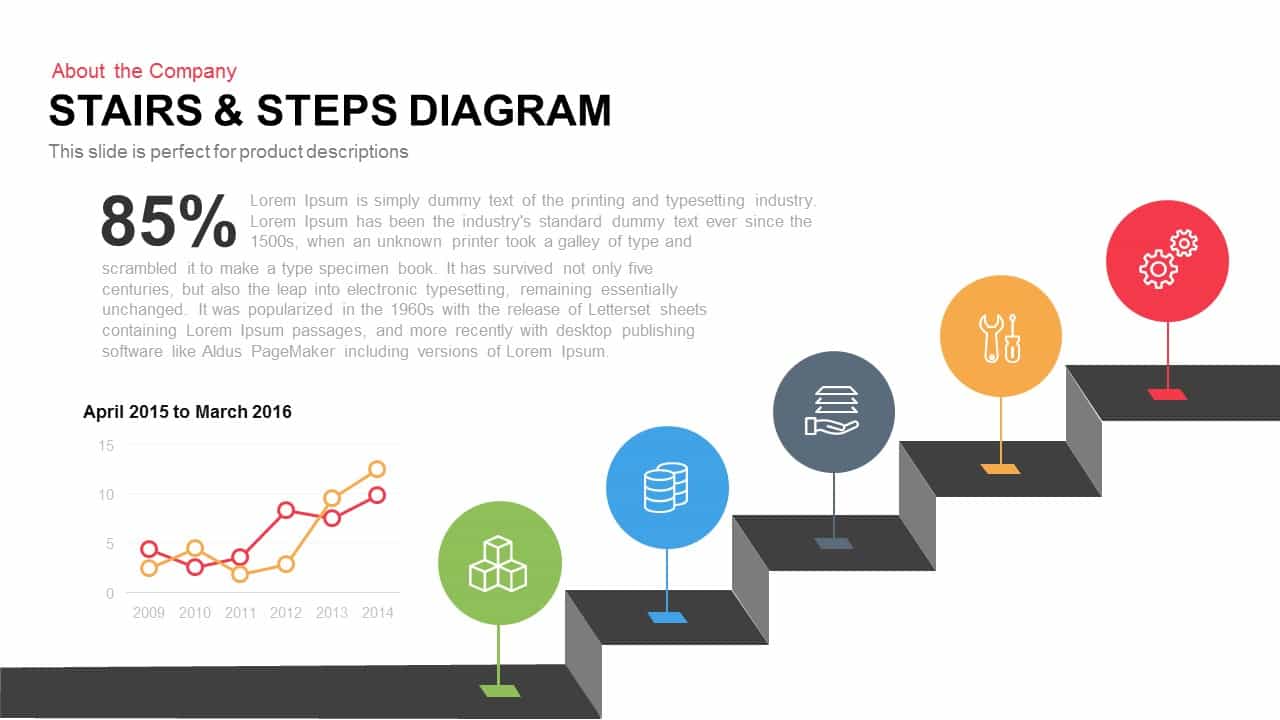
Stairs & Steps Process Diagram template for PowerPoint & Google Slides
Process
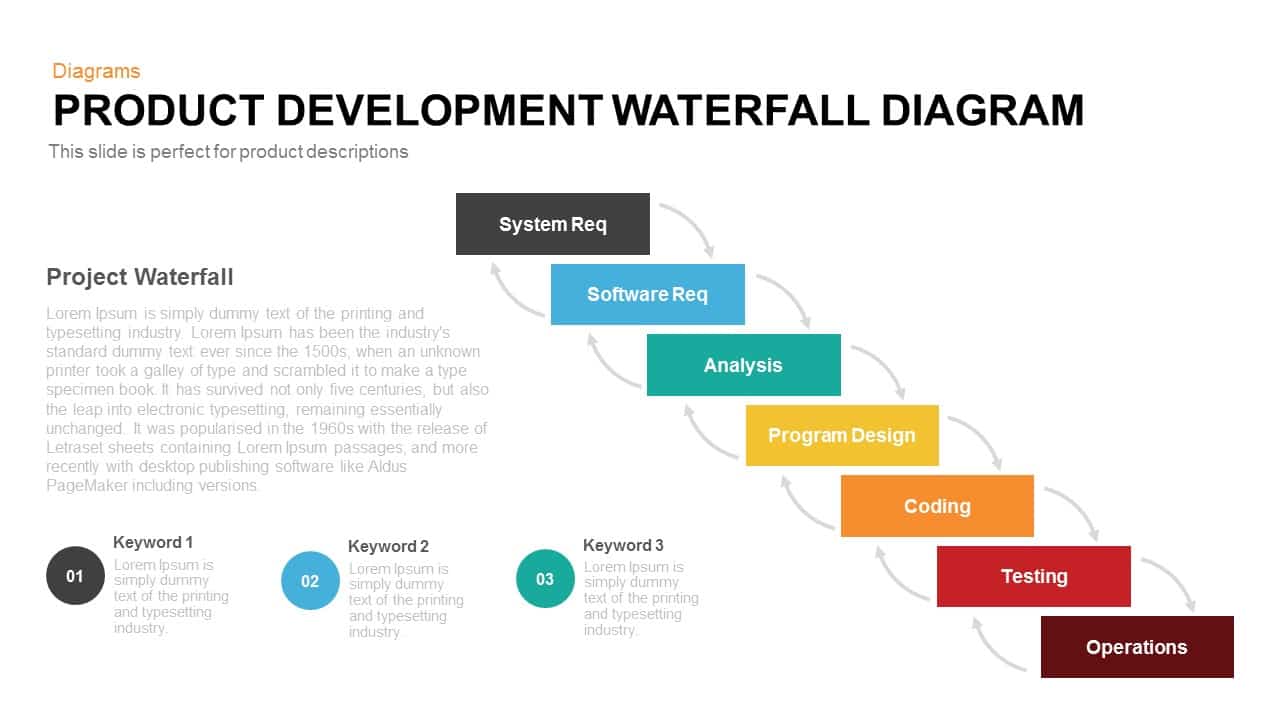
Product Development Waterfall Diagram Template for PowerPoint & Google Slides
Process
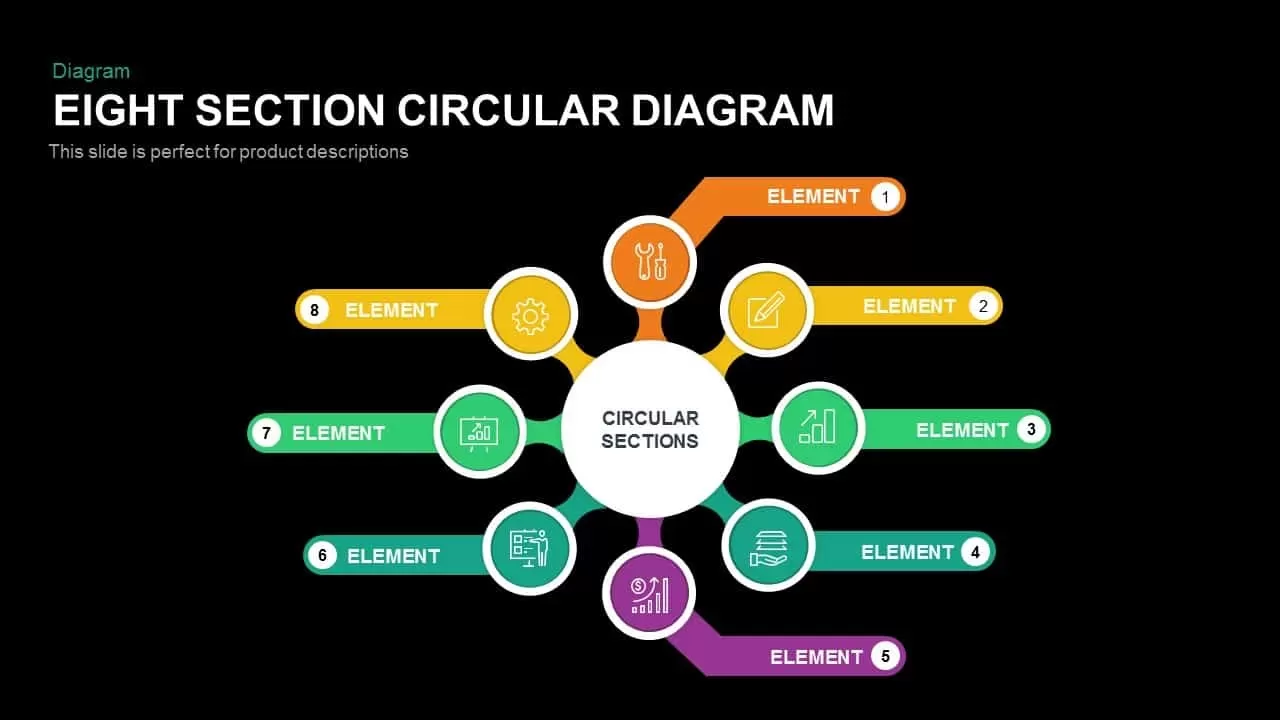
Eight Section Circular Diagram Template for PowerPoint & Google Slides
Circular
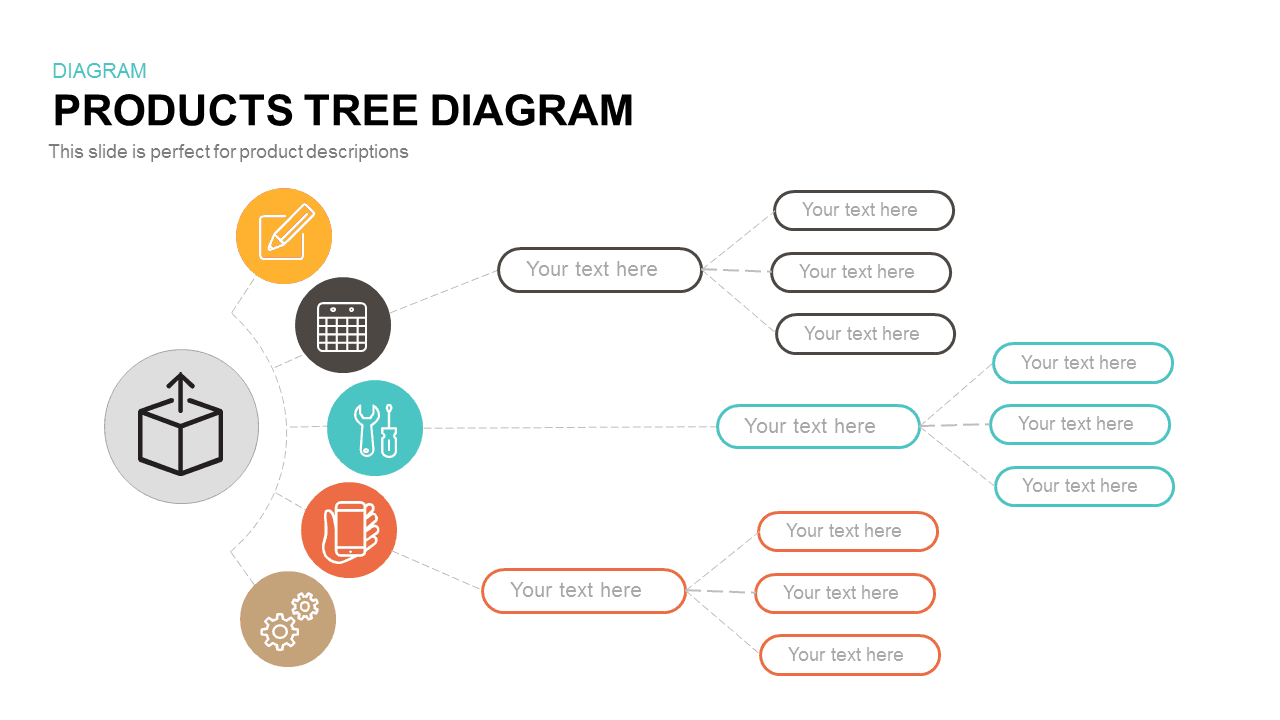
Interactive Products Tree Diagram template for PowerPoint & Google Slides
Org Chart
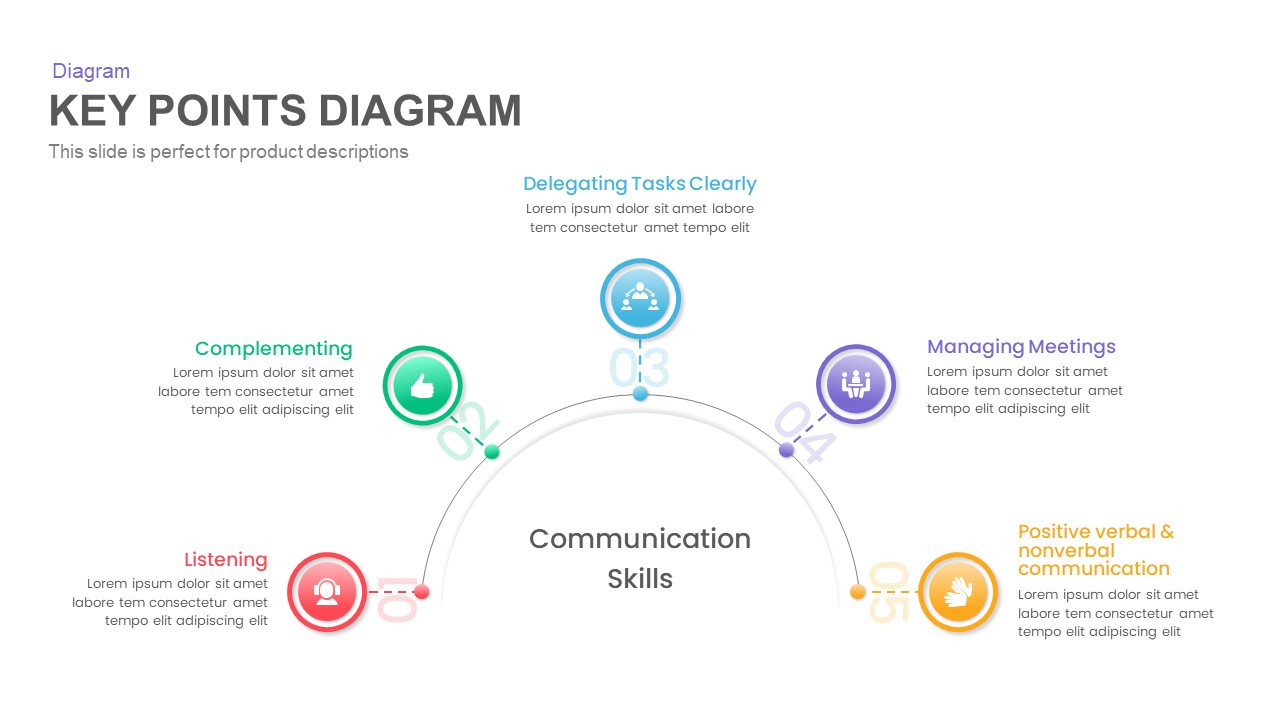
Dynamic Key Points Diagram Template for PowerPoint & Google Slides
Process
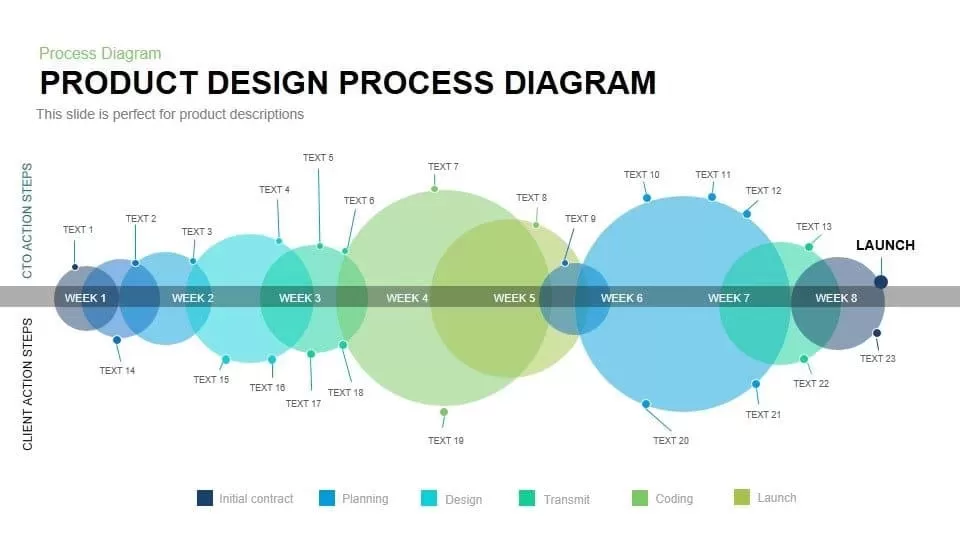
Product Design Process Diagram Template for PowerPoint & Google Slides
Timeline
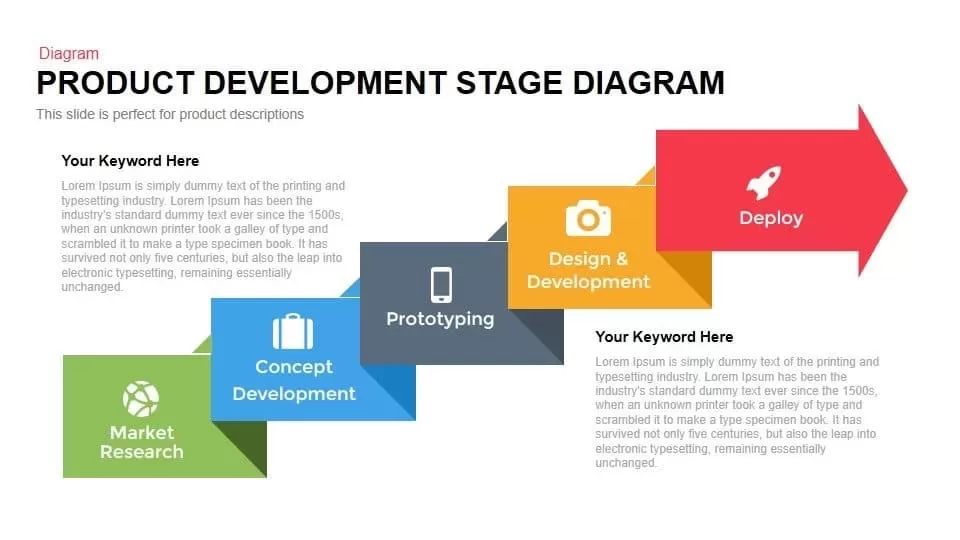
Product Development Stage Diagram Template for PowerPoint & Google Slides
Process
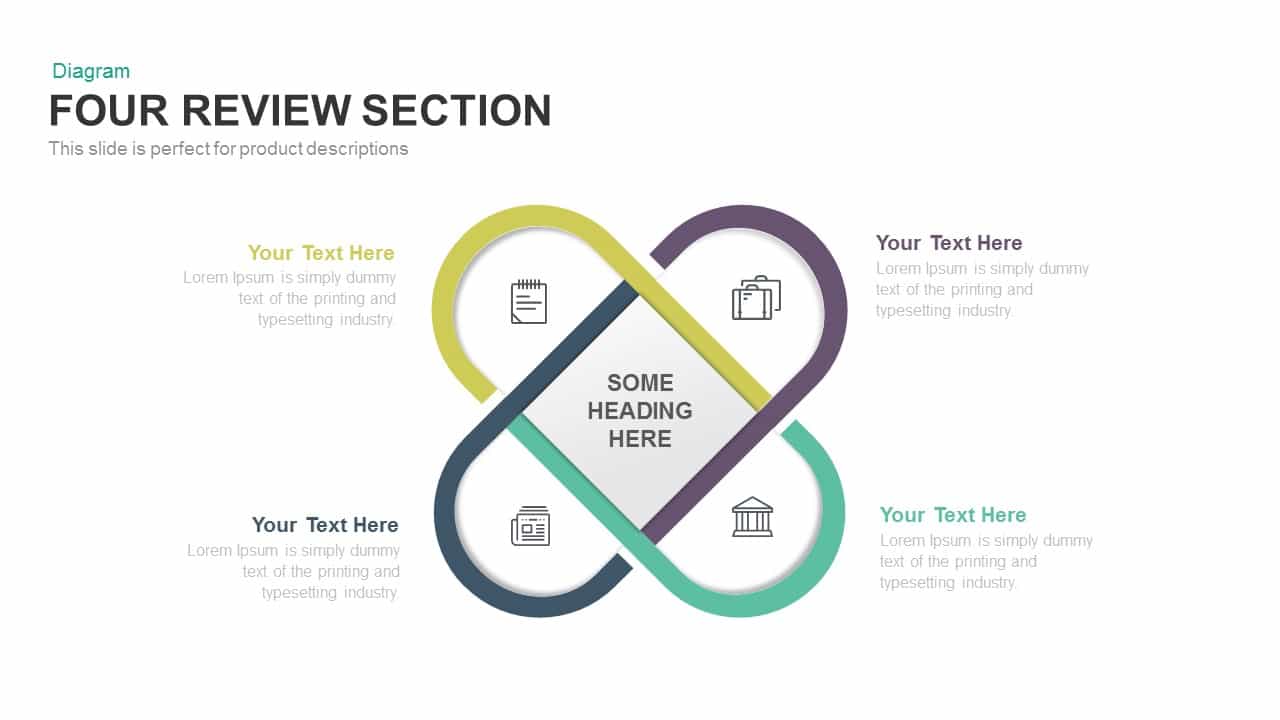
Clean Four-Section Review Diagram Template for PowerPoint & Google Slides
Agenda
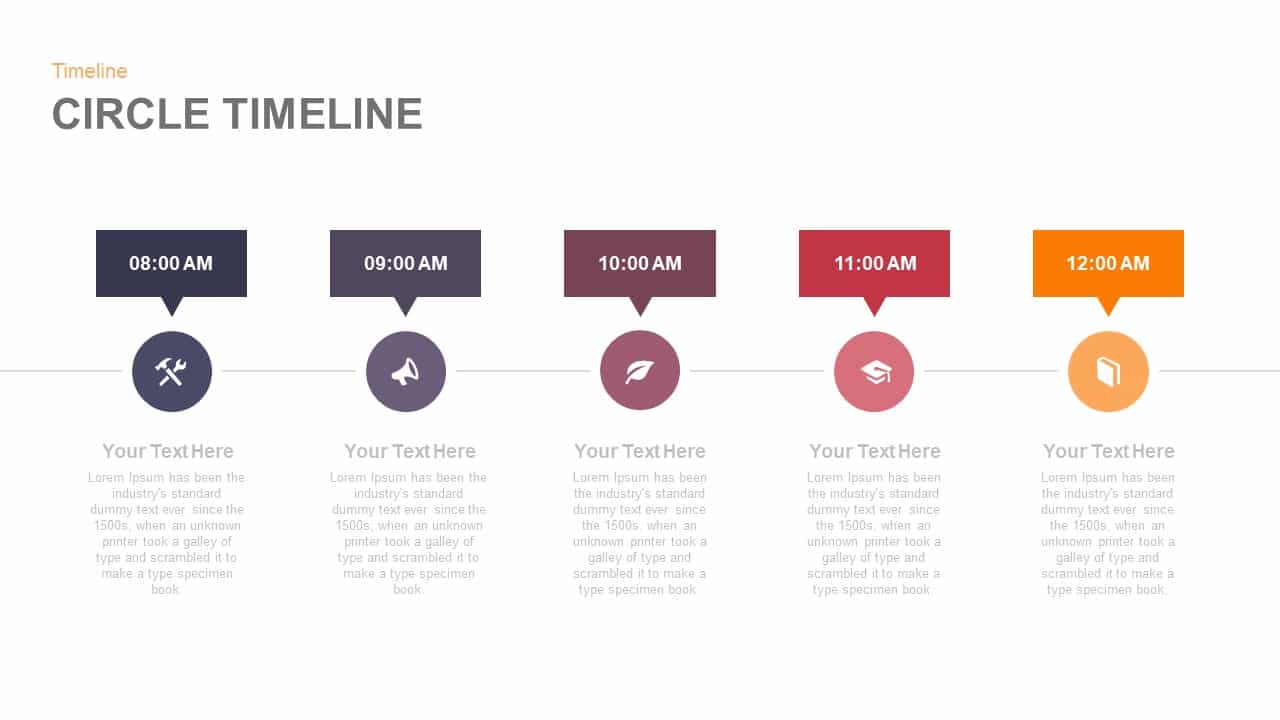
Five-Point Circle Timeline Diagram Template for PowerPoint & Google Slides
Timeline
12-Stage Zig Zag Process Diagram Template for PowerPoint & Google Slides
Process
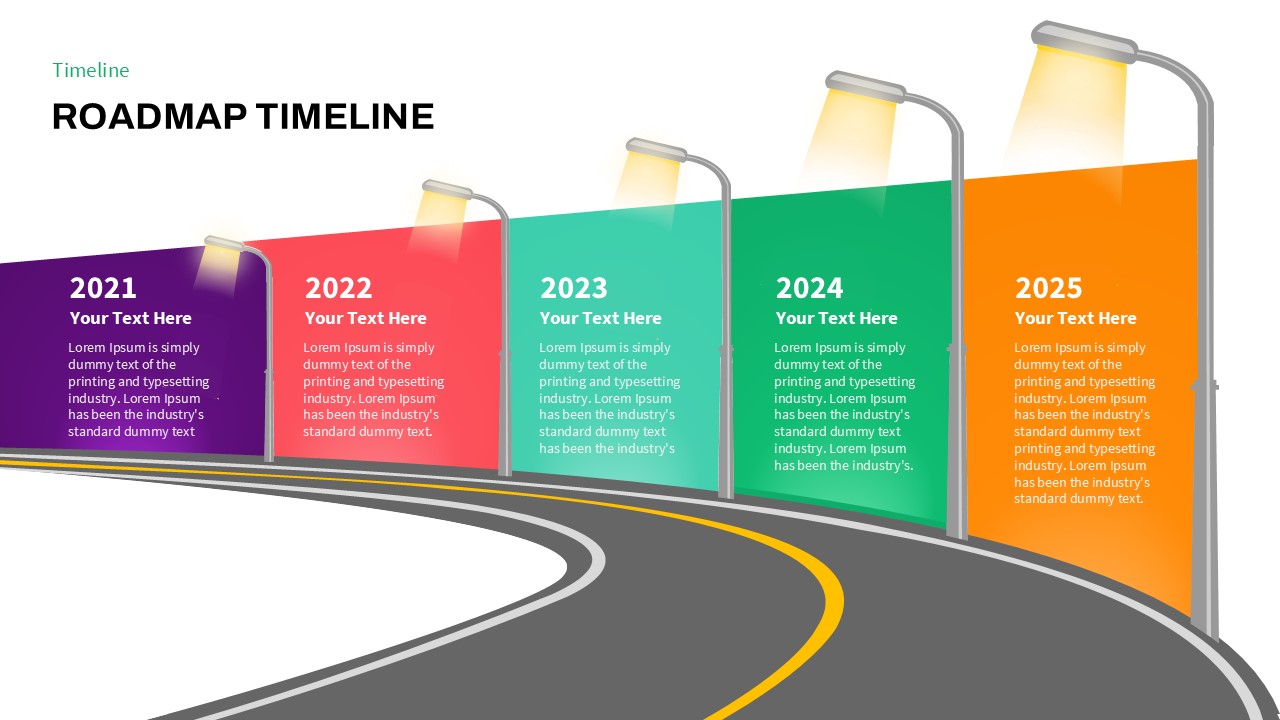
Curved Road Roadmap Timeline Diagram Template for PowerPoint & Google Slides
Roadmap
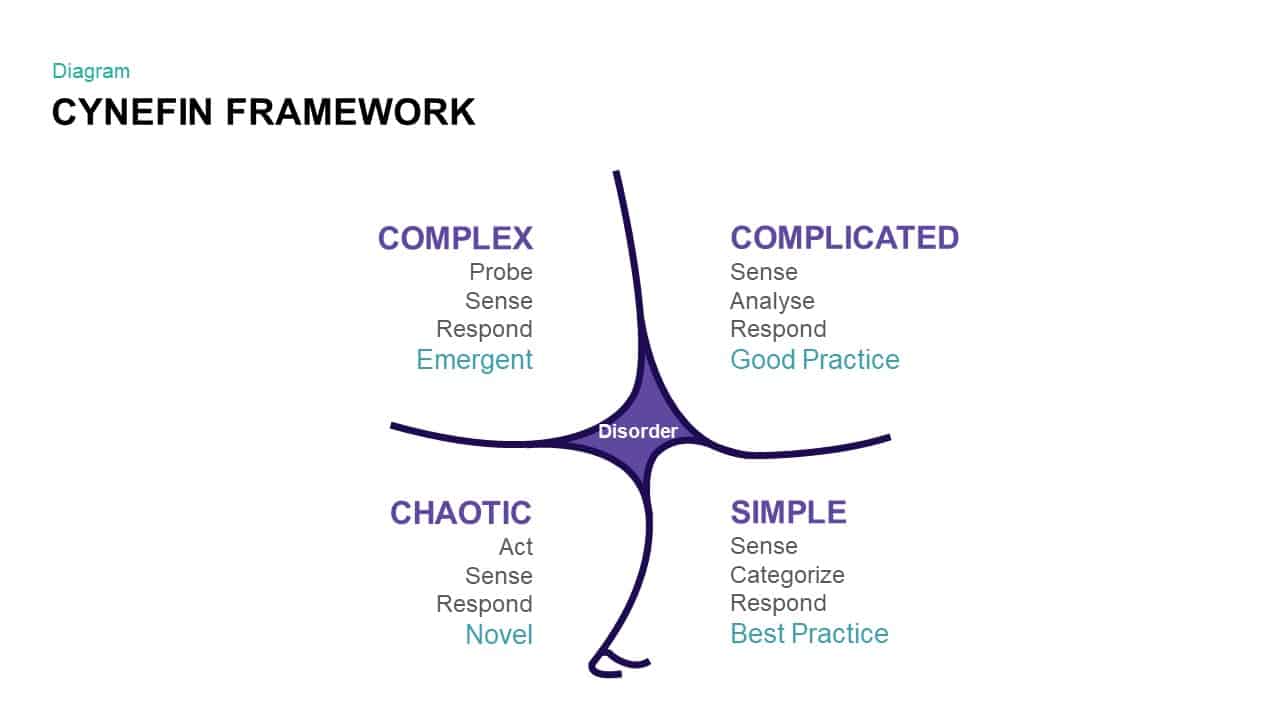
Comprehensive Cynefin Framework Diagram Template for PowerPoint & Google Slides
Opportunities Challenges
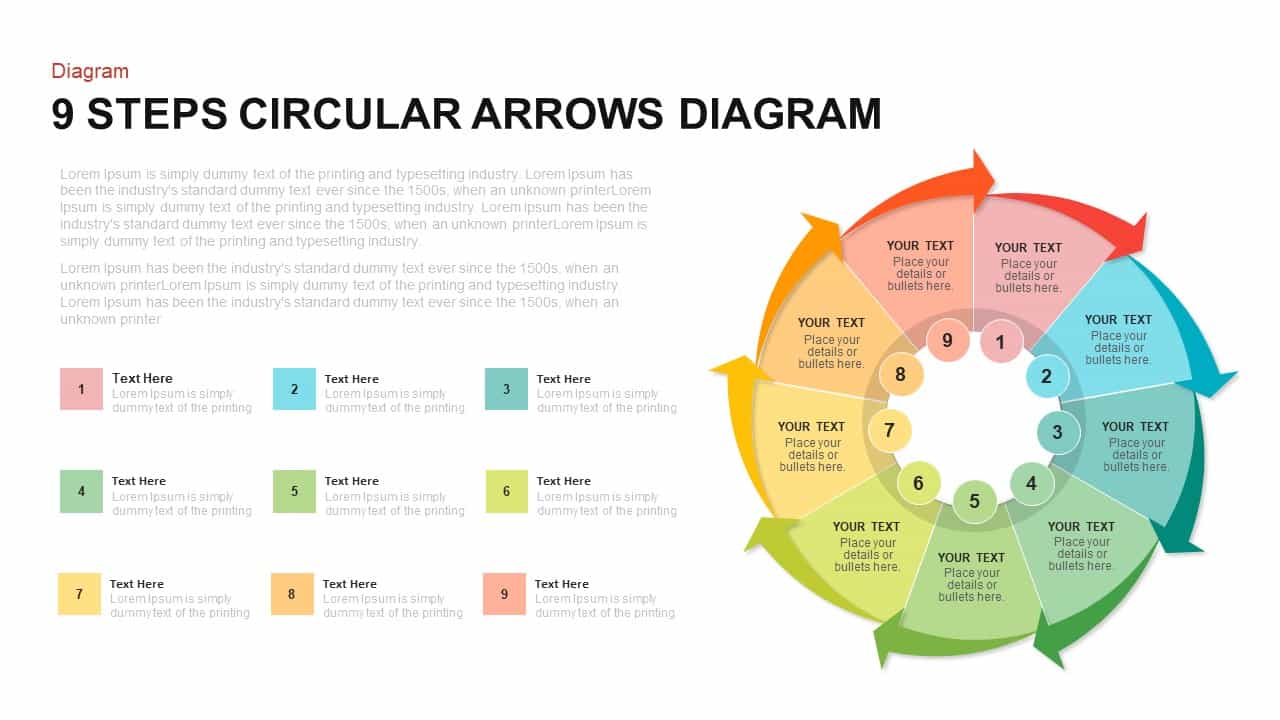
9-Step Circular Arrows Process Diagram Template for PowerPoint & Google Slides
Process
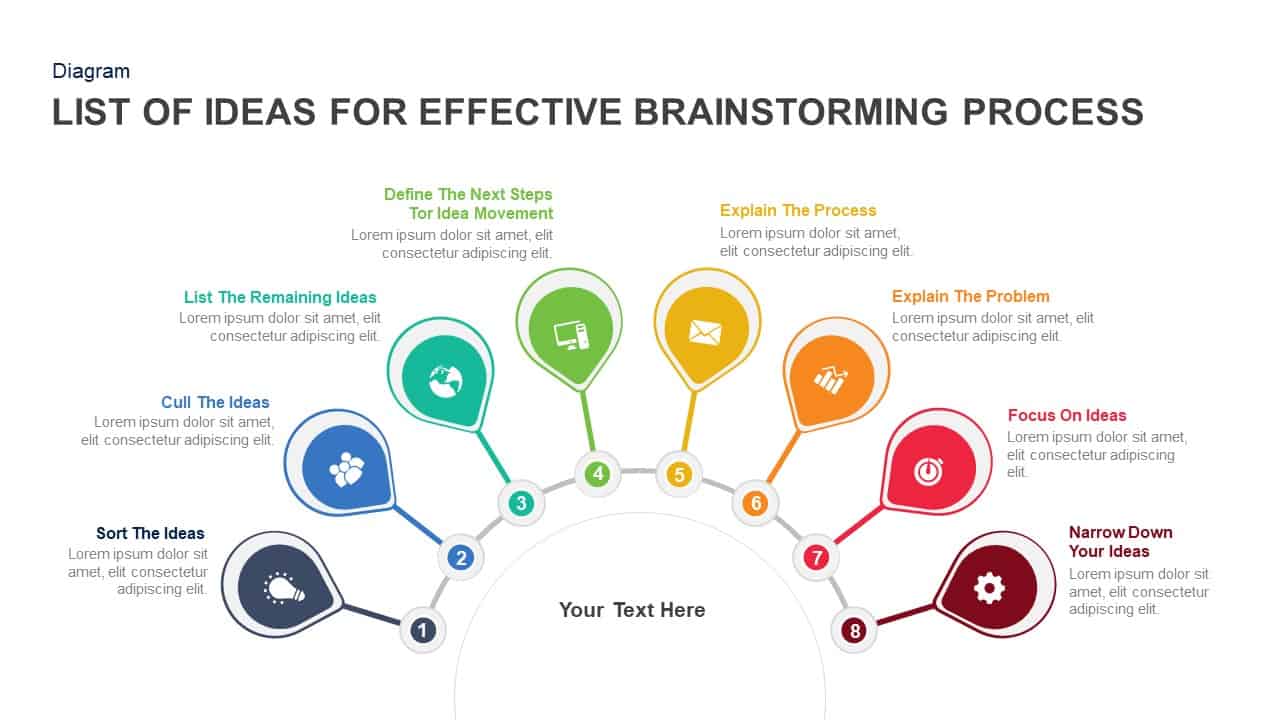
Eight-Step Brainstorming Process Diagram Template for PowerPoint & Google Slides
Process
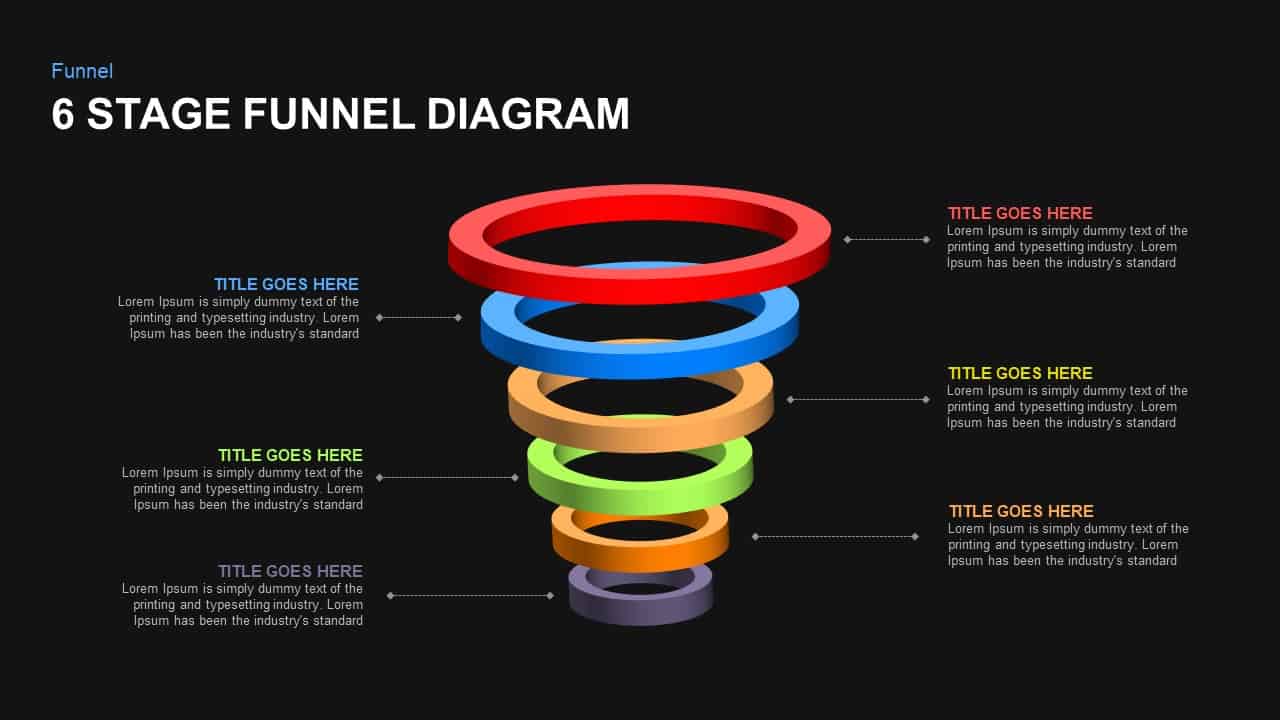
6-Stage Funnel Diagram Infographic Template for PowerPoint & Google Slides
Funnel
Four-Stage Gear Process Diagram Template for PowerPoint & Google Slides
Process
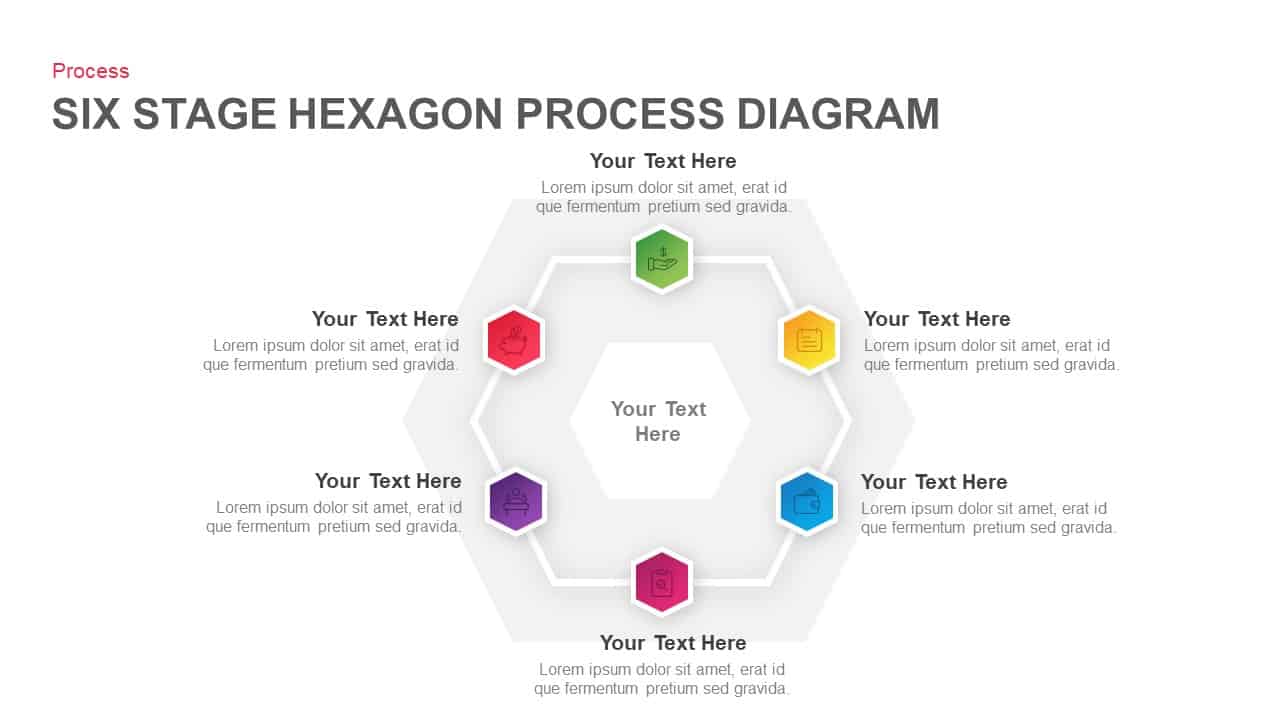
Six Stage Hexagon Process Diagram Template for PowerPoint & Google Slides
Process
Four-Stage Linear Process Flow Diagram Template for PowerPoint & Google Slides
Process
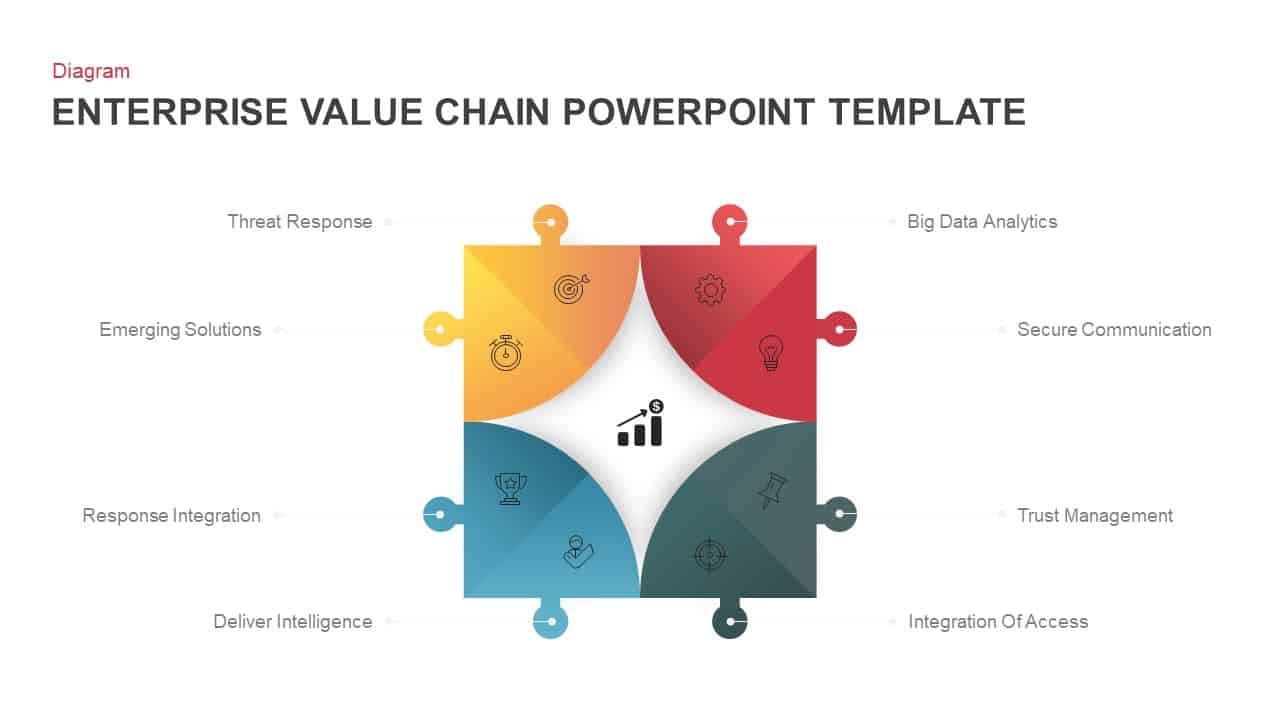
Enterprise Value Chain Puzzle Diagram Template for PowerPoint & Google Slides
Business Models
Creative Three-Circle Venn Diagram Template for PowerPoint & Google Slides
Comparison
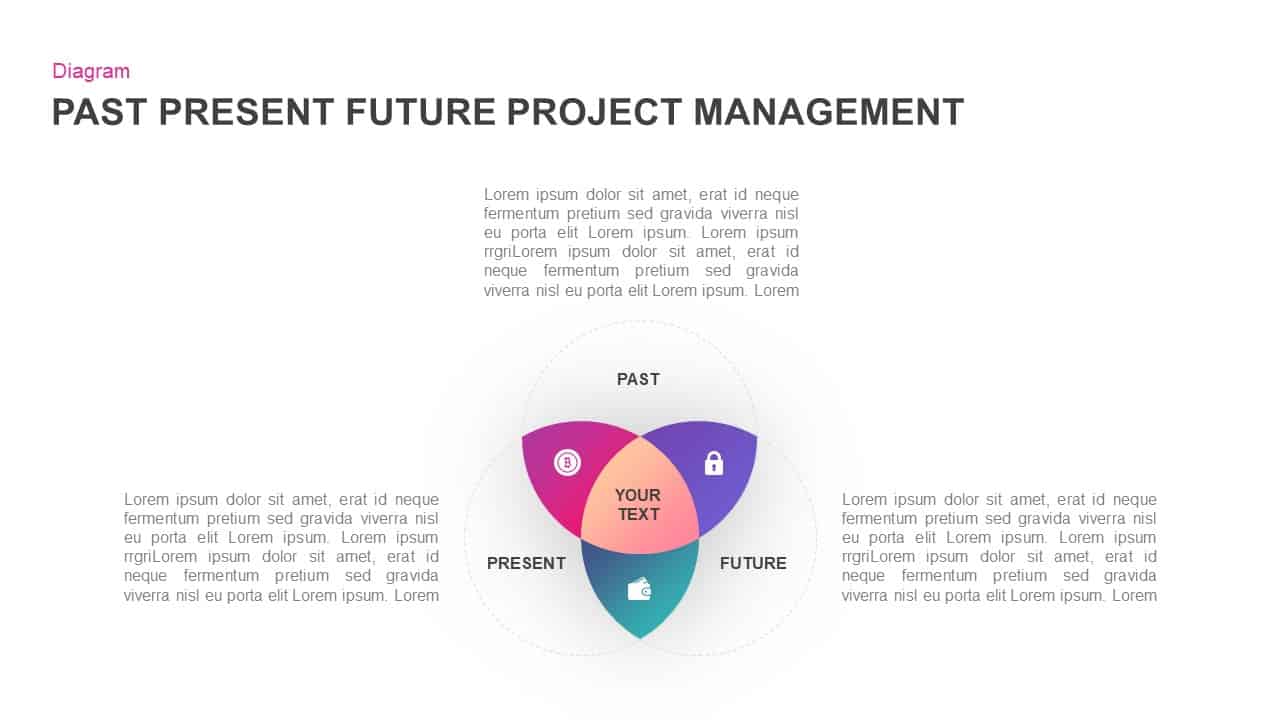
Past, Present & Future Venn Diagram Template for PowerPoint & Google Slides
Comparison
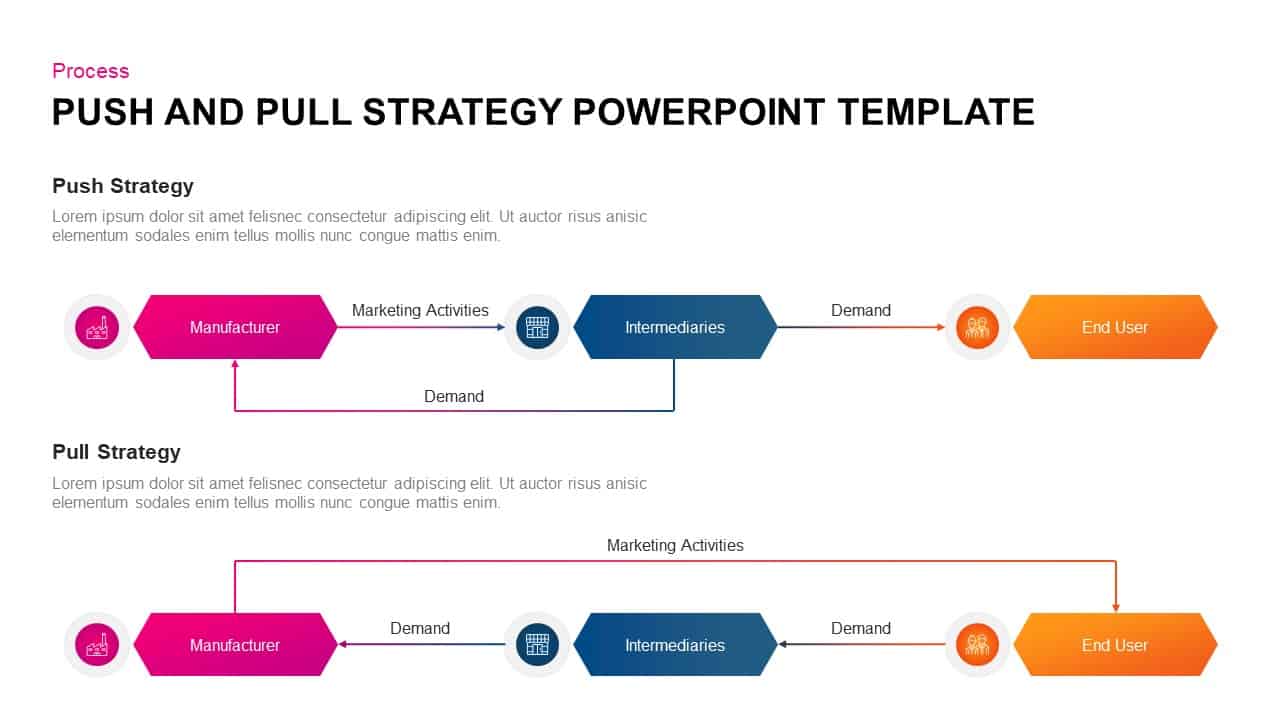
Push and Pull Marketing Strategy Diagram Template for PowerPoint & Google Slides
Business Strategy
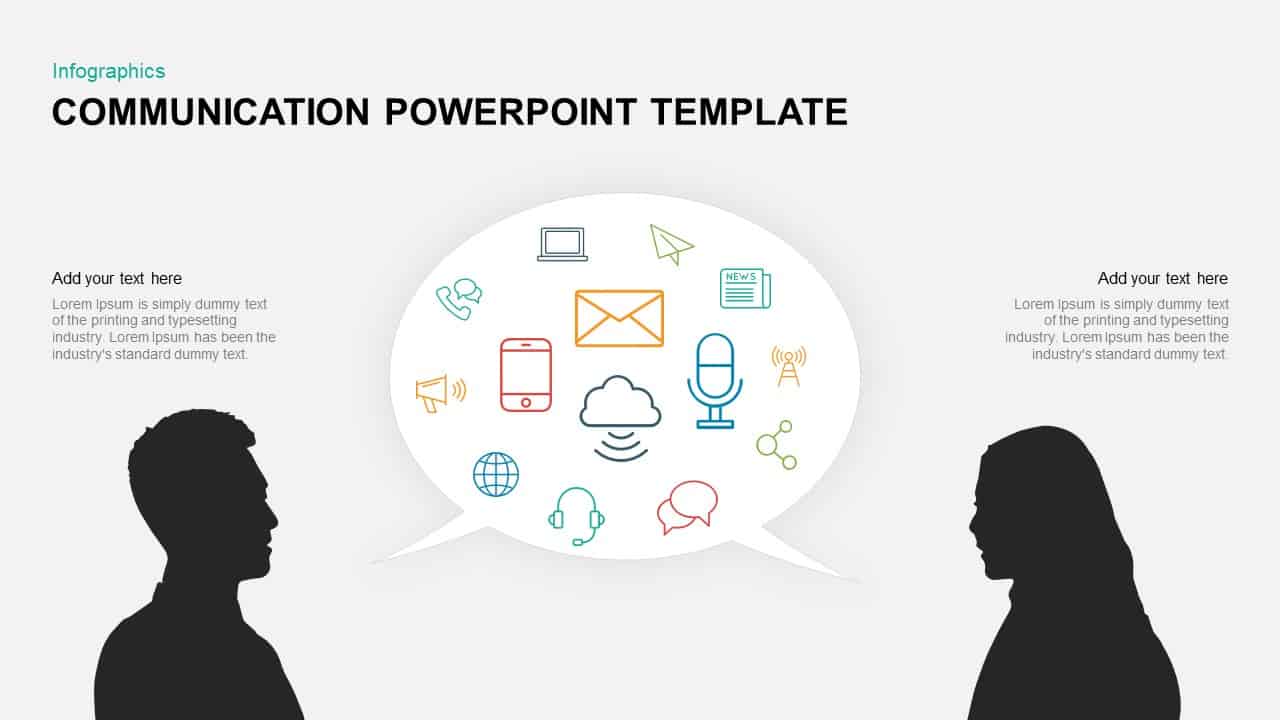
Communication Channels Diagram Template for PowerPoint & Google Slides
Customer Experience
Colorful Venn Diagram Infographics Template for PowerPoint & Google Slides
Circular
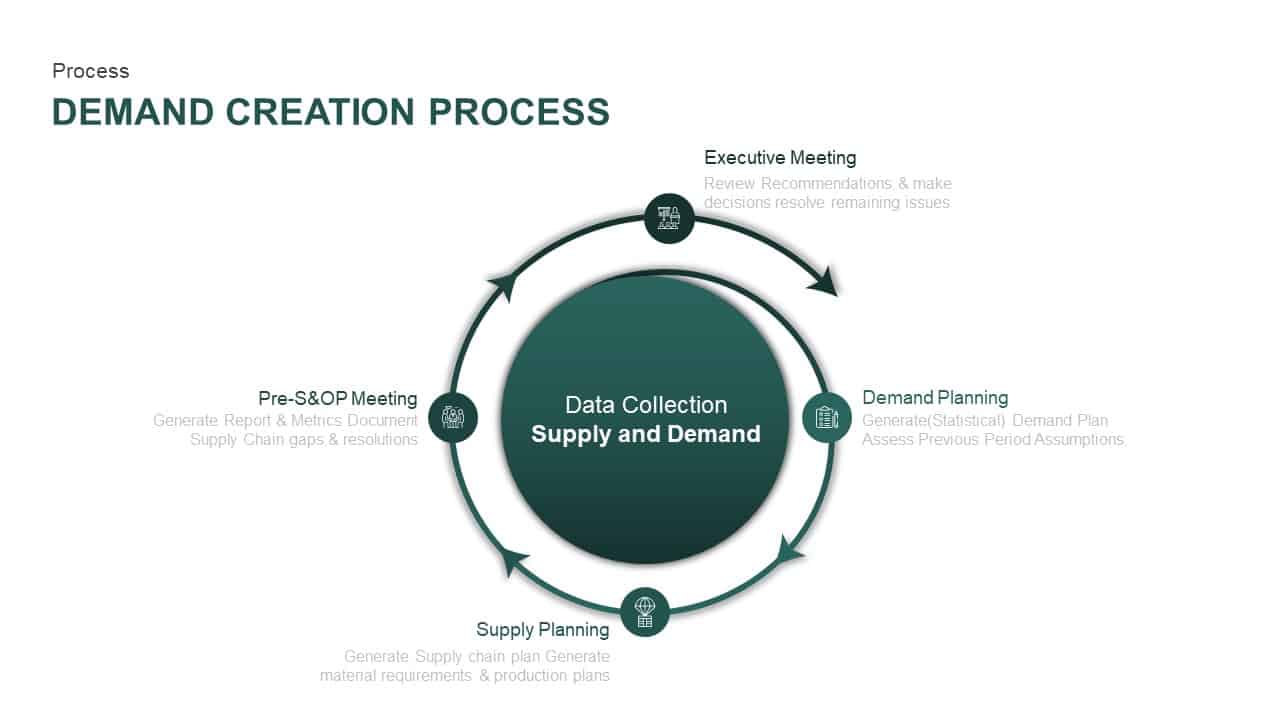
Supply and Demand Creation Cycle Diagram Template for PowerPoint & Google Slides
Process
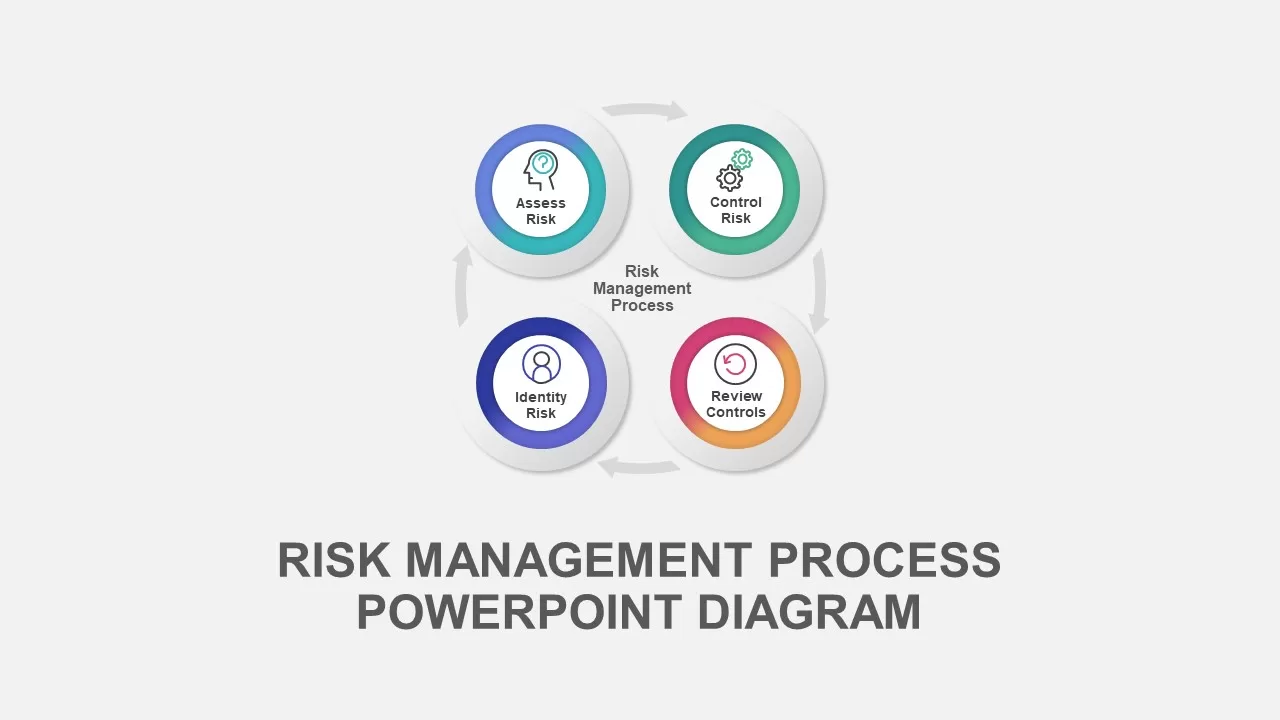
Risk Management Process Diagram Template for PowerPoint & Google Slides
Risk Management
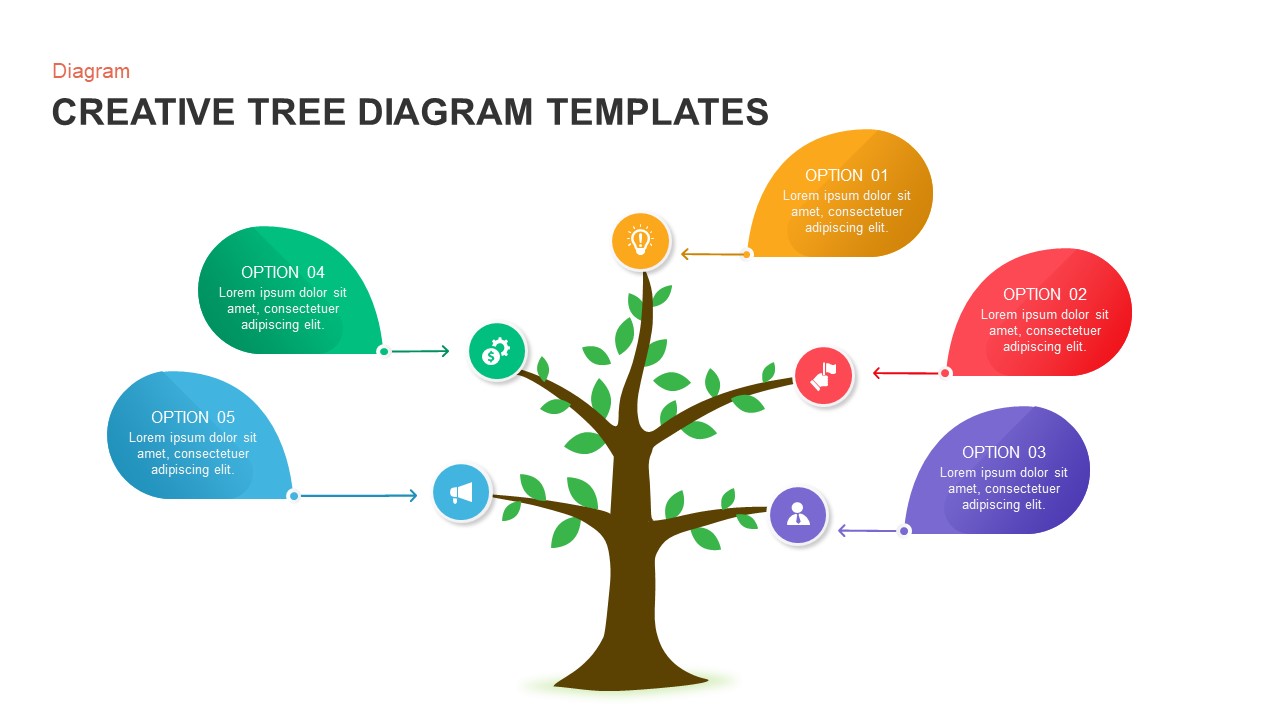
Creative Tree Diagram Infographic Template for PowerPoint & Google Slides
Decision Tree
Structured Mind Map Infographic Diagram Template for PowerPoint & Google Slides
Mind Maps
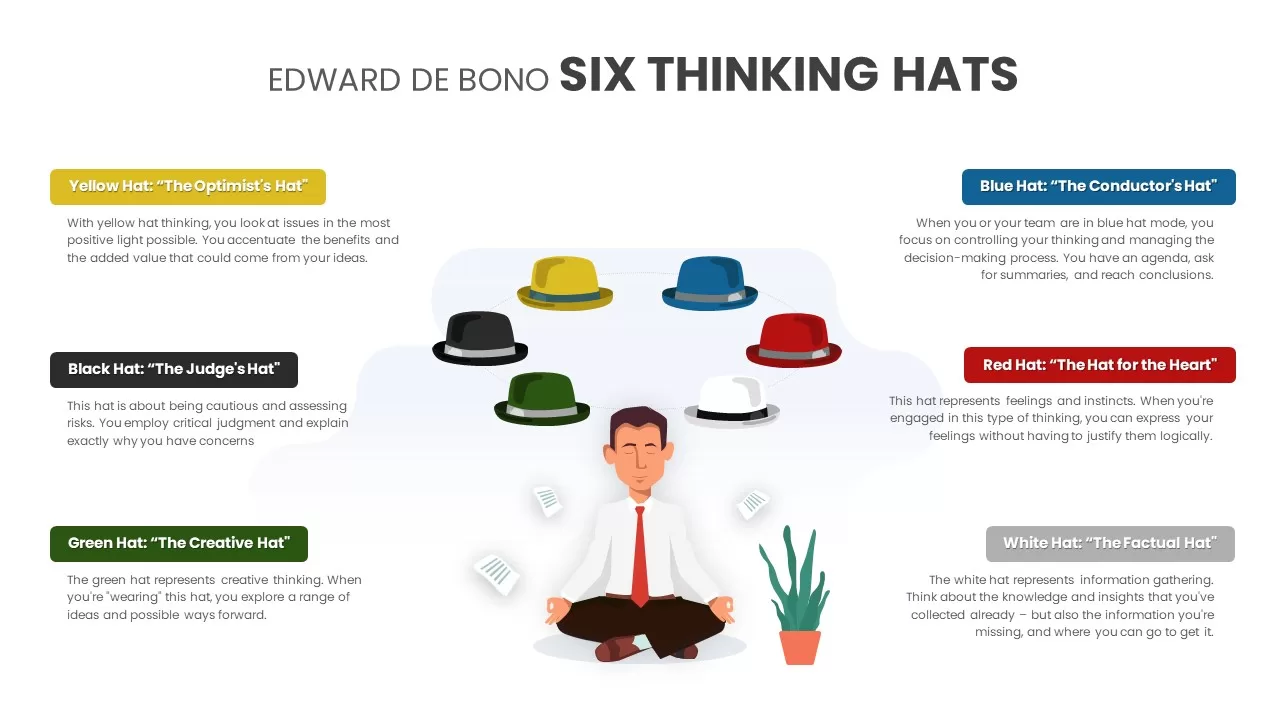
Six Thinking Hats Diagram Presentation Template for PowerPoint & Google Slides
Infographics
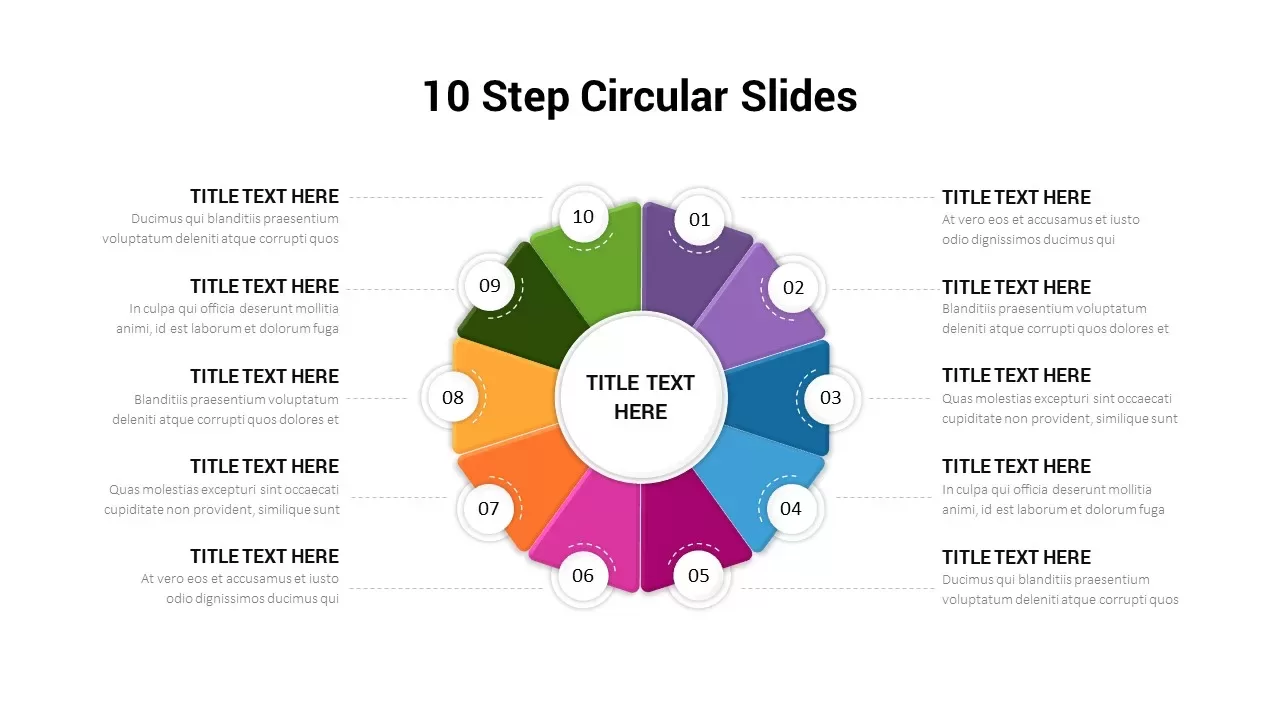
10-Step Circular Process Diagram Template for PowerPoint & Google Slides
Process
Business Strategy House Model Diagram Template for PowerPoint & Google Slides
Business Strategy
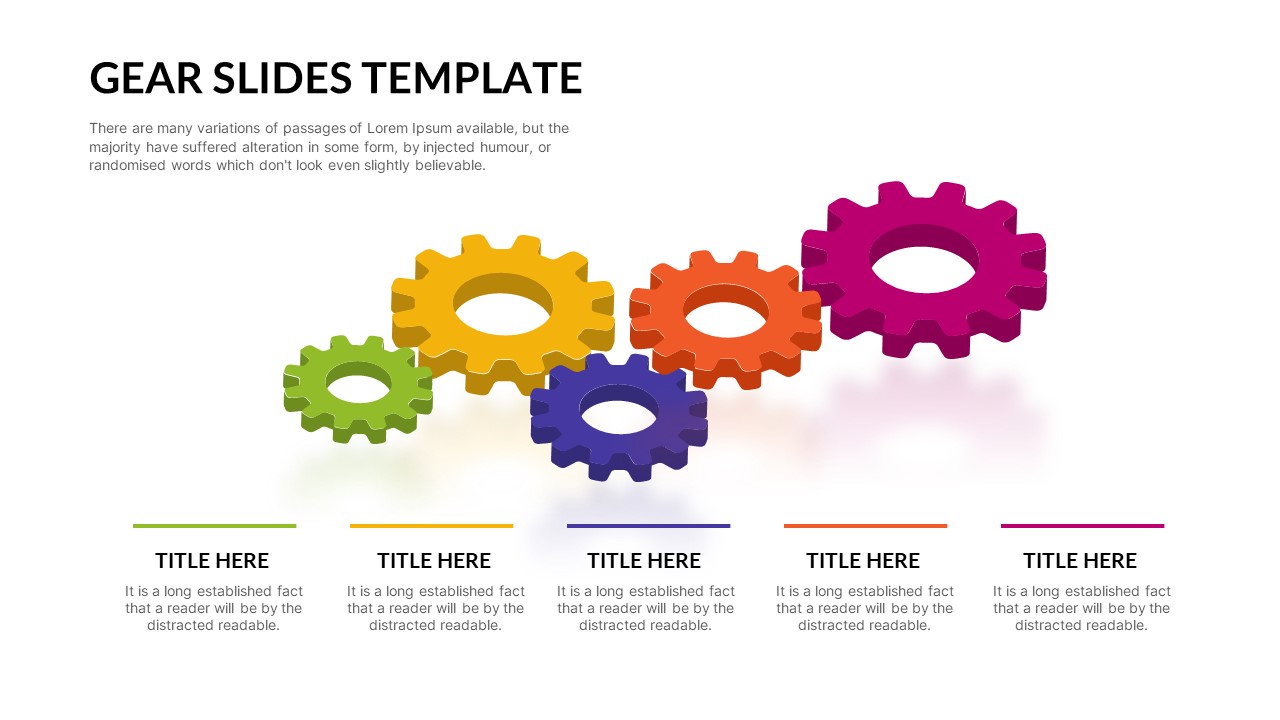
Five-Step Interlocking Gears Diagram Template for PowerPoint & Google Slides
Process
Free Animated DNA Infographic Diagram Template for PowerPoint & Google Slides
Infographics
Free
Free Vision and Mission Target Diagram Template for PowerPoint & Google Slides
Vision and Mission
Free
Free Business Model Canvas Diagram Slide Template for PowerPoint & Google Slides
Business Models
Free
Capital Investments Process Flow Diagram Template for PowerPoint & Google Slides
Process
Salience Model Venn Diagram Infographic Template for PowerPoint & Google Slides
Circular
Sources of Power Circular Diagram Template for PowerPoint & Google Slides
Circular
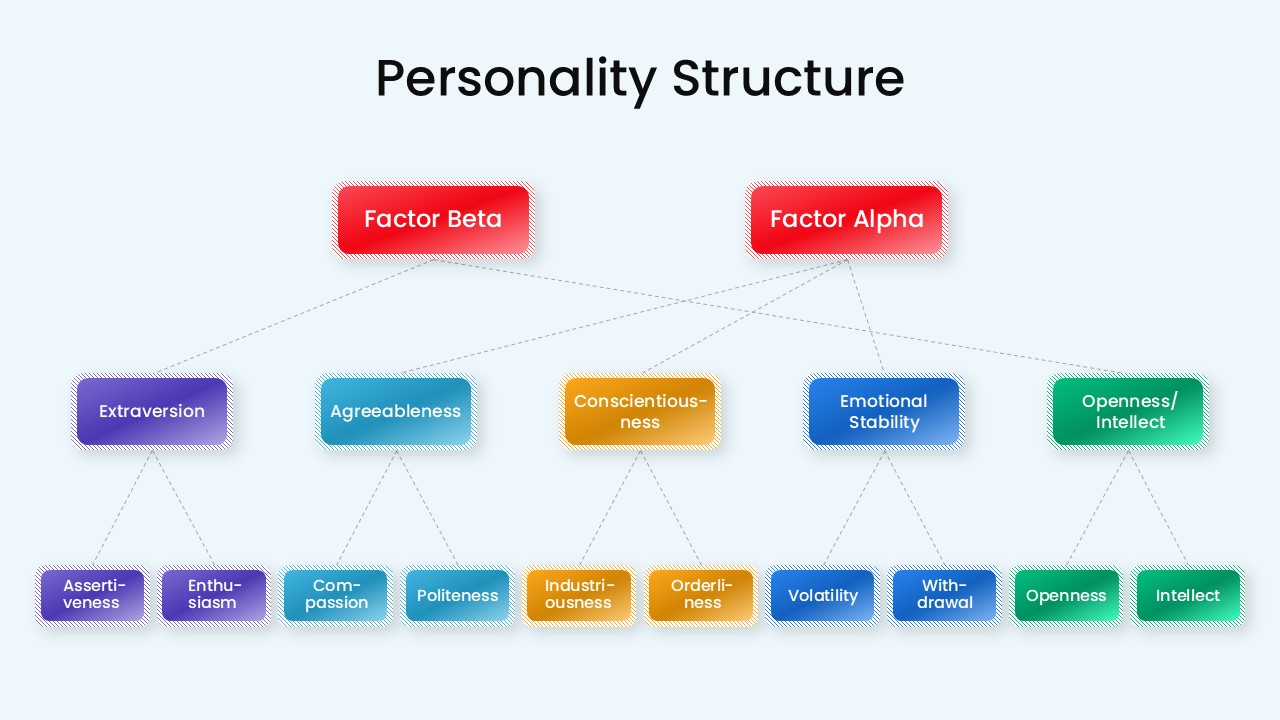
Personality Structure Hierarchy Diagram Template for PowerPoint & Google Slides
Org Chart
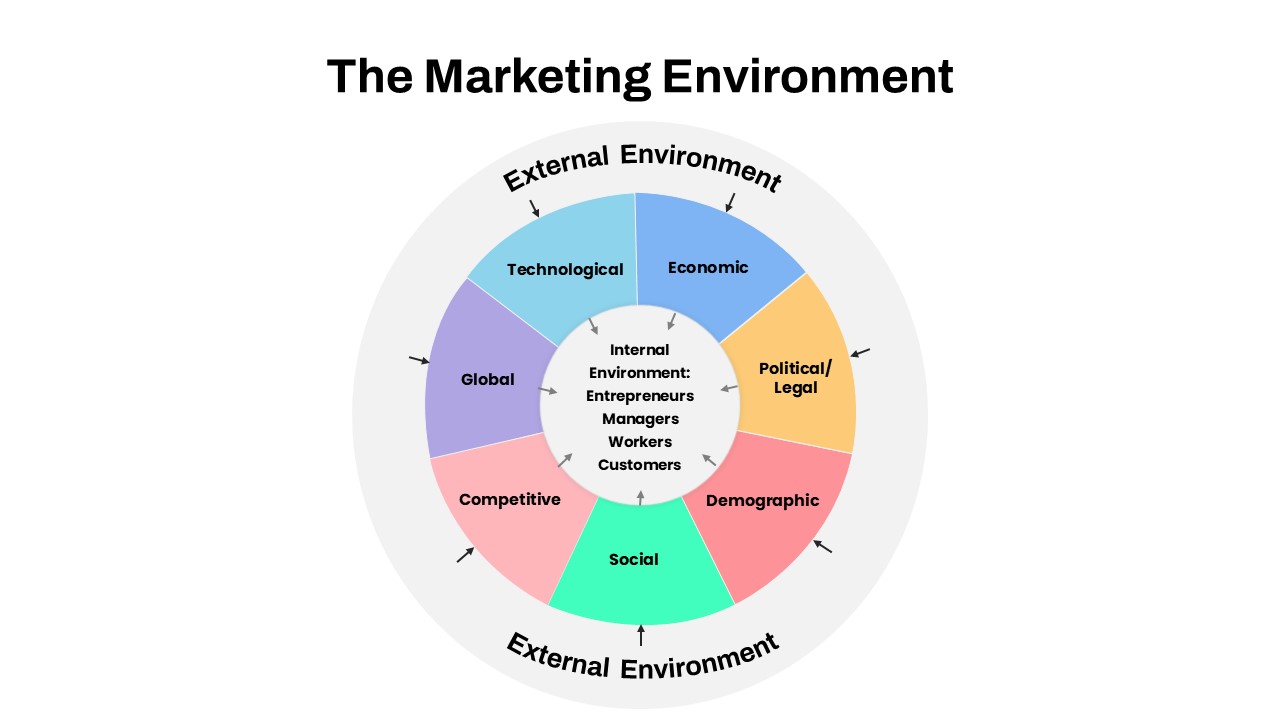
Marketing Environment Circular Diagram template for PowerPoint & Google Slides
Marketing
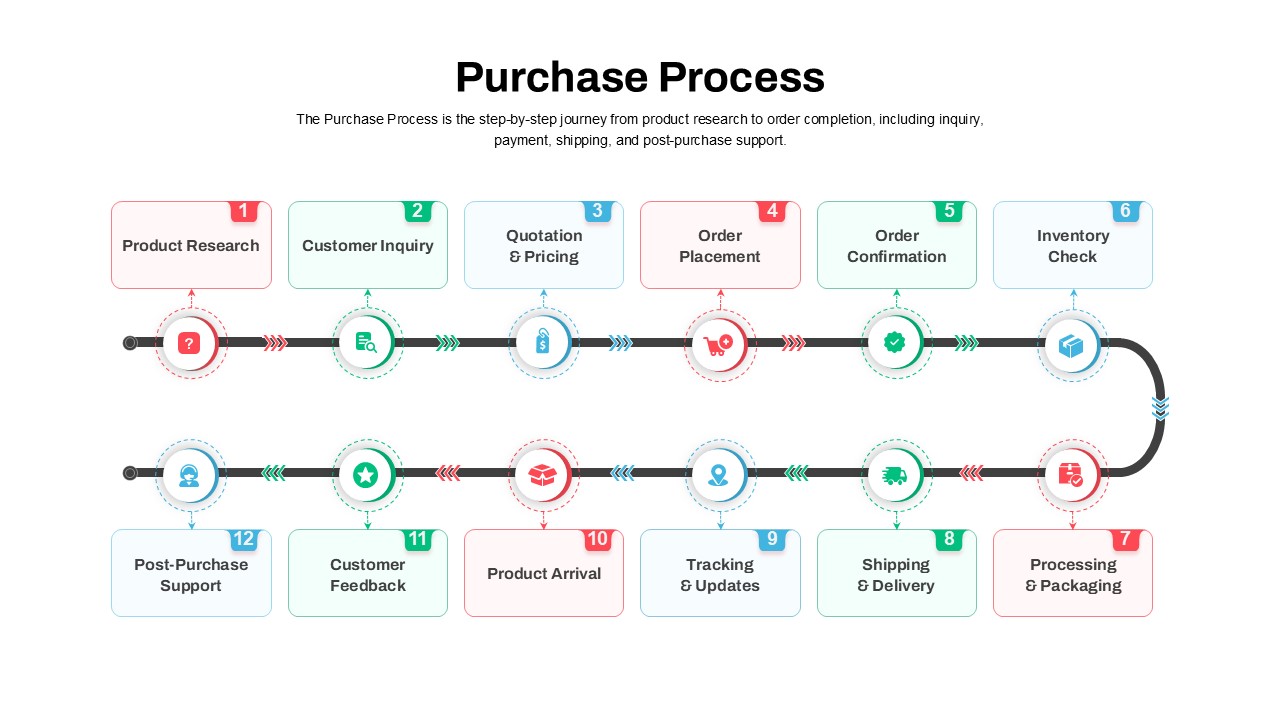
Streamlined Purchase Process Diagram Template for PowerPoint & Google Slides
Timeline
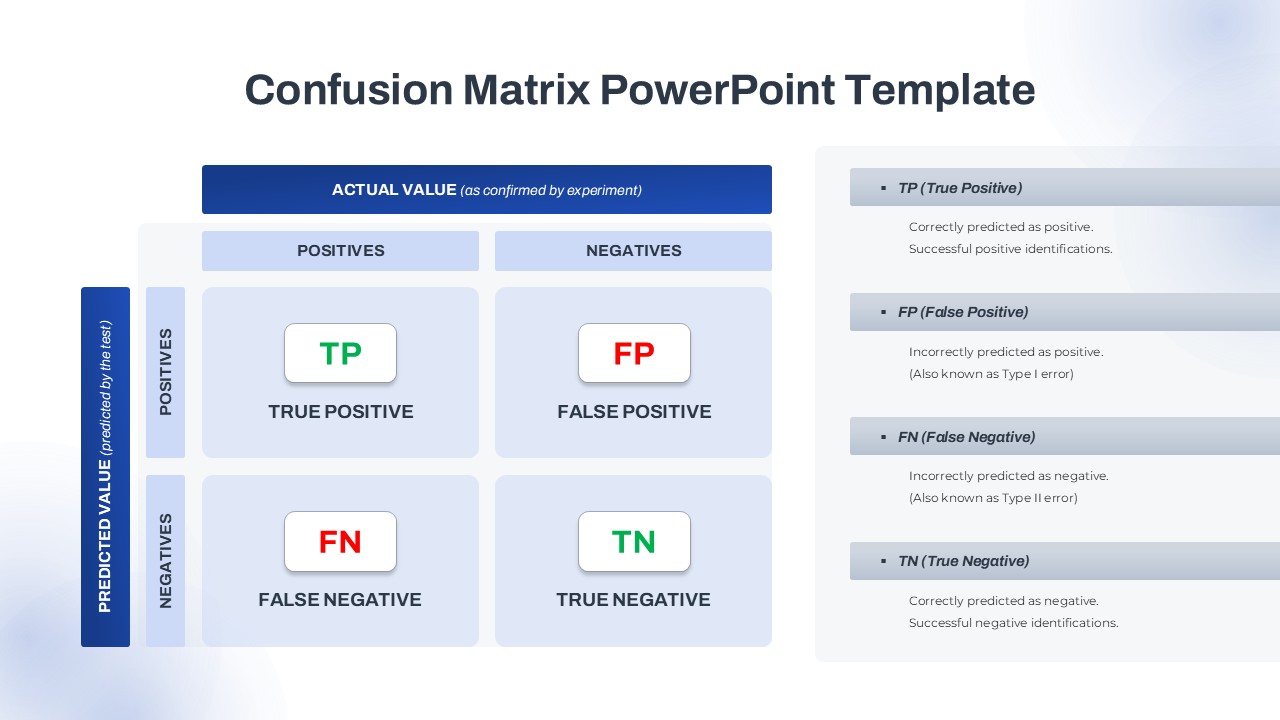
Confusion Matrix Diagram Overview Template for PowerPoint & Google Slides
Comparison
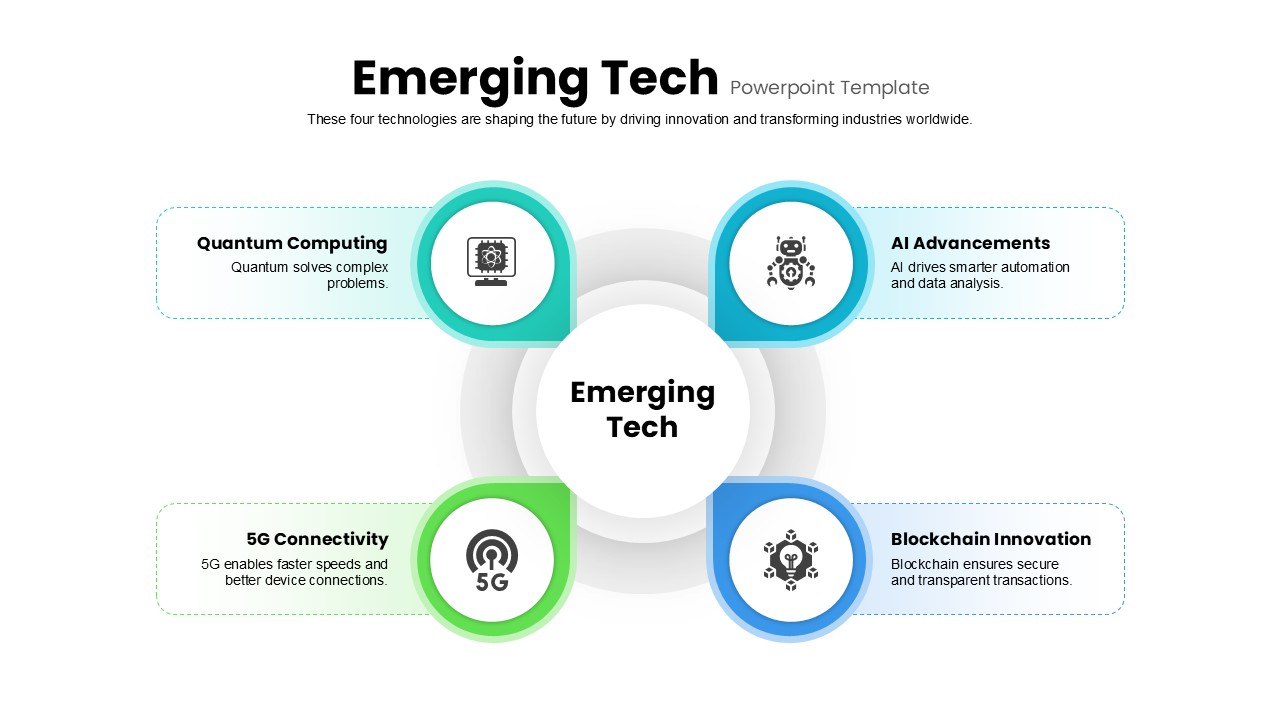
Emerging Tech Hub-and-Spoke Diagram Template for PowerPoint & Google Slides
Technology
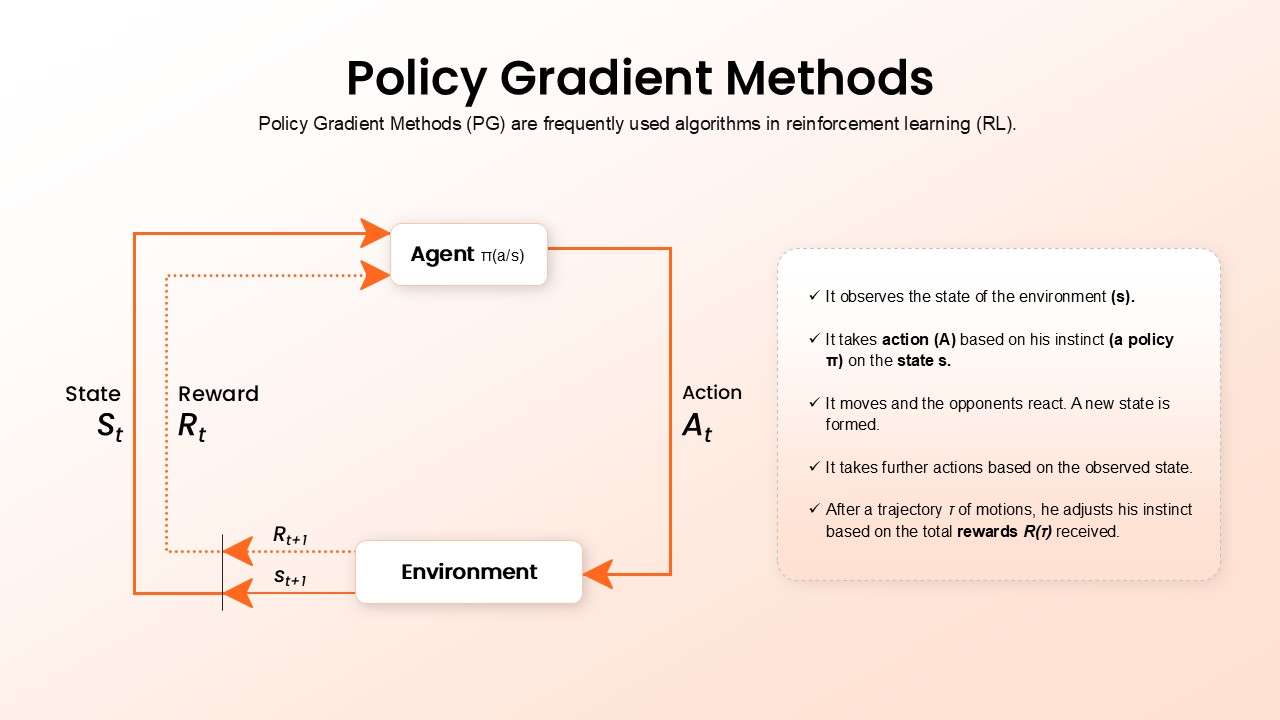
Policy Gradient Methods Flow Diagram Template for PowerPoint & Google Slides
AI
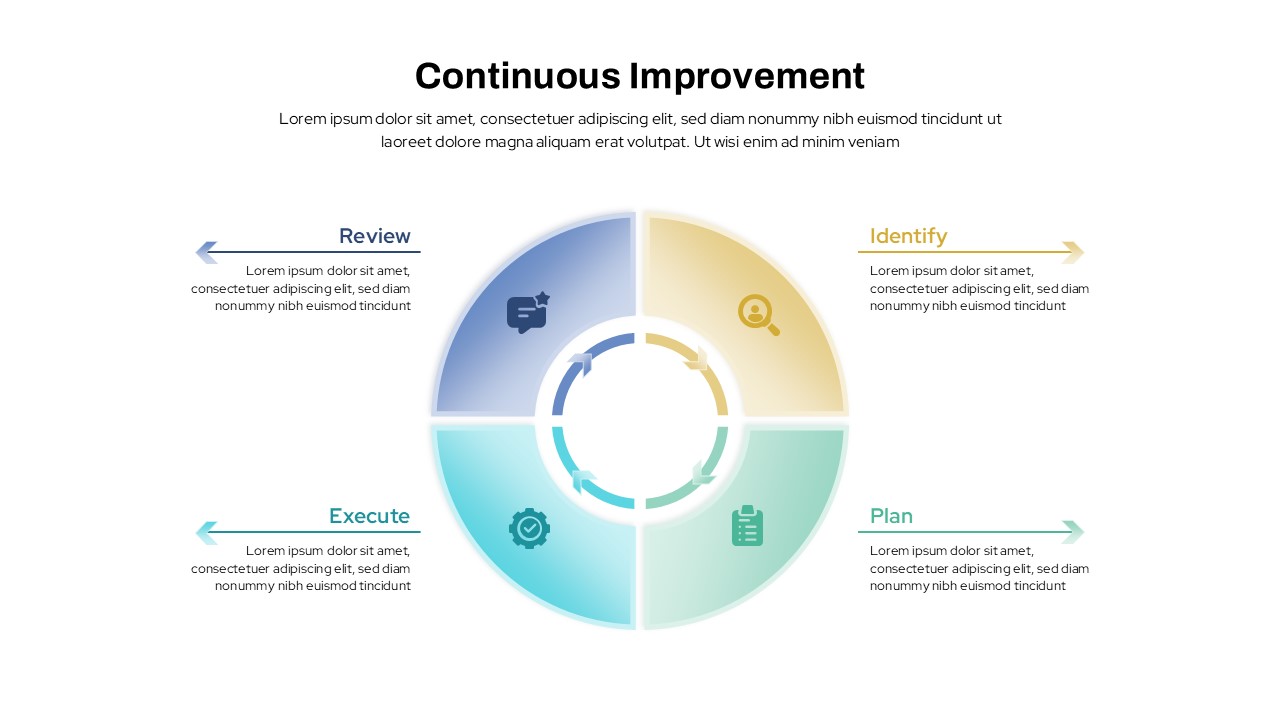
Continuous Improvement Cycle Diagram Template for PowerPoint & Google Slides
Process