Sales Funnel Infographic Diagram Template for PowerPoint & Google Slides
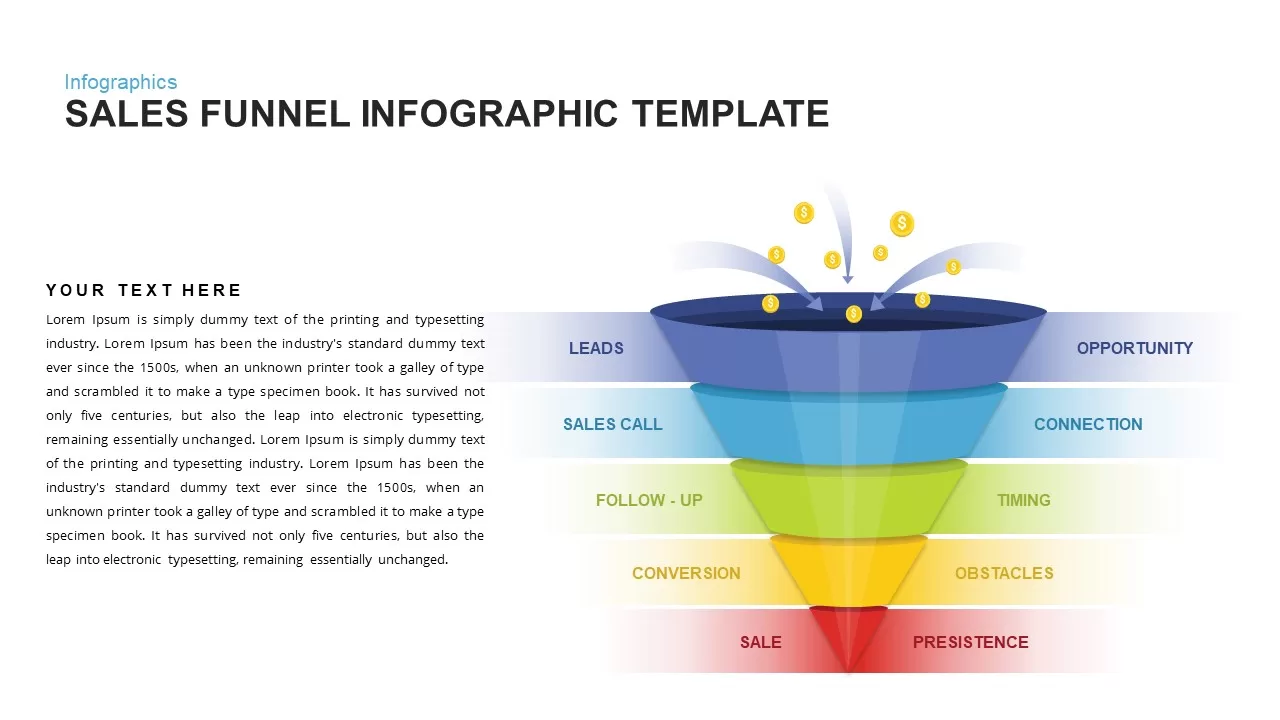
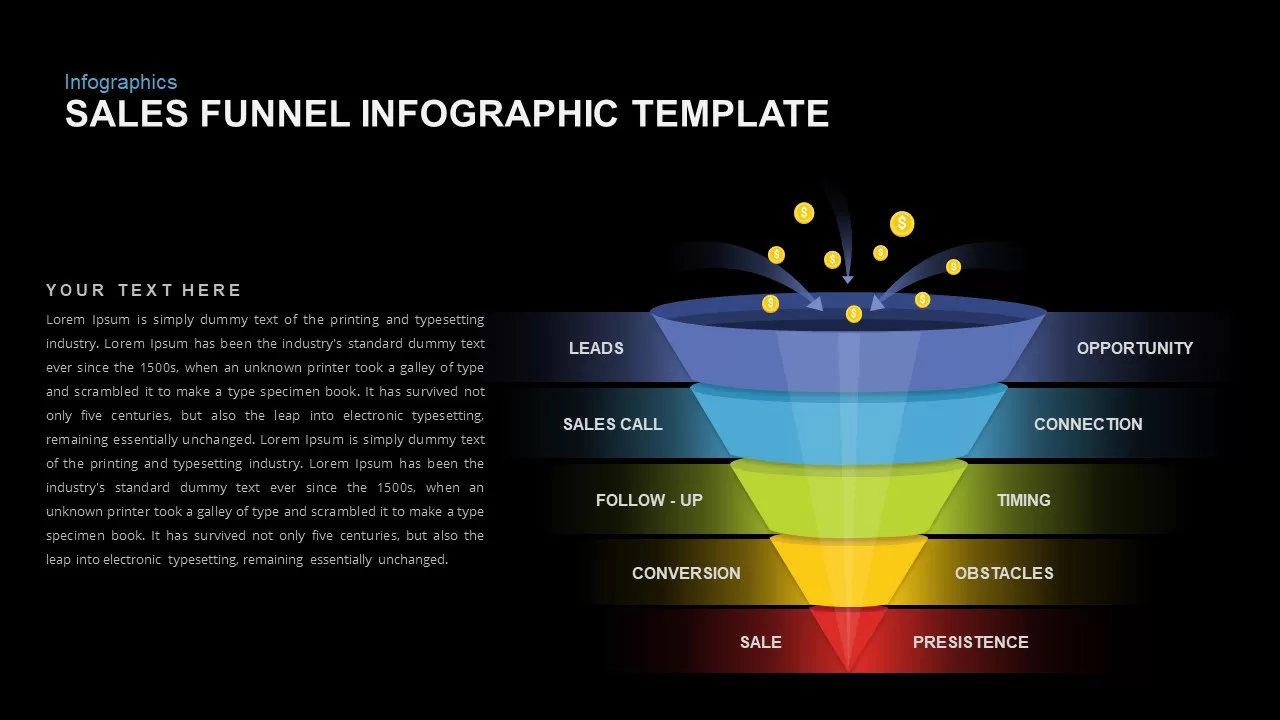

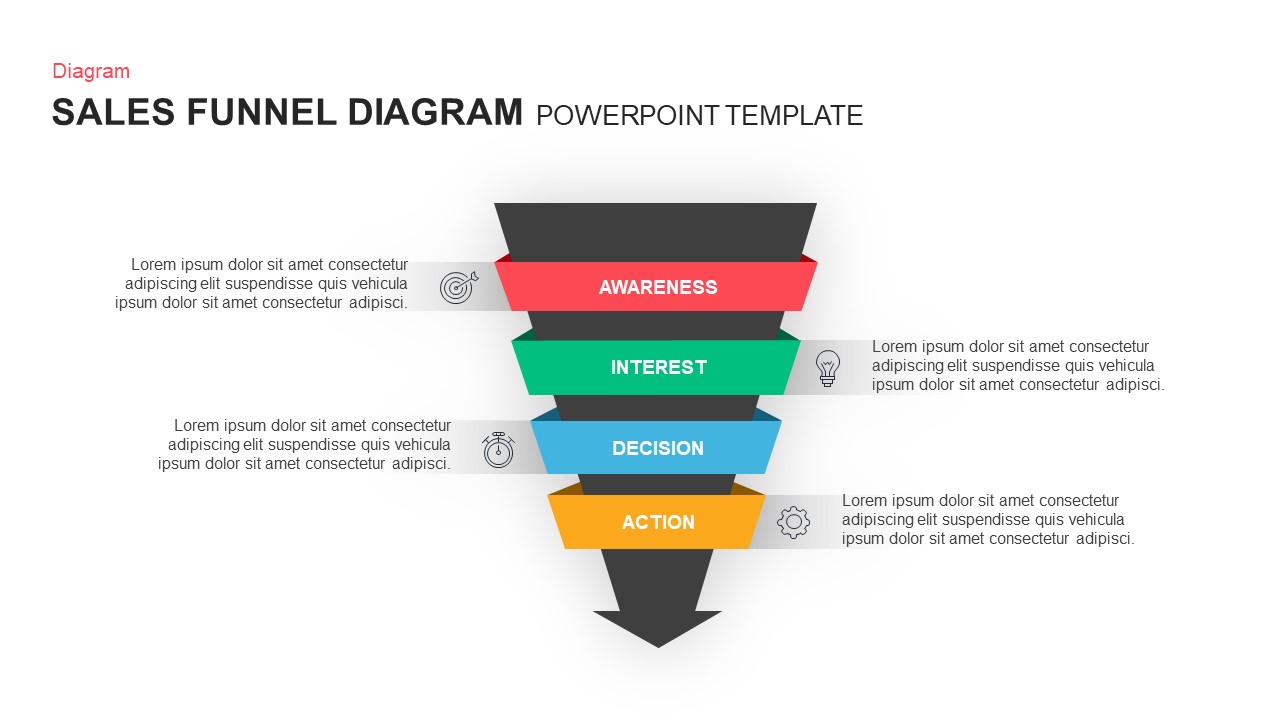
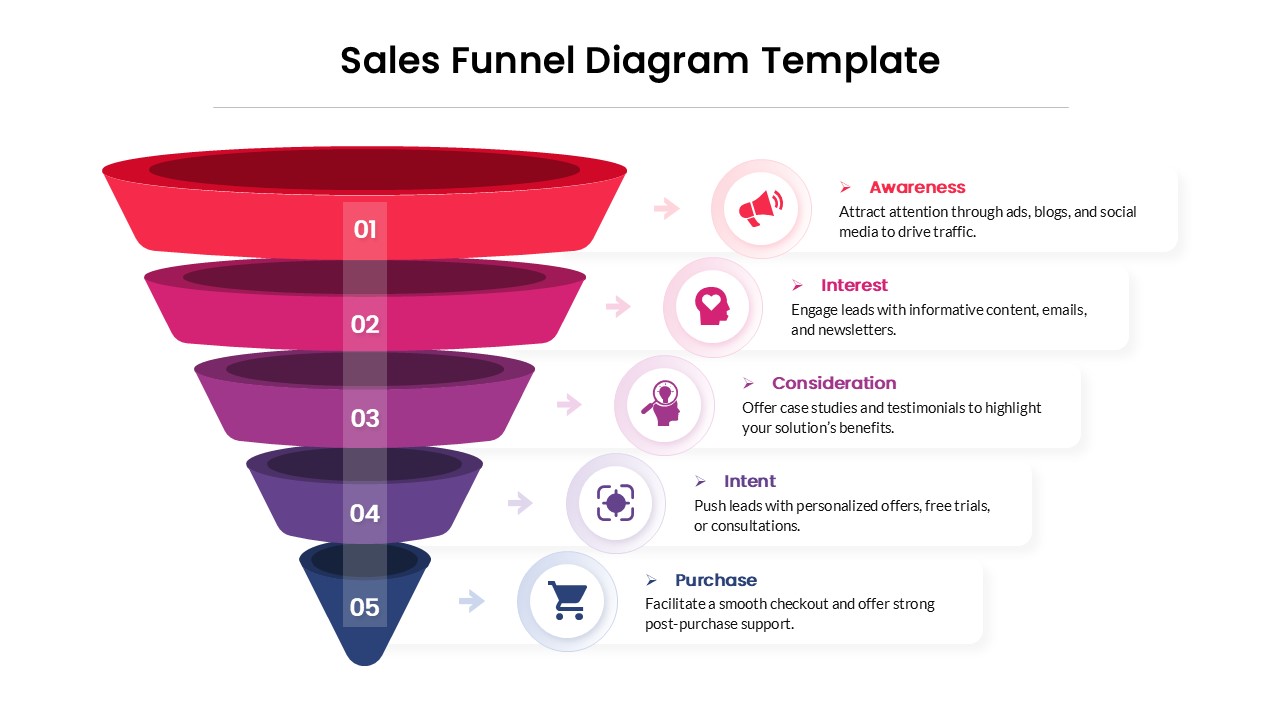
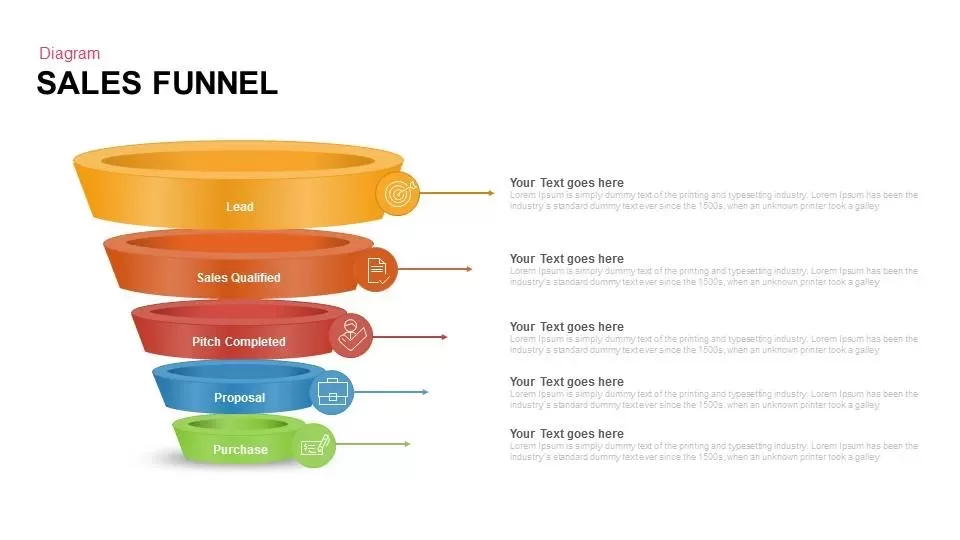
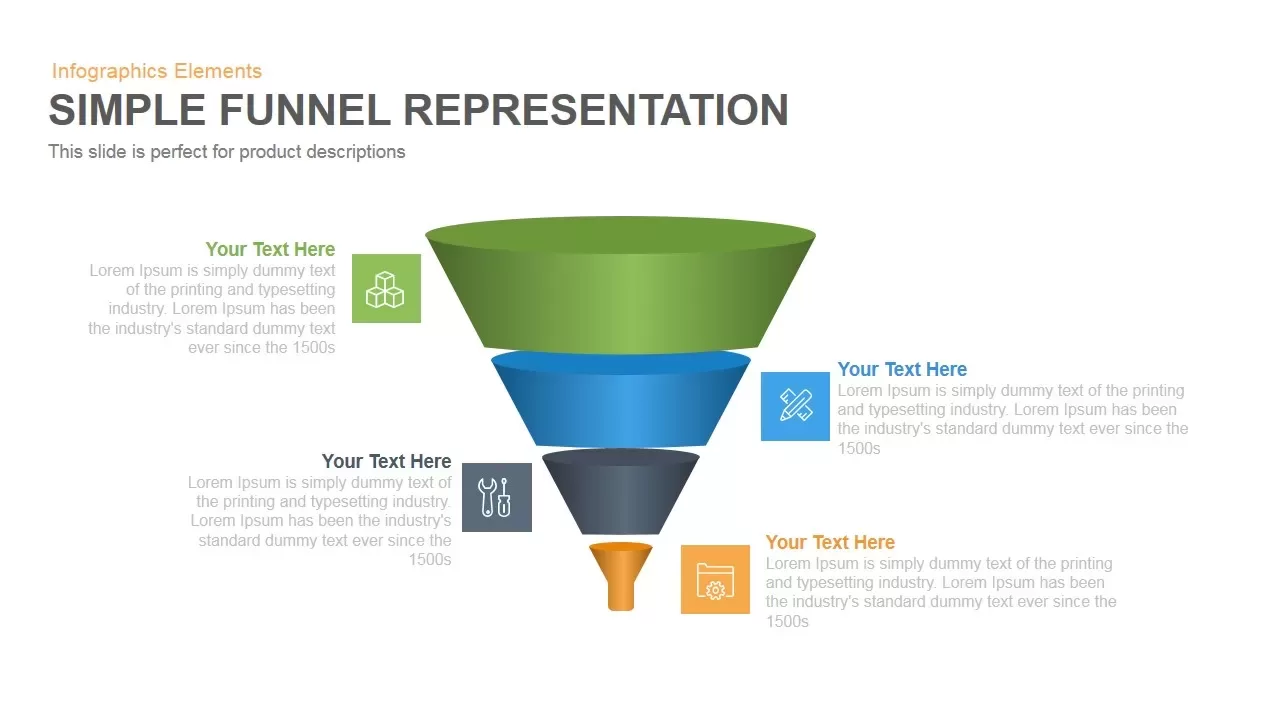
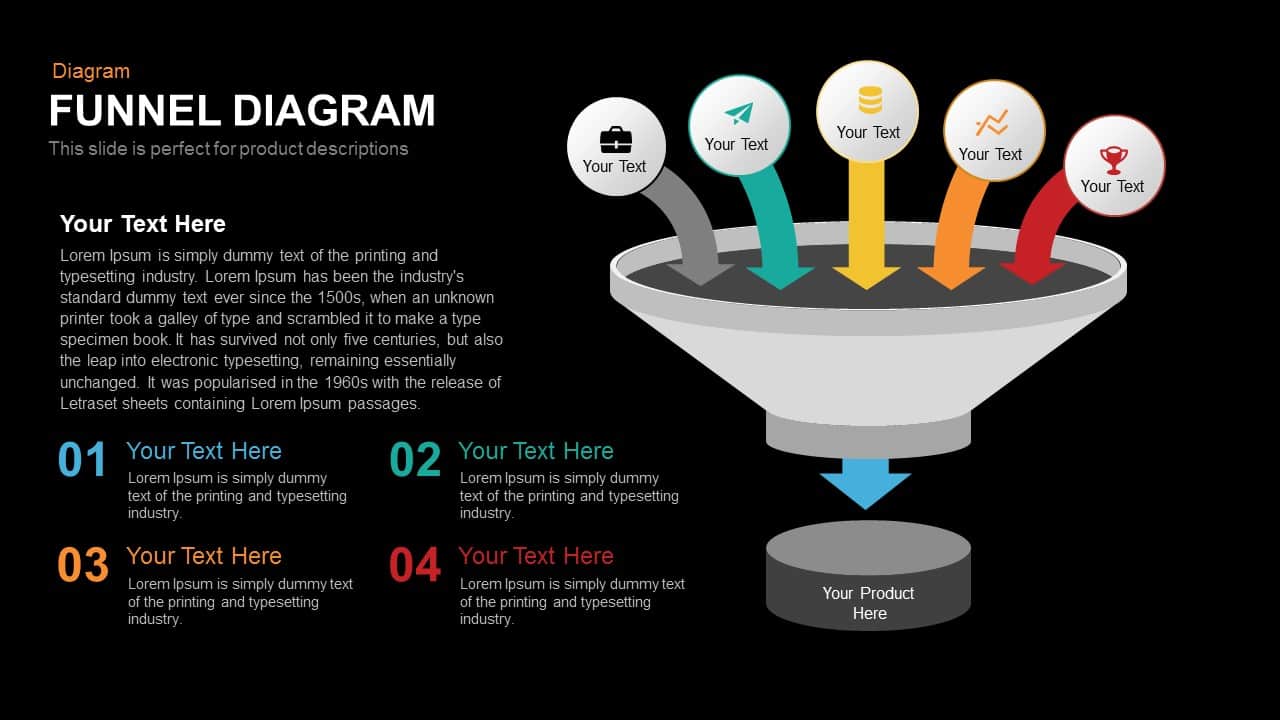
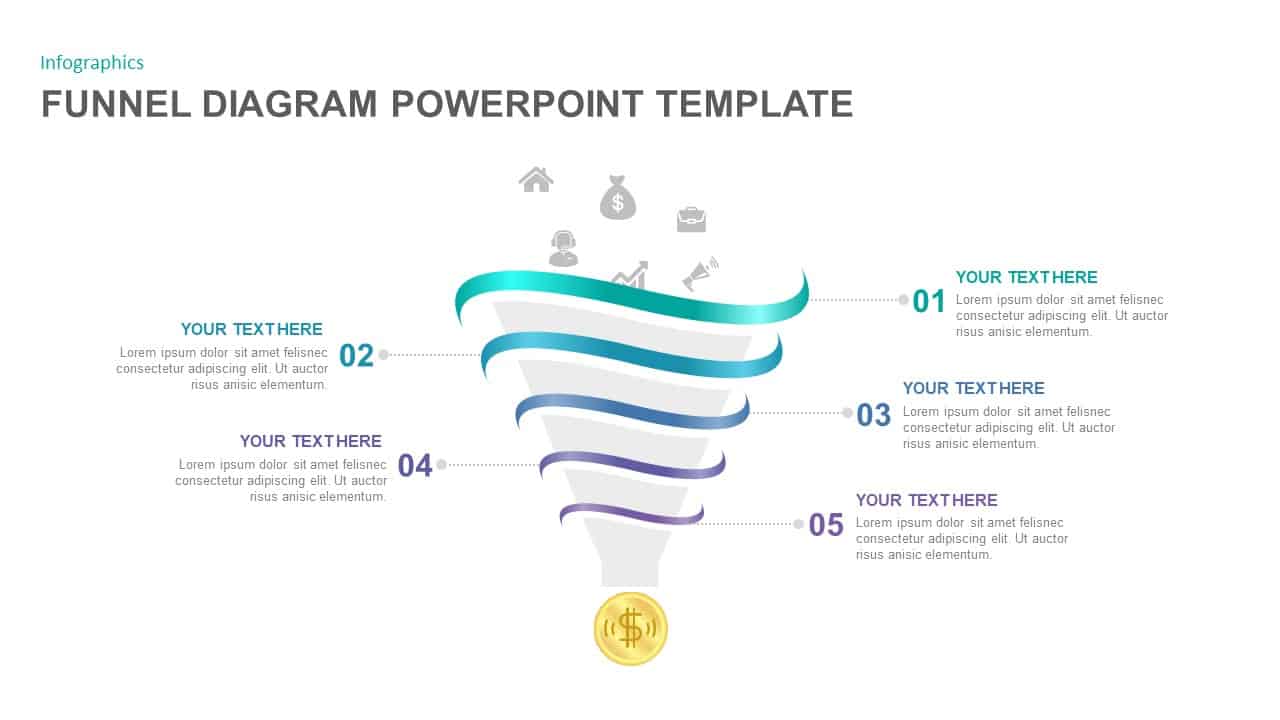
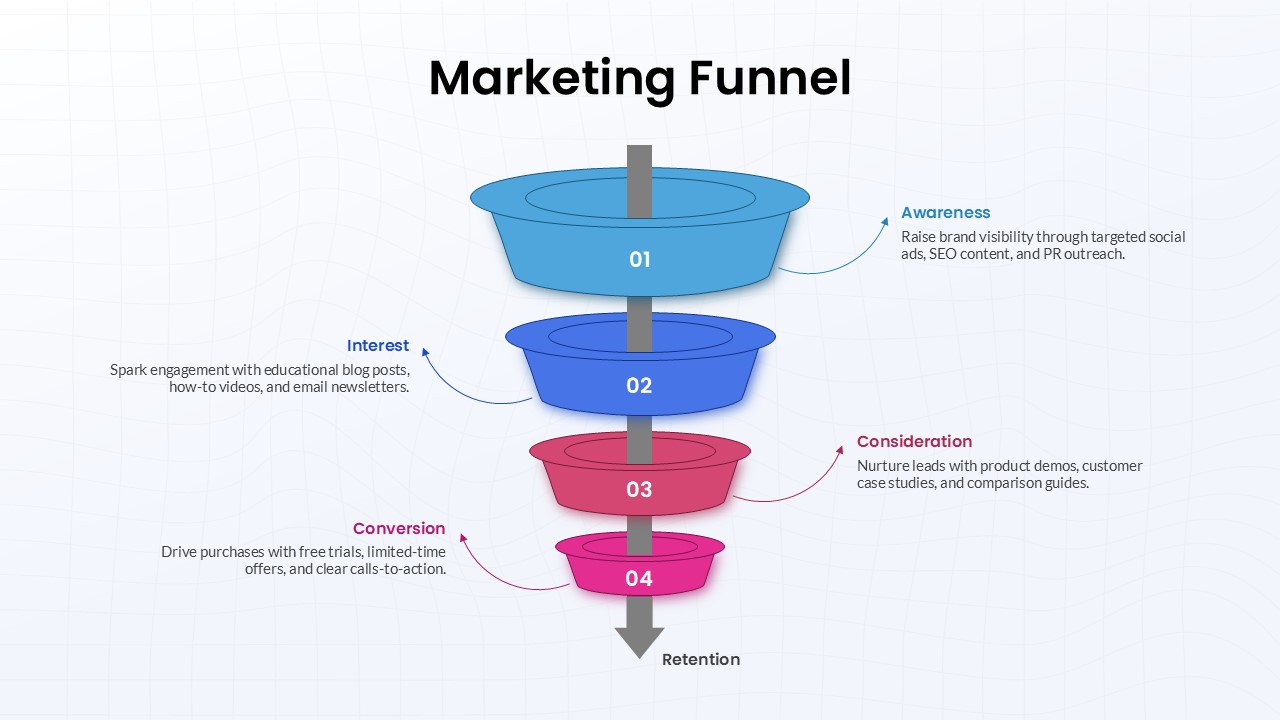
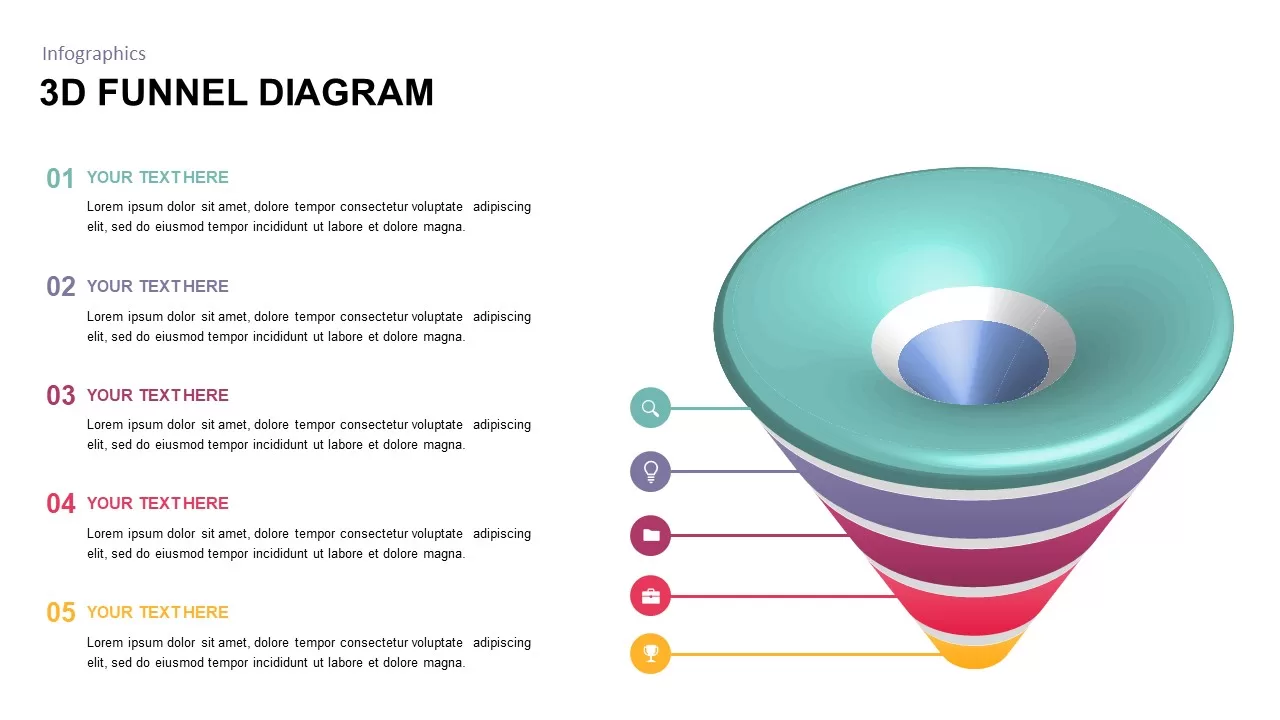
Leverage this sales funnel infographic slide to visualize and optimize your customer journey with a vibrant, layered funnel that guides leads through the stages of sales call, follow-up, conversion, and final sale. The high-resolution graphic features five stacked segments—each in a distinct color gradient—paired with clear labels and supporting text areas. Dollar-icon arrows illustrate revenue flow into the funnel, while horizontal connector lines align each stage with its corresponding strategic focus: opportunity, connection, timing, obstacles, and persistence. The clean white background, professional sans-serif typography, and subtle drop shadows create a modern, polished look that elevates any presentation. For more variations, explore our funnel presentation templates that cover different stages and use cases.
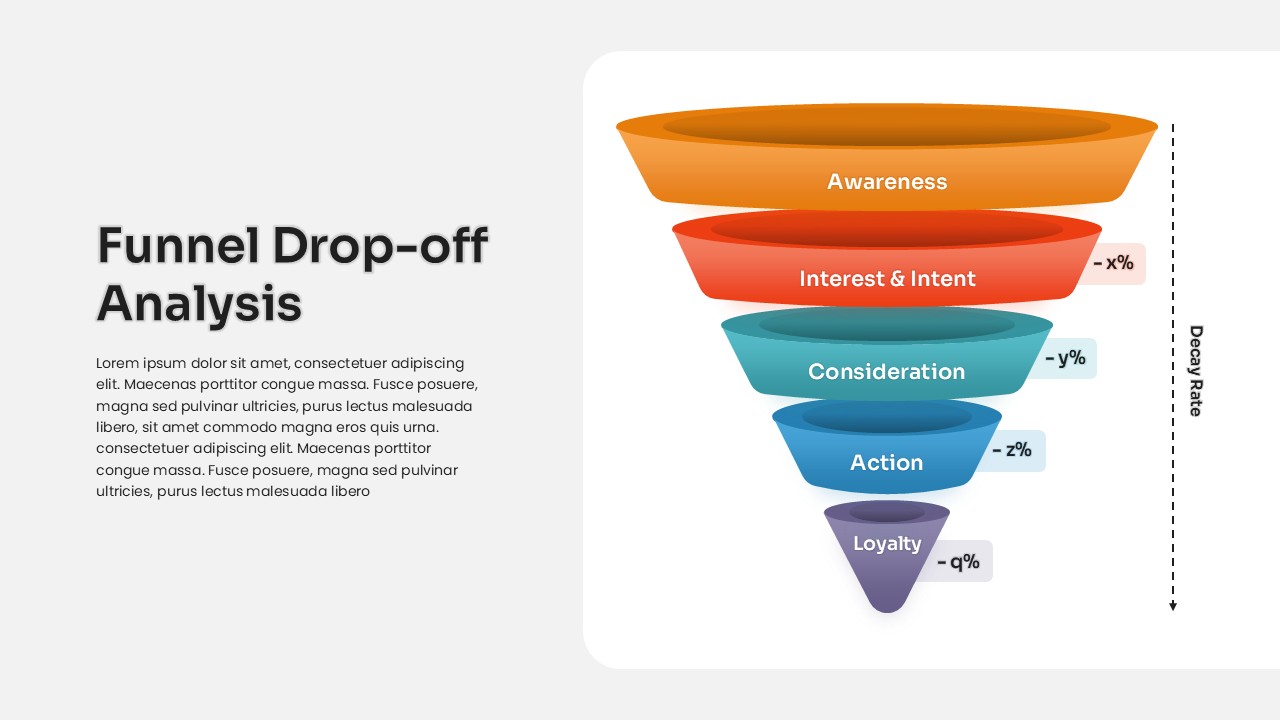
Built on fully editable master slides in PowerPoint and Google Slides, this template empowers you to customize colors, gradients, labels, and segment order to suit your branding and messaging needs. Swap text placeholders with your actual data, adjust segment widths to reflect conversion rates, or replace icons to match industry specifics—all without advanced design skills. Vector-based elements ensure sharp output across screen sizes and print formats, while built-in layout guides maintain alignment and consistency. Whether you’re presenting to sales teams, executive leadership, or potential investors, this infographic slide streamlines complex data into an intuitive, visually compelling format. Slides like the funnel drop-off analysis further allow you to focus on where leads exit the process and how to optimize conversion.
Whether you’re illustrating lead generation strategies, conversion rate optimization plans, or quarterly performance reviews, this funnel infographic adapts to diverse sales presentations. Use the horizontal callout bars to highlight metrics like lead volume, call-to-meeting ratios, follow-up success rates, and close percentages. With its clear segmentation and editable design, this slide transforms dense sales data into an engaging narrative, boosting stakeholder buy-in and actionable insights.
Who is it for
Sales managers, business development leaders, marketing directors, and executive teams will find this template invaluable for presenting pipeline health, conversion analytics, and revenue forecasts in board meetings or training sessions.
Other Uses
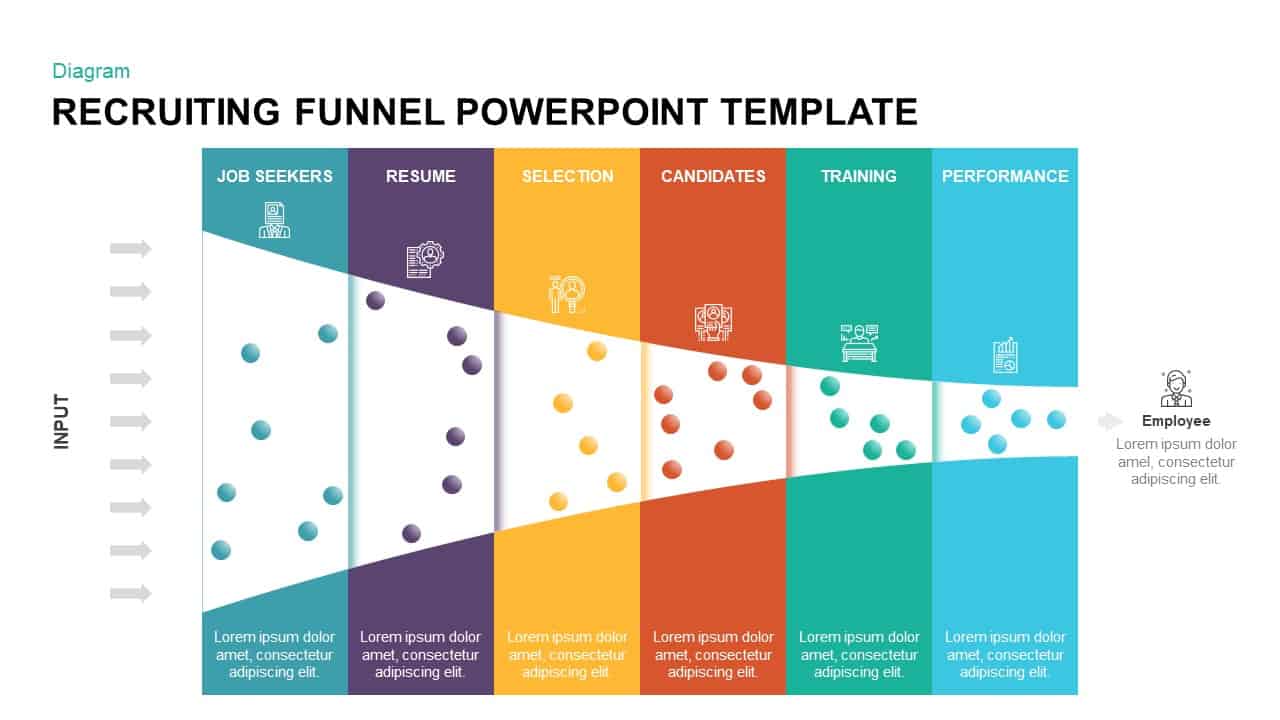
Repurpose this layout for marketing funnel breakdowns, customer lifecycle mapping, recruitment pipelines, fundraising stages, or project milestone progress—any scenario that benefits from a staged, visual flow of input to outcome. For a more minimal approach to presenting multi-step journeys, the four stage funnel infographic is a great option that simplifies processes into clear, concise phases.
Login to download this file

Item ID
SB02008
Related Templates

Sales Process Workflow Funnel Diagram PowerPoint Template for PowerPoint & Google Slides
Funnel
Professional Sales Funnel Diagram Template for PowerPoint & Google Slides
Funnel
5 Stage Sales Funnel Diagram Template for PowerPoint & Google Slides
Funnel

Sales Funnel Diagram for PowerPoint & Google Slides
Marketing Funnel
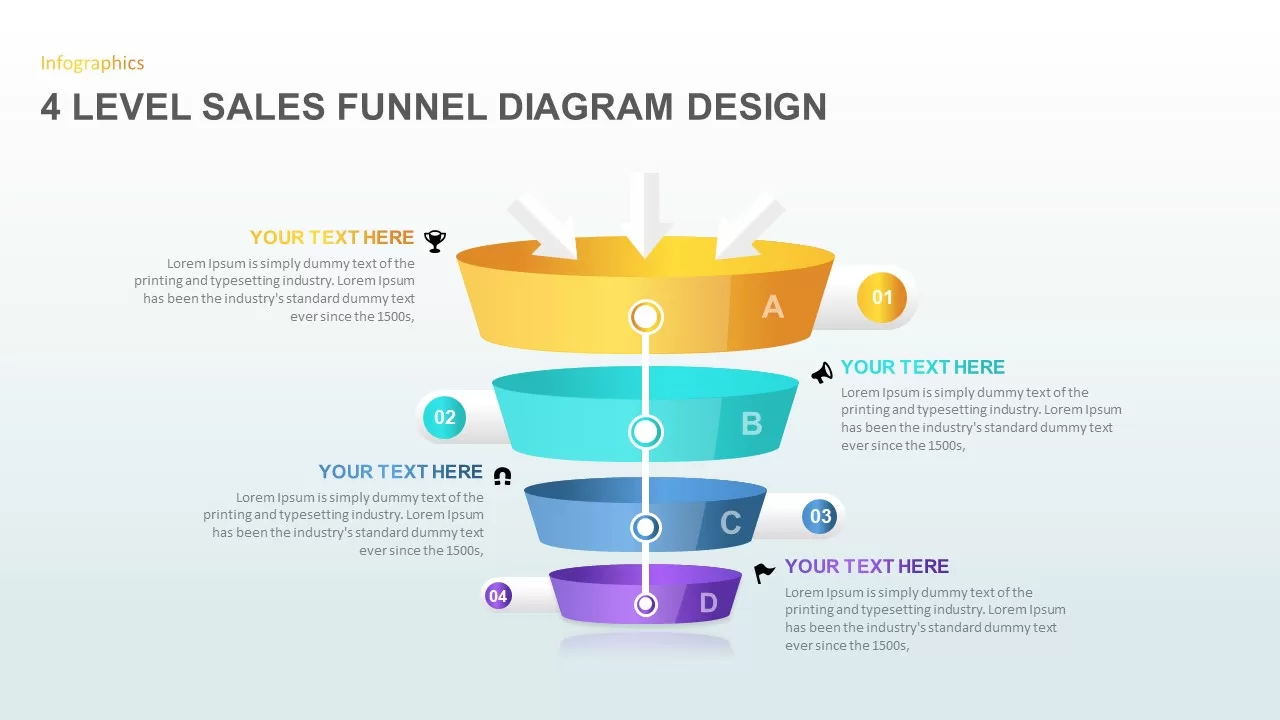
4 Level Sales Funnel Diagram Design for PowerPoint & Google Slides
Marketing Funnel
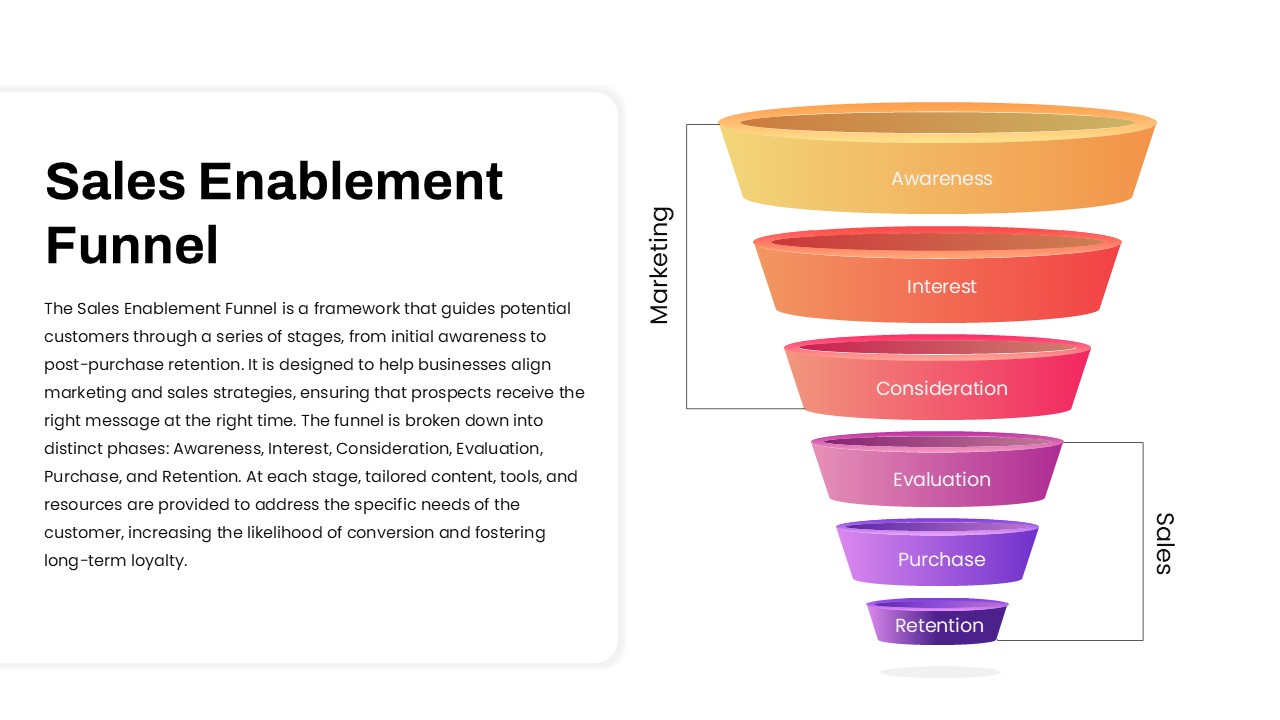
Sales Enablement Funnel diagram for PowerPoint & Google Slides
Funnel
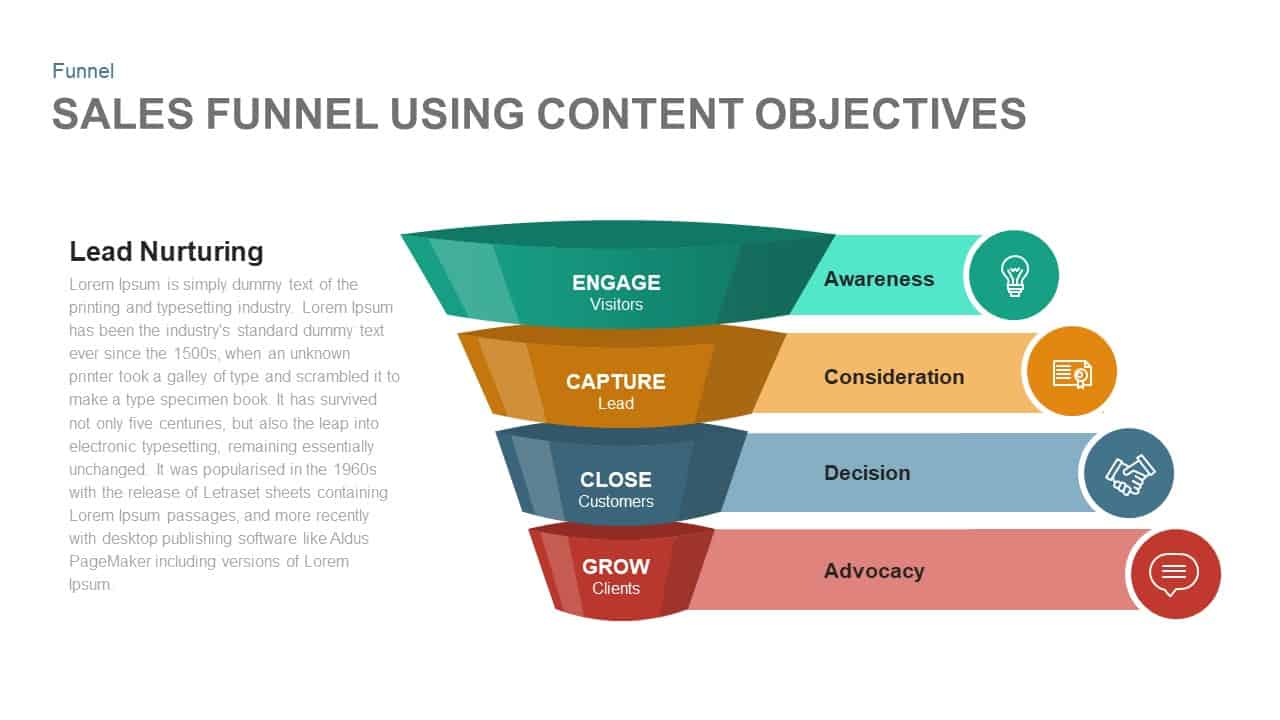
Sales Funnel Using Content Objectives Template for PowerPoint & Google Slides
Funnel
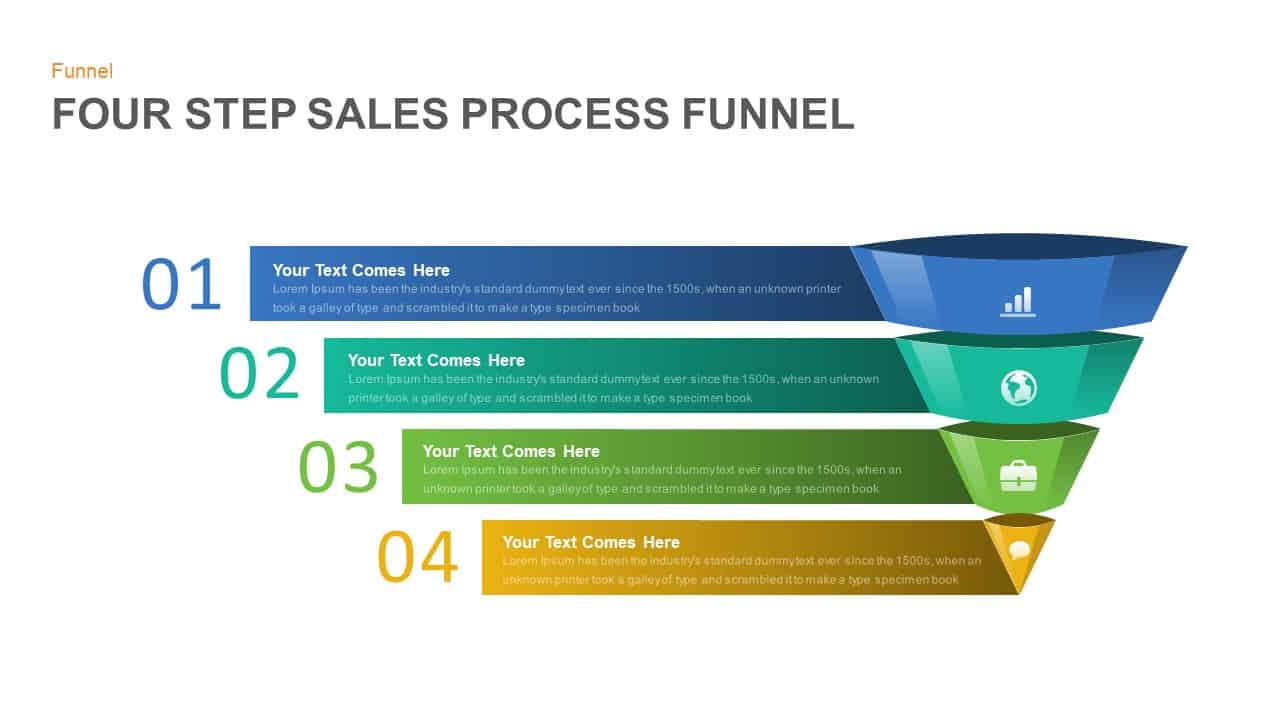
Four Step Sales Process Funnel Template for PowerPoint & Google Slides
Funnel
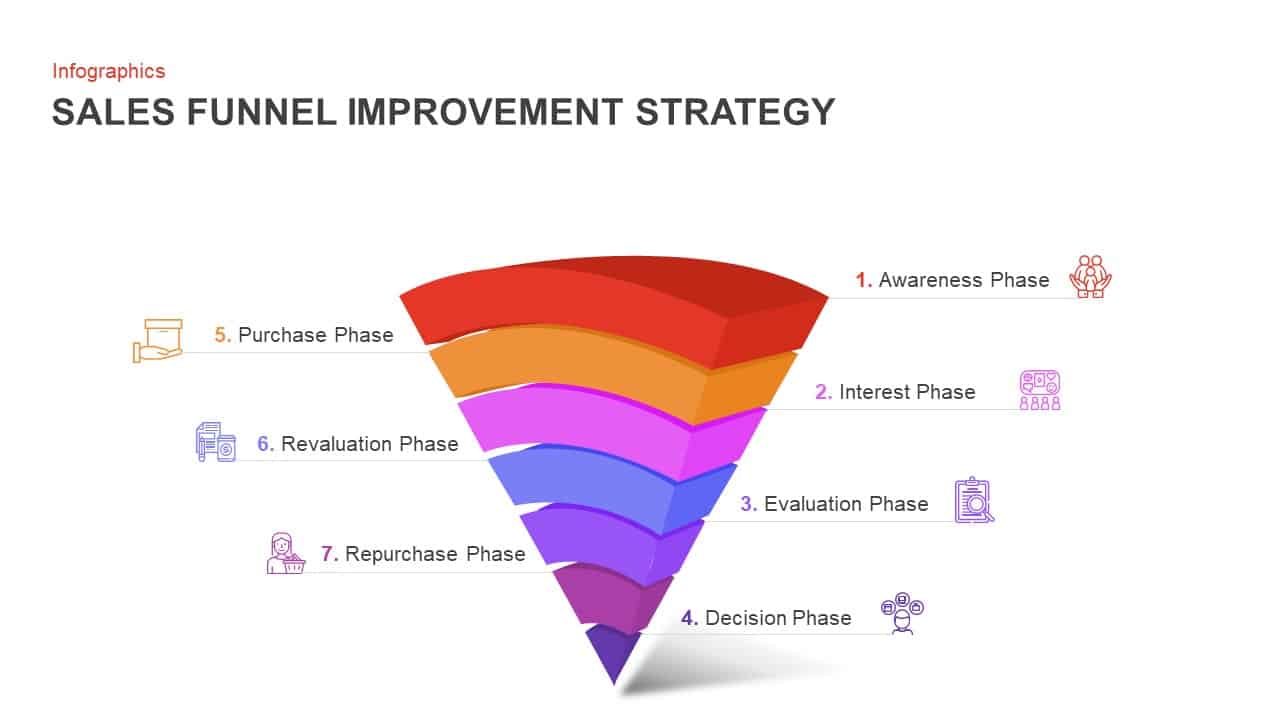
7-Step Sales Funnel Improvement Strategy Template for PowerPoint & Google Slides
Infographics
Inverted Sales Funnel Marketing Stages Template for PowerPoint & Google Slides
Marketing Funnel
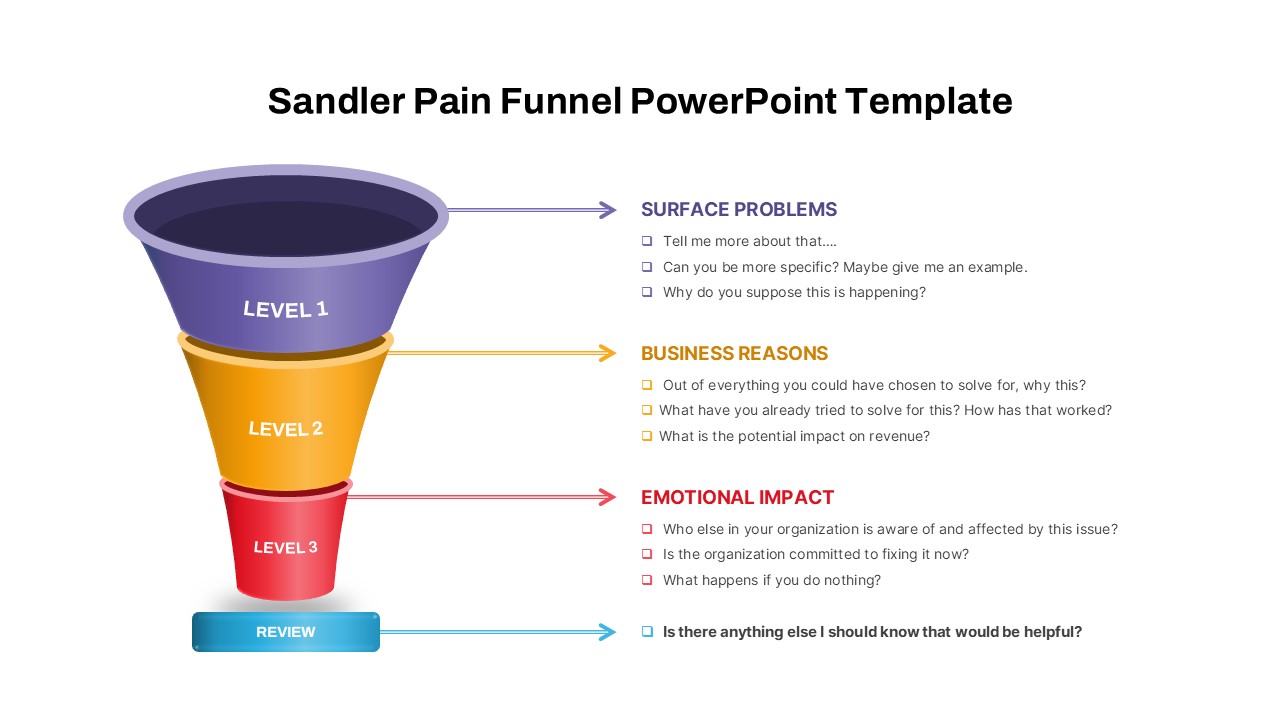
Sandler Pain Funnel Sales Qualification Template for PowerPoint & Google Slides
Funnel
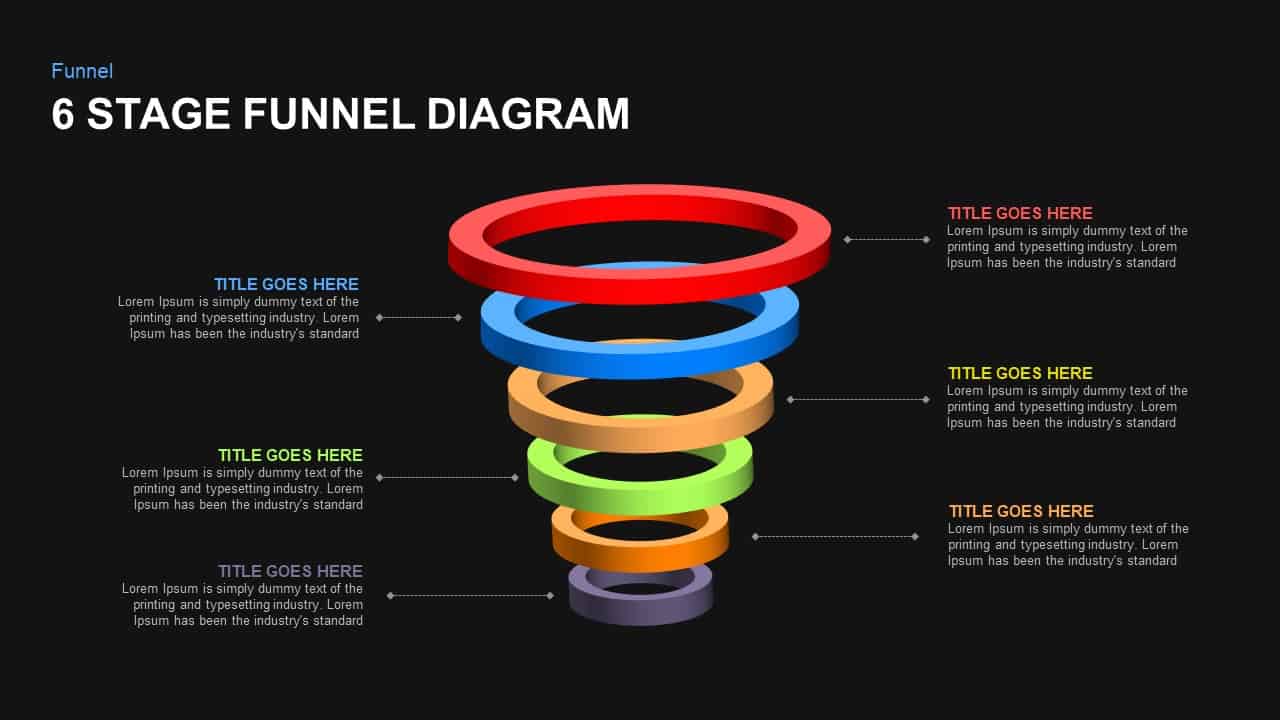
6-Stage Funnel Diagram Infographic Template for PowerPoint & Google Slides
Funnel
3D Conversion Funnel Diagram Infographic Template for PowerPoint & Google Slides
Funnel
Four-Stage Funnel Diagram Infographic Template for PowerPoint & Google Slides
Funnel
Four-Stage Funnel Diagram Infographic Template for PowerPoint & Google Slides
Funnel
Professional 3D Funnel Infographic Template for PowerPoint & Google Slides
Funnel
Gradient 5-Stage Funnel Infographic Template for PowerPoint & Google Slides
Funnel
Five-Stage Marketing Funnel Infographic Template for PowerPoint & Google Slides
Funnel
Four-Step Funnel Infographic Pack Template for PowerPoint & Google Slides
Funnel
Free Multi-Step Funnel Infographic Slide Pack Template for PowerPoint & Google Slides
Funnel
Free

Sales Process Infographic Slides Pack Template for PowerPoint & Google Slides
Process
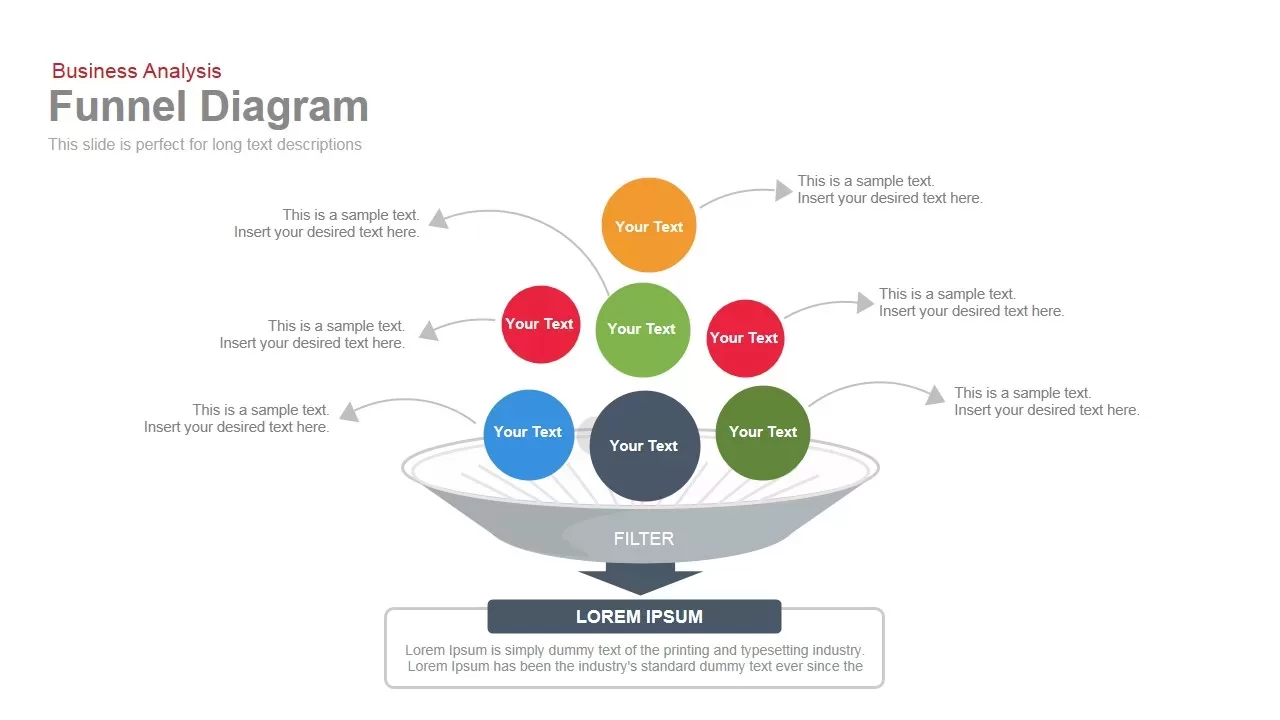
Business Funnel Diagram template for PowerPoint & Google Slides
Funnel
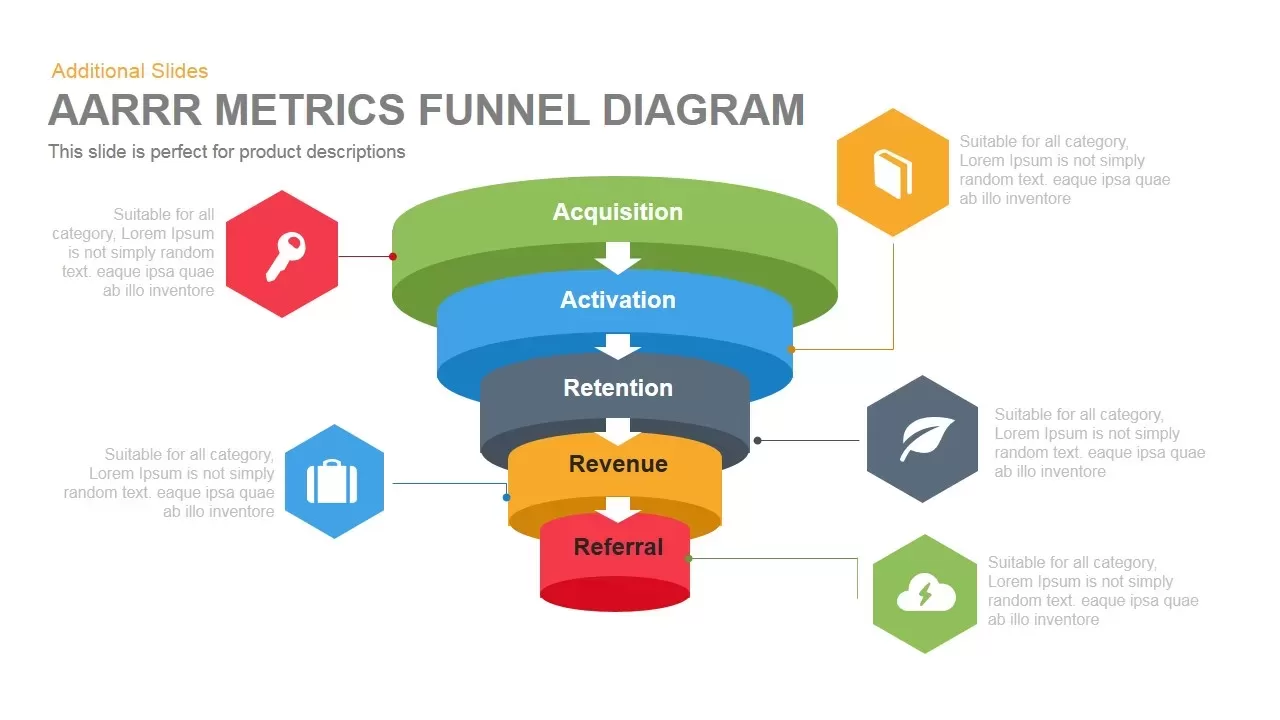
AARRR Funnel Diagram template for PowerPoint & Google Slides
Funnel
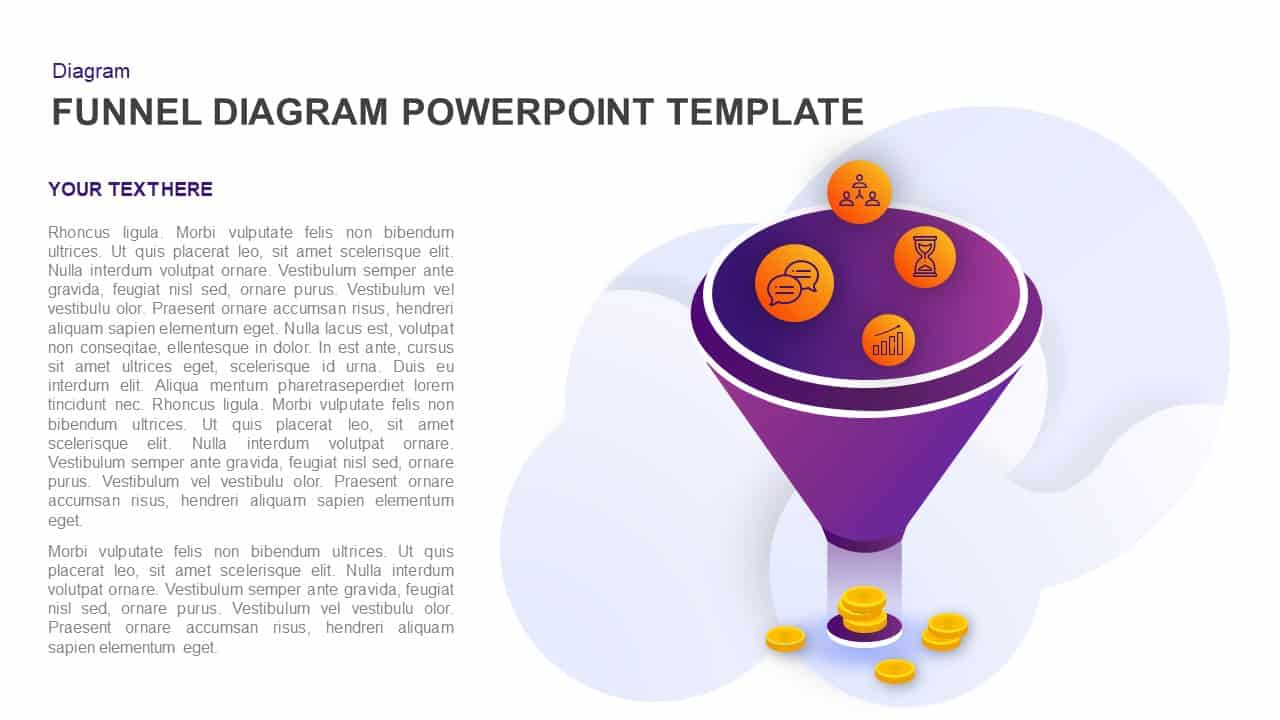
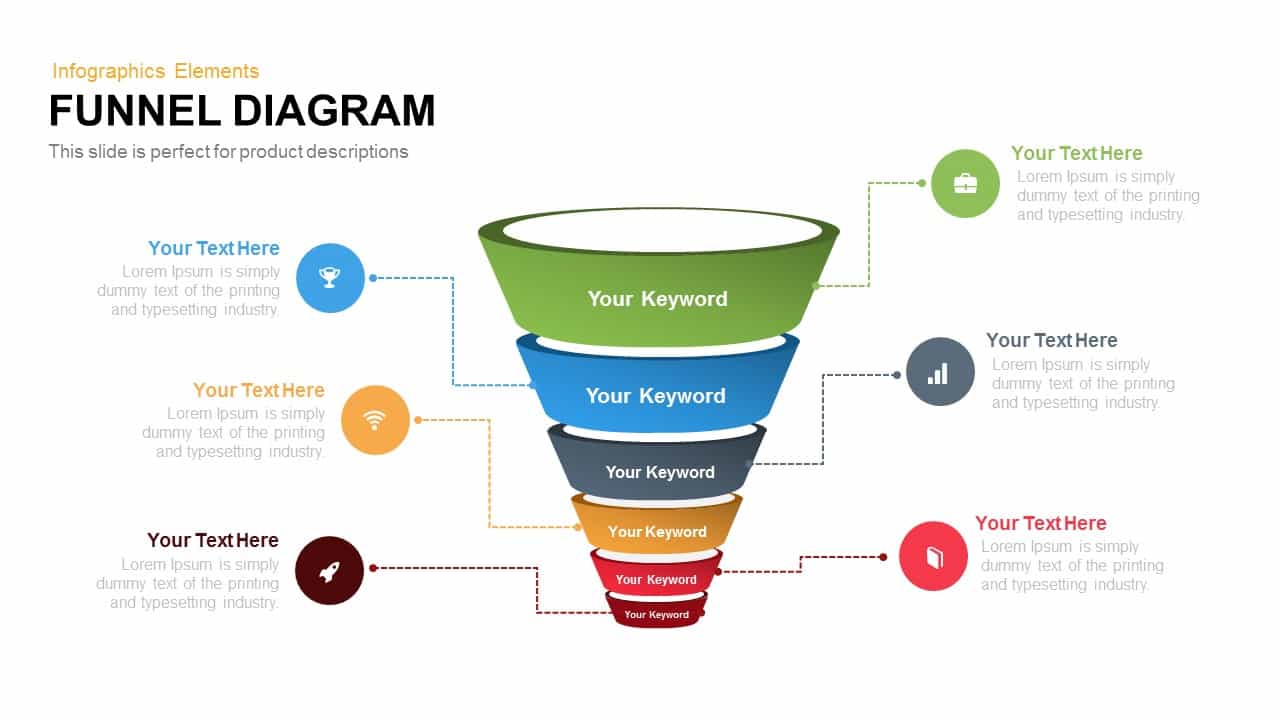
Funnel Diagram Template for PowerPoint & Google Slides
Infographics
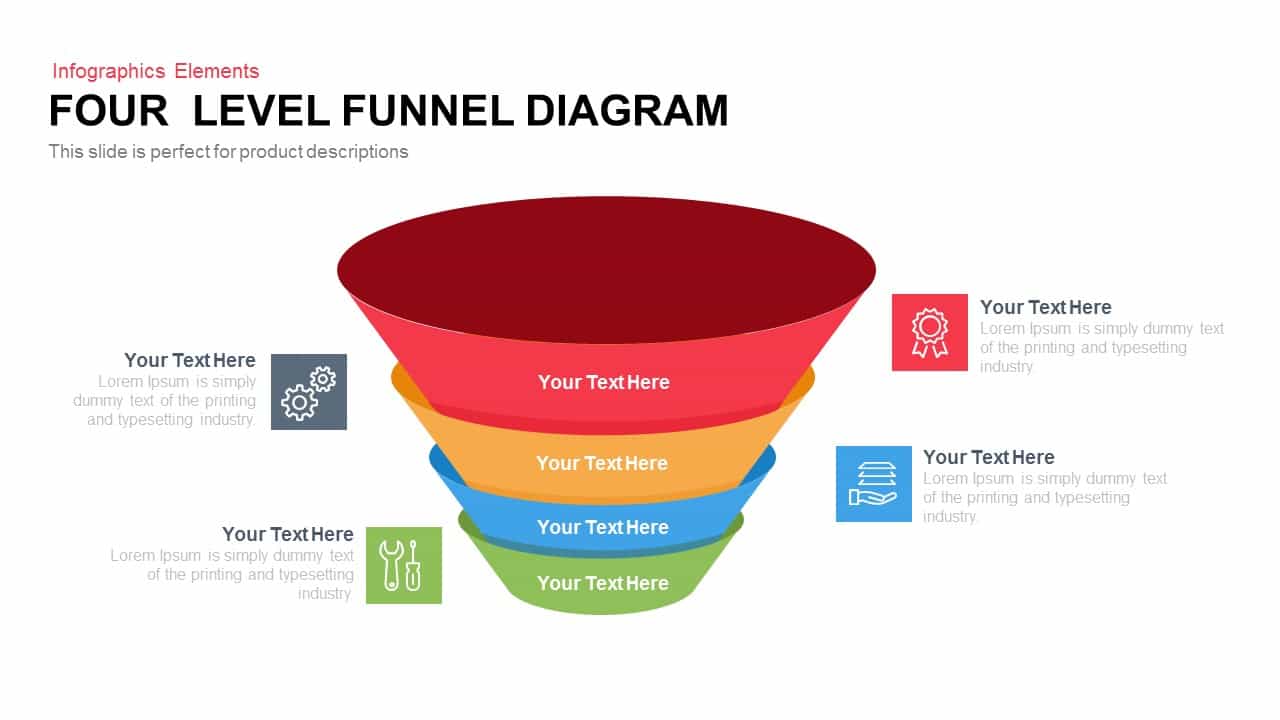
4 Level Funnel Diagram Template for PowerPoint & Google Slides
Funnel
Funnel Diagram template for PowerPoint & Google Slides
Funnel
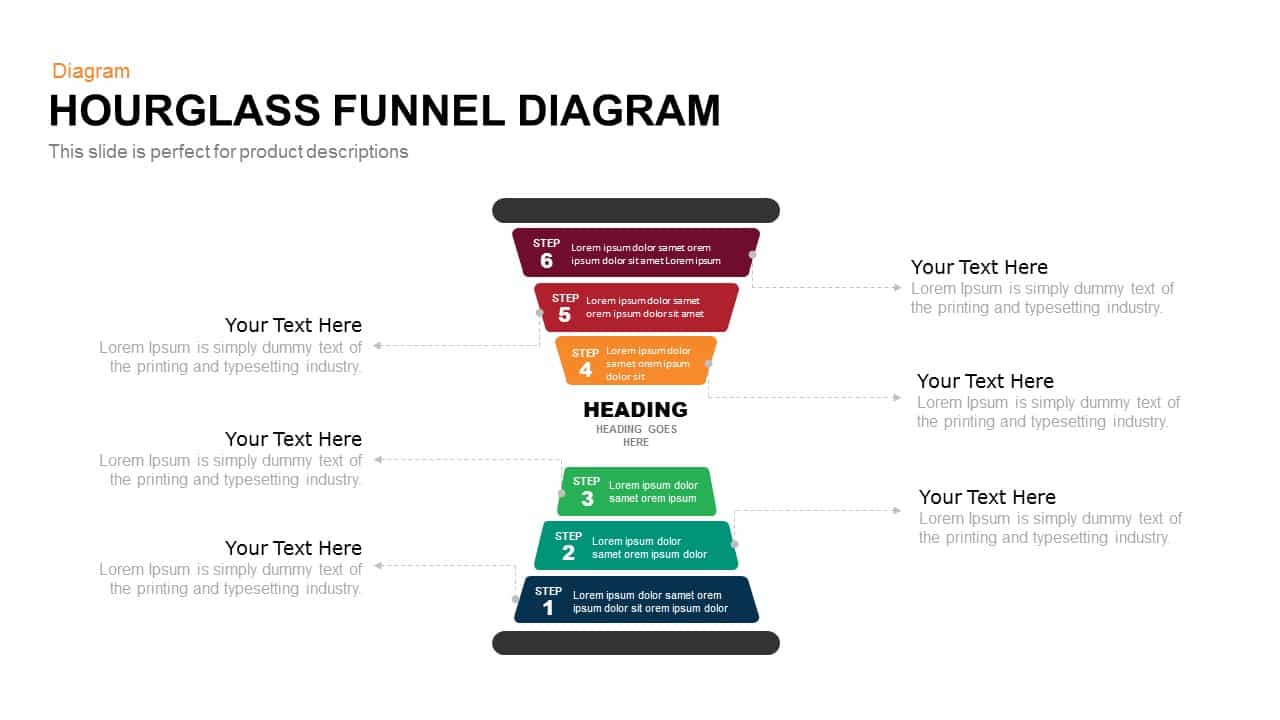
Hourglass Funnel Diagram Process Template for PowerPoint & Google Slides
Funnel
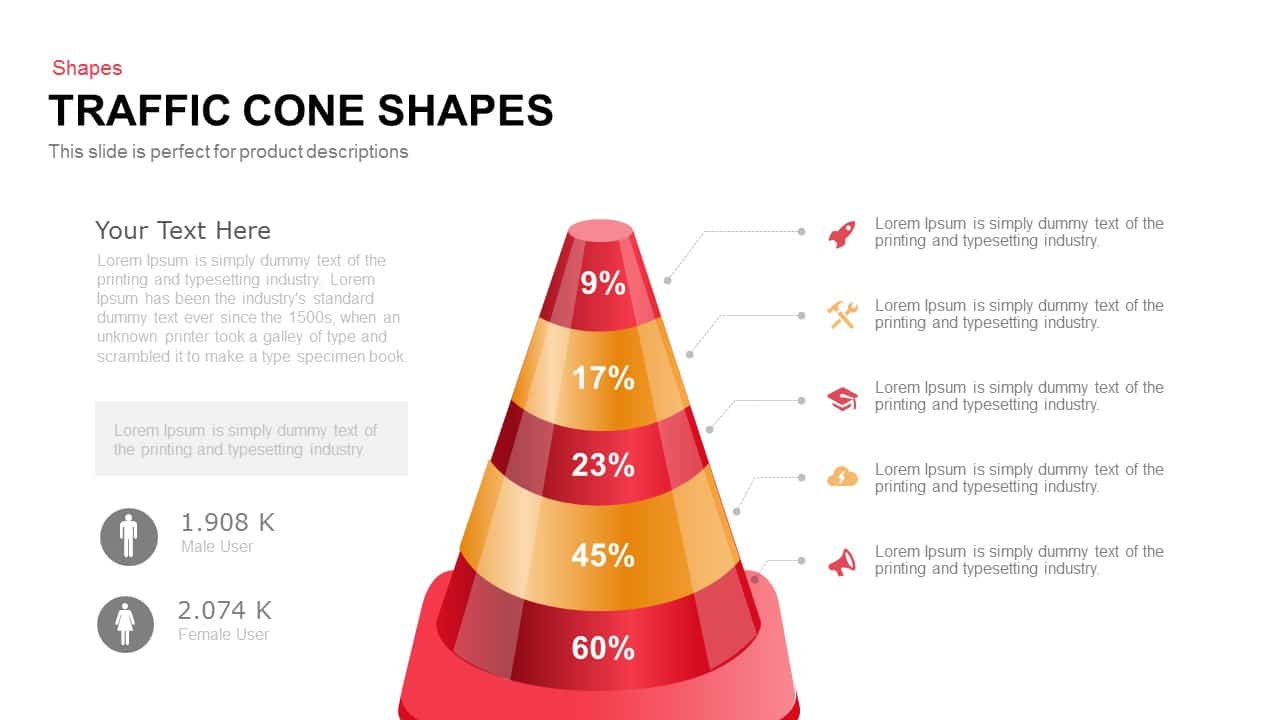
Traffic Cone Funnel Diagram Slide Template for PowerPoint & Google Slides
Funnel
Professional Four-Stage Funnel Diagram Template for PowerPoint & Google Slides
Funnel
Four and Five-Stage Funnel Diagram Template for PowerPoint & Google Slides
Funnel
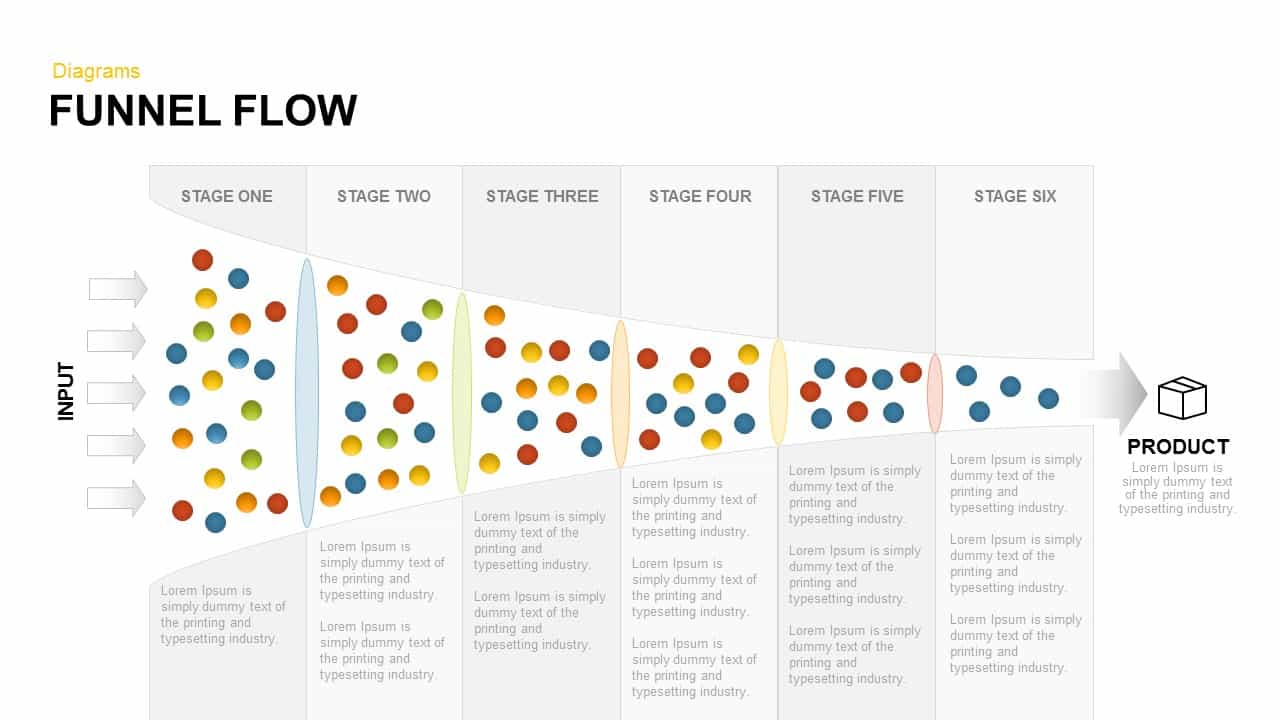
Funnel Flow Diagram template for PowerPoint & Google Slides
Funnel
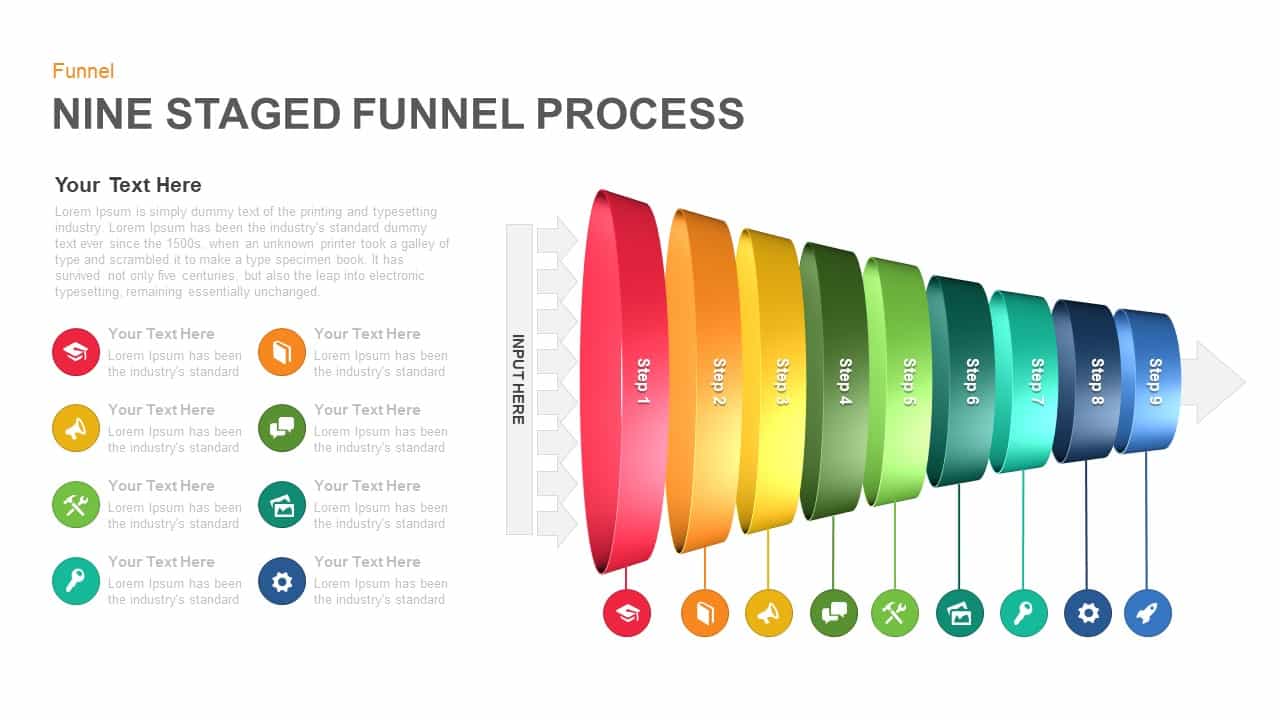
Nine-Stage 3D Funnel Process Diagram Template for PowerPoint & Google Slides
Funnel
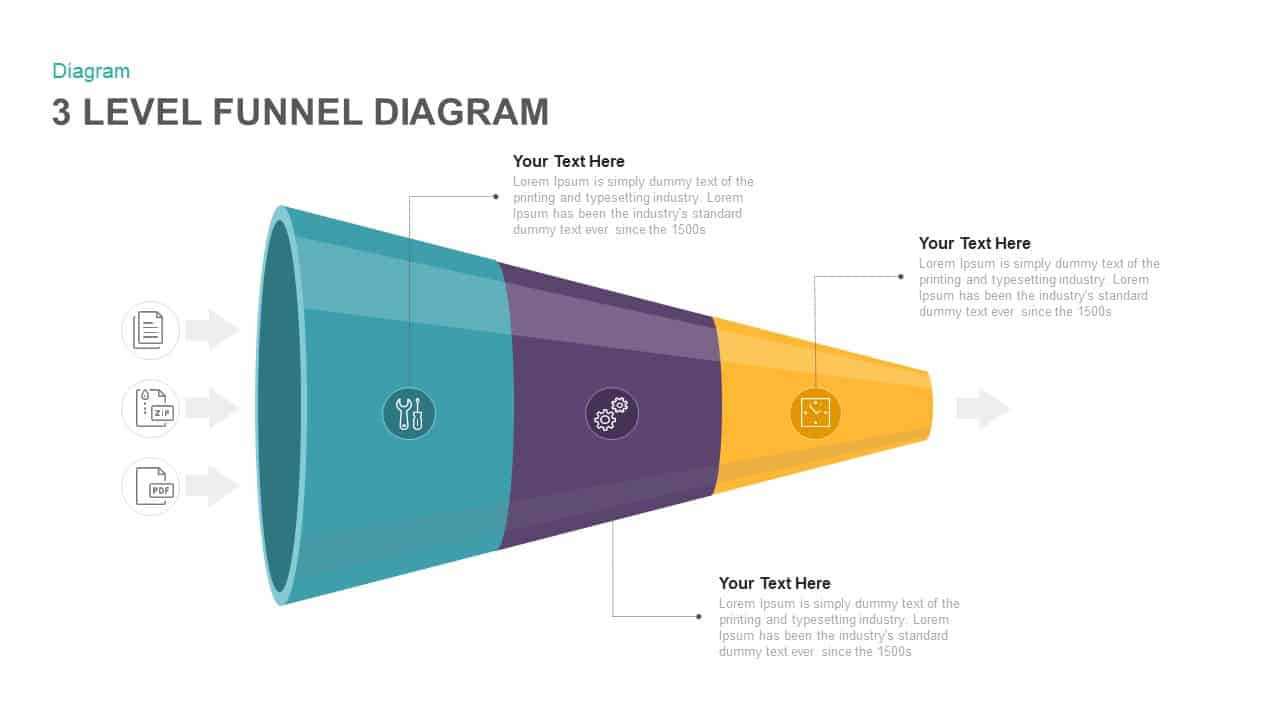
Three Level Funnel Process Diagram Template for PowerPoint & Google Slides
Funnel

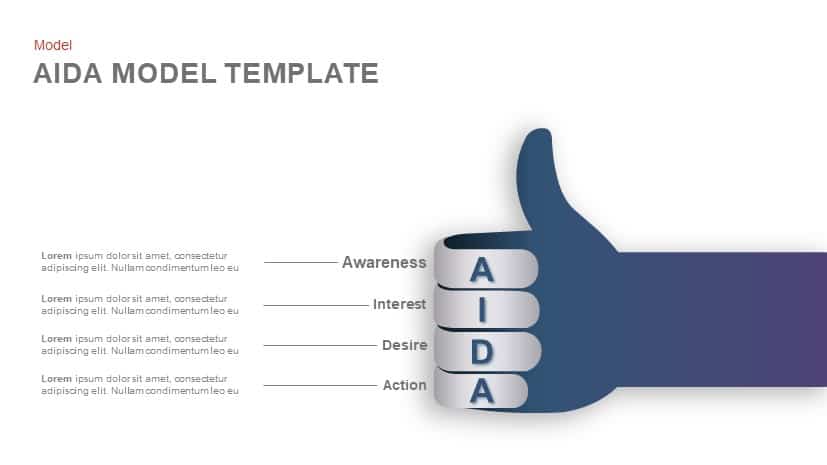
AIDA Model Funnel Thumb Diagram Template for PowerPoint & Google Slides
Process
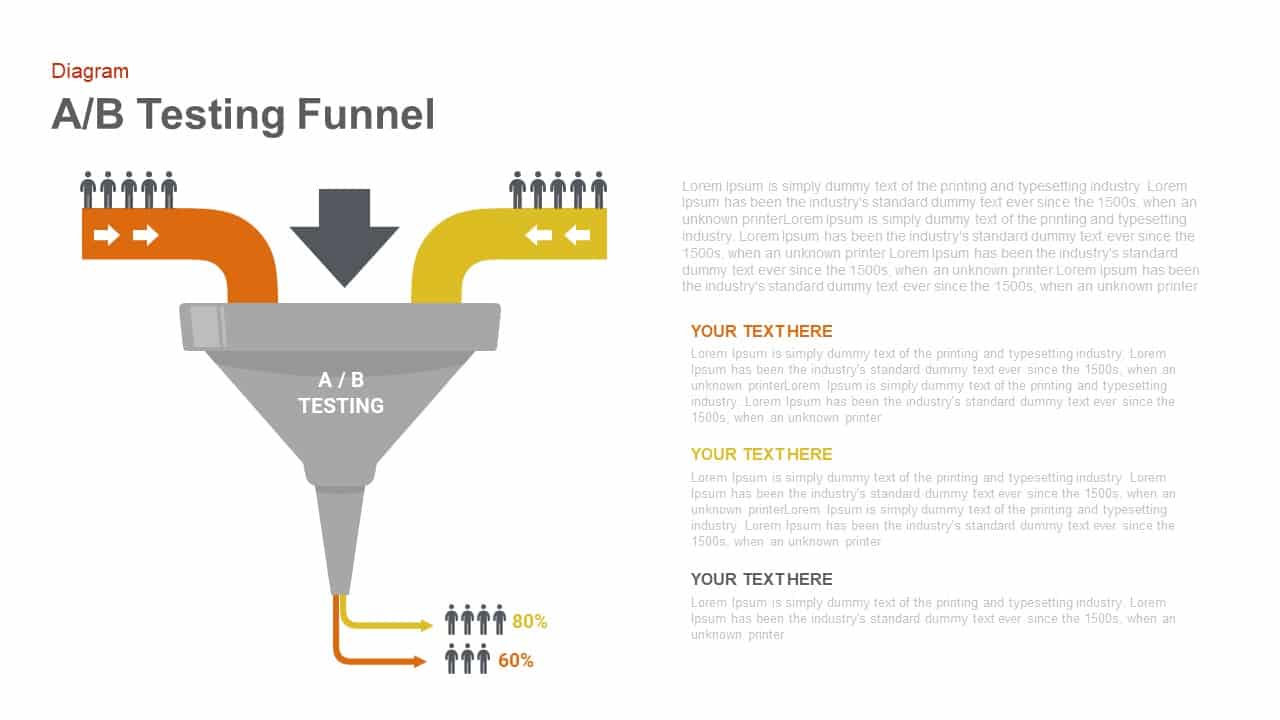
A/B Testing Funnel Diagram Template for PowerPoint & Google Slides
Digital Marketing
Animated Recruiting Funnel Diagram Template for PowerPoint & Google Slides
Funnel
Five-Step Gradient Blue Funnel Diagram Template for PowerPoint & Google Slides
Funnel
Four-Step Spiral Funnel Diagram Template for PowerPoint & Google Slides
Funnel
5-Step Colorful Funnel Diagram Template for PowerPoint & Google Slides
Funnel
Free 4-Step 3D Funnel Diagram Template for PowerPoint & Google Slides
Funnel
Free
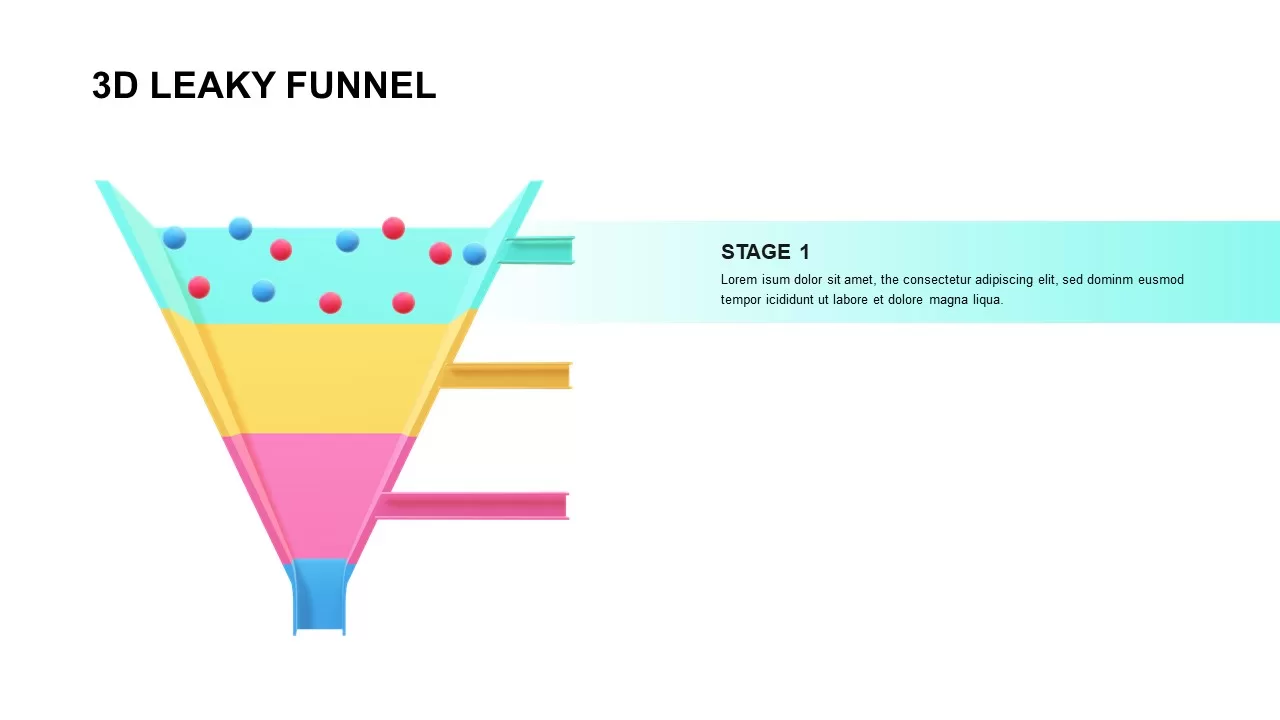
3D Leaky Funnel Diagram template for PowerPoint & Google Slides
Funnel
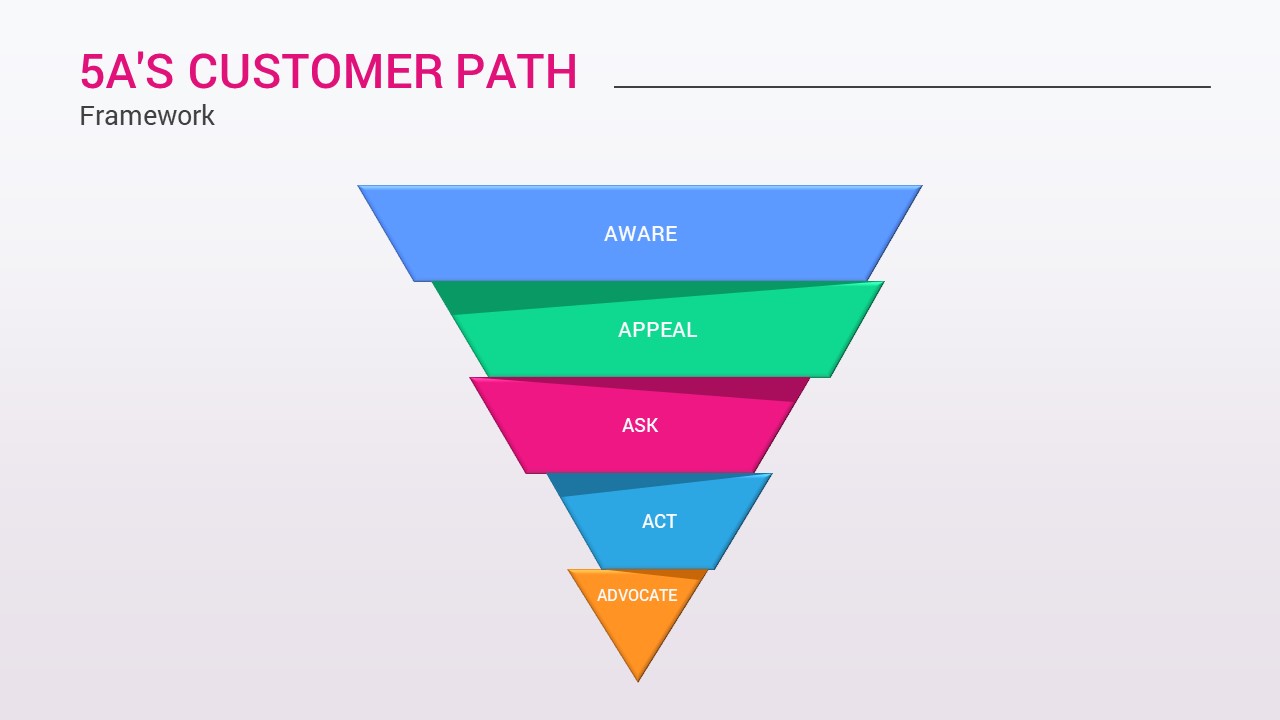
5A’s Customer Path Funnel Diagram Template for PowerPoint & Google Slides
Funnel
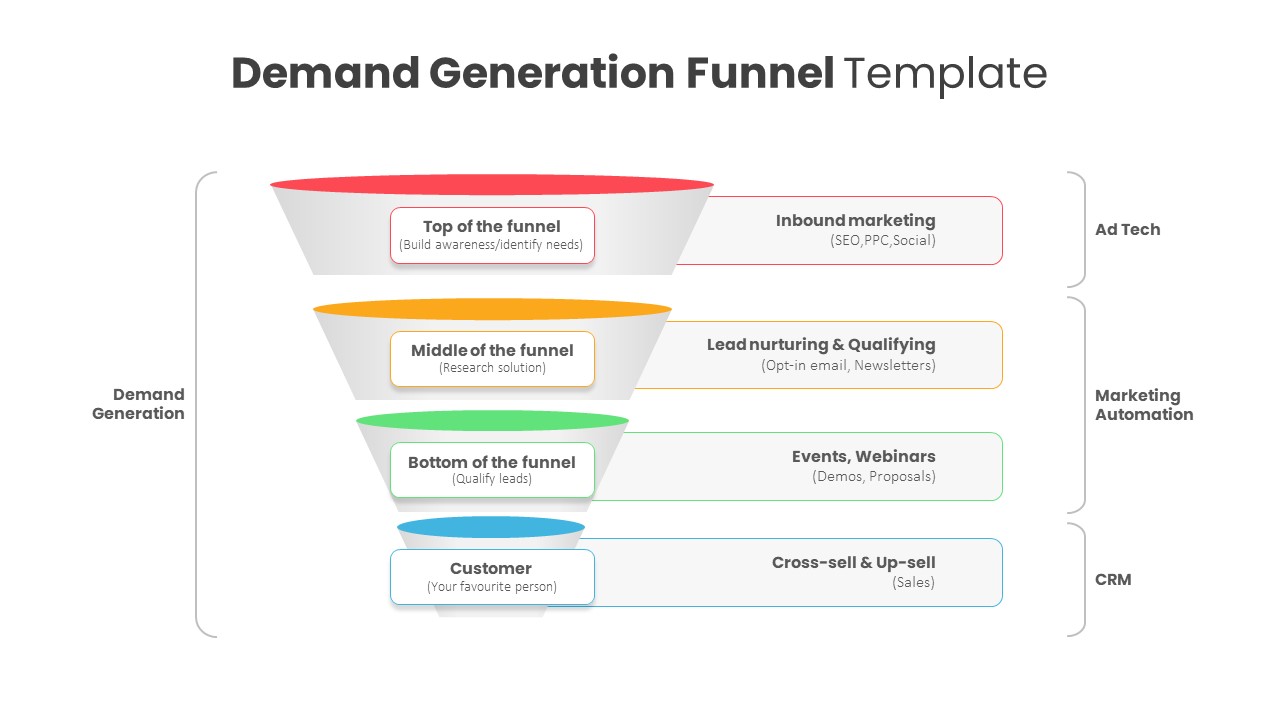
Demand Generation Funnel Diagram Template for PowerPoint & Google Slides
Funnel
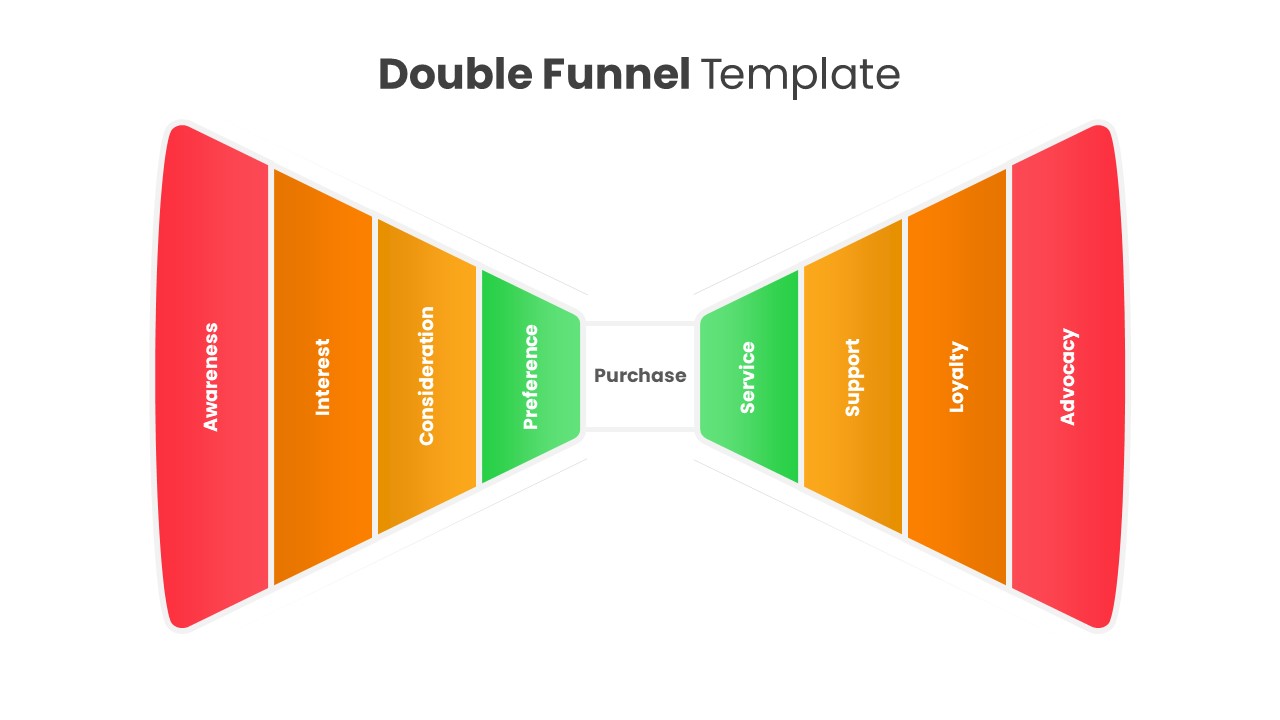
Double Funnel Lifecycle Diagram Template for PowerPoint & Google Slides
Funnel
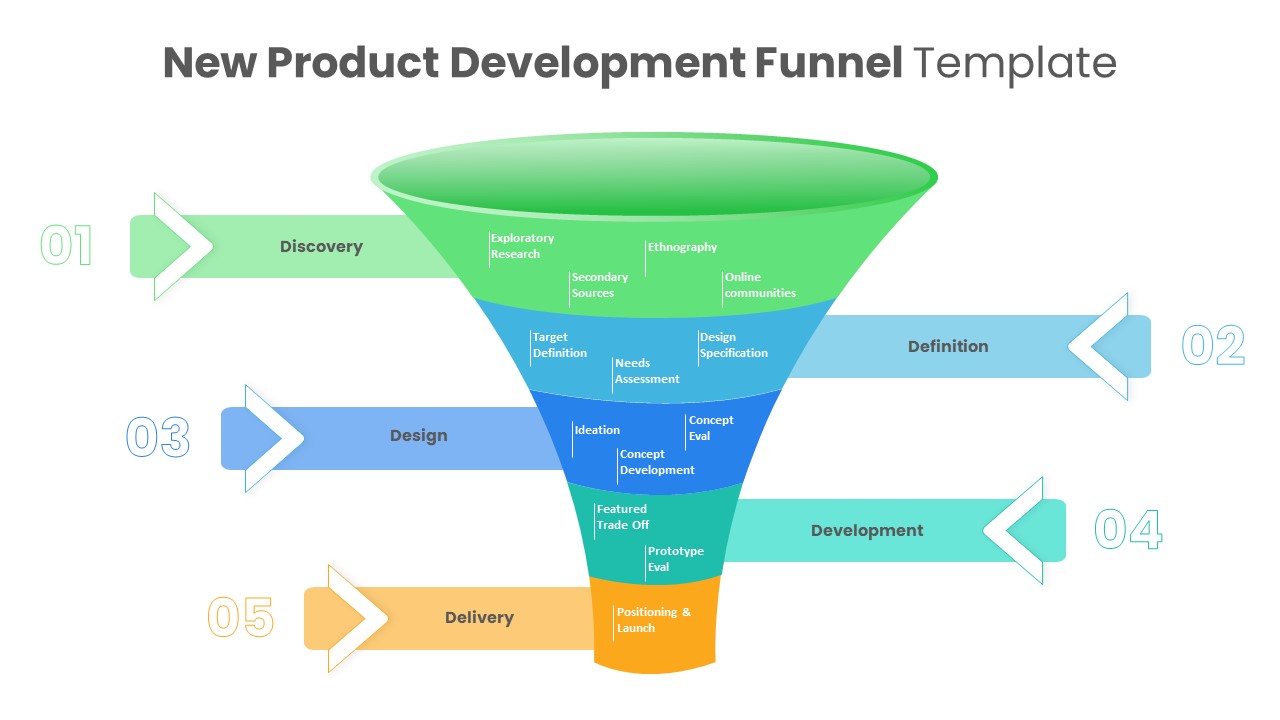
New Product Development Funnel Diagram Template for PowerPoint & Google Slides
Funnel
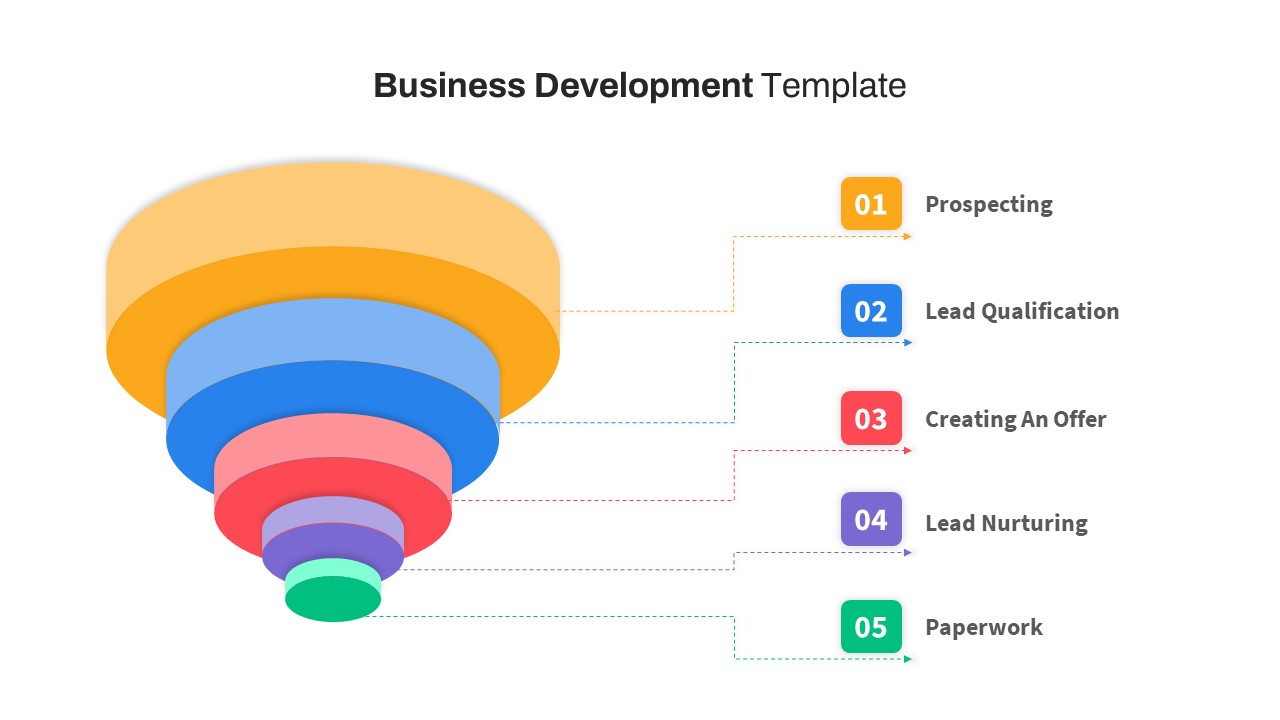
Free Business Development Funnel Diagram Template for PowerPoint & Google Slides
Marketing Funnel
Free
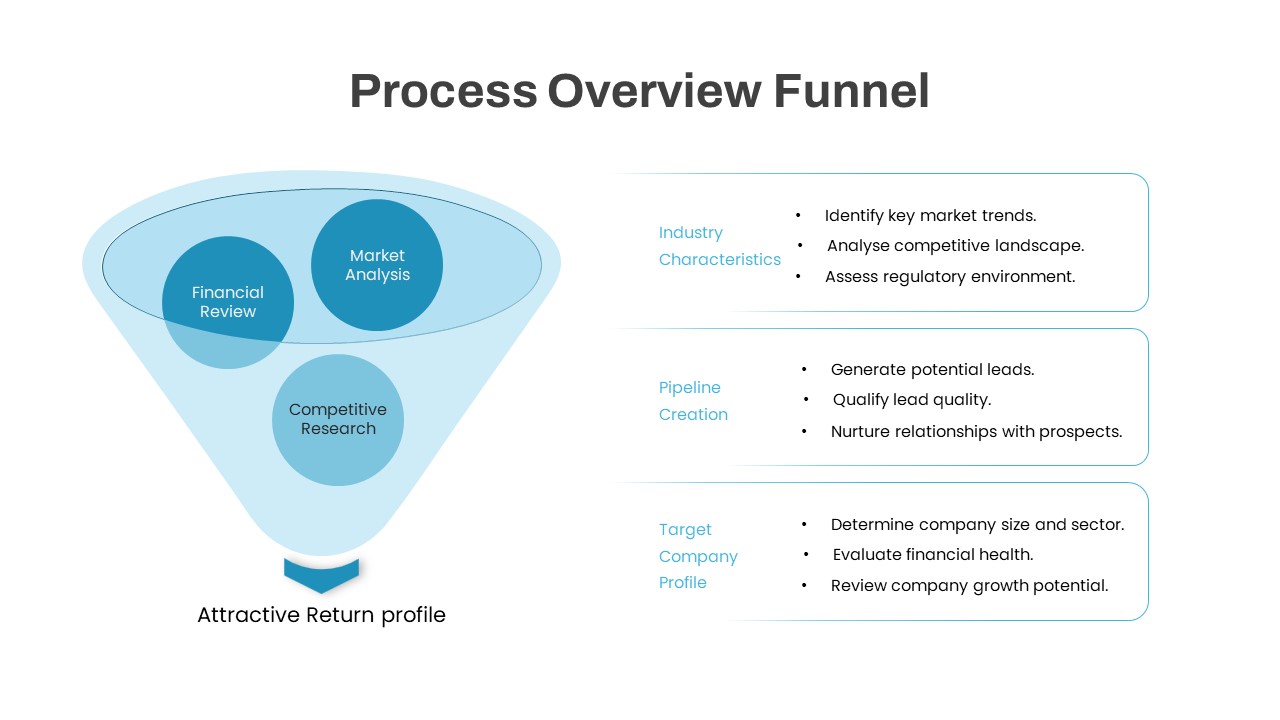
Process Overview Funnel Diagram Template for PowerPoint & Google Slides
Funnel
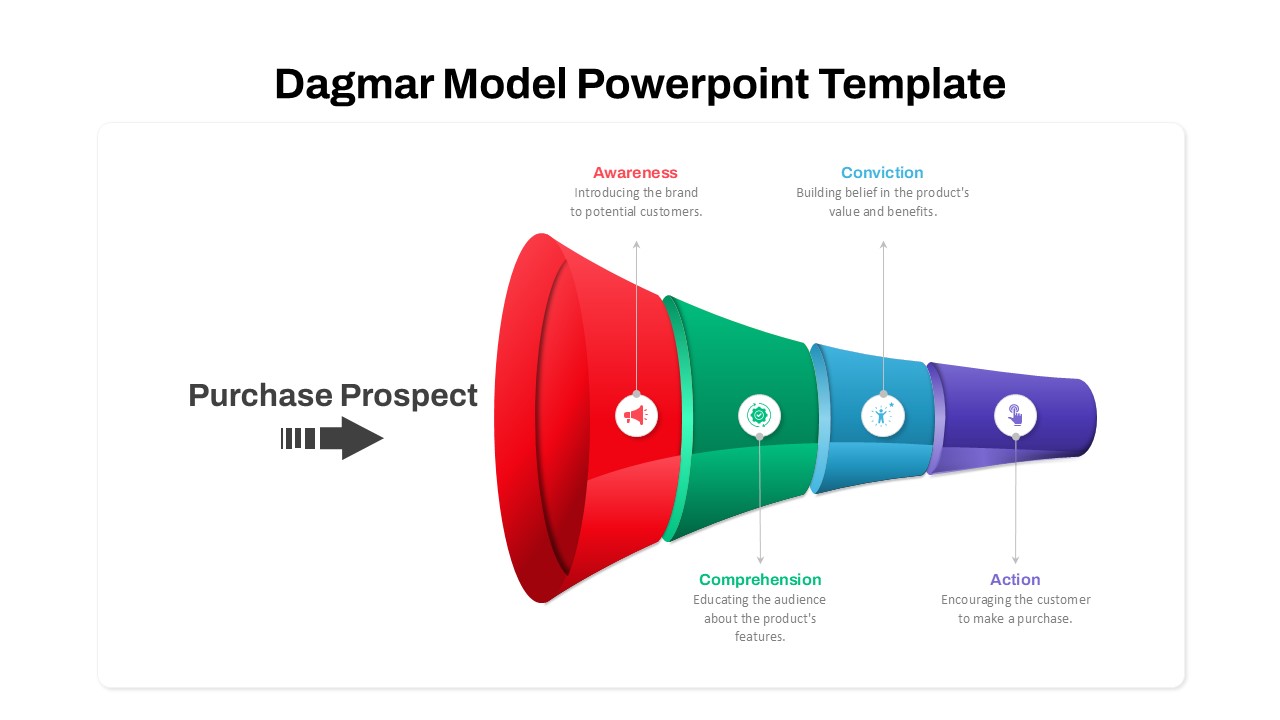
Dagmar Model Marketing Funnel Diagram Template for PowerPoint & Google Slides
Funnel
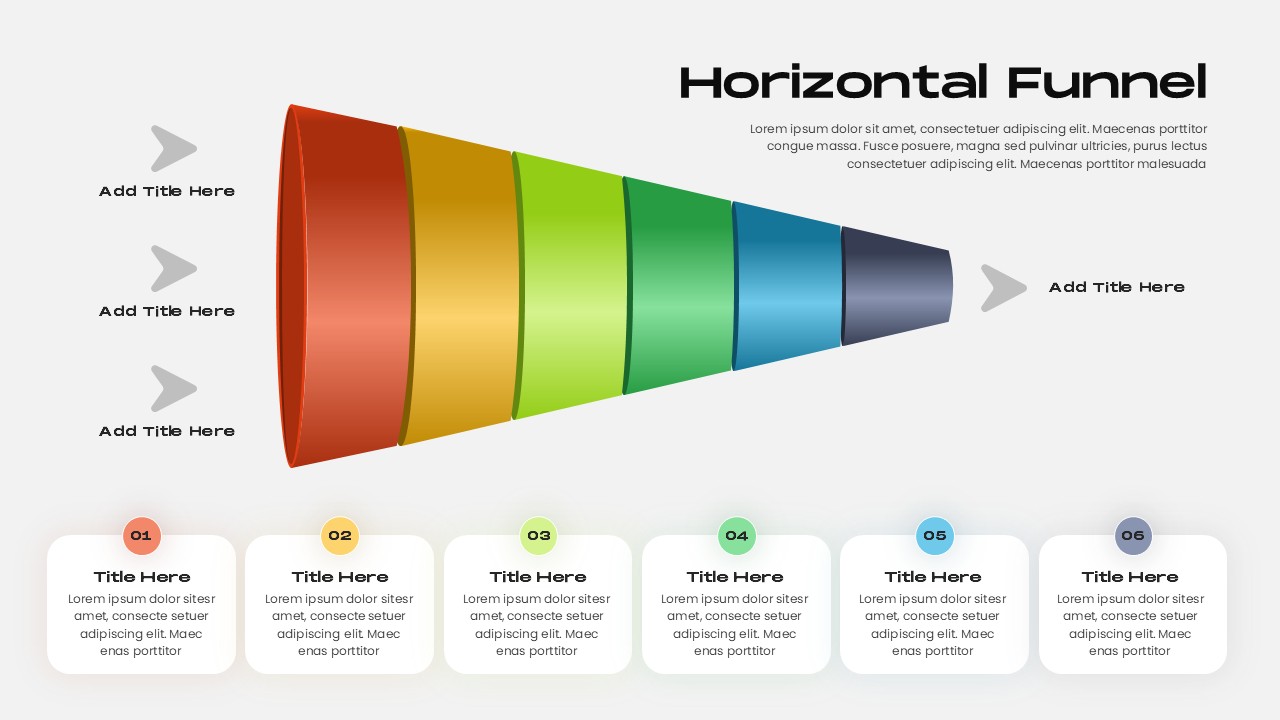
Horizontal Funnel Diagram Process Template for PowerPoint & Google Slides
Funnel
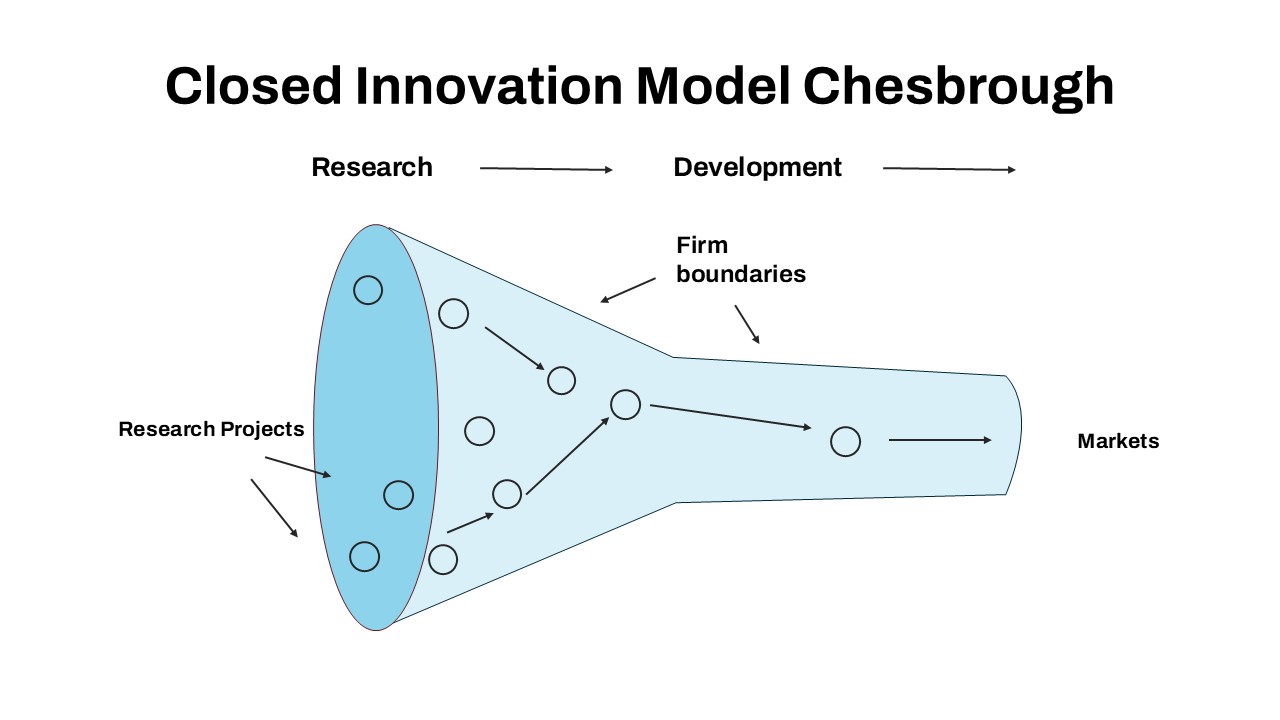
Closed Innovation Model Funnel Diagram Template for PowerPoint & Google Slides
Funnel
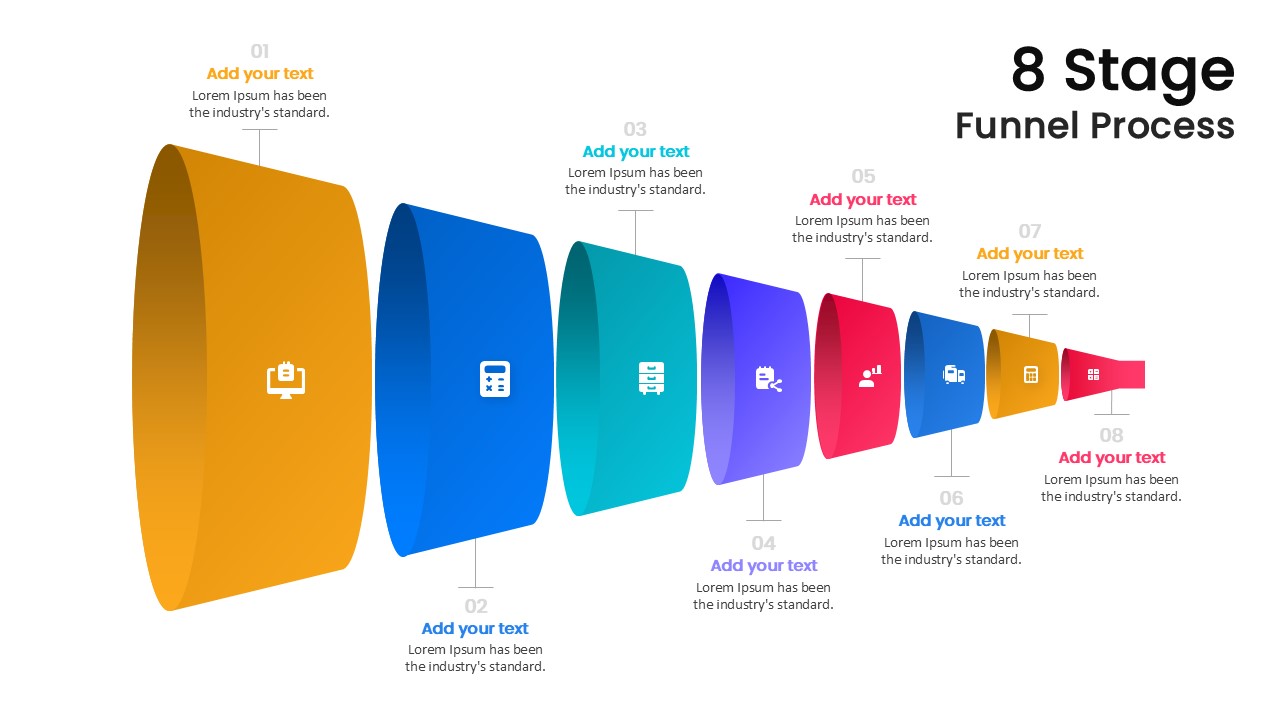
Modern 8-Stage Funnel Process Diagram Template for PowerPoint & Google Slides
Funnel
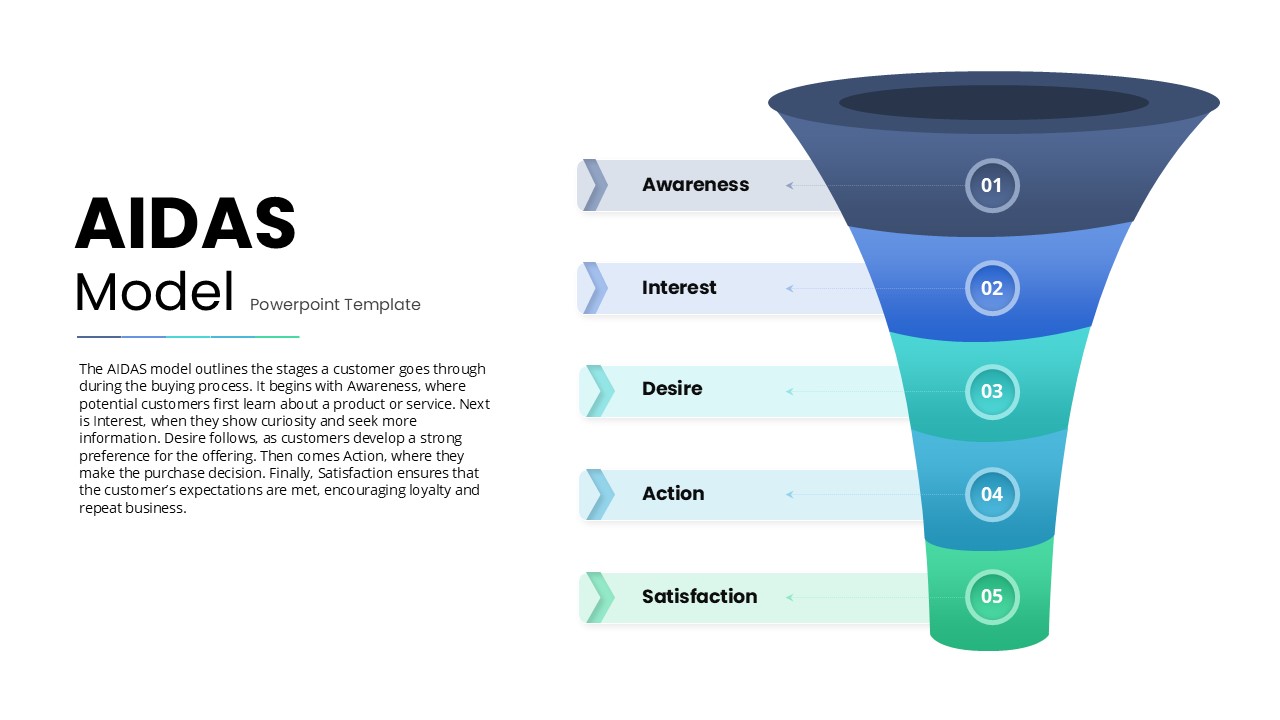
AIDAS Customer Journey Funnel Diagram Template for PowerPoint & Google Slides
Marketing Funnel
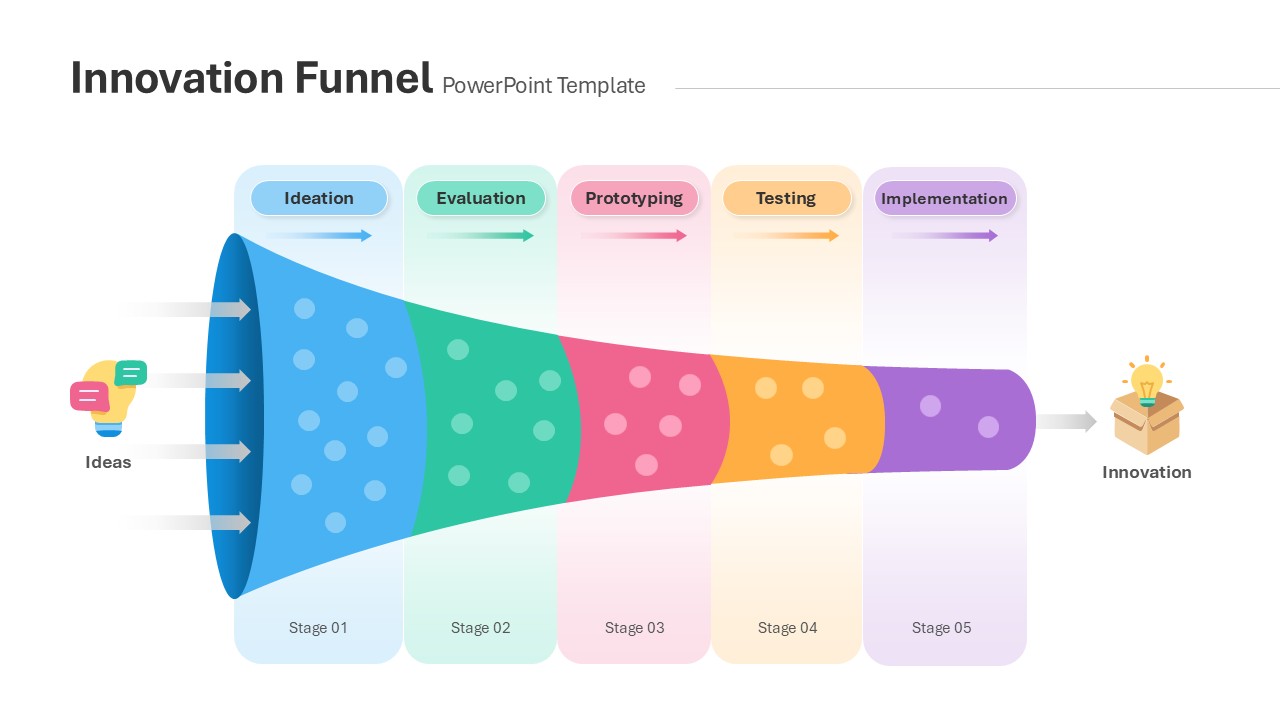
Innovation Funnel Process Diagram Template for PowerPoint & Google Slides
Funnel
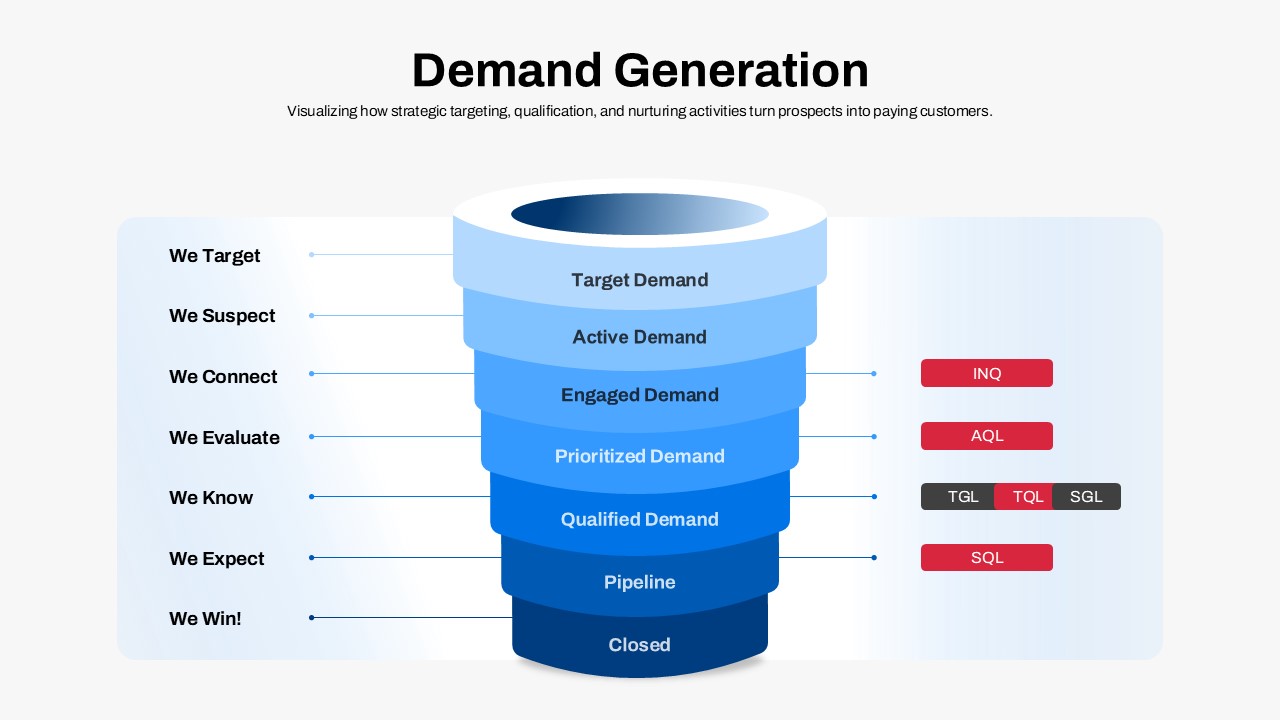
Demand Generation Funnel Process Diagram Template for PowerPoint & Google Slides
Funnel
Five-Step Modern Funnel Diagram Template for PowerPoint & Google Slides
Funnel
Four-Stage Marketing Funnel Diagram Template for PowerPoint & Google Slides
Marketing Funnel
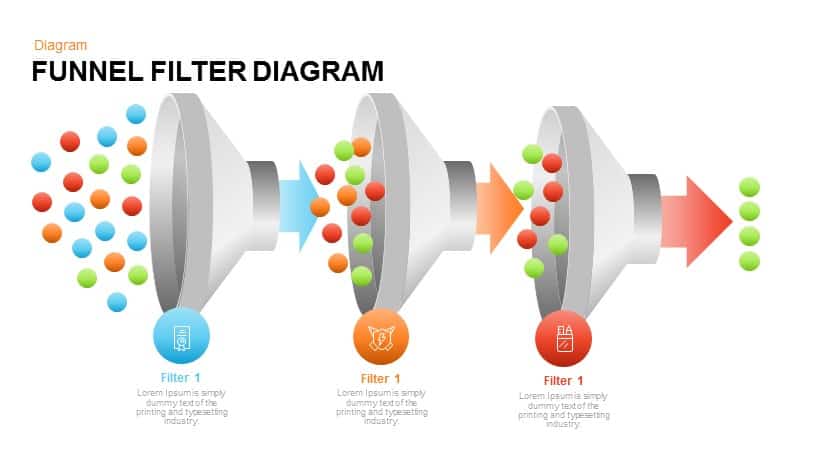
Funnel Filter Diagram for PowerPoint & Google Slides
Funnel
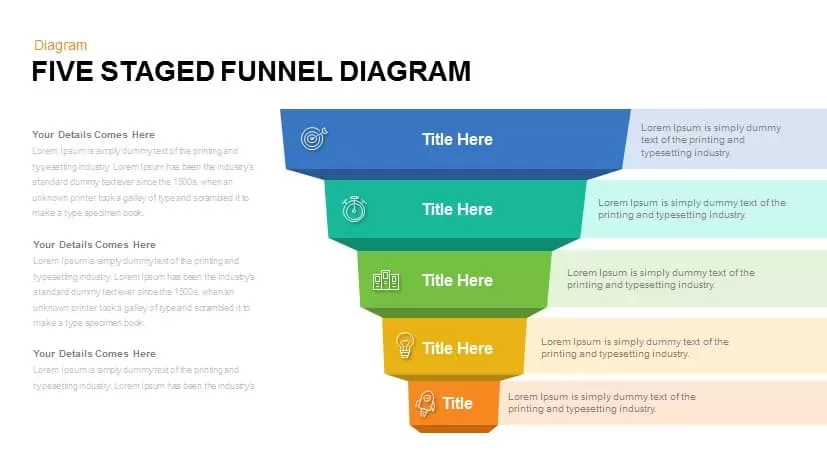
Five Staged Funnel Diagram for PowerPoint & Google Slides
Funnel
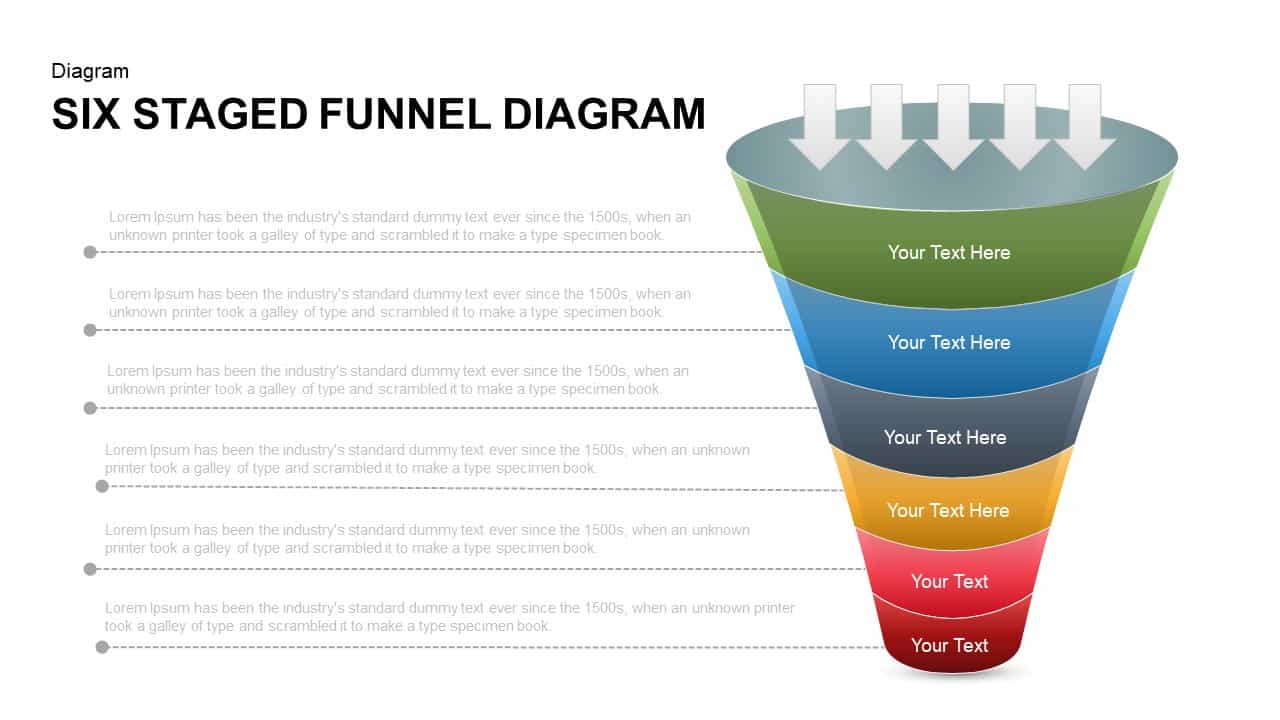
Six Staged Funnel Diagram for PowerPoint & Google Slides
Funnel
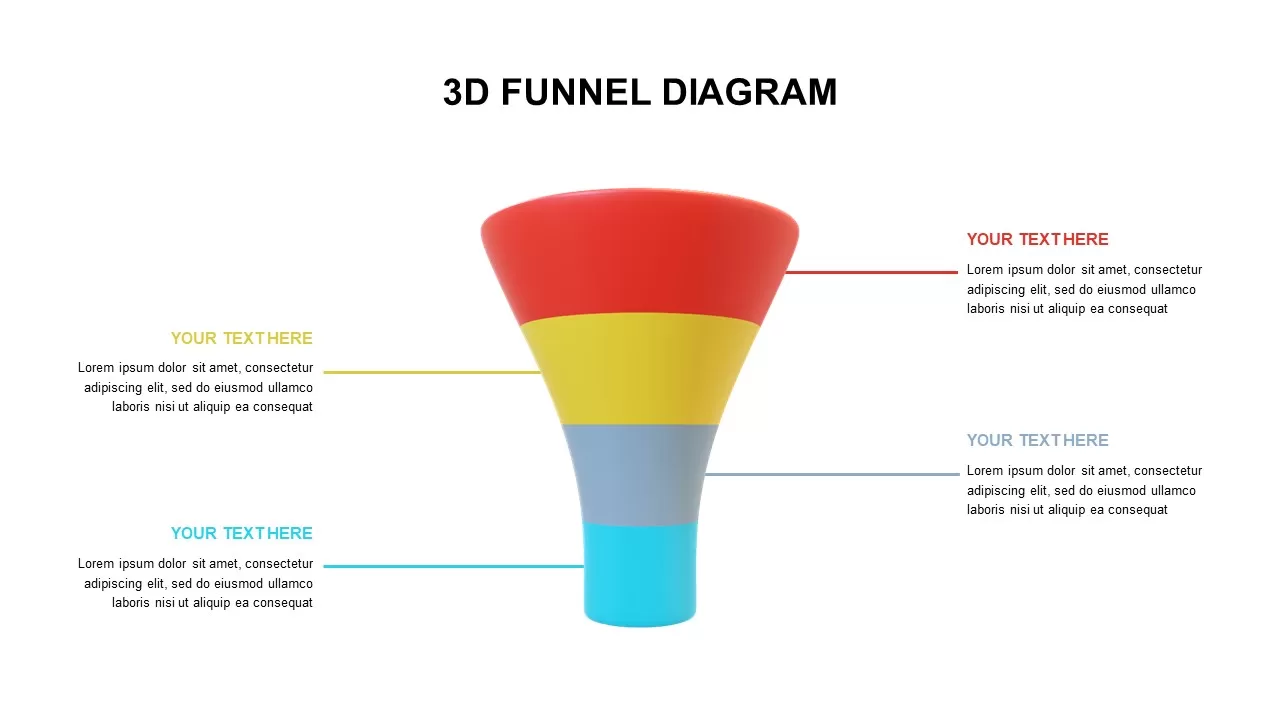
3D Funnel Diagram Infographics for PowerPoint & Google Slides
Funnel
Circle Segment Sales Metrics Infographic Template for PowerPoint & Google Slides
Circular
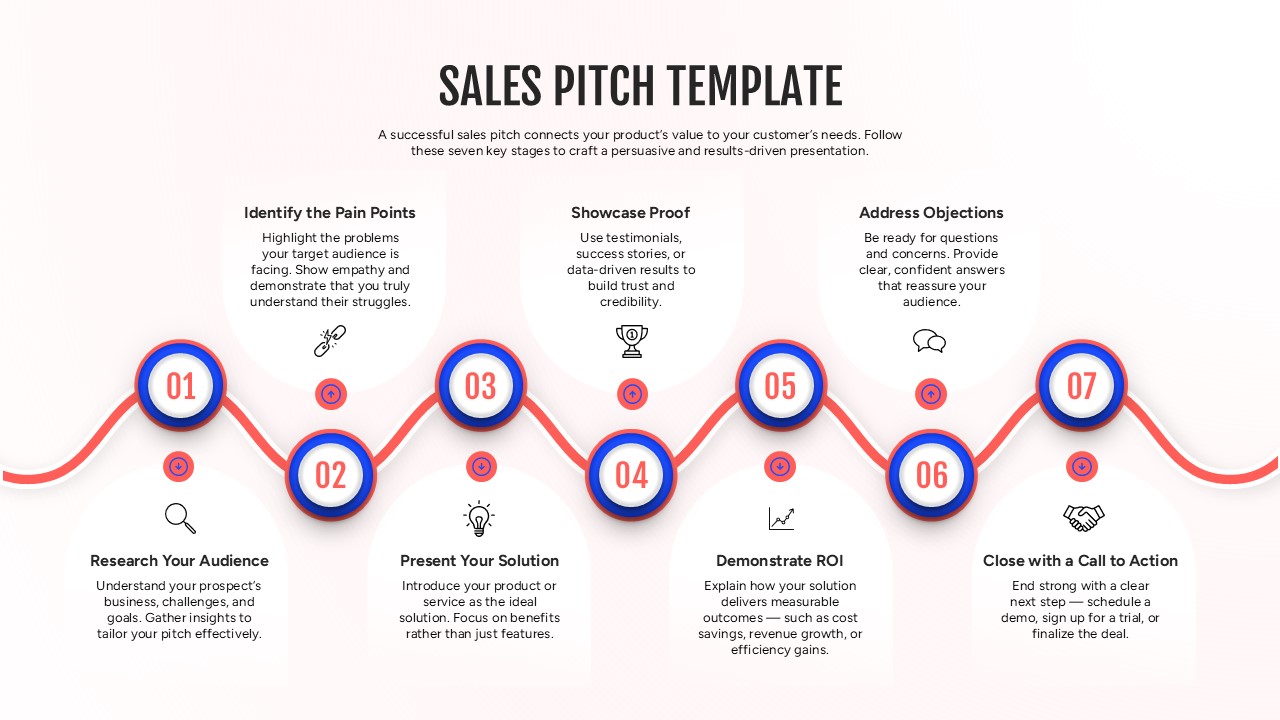
Sales Pitch Roadmap Infographic Template for PowerPoint & Google Slides
Marketing
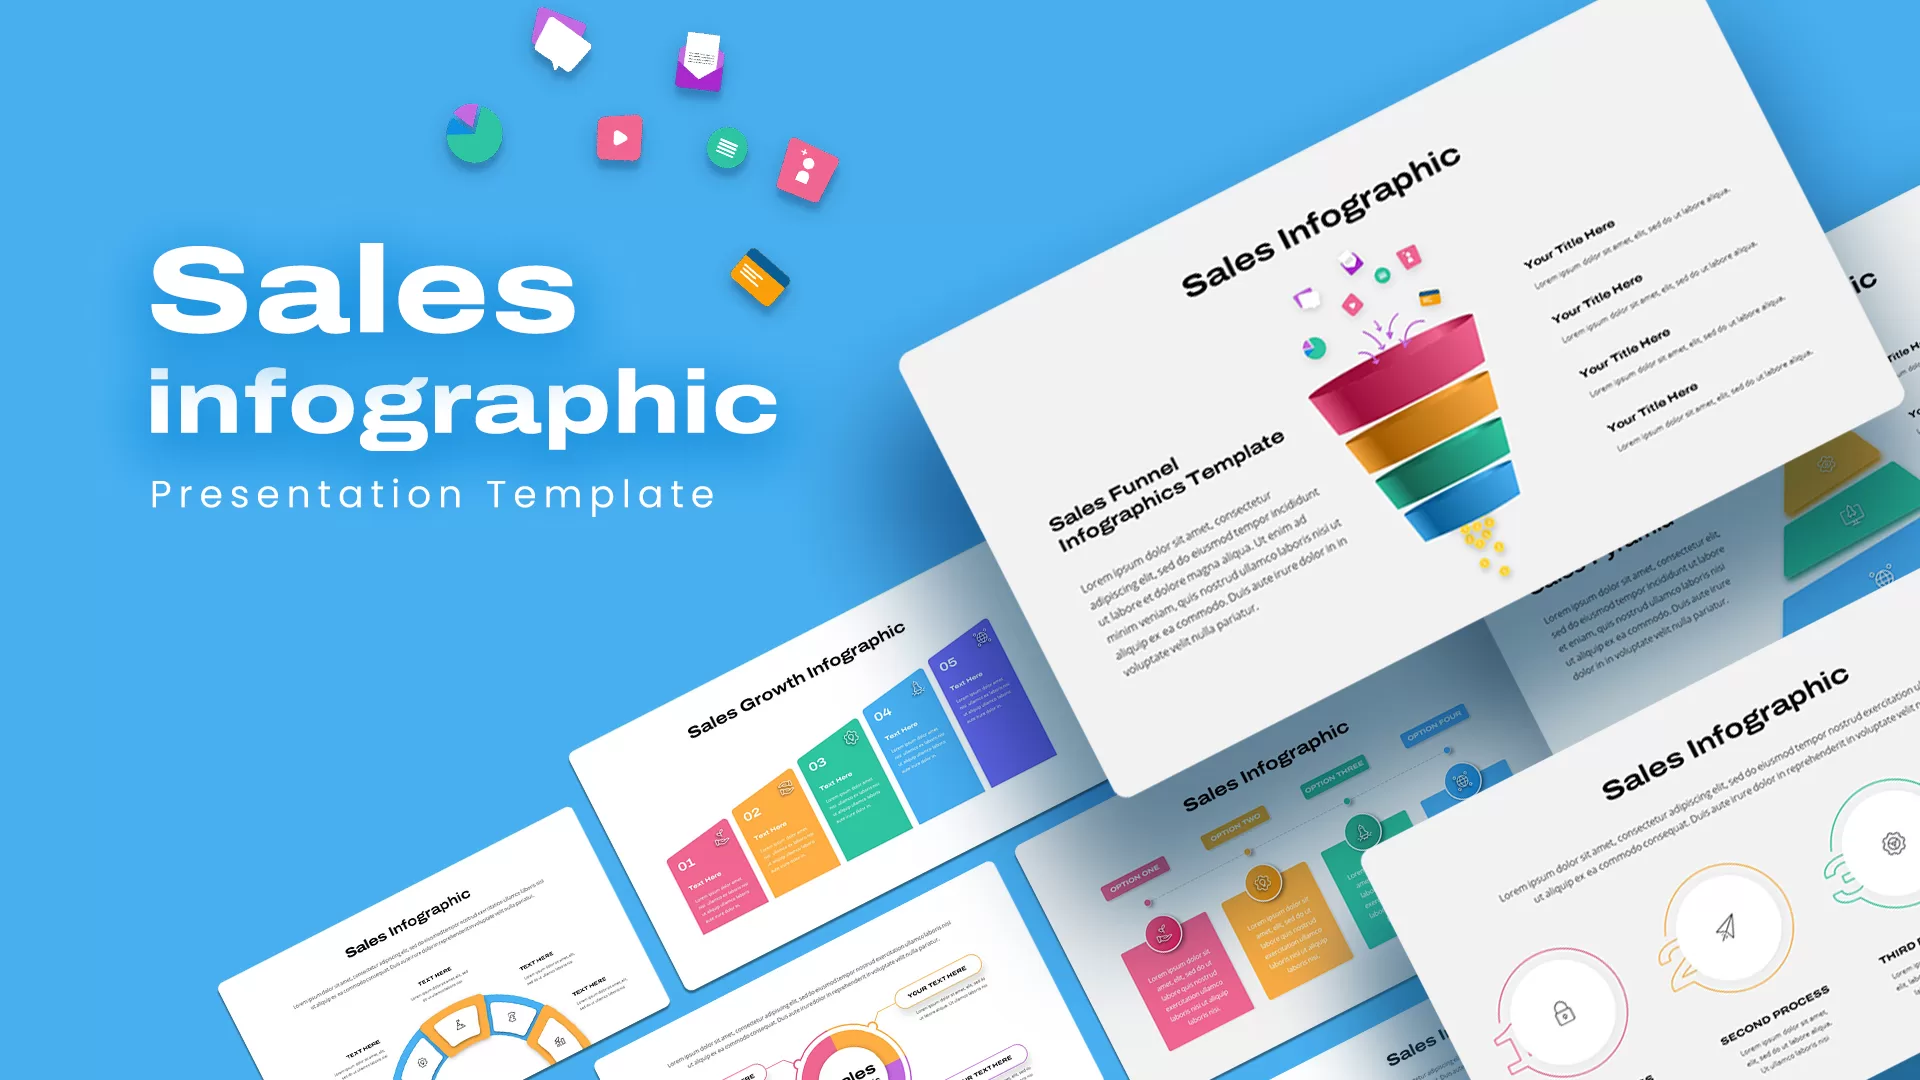
Sales Infographic pack for PowerPoint & Google Slides
Business

Innovation Ambition Matrix & Funnel Strategy Slides for PowerPoint & Google Slides
Process
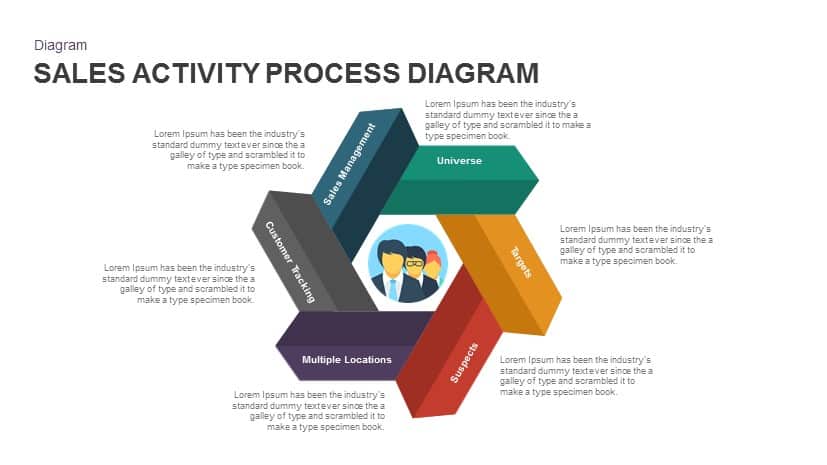
Sales Activity Hexagon Process Diagram Template for PowerPoint & Google Slides
Process
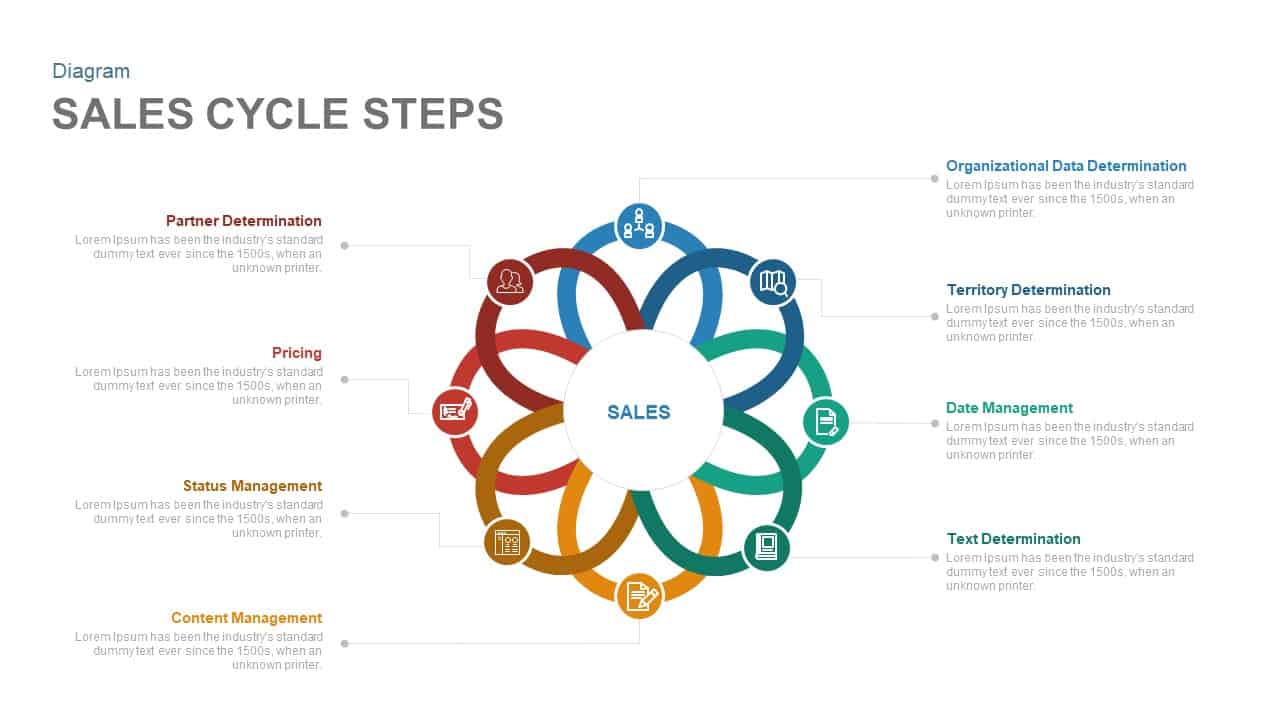
Eight-Step Sales Cycle Diagram Template for PowerPoint & Google Slides
Process
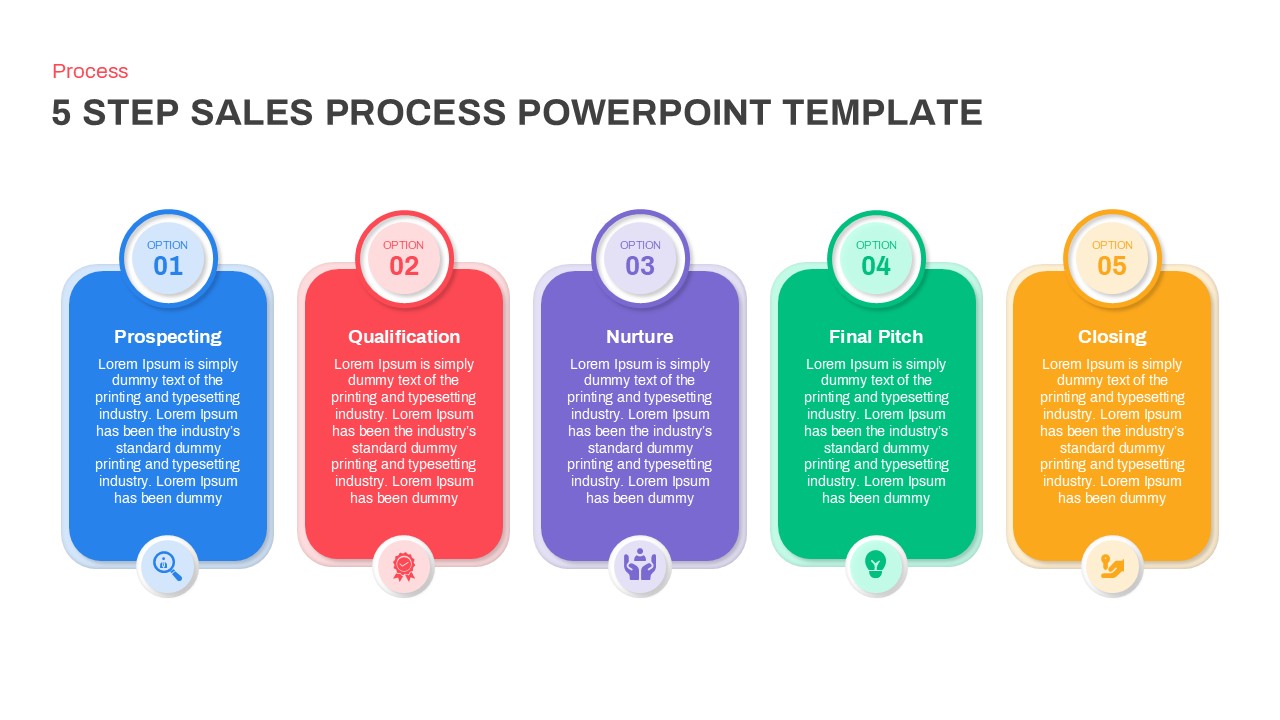
Modern 5-Step Sales Process Diagram Template for PowerPoint & Google Slides
Process
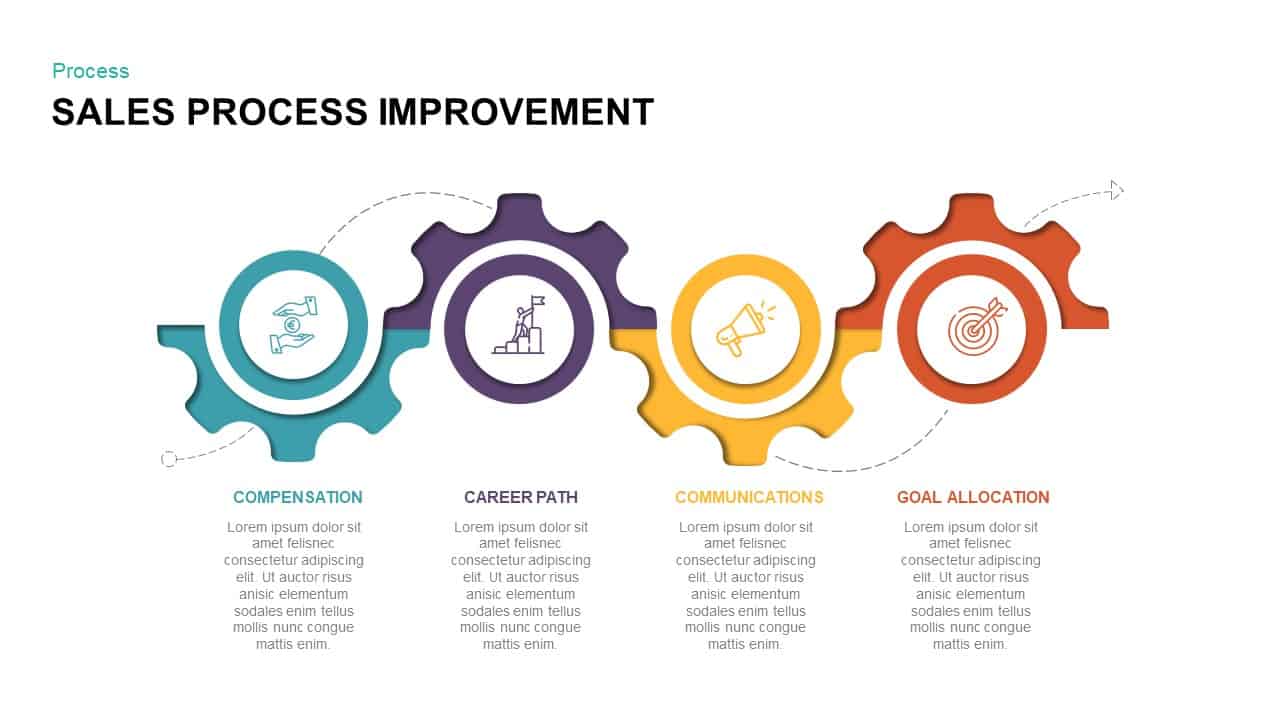
Sales Process Improvement Gear Diagram Template for PowerPoint & Google Slides
Process
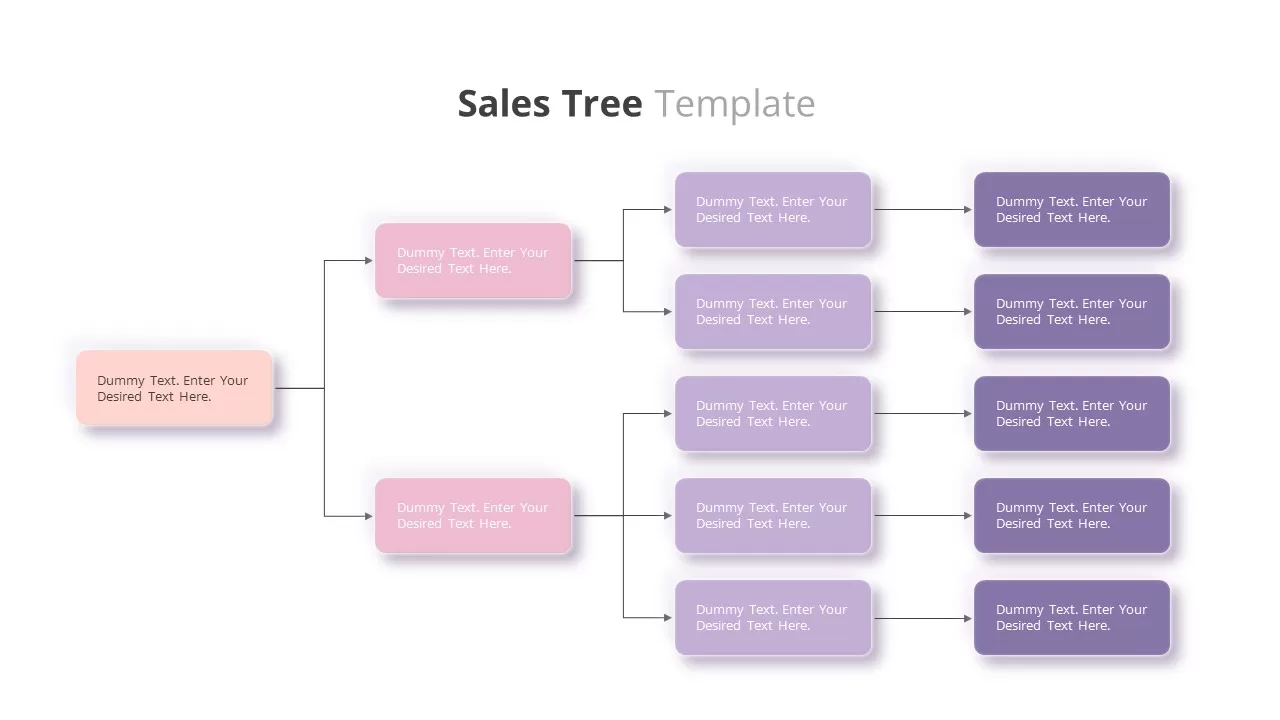
Customizable Sales Tree Diagram Template for PowerPoint & Google Slides
Org Chart
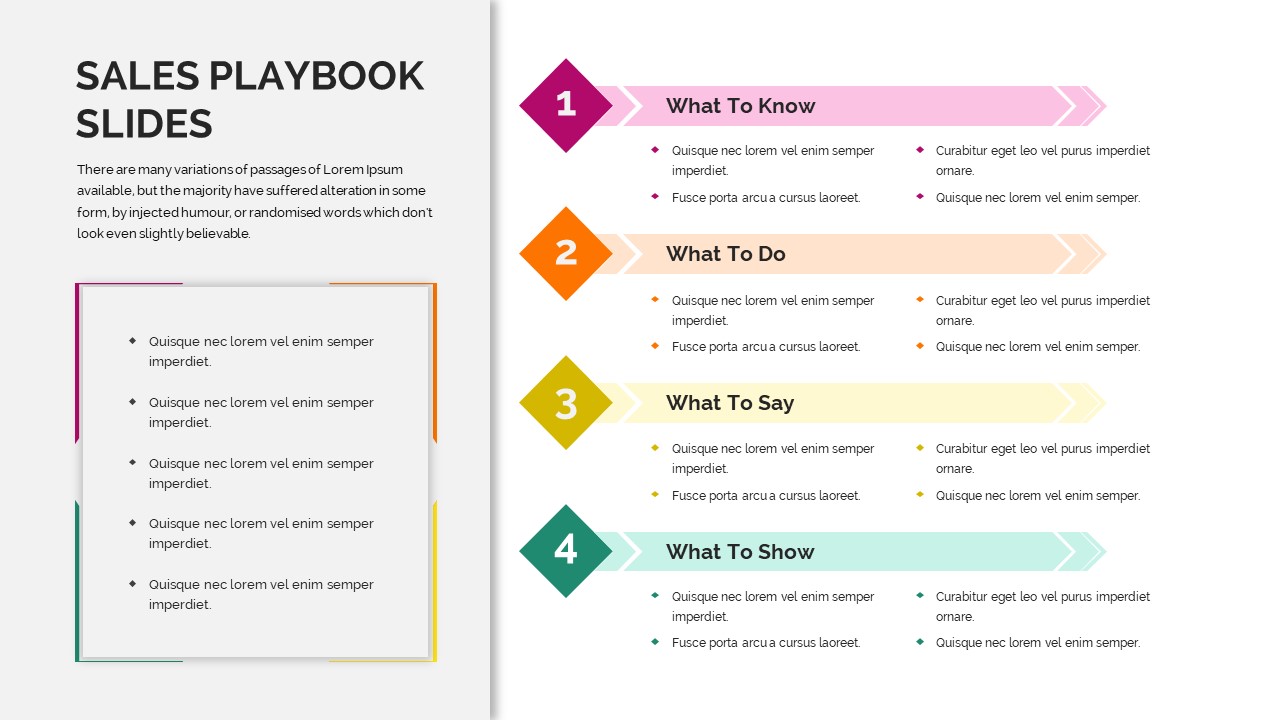
Sales Playbook Process Steps Diagram Template for PowerPoint & Google Slides
Marketing
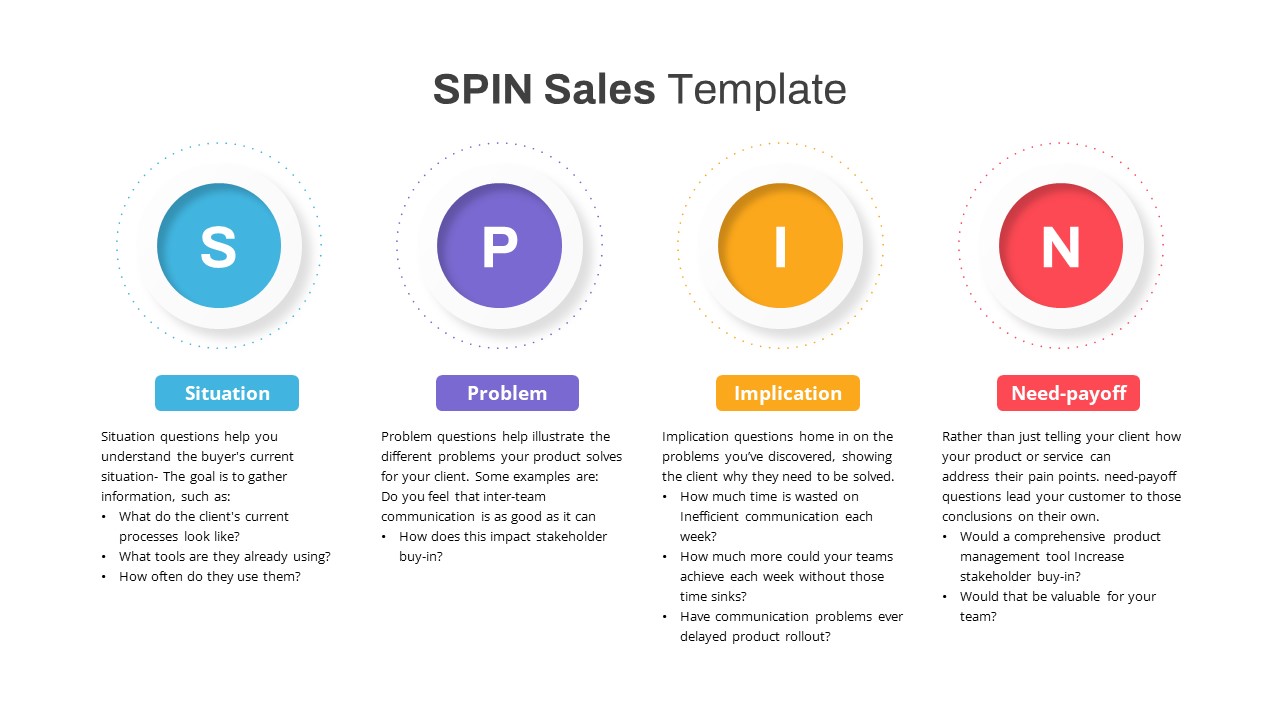
SPIN Sales Methodology Diagram Template for PowerPoint & Google Slides
Process
Data-Driven Sales Strategy Diagram Template for PowerPoint & Google Slides
Marketing
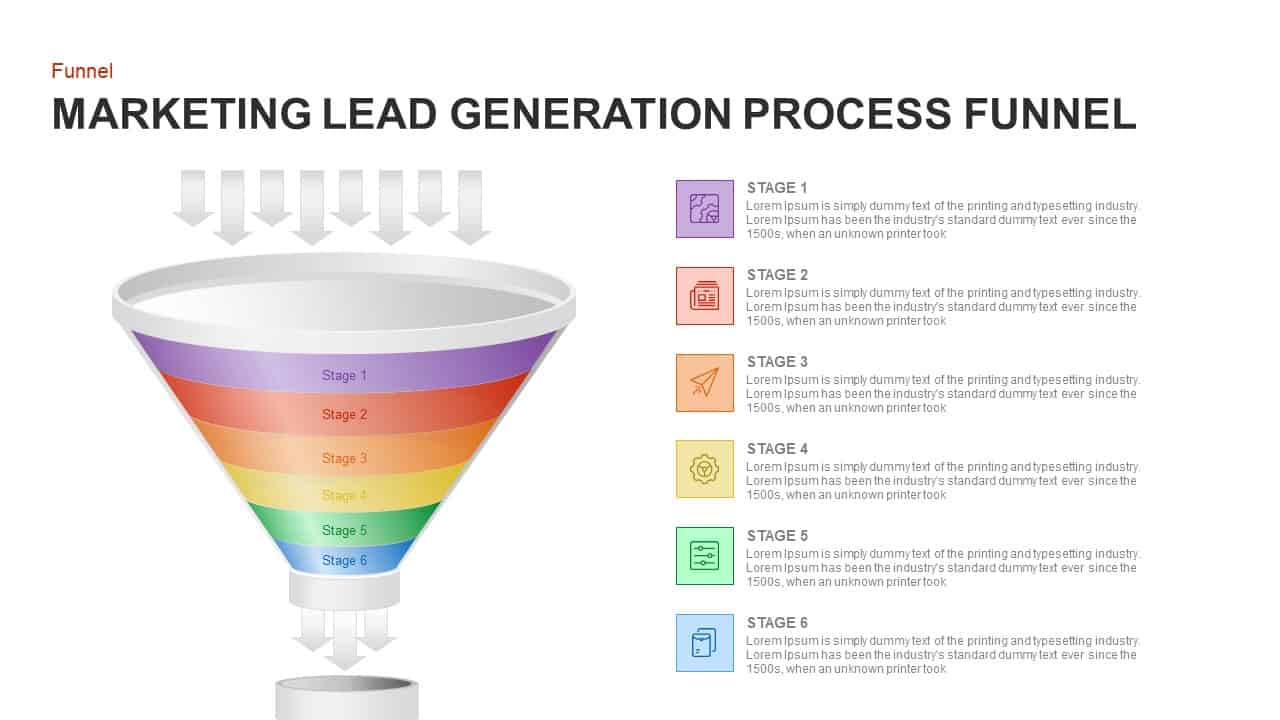
Marketing Lead Generation Process Funnel PowerPoint Template for PowerPoint & Google Slides
Funnel
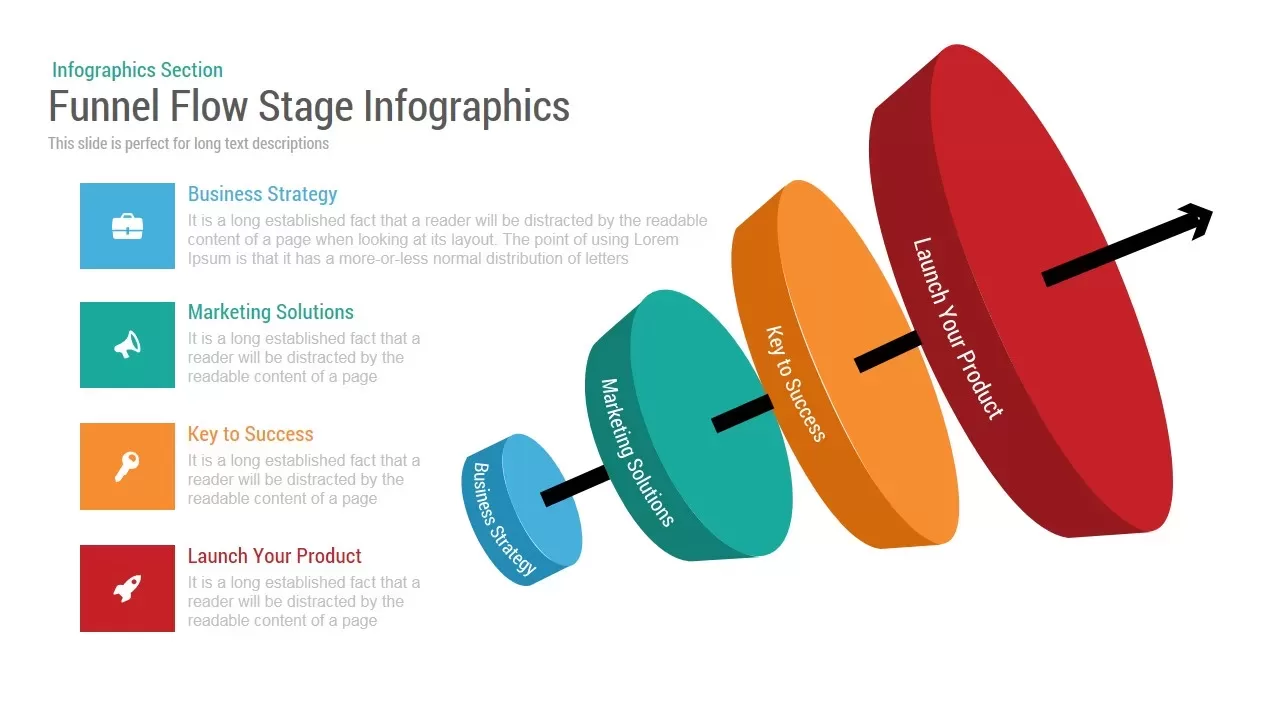
Funnel Flow Stage Infographics template for PowerPoint & Google Slides
Funnel
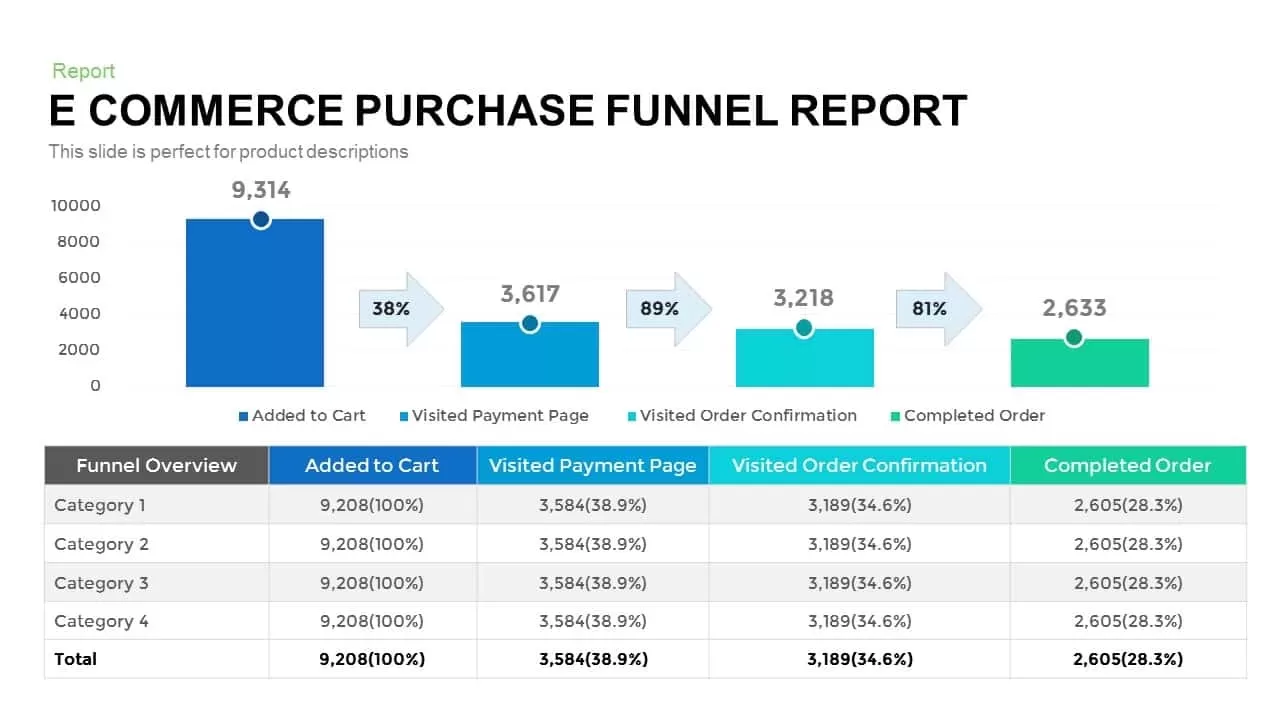
E-commerce Purchase Funnel Report template for PowerPoint & Google Slides
Funnel
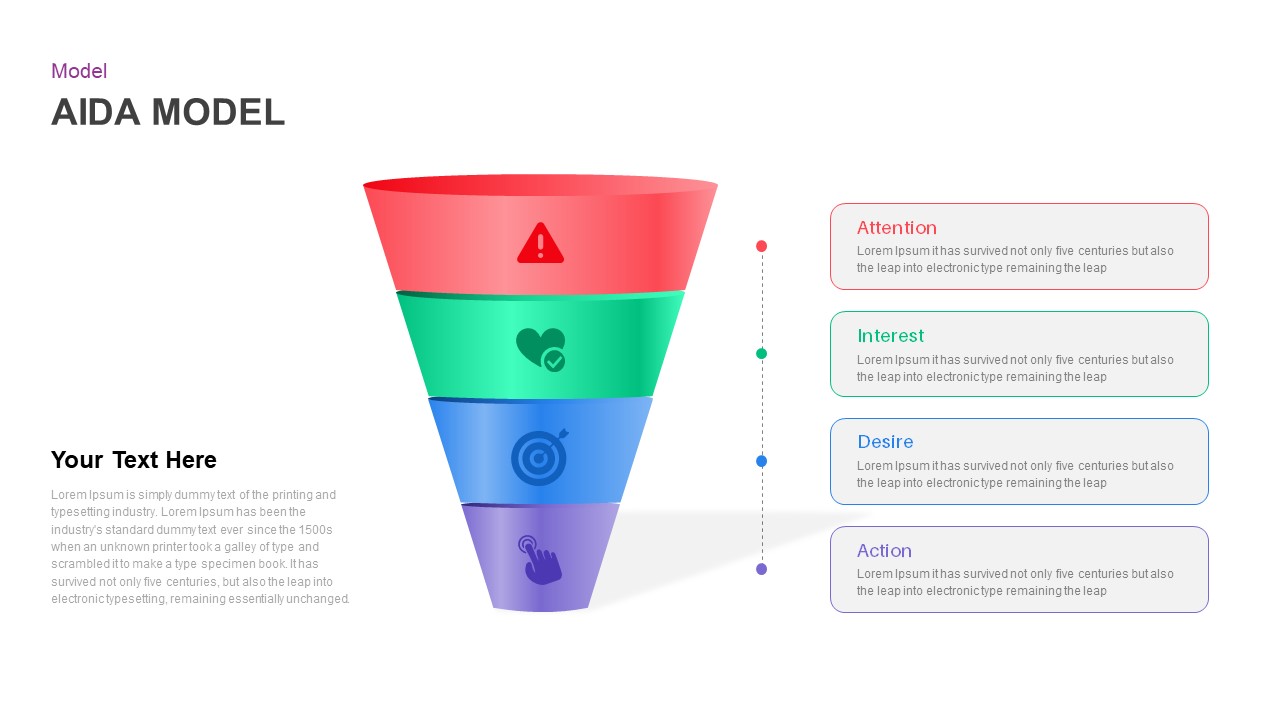
AIDA Marketing Funnel Model Template for PowerPoint & Google Slides
Marketing
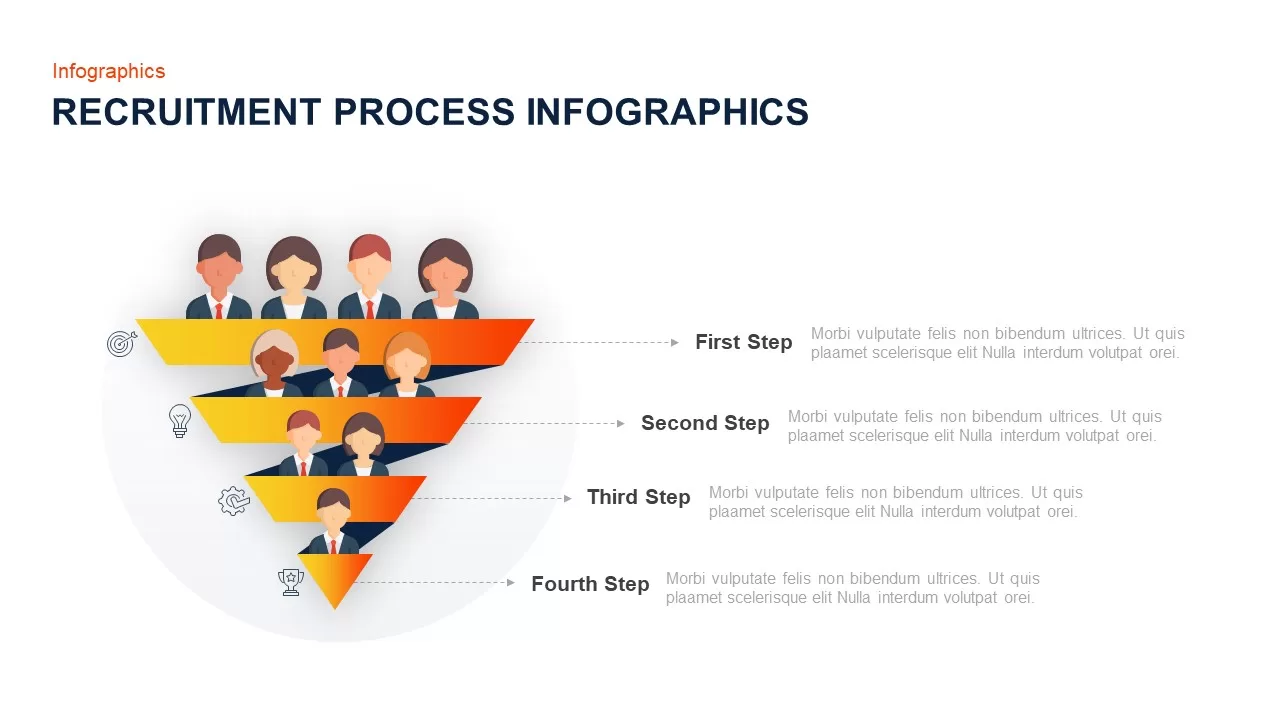
Recruitment Process Funnel Infographics Template for PowerPoint & Google Slides
Recruitment
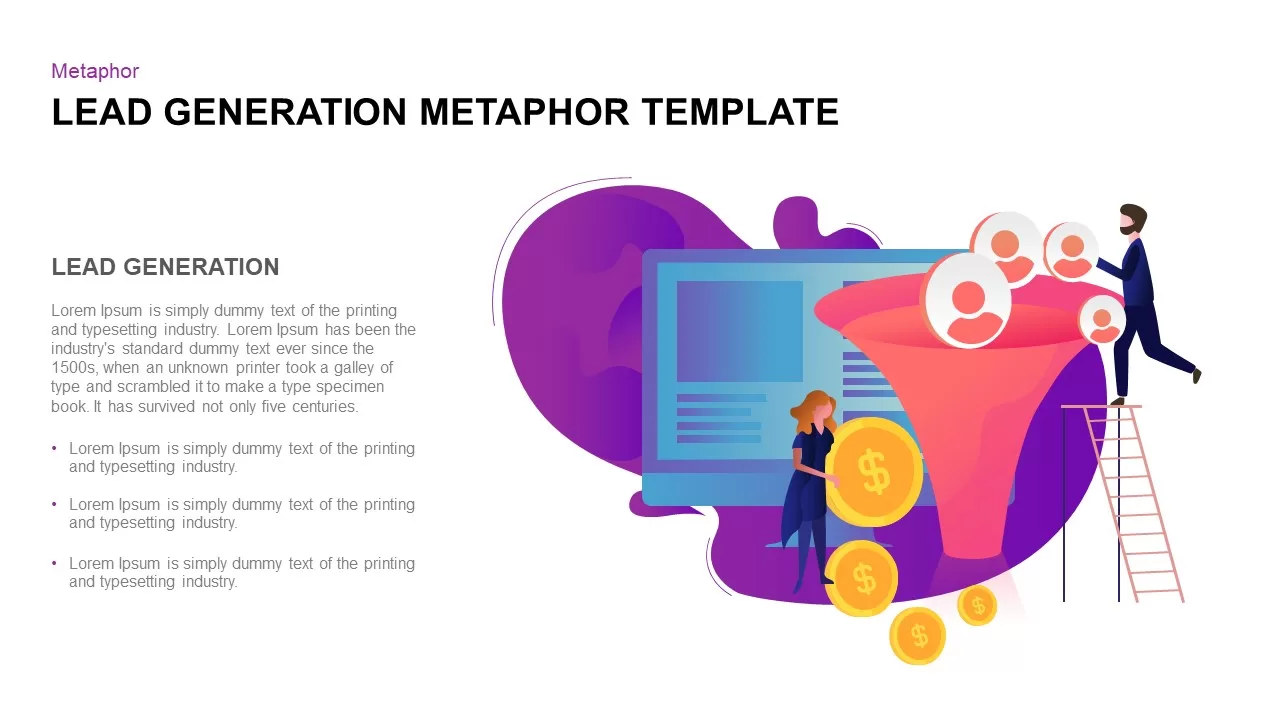
Lead Generation Funnel Metaphor Template for PowerPoint & Google Slides
Marketing Funnel
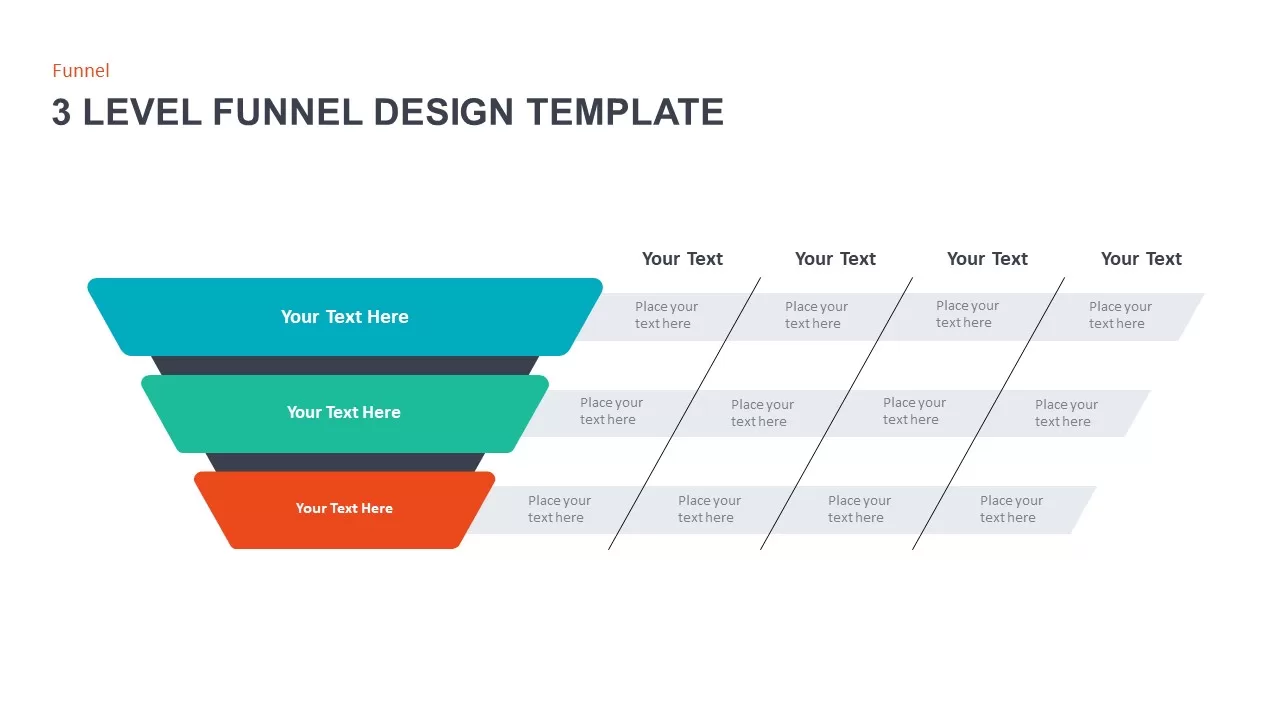
3 Level Funnel Design Visualization Template for PowerPoint & Google Slides
Funnel
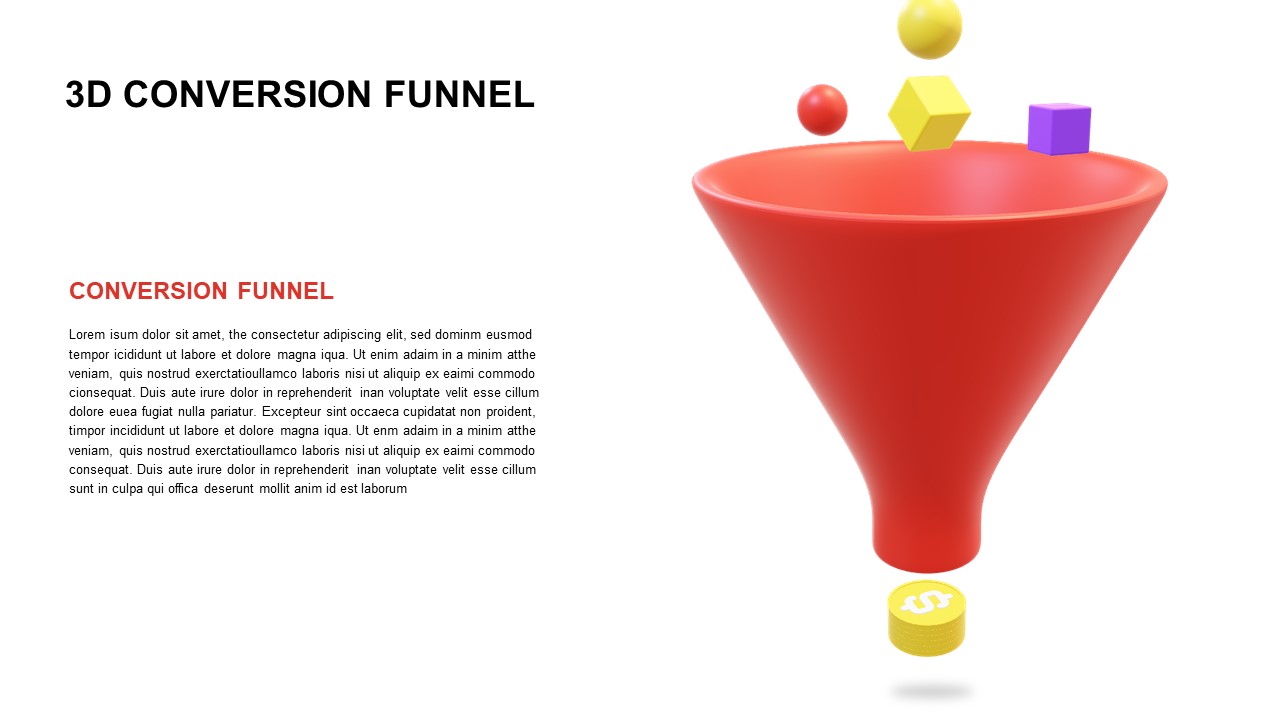
Free 3D Conversion Funnel Overview template for PowerPoint & Google Slides
Funnel
Free
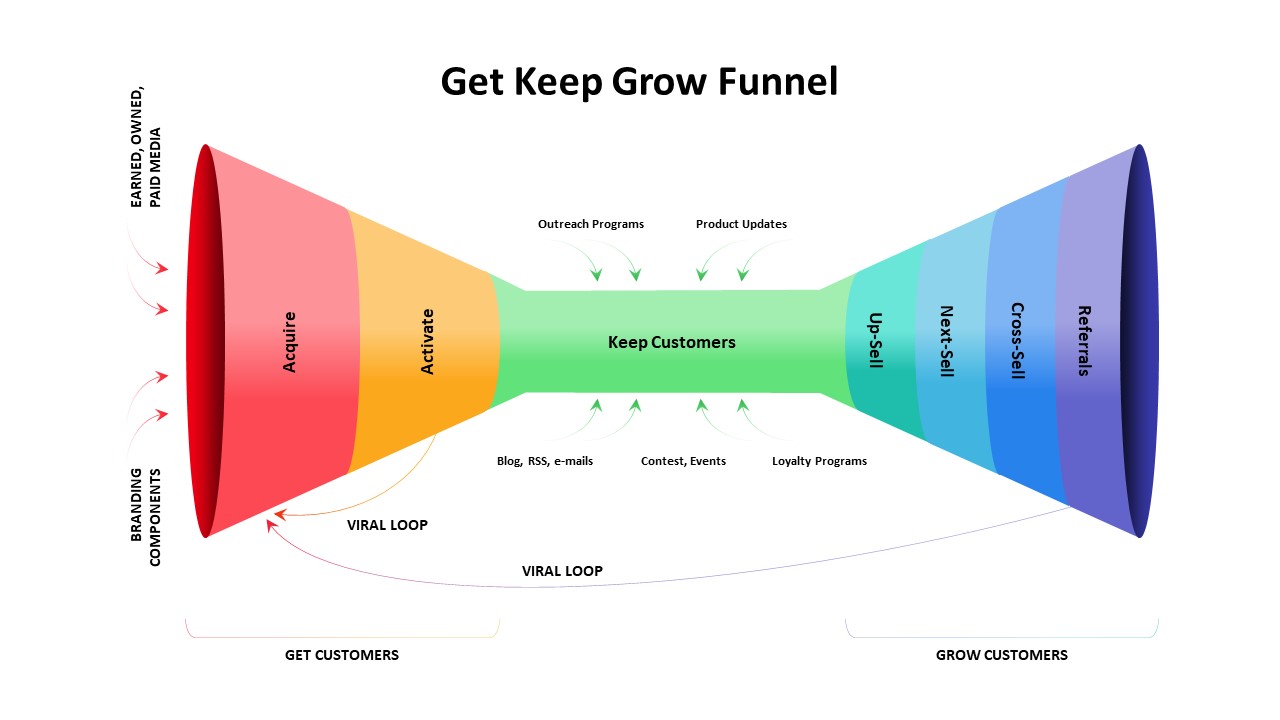
Get Keep Grow Customer Funnel Lifecycle Template for PowerPoint & Google Slides
Funnel
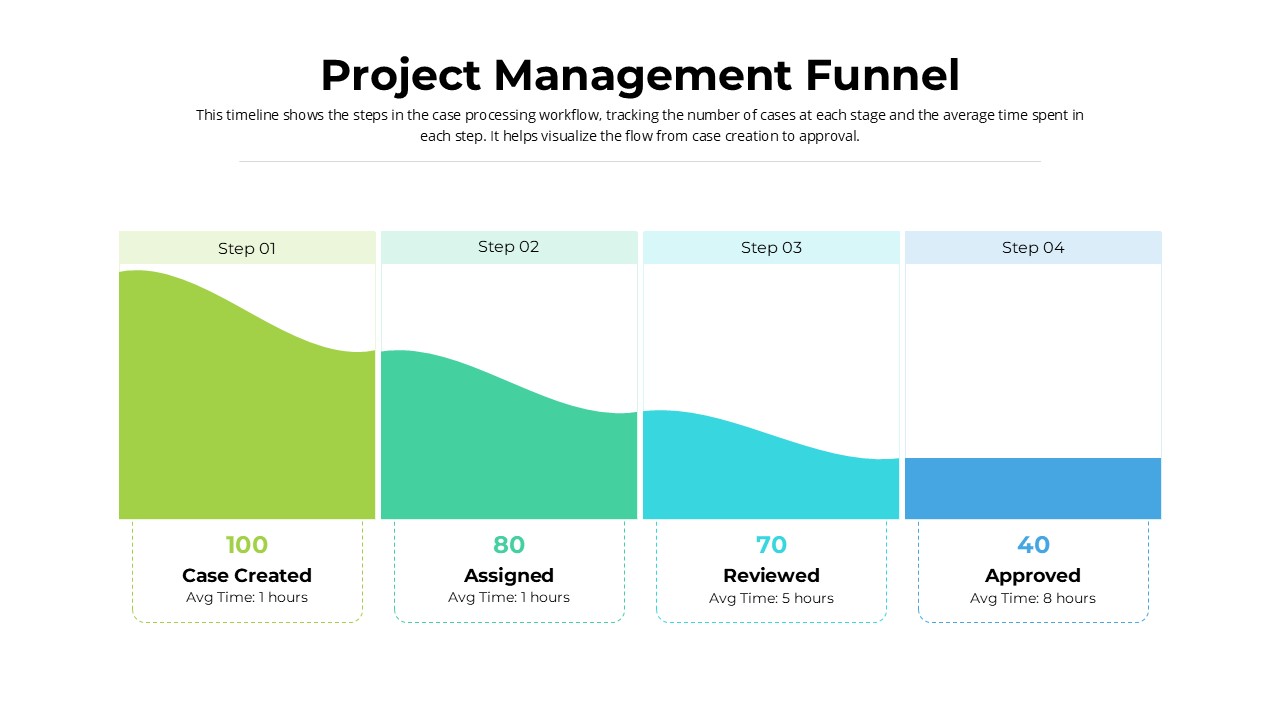
Project Management Funnel template for PowerPoint & Google Slides
Project
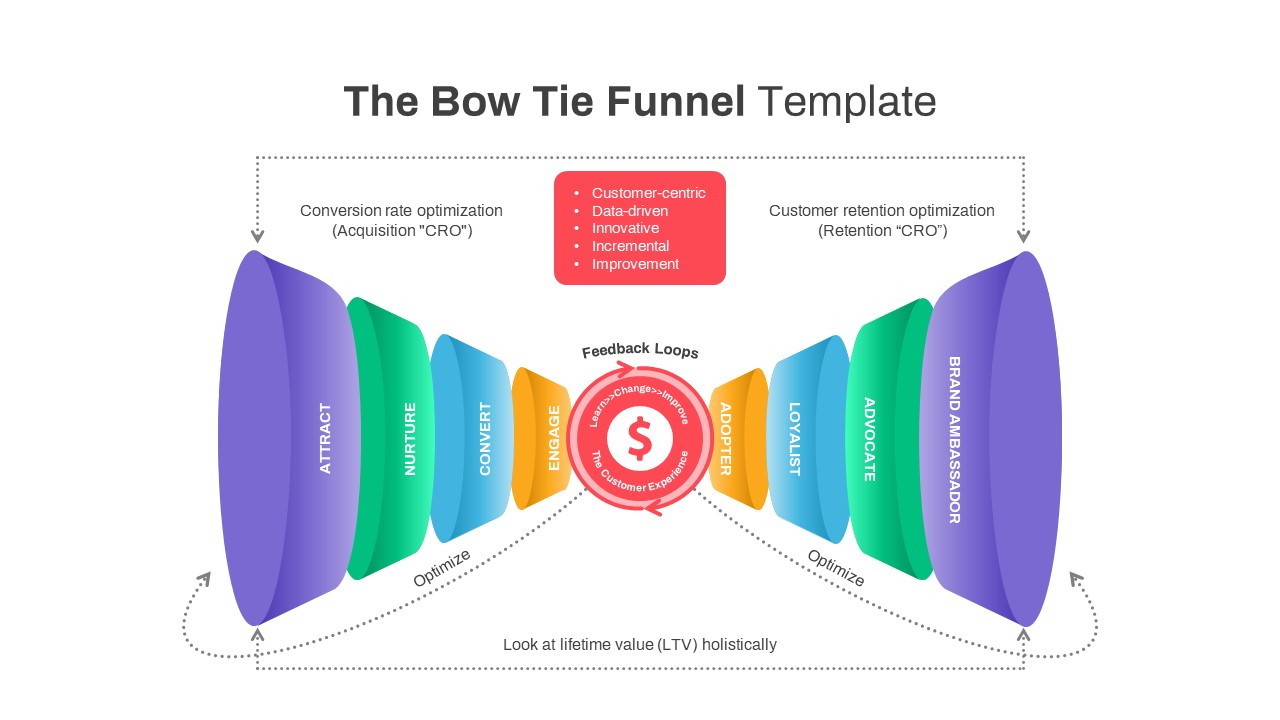
Bow Tie Customer Funnel Presentation Template for PowerPoint & Google Slides
Funnel
8 Stage Funnel Process template for PowerPoint & Google Slides
Funnel
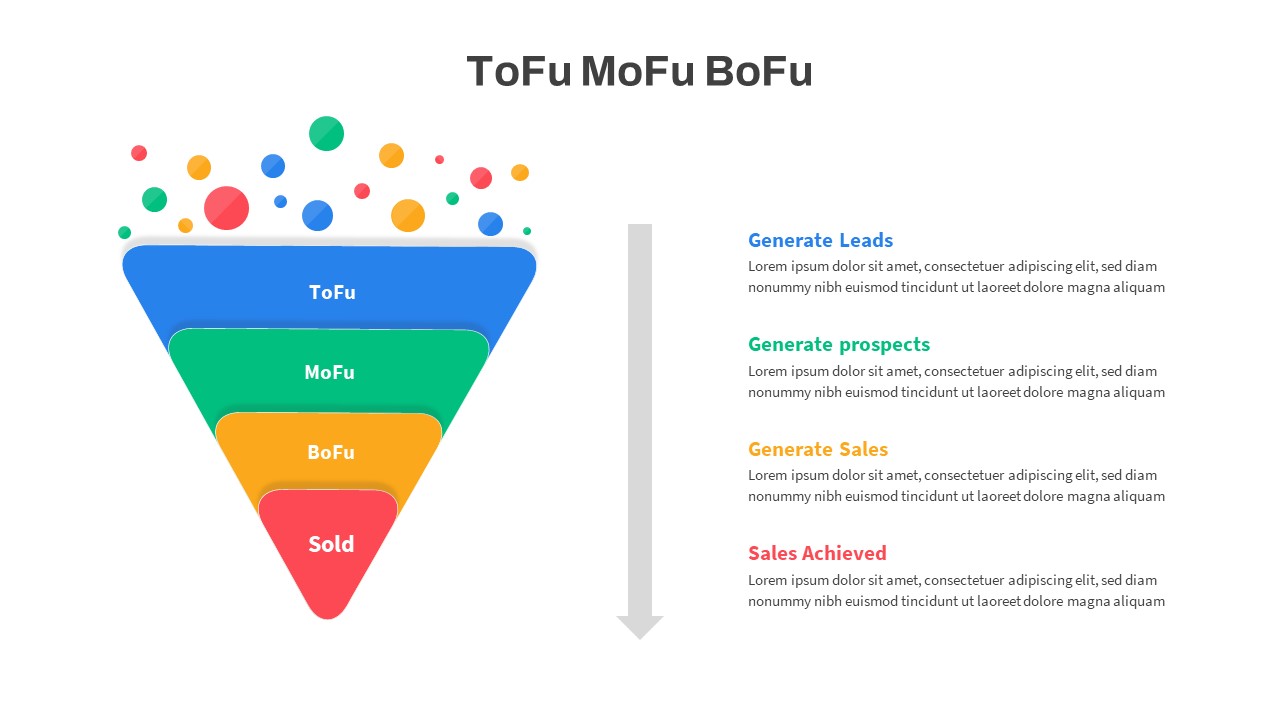
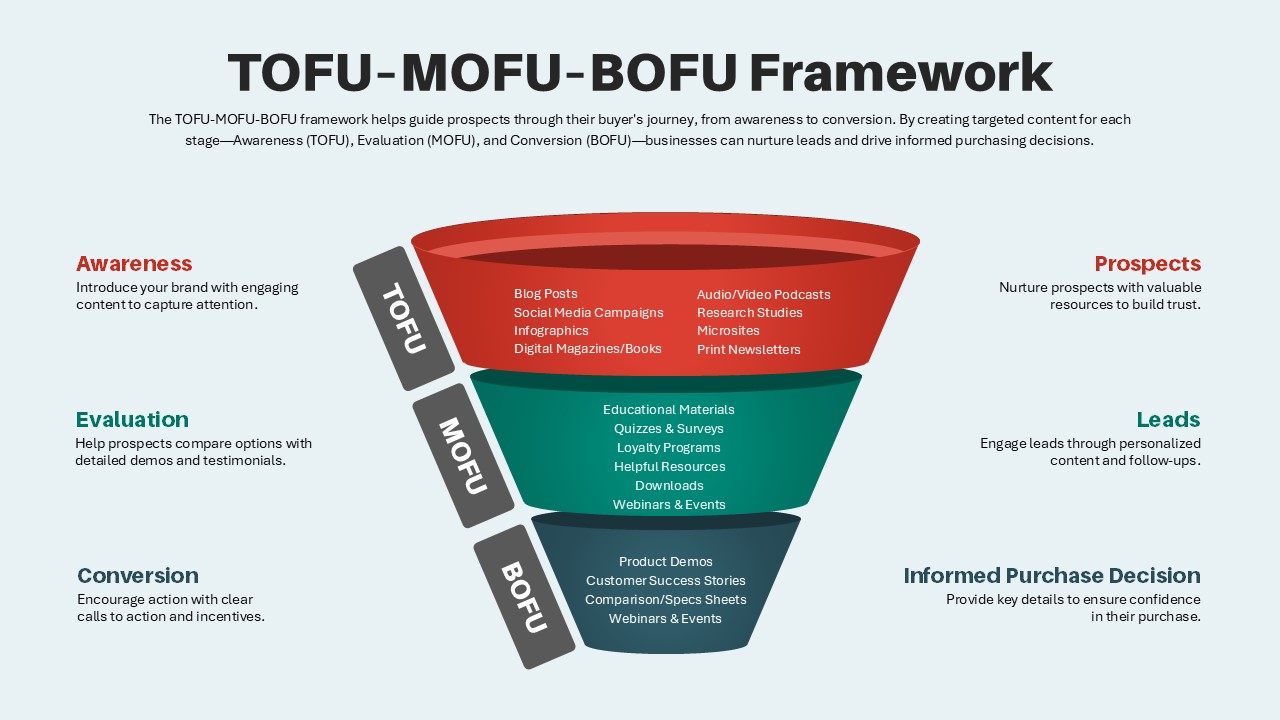
TOFU-MOFU-BOFU Marketing Funnel Template for PowerPoint & Google Slides
Funnel
Funnel Drop-off Analysis template for PowerPoint & Google Slides
Business
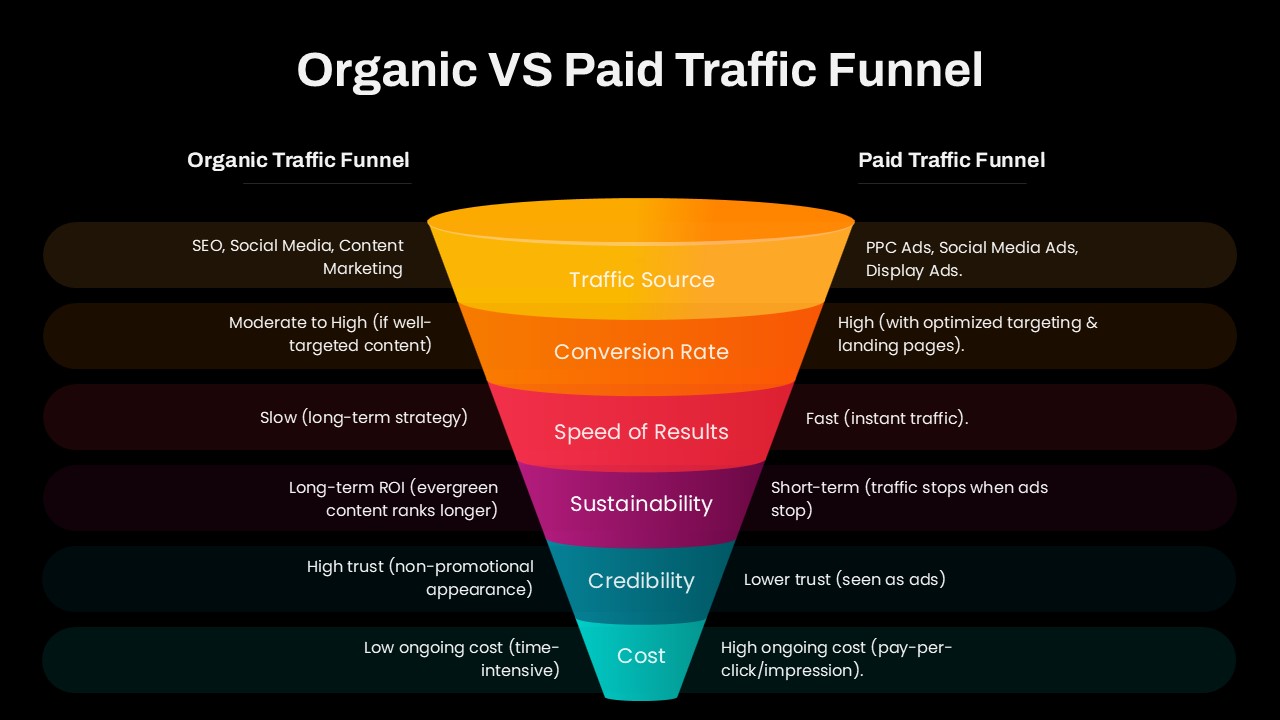
Organic vs Paid Traffic Funnel Template for PowerPoint & Google Slides
Marketing Funnel
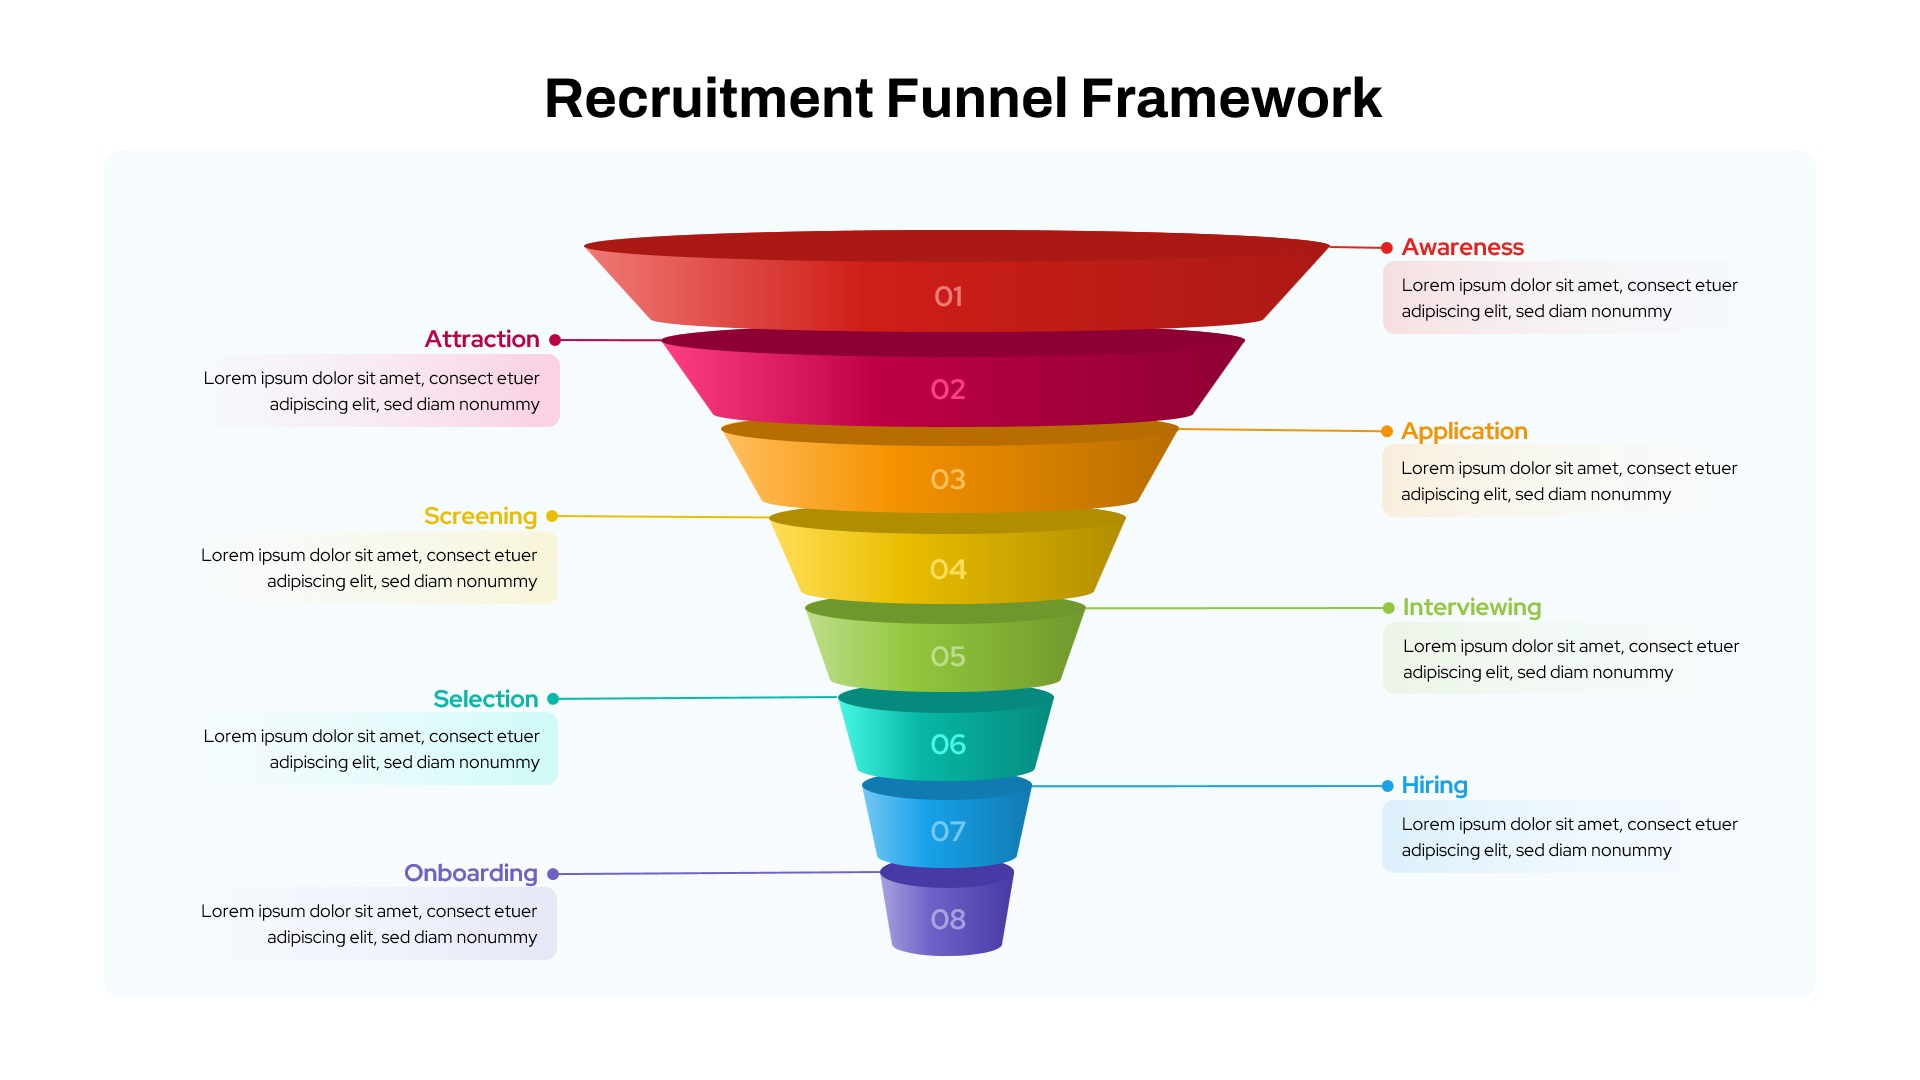
Recruitment Funnel Framework template for PowerPoint & Google Slides
Recruitment
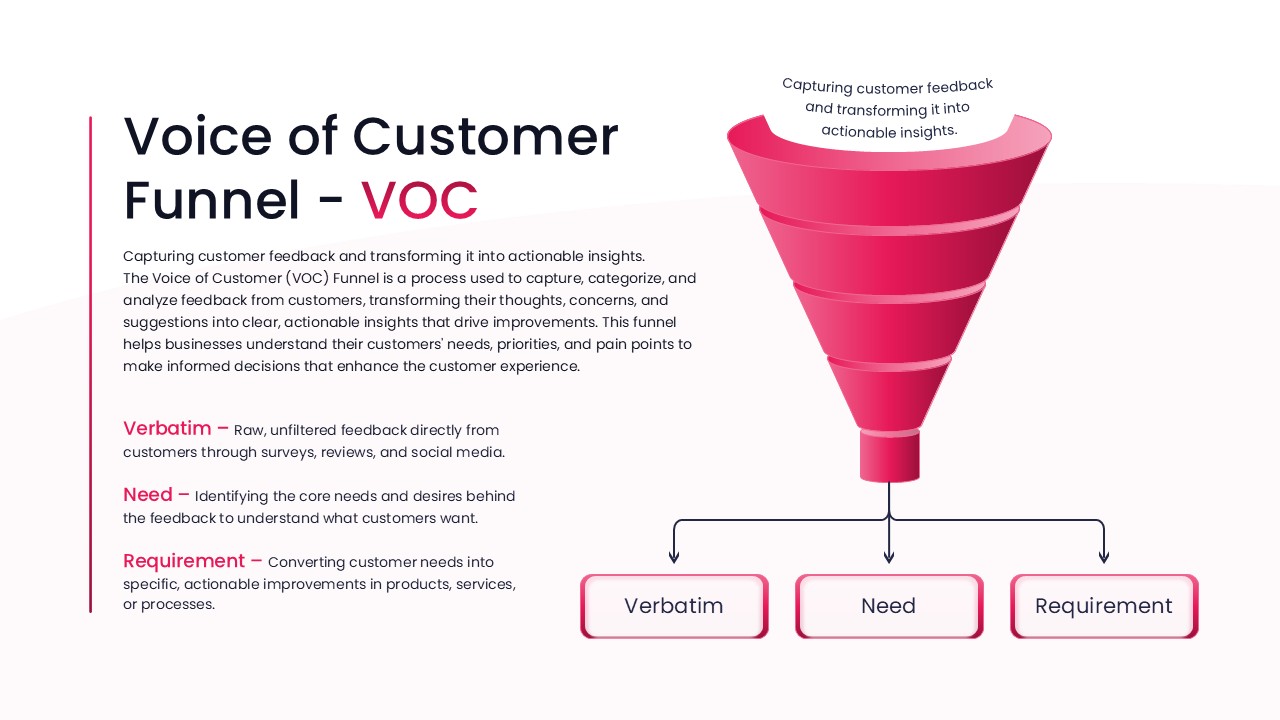
Voice of Customer Funnel (VOC) template for PowerPoint & Google Slides
Marketing
Pirate Metrics AARRR Funnel Framework Template for PowerPoint & Google Slides
Funnel
Funnel and Flywheel Thinking Comparison template for PowerPoint & Google Slides
Infographics
Project Management Funnel Template for PowerPoint & Google Slides
Funnel
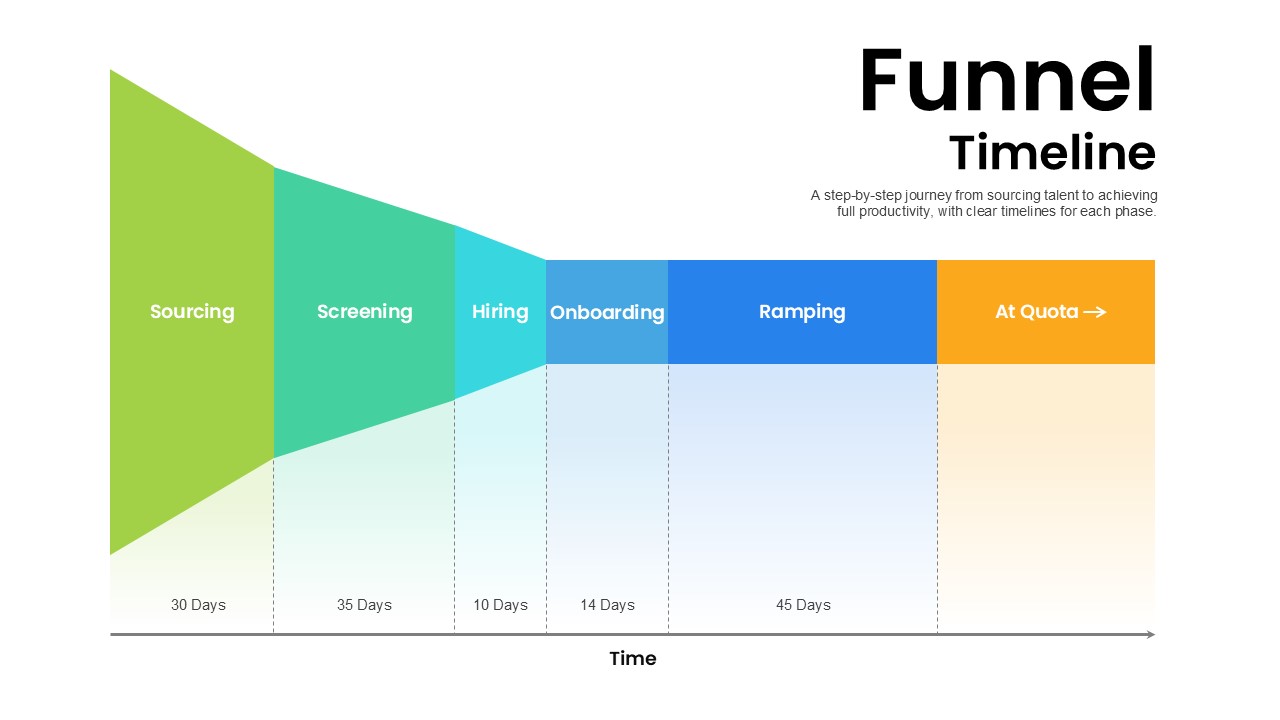
Hiring Funnel Timeline with Six Phases Template for PowerPoint & Google Slides
Recruitment
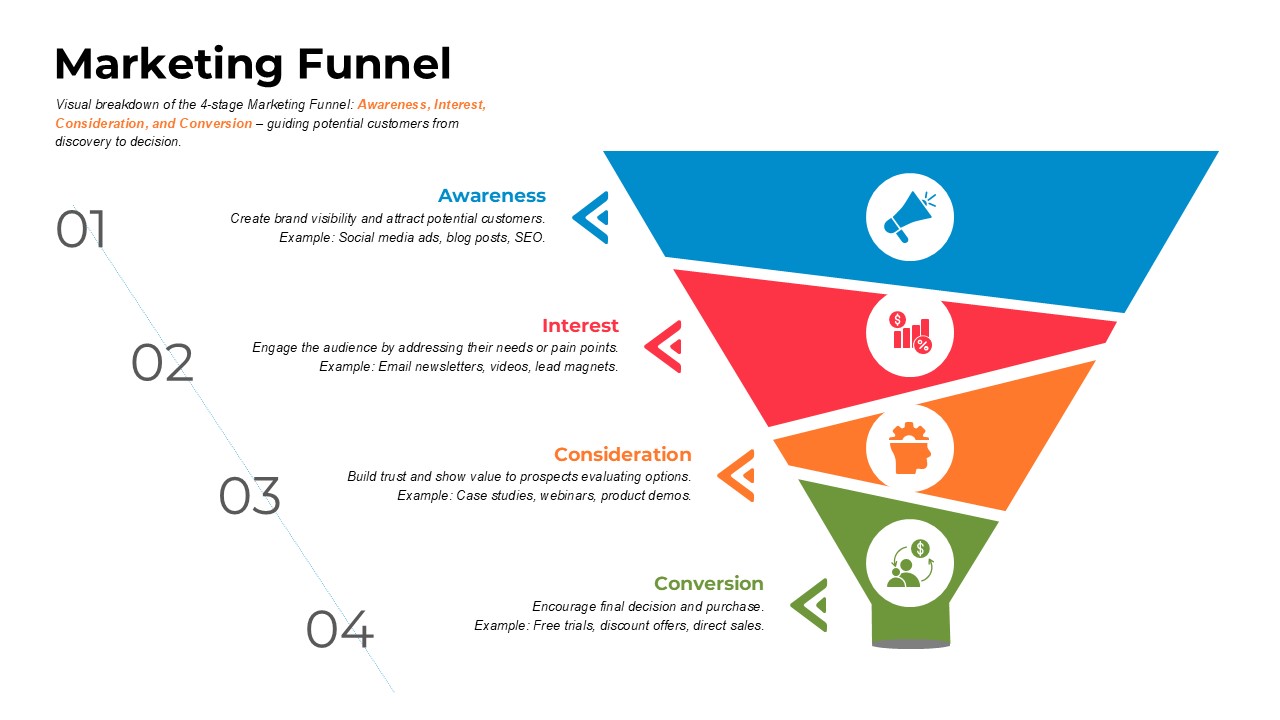
Four-Stage Marketing Funnel Template for PowerPoint & Google Slides
Marketing Funnel
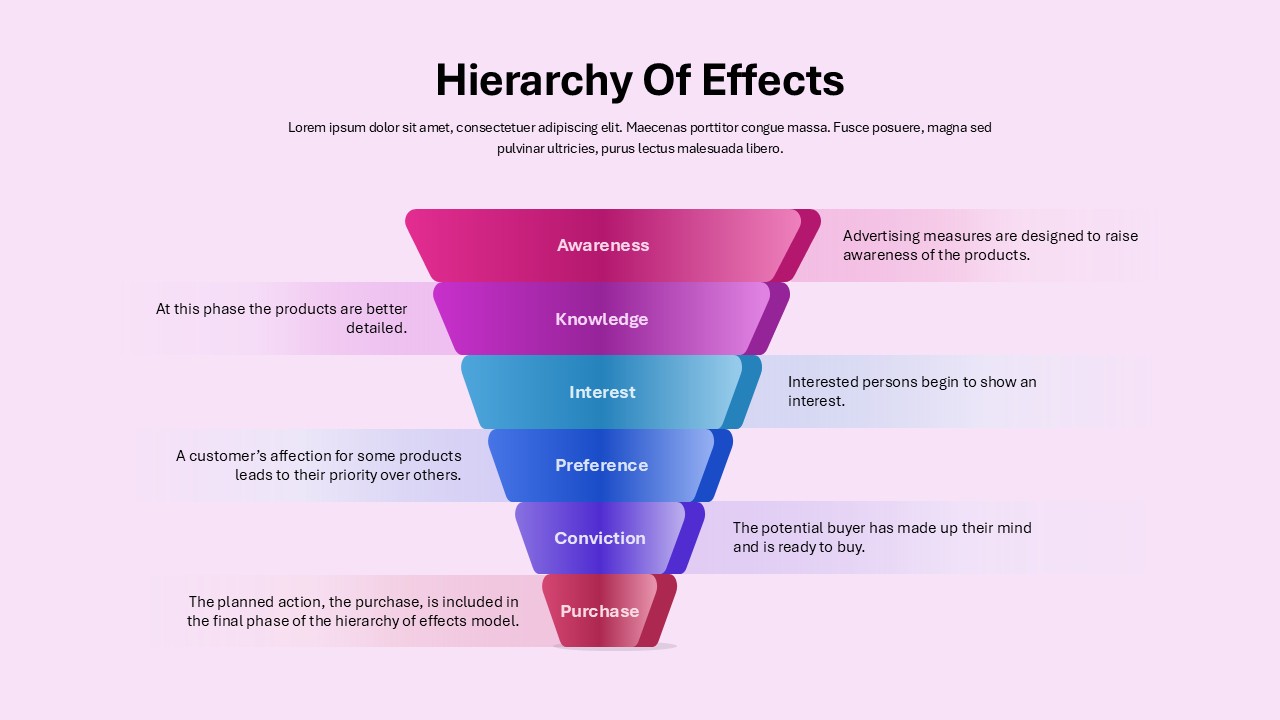
Marketing Funnel Hierarchy of Effects Template for PowerPoint & Google Slides
Marketing Funnel
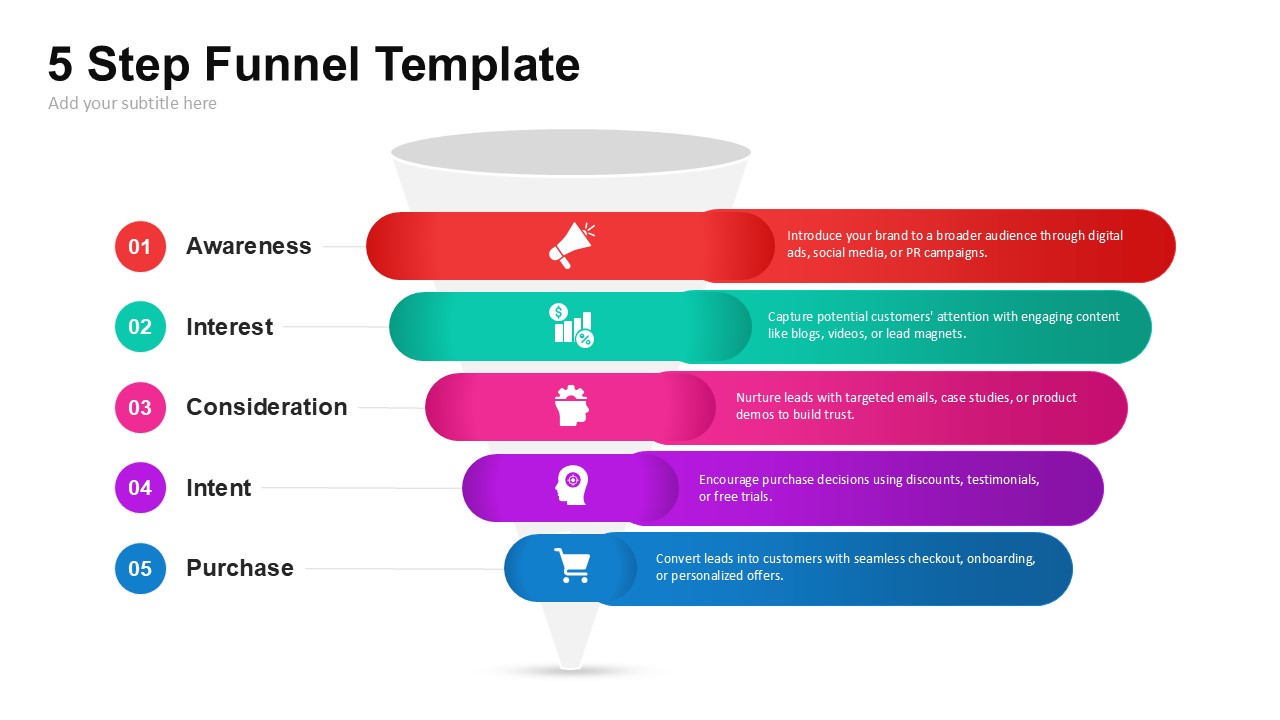
5-Step Marketing Funnel Template for PowerPoint & Google Slides
Marketing Funnel
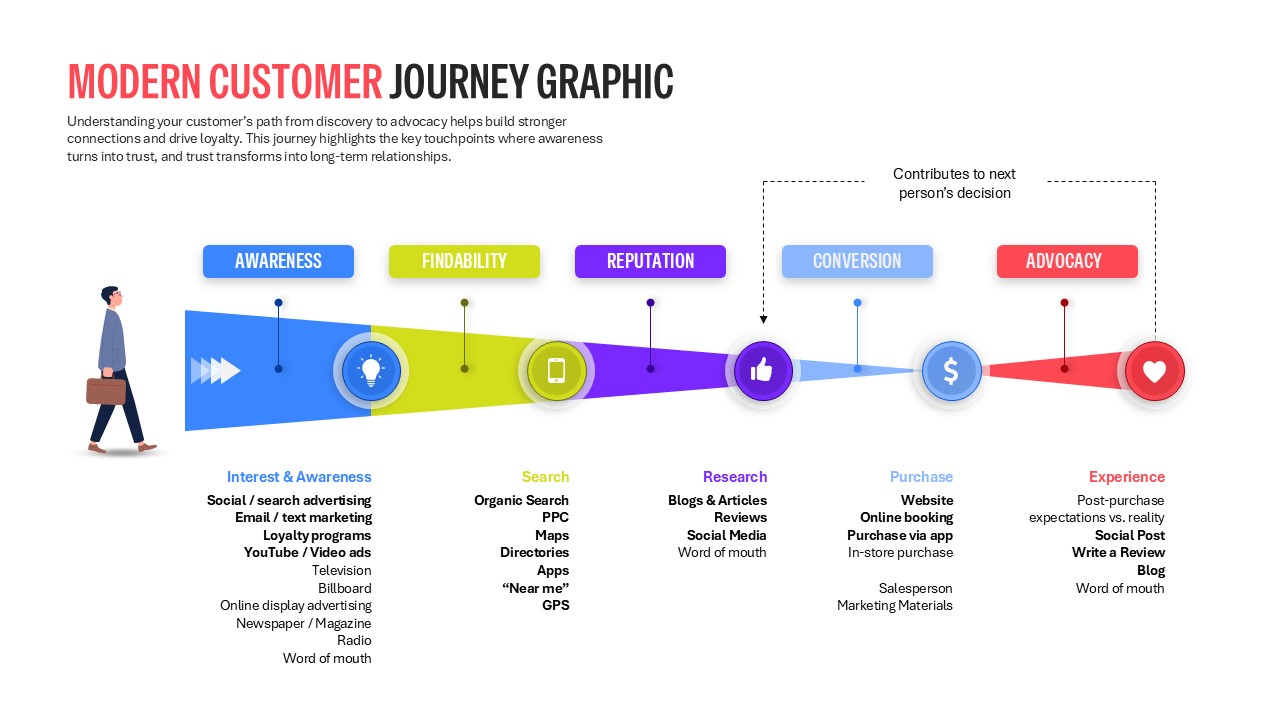
Modern Customer Journey Graphic Funnel Template for PowerPoint & Google Slides
Customer Journey
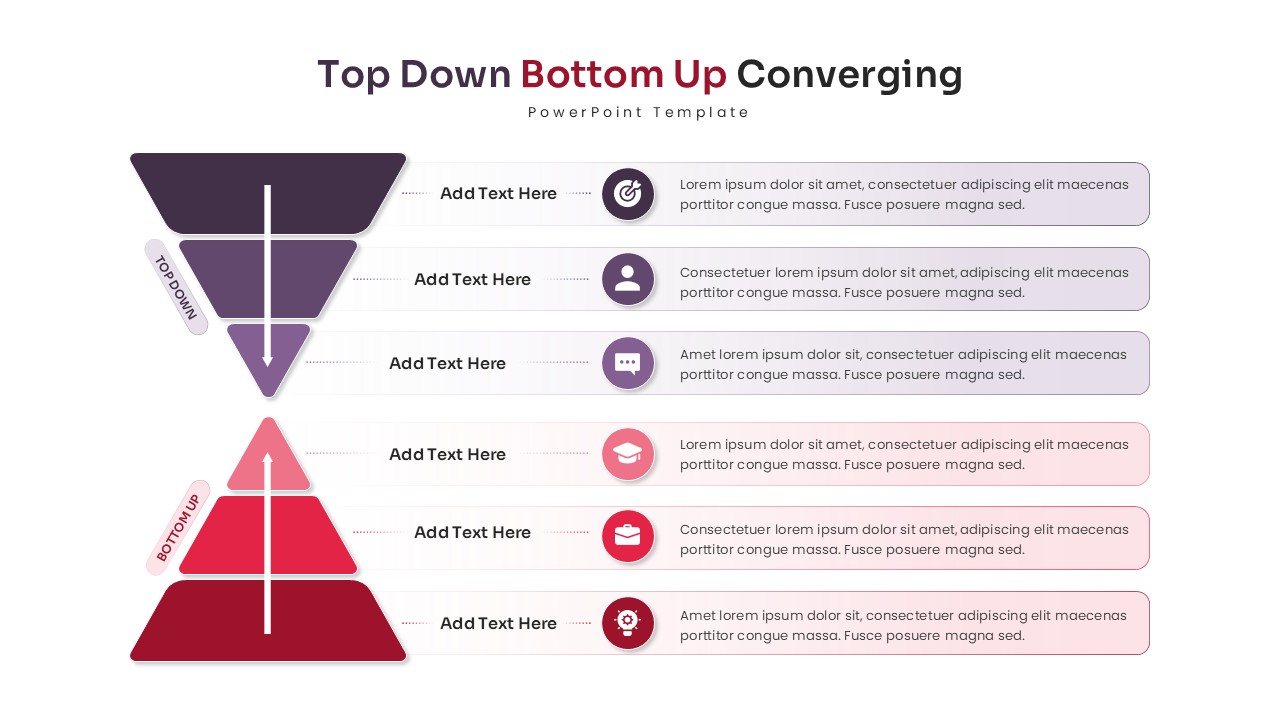
Top Down Bottom Up Converging Funnel for PowerPoint & Google Slides
Funnel
Professional Animated Sales Presentation Template for PowerPoint & Google Slides
Pitch Deck
Sales Growth Comparison Chart & Table Template for PowerPoint & Google Slides
Bar/Column