Sky and Tree Root Cause Analysis Deck Template for PowerPoint & Google Slides

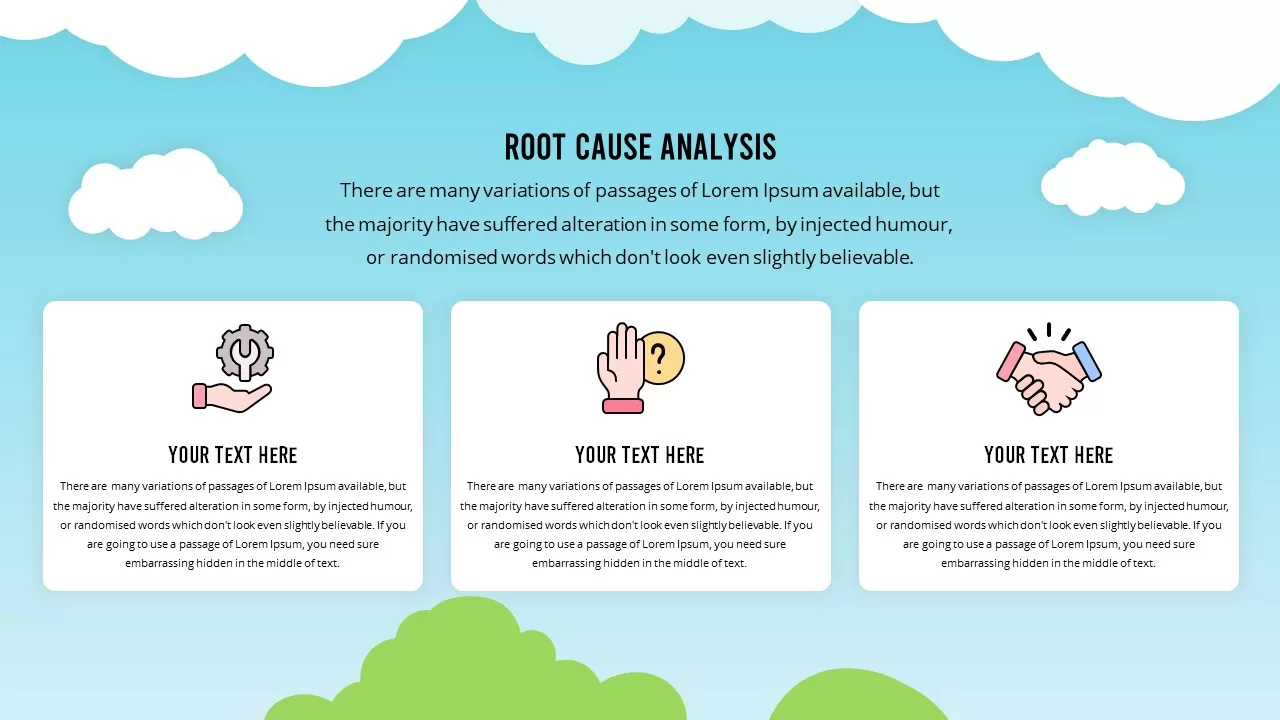


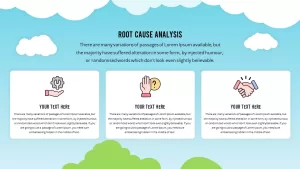


This dynamic Root Cause Analysis deck opens with a full-bleed cover slide showcasing a bright sky-blue background layered with stylized white clouds, paper airplane accent, and flock silhouettes, positioning your presentation in a clean, uplifting atmosphere. The title “Root Cause Analysis” appears in bold, high-contrast typography for immediate impact.
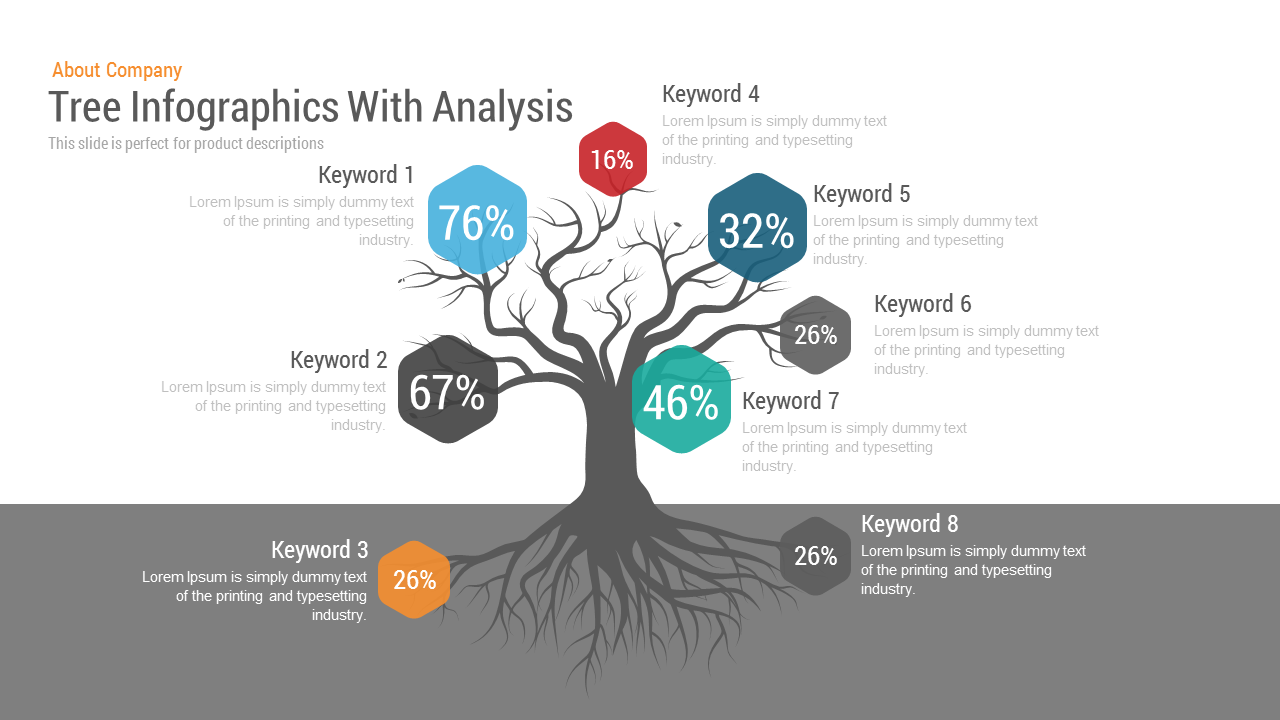
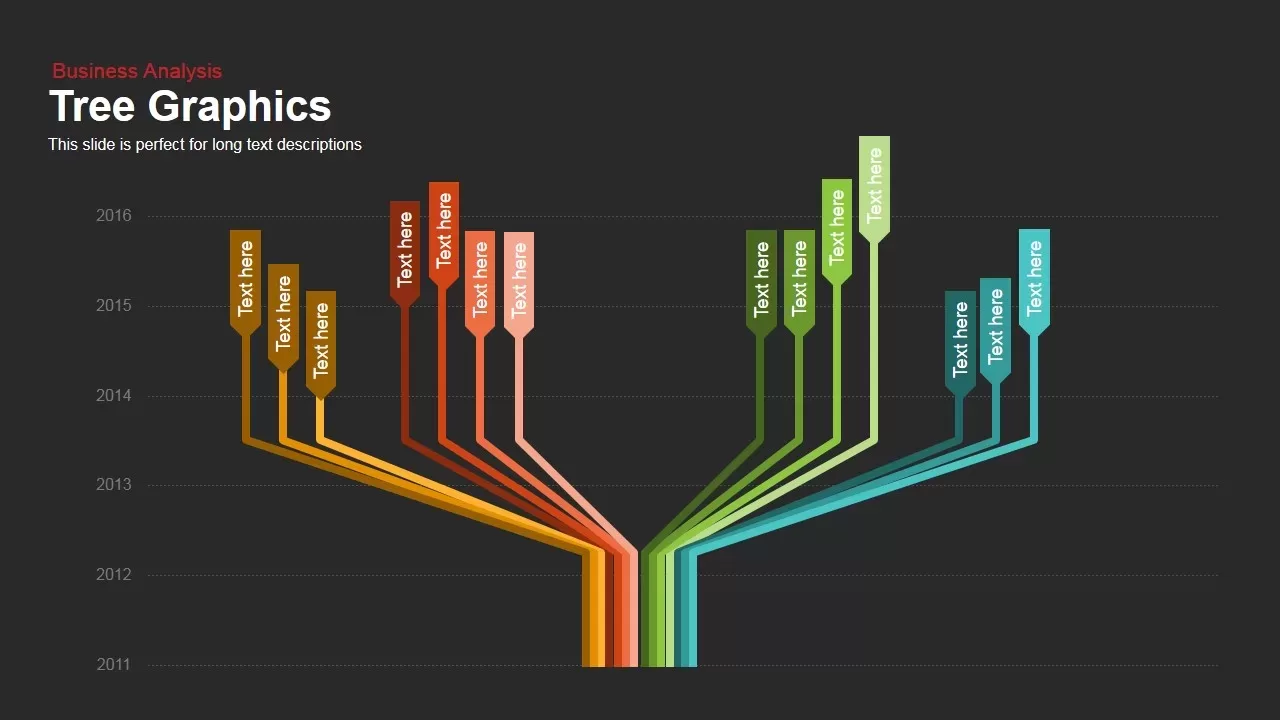
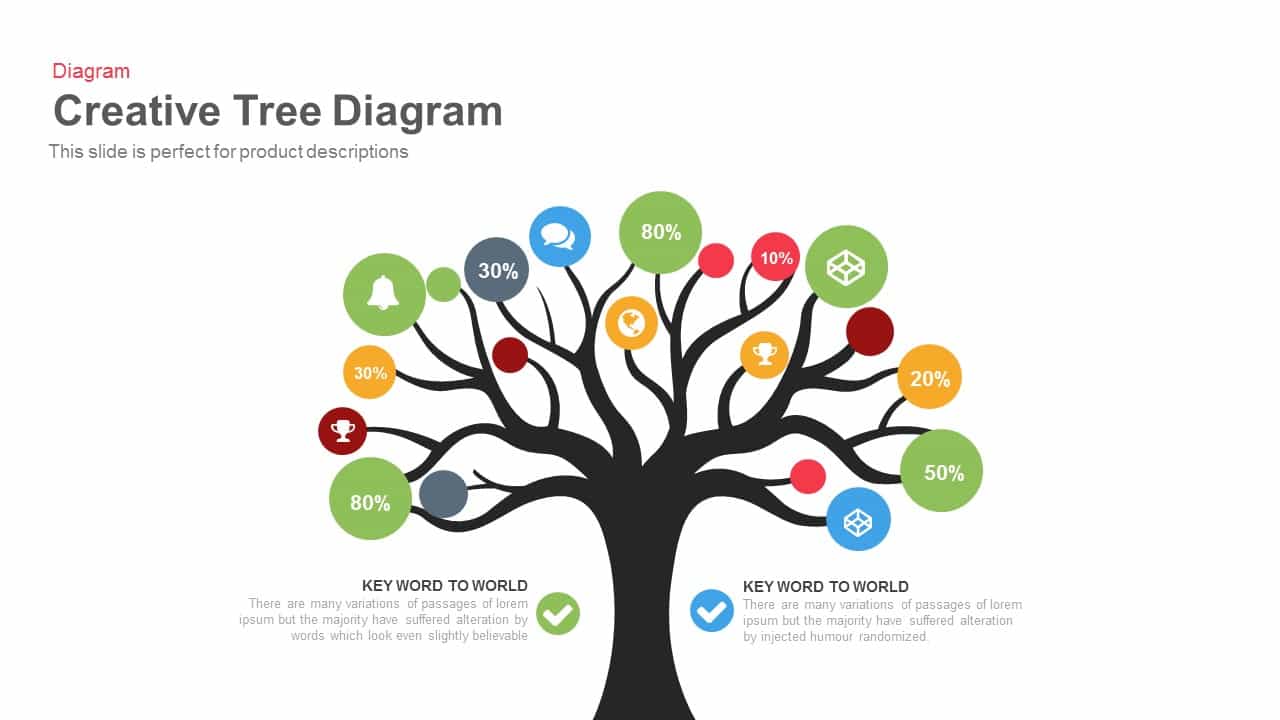
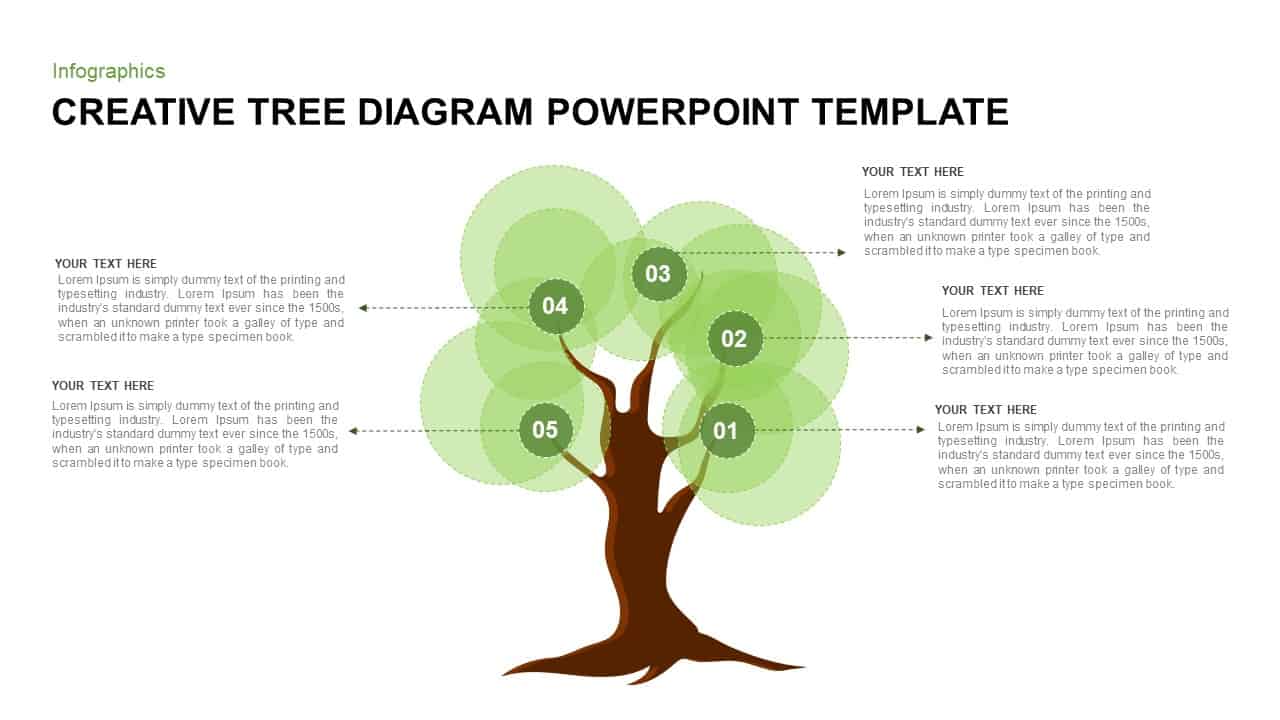
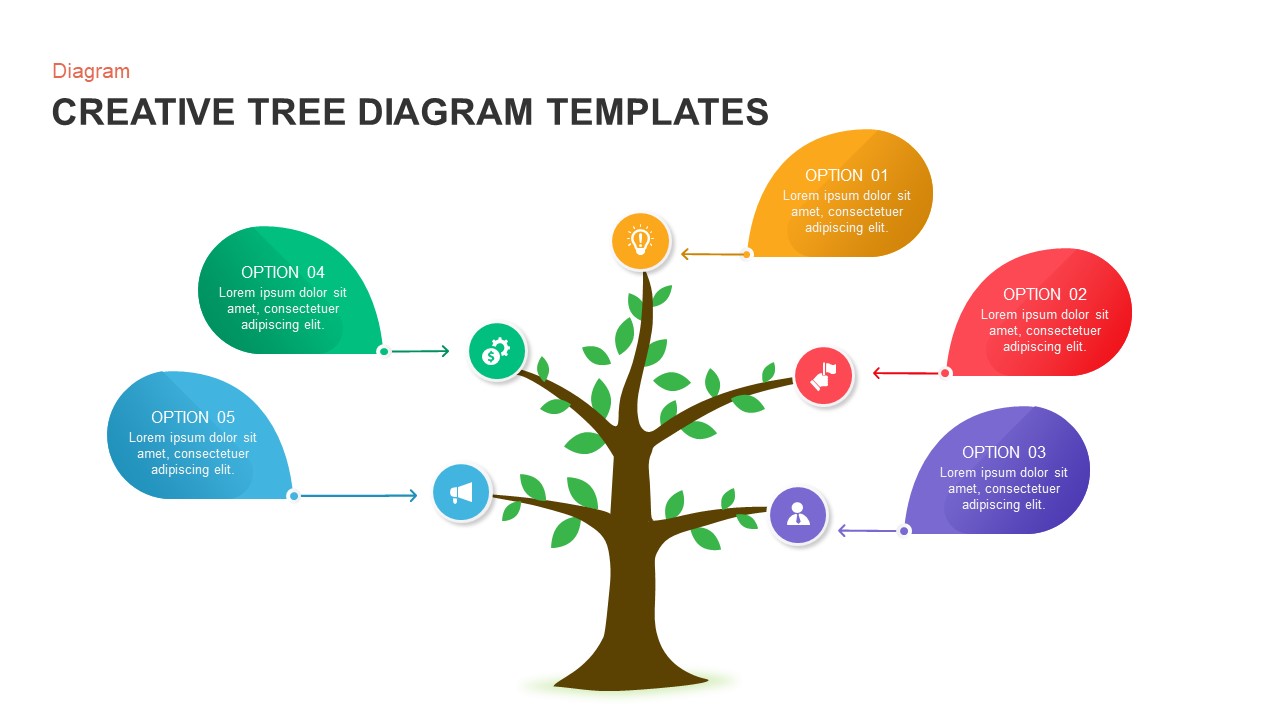
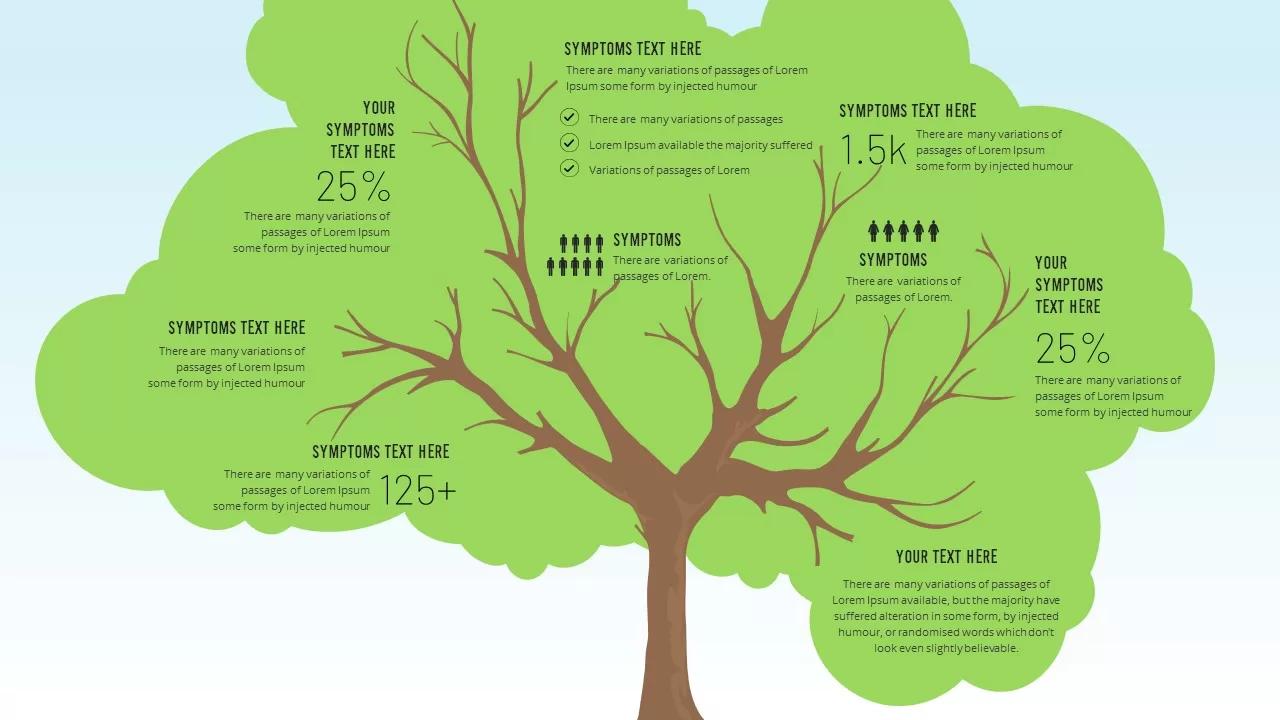
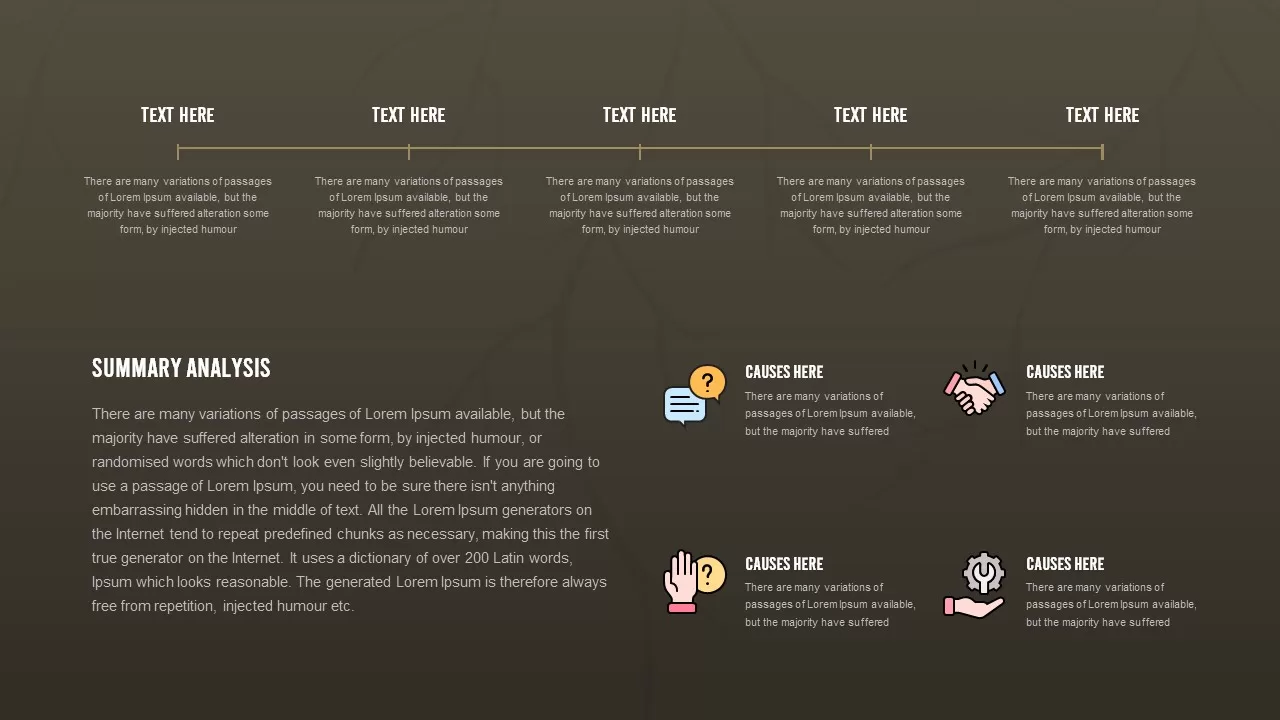
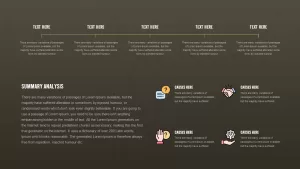
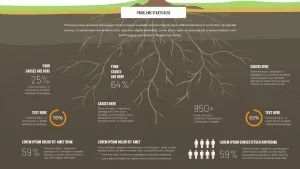
Subsequent slides include a three-panel cloud card layout designed to introduce primary analysis phases with line-style icons and concise text blocks. A vivid tree canopy slide employs overlapping green foliage to display multiple symptom metrics, percentage callouts, and icon-driven checklists along branch-like structures. A dark-thematic analysis slide presents a horizontal timeline, summary text, and four cause categories using pastel iconography over a subtle root-pattern overlay, guiding viewers through context, challenges, and supporting data. The final root-level slide visualizes underlying causes with brown root graphics extending through a muted background, complemented by circular progress rings, numeric callouts, people icon groups, and mini-chart placeholders for clear quantification.
Built for rapid customization, every element in this deck leverages editable vector shapes, drag-and-drop icon placeholders, and data-linked chart objects. Master slide layouts ensure consistent styling and seamless theme swaps—adjust gradient skies, switch foliage colors, or apply brand fonts globally in seconds. Alignment guides and snap-to-grid functionality eliminate manual tweaks, accelerating slide assembly and maintaining visual harmony.
Ideal for leadership workshops, project postmortems, quality control reviews, and risk mitigation planning, this deck adapts effortlessly to highlight problem statements, categorize root causes, and communicate corrective actions. Beyond traditional root cause analysis, repurpose these slides for process audits, continuous improvement initiatives, operational reviews, and training modules to foster data-driven discussions and drive lasting organizational improvements.
Who is it for
Quality engineers, project managers, operations teams, and business analysts can use this deck to pinpoint underlying issues and align stakeholders around data-driven solutions. Managers in manufacturing, IT, healthcare, and service industries will benefit from its structured visuals when leading root cause workshops, retrospectives, or risk evaluations.
Other Uses
Besides root cause workshops, leverage these slides for continuous improvement presentations, process failure mode effect analyses (PFMEA), corrective action planning, and training sessions. Use the cloud, tree canopy, and root visuals to illustrate project reviews, scoreboard dashboards, or strategic planning frameworks across departments.
Login to download this file

Item ID
SB01995
Related Templates

Root Cause Analysis PowerPoint & Google Slides Template for Presentations
Business Strategy
Root Cause Analysis Infographic Pack Template for PowerPoint & Google Slides
Process
Free Root Cause Analysis Fishbone Diagram Template for PowerPoint & Google Slides
Process
Free
5 Why Fishbone Diagram for Root Cause Analysis in PowerPoint & Google Slides
Process
Fishbone Cause Analysis Diagram Template for PowerPoint & Google Slides
Process
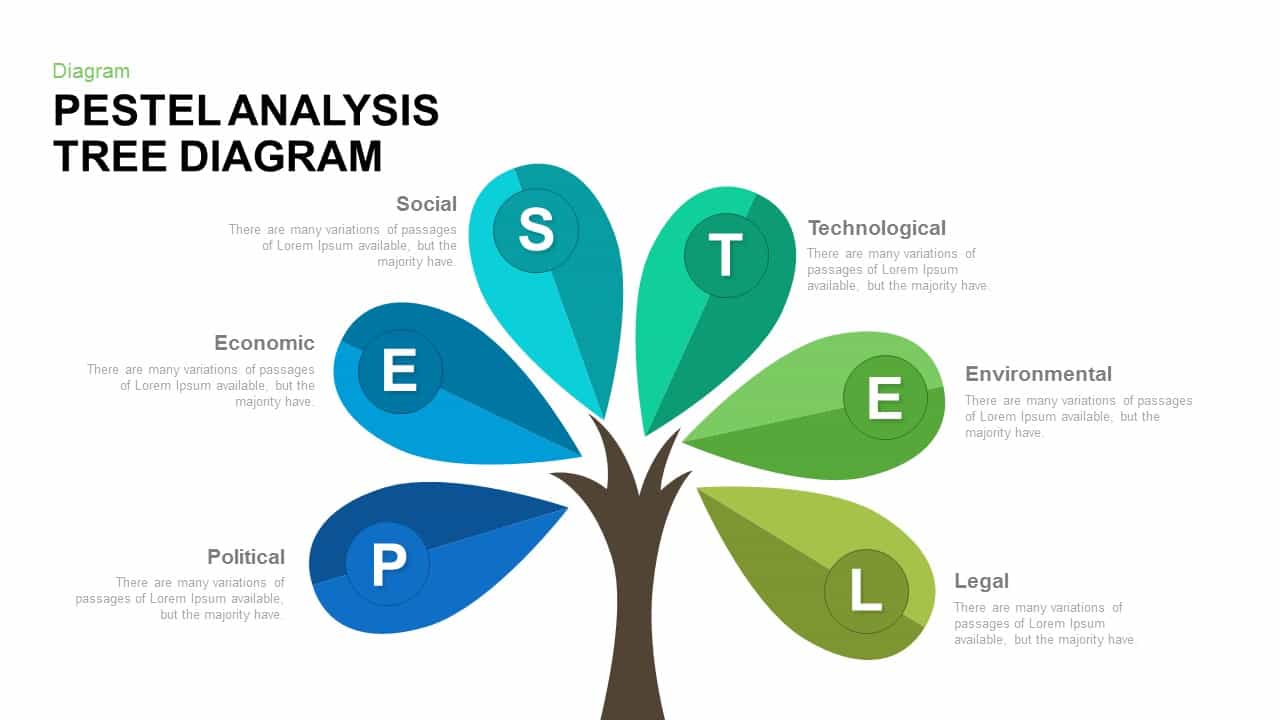
PESTEL Analysis Tree Diagram for PowerPoint & Google Slides
Process

Cause and Effect Diagram Infographic Template for PowerPoint & Google Slides
Bar/Column
Fishbone Diagram Cause-and-Effect Template for PowerPoint & Google Slides
Process
Fishbone Cause and Effect Diagram Template for PowerPoint & Google Slides
Process
Five-Input Cause and Effect Diagram Template for PowerPoint & Google Slides
Arrow
Fishbone Cause and Effect Infographic Template for PowerPoint & Google Slides
Infographics
Underwater Fishbone Cause-Effect Diagram Template for PowerPoint & Google Slides
Process
Tree Infographics template for PowerPoint & Google Slides
Decision Tree
Tree Diagram template for PowerPoint & Google Slides
Decision Tree
Business Tree Diagram template for PowerPoint & Google Slides
Business Strategy
Engaging Creative Tree Diagram Slide Template for PowerPoint & Google Slides
Flow Charts
Tree Illustration template for PowerPoint & Google Slides
Process
Interactive Products Tree Diagram template for PowerPoint & Google Slides
Org Chart
Colorful Decision Tree Diagram template for PowerPoint & Google Slides
Decision Tree
Editable Hierarchical Tree Diagram Template for PowerPoint & Google Slides
Decision Tree
Tree Growth Stage Infographic Template for PowerPoint & Google Slides
Timeline
Tree Infographics template for PowerPoint & Google Slides
Infographics
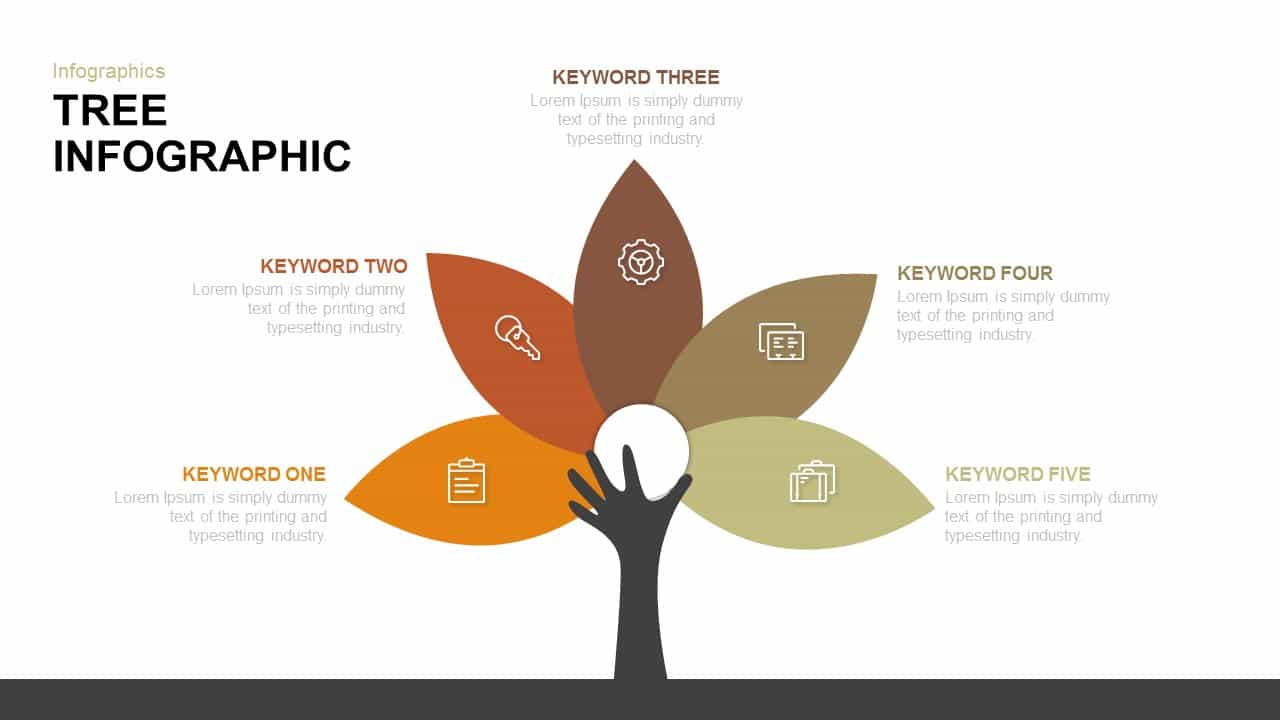
Tree Keyword Petals Infographic Template for PowerPoint & Google Slides
Process
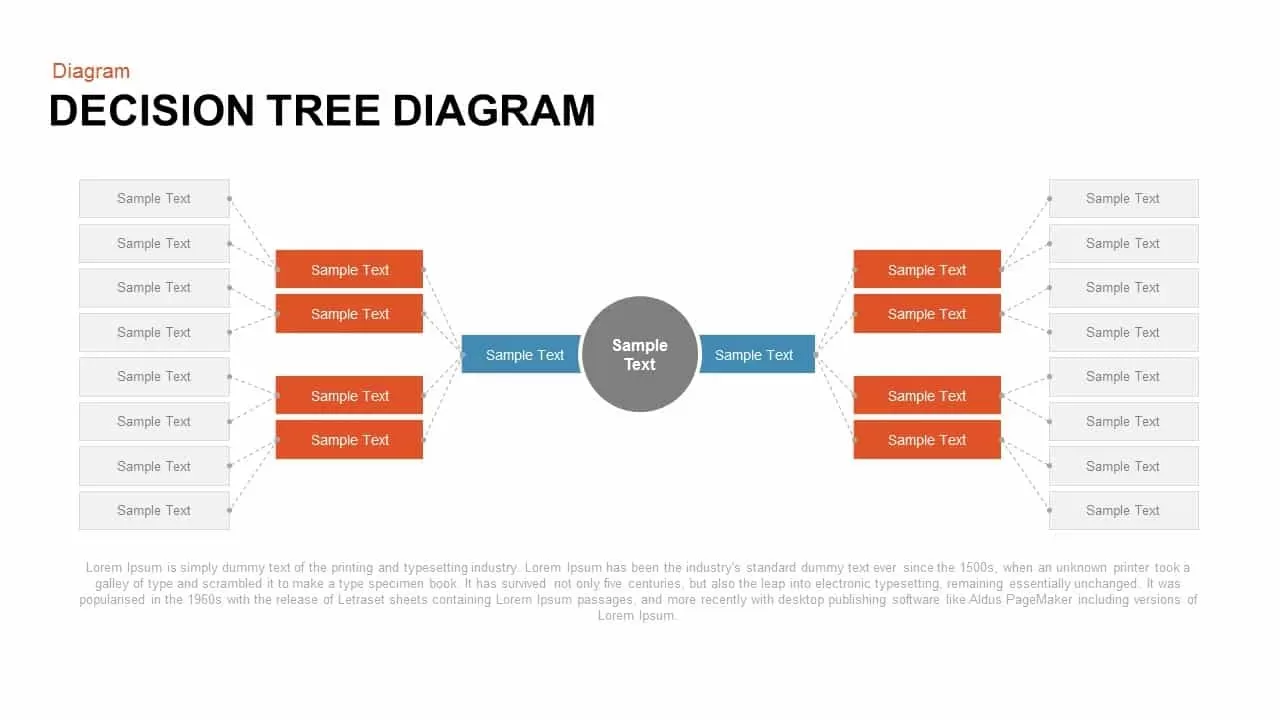
Decision Tree Diagram template for PowerPoint & Google Slides
Decision Tree

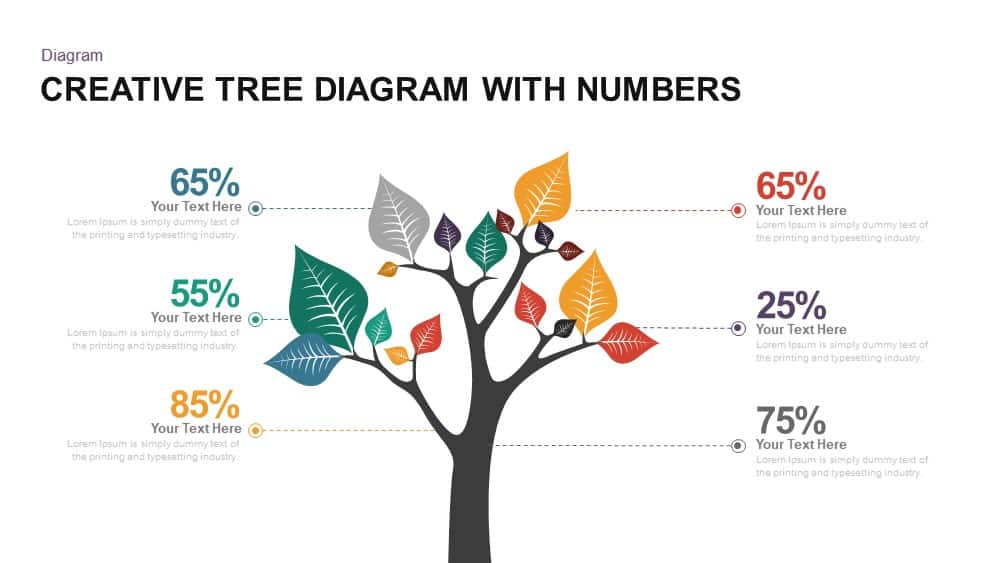
Creative Tree Diagram with Percentages Template for PowerPoint & Google Slides
Decision Tree
Creative Tree Infographic Diagram Template for PowerPoint & Google Slides
Infographics
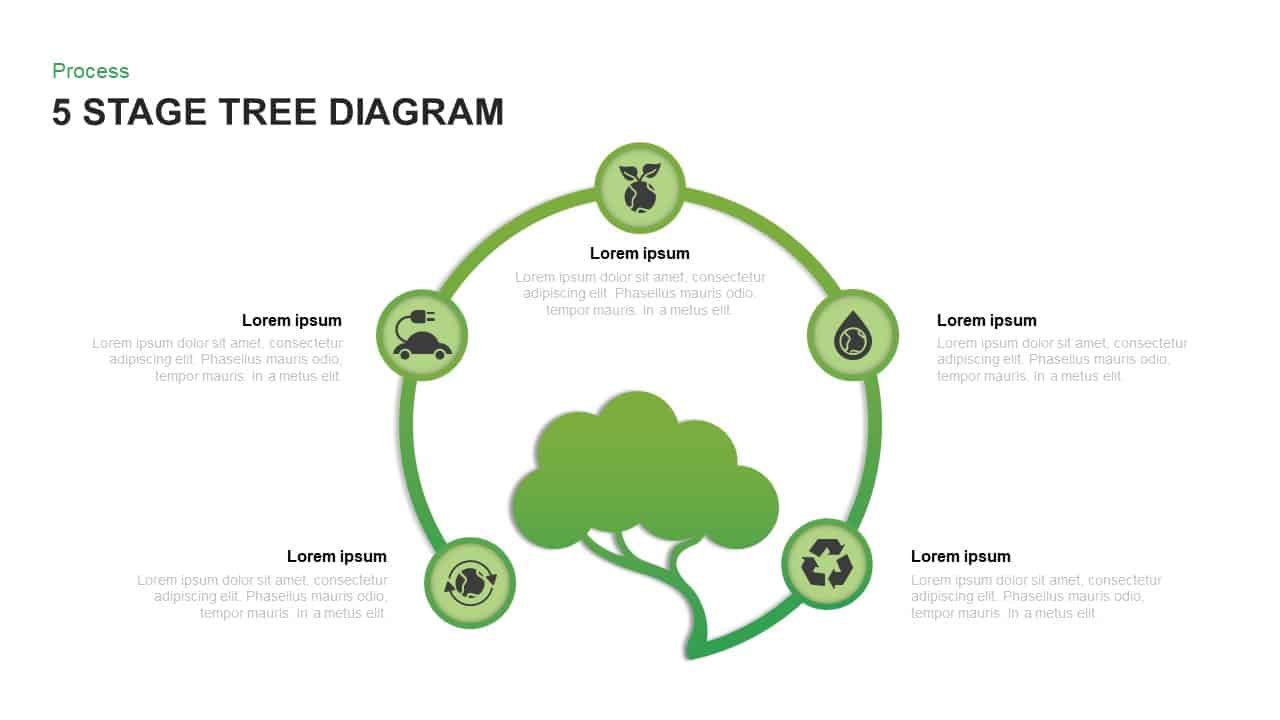
Five-Stage Eco Tree Process Diagram Template for PowerPoint & Google Slides
Process
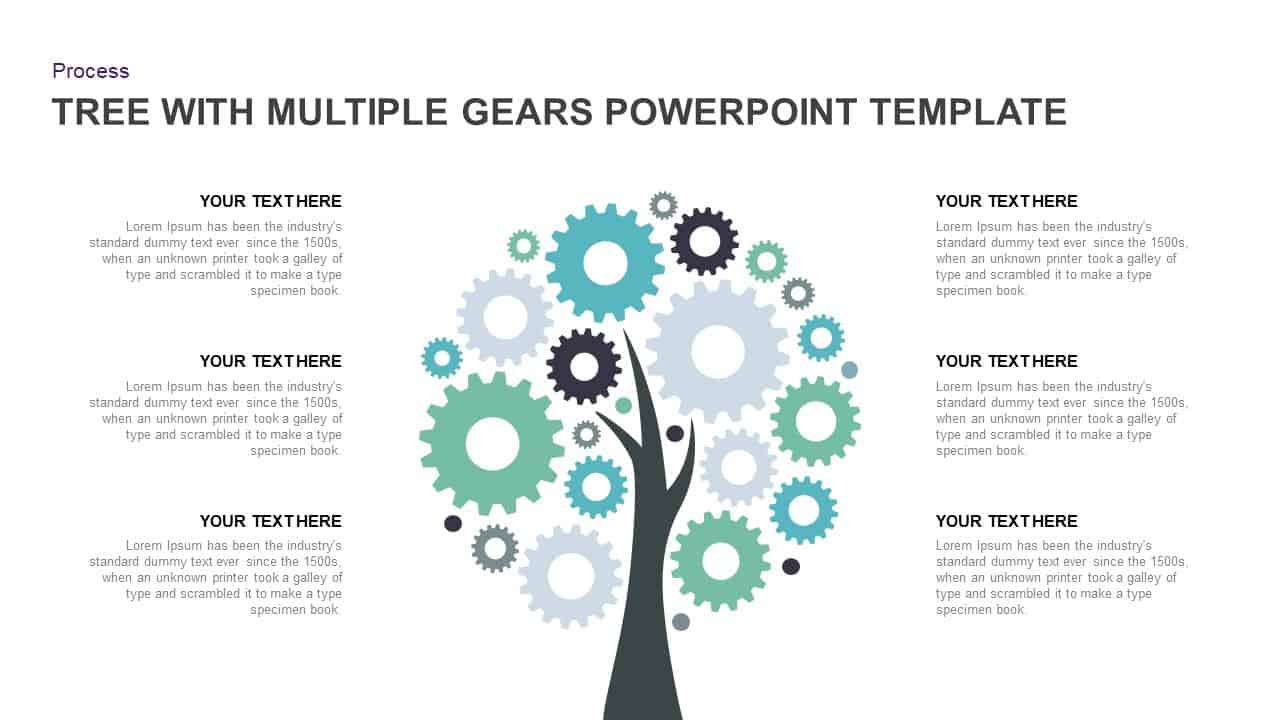
Tree Diagram with Gears Process Template for PowerPoint & Google Slides
Process
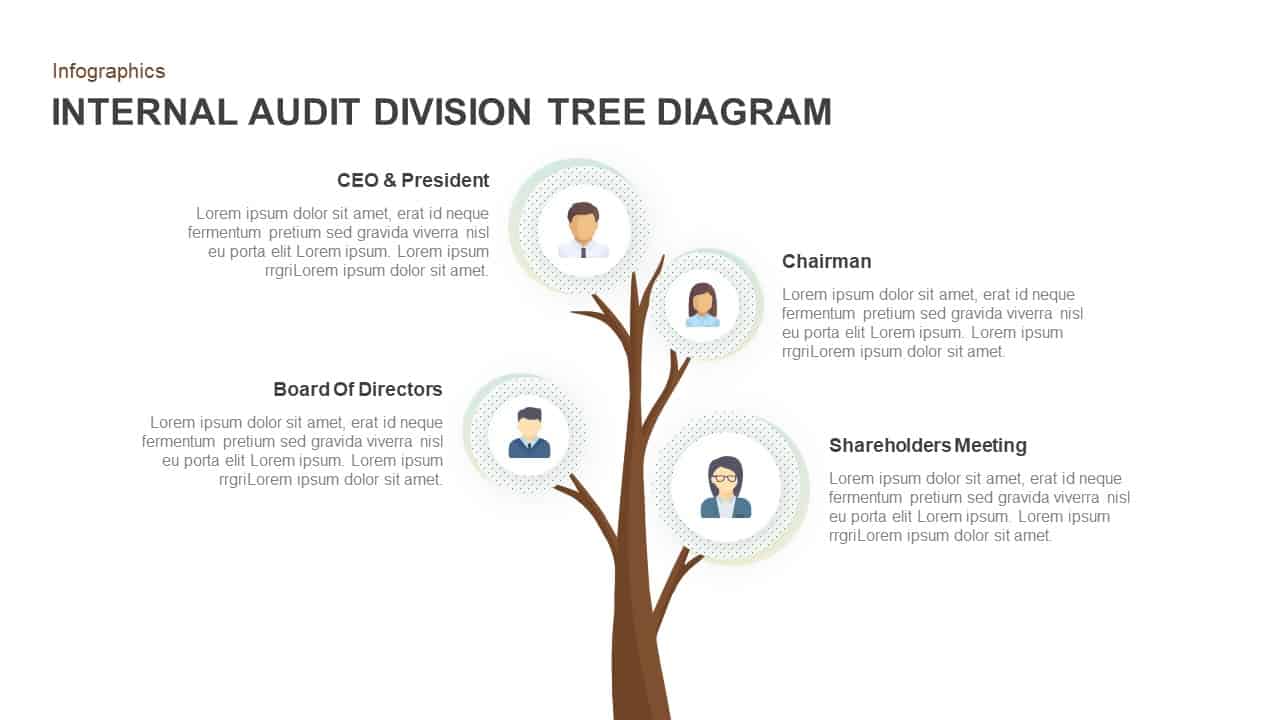
Internal Audit Division Tree Diagram Template for PowerPoint & Google Slides
Org Chart
Creative Tree Diagram Infographic Template for PowerPoint & Google Slides
Decision Tree
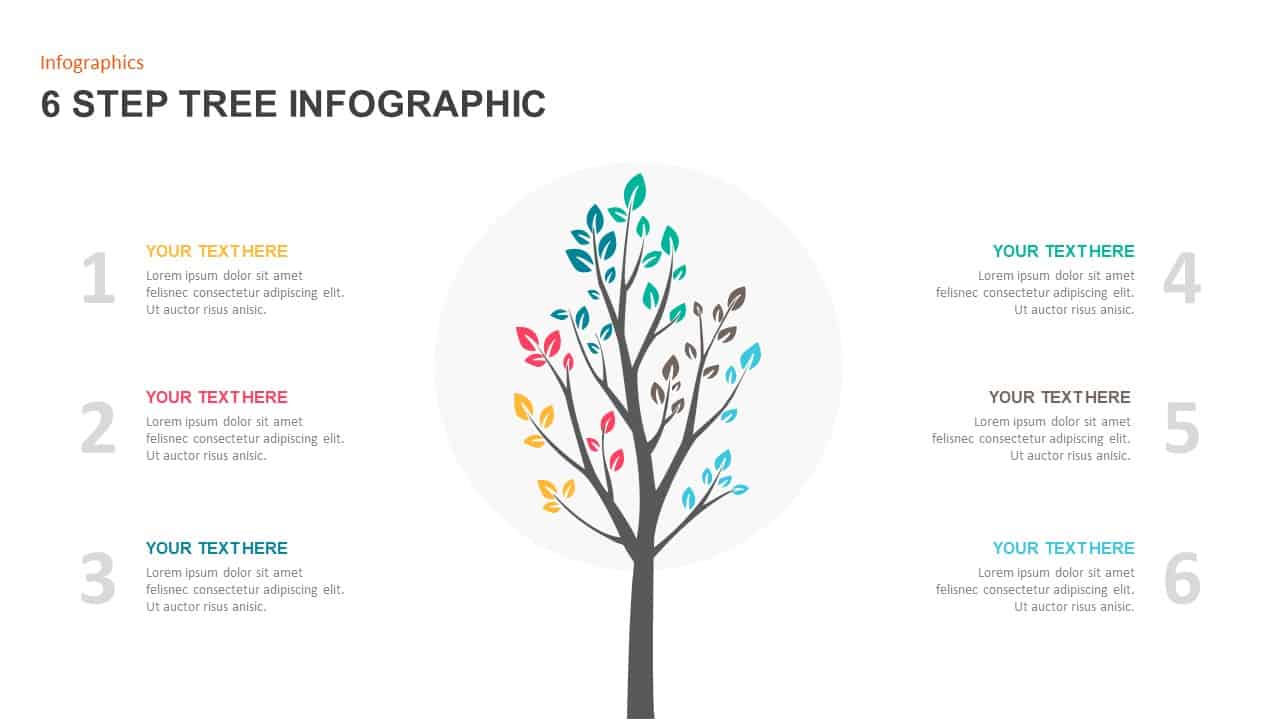
Six-Step Tree Diagram Infographic Template for PowerPoint & Google Slides
Infographics
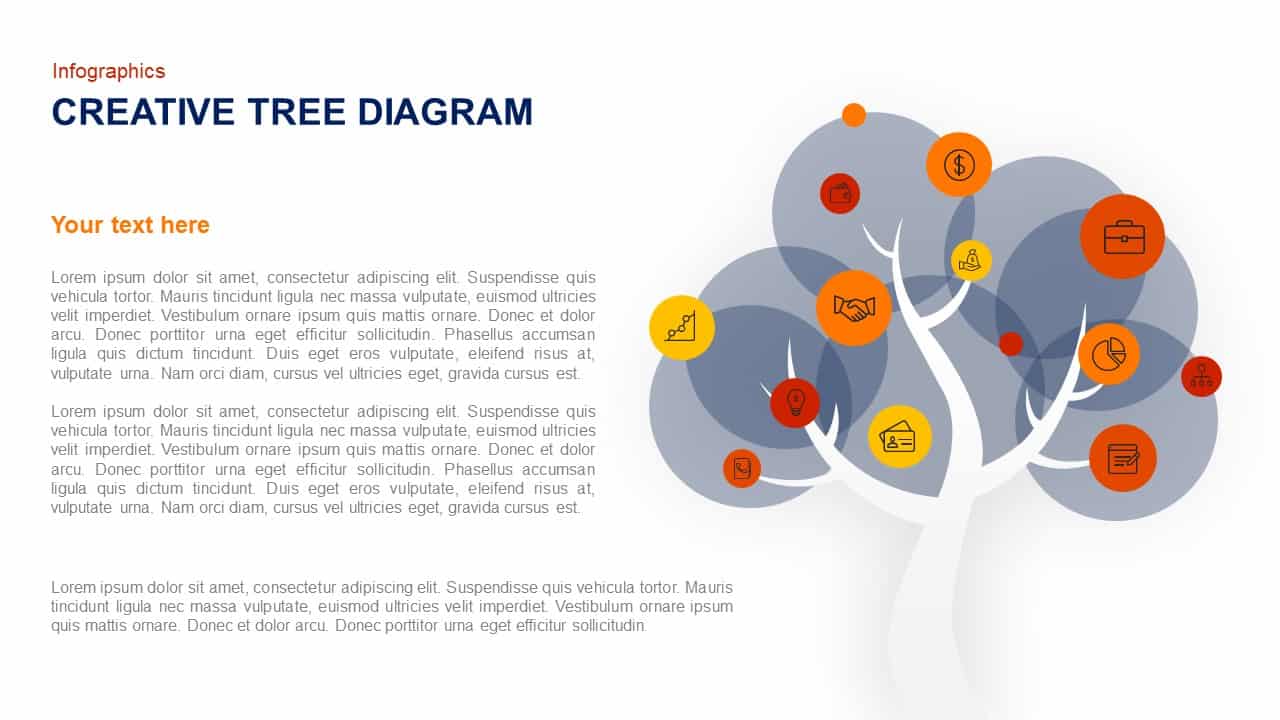
Creative Tree Diagram template for PowerPoint & Google Slides
Process
Creative Tree Diagram Infographic Template for PowerPoint & Google Slides
Decision Tree
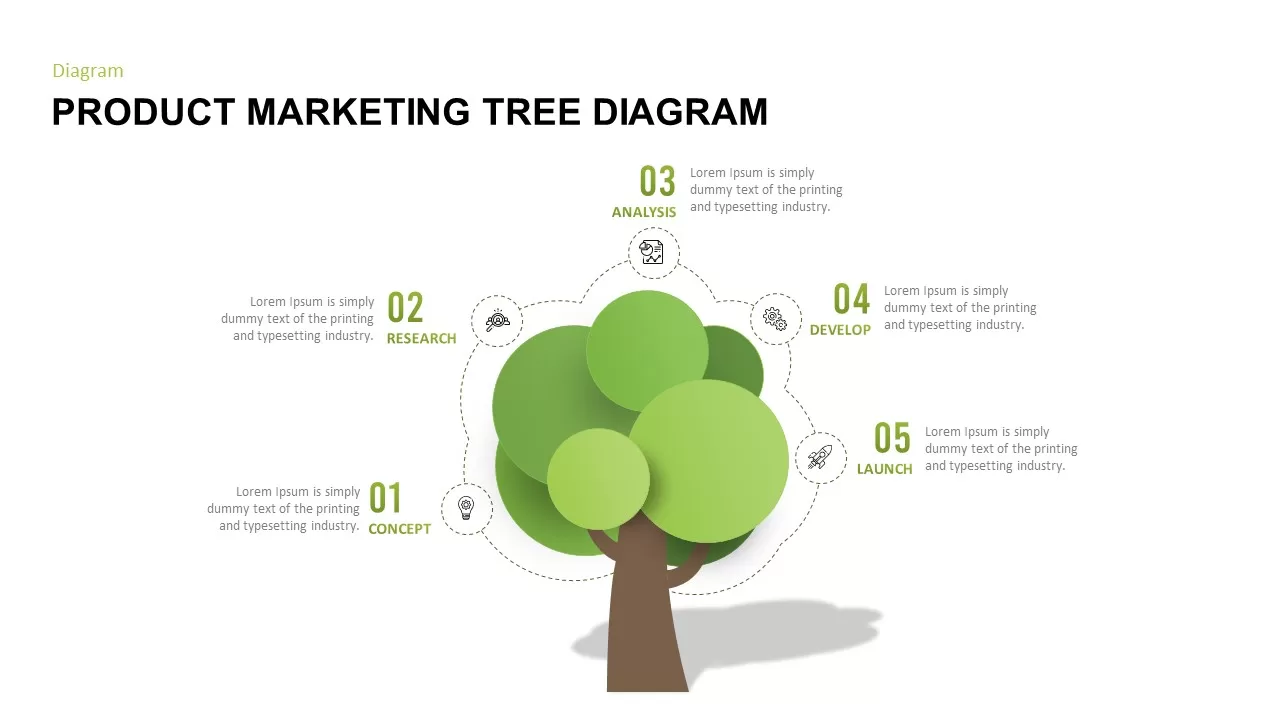
Product Marketing Tree Diagram Template for PowerPoint & Google Slides
Marketing
Paper Tree Business Introduction Template for PowerPoint & Google Slides
Company Profile
Flow Chart Decision Tree Template for PowerPoint & Google Slides
Flow Charts
Customizable Sales Tree Diagram Template for PowerPoint & Google Slides
Org Chart
Classic Family Tree Diagram Layout Template for PowerPoint & Google Slides
Infographics
Elegant Kinship Diagram Family Tree Template for PowerPoint & Google Slides
Org Chart
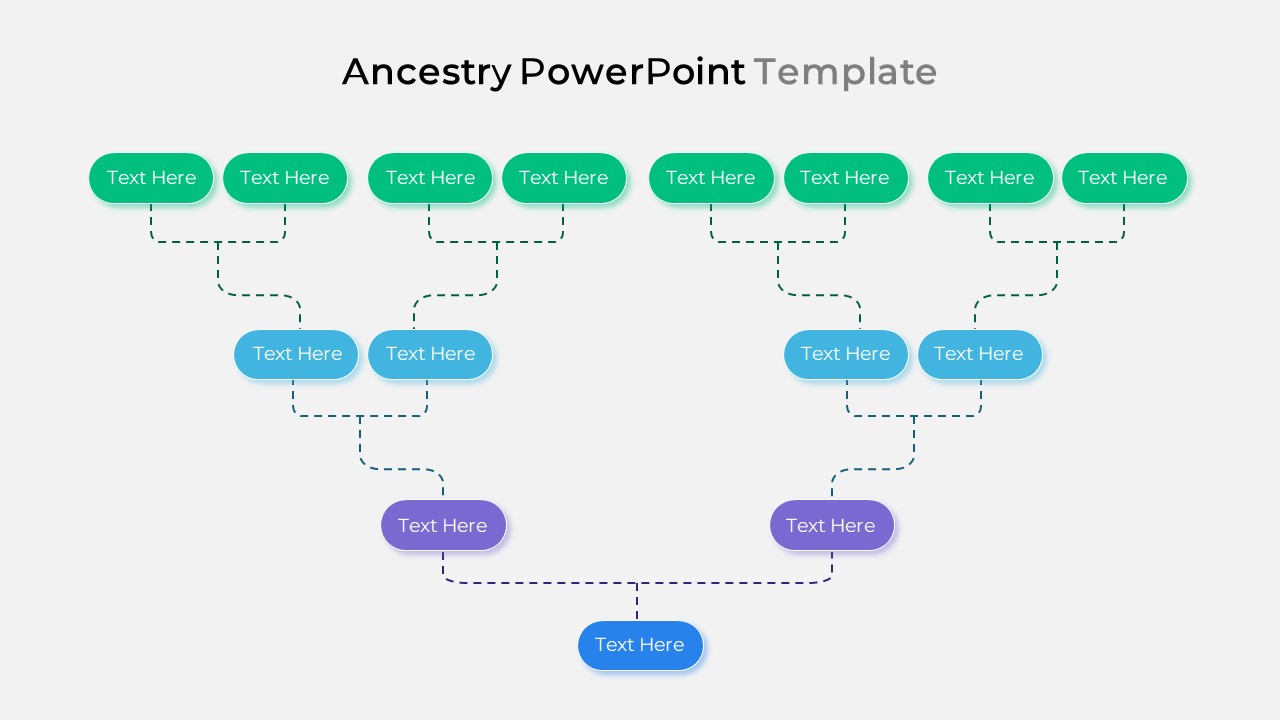
Smart Ancestry Diagram Family Tree Template for PowerPoint & Google Slides
Org Chart
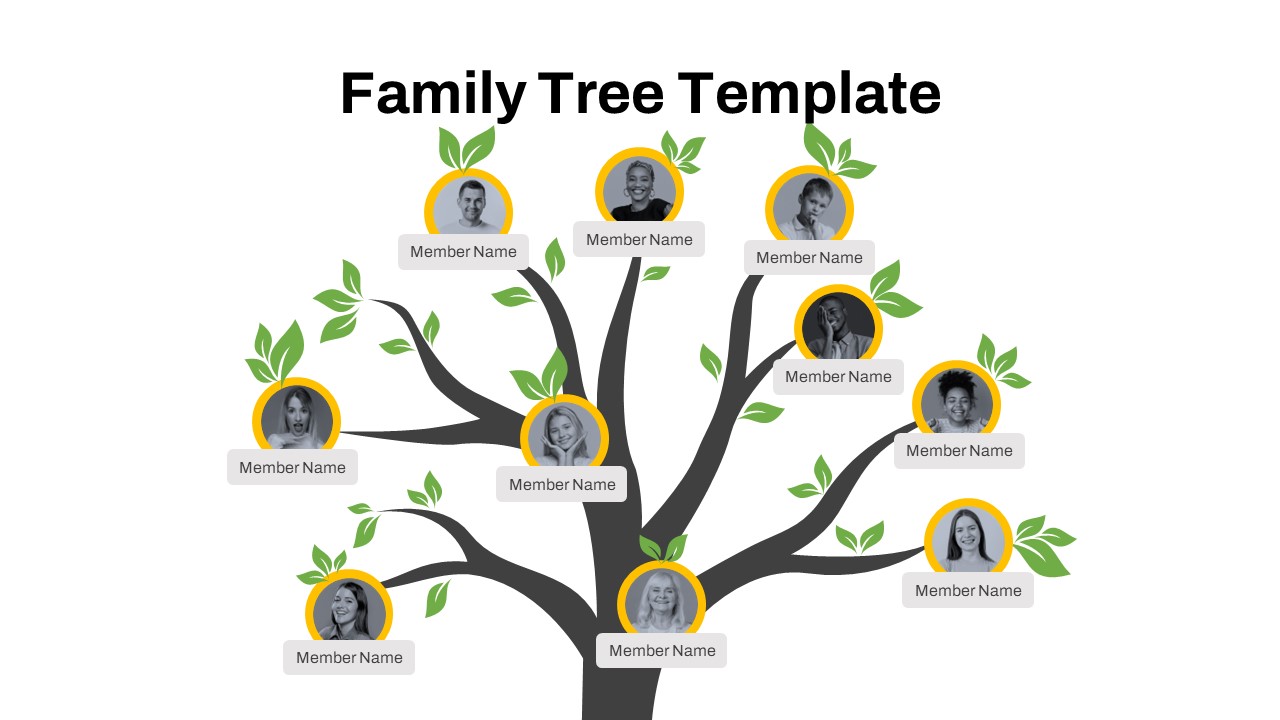
Free Editable Family Tree Genealogy Diagram Template for PowerPoint & Google Slides
Org Chart
Free
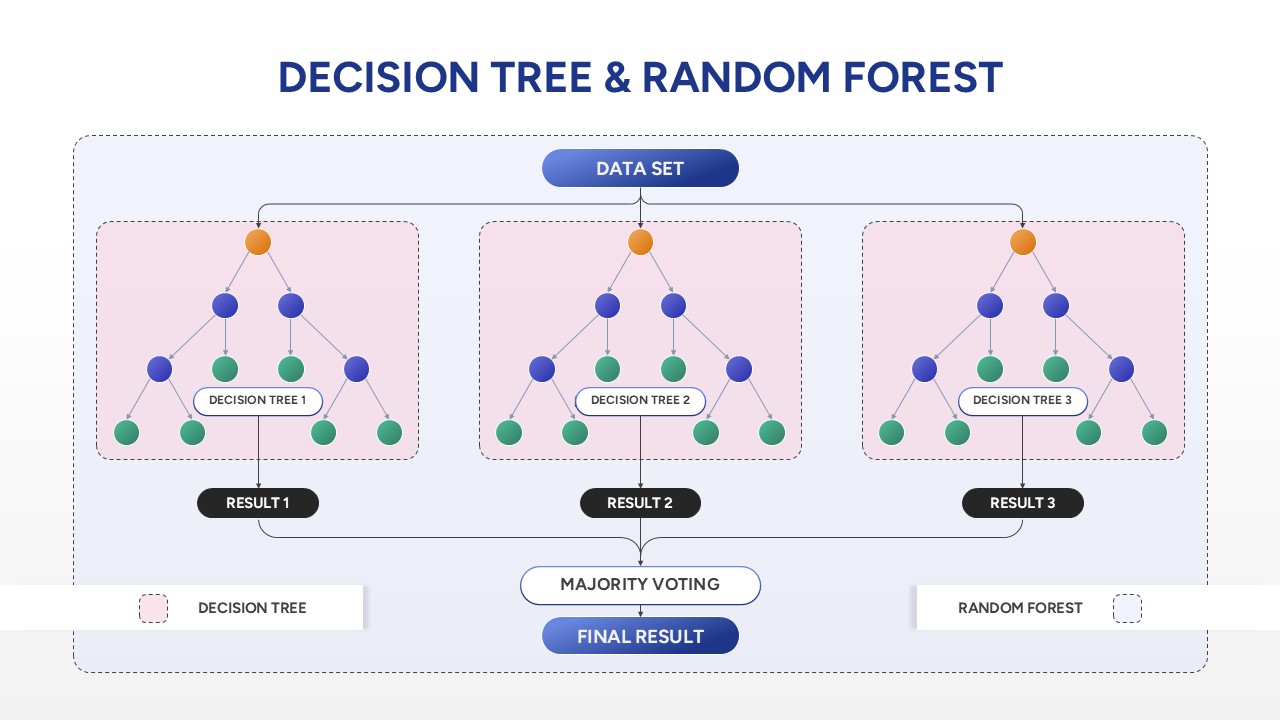
Decision Tree & Random Forest template for PowerPoint & Google Slides
Technology
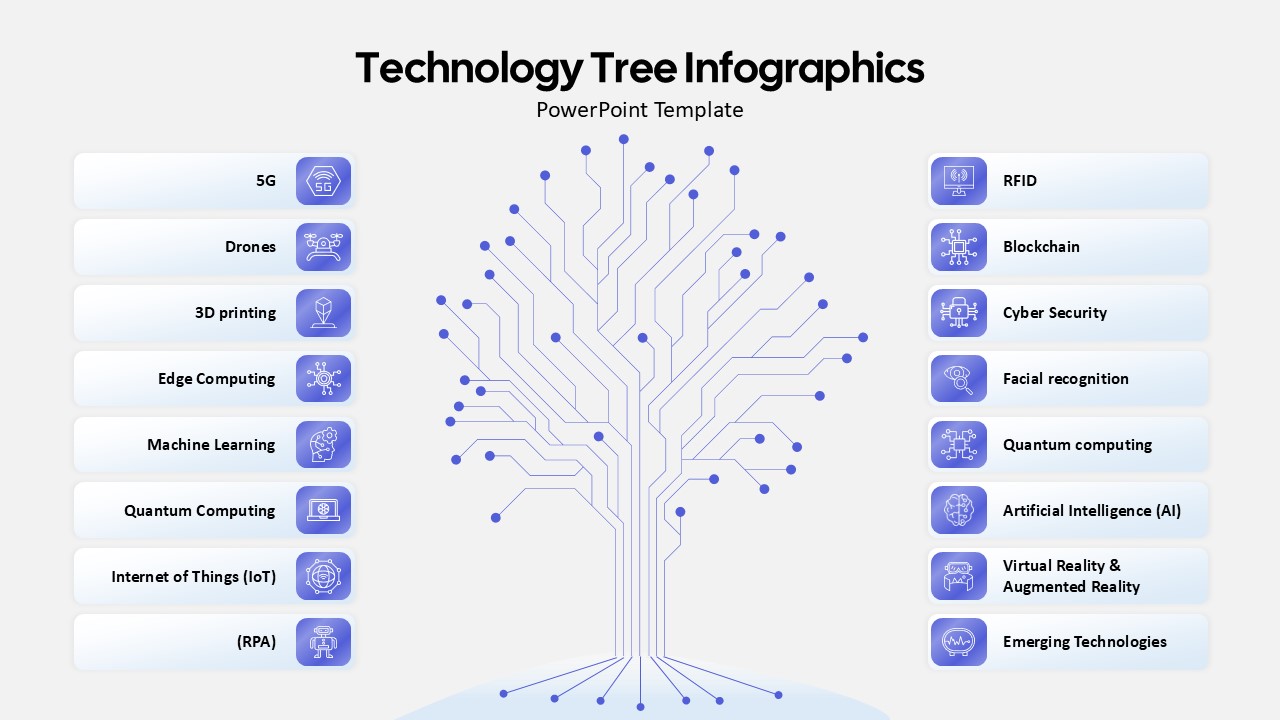
Technology Tree Infographics Template for PowerPoint & Google Slides
AI
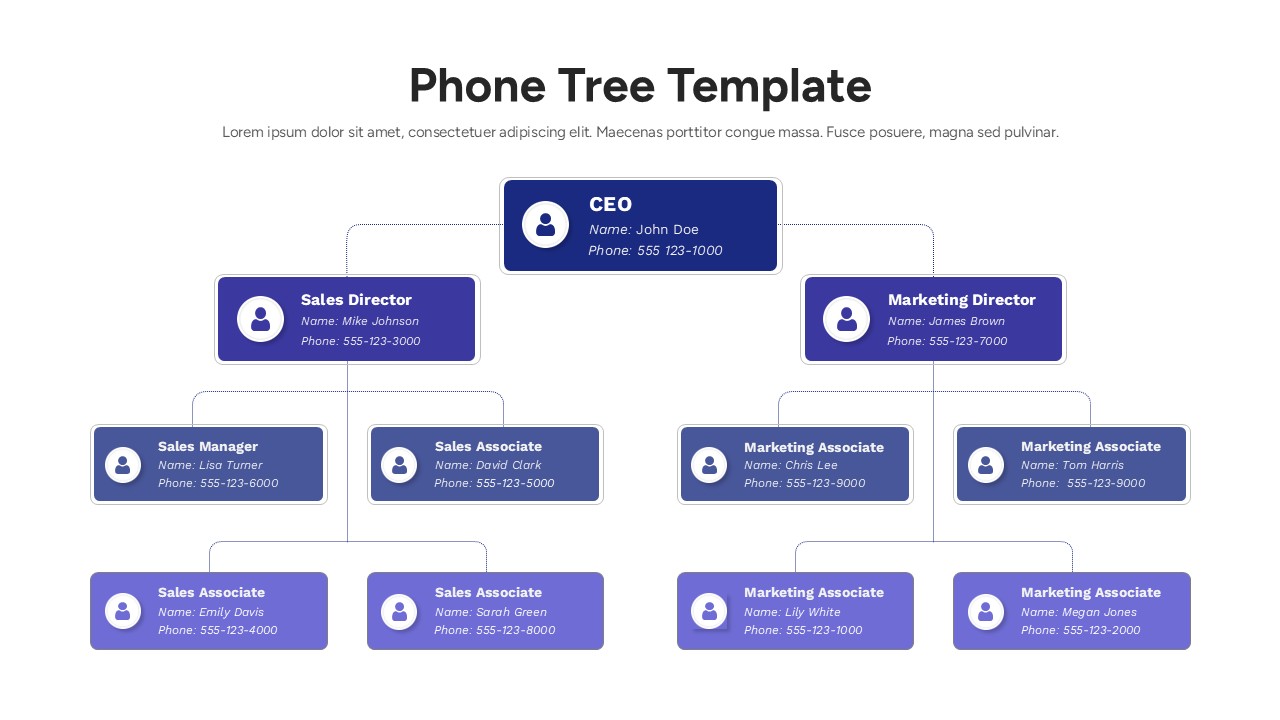
Corporate Phone Tree Hierarchy Template for PowerPoint & Google Slides
Org Chart
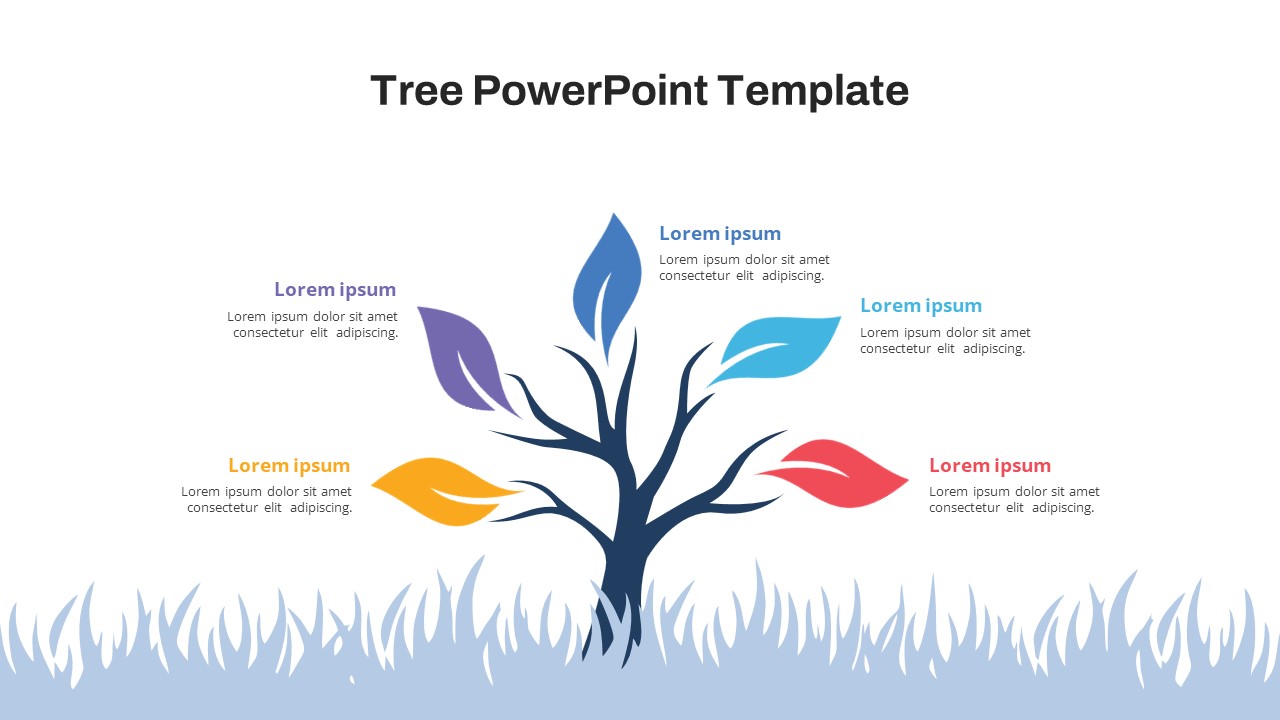
Free Colorful Tree Diagram for Growth & Strategy in PowerPoint & Google Slides
Infographics
Free
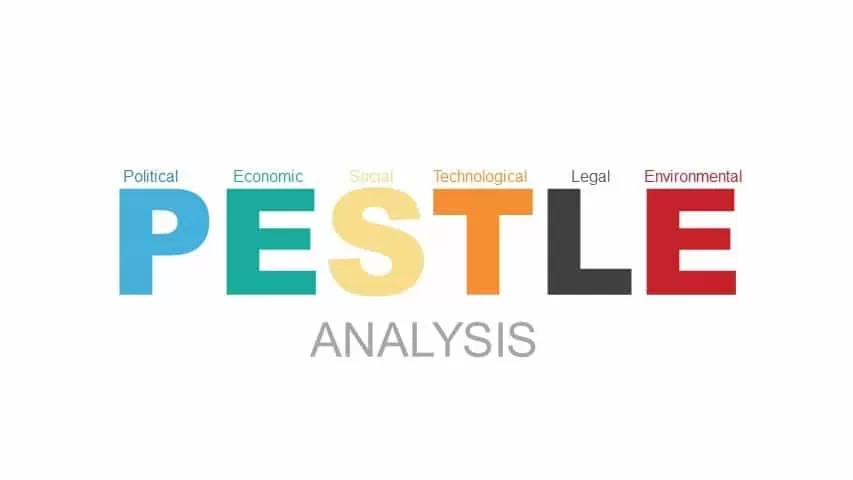
PESTLE Analysis Deck Template for PowerPoint & Google Slides
Decks
Business Case Deck with Market Analysis Template for PowerPoint & Google Slides
Business Report
Social Media Analysis Metrics Slide Deck Template for PowerPoint & Google Slides
Digital Marketing
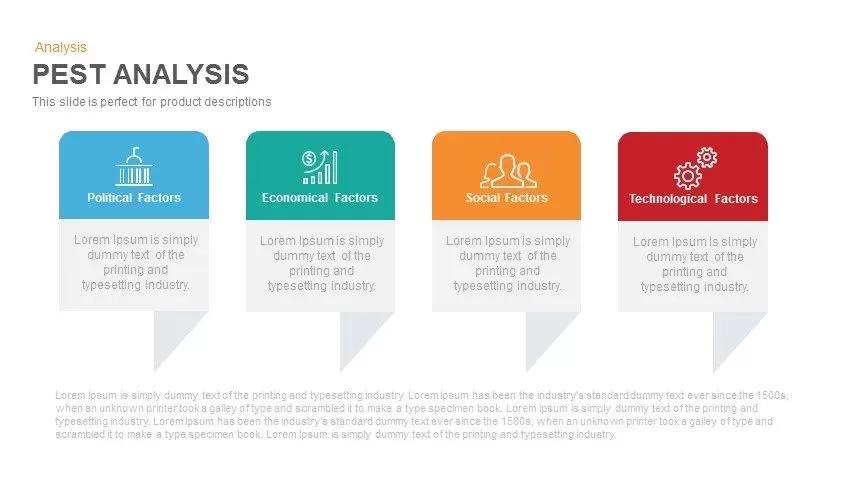
PEST Analysis PowerPoint Template for PowerPoint & Google Slides
Business Strategy
Donut Split Analysis template for PowerPoint & Google Slides
Pie/Donut

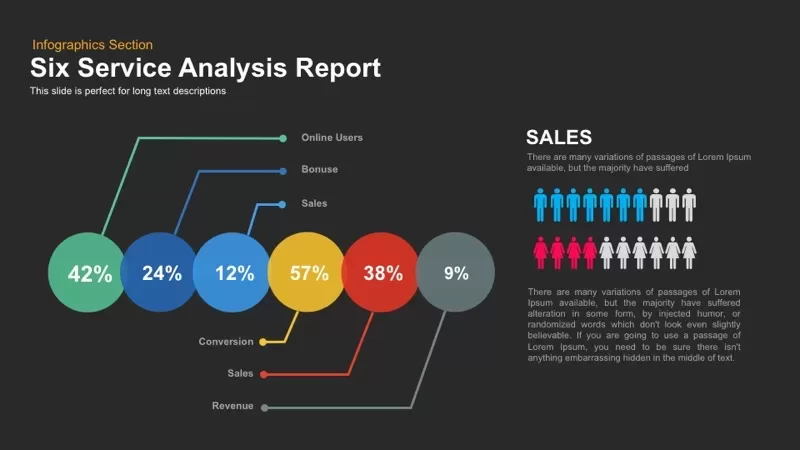
Six Service Analysis Report template for PowerPoint & Google Slides
Infographics
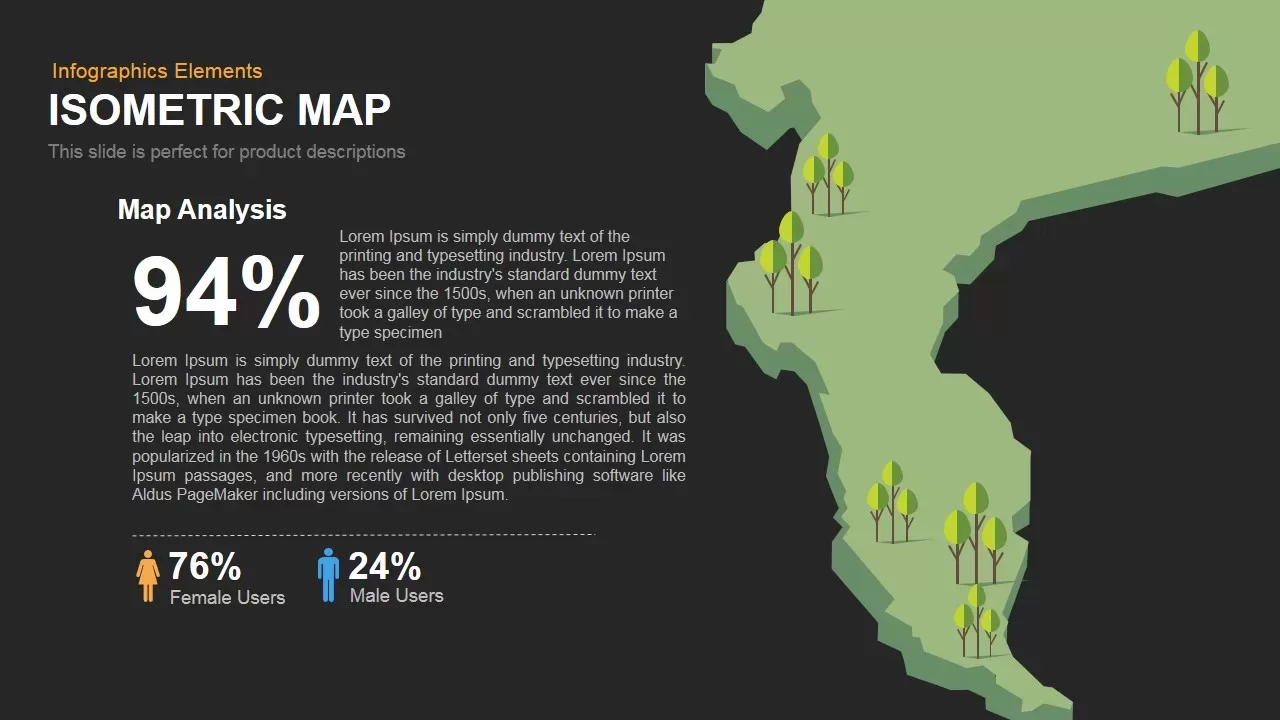
Isometric Map Analysis Slide Template for PowerPoint & Google Slides
World Maps
E-Learning Report Analysis Template for PowerPoint & Google Slides
Infographics
Pencil Bar Chart Data Analysis Template for PowerPoint & Google Slides
Bar/Column
PEST Analysis Template for PowerPoint & Google Slides
PEST
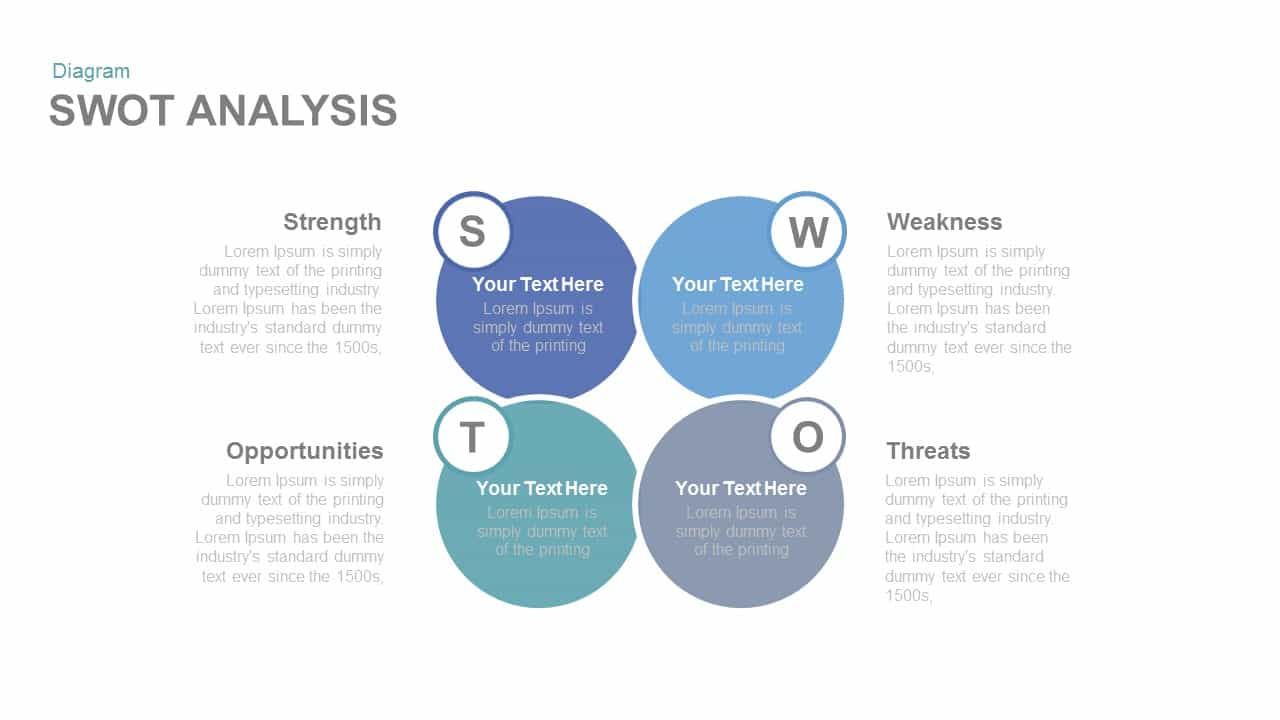
Free SWOT Analysis template for PowerPoint & Google Slides
SWOT
Free
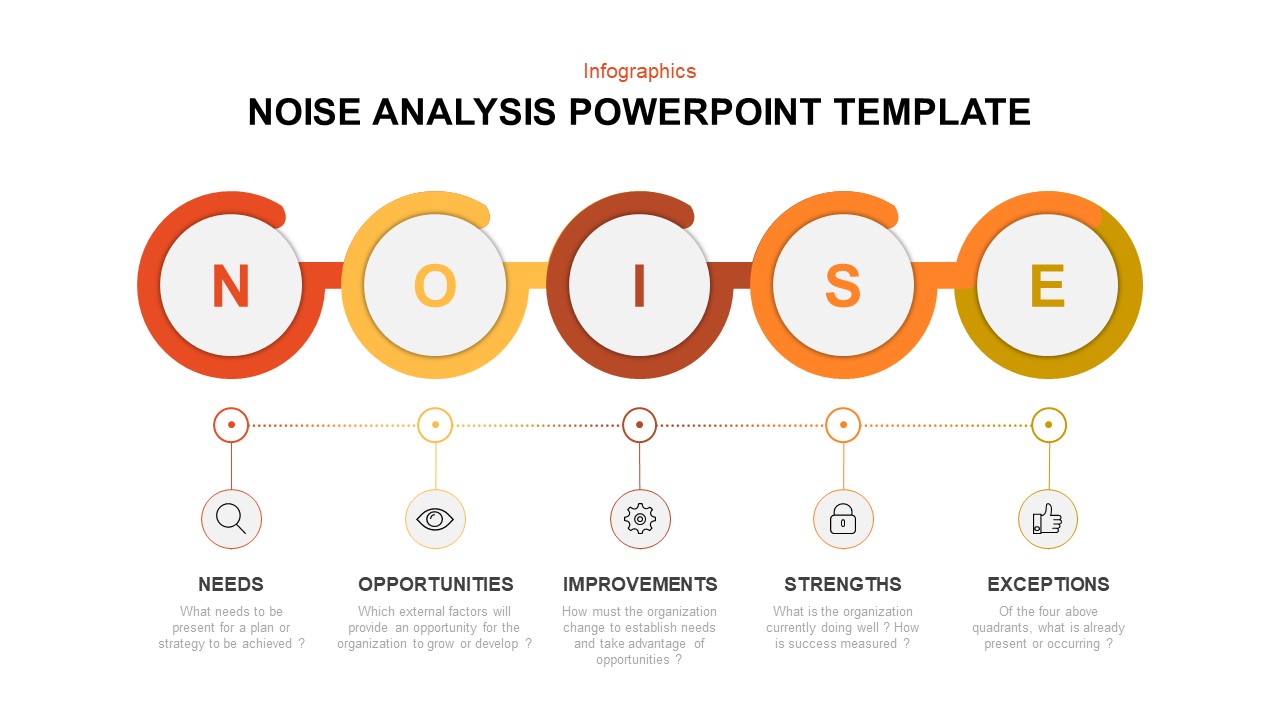
Modern Noise Analysis Infographic Template for PowerPoint & Google Slides
Process
Four-Part SWOT Analysis Diagram Template for PowerPoint & Google Slides
SWOT
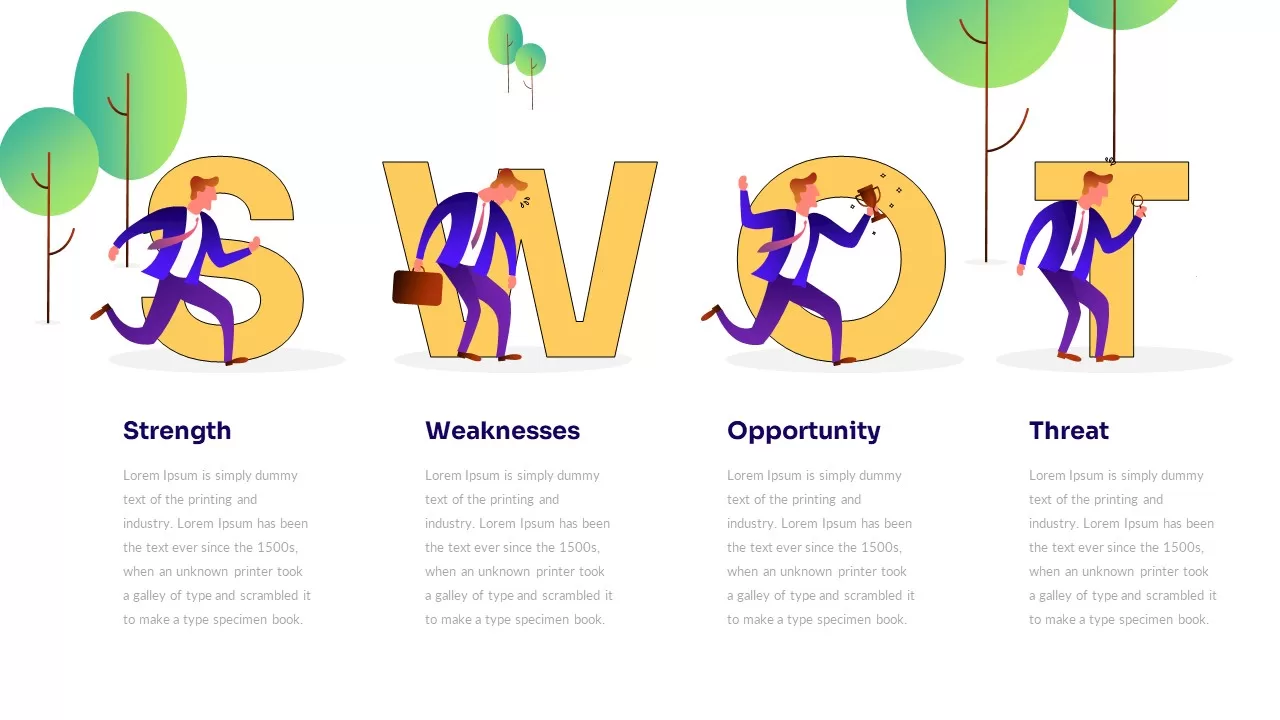
Illustrated Business SWOT Analysis Template for PowerPoint & Google Slides
SWOT

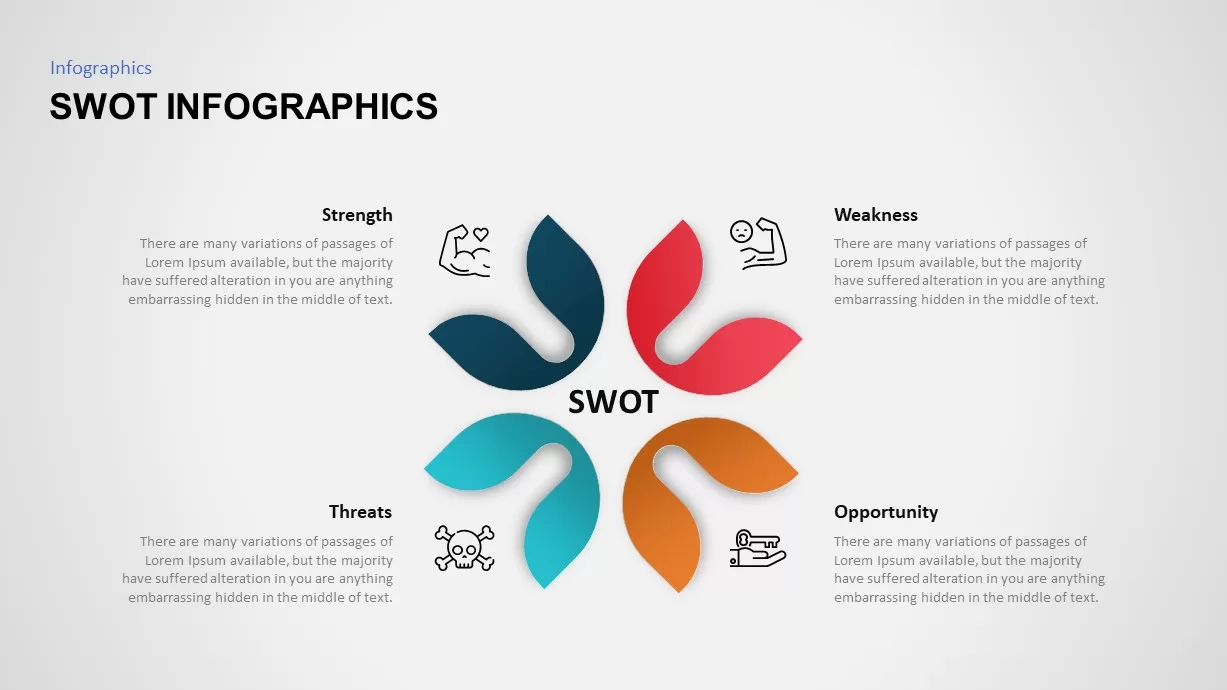
SWOT Analysis Petal Infographic Template for PowerPoint & Google Slides
SWOT
Break-Even Analysis template for PowerPoint & Google Slides
Process
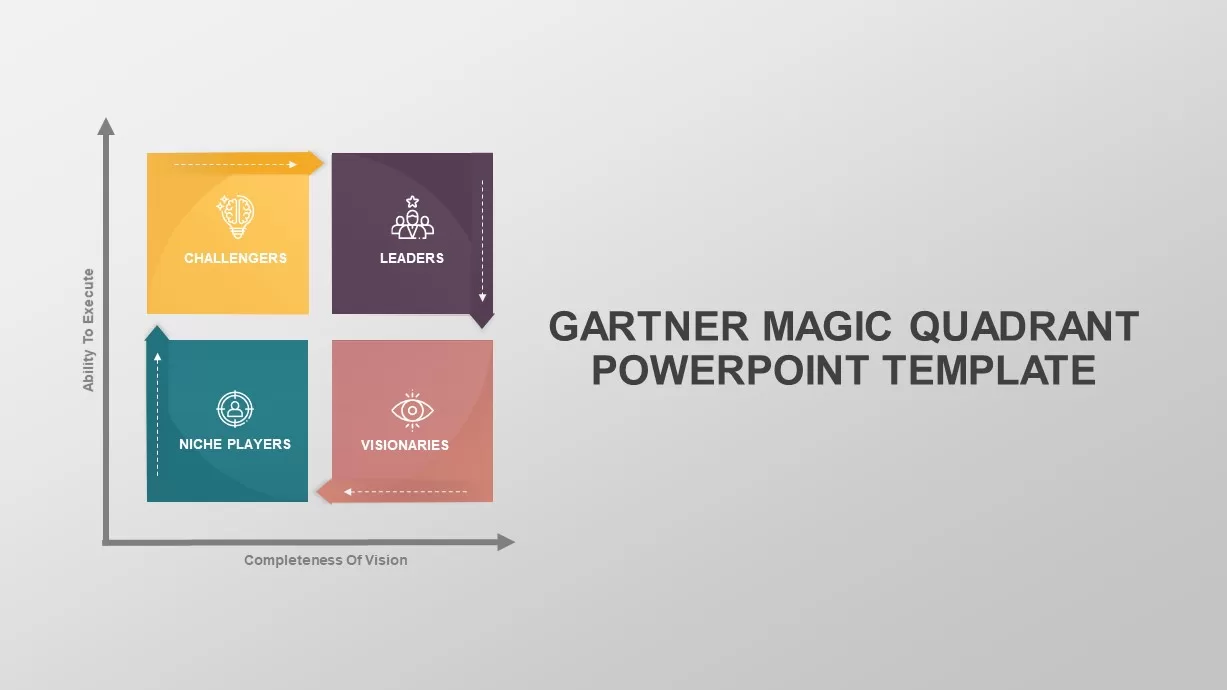
Gartner Magic Quadrant Analysis Template for PowerPoint & Google Slides
Business
SWOT Analysis Circular Infographic Template for PowerPoint & Google Slides
SWOT
Stakeholder Analysis Template for PowerPoint & Google Slides
Business
Comprehensive Competitor Analysis Template for PowerPoint & Google Slides
Competitor Analysis
VMOST Analysis Template for PowerPoint & Google Slides
Business Strategy
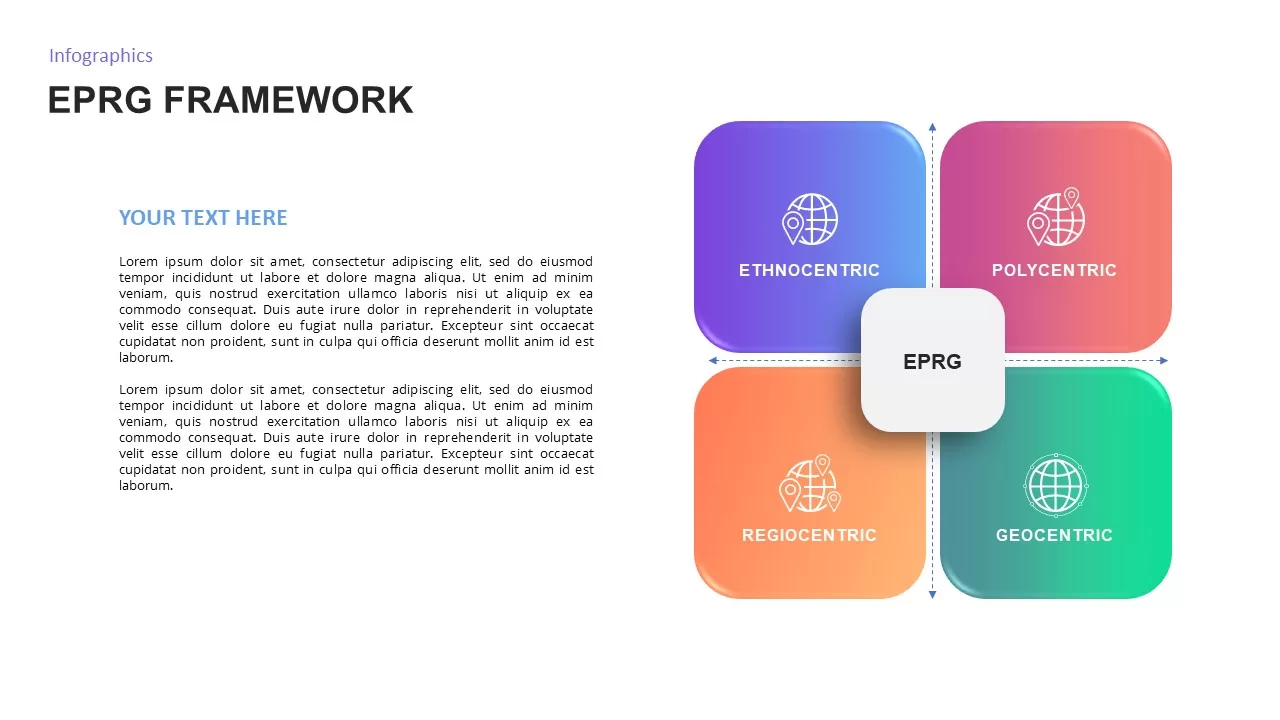
EPRG Framework Analysis template for PowerPoint & Google Slides
Business Strategy
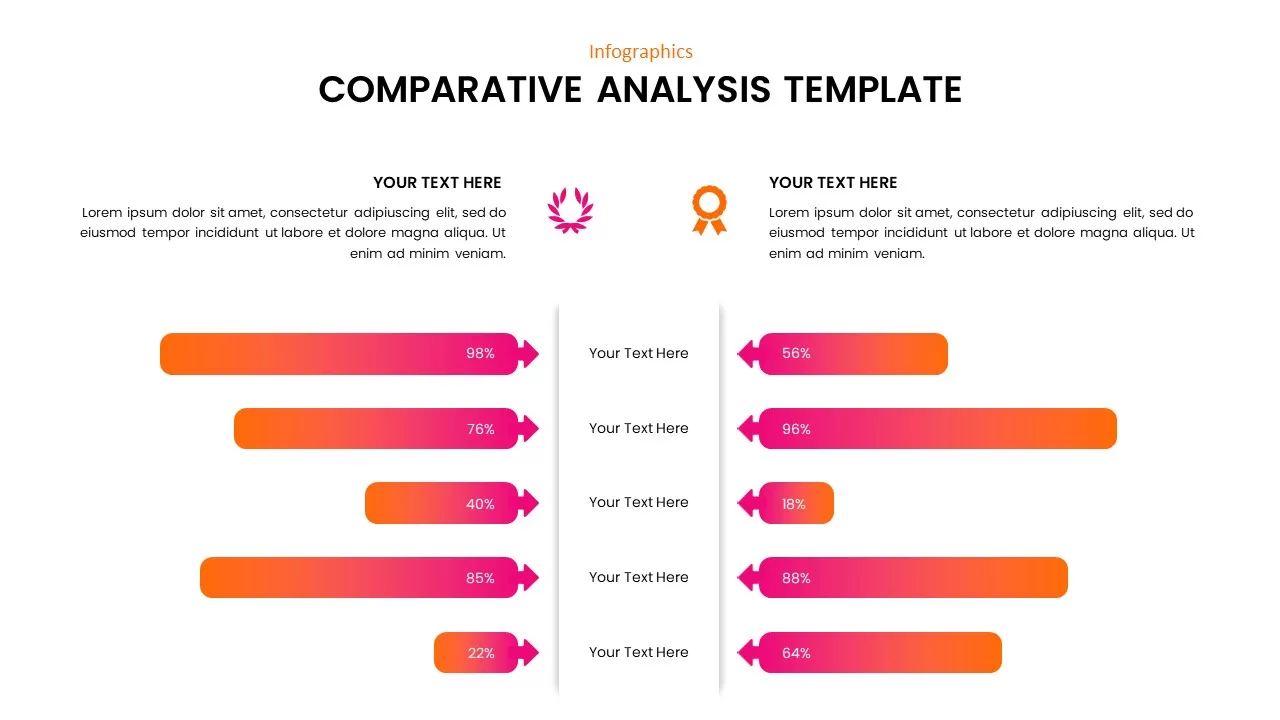
Comparative Analysis template for PowerPoint & Google Slides
Business Report
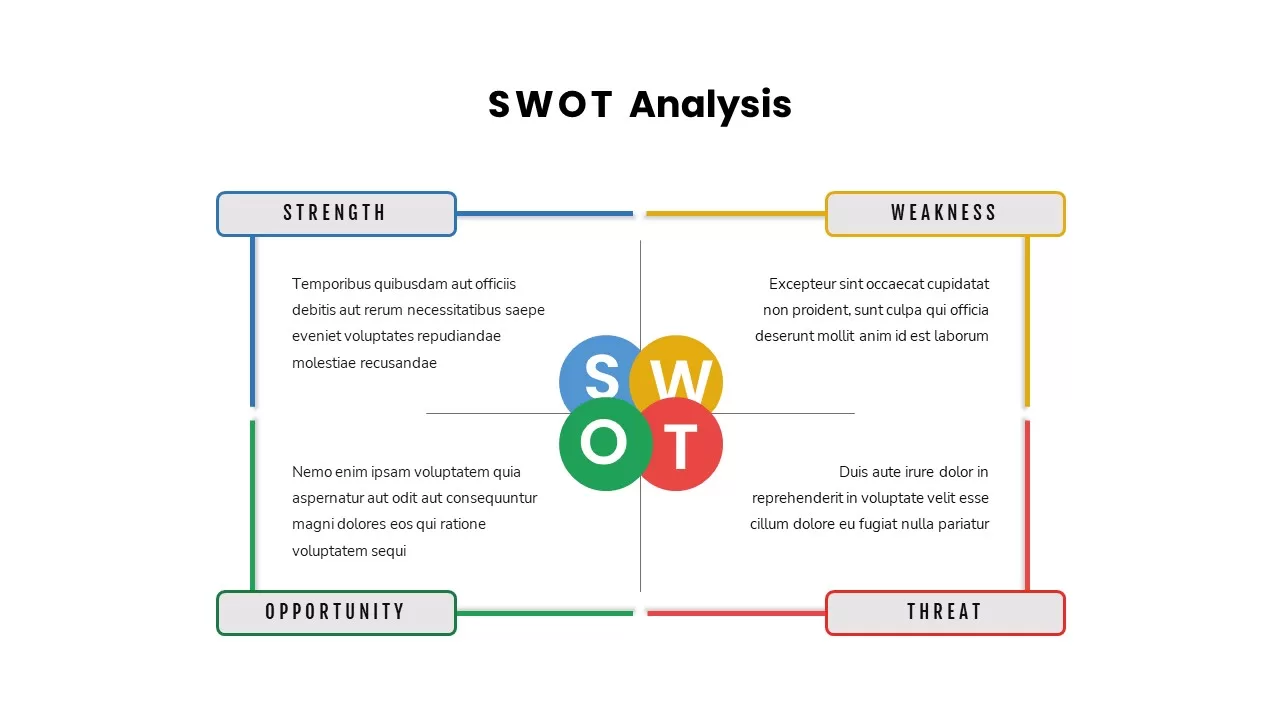
SWOT Analysis Quadrant template for PowerPoint & Google Slides
Business Strategy
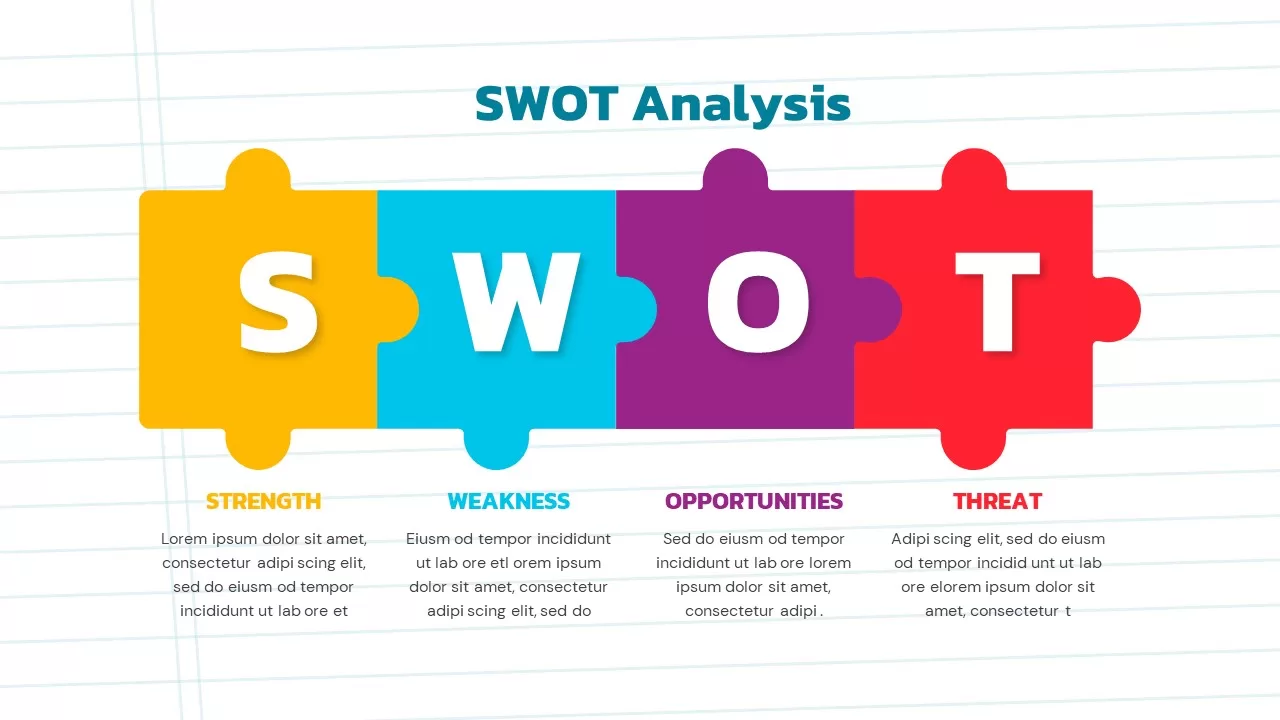
Puzzle Piece SWOT Analysis Diagram Template for PowerPoint & Google Slides
Opportunities Challenges
Photo Personal SWOT Analysis Callouts Template for PowerPoint & Google Slides
SWOT
Current vs Future State Gap Analysis template for PowerPoint & Google Slides
Comparison
Dual-Color Cost vs Benefit Analysis Template for PowerPoint & Google Slides
Comparison
CATWOE Analysis Template for PowerPoint & Google Slides
Process
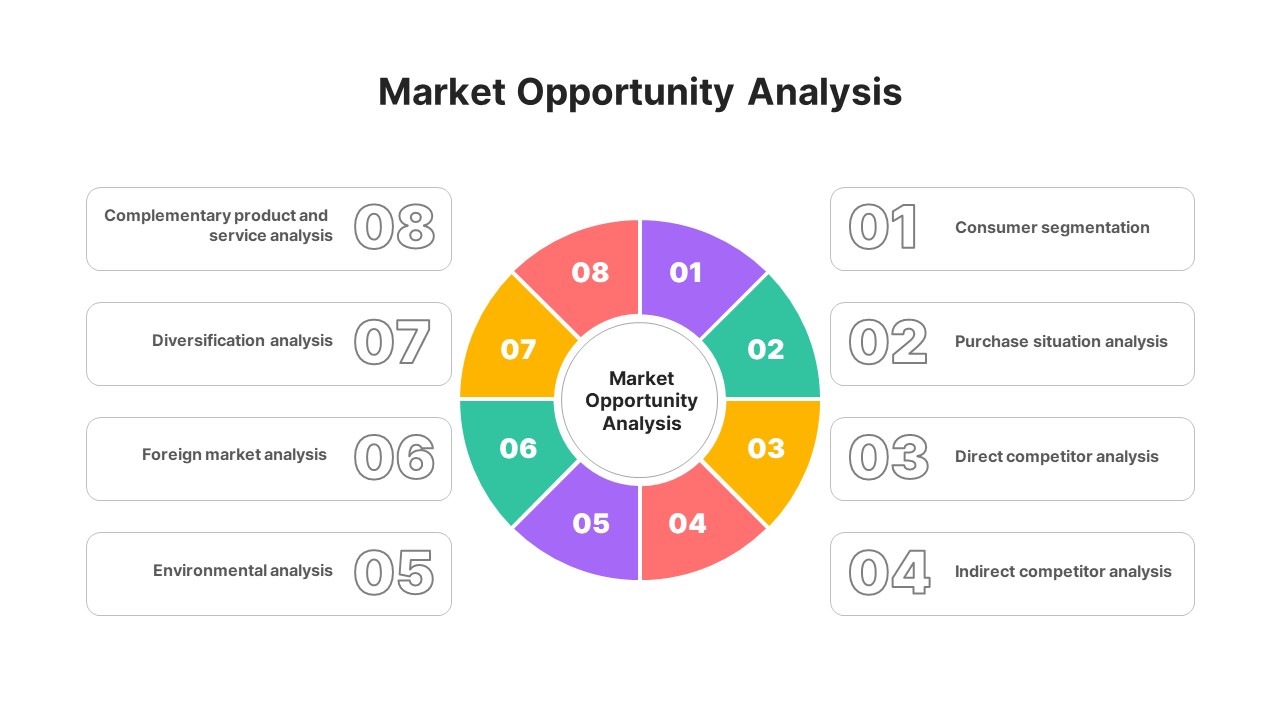
Market Opportunity Analysis Wheel template for PowerPoint & Google Slides
Business Strategy
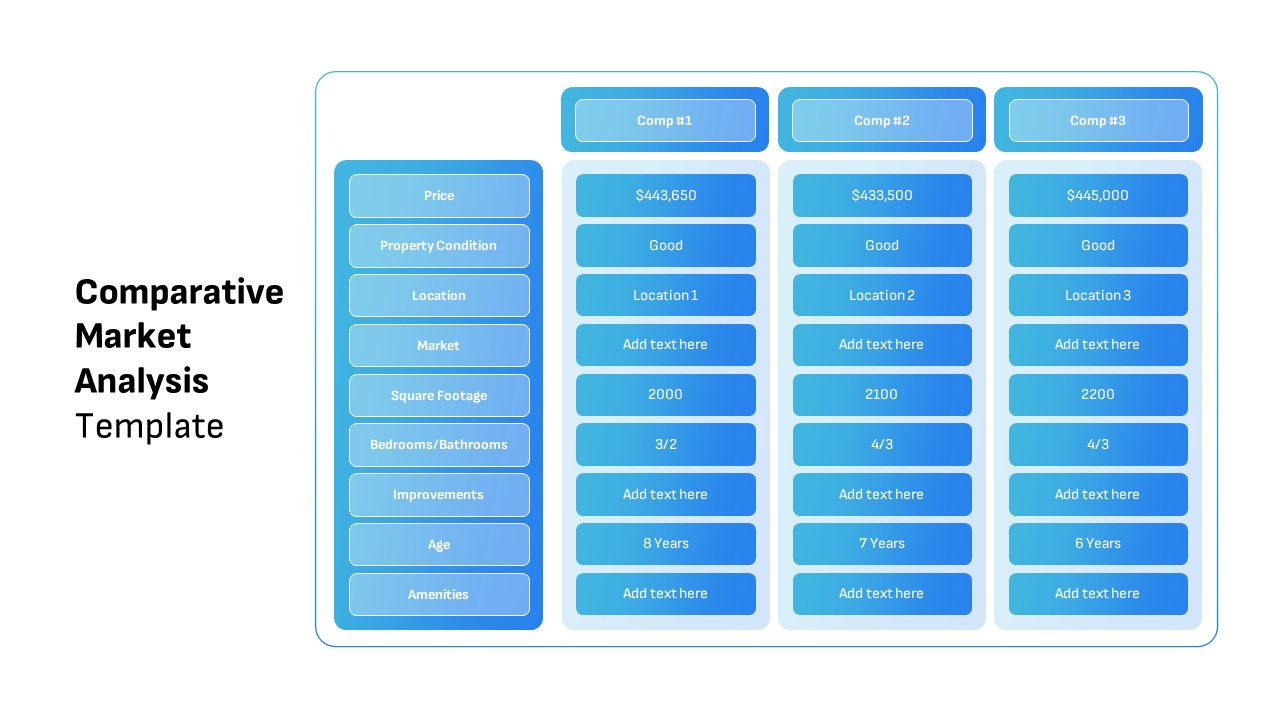
Comparative Market Analysis Template for PowerPoint & Google Slides
Comparison
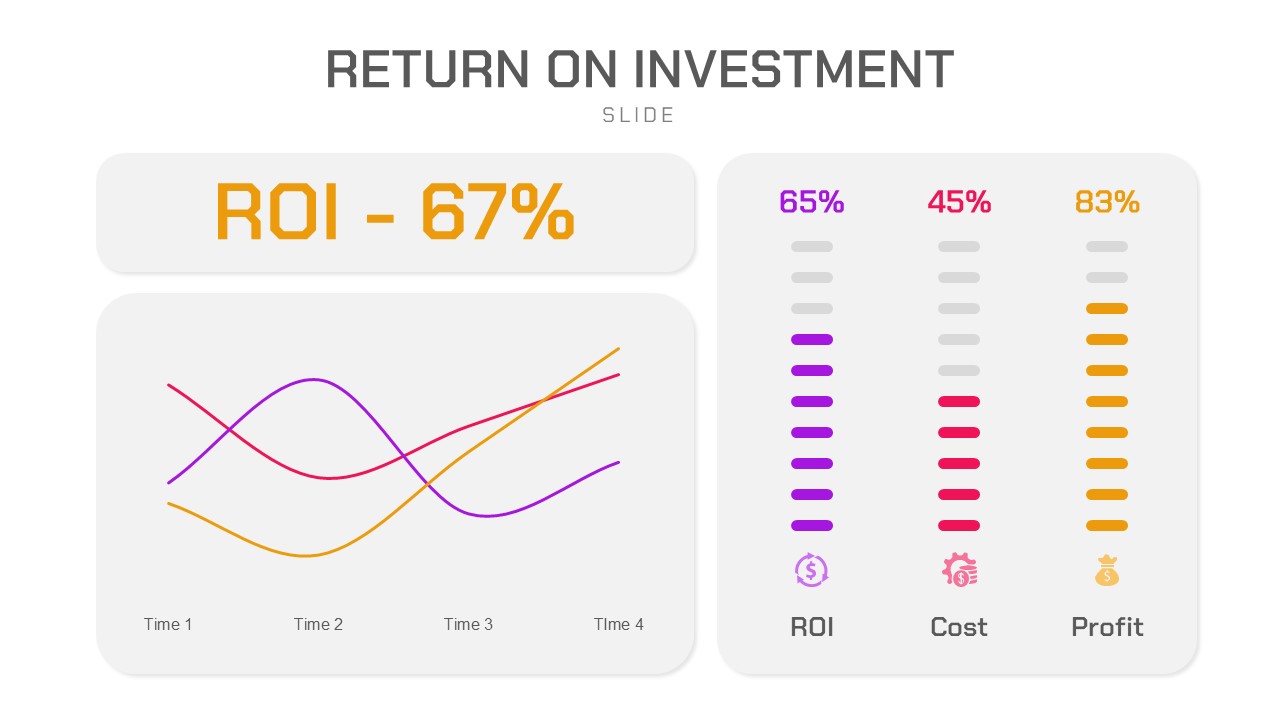
Return on Investment (ROI) Analysis template for PowerPoint & Google Slides
Business Report
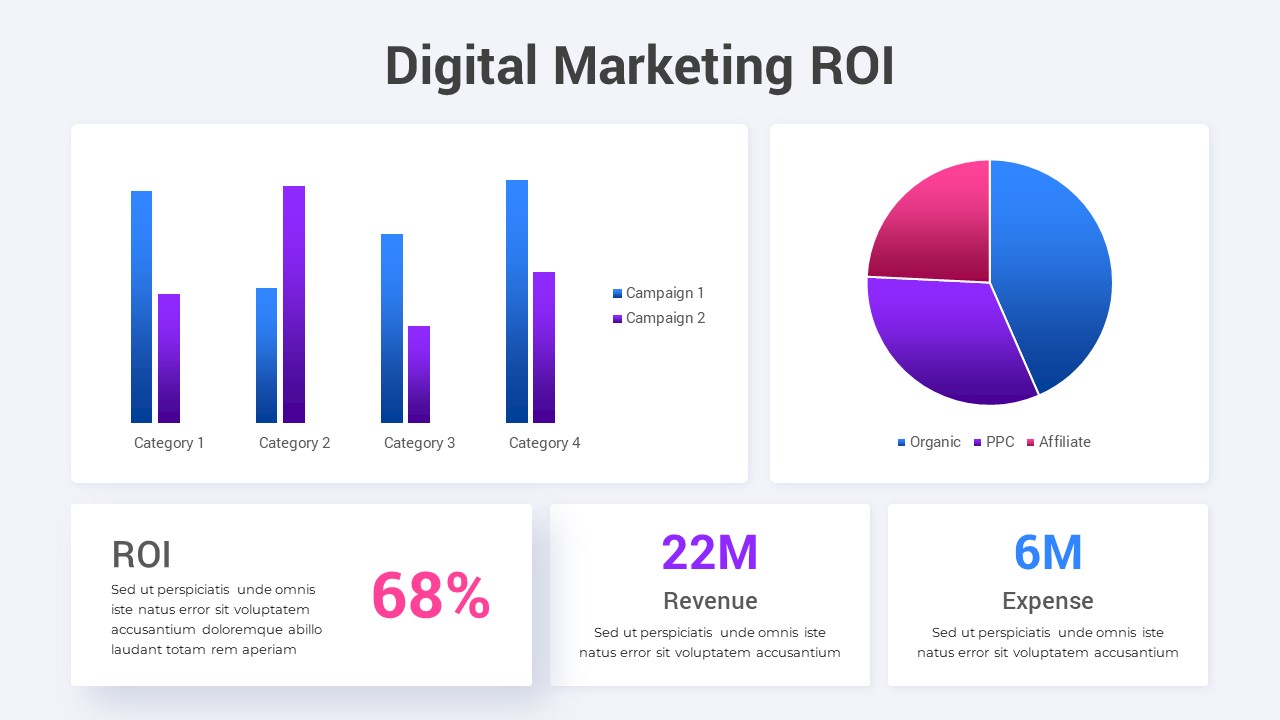
Digital Marketing ROI Analysis template for PowerPoint & Google Slides
Digital Marketing
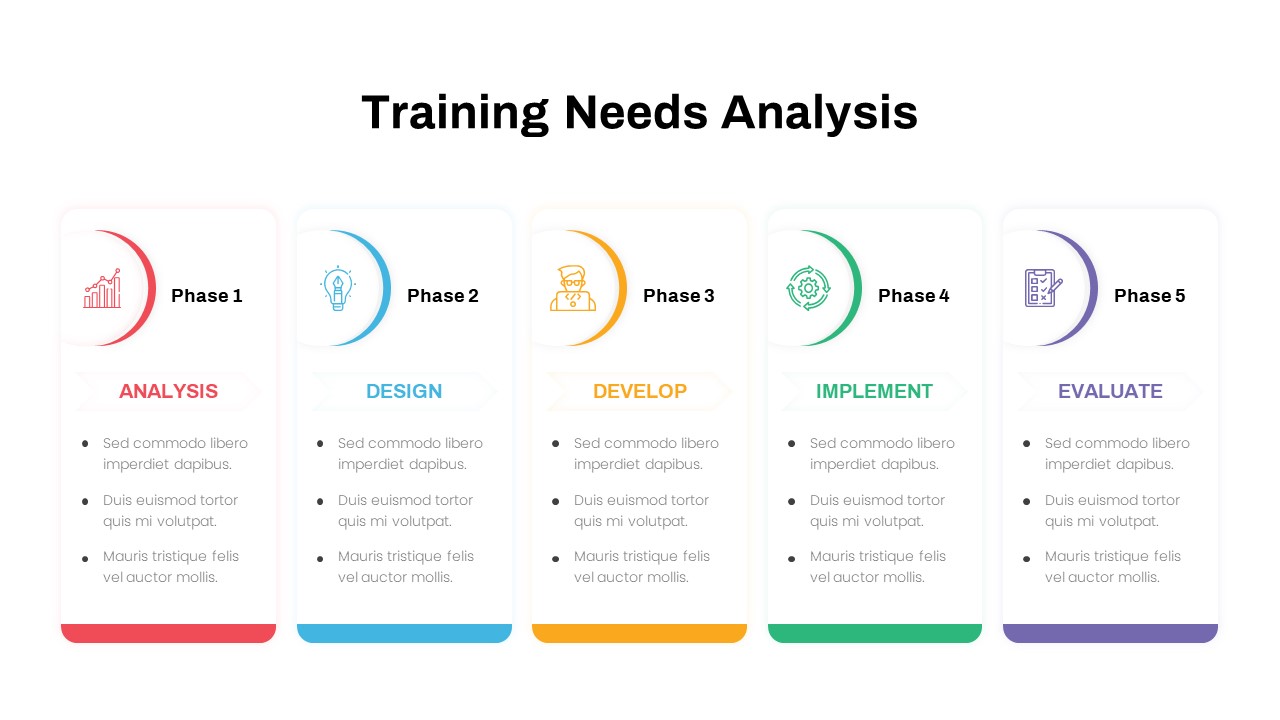
Training Needs Analysis Process Template for PowerPoint & Google Slides
Employee Performance
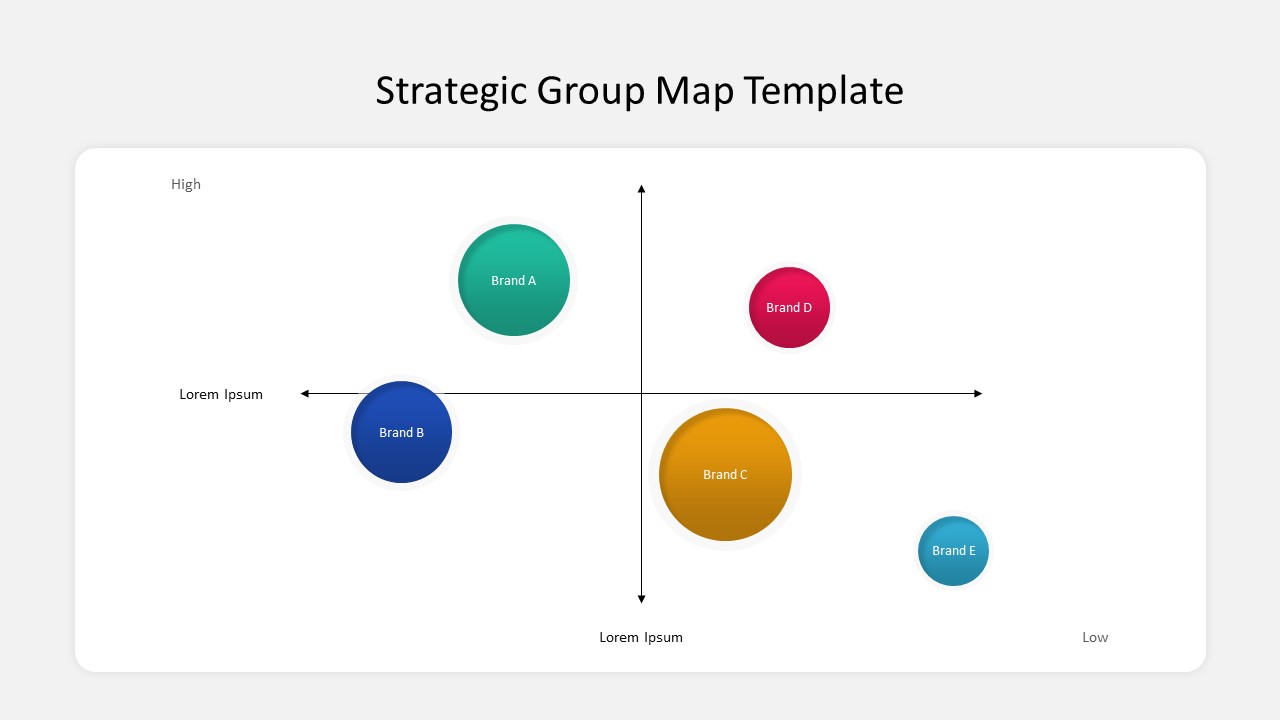
Business Strategic Group Map Analysis Template for PowerPoint & Google Slides
Competitor Analysis
Free
Neon Dark Stock Market Analysis Template for PowerPoint & Google Slides
Pitch Deck
Free
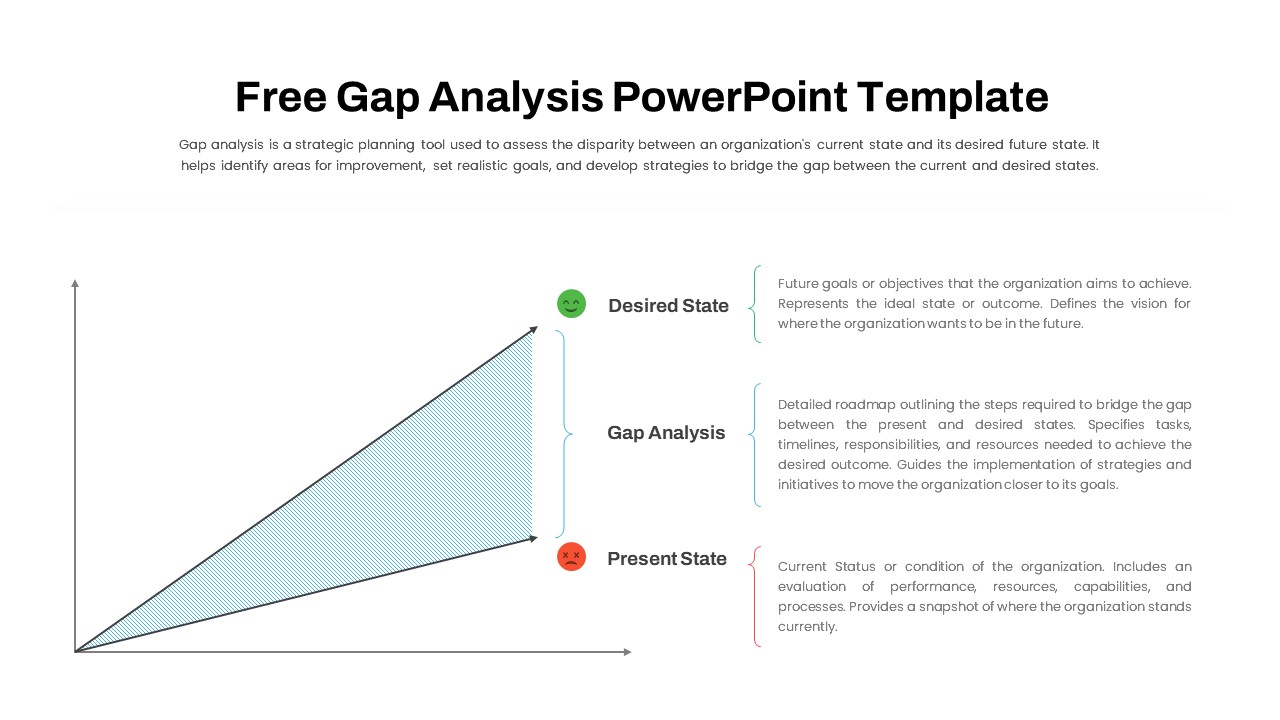
Free Comprehensive Gap Analysis Framework Template for PowerPoint & Google Slides
Opportunities Challenges
Free
Annual Growth Trend Analysis Chart template for PowerPoint & Google Slides
Business Report
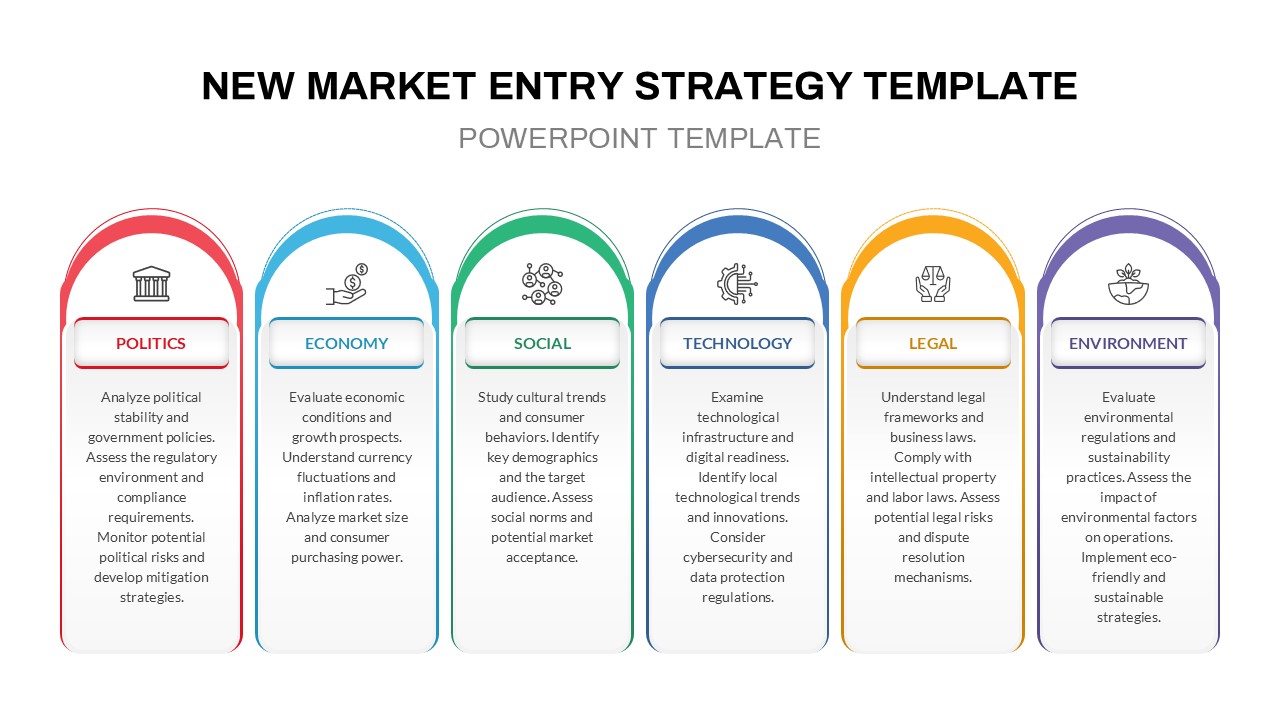
PESTLE Analysis for Market Entry Template for PowerPoint & Google Slides
PEST
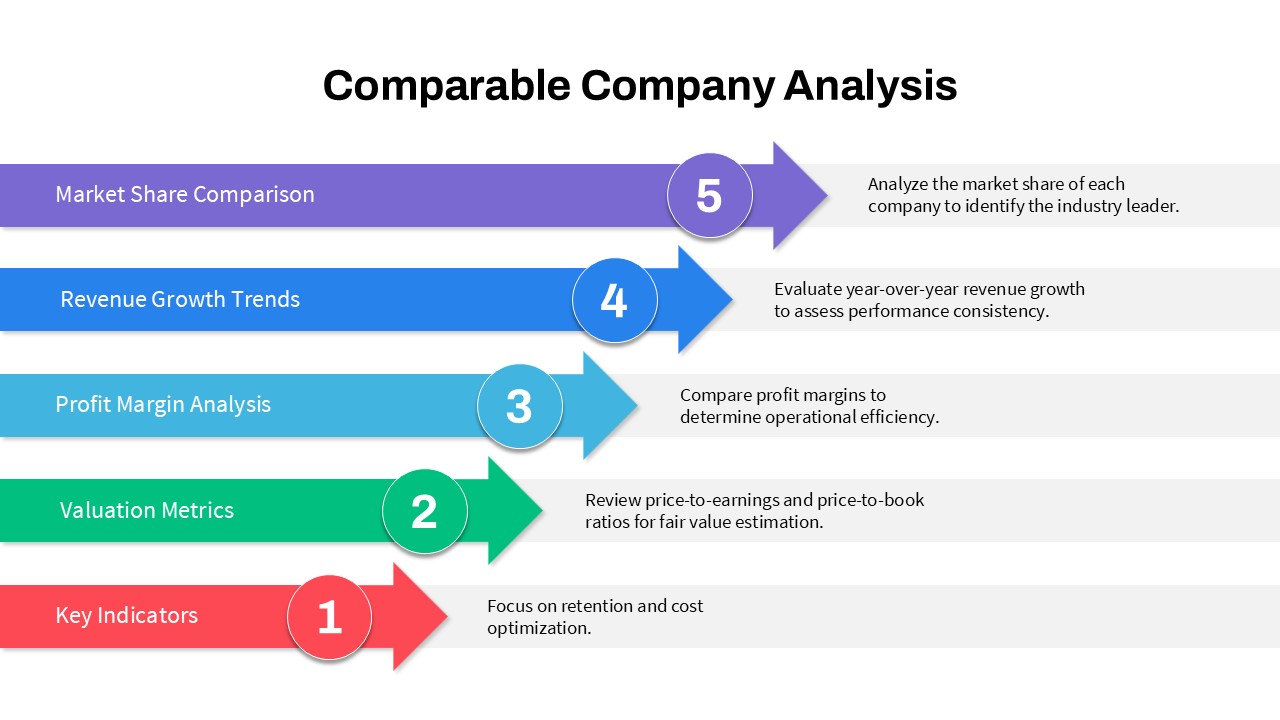
5-Step Comparable Company Analysis Template for PowerPoint & Google Slides
Arrow
Data Analysis Bar Chart with Insights Template for PowerPoint & Google Slides
Bar/Column
Free
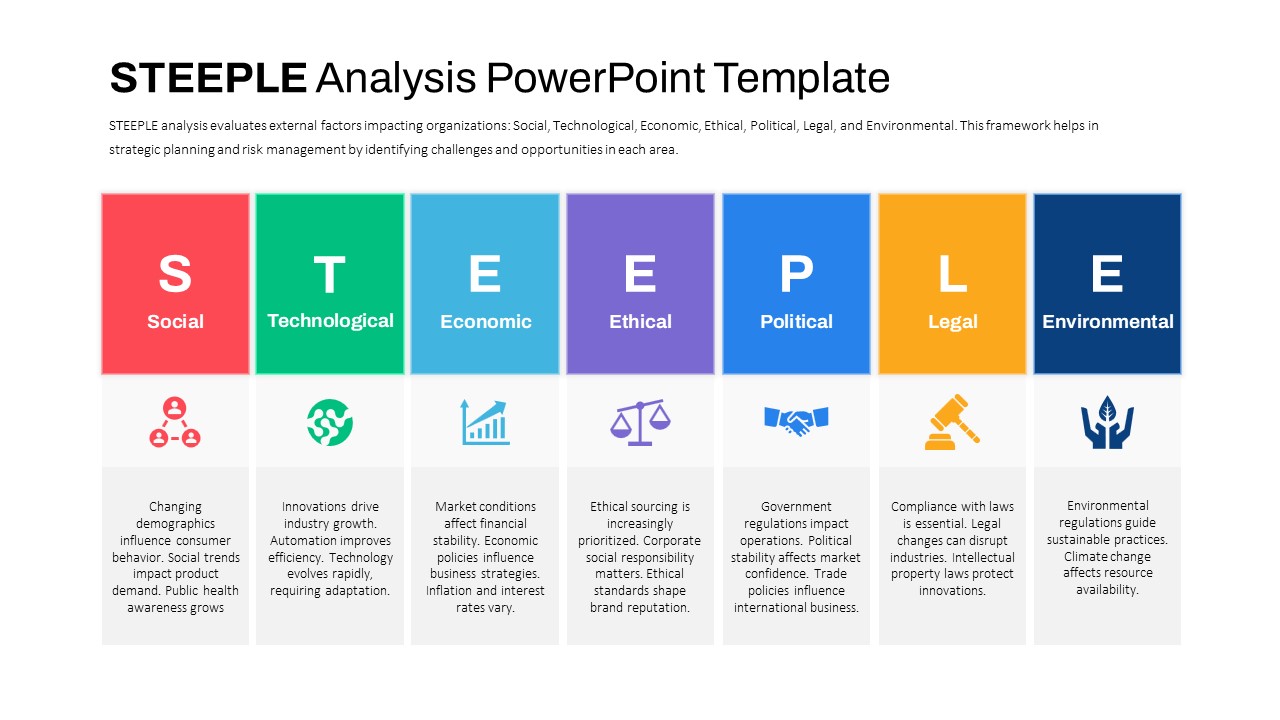
STEEPLE Analysis framework template for PowerPoint & Google Slides
Business Strategy
Two-Box Analysis & Target Comparison Template for PowerPoint & Google Slides
Comparison
Turnover Analysis Dashboard Template for PowerPoint & Google Slides
Employee Performance
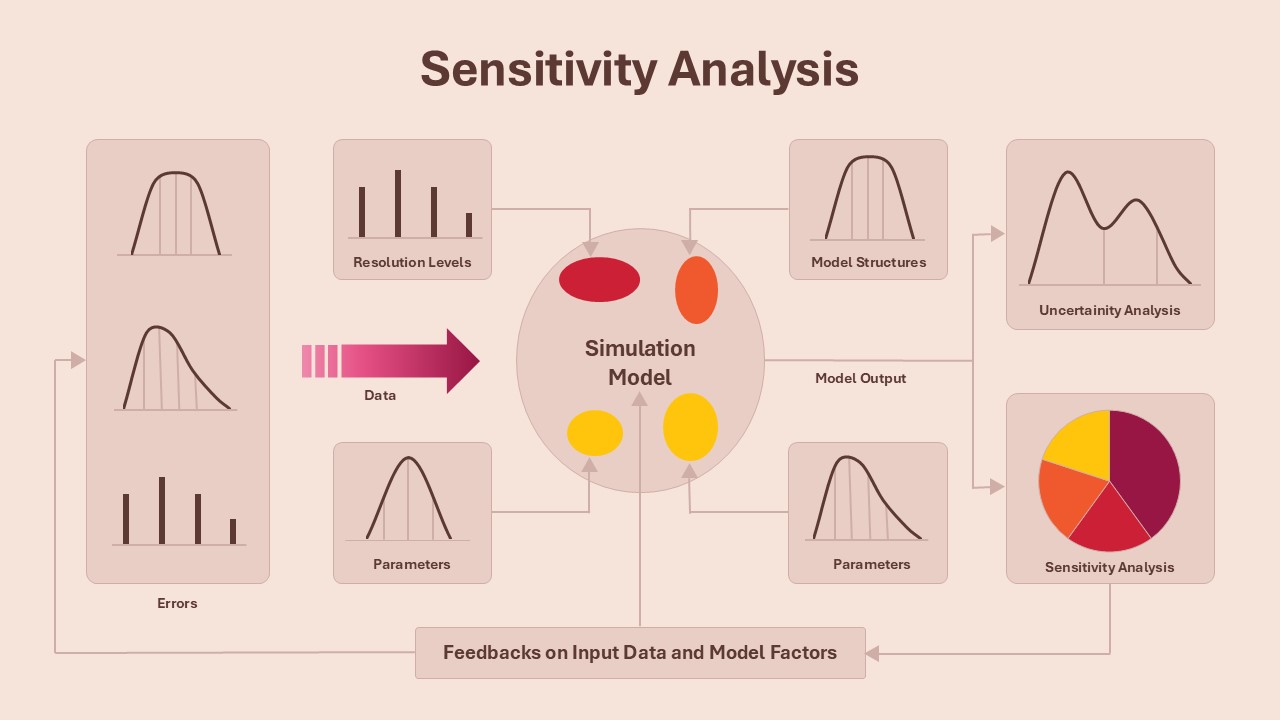
Sensitivity Analysis Framework template for PowerPoint & Google Slides
Business Strategy
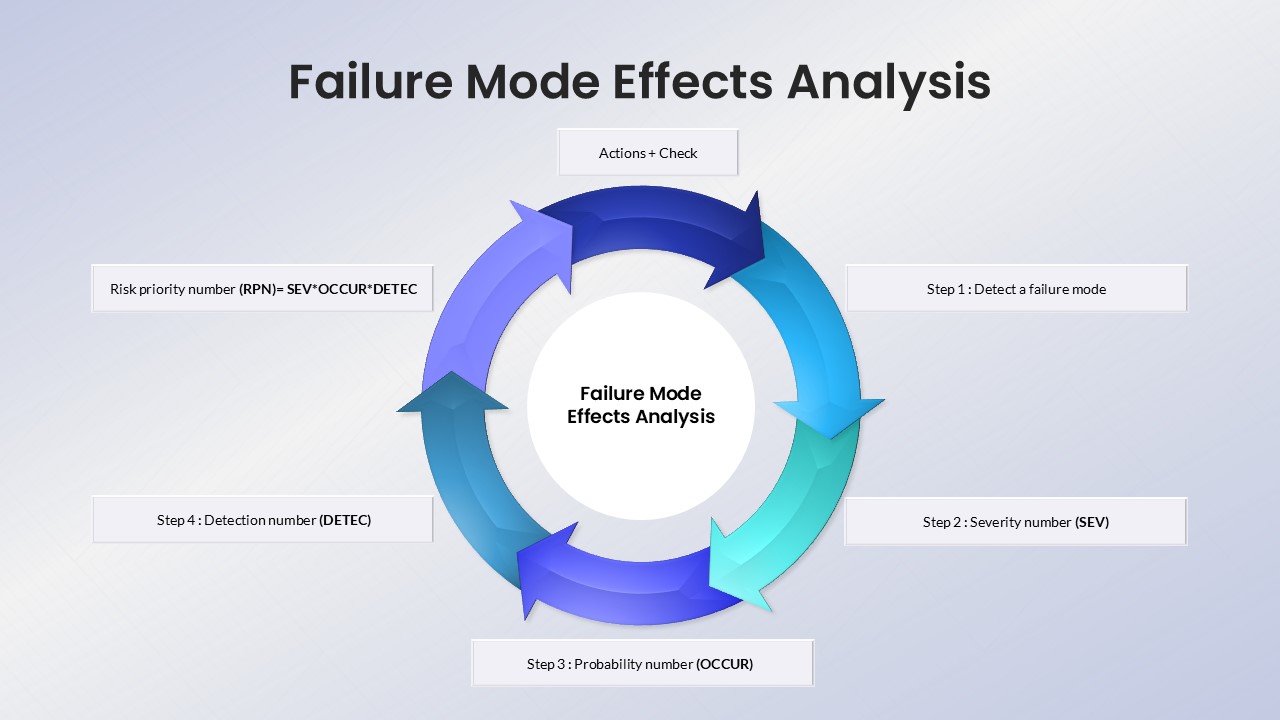
Failure Mode Effects Analysis (FMEA) Slide Template for PowerPoint & Google Slides
Process
Colorful SWOT Analysis Quadrant Template for PowerPoint & Google Slides
SWOT
Persona Analysis Template for PowerPoint & Google Slides
Infographics
Blue SWOT Analysis Presentation Template for PowerPoint & Google Slides
SWOT
Cohort Analysis Retention Dashboard Template for PowerPoint & Google Slides
Comparison Chart
Blank SWOT Analysis Template for PowerPoint & Google Slides
SWOT
3D Quadrant SWOT Analysis Template for PowerPoint & Google Slides
SWOT
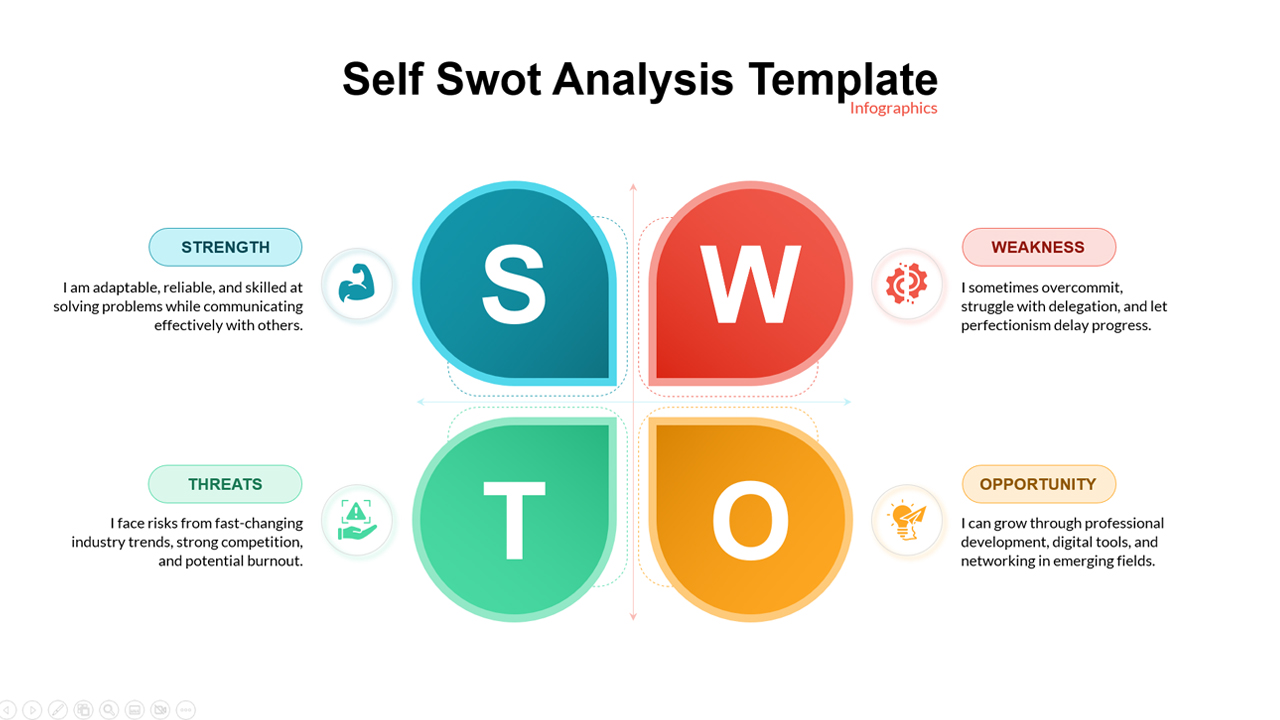
Self SWOT Analysis Template for PowerPoint & Google Slides
SWOT
Data Gap Analysis Template for PowerPoint & Google Slides
Business
Financial Gap Analysis Framework Template for PowerPoint & Google Slides
Finance