Comprehensive Risk Impact Analysis Template for PowerPoint & Google Slides


Description
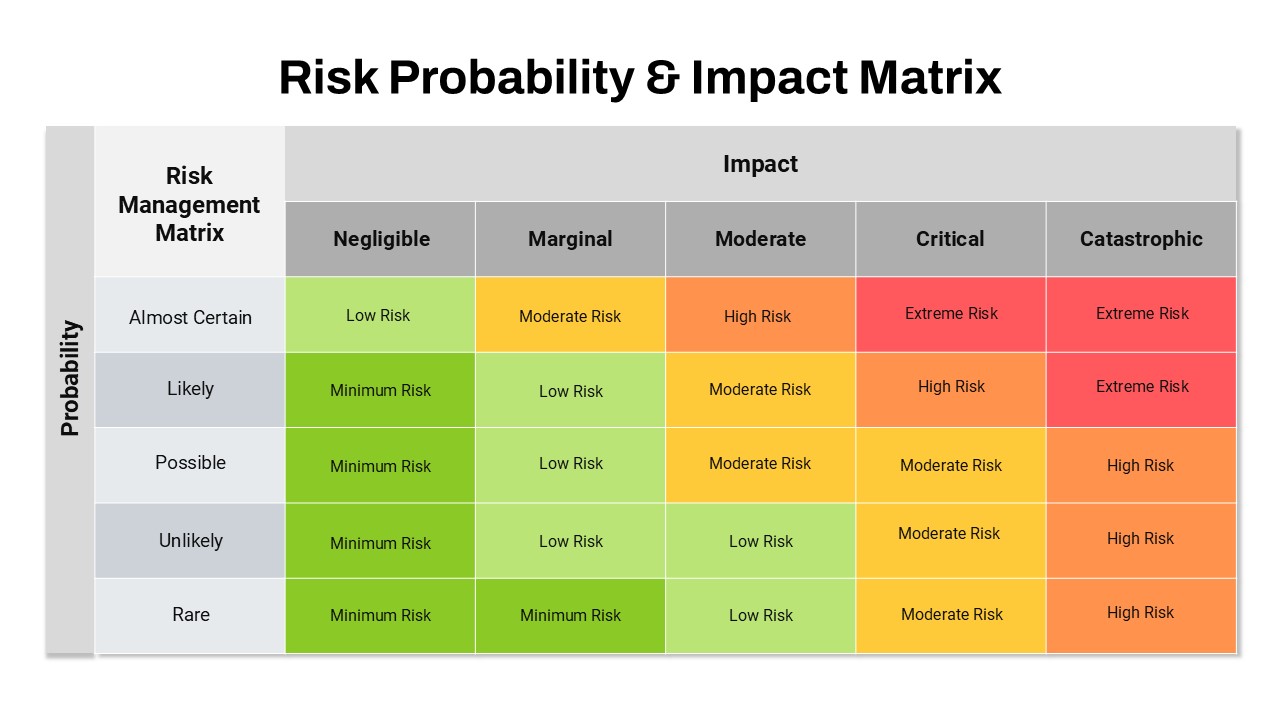
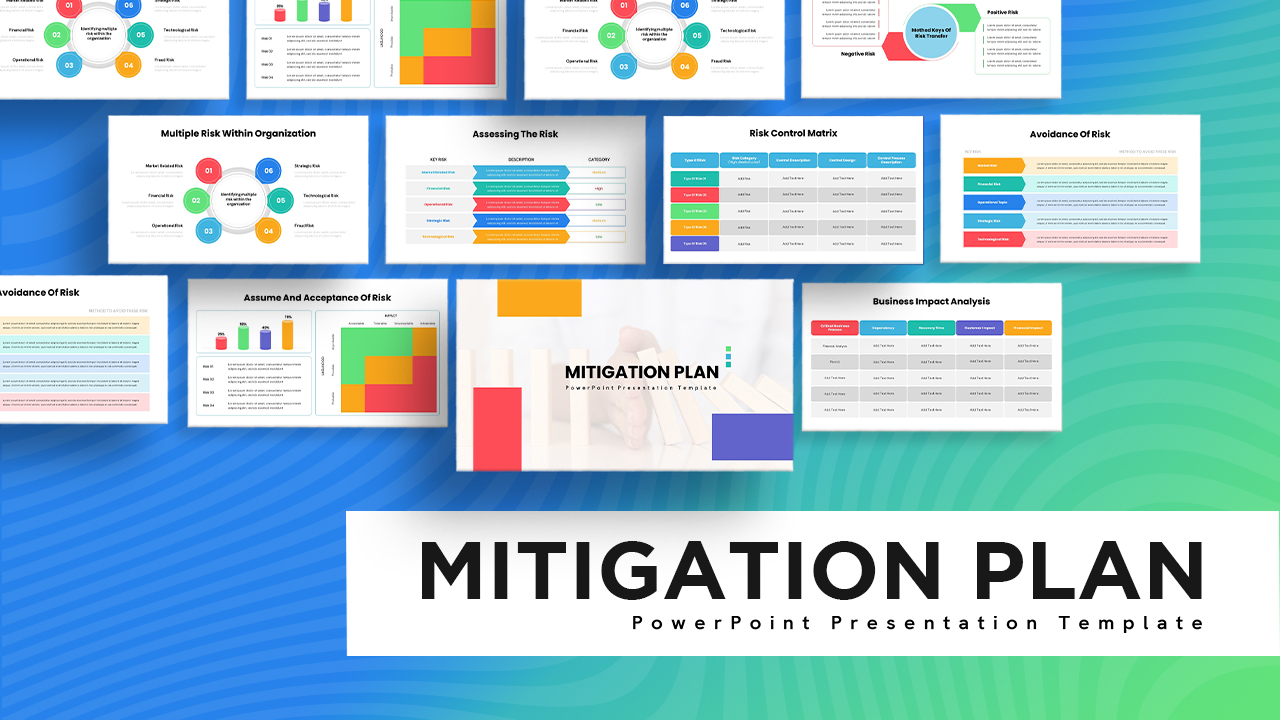
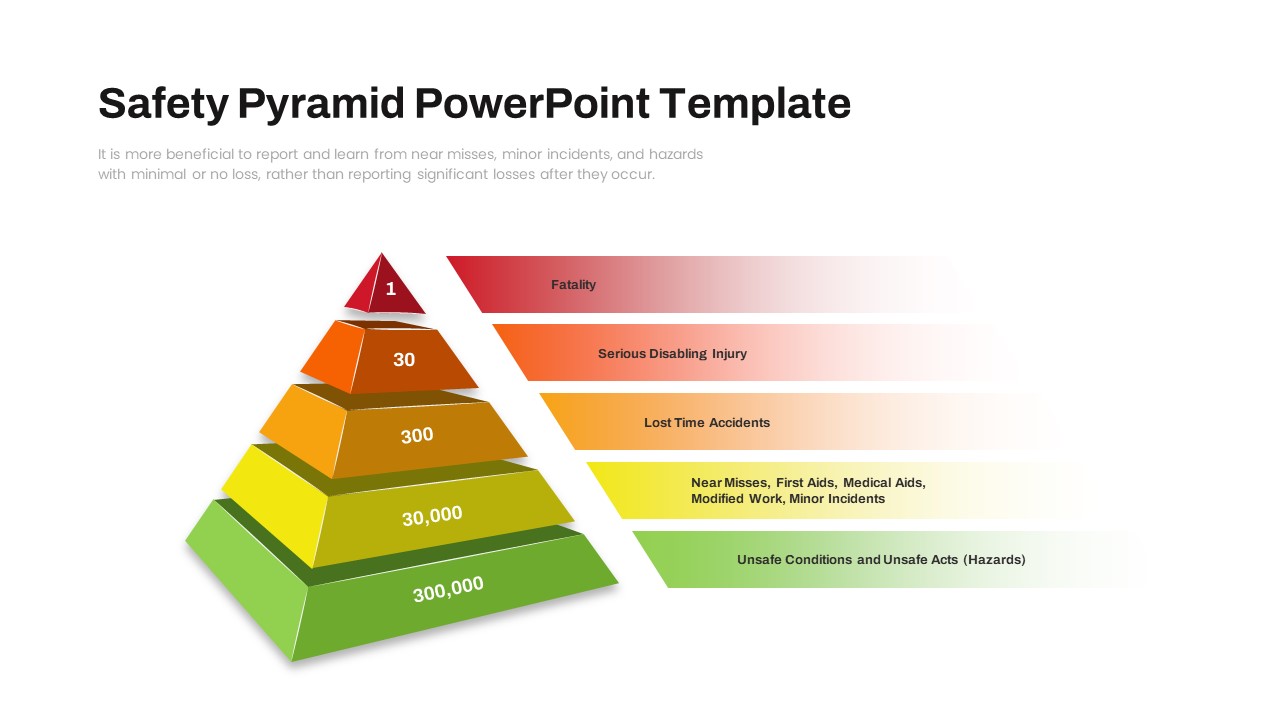
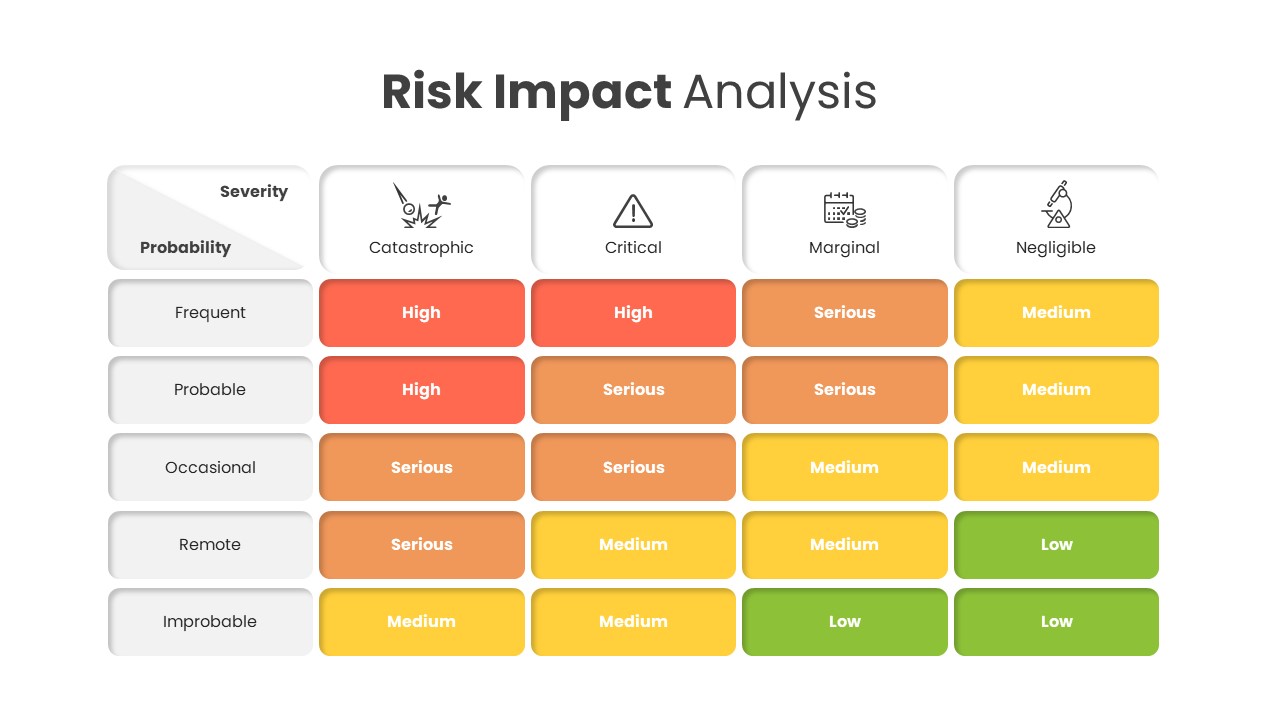
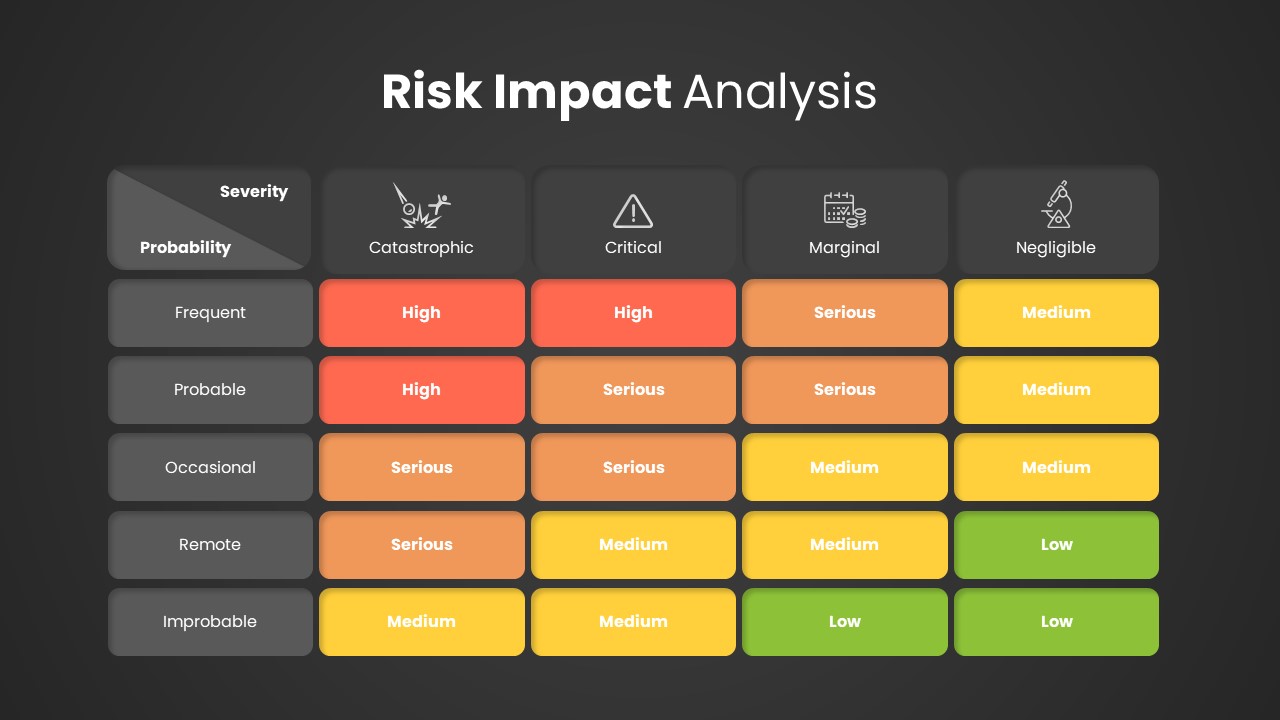
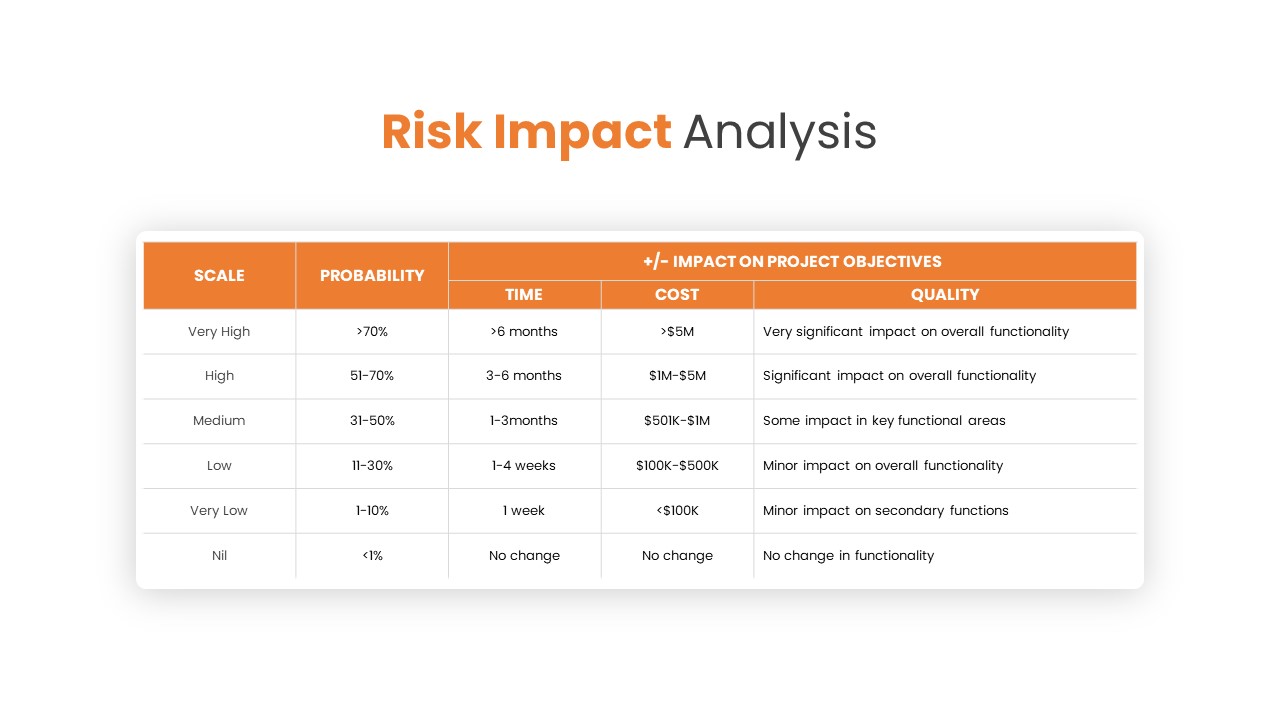
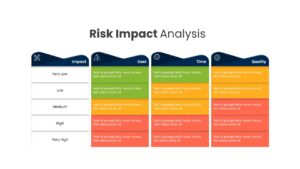
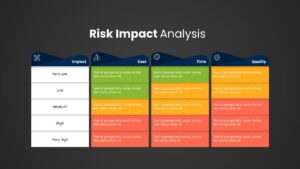
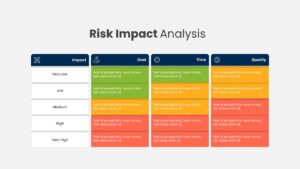
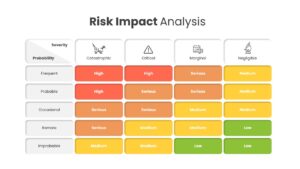
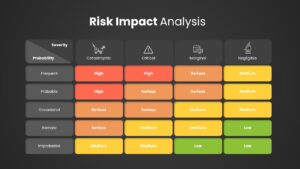
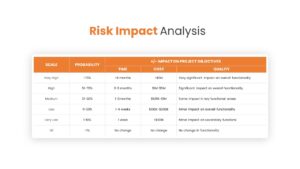
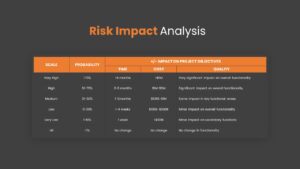
Assess and communicate project risks with precision using this four-slide Risk Impact Analysis infographic pack. Slide 1 introduces a color-coded matrix that cross-references five impact levels (Very Low to Very High) against three impact categories—Cost, Time, and Quality—using green, yellow, orange, and red bands to indicate severity. Slide 2 expands on probability versus severity, mapping five likelihood tiers (Frequent to Improbable) against four consequence levels (Catastrophic to Negligible) in a clean icon-driven grid. Slide 3 offers a tabular reference sheet with defined probability percentages, time-to-resolution estimates, cost-impact brackets, and quality-impact descriptions, ensuring consistent risk scoring across teams. Slide 4 presents a streamlined, high-contrast version of the impact matrix for quick executive briefings or dark-mode presentations.
All four infographics are built on master slides in both PowerPoint and Google Slides. Every element is fully vector-editable: swap out icons, adjust color scales to match your corporate palette, or edit text fields without breaking the layout. Rounded-corner tables, consistent typography, and subtle drop shadows maintain a professional aesthetic while enhancing readability. Light- and dark-theme variants ensure your analysis stands out in any environment, from boardroom project reviews to virtual stakeholder webinars.
Whether you’re conducting compliance assessments, safety audits, or phase-gate reviews, this Risk Impact Analysis template streamlines your slide production and drives data-driven decision-making. Duplicate slides to compare multiple scenarios, layer additional risk categories, or integrate into broader project decks—all while maintaining visual consistency and analytical rigor.
Who is it for
Project managers, risk-management teams, and quality-assurance professionals will leverage these infographics to quantify and prioritize risks. Compliance officers, safety engineers, and executive sponsors benefit from the clear, standardized impact assessments in stakeholder briefings.
Other Uses
Beyond project risk scoring, repurpose the matrices for issue-impact assessments, vendor-selection scoring, or root-cause analyses. Relabel axes to suit scenario-planning, business-continuity planning, or KPI-performance dashboards.
Login to download this file

Item ID
SB02269
Related Templates

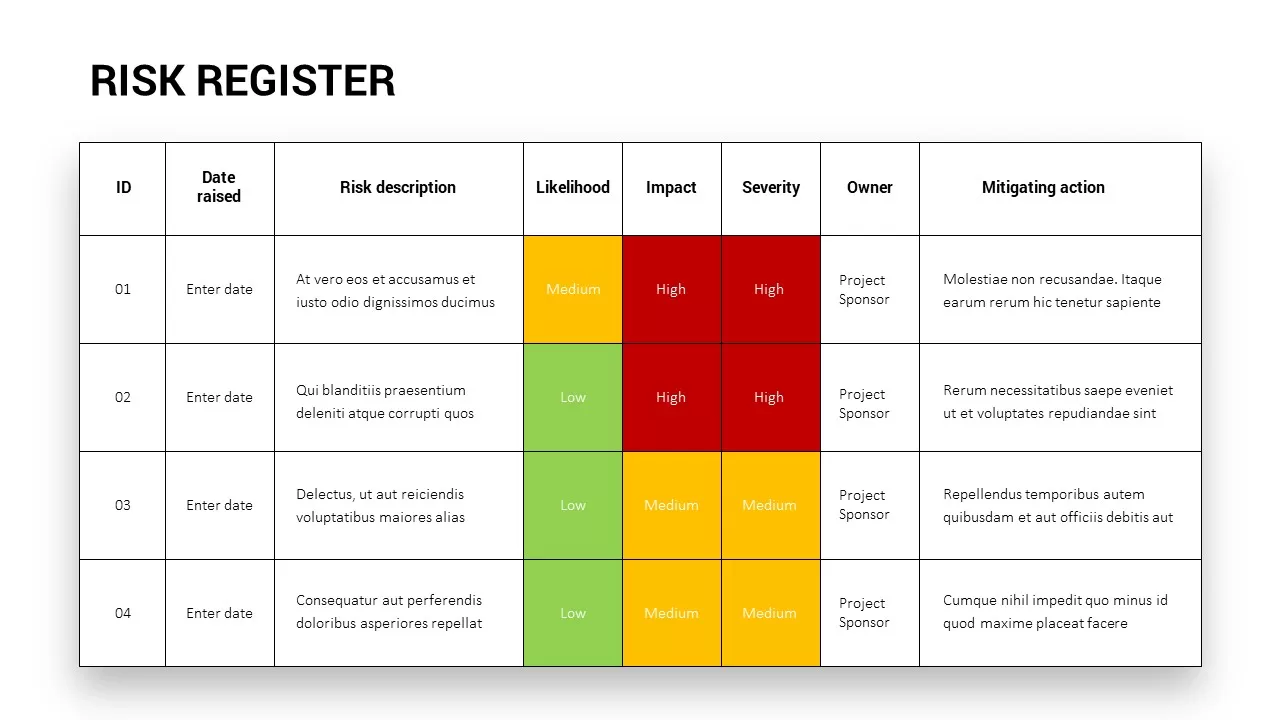
Comprehensive Risk Register Table Template for PowerPoint & Google Slides
Risk Management
Risk Probability and Impact Matrix Template for PowerPoint & Google Slides
Risk Management
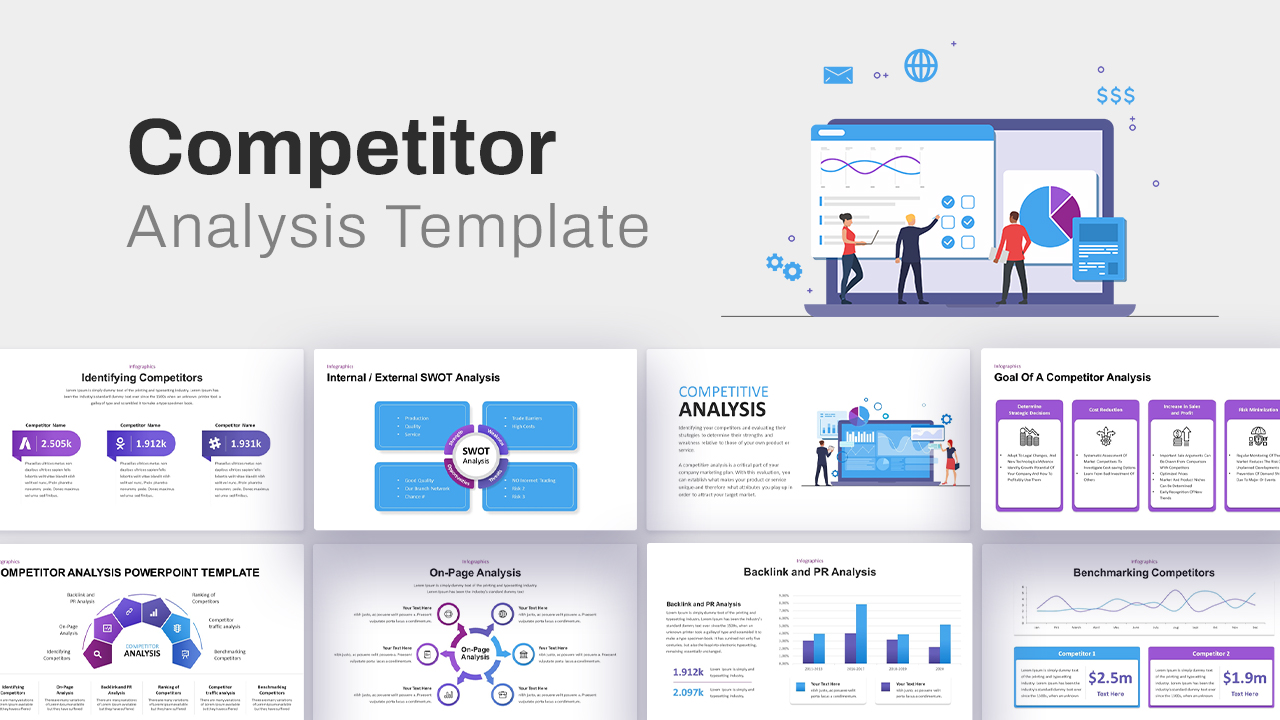
Comprehensive Competitor Analysis Template for PowerPoint & Google Slides
Competitor Analysis
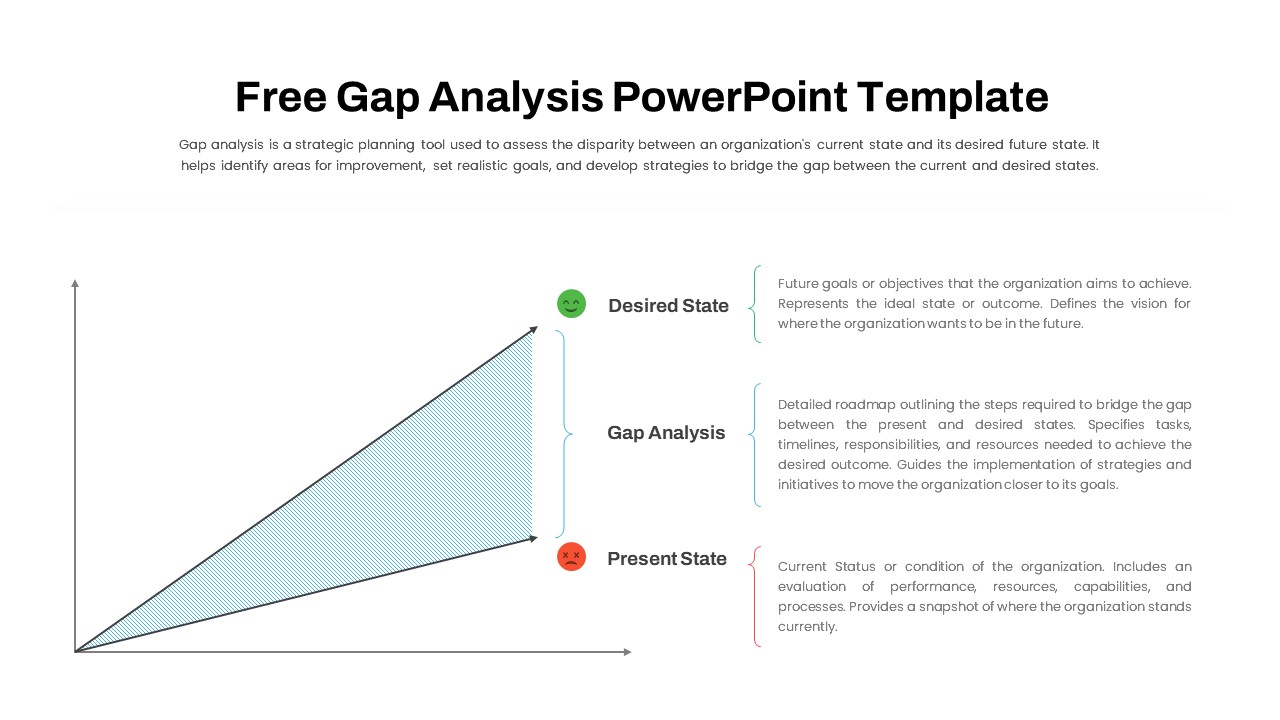
Free Comprehensive Gap Analysis Framework Template for PowerPoint & Google Slides
Opportunities Challenges
Free
Comprehensive Social Media Icons Slide Template for PowerPoint & Google Slides
Advertising
Comprehensive Car Insurance Services Diagram Template for PowerPoint & Google Slides
Business
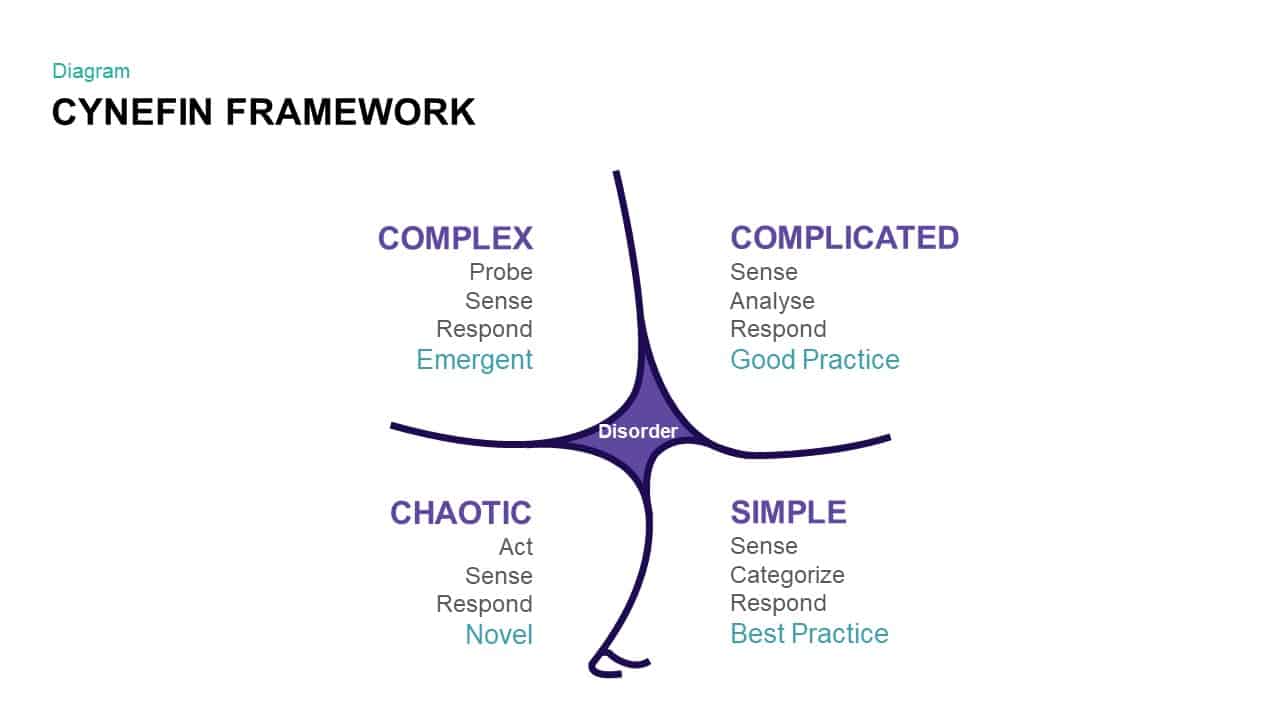
Comprehensive Cynefin Framework Diagram Template for PowerPoint & Google Slides
Opportunities Challenges
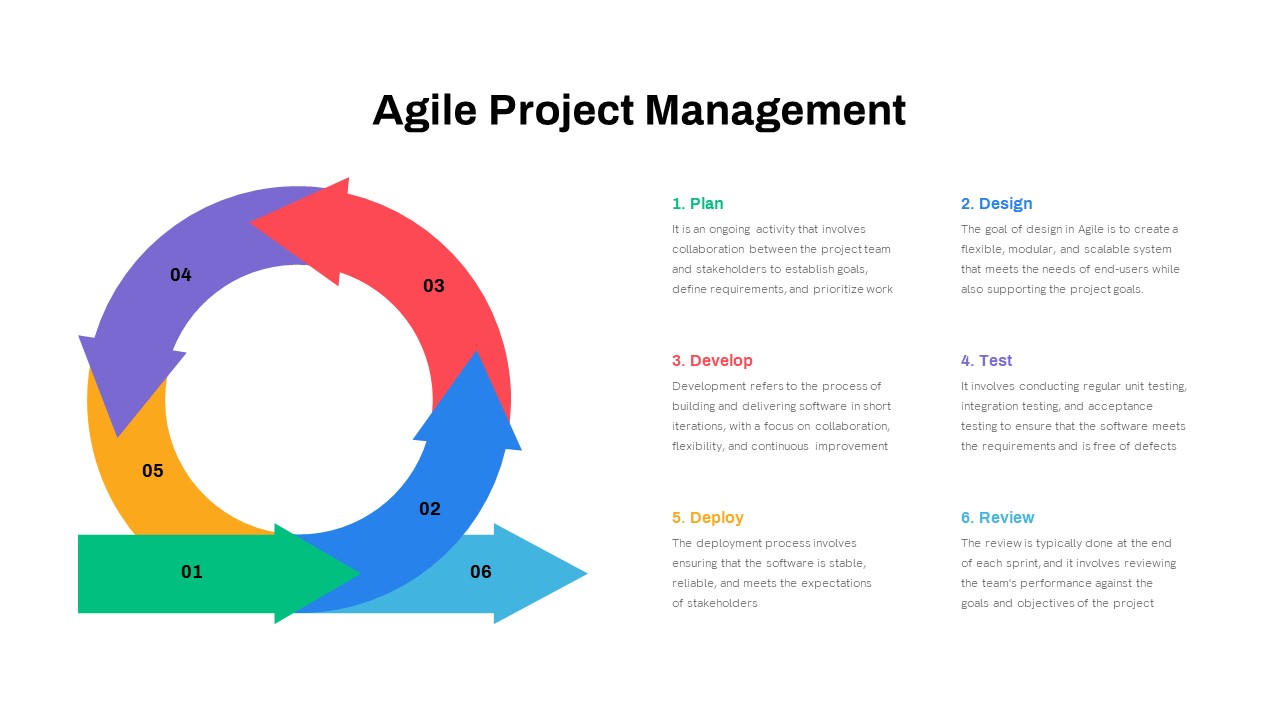
Comprehensive Agile Project Management Template for PowerPoint & Google Slides
Scrum
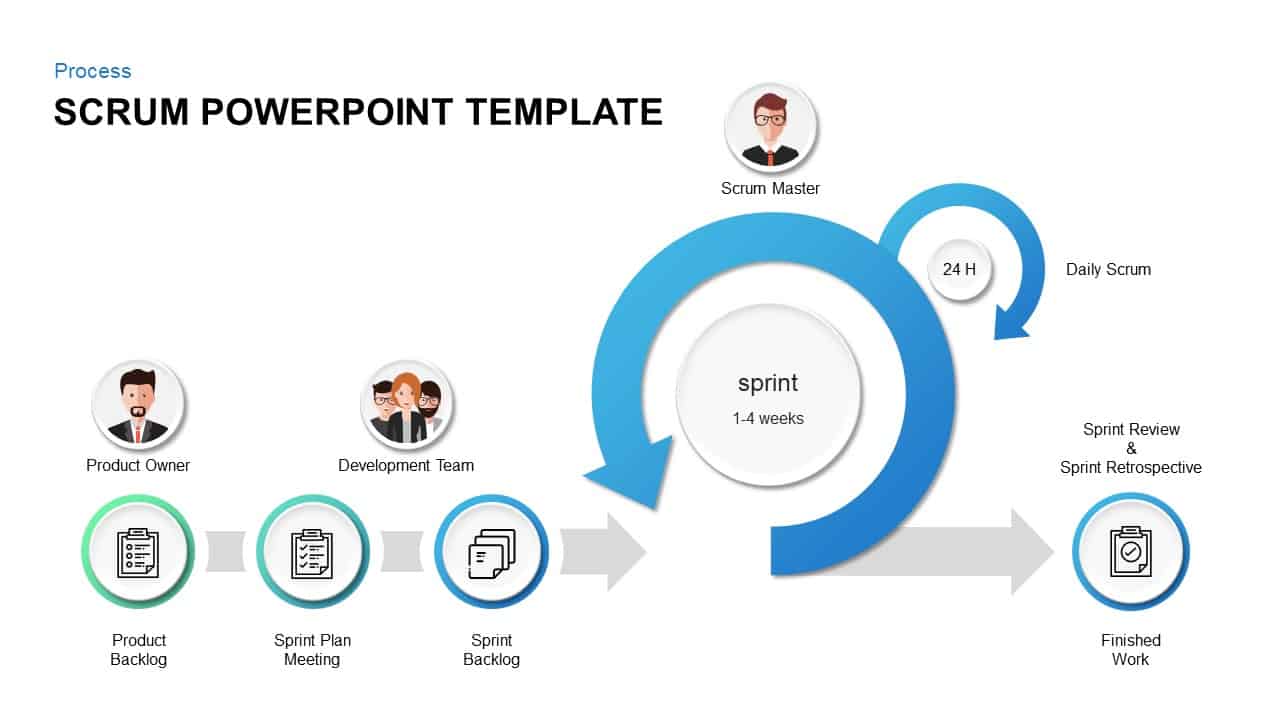
Comprehensive Scrum Infographics Pack Template for PowerPoint & Google Slides
Scrum

Comprehensive IT Governance Frameworks Template for PowerPoint & Google Slides
Pitch Deck
Comprehensive Healthcare Overview Deck Template for PowerPoint & Google Slides
Medical
Comprehensive SIVA Marketing Mix Model Template for PowerPoint & Google Slides
Marketing
Comprehensive Communication Plan Template for PowerPoint & Google Slides
Business Plan
Comprehensive Recruitment Metrics Report Template for PowerPoint & Google Slides
Recruitment

Comprehensive Thesis Defense Presentation Template for PowerPoint & Google Slides
Pitch Deck
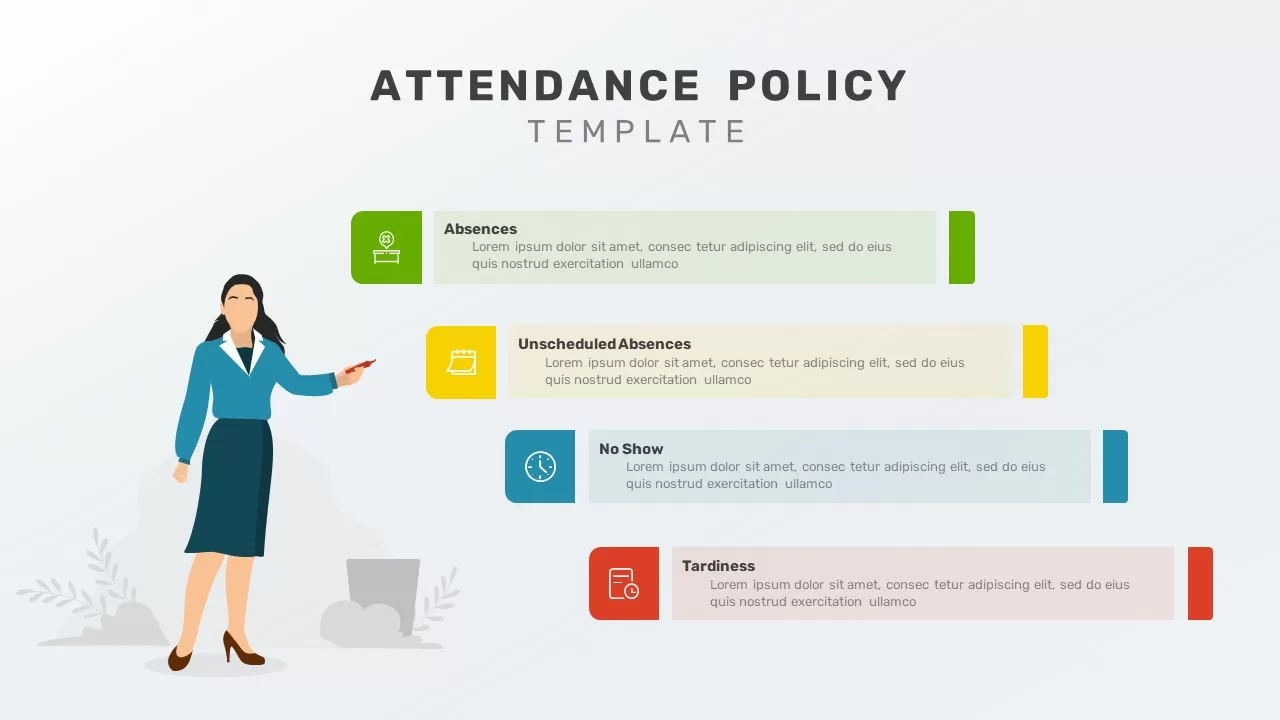
Comprehensive Attendance Policy Overview Template for PowerPoint & Google Slides
Process
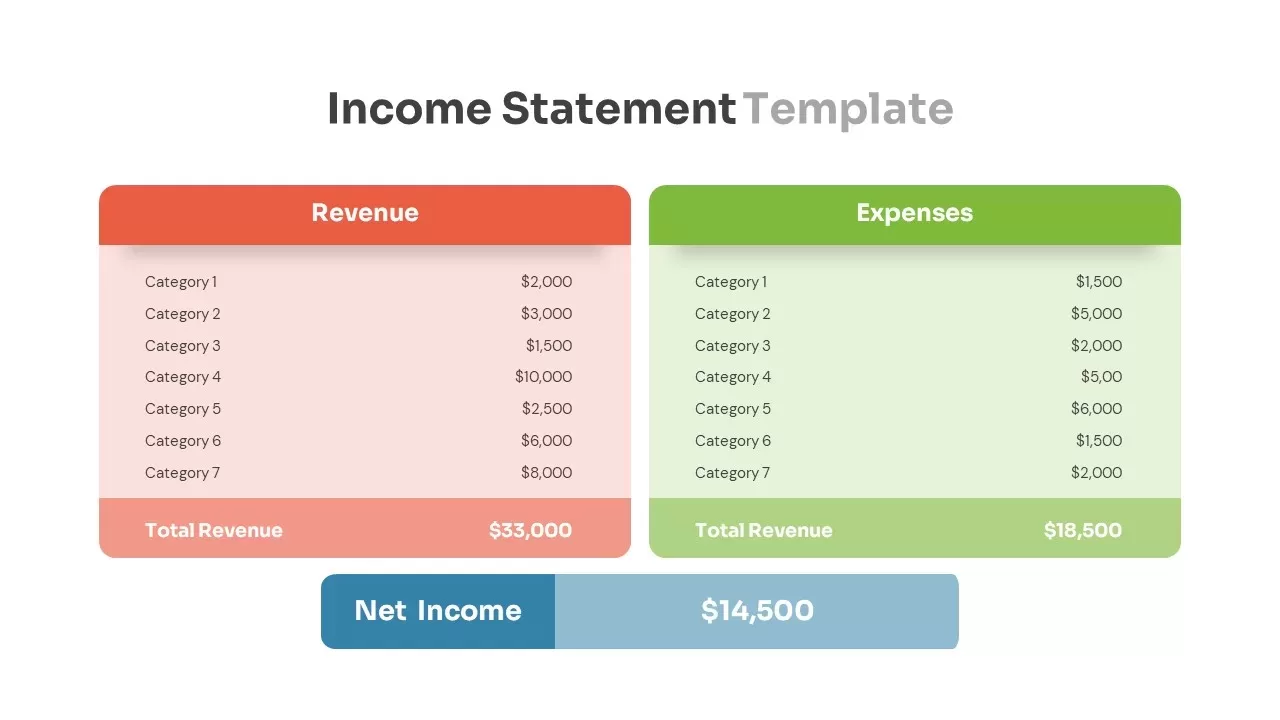
Comprehensive Income Statement Overview Template for PowerPoint & Google Slides
Business Report
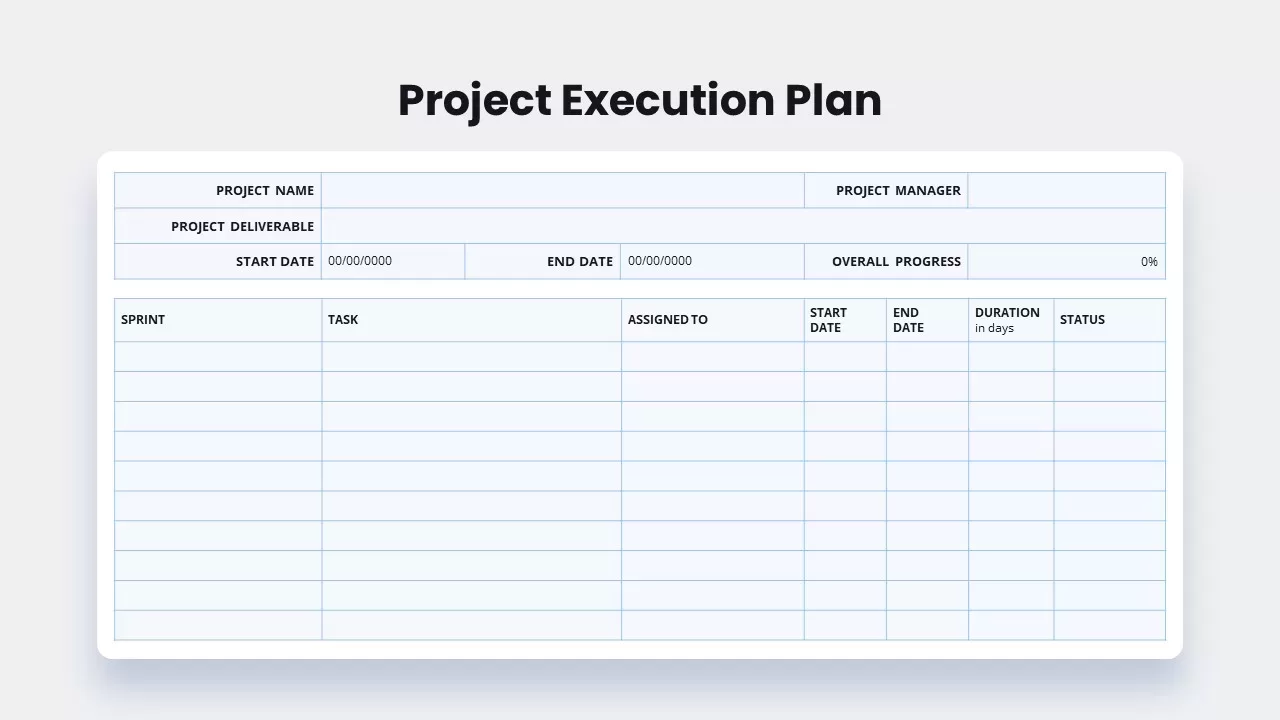
Comprehensive Project Execution Plan template for PowerPoint & Google Slides
Project Status
Comprehensive Resource Planning Table Template for PowerPoint & Google Slides
Project
Comprehensive Hiring Process Flow Chart Template for PowerPoint & Google Slides
Flow Charts
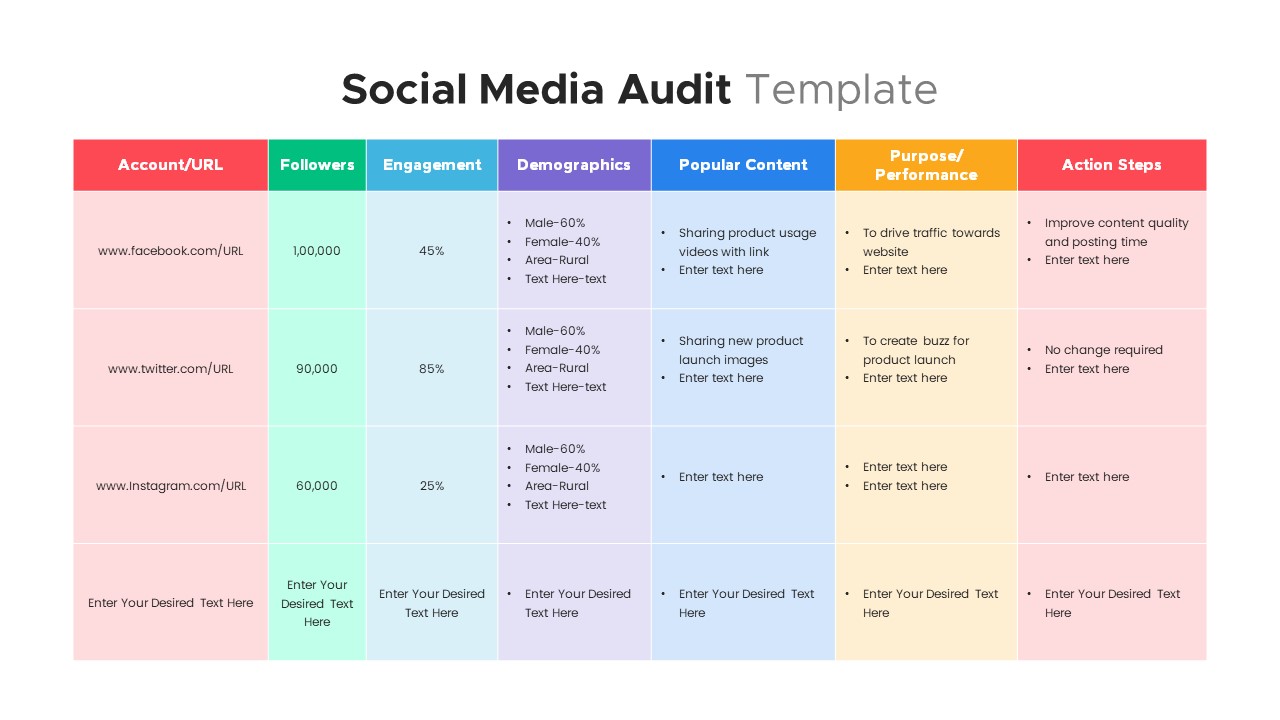
Comprehensive Social Media Audit Template for PowerPoint & Google Slides
Digital Marketing
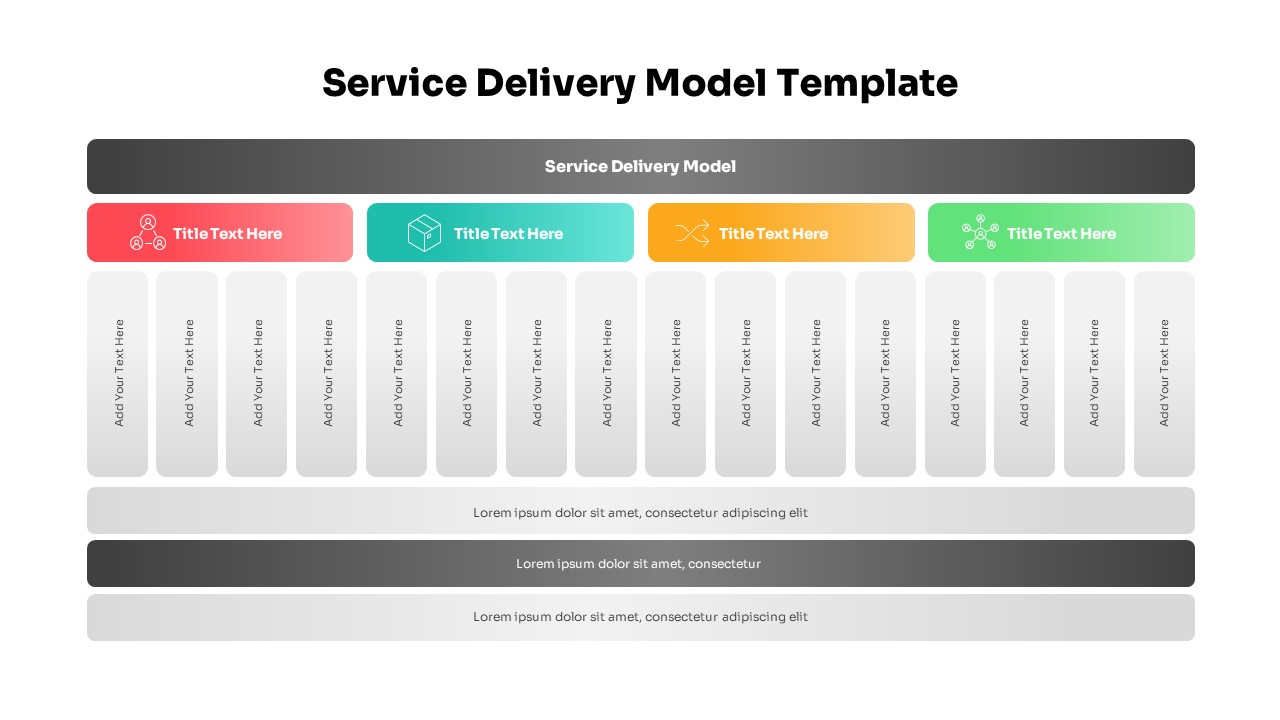
Comprehensive Service Delivery Model Template for PowerPoint & Google Slides
Project
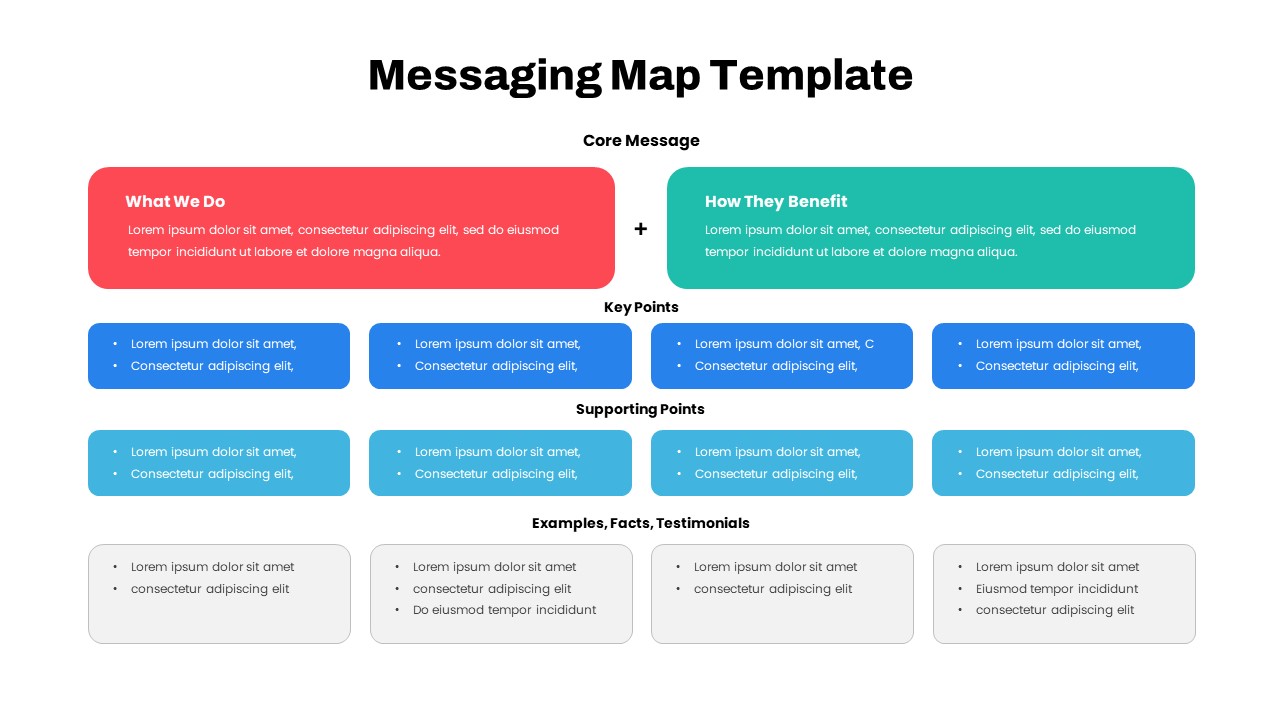
Comprehensive Messaging Map Framework Template for PowerPoint & Google Slides
Process
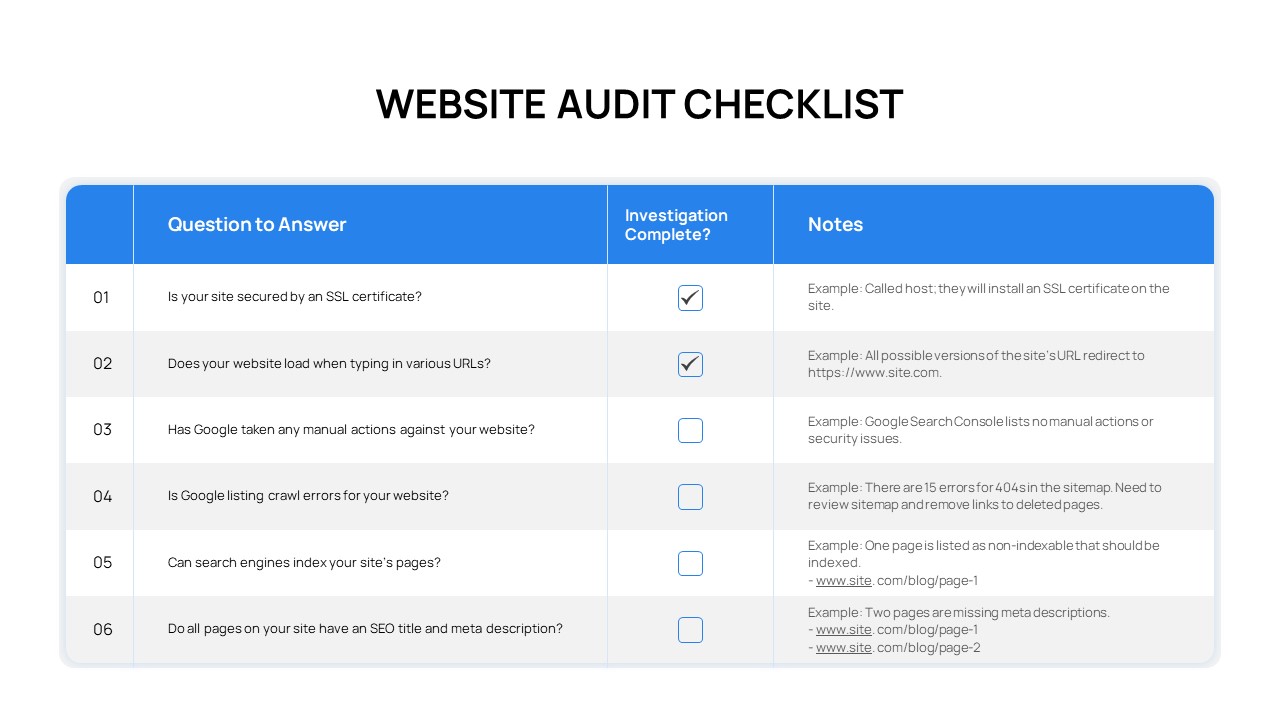
Comprehensive Website Audit Checklist Template for PowerPoint & Google Slides
Technology
Comprehensive Process Flow Diagram Template for PowerPoint & Google Slides
Process
Comprehensive Financial Statements Template for PowerPoint & Google Slides
Finance
Comprehensive Quality Assurance Workflow Template for PowerPoint & Google Slides
Company Profile

Free Comprehensive Social Work Presentation Template for PowerPoint & Google Slides
Pitch Deck
Free
Free Comprehensive Charts & Graphs Template for PowerPoint & Google Slides
Charts
Free
Free Comprehensive Management Strategy Deck Template for PowerPoint & Google Slides
Pitch Deck
Free
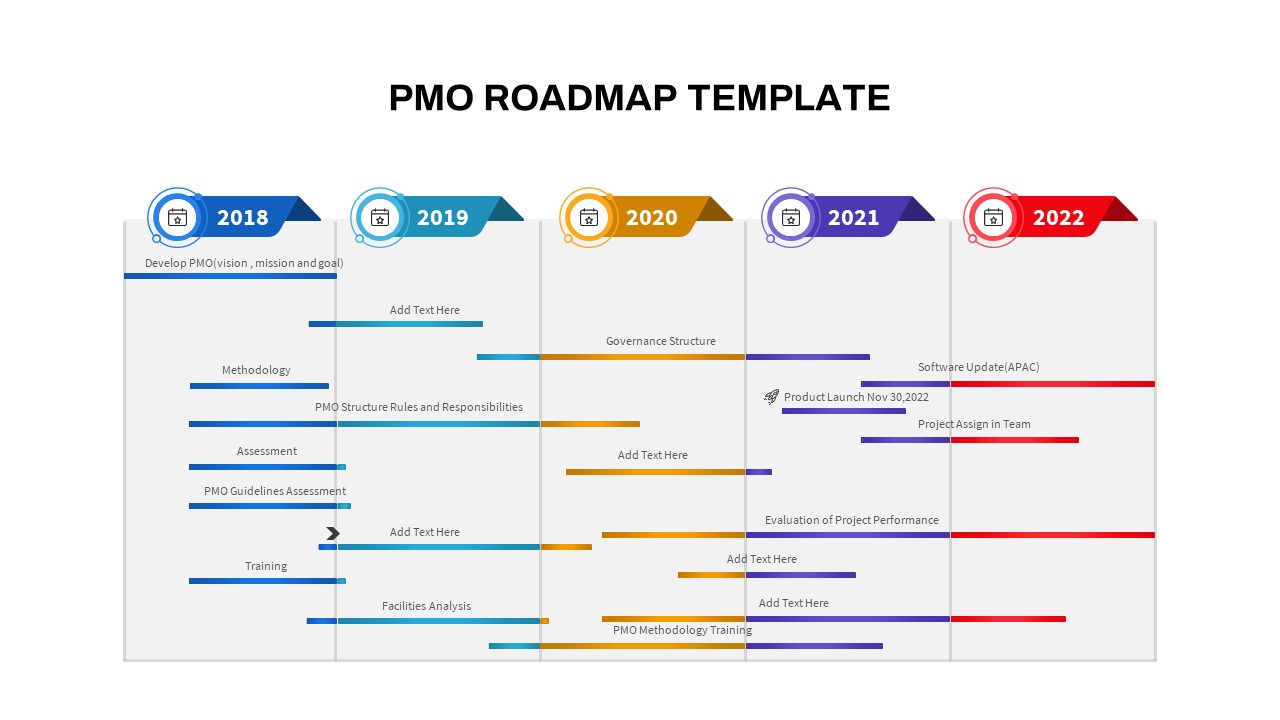
Comprehensive PMO Roadmap Timeline Template for PowerPoint & Google Slides
Roadmap
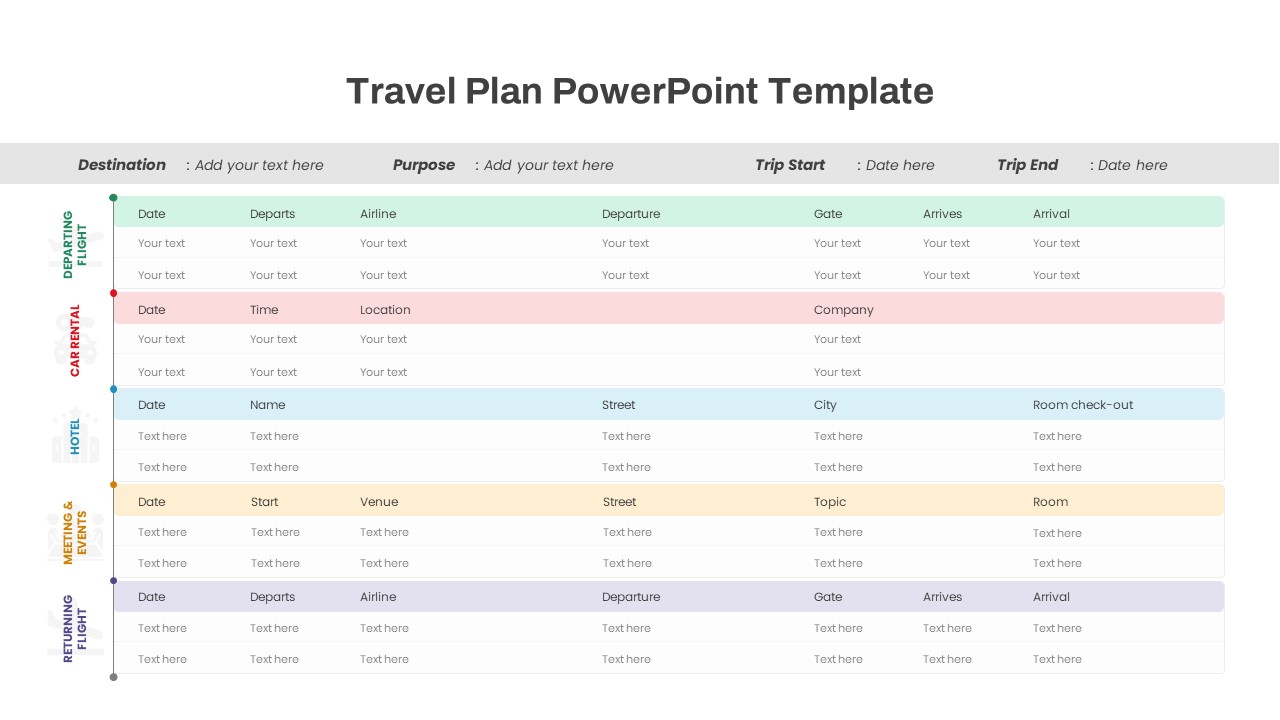
Comprehensive Travel Itinerary Slide Template for PowerPoint & Google Slides
Agenda
Comprehensive Nature Presentation Template for PowerPoint & Google Slides
Pitch Deck
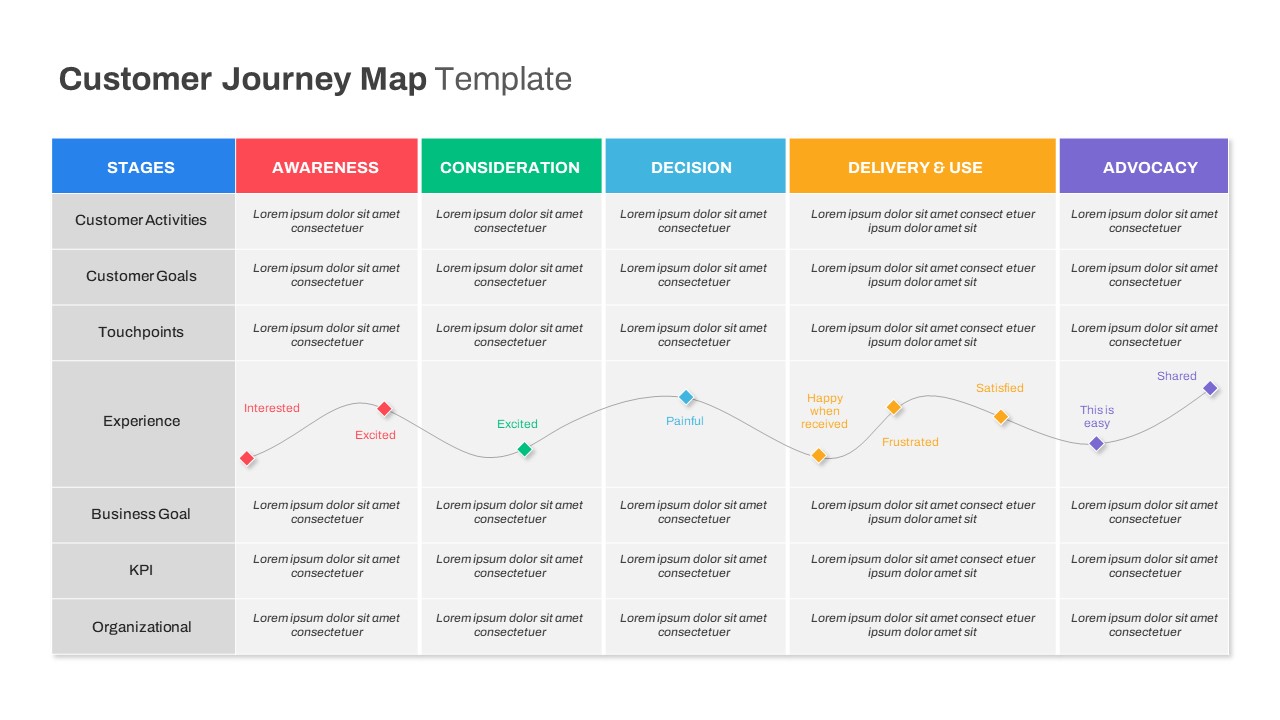
Comprehensive Customer Journey Map Template for PowerPoint & Google Slides
Customer Journey
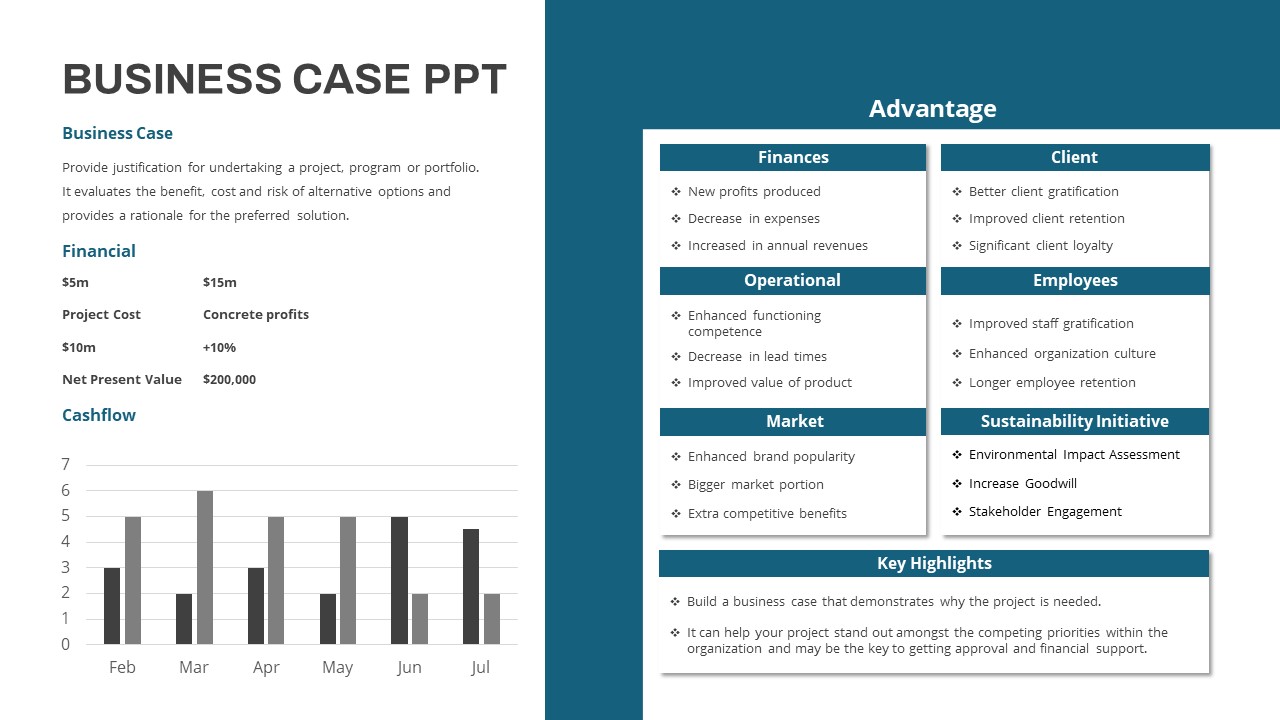
Comprehensive Business Case Presentation Template for PowerPoint & Google Slides
Pie/Donut
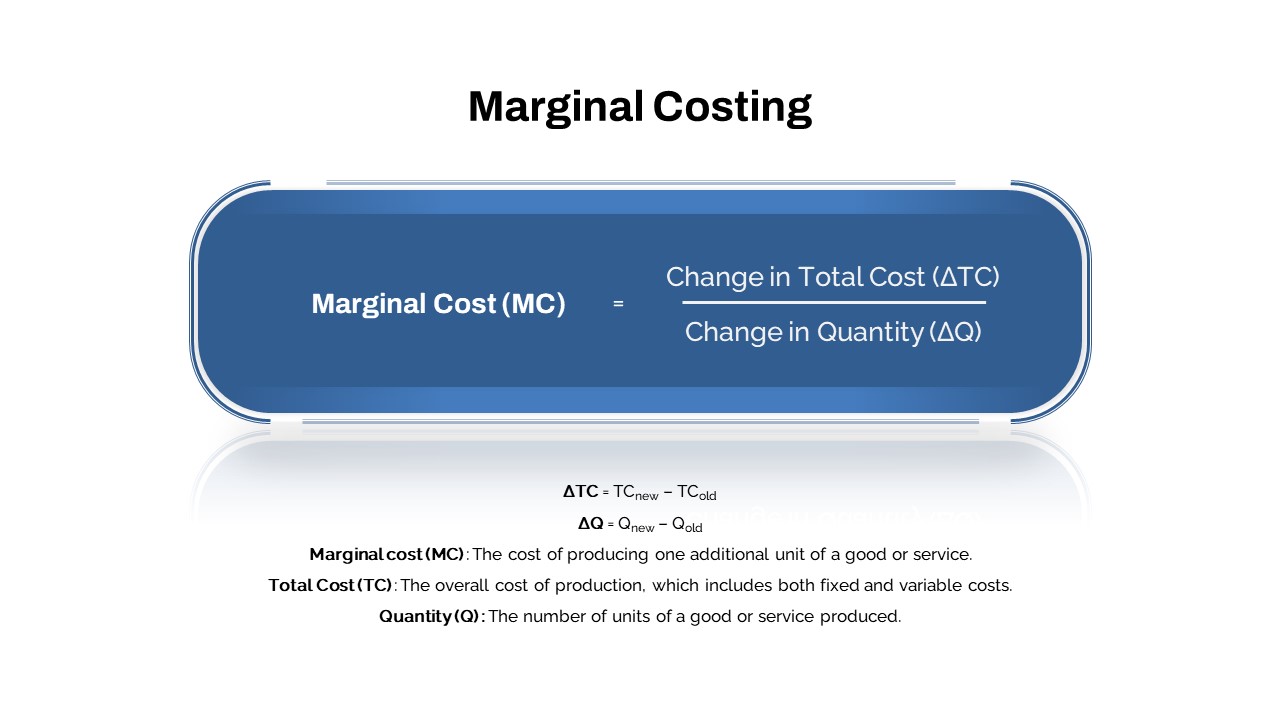
Comprehensive Marginal Costing Formula Template for PowerPoint & Google Slides
Process
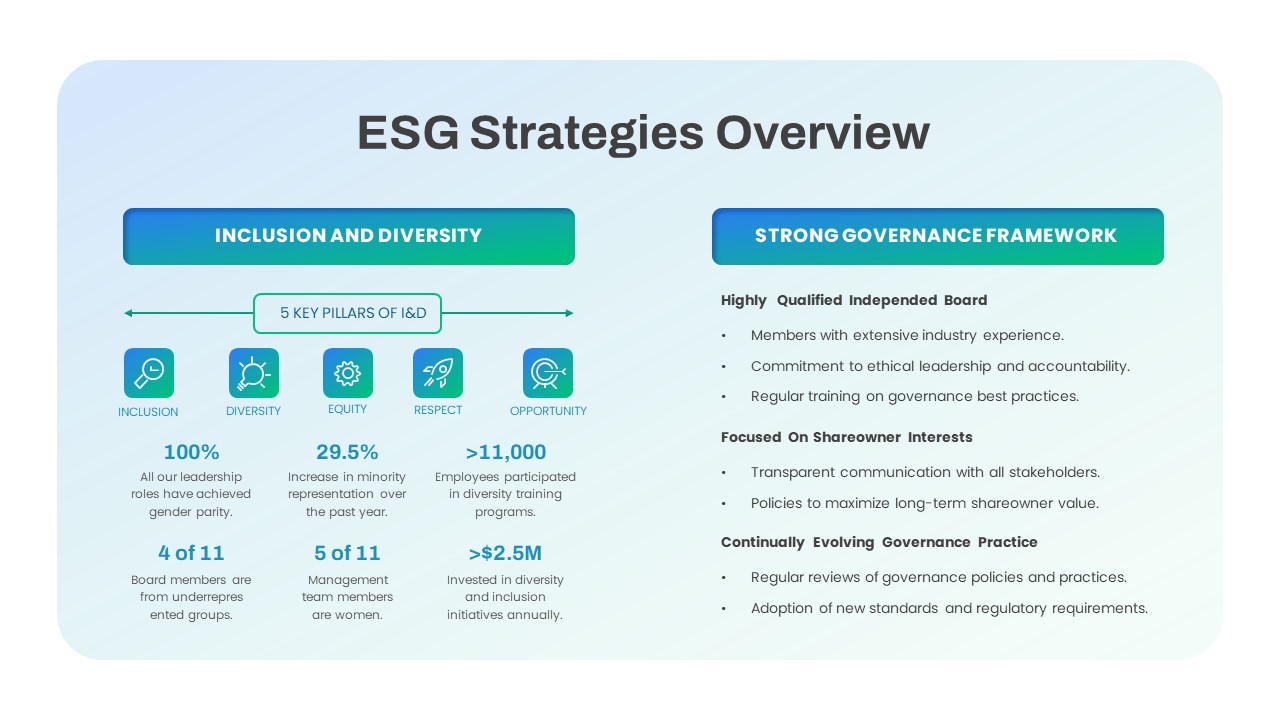
Comprehensive ESG Strategies Overview Template for PowerPoint & Google Slides
Infographics
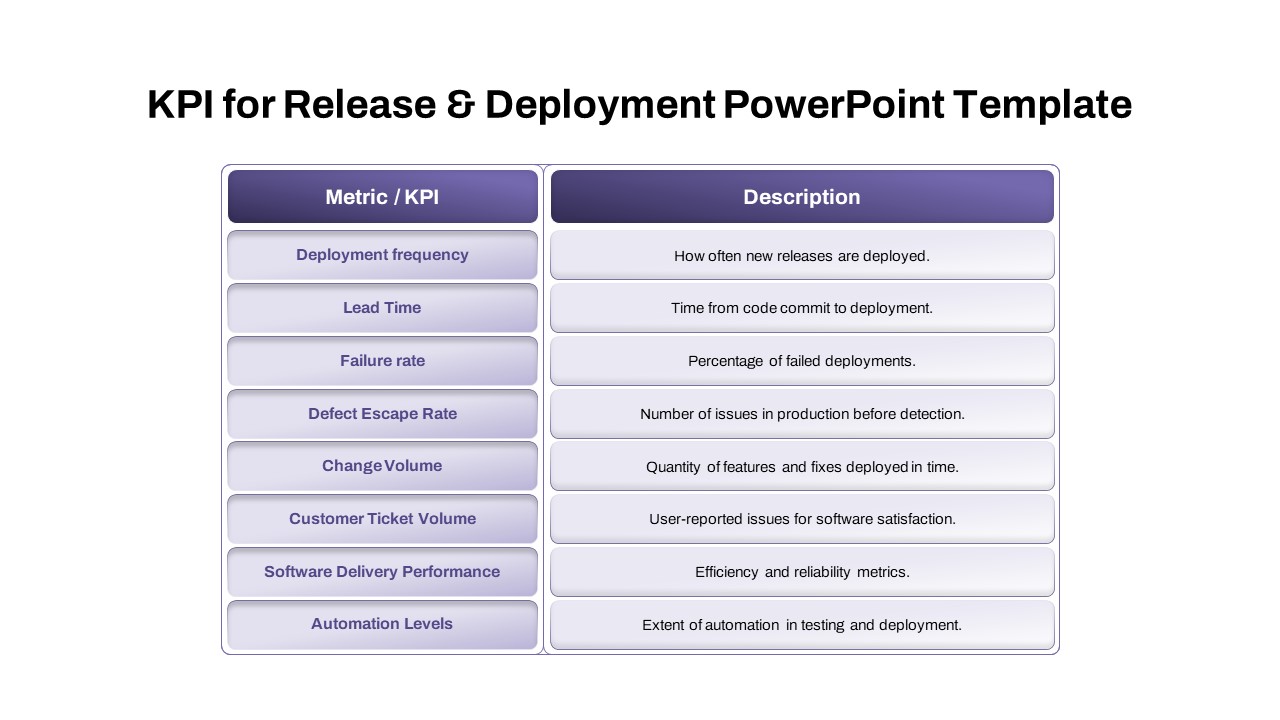
Comprehensive Release & Deployment KPI Template for PowerPoint & Google Slides
Software Development
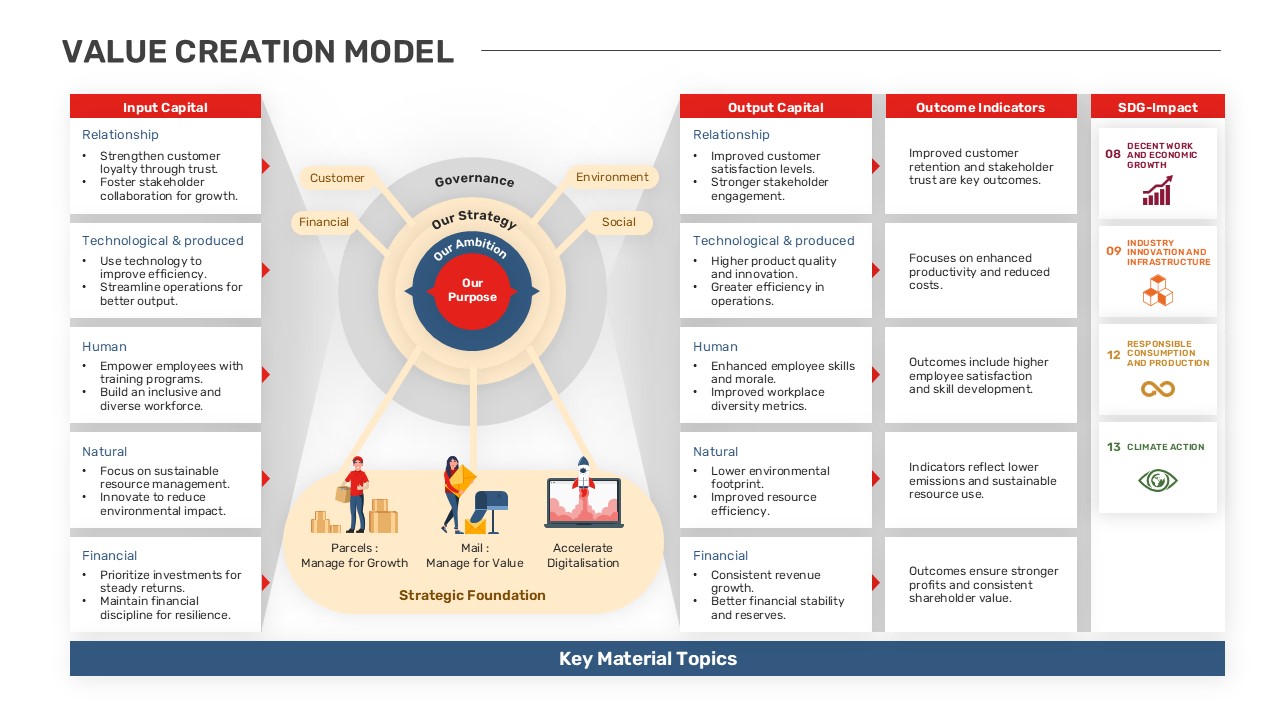
Comprehensive Value Creation Model Template for PowerPoint & Google Slides
Business Models
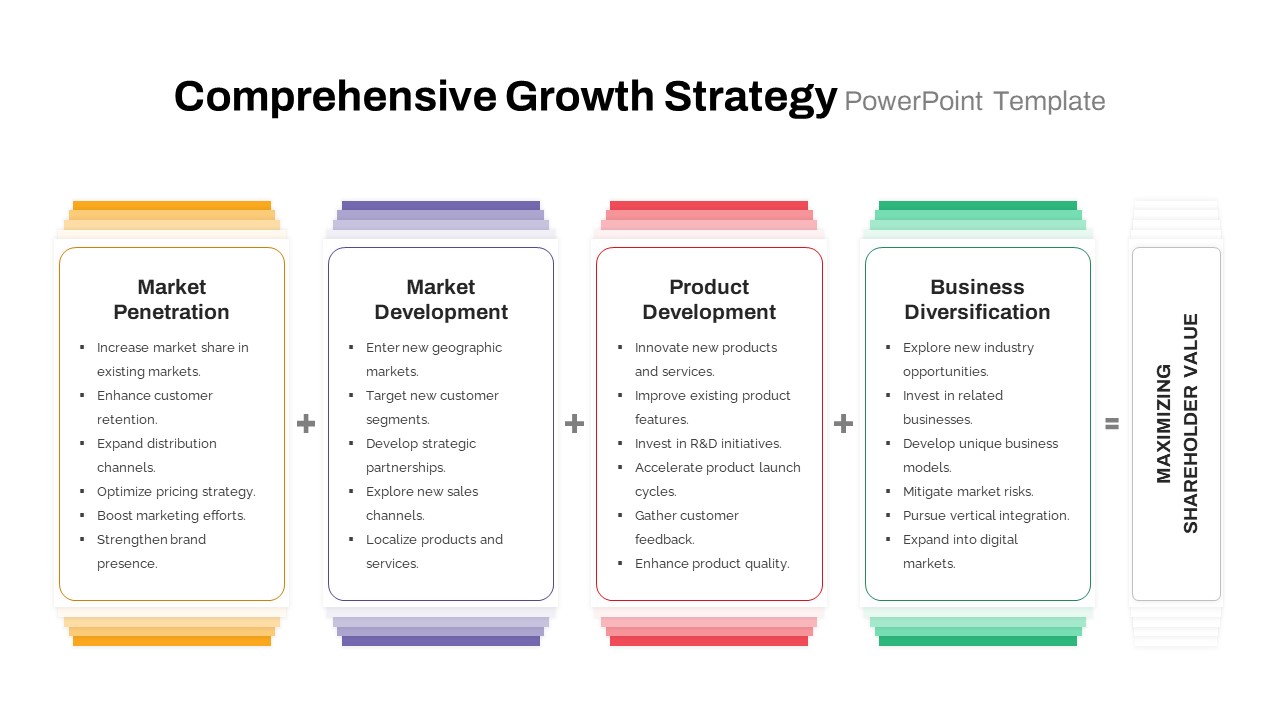
Comprehensive Growth Strategy Cards Template for PowerPoint & Google Slides
Infographics
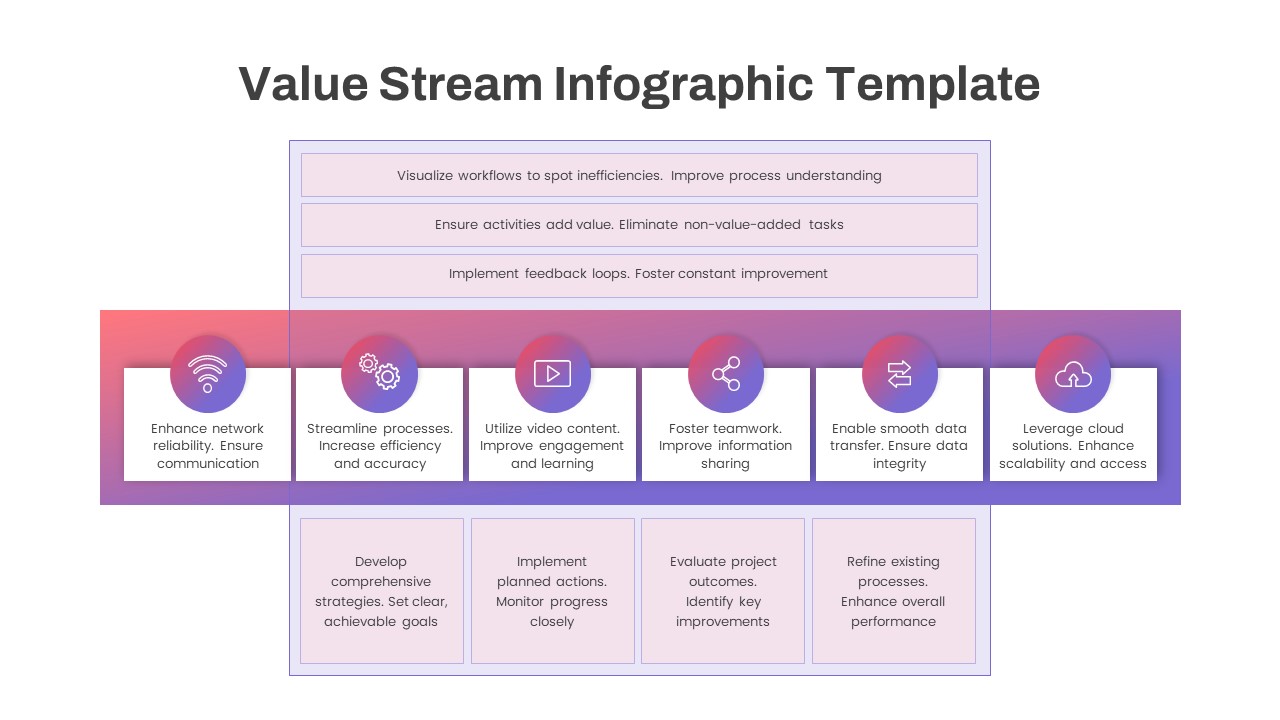
Comprehensive Value Stream Infographic Template for PowerPoint & Google Slides
Process
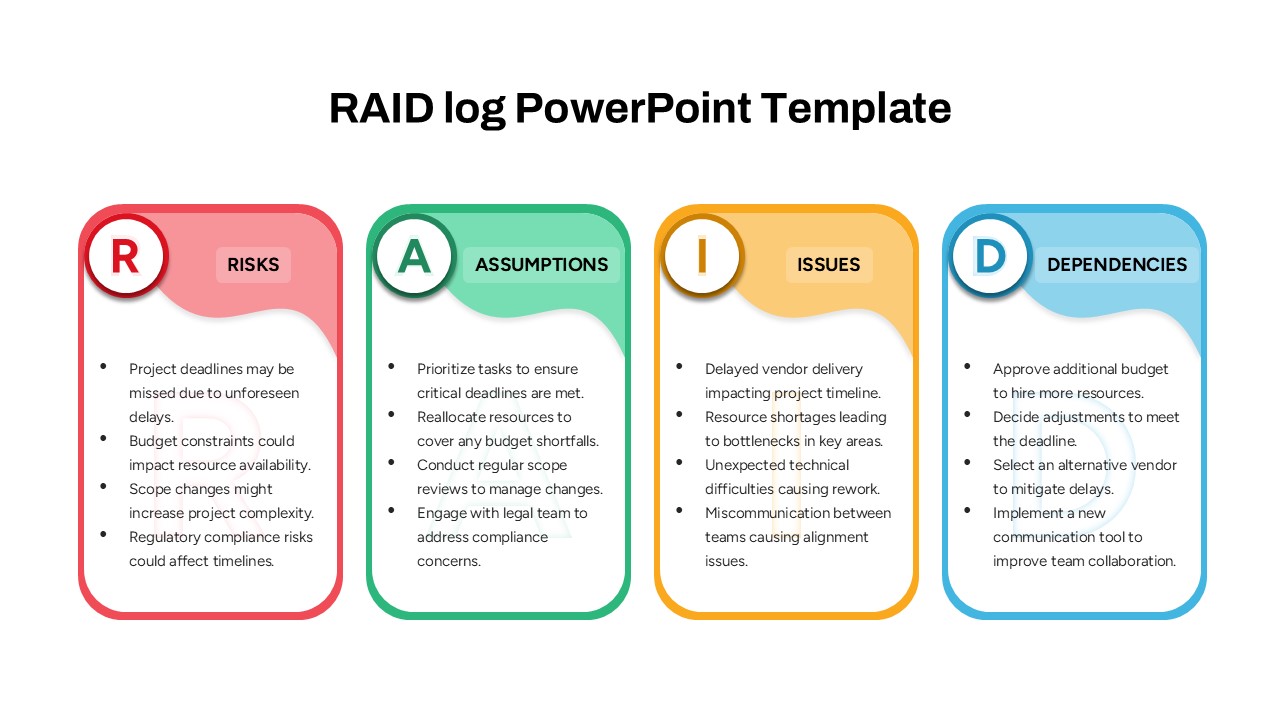
Comprehensive RAID Log Slide Pack Template for PowerPoint & Google Slides
Project
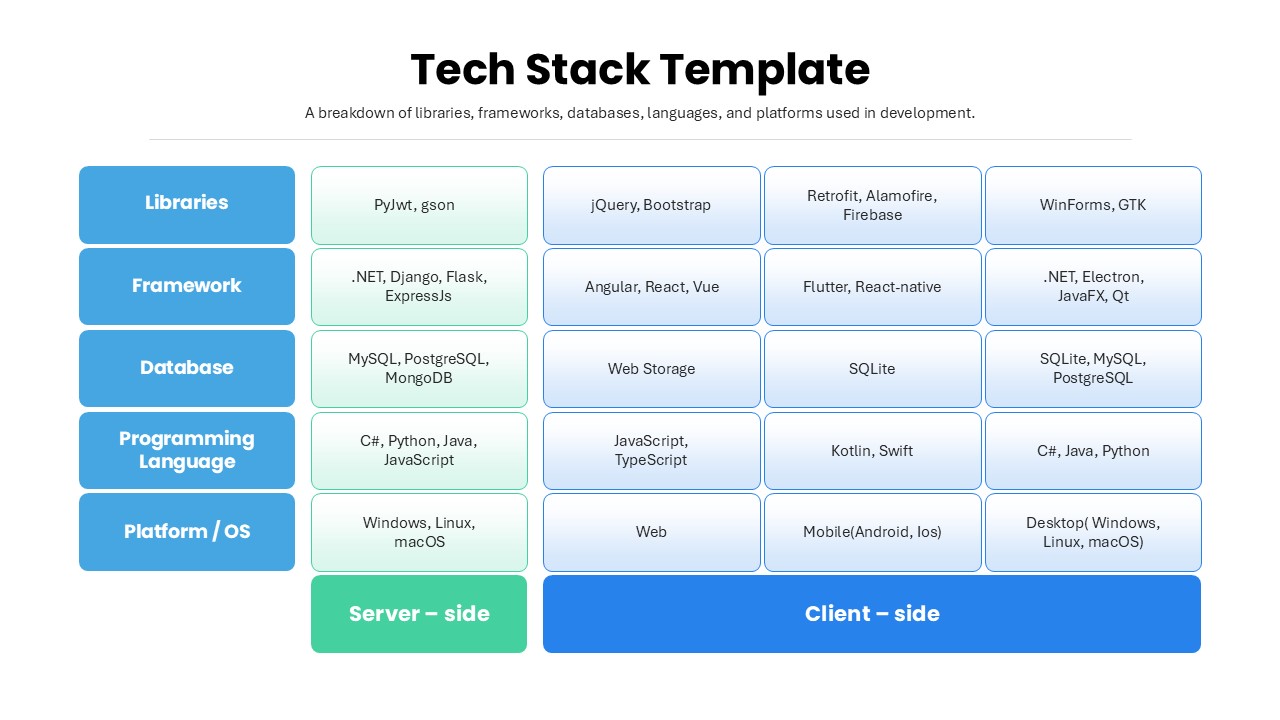
Comprehensive Tech Stack Breakdown Slide Template for PowerPoint & Google Slides
Software Development
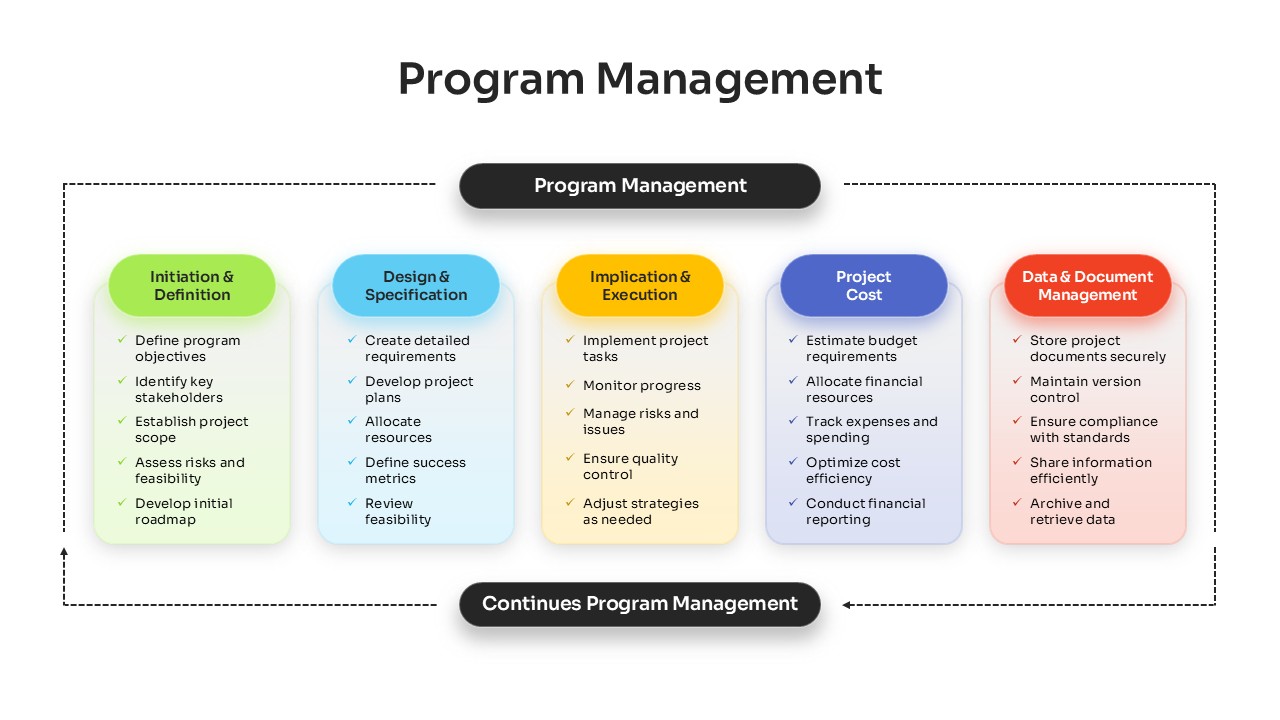
Comprehensive Program Management Process Template for PowerPoint & Google Slides
Process
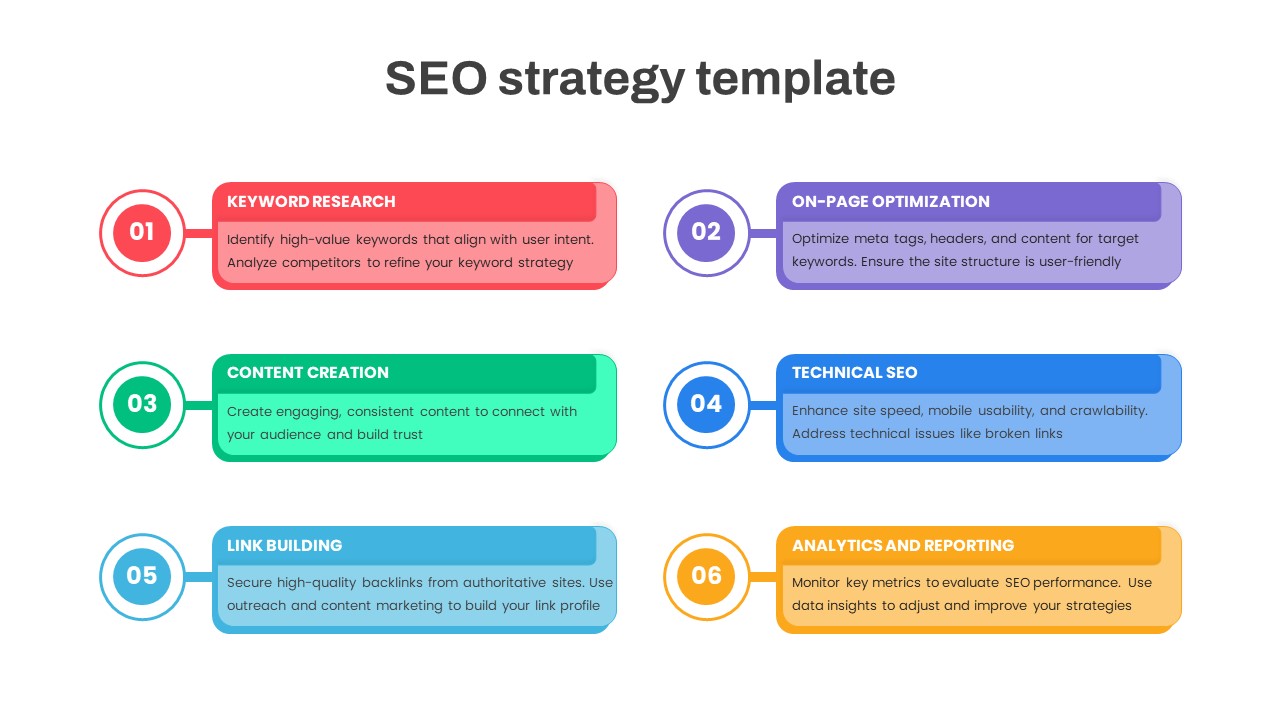
Comprehensive SEO Strategy Roadmap Template for PowerPoint & Google Slides
Digital Marketing
Comprehensive Data & AI Capability Model Template for PowerPoint & Google Slides
AI
Comprehensive Action Tracker Table Template for PowerPoint & Google Slides
Business
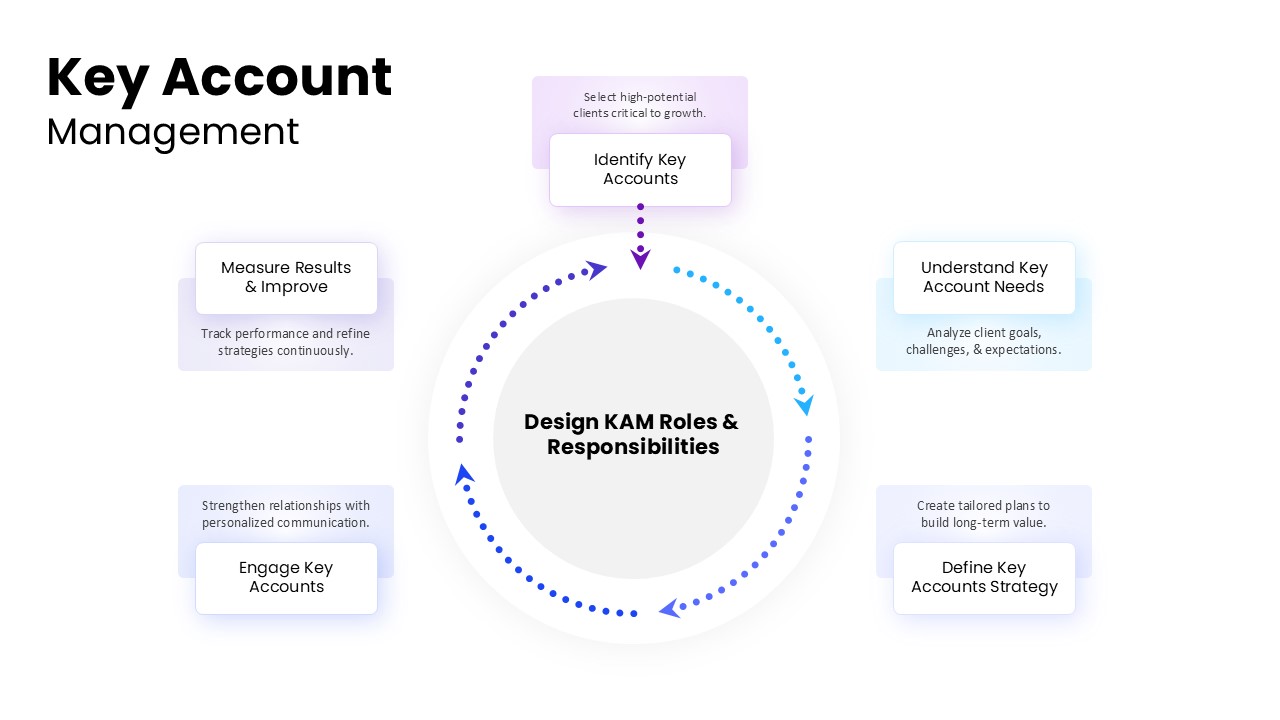
Comprehensive Key Account Management Template for PowerPoint & Google Slides
Process
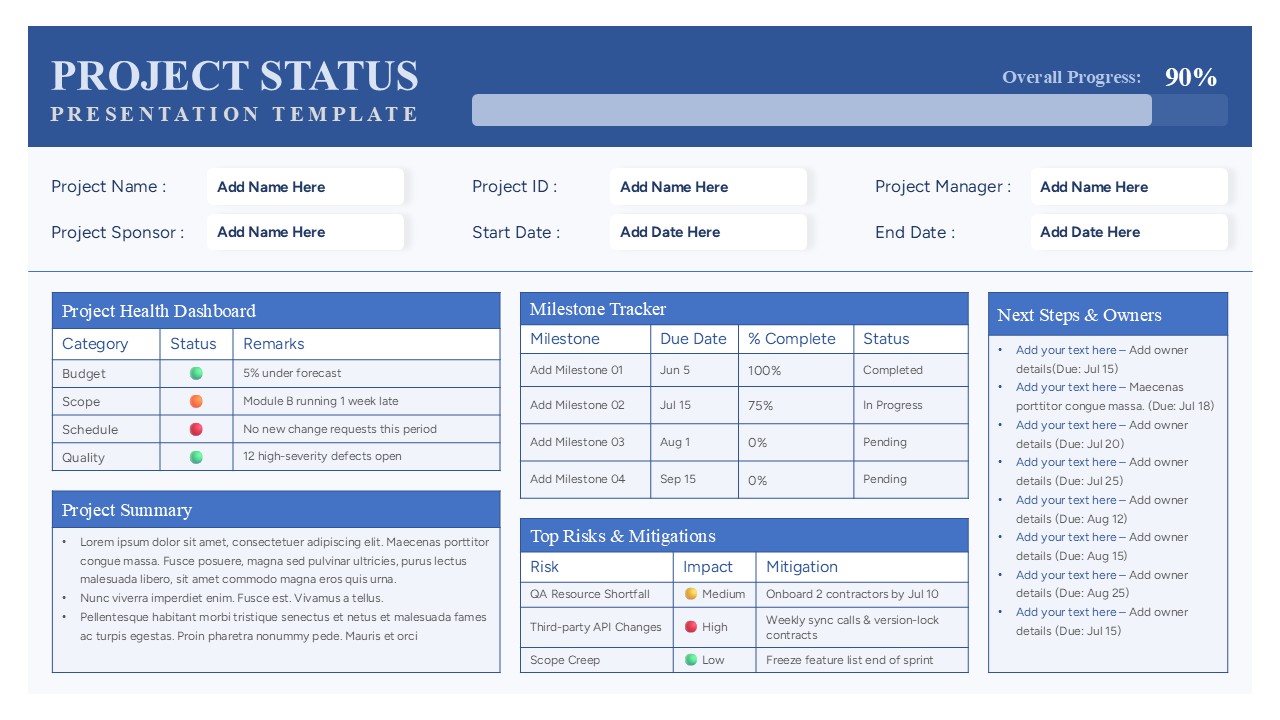
Comprehensive Project Status Report Template for PowerPoint & Google Slides
Project Status
Free Nonprofit Charity Social Impact Deck Template for PowerPoint & Google Slides
Pitch Deck
Free
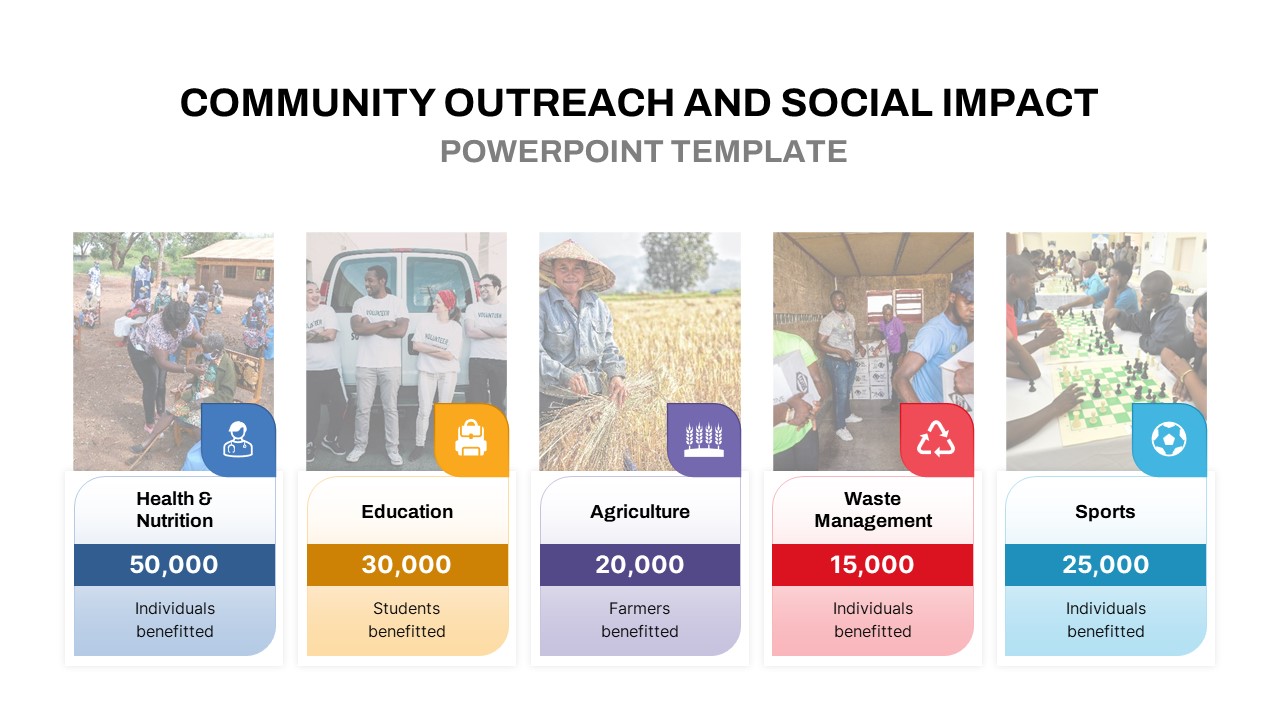
Community Outreach Impact Metrics Template for PowerPoint & Google Slides
Accomplishment
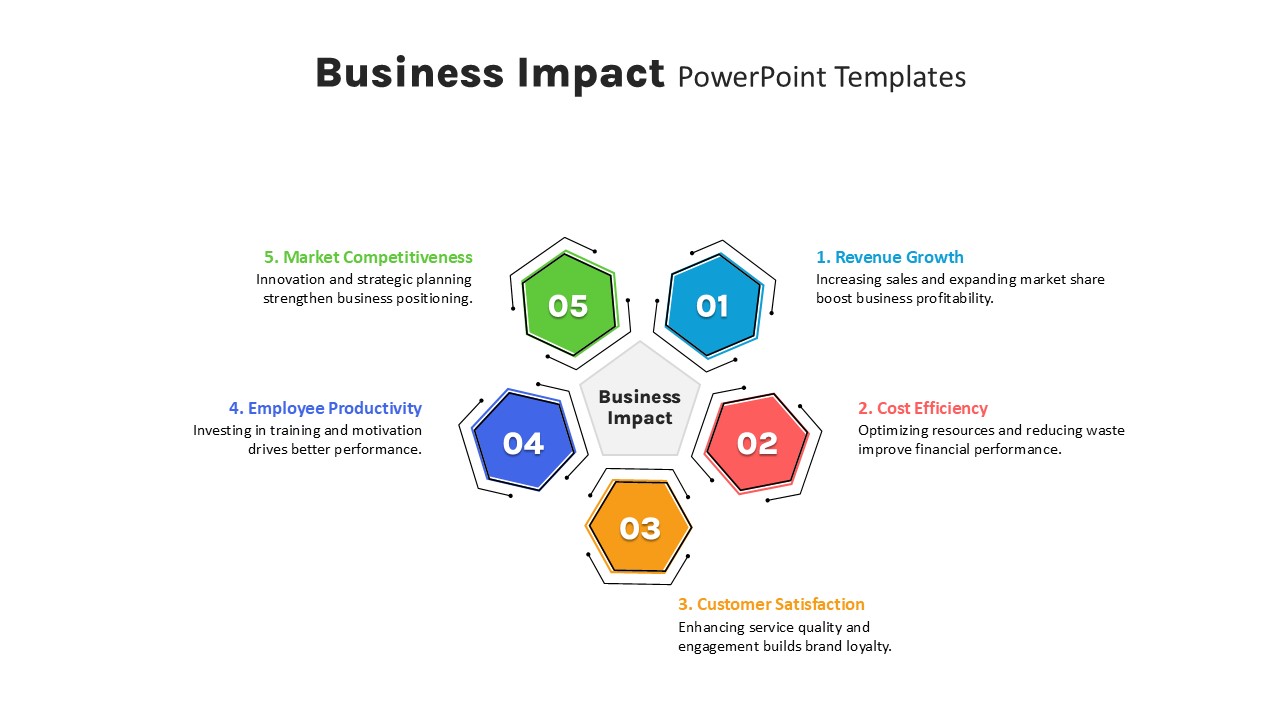
Five-Step Hexagon Business Impact Template for PowerPoint & Google Slides
Circular
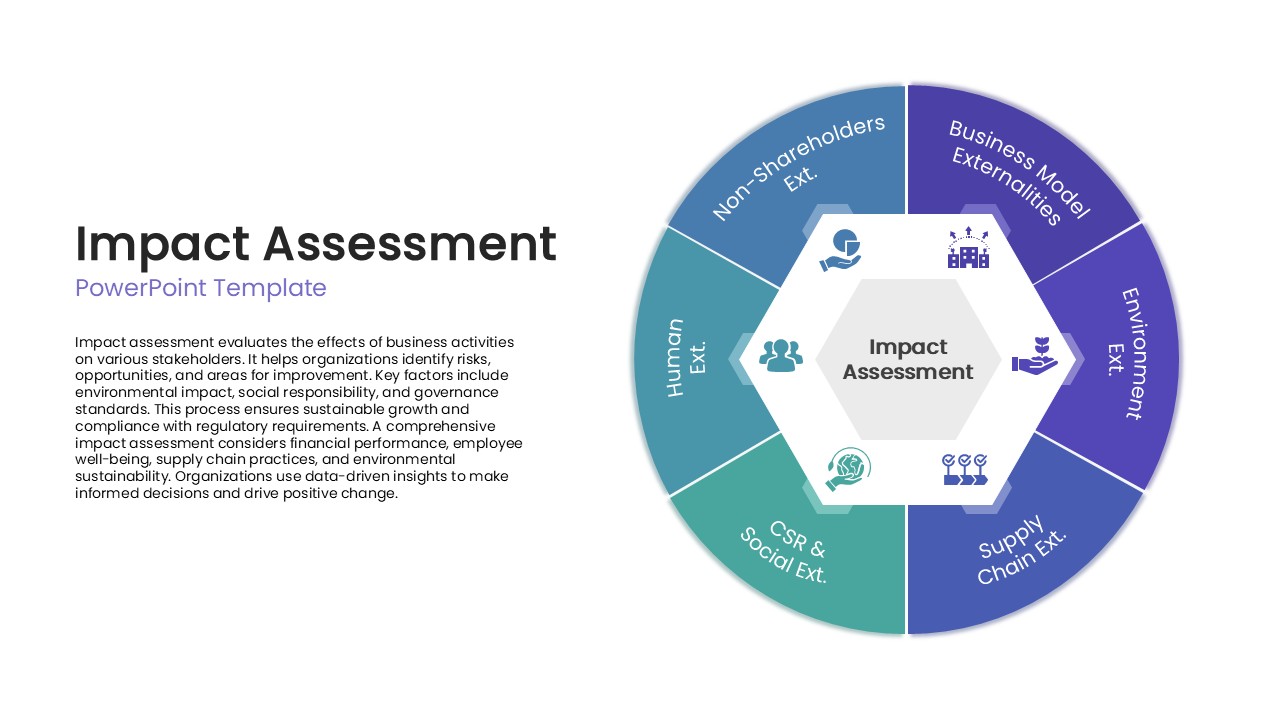
Impact Assessment Circular Diagram Template for PowerPoint & Google Slides
Circular
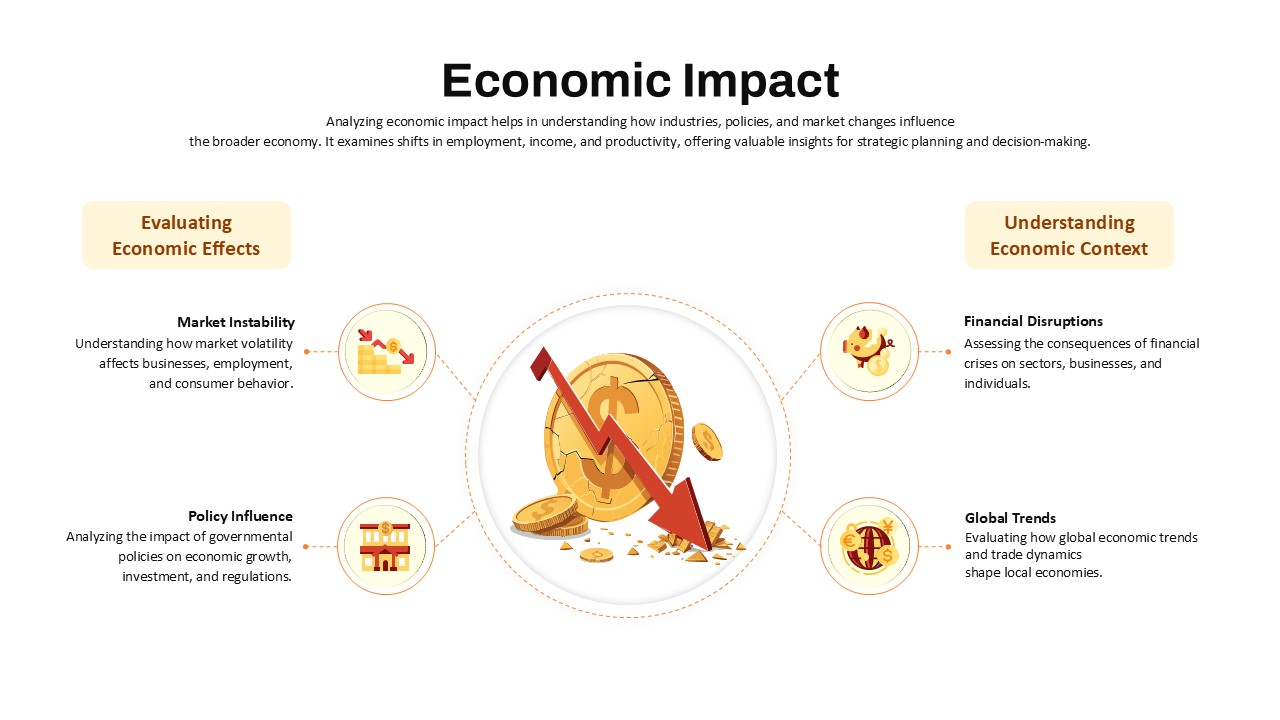
Economic Impact Assessment template for PowerPoint & Google Slides
Business Report
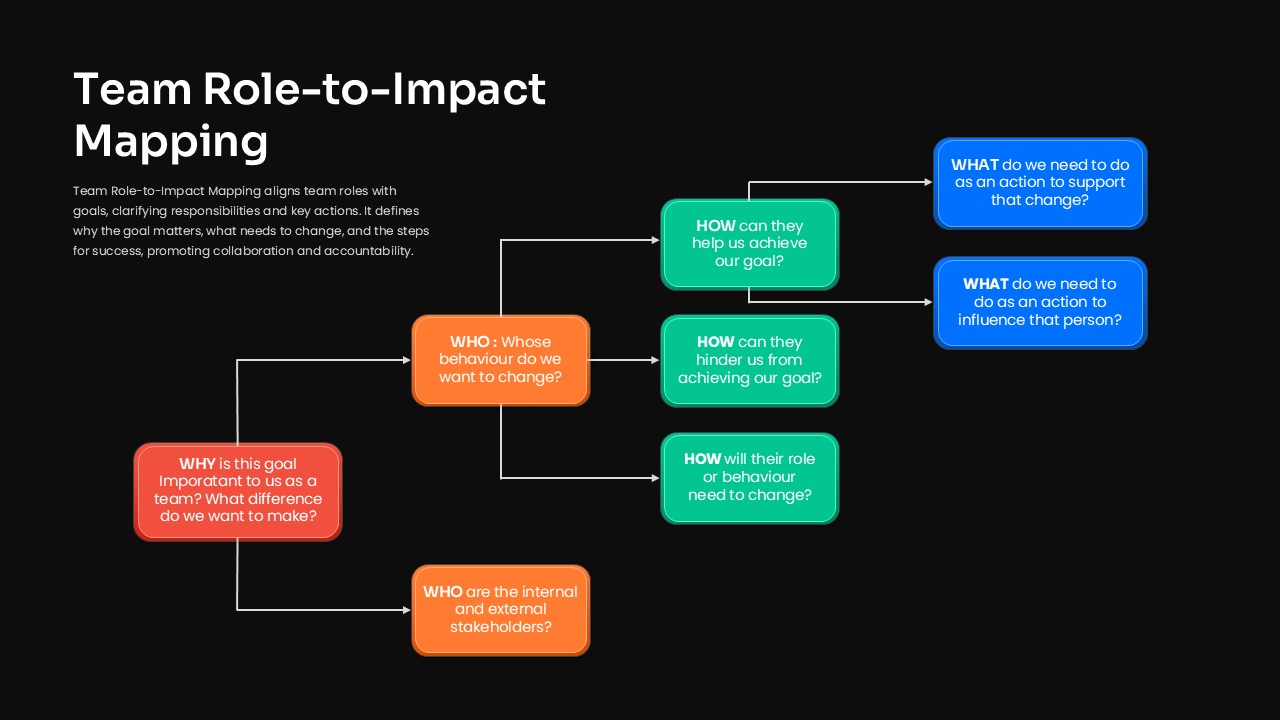
Team Role-to-Impact Mapping Flowchart Template for PowerPoint & Google Slides
Process
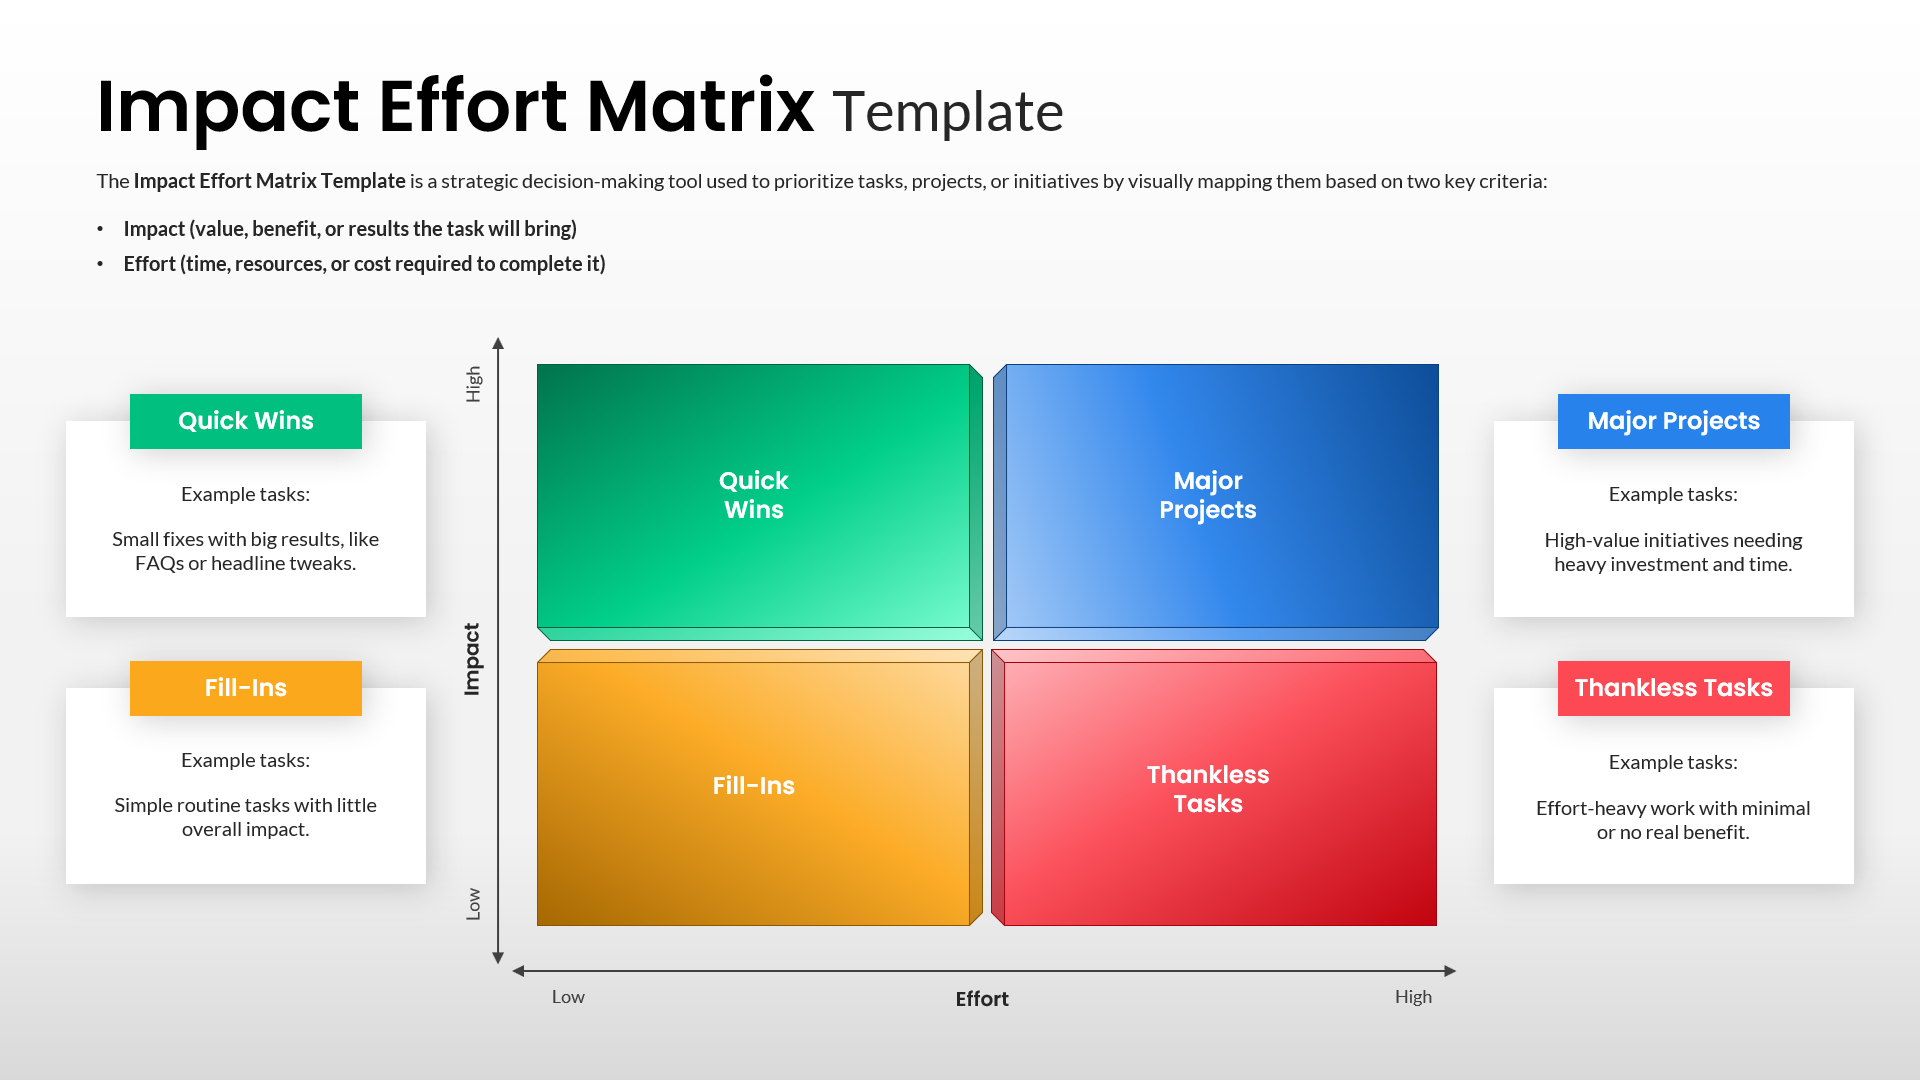
Impact Effort Matrix Template for PowerPoint & Google Slides
Comparison Chart
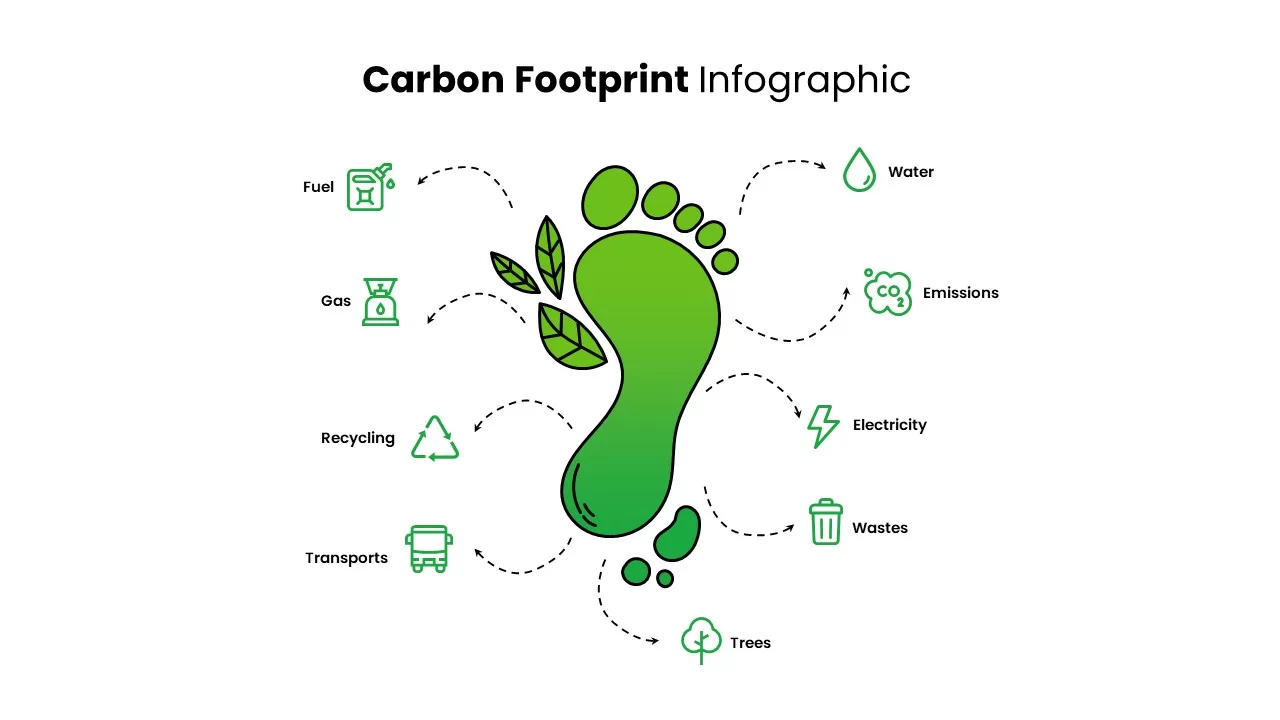
Carbon Footprint Environmental Impact Slide for PowerPoint & Google Slides
Risk Management

Statement of Comprehensive Income & Income Statement Template for PowerPoint
Business Report
Risk Pyramid Hierarchy Analysis Template for PowerPoint & Google Slides
Pyramid
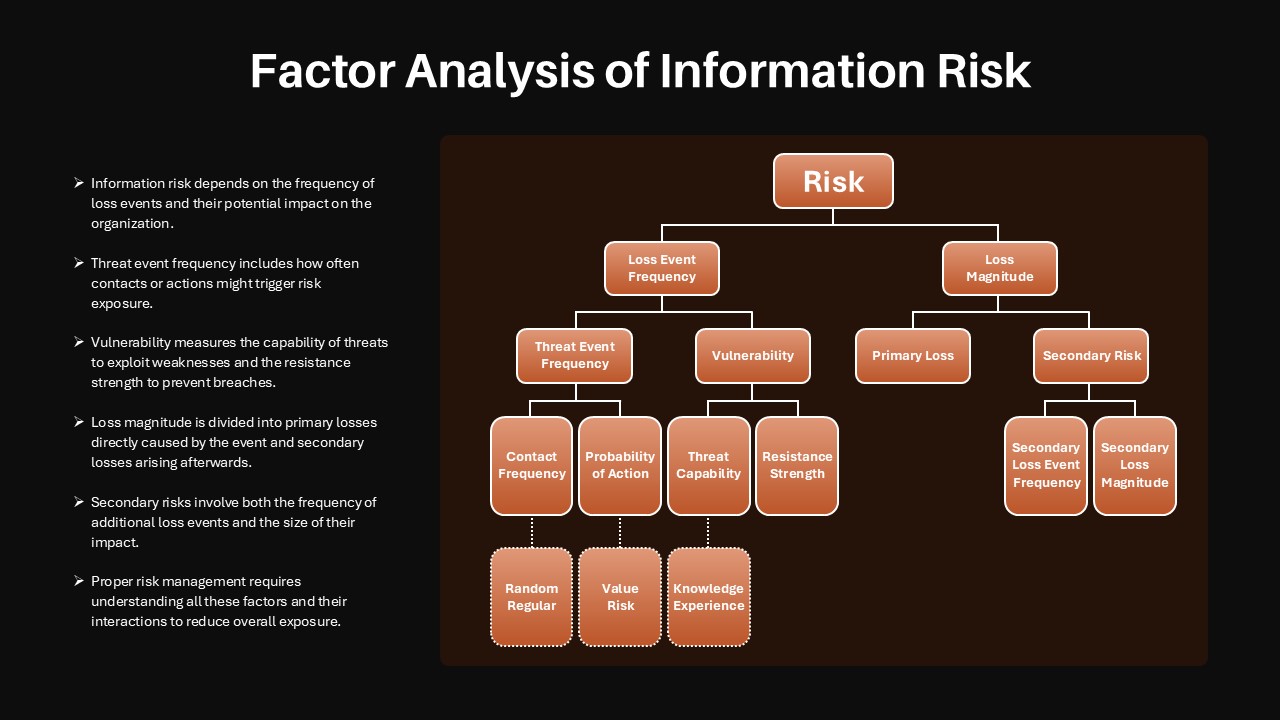
Factor Analysis of Information Risk Template for PowerPoint & Google Slides
Risk Management
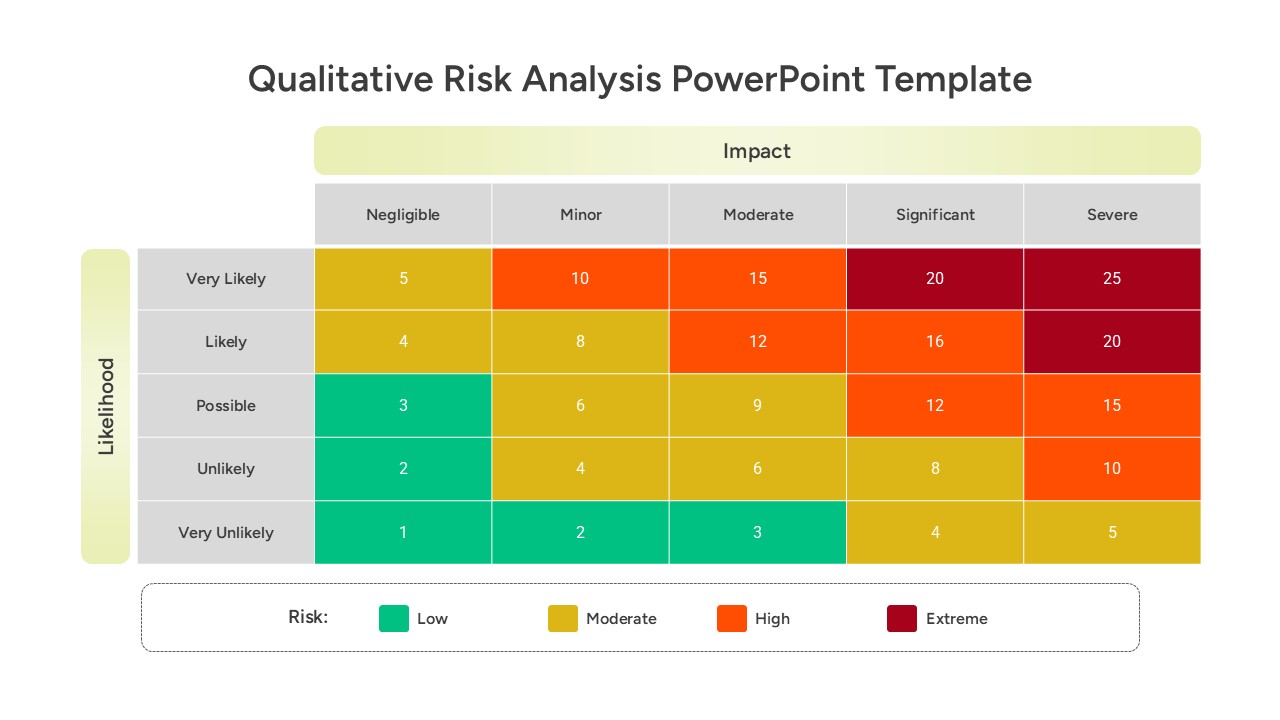
Qualitative Risk Analysis template for PowerPoint & Google Slides
Business
Quantitative Risk Analysis Matrix template for PowerPoint & Google Slides
Risk Management
Risk Management Mind Map Radial Diagram template for PowerPoint & Google Slides
Mind Maps

Bold Diamond Risk Alert Visualization Template for PowerPoint & Google Slides
Risk Management
Risk Management Presentation Template for PowerPoint and Google Slides
Decks
Marketing Risk Management Gear Diagram Template for PowerPoint & Google Slides
Risk Management
Risk Management Heat Map Diagram Template for PowerPoint & Google Slides
Comparison Chart
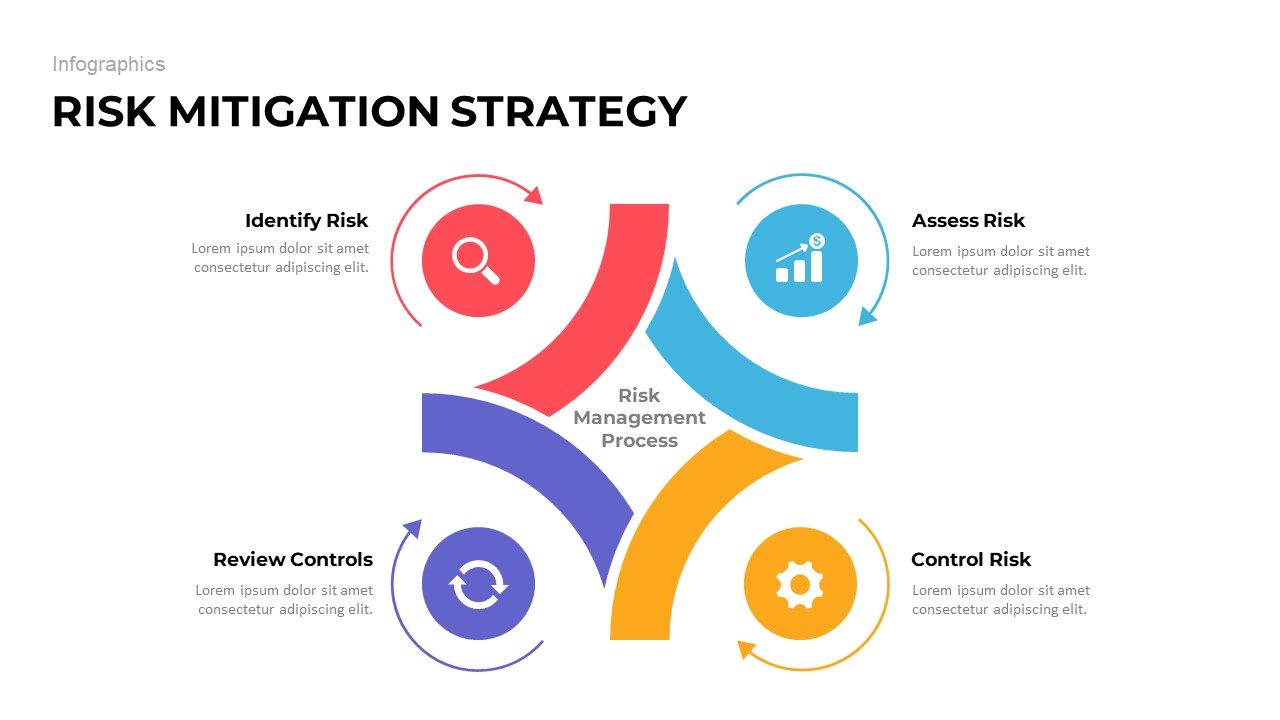
Risk Mitigation Strategy template for PowerPoint & Google Slides
Risk Management
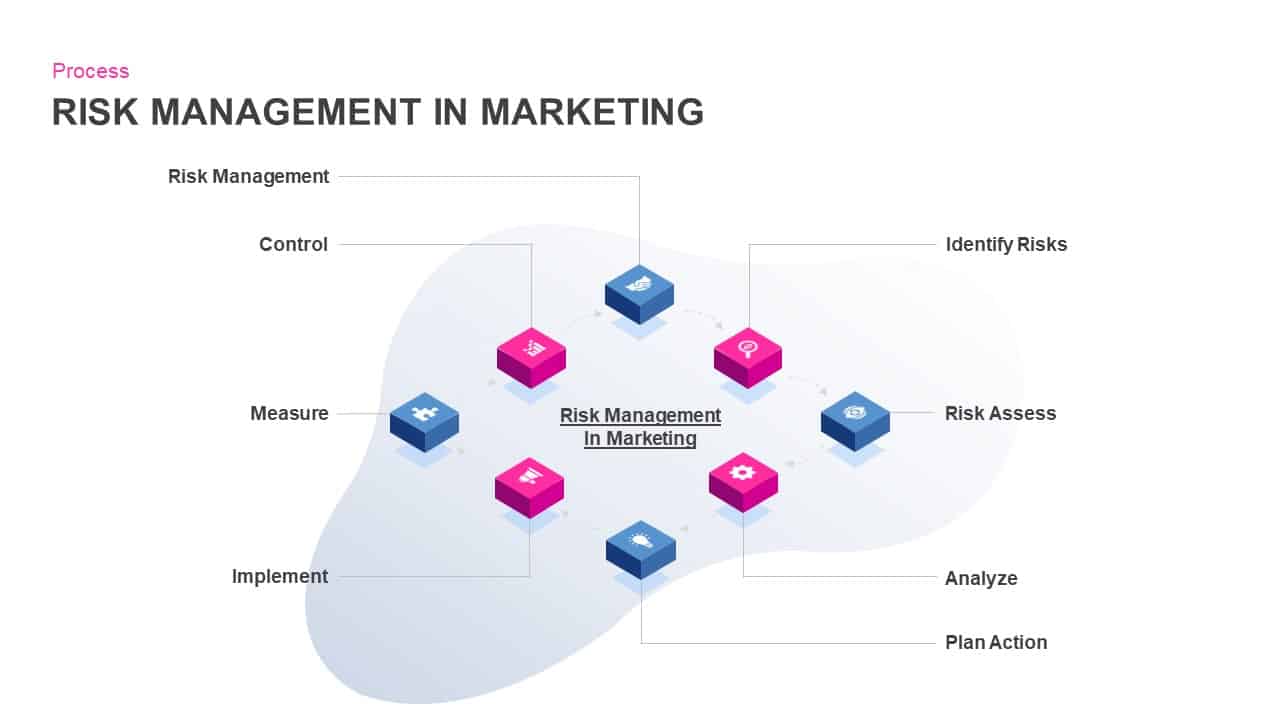
Risk Management in Marketing Process Template for PowerPoint & Google Slides
Risk Management
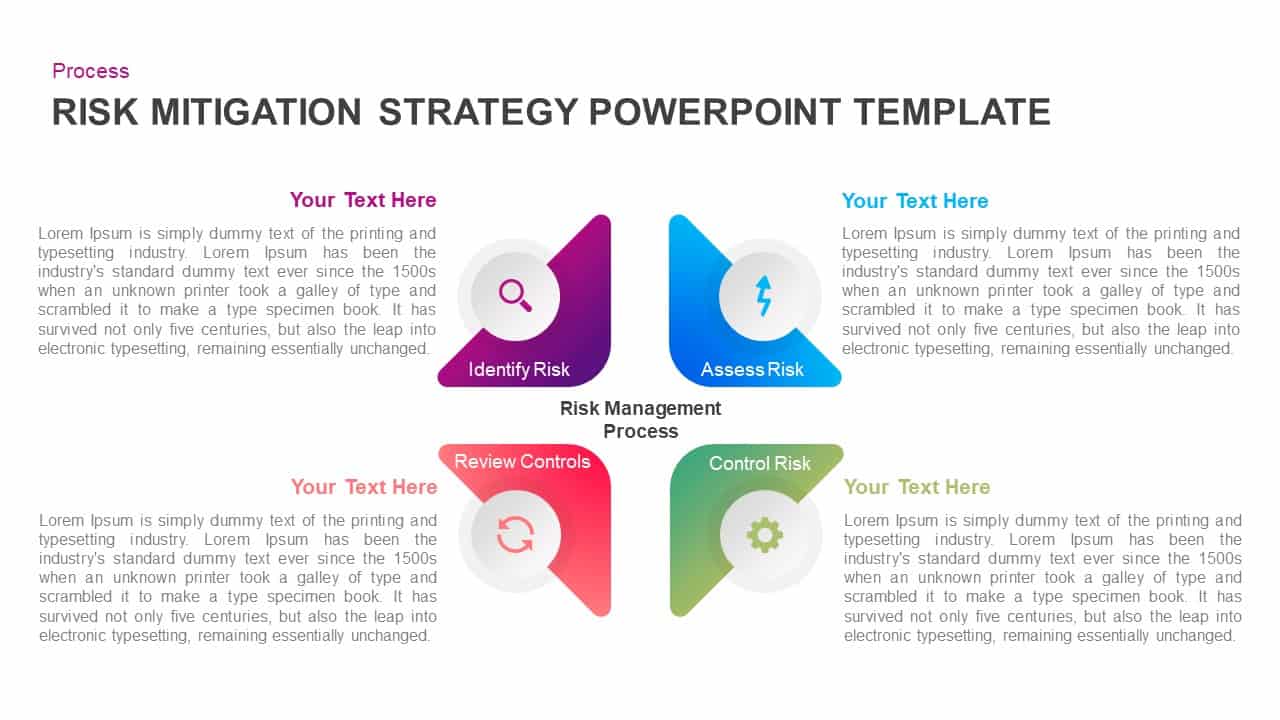
Four-Step Risk Mitigation Strategy Template for PowerPoint & Google Slides
Process
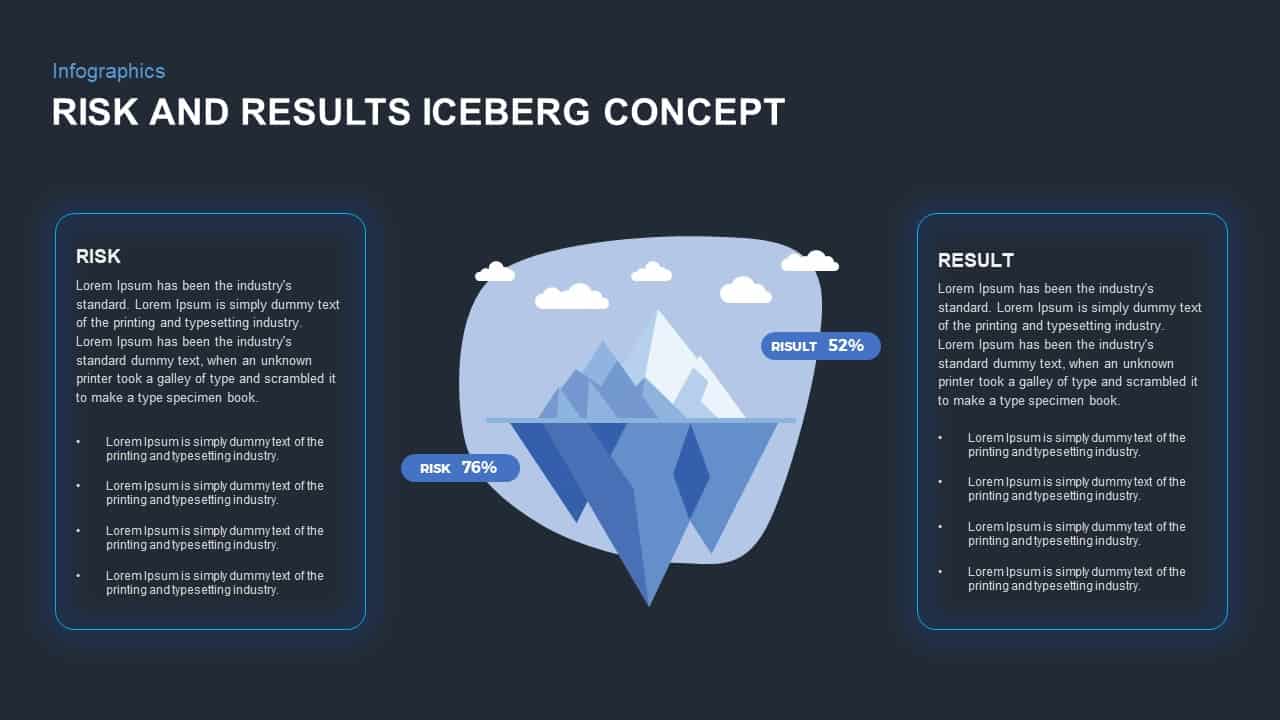
Risk and Results Iceberg Infographic Template for PowerPoint & Google Slides
Comparison
Enterprise Risk Management Cycle Diagram Template for PowerPoint & Google Slides
Process
Risk Management Process Diagram Template for PowerPoint & Google Slides
Risk Management
Bow-Tie Risk Assessment Diagram Template for PowerPoint & Google Slides
Risk Management
Heat Map Risk Assessment Presentation Template for PowerPoint & Google Slides
Risk Management
Professional Risk Heat Map Visualization Template for PowerPoint & Google Slides
Risk Management
Heat Map Risk Matrix Dashboard Template for PowerPoint & Google Slides
Comparison Chart
Risk Assessment Heatmap Matrix Slide Template for PowerPoint & Google Slides
Comparison Chart
Risk Heatmap Comparison Template for PowerPoint & Google Slides
Maps
Swiss Cheese Risk Management Model Template for PowerPoint & Google Slides
Risk Management
Shield Infographics Risk Indicators Template for PowerPoint & Google Slides
Infographics
Risk Mitigation Plan Deck Template for PowerPoint & Google Slides
Risk Management
Work Safety Training & Risk Management Template for PowerPoint & Google Slides
Risk Management
Risk Management Consulting Deck Template for PowerPoint & Google Slides
Risk Management
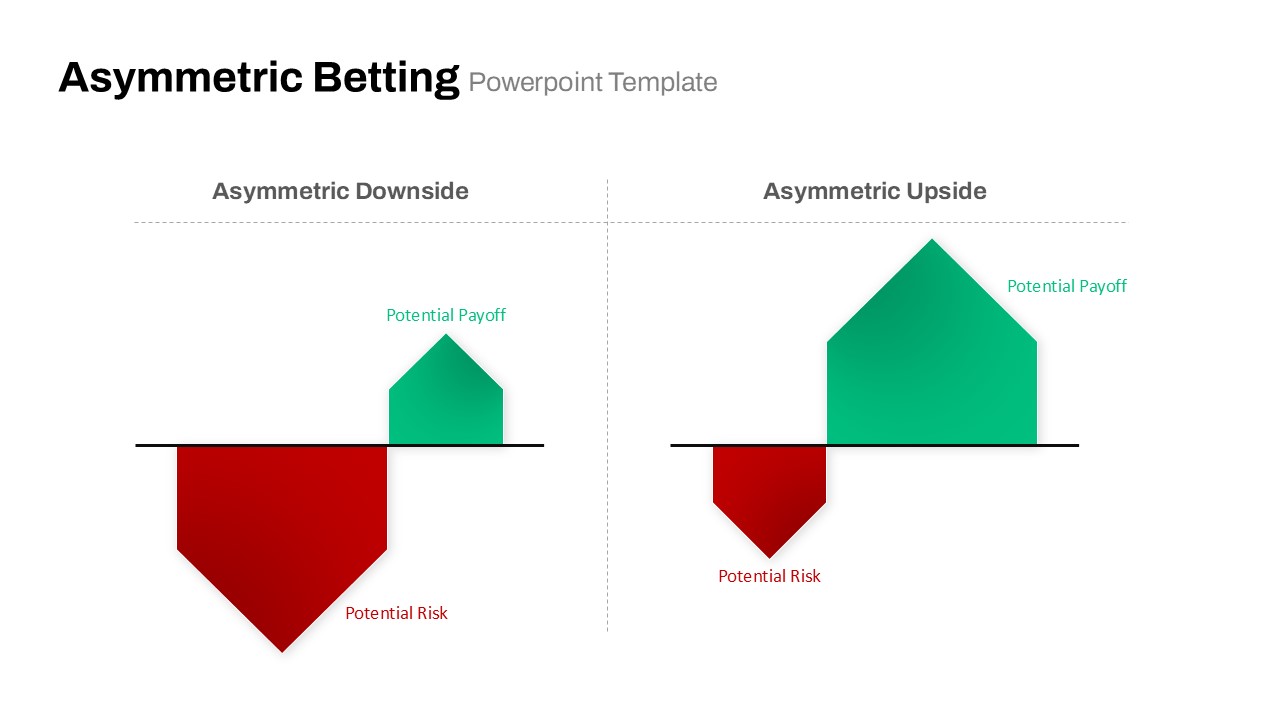
Asymmetric Betting Payoff Risk Diagram Template for PowerPoint & Google Slides
Comparison
Risk Level Gauge Comparison Dashboard Template for PowerPoint & Google Slides
Comparison
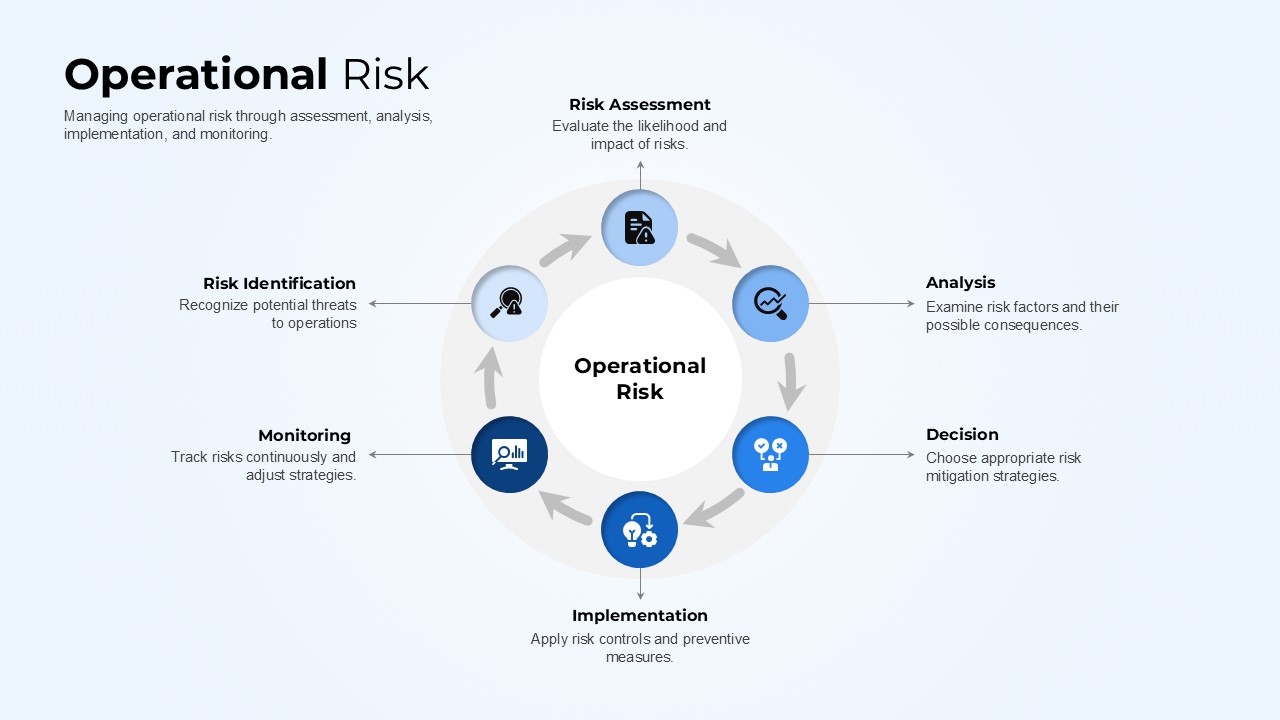
Operational Risk Template for PowerPoint & Google Slides
Risk Management
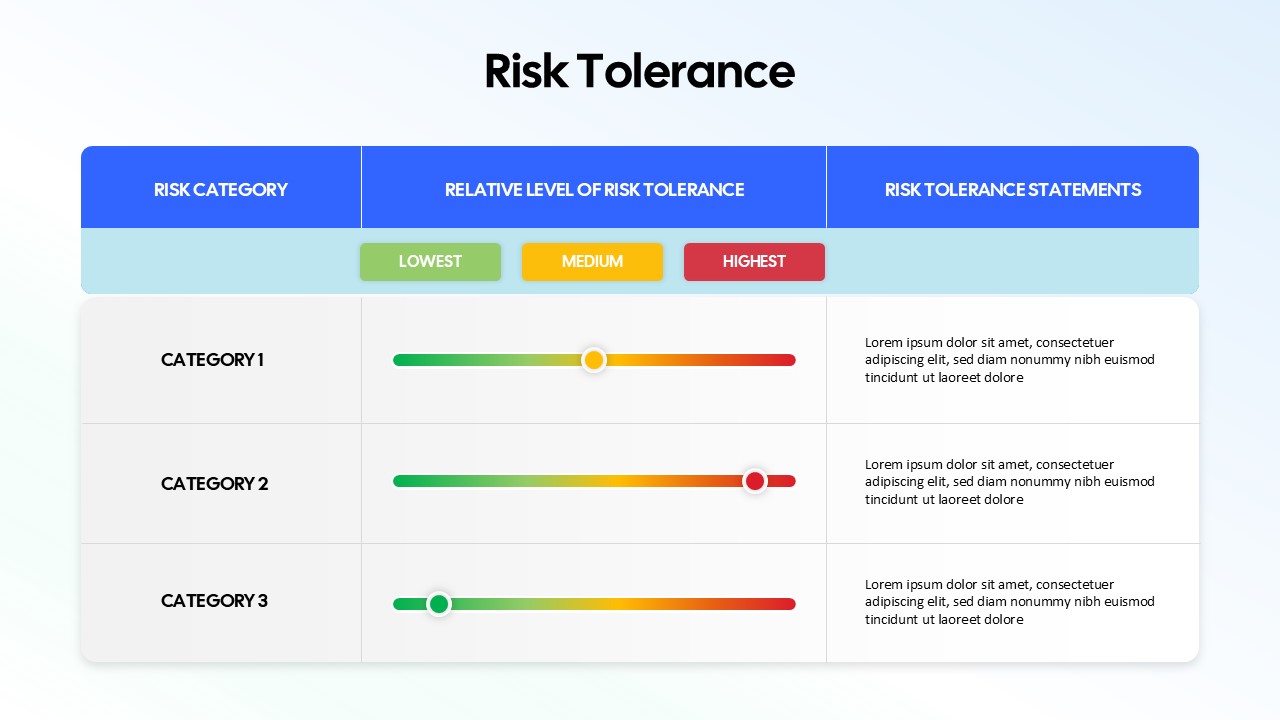
Risk Tolerance Assessment Sliders Template for PowerPoint & Google Slides
Finance
Risk Scoring & Ranking Heatmap Matrix Template for PowerPoint & Google Slides
Risk Management
Risk Management Framework Pyramid Template for PowerPoint & Google Slides
Risk Management
Supplier Risk Management template for PowerPoint & Google Slides
Opportunities Challenges
Risk Acceptance Workflow Template for PowerPoint & Google Slides
Risk Management
Key Risk Indicators (KRI) Gauge Template for PowerPoint & Google Slides
Risk Management
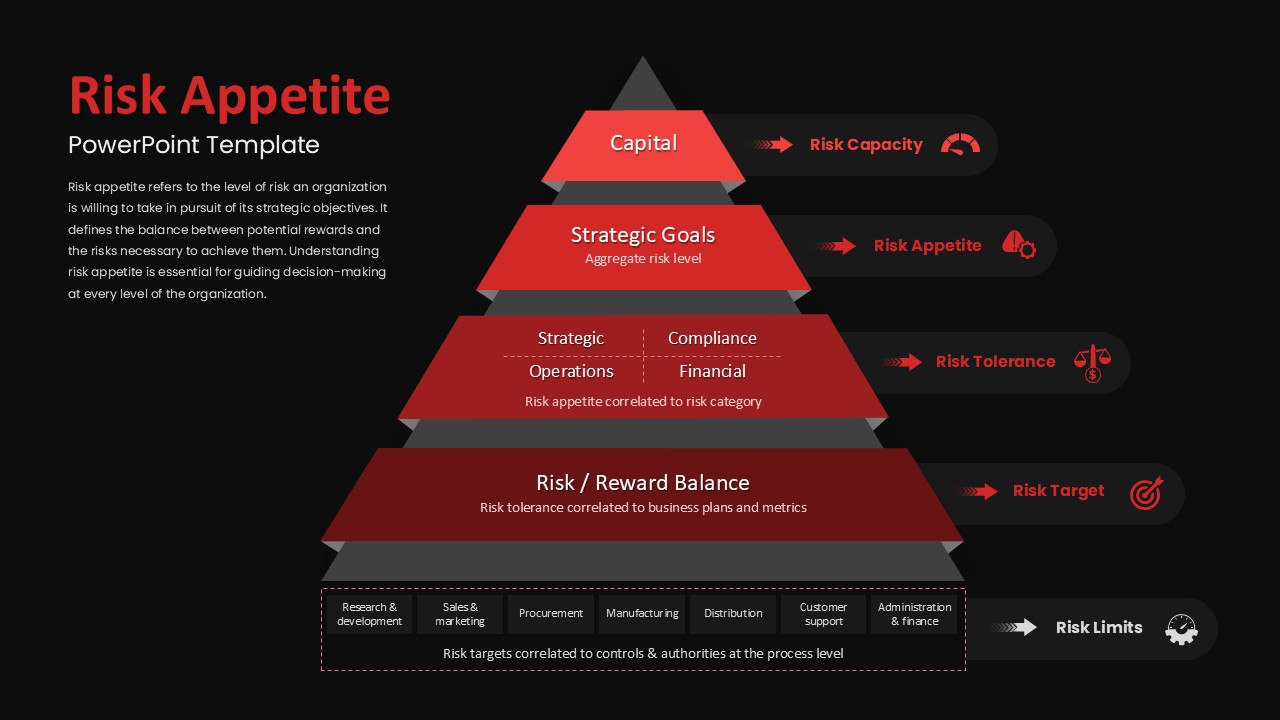
Risk Appetite Pyramid Framework Template for PowerPoint & Google Slides
Pyramid
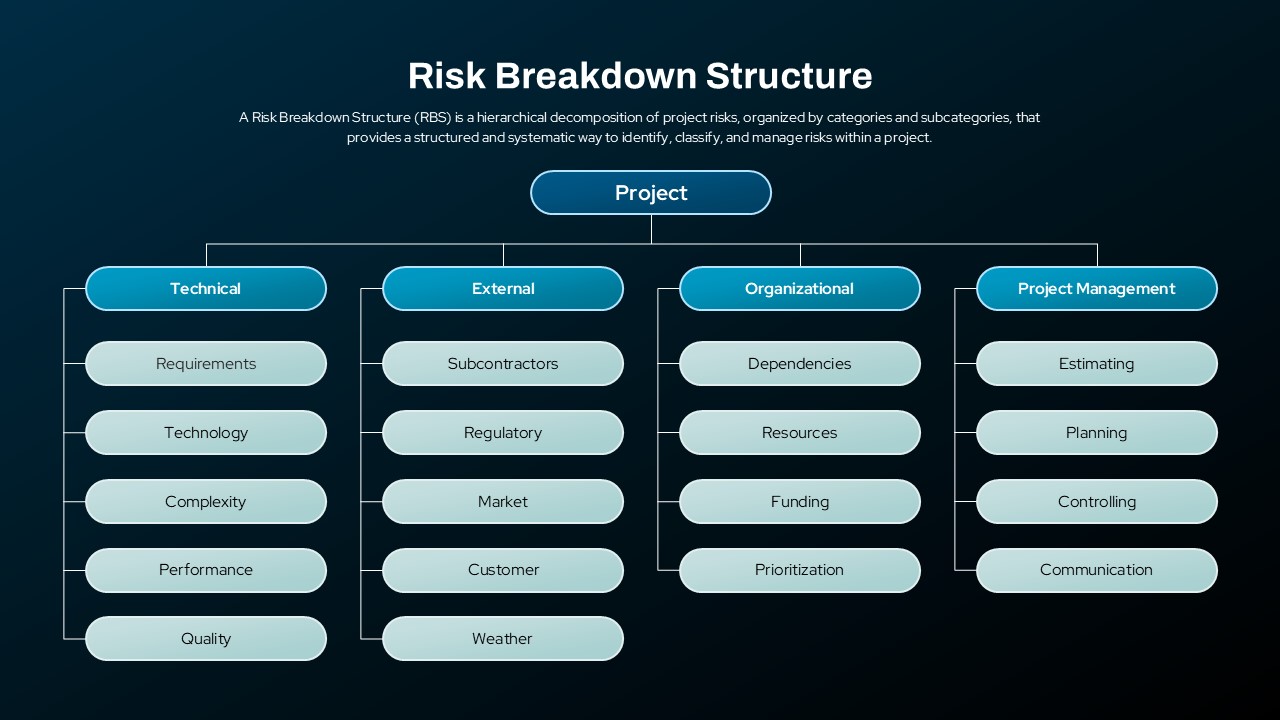
Risk Breakdown Structure Diagram Template for PowerPoint & Google Slides
Org Chart
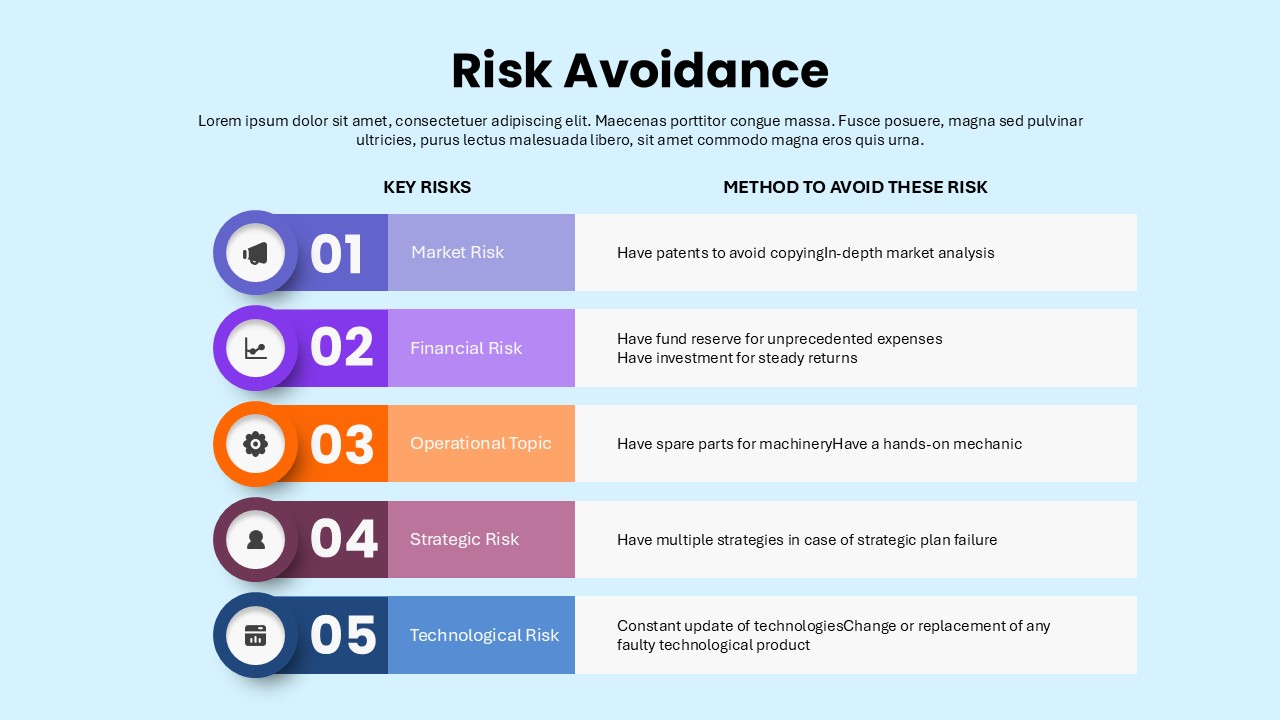
Risk Avoidance: Five Risks & Mitigation Template for PowerPoint & Google Slides
Risk Management
Risk vs Reward Comparison Template for PowerPoint & Google Slides
Opportunities Challenges
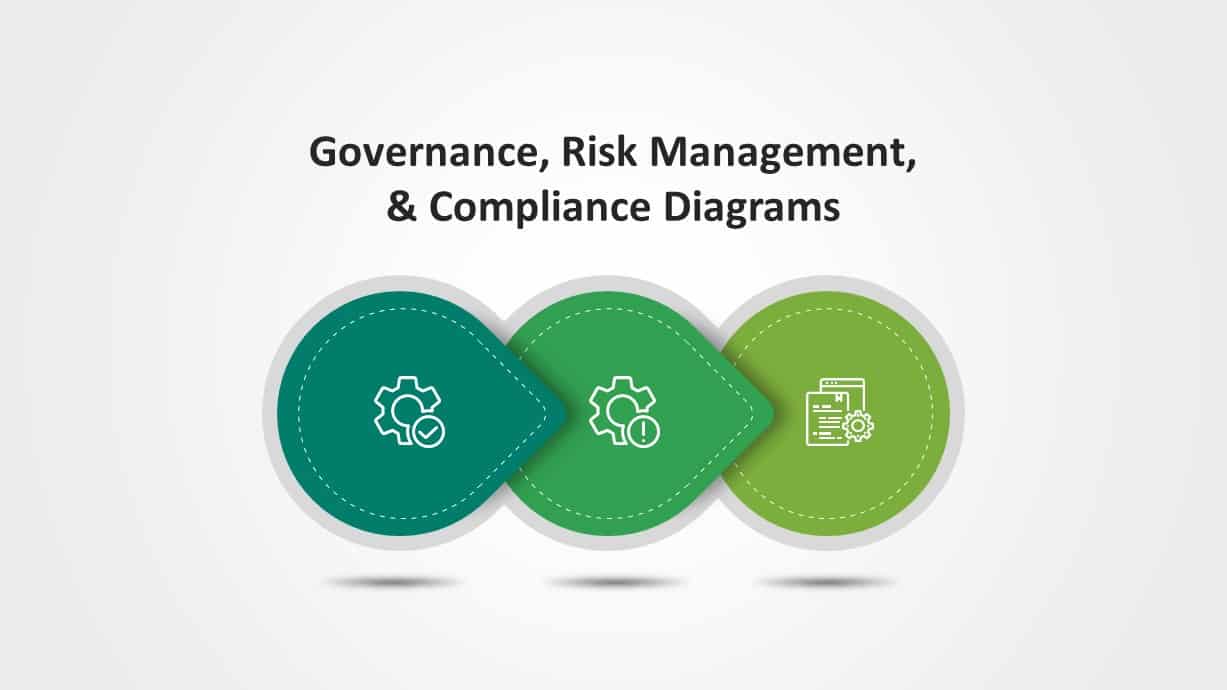
Governance, Risk & Compliance Overview Diagrams for PowerPoint & Google Slides
Risk Management
Safety Incident Pyramid Risk Hierarchy Slide for PowerPoint & Google Slides
Risk Management
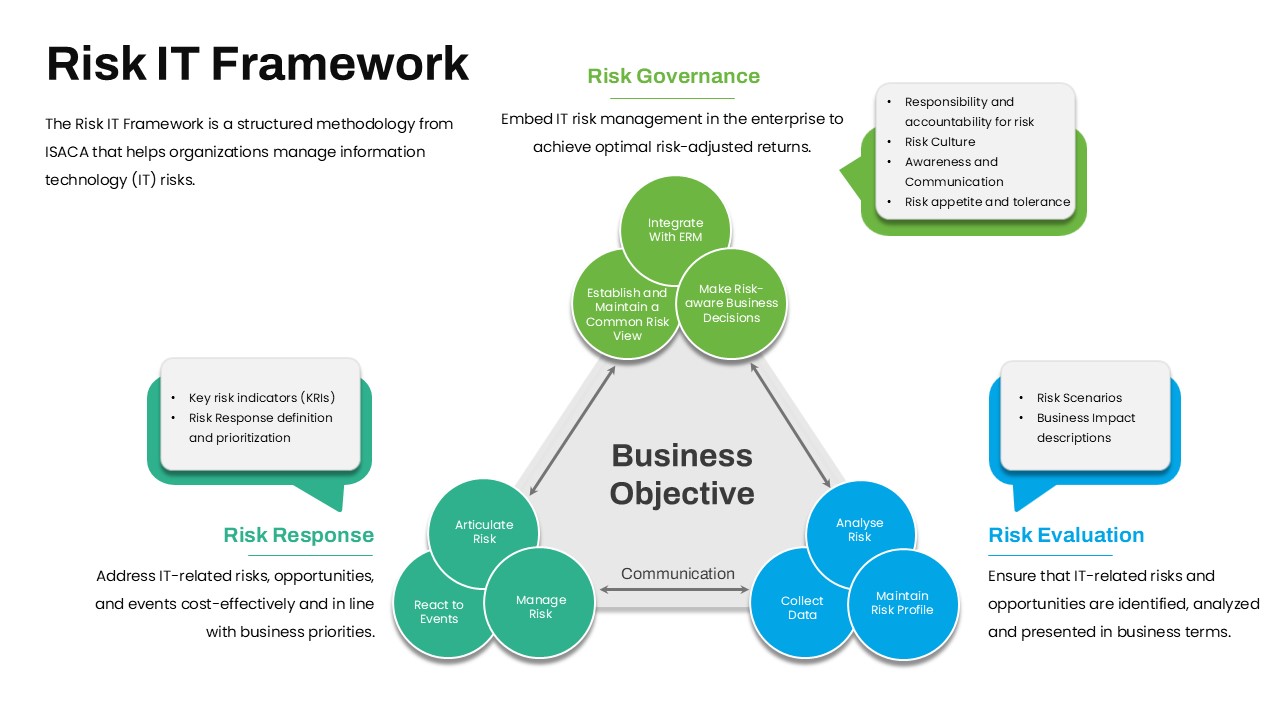
Risk IT Framework Overview for PowerPoint & Google Slides
Business Strategy