Skinner’s Reinforcement Theory Matrix Template for PowerPoint & Google Slides
Description
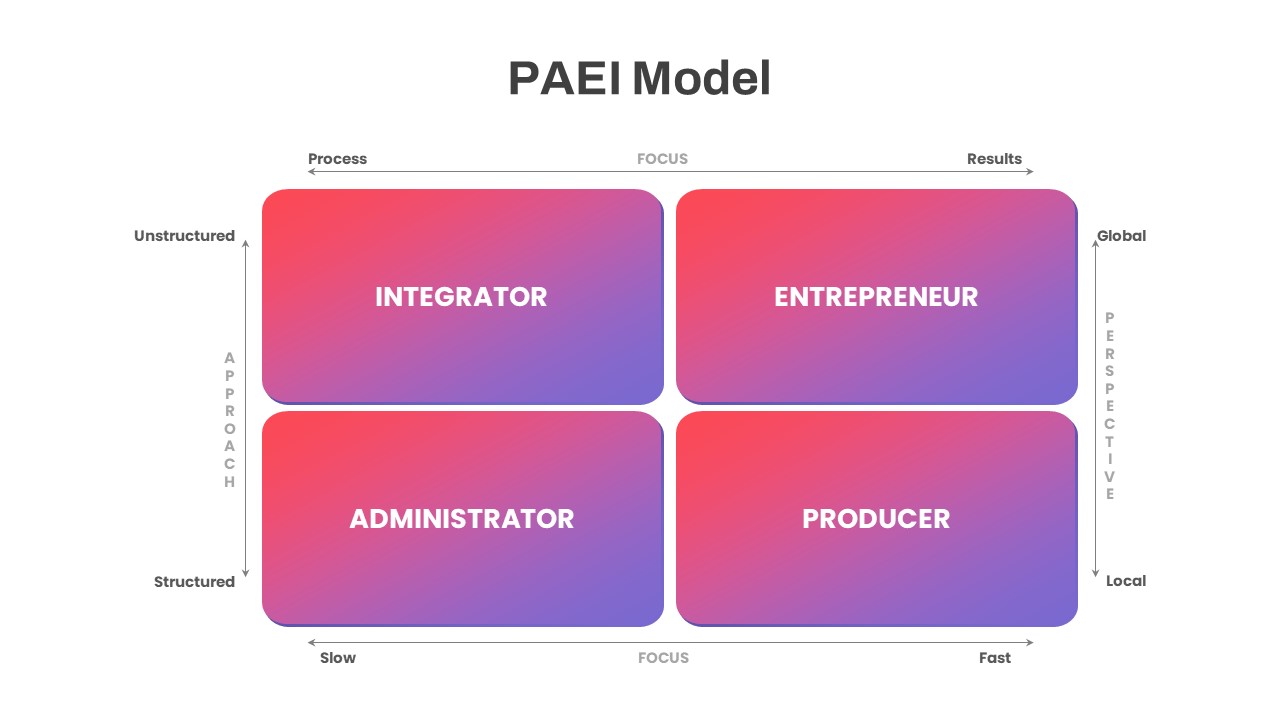
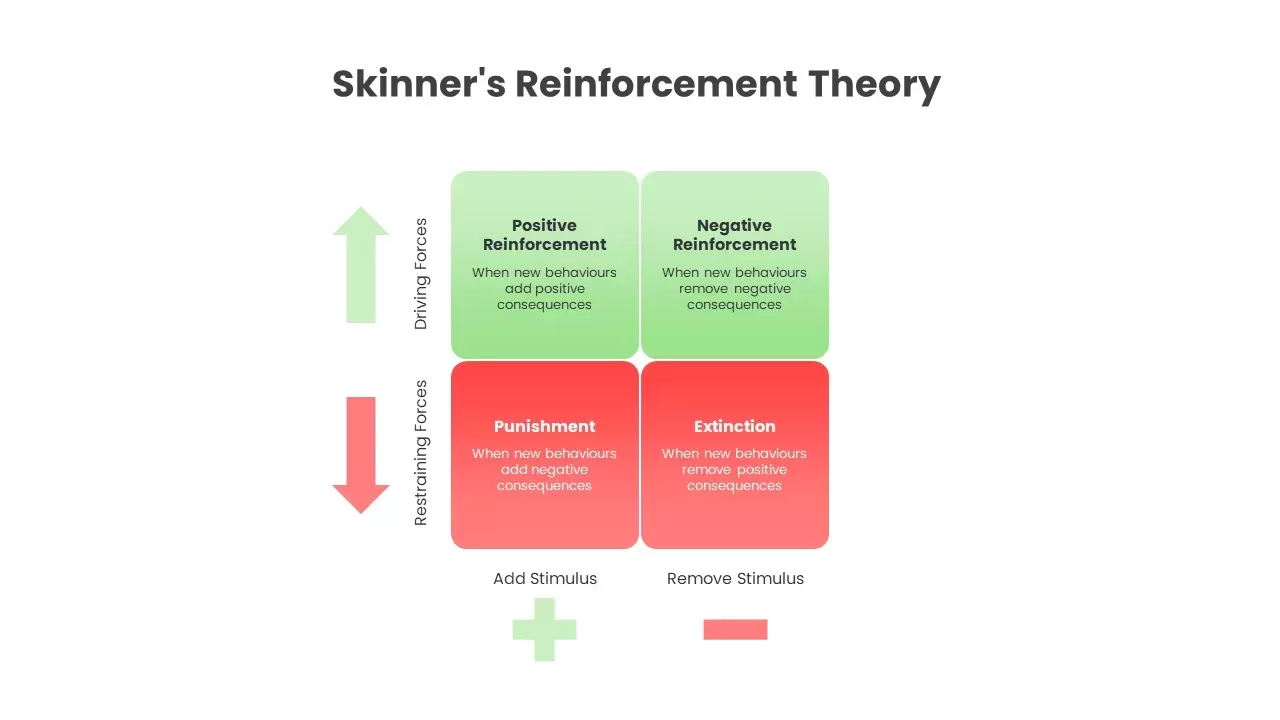
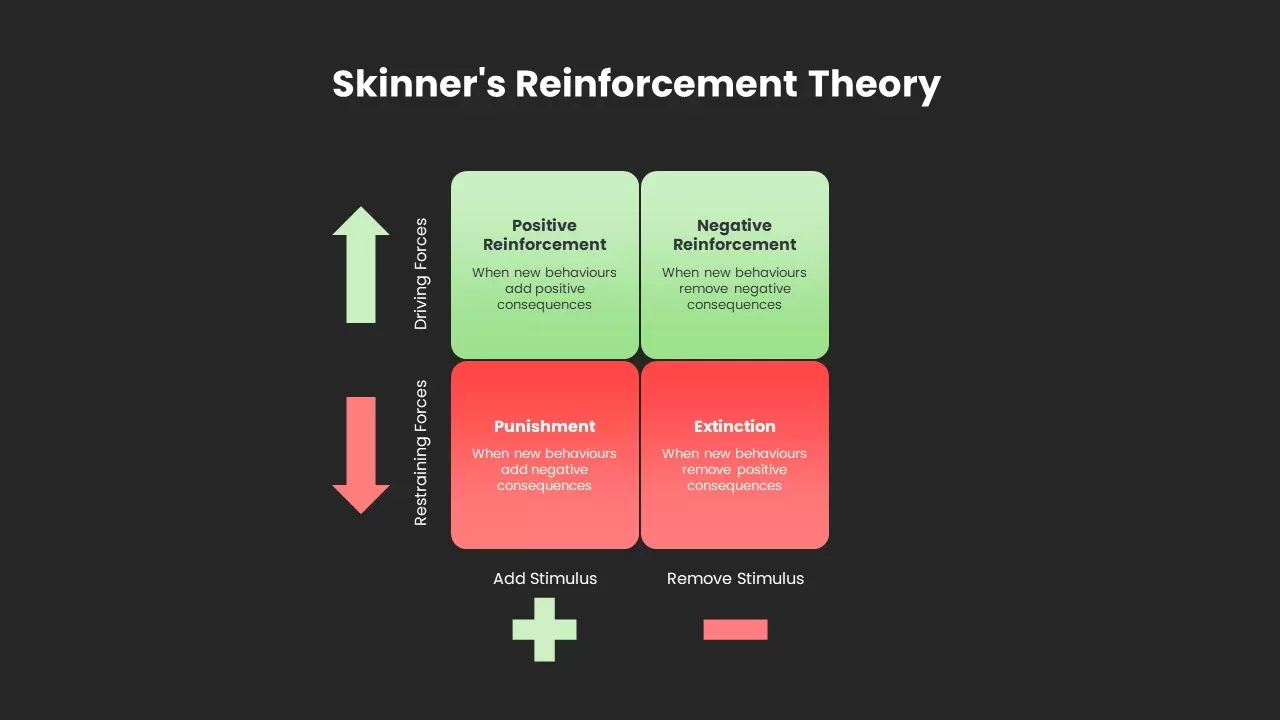
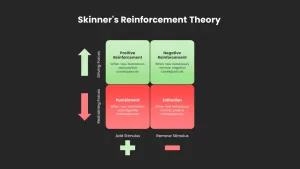
Use this four-quadrant matrix infographic slide to present Skinner’s reinforcement theory in a clear, engaging format. Each quadrant features one of the four reinforcement types—Positive Reinforcement, Negative Reinforcement, Punishment, and Extinction—rendered in distinct green and red gradient fills. An upward green arrow on the left denotes Driving Forces, while a downward red arrow indicates Restraining Forces. At the bottom, plus and minus icons define the Add Stimulus and Remove Stimulus axes, providing an intuitive legend for behavioral outcomes. Ample text placeholders inside each cell let you insert custom descriptions or real-world examples, making complex psychological concepts instantly accessible.
Built on master slides with fully editable vector shapes, this layout lets you adjust gradient colors, relabel quadrants, and reposition the legend without affecting alignment. Swap headings, update side labels, or apply corporate brand colors in seconds. The professional white background ensures optimal readability, and subtle drop shadows add depth to each element. Optimized for both PowerPoint and Google Slides, the slide preserves pixel-perfect spacing, consistent typography, and crisp visuals across devices and output formats.
Locked guides maintain perfect alignment when combining this slide within multi-slide decks, helping you build comprehensive training modules or corporate presentations without manual tweaking. With this versatile design, you can deliver precise, data-driven insights on reinforcement strategies in classrooms, boardrooms, or virtual workshops.
Who is it for
Organizational psychologists, HR leaders, trainers, and educators will find this matrix ideal for teaching behavioral principles. Consultants and performance managers can leverage it in workshops, seminars, or executive briefings to align teams on reward and deterrent strategies.
Other Uses
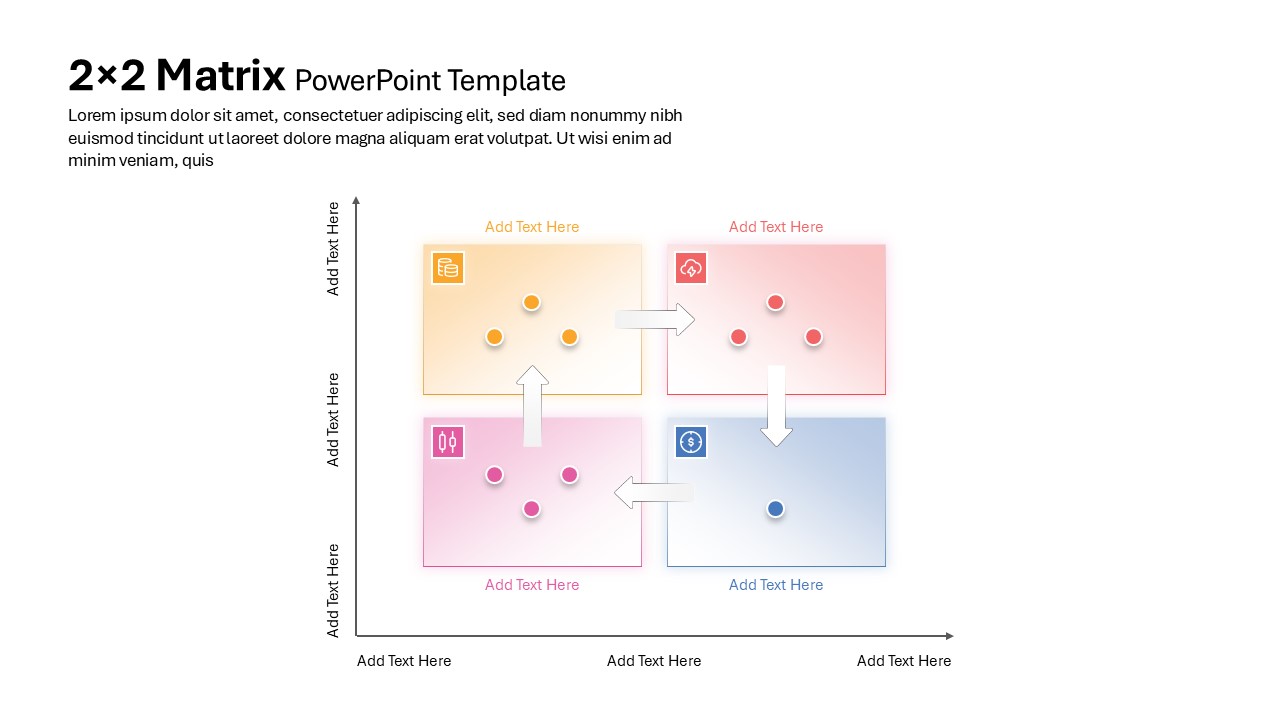
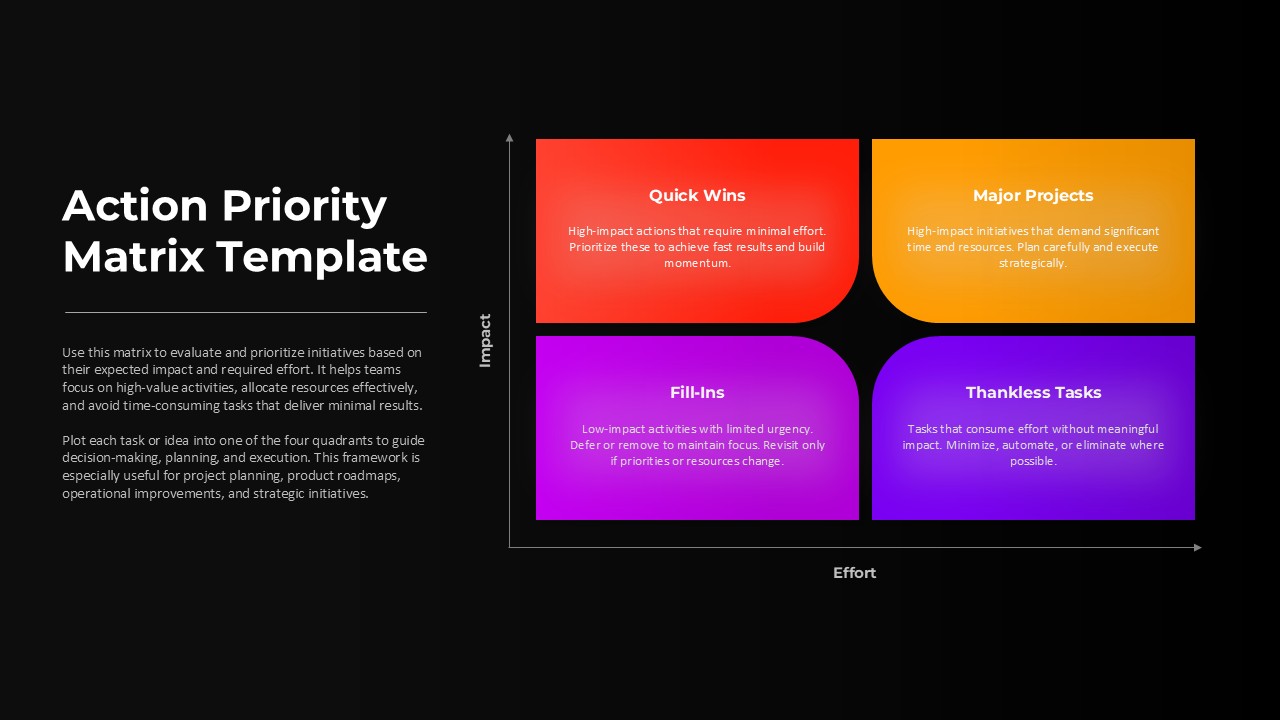
Beyond behavioral theory, repurpose this slide for four-quadrant analyses such as cost-benefit matrices, risk-impact assessments, or strategic planning frameworks. Simply relabel quadrants and update axis legends to suit any comparison or process modeling need.
Login to download this file

Item ID
SB02961
Related Templates

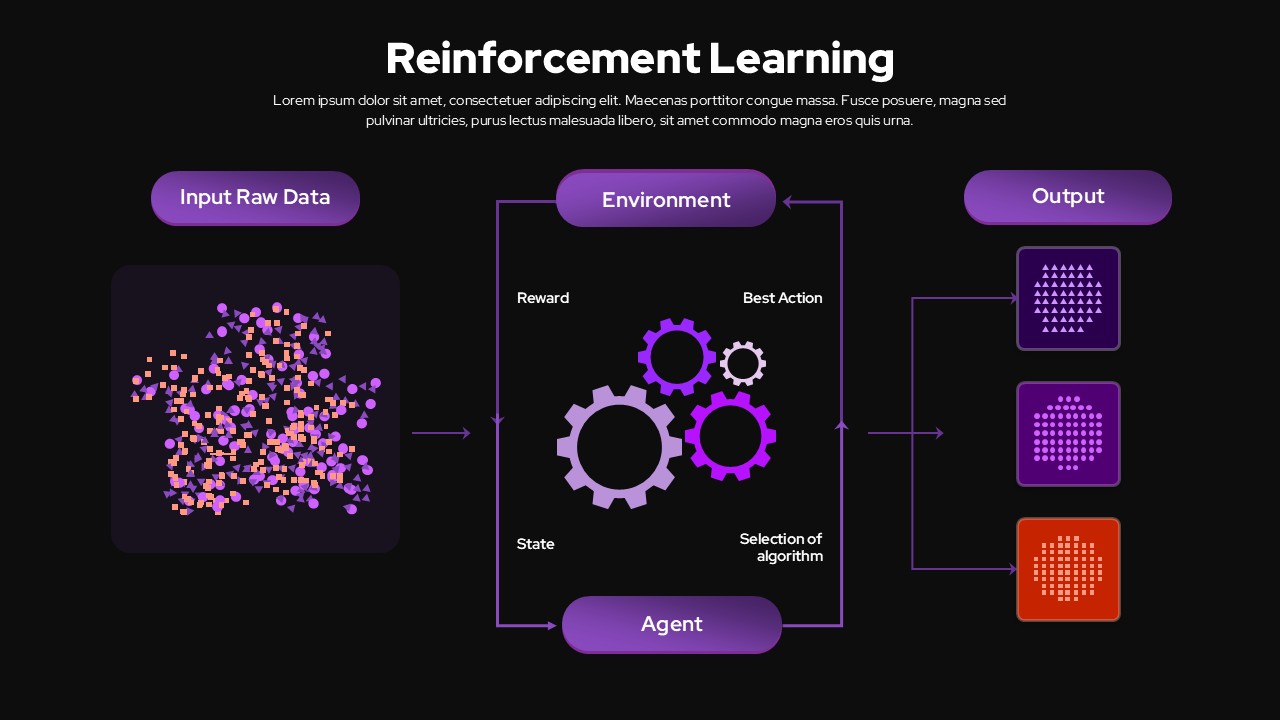
Reinforcement Learning Diagram Dark Template for PowerPoint & Google Slides
Machine Learning
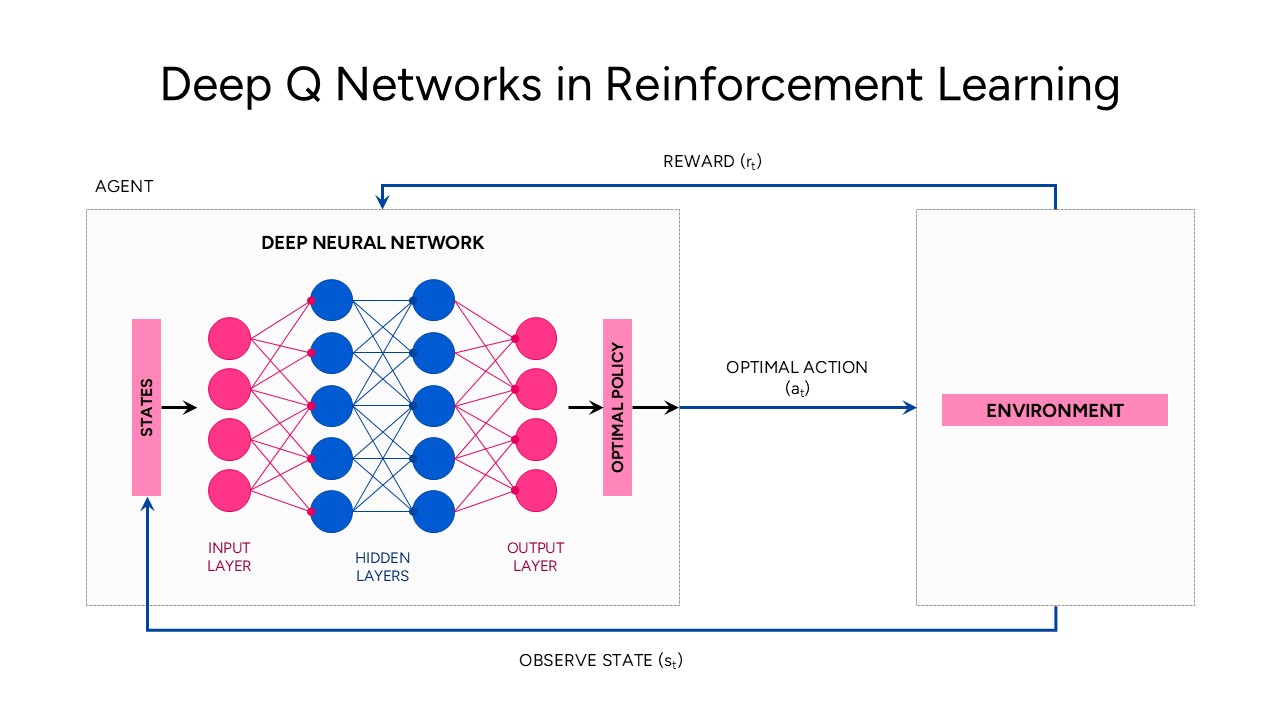
Deep Q Networks in Reinforcement Learning template for PowerPoint & Google Slides
Technology
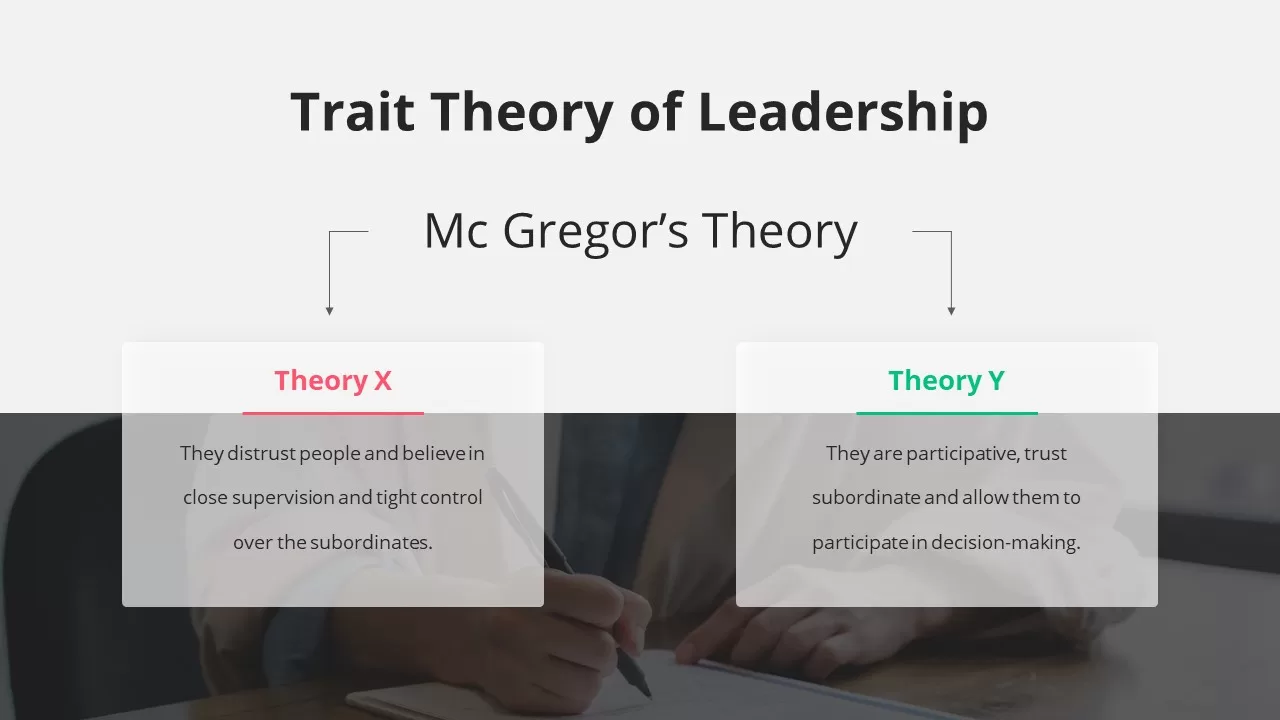
Theory X and Theory Y Comparison Template for PowerPoint & Google Slides
Comparison
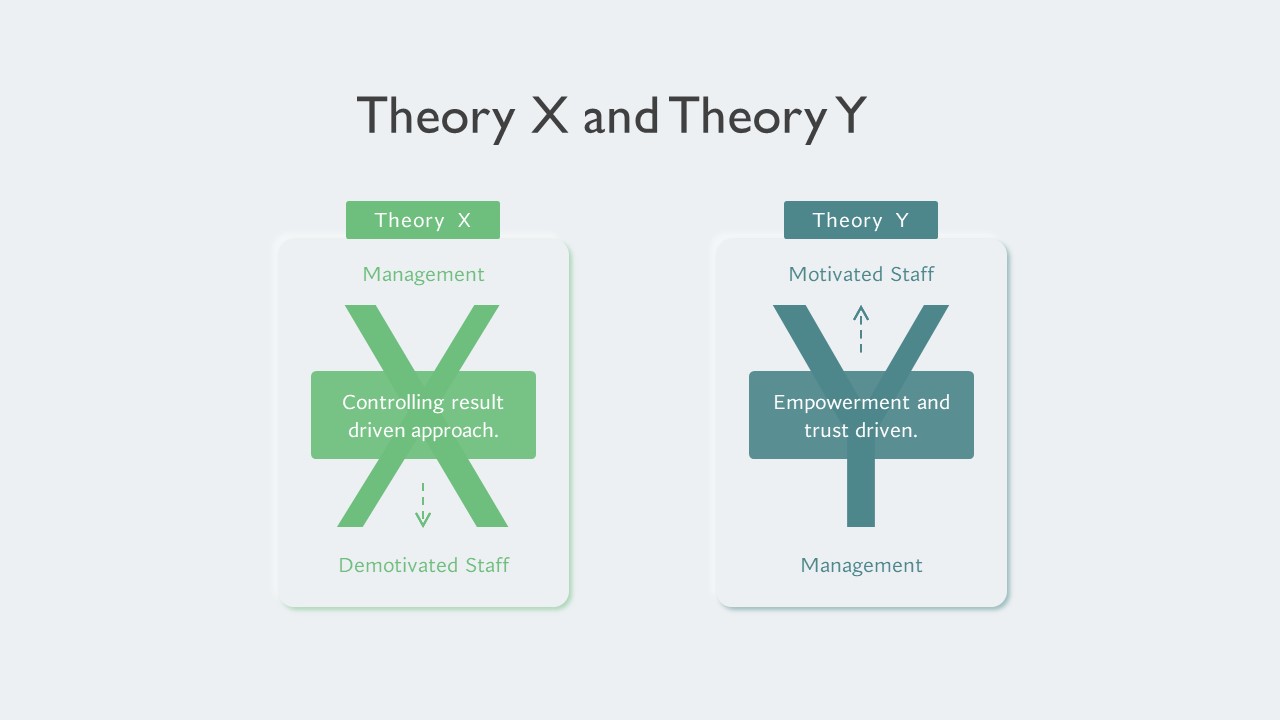
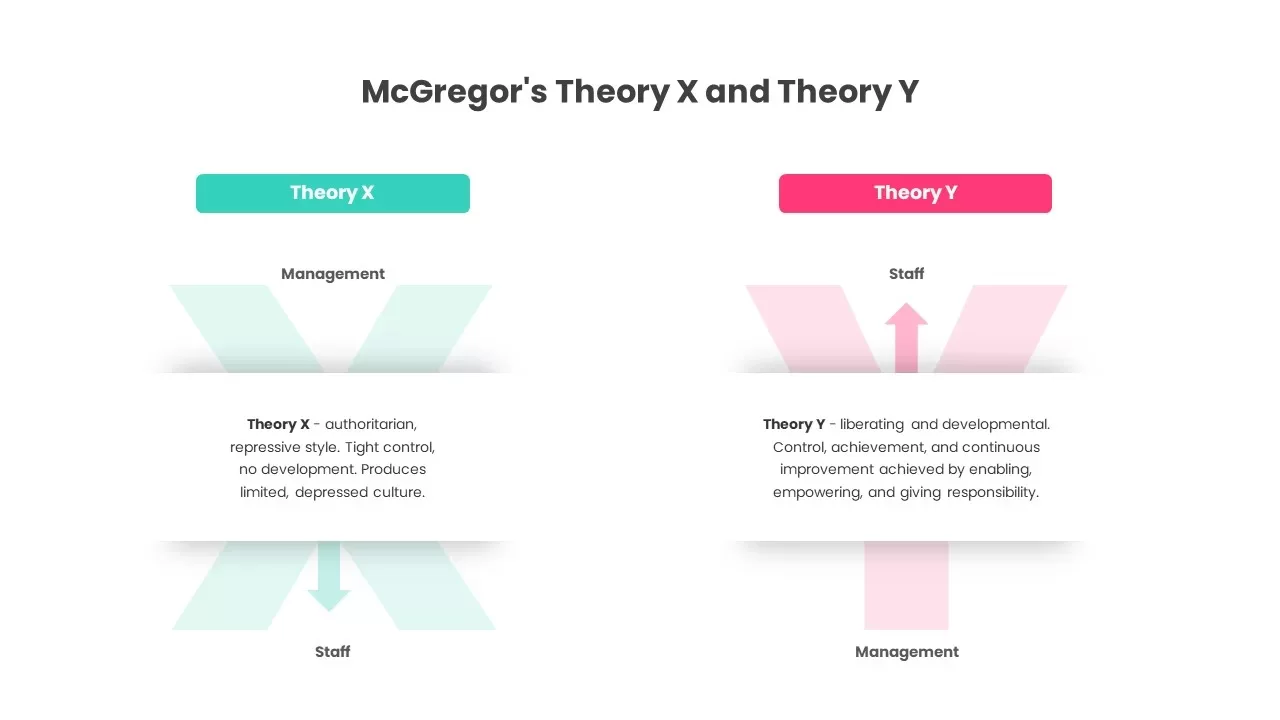
McGregor’s Theory X and Theory Y infographic Template for PowerPoint & Google Slides
Business Strategy
McGregor’s Theory X vs Theory Y Template for PowerPoint & Google Slides
Comparison
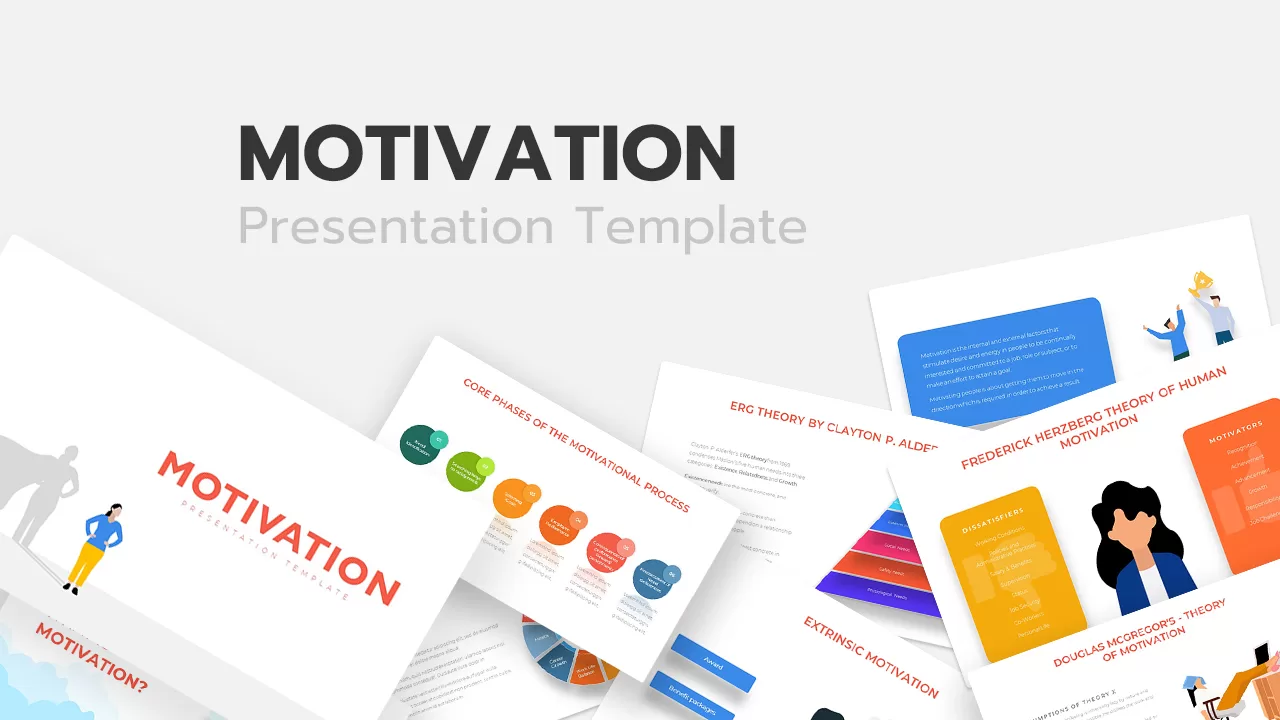
Motivational Theory Presentation Template for PowerPoint & Google Slides
Decks

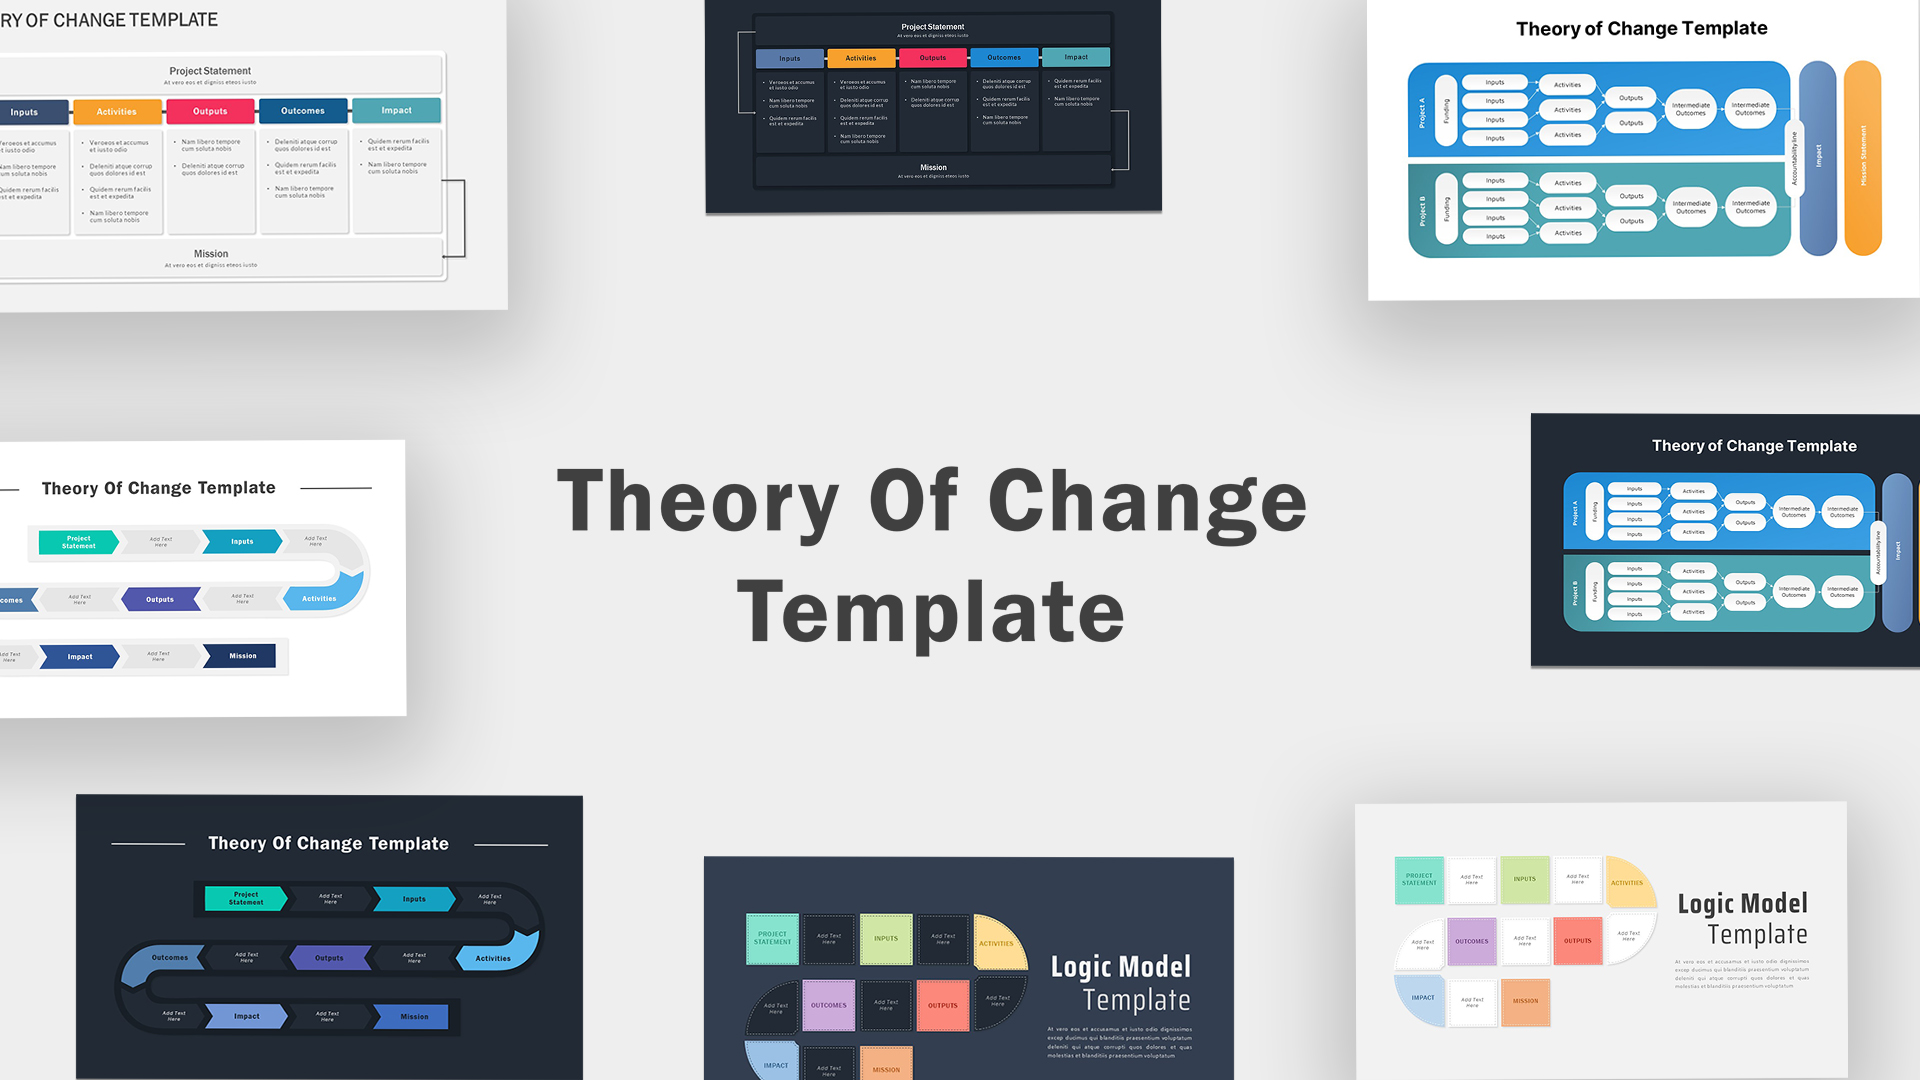
Theory of Change Infographics Pack Template for PowerPoint & Google Slides
Process
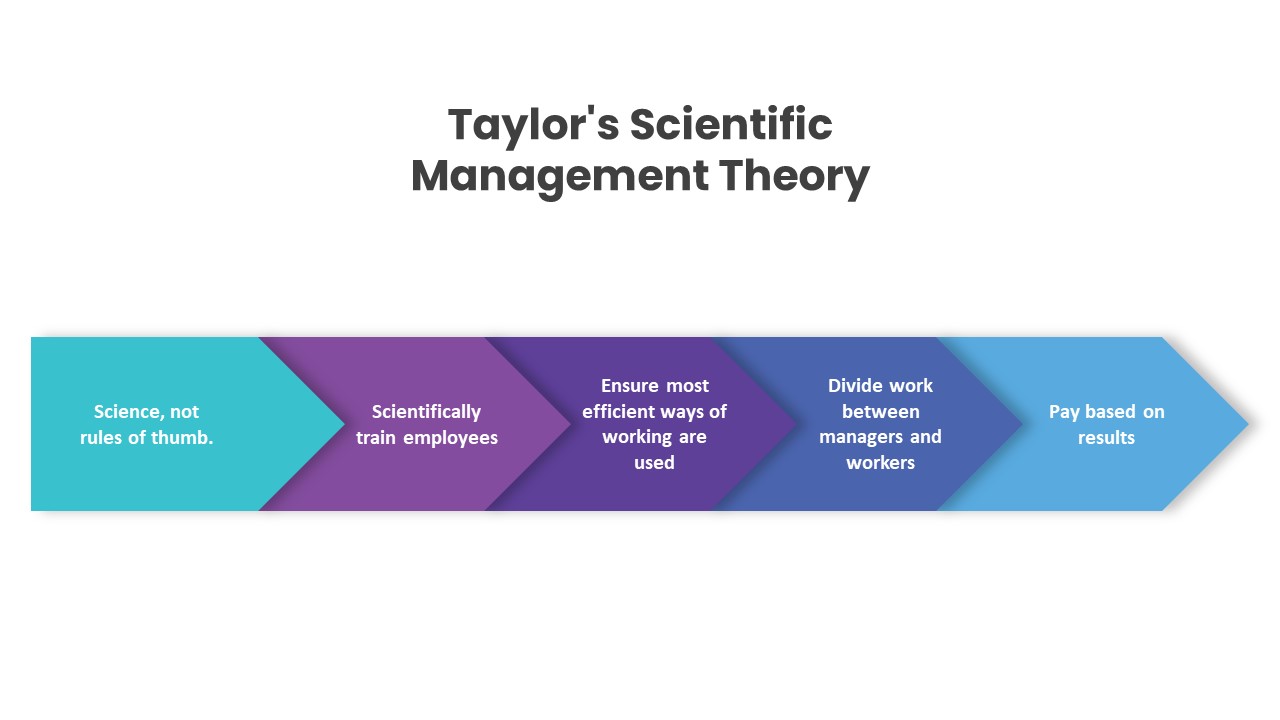
Taylor’s Scientific Management Theory Template for PowerPoint & Google Slides
Process
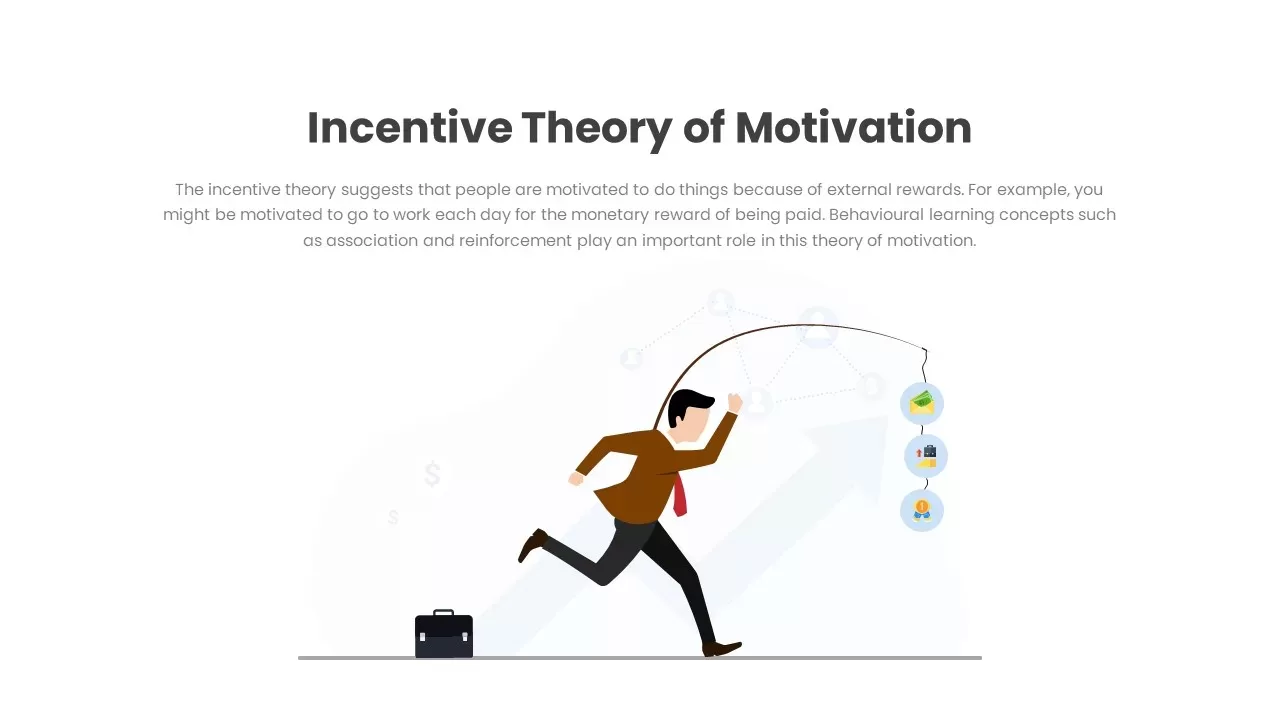
Incentive Theory of Motivation Diagram Template for PowerPoint & Google Slides
Employee Performance
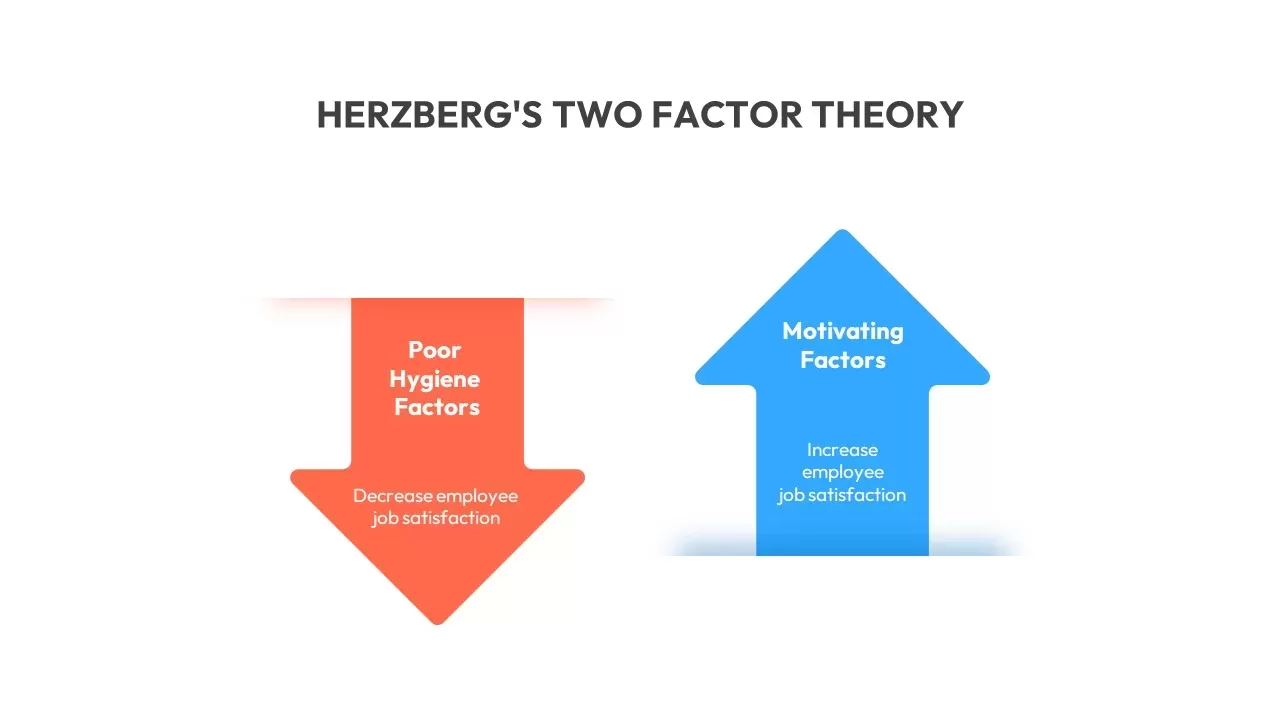
Herzberg’s Two Factor Theory Diagram Template for PowerPoint & Google Slides
Comparison
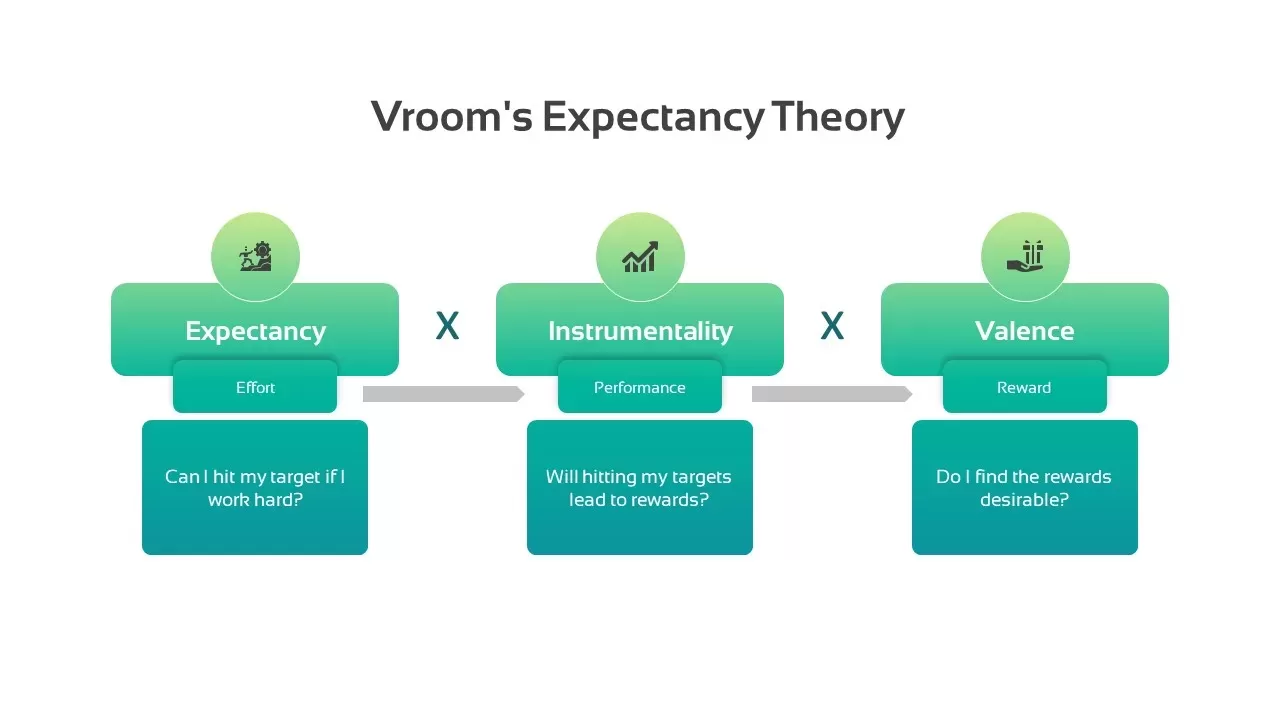
Vroom’s Expectancy Theory Infographic Template for PowerPoint & Google Slides
Process
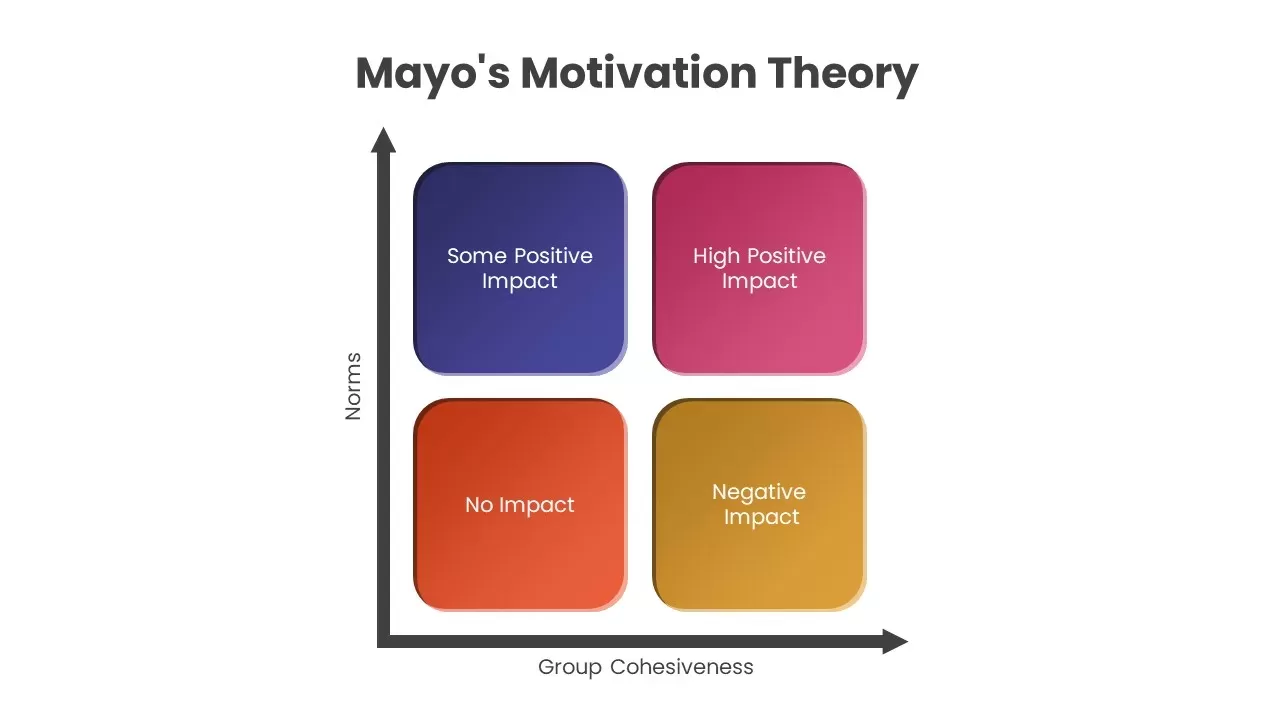
Mayo’s Motivation Theory Diagram Template for PowerPoint & Google Slides
Comparison
Adam’s Equity Theory Scale Comparison Template for PowerPoint & Google Slides
Comparison
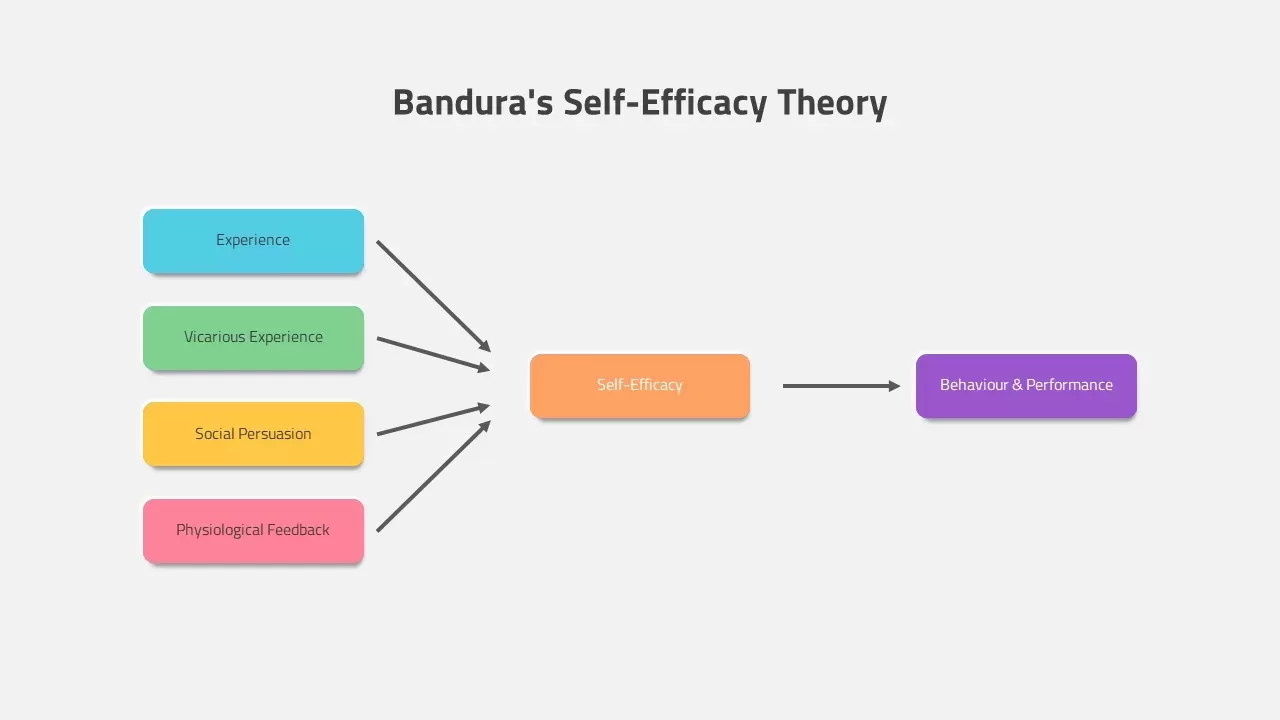
Bandura’s Self-Efficacy Theory Template for PowerPoint & Google Slides
Process
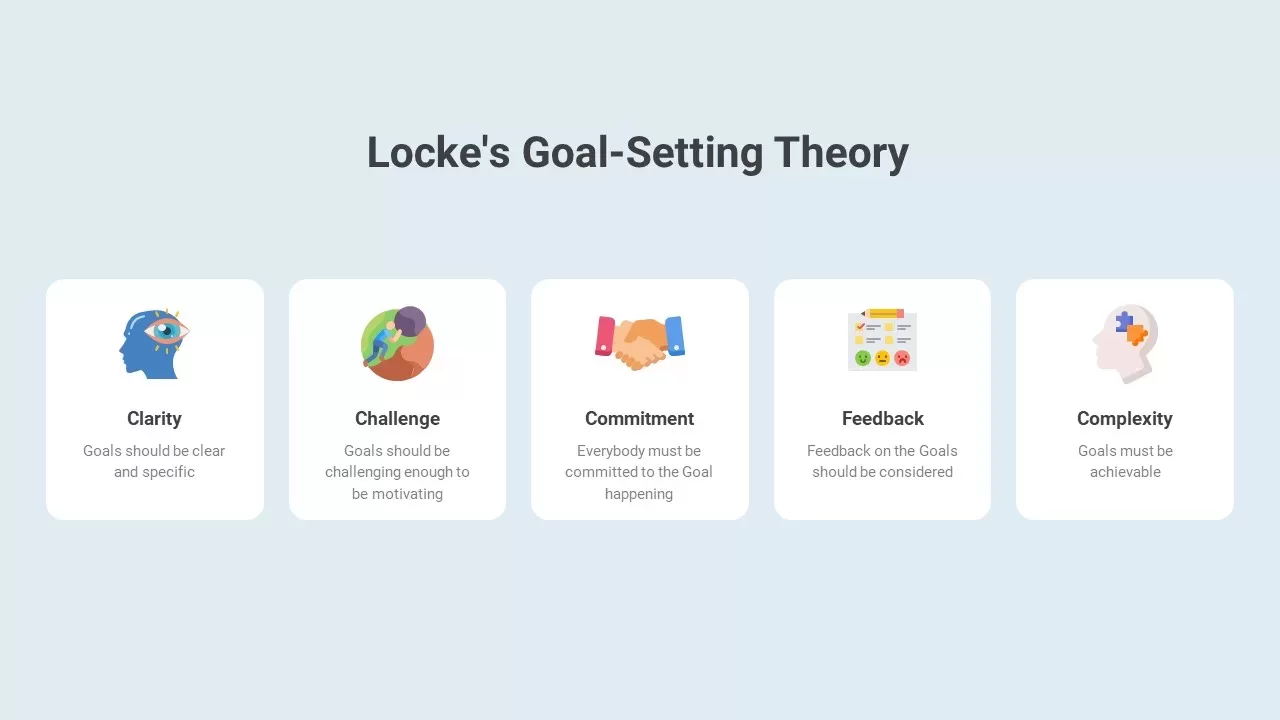
Locke’s Goal-Setting Theory Infographic Template for PowerPoint & Google Slides
Goals
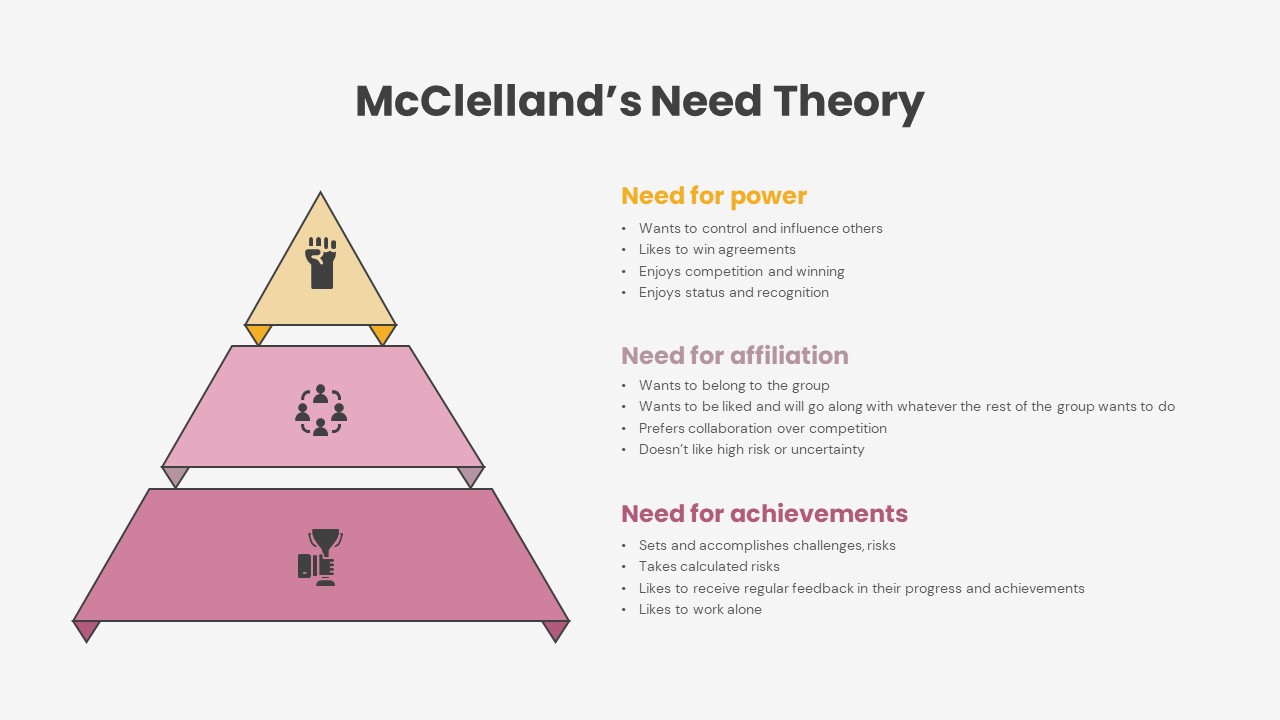
McClelland’s Need Theory Pyramid Template for PowerPoint & Google Slides
Pyramid
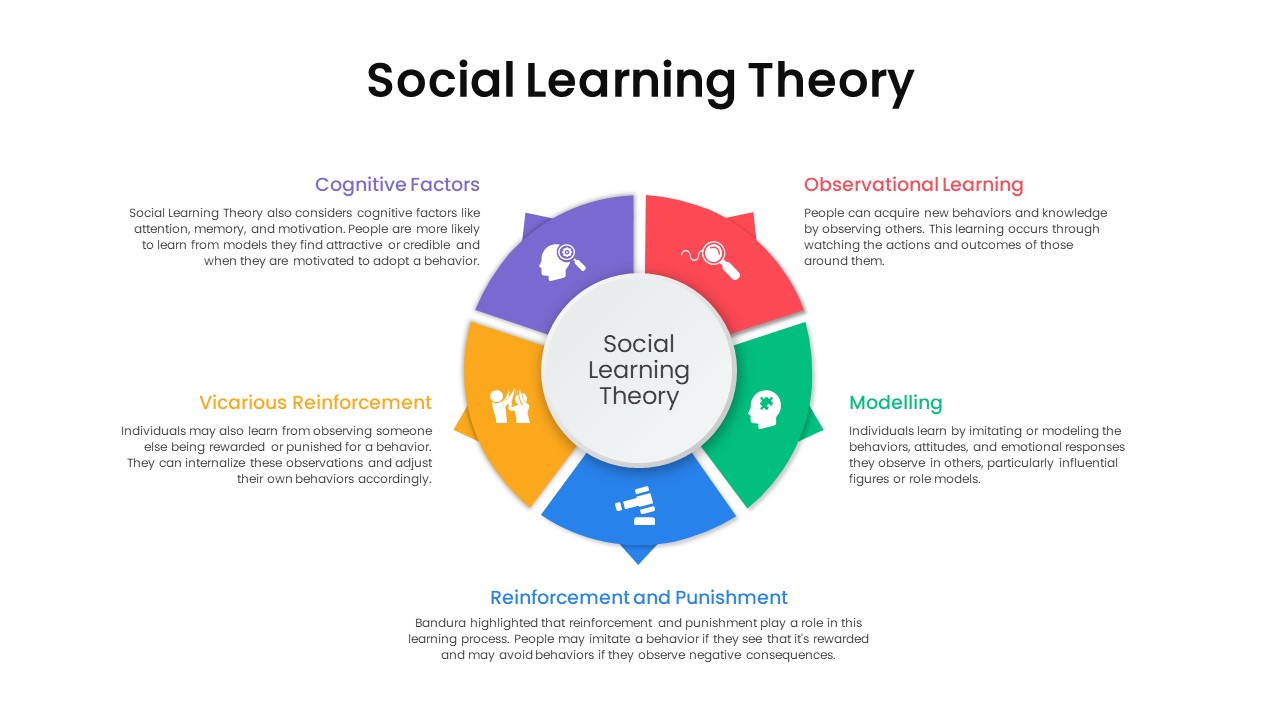
Social Learning Theory Infographic Template for PowerPoint & Google Slides
Circular
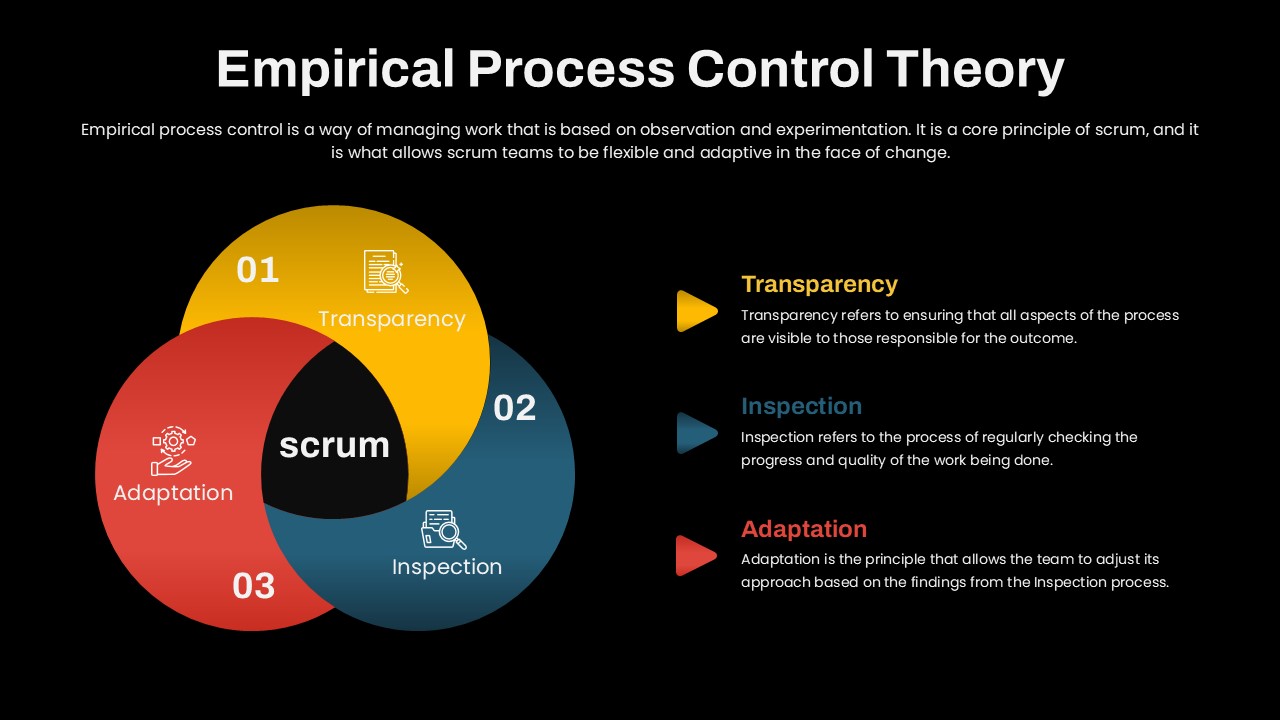
Empirical Process Control Theory Diagram Template for PowerPoint & Google Slides
Circular
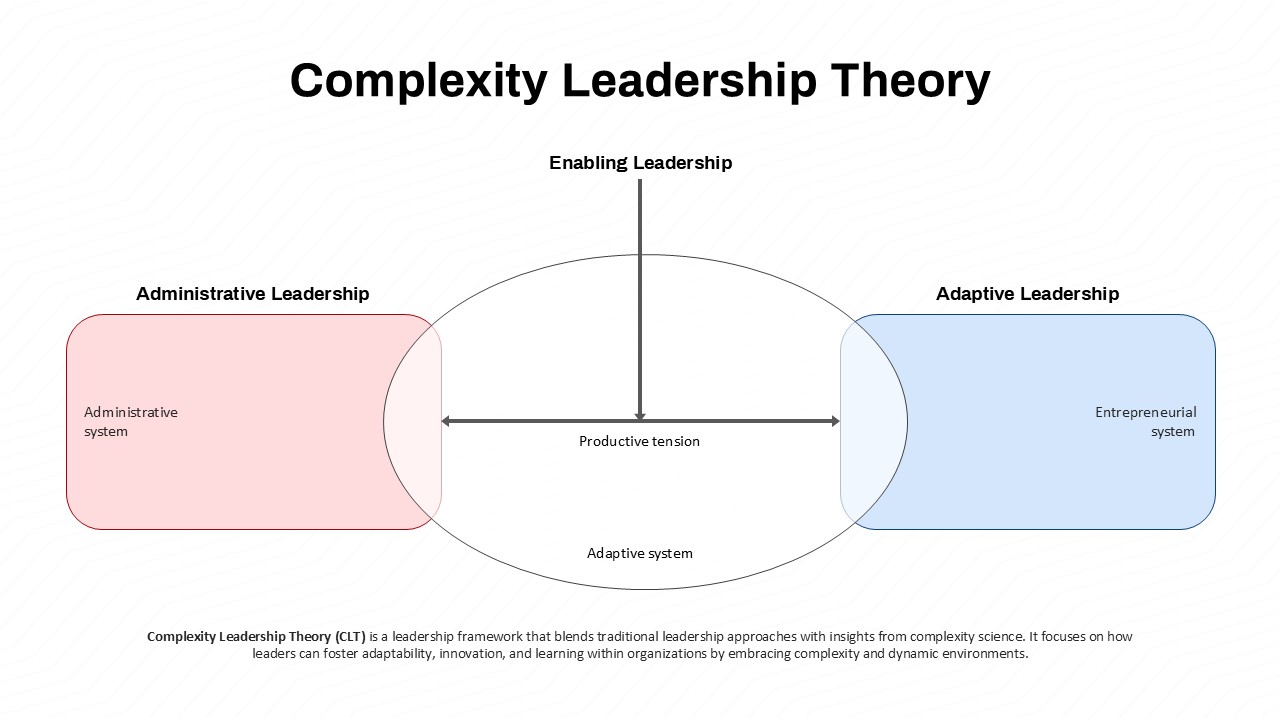
Complexity Leadership Theory Overview Template for PowerPoint & Google Slides
Leadership
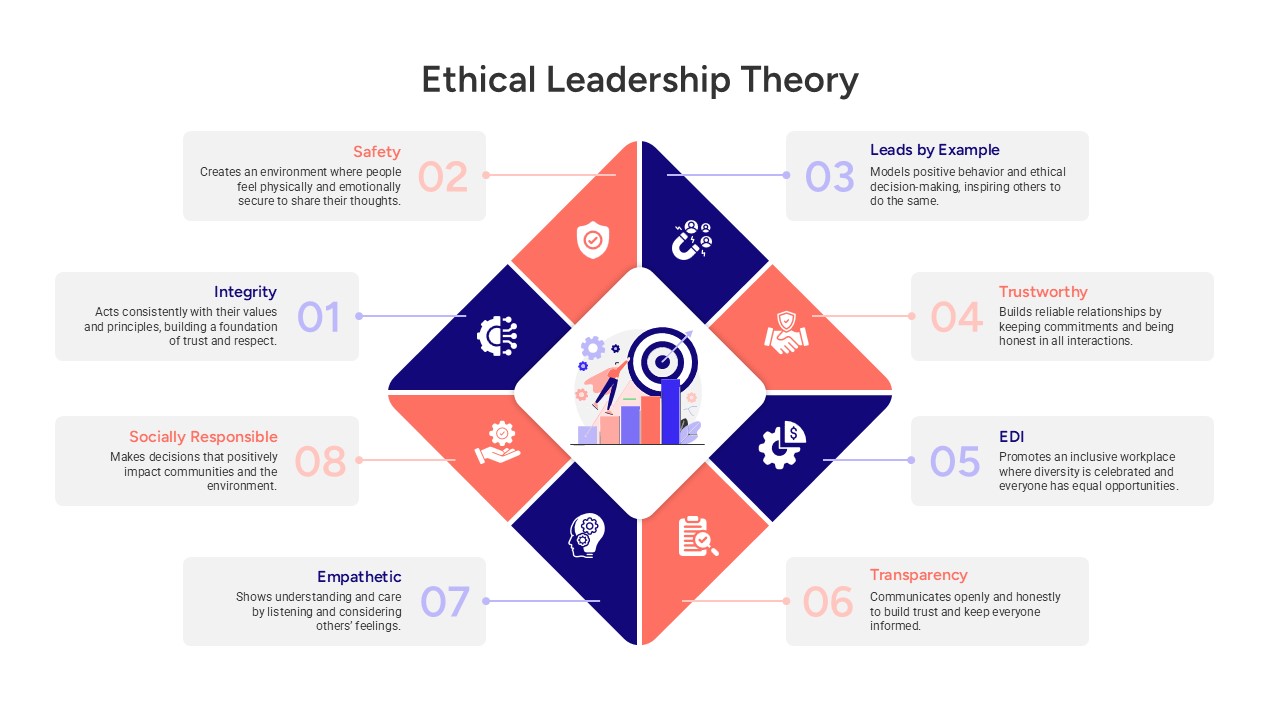
Ethical Leadership Theory Framework Template for PowerPoint & Google Slides
Leadership
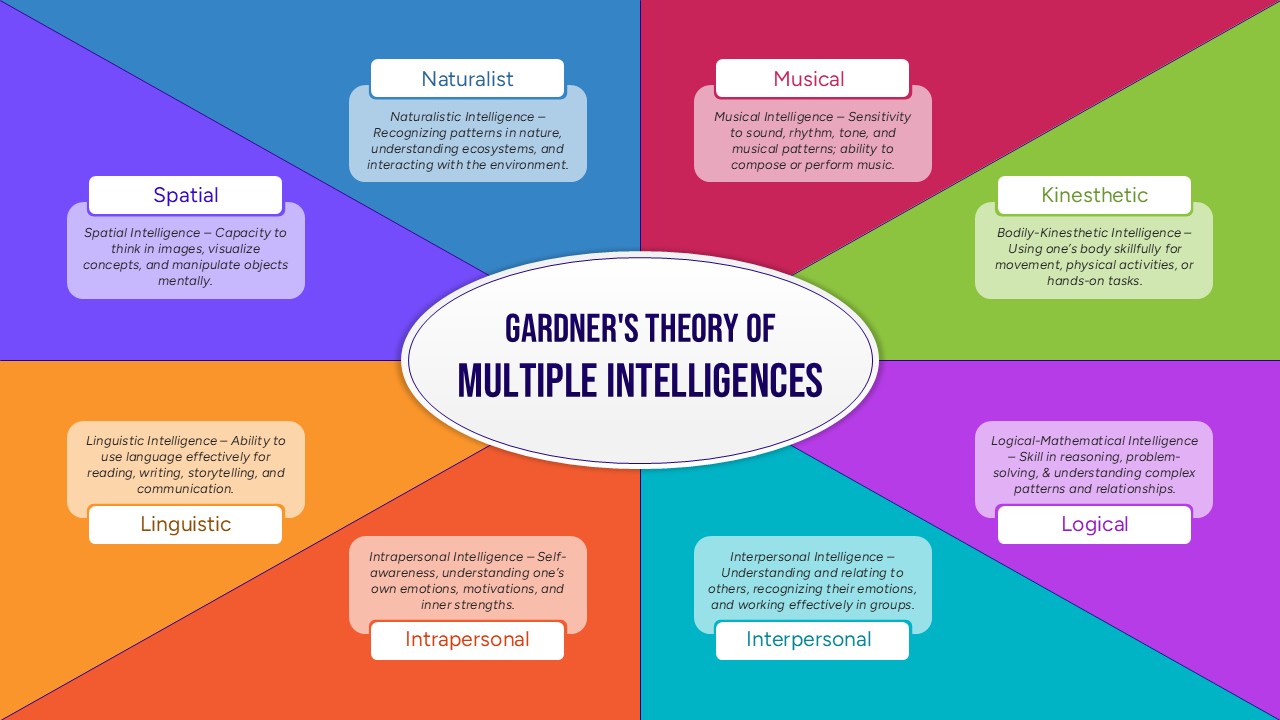
Gardner’s Theory of Multiple Intelligences Diagram Template for PowerPoint & Google Slides
Leadership
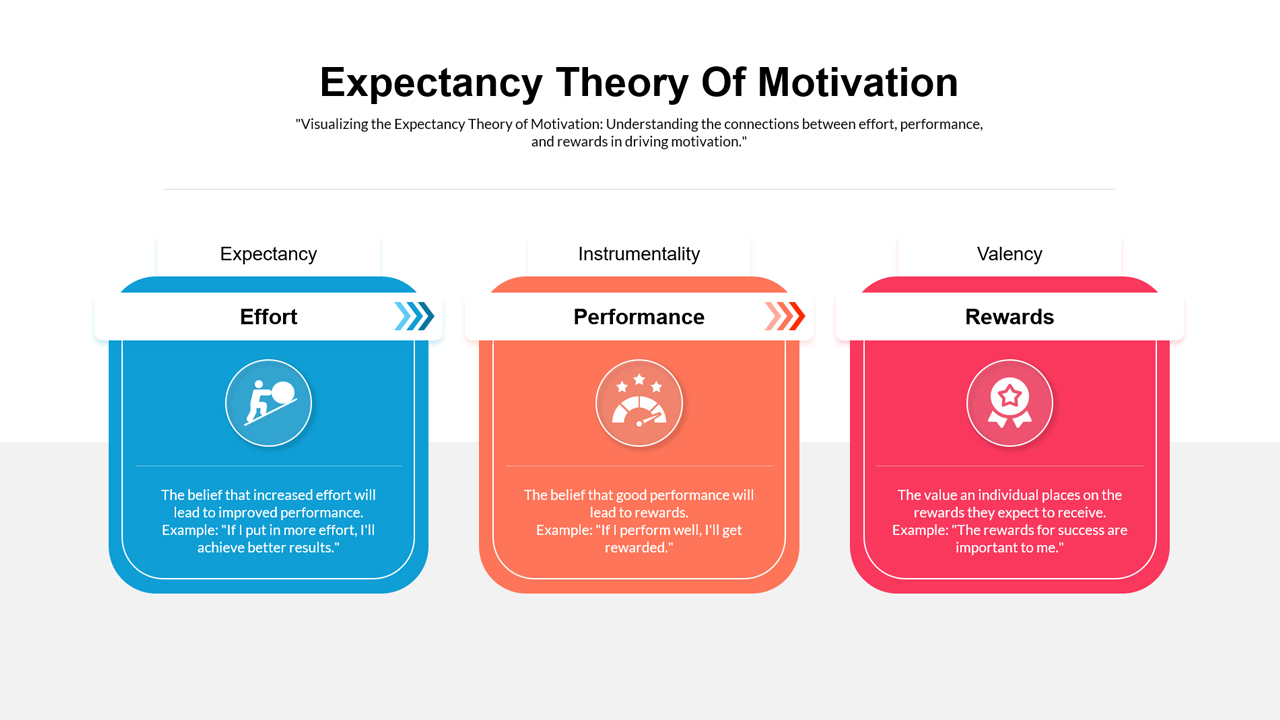
Expectancy Theory Of Motivation Template for PowerPoint & Google Slides
Process
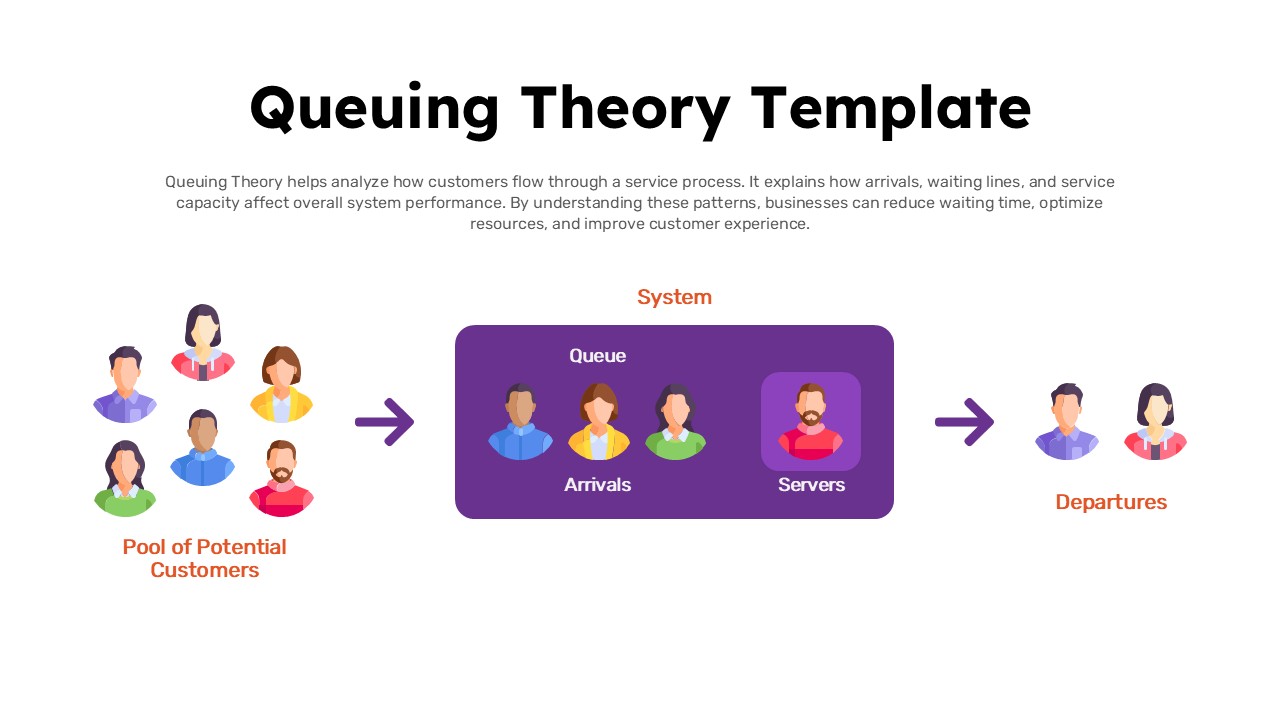
Queuing Theory System Flow Diagram Template for PowerPoint & Google Slides
Process
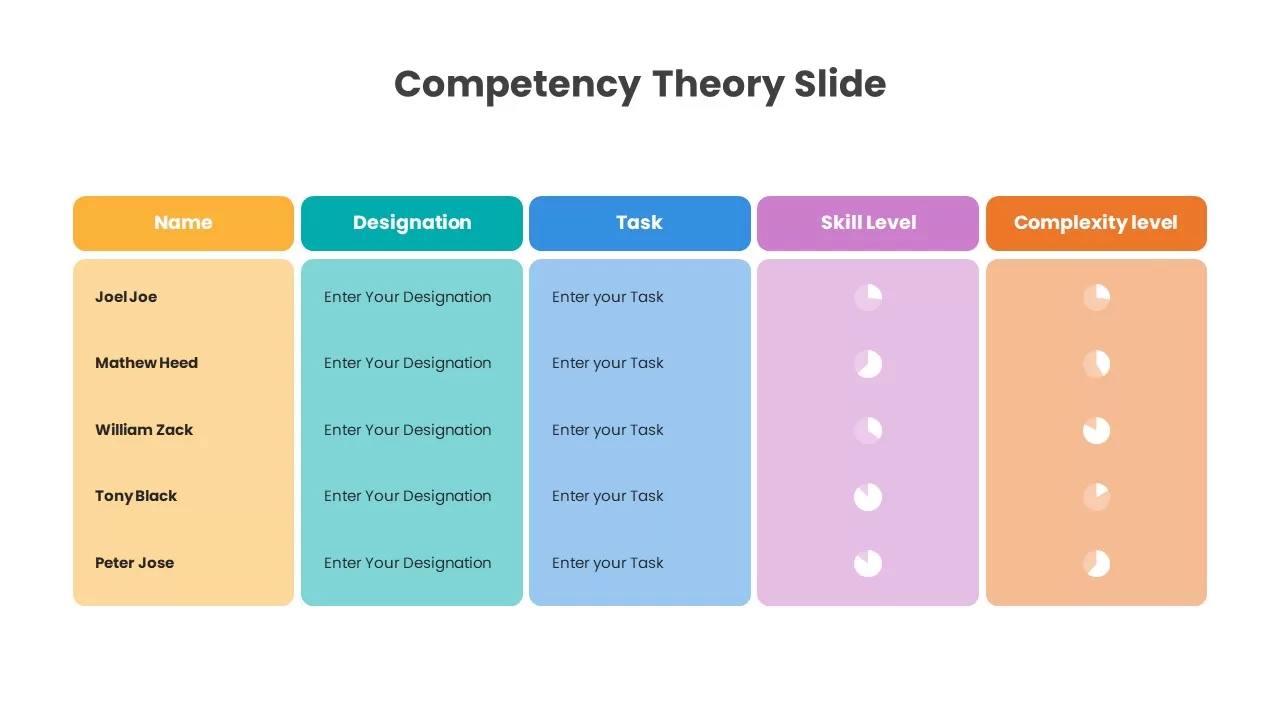
Competency Theory Slide for PowerPoint & Google Slides
Employee Performance
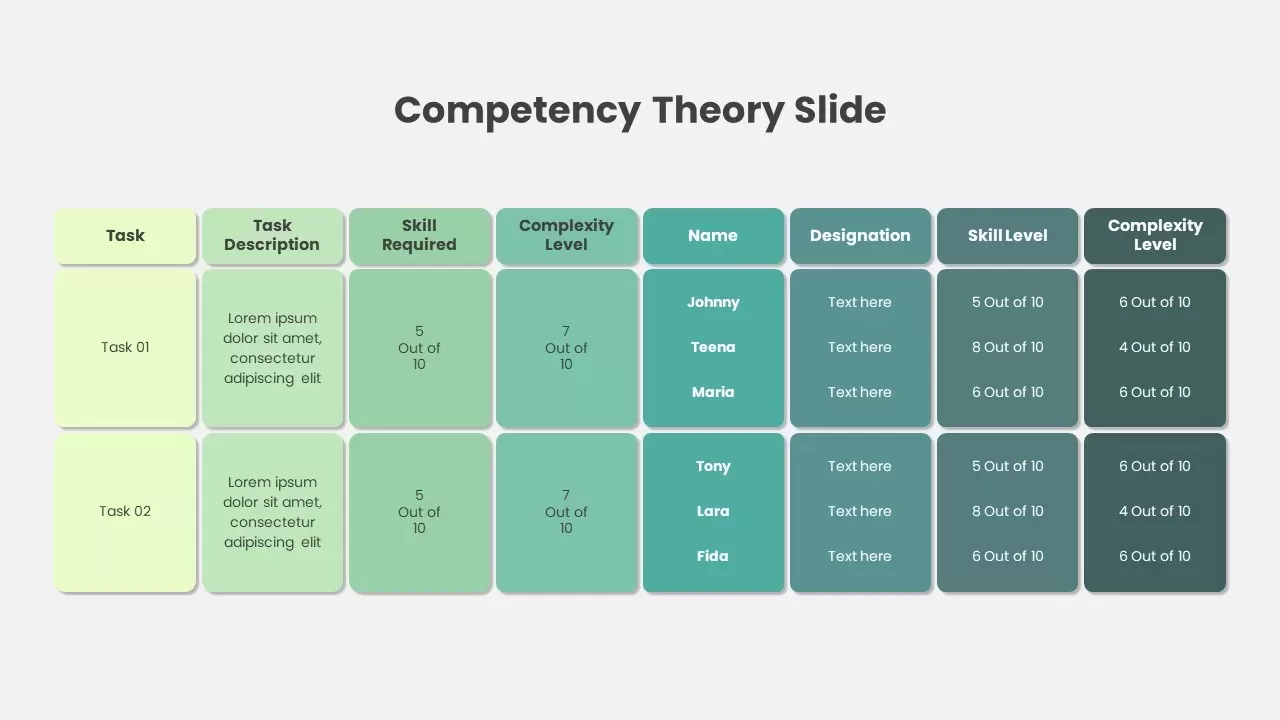
Competency Theory Slide for PowerPoint & Google Slides
Employee Performance
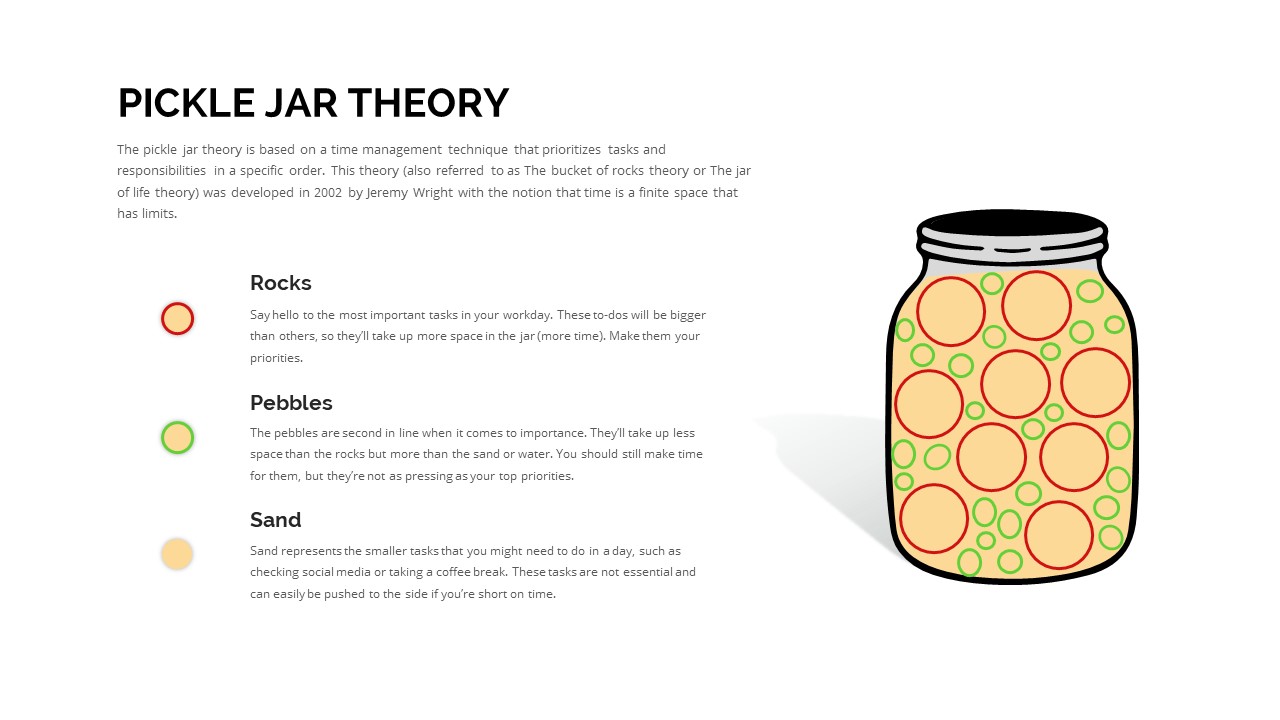
Pickle Jar Theory for PowerPoint & Google Slides
Business Strategy
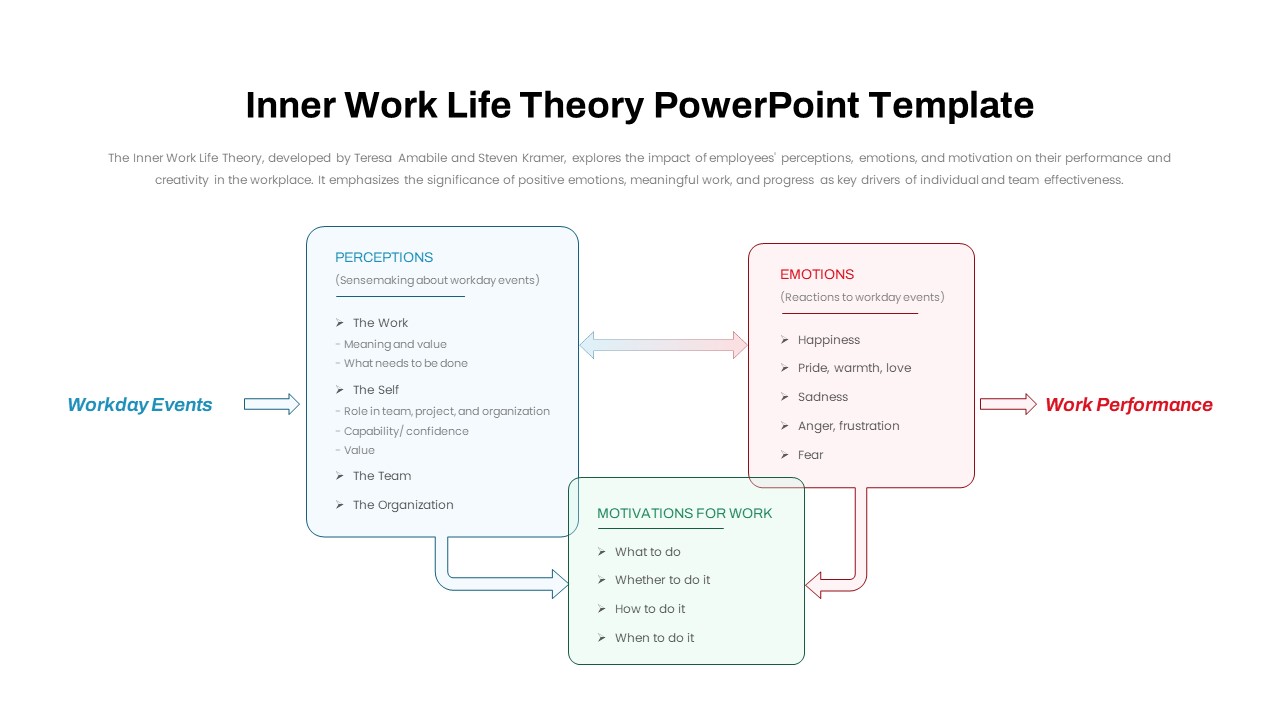
Inner Work Life Theory Diagram Slide for PowerPoint & Google Slides
Employee Performance
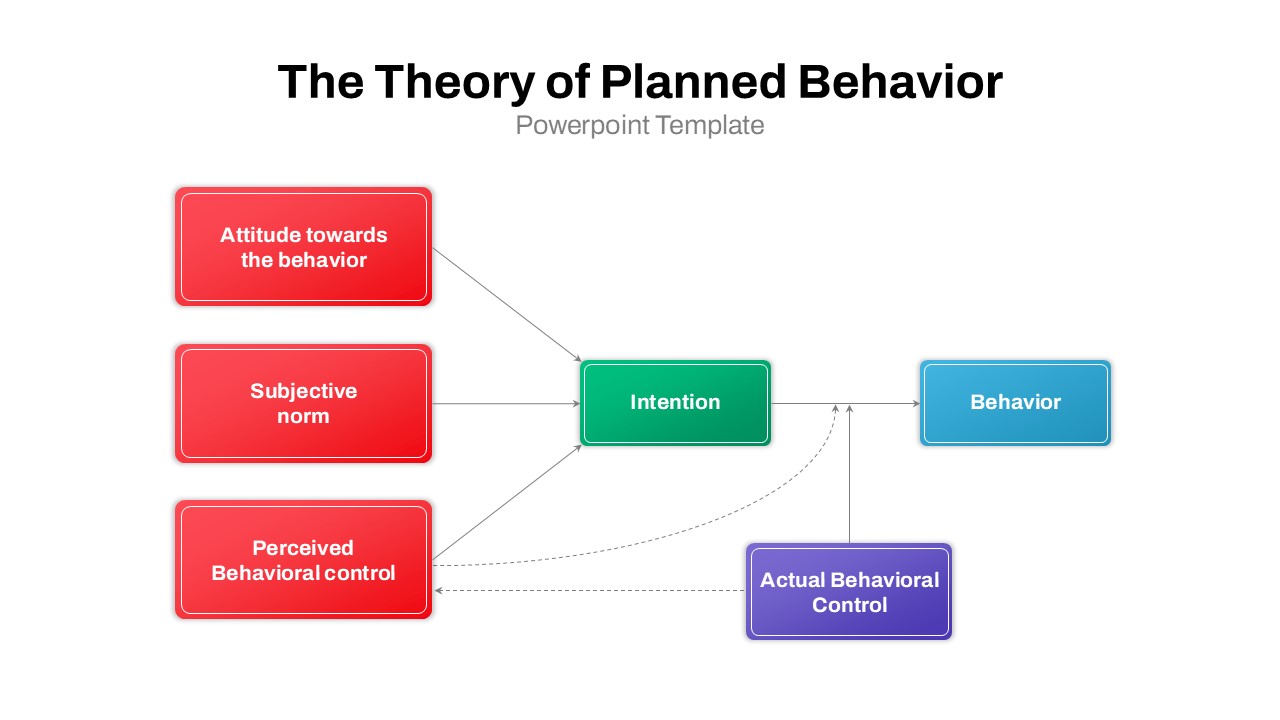
The Theory of Planned Behavior for PowerPoint & Google Slides
Flow Charts
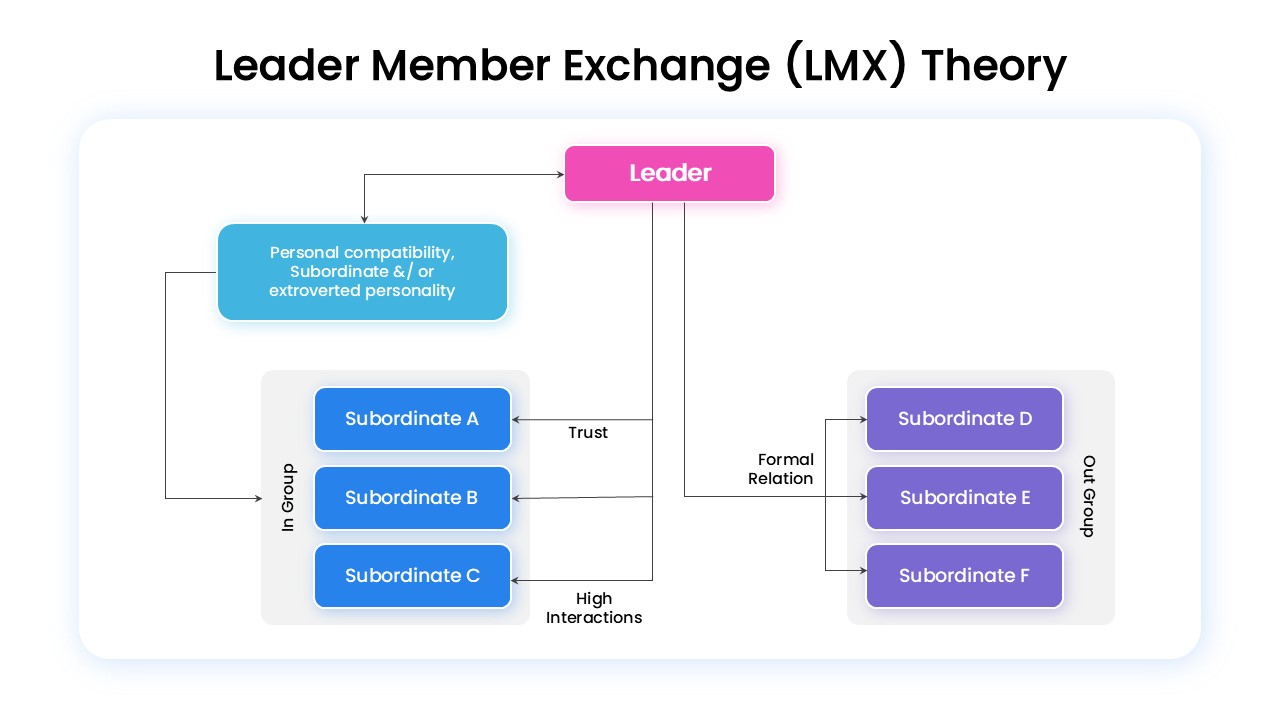
Leader-Member Exchange (LMX) Theory for PowerPoint & Google Slides
Business Strategy

Innovation Ambition Matrix & Funnel Strategy Slides for PowerPoint & Google Slides
Process
Market Development Matrix Chart Template for PowerPoint & Google Slides
Comparison Chart
Ansoff Matrix Growth Strategy Model Template for PowerPoint & Google Slides
BCG

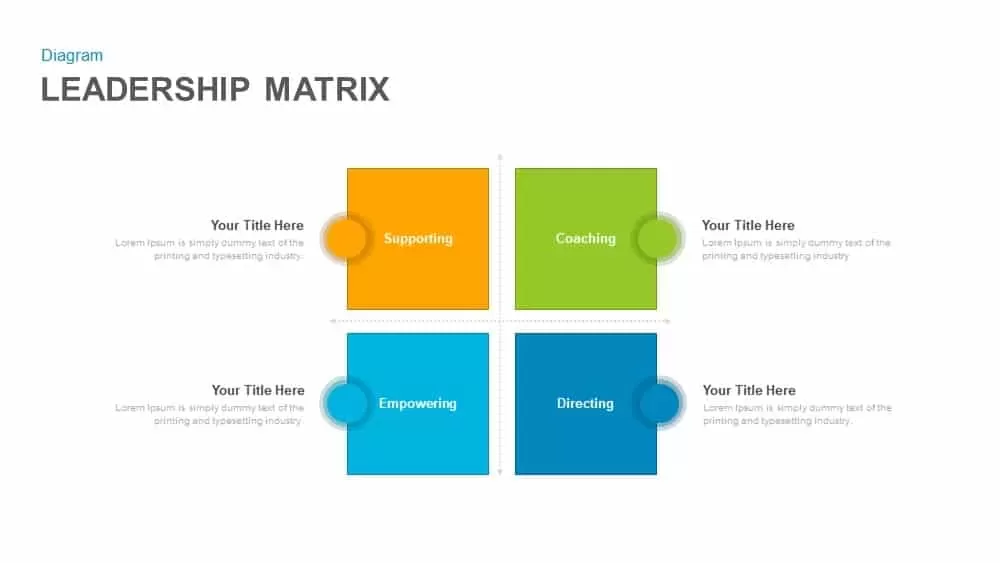
Leadership Matrix with Four Quadrants Template for PowerPoint & Google Slides
Comparison
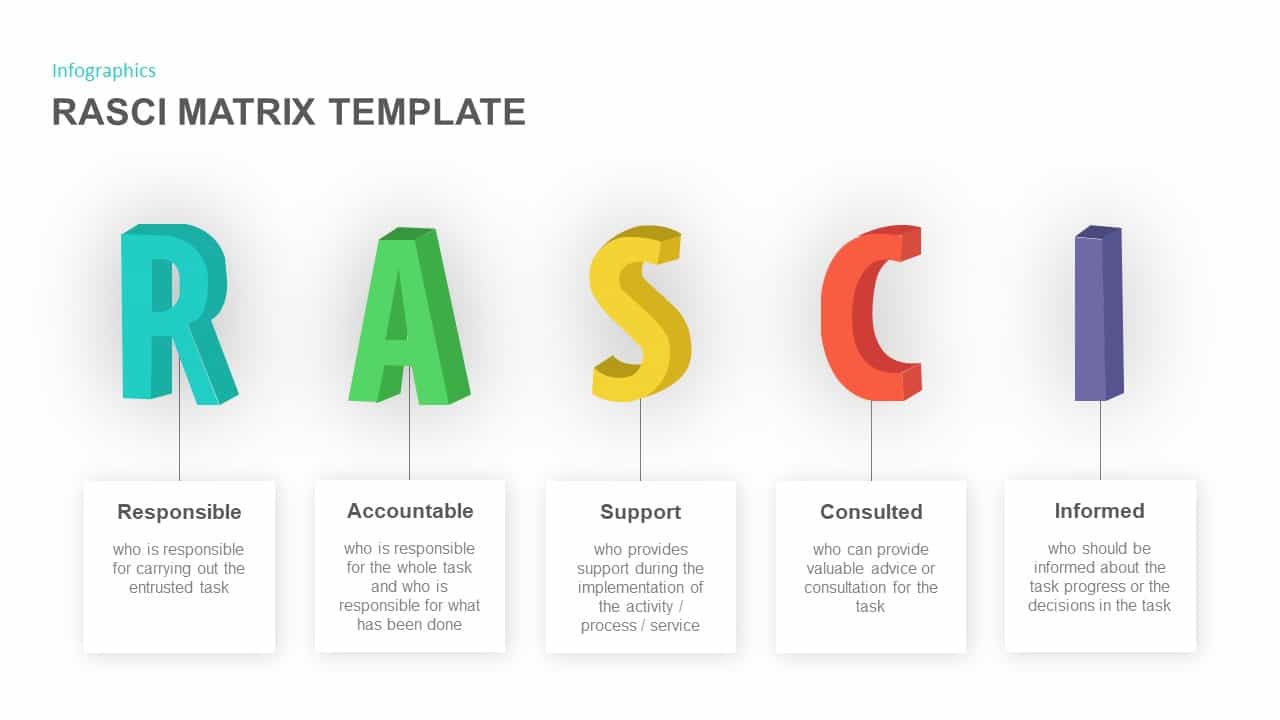
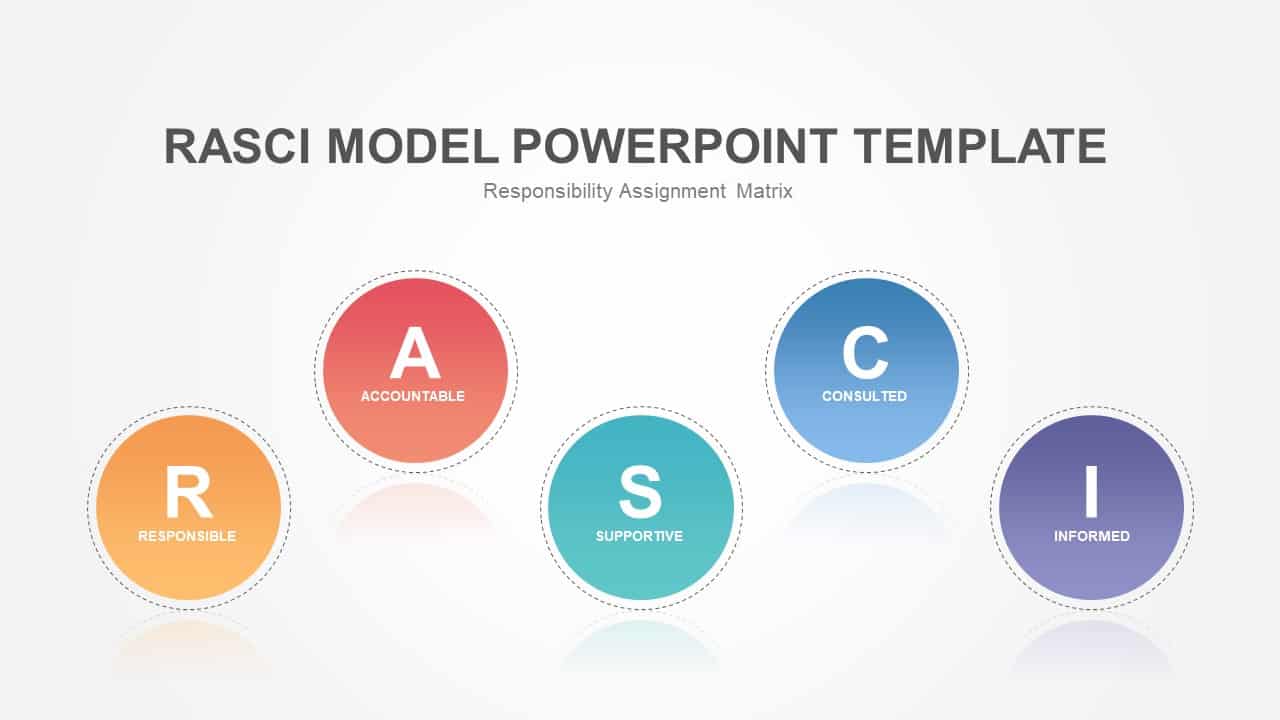
RASCI Assignment Matrix Infographic Template for PowerPoint & Google Slides
Infographics
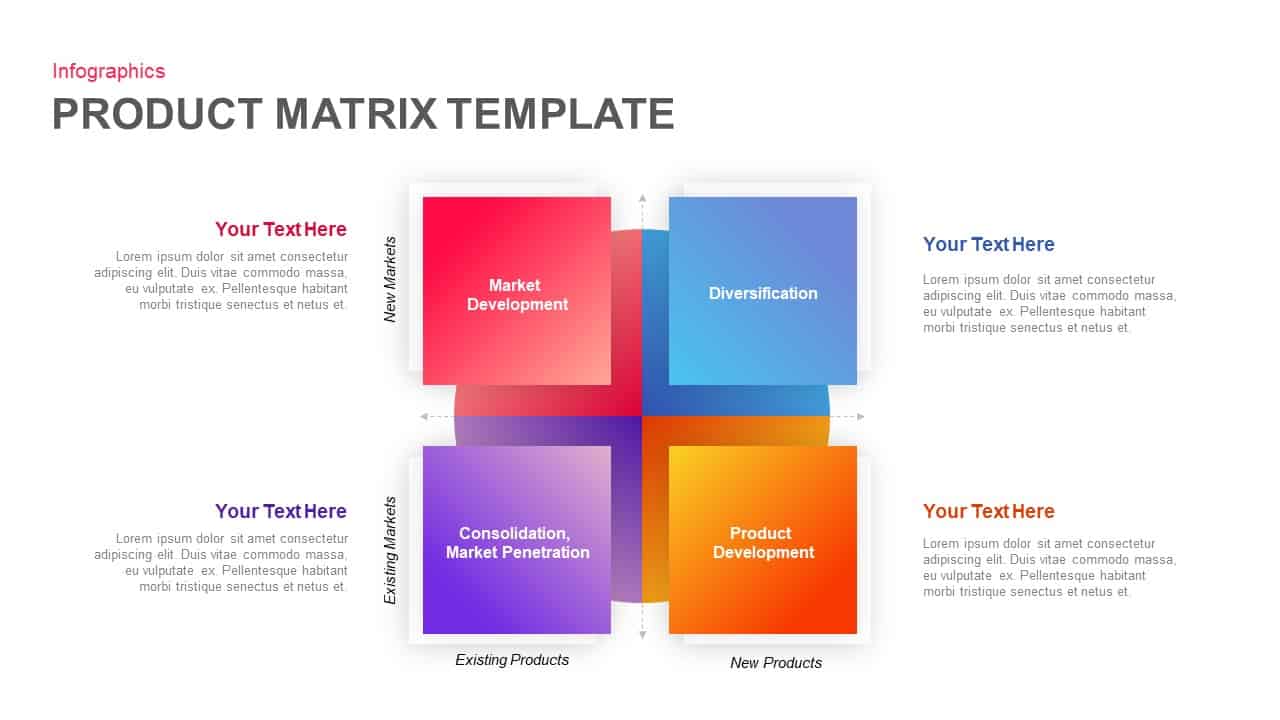
Product Market Expansion Matrix Template for PowerPoint & Google Slides
Business

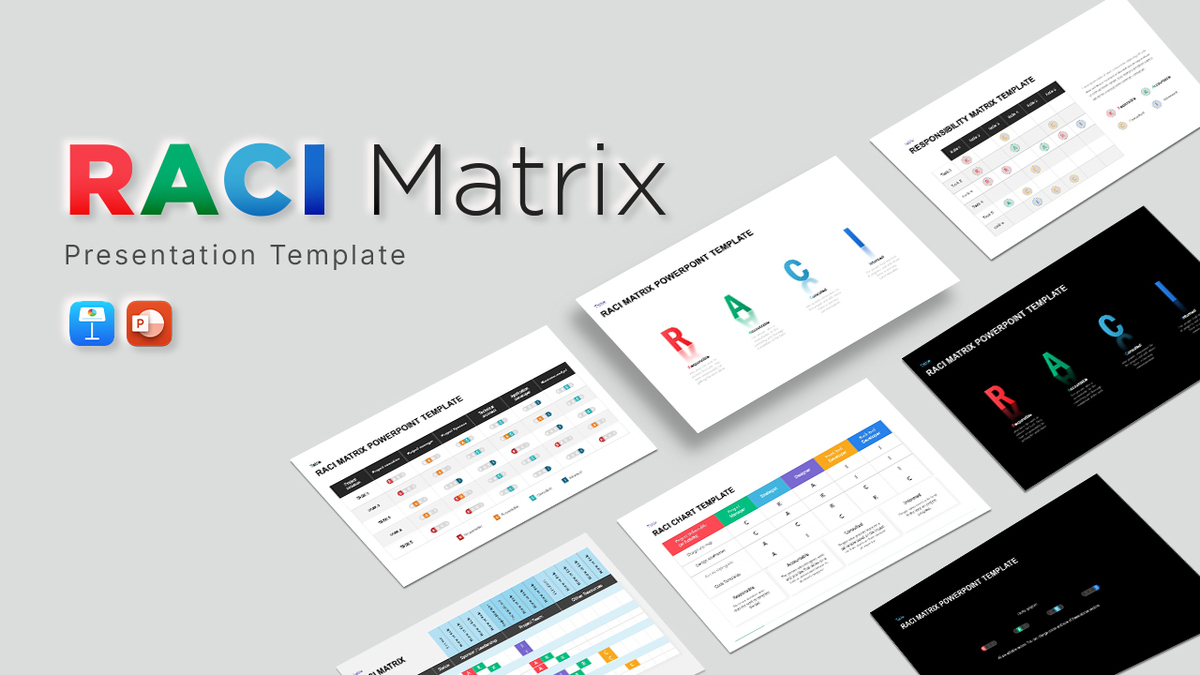
Interactive RACI Responsibility Matrix Template for PowerPoint & Google Slides
Project
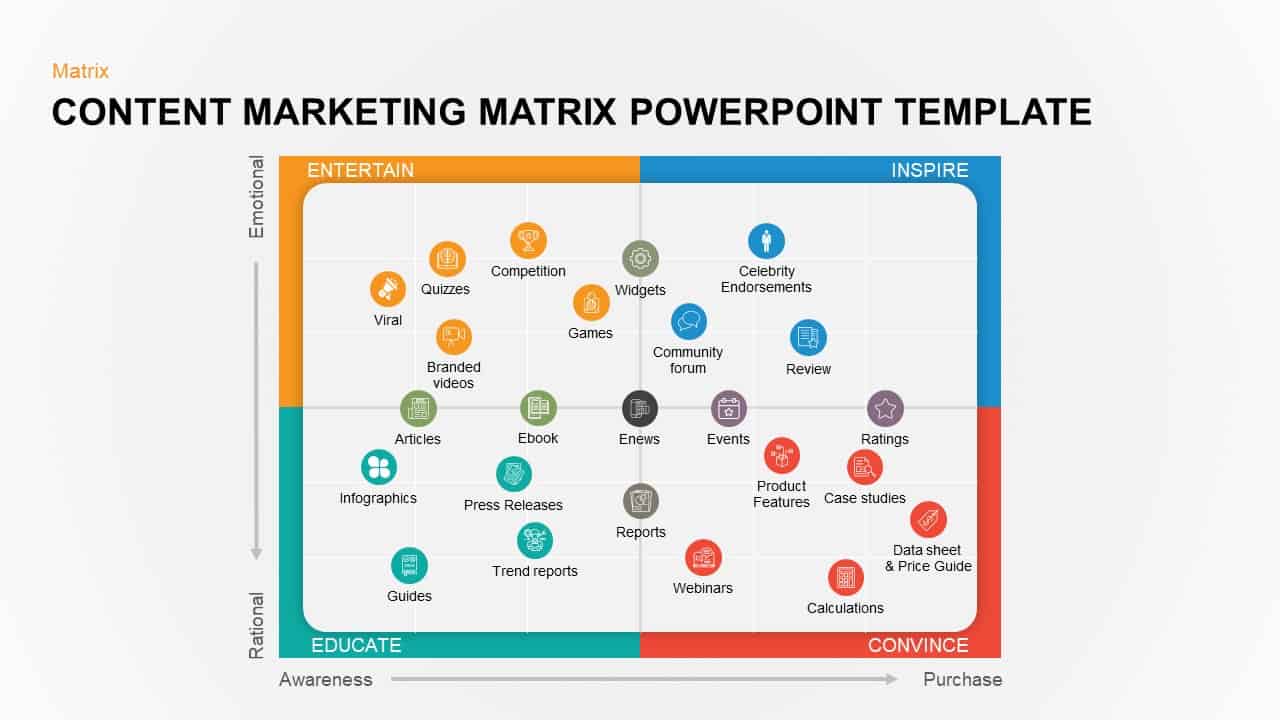
Colorful Content Marketing Matrix Template for PowerPoint & Google Slides
Comparison
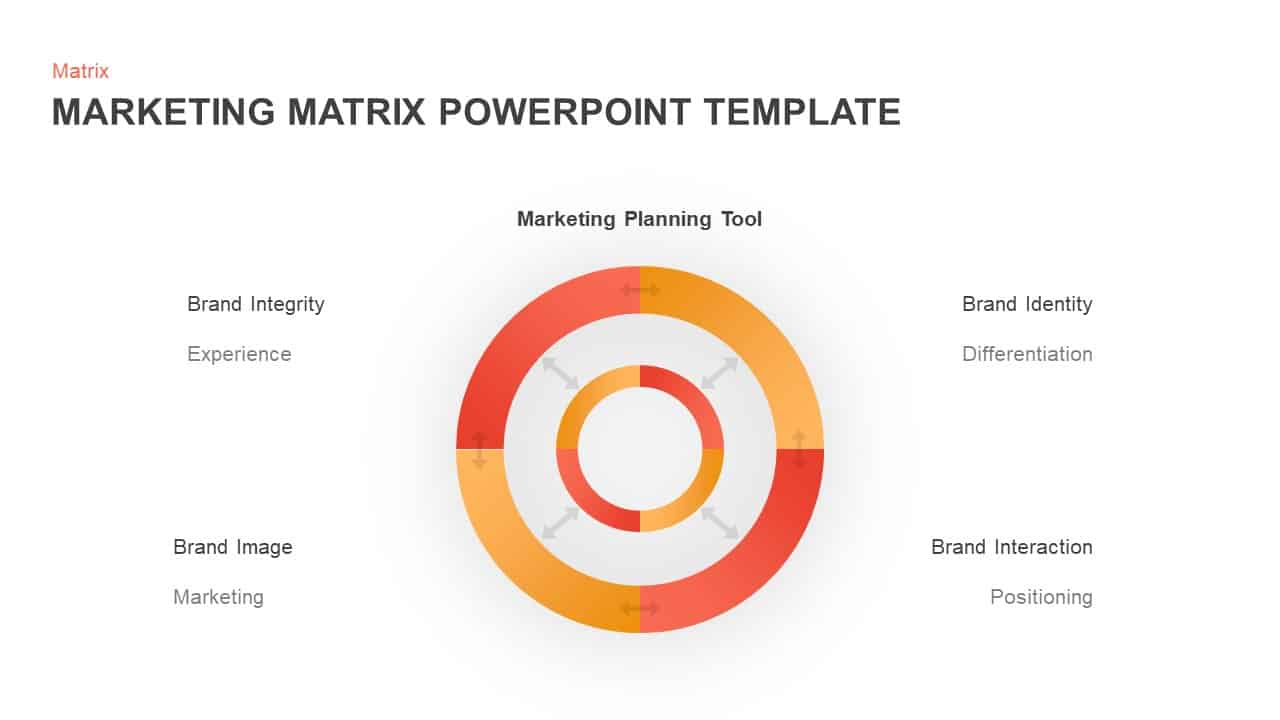
Concentric Marketing Matrix Slide Template for PowerPoint & Google Slides
Circular
Three-Year Strategic Plan Matrix Template for PowerPoint & Google Slides
Timeline
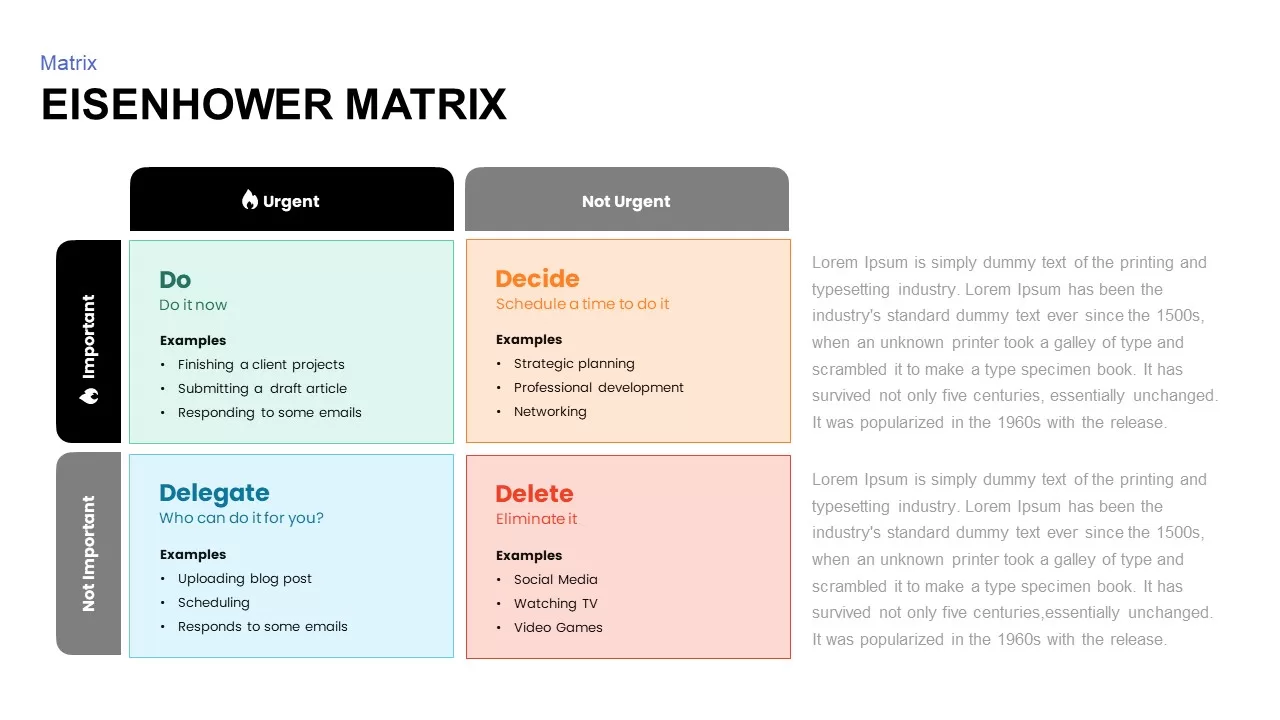
Eisenhower Matrix Task Prioritization Template for PowerPoint & Google Slides
Comparison Chart
RASCI Responsibility Assignment Matrix Template for PowerPoint & Google Slides
Project
Strategic ADL Matrix by Industry Life Cycle & Position Template for PowerPoint & Google Slides
Business Strategy
Supply Positioning Model Matrix Template for PowerPoint & Google Slides
Comparison Chart
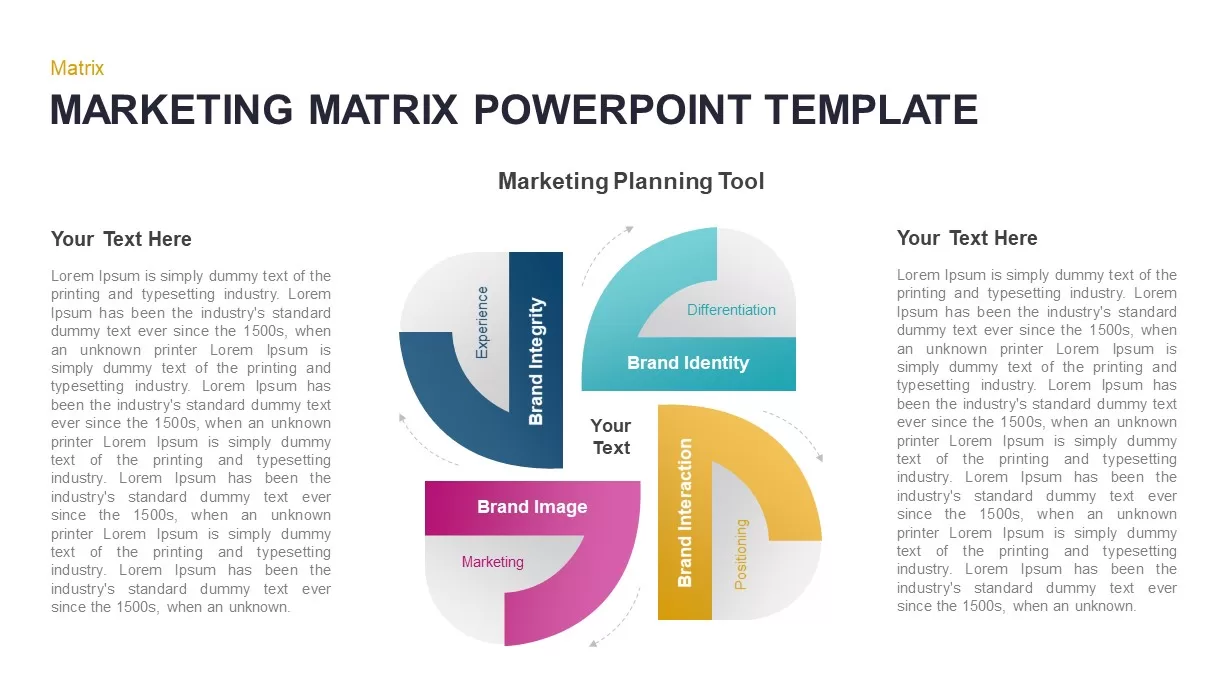
Marketing Matrix Brand Quadrant Diagram Template for PowerPoint & Google Slides
Process
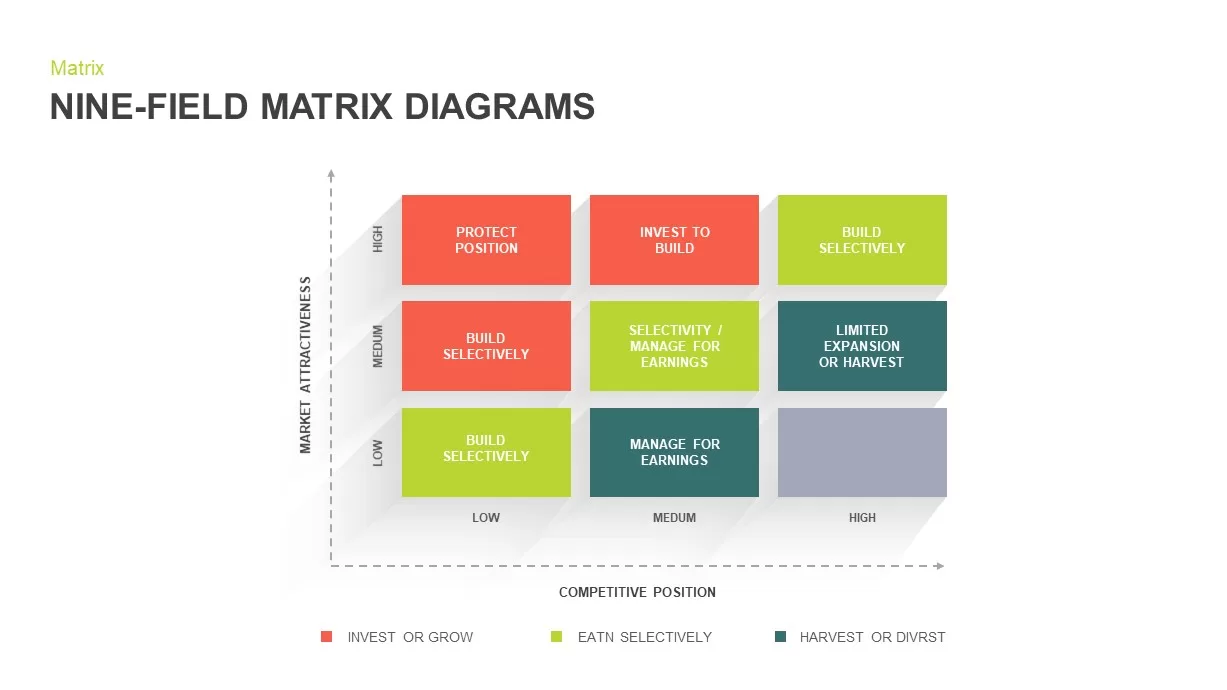
Nine-Field Matrix Diagrams Collection Template for PowerPoint & Google Slides
Comparison Chart
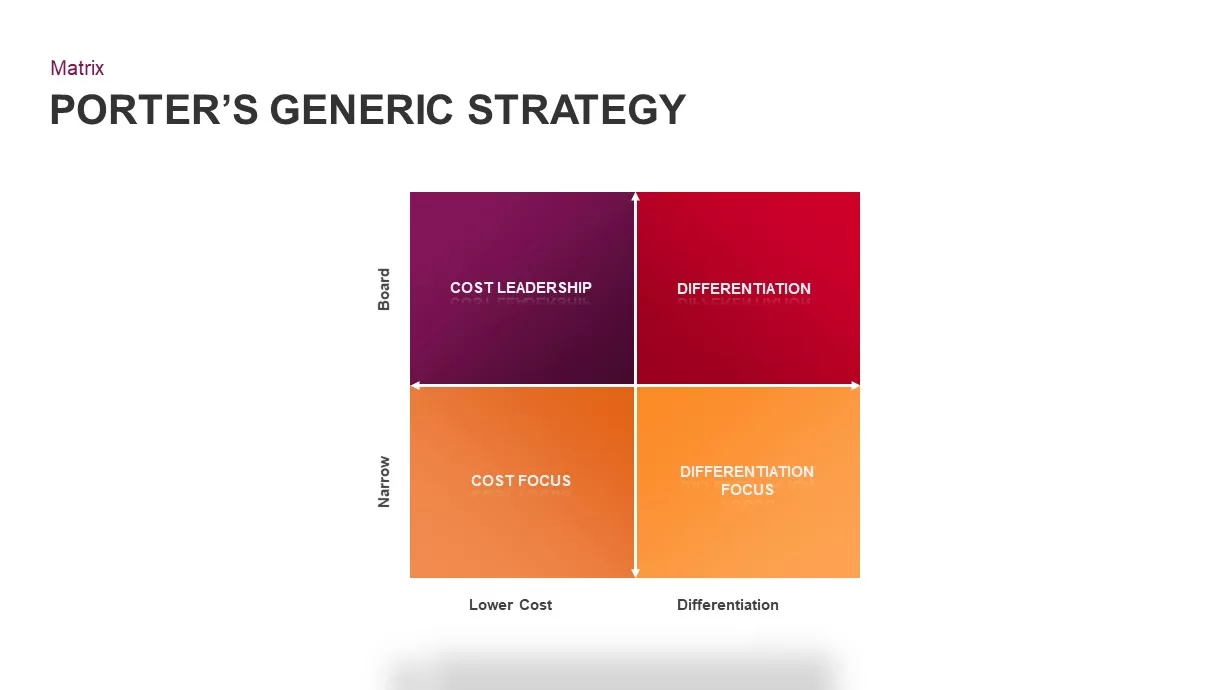
Porter’s Generic Strategy Matrix Diagram Template for PowerPoint & Google Slides
Competitor Analysis
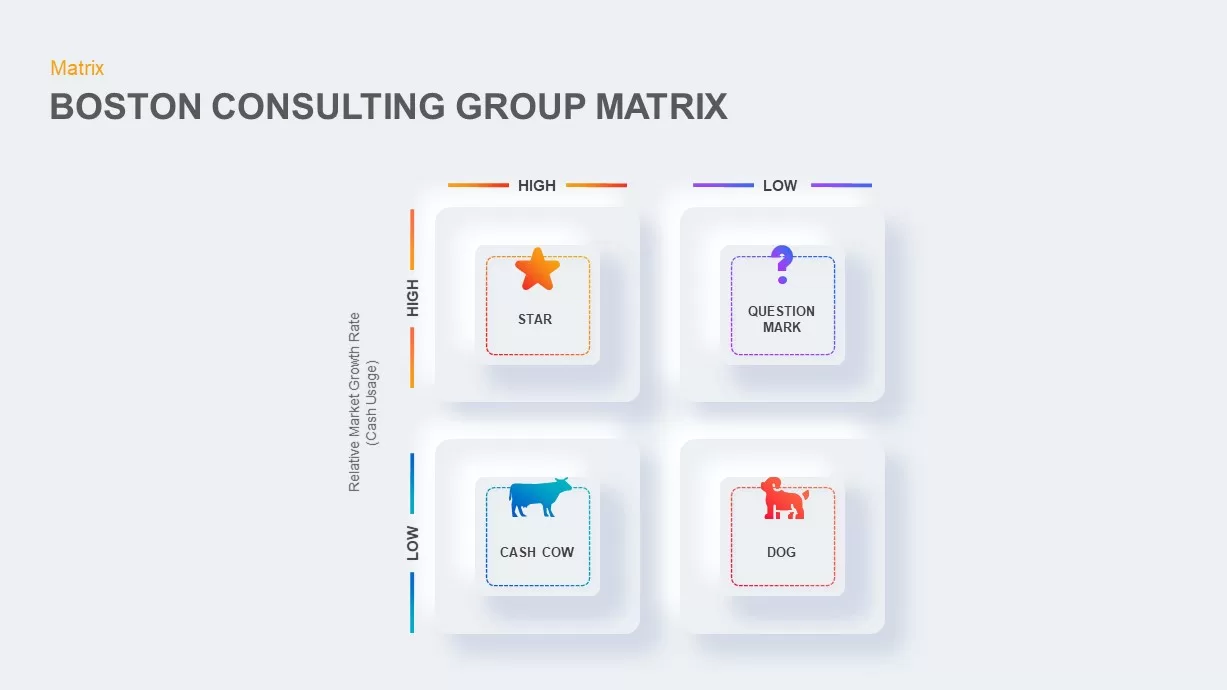
Boston Consulting Group Matrix Diagram Template for PowerPoint & Google Slides
BCG
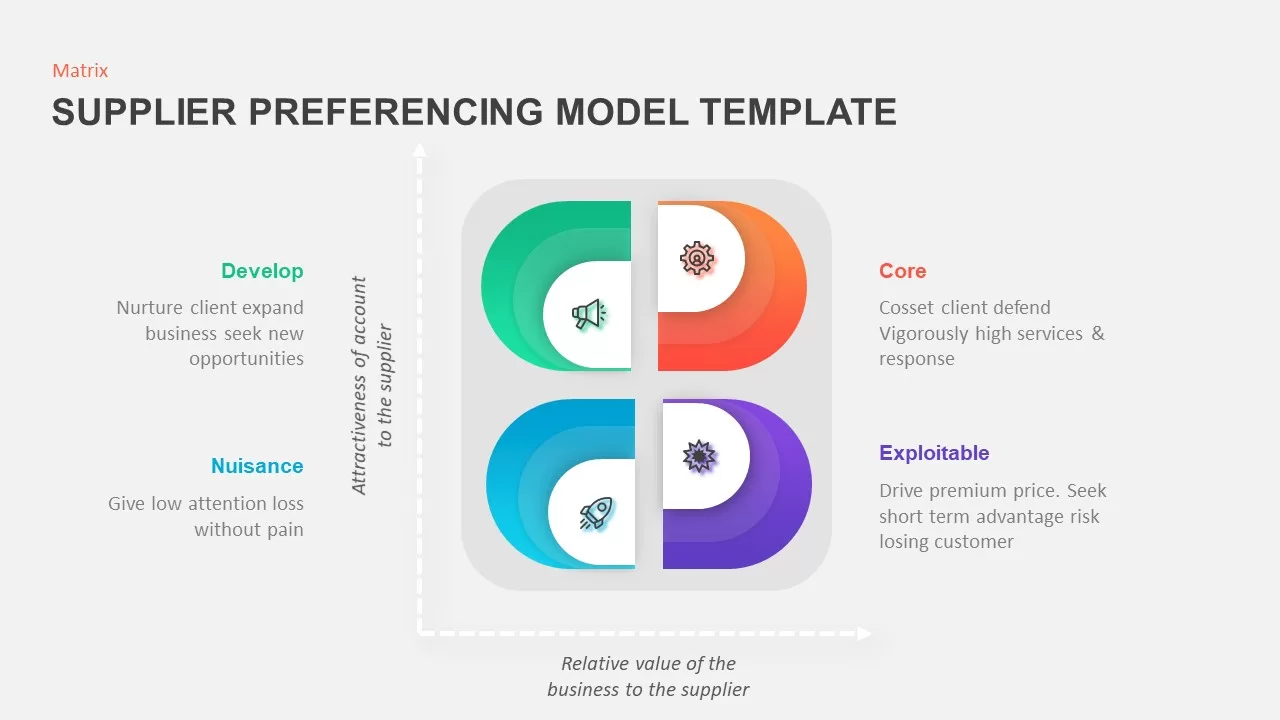
Supplier Preferencing Model Matrix Template for PowerPoint & Google Slides
Business Strategy
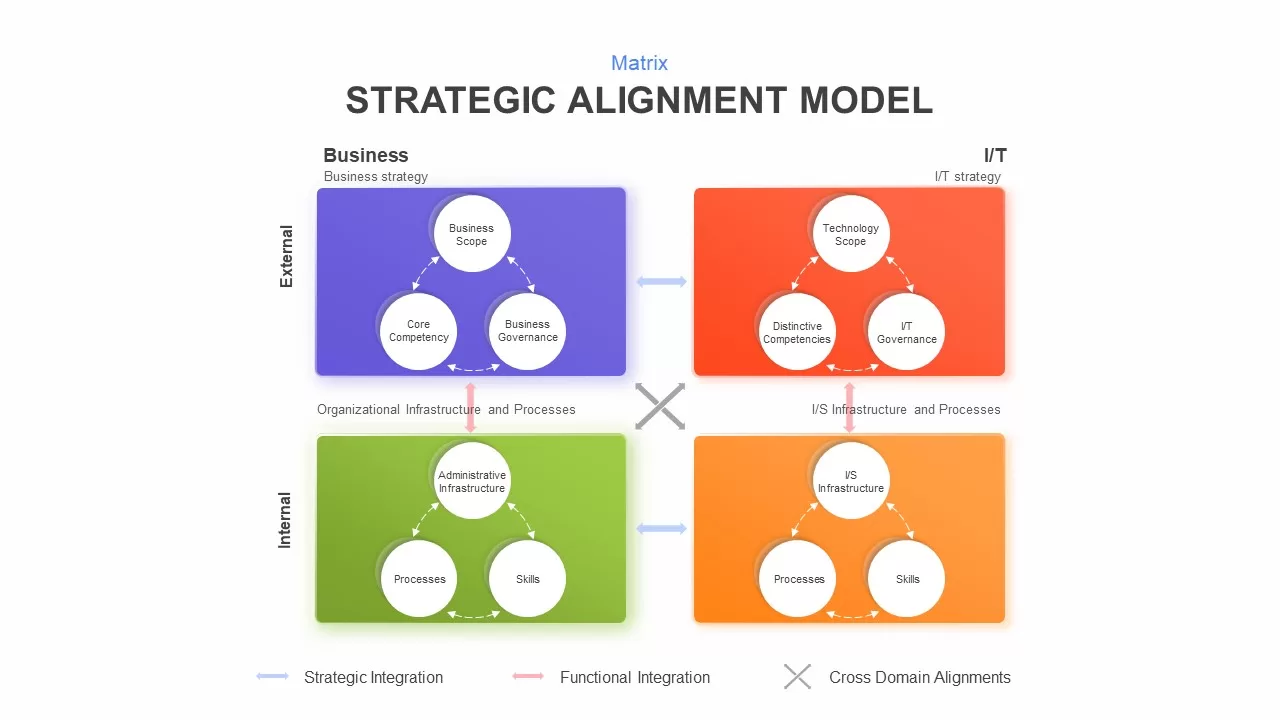
Strategic Alignment Matrix Model Template for PowerPoint & Google Slides
Project
Editable Four-Quadrant TOWS Matrix Template for PowerPoint & Google Slides
Opportunities Challenges
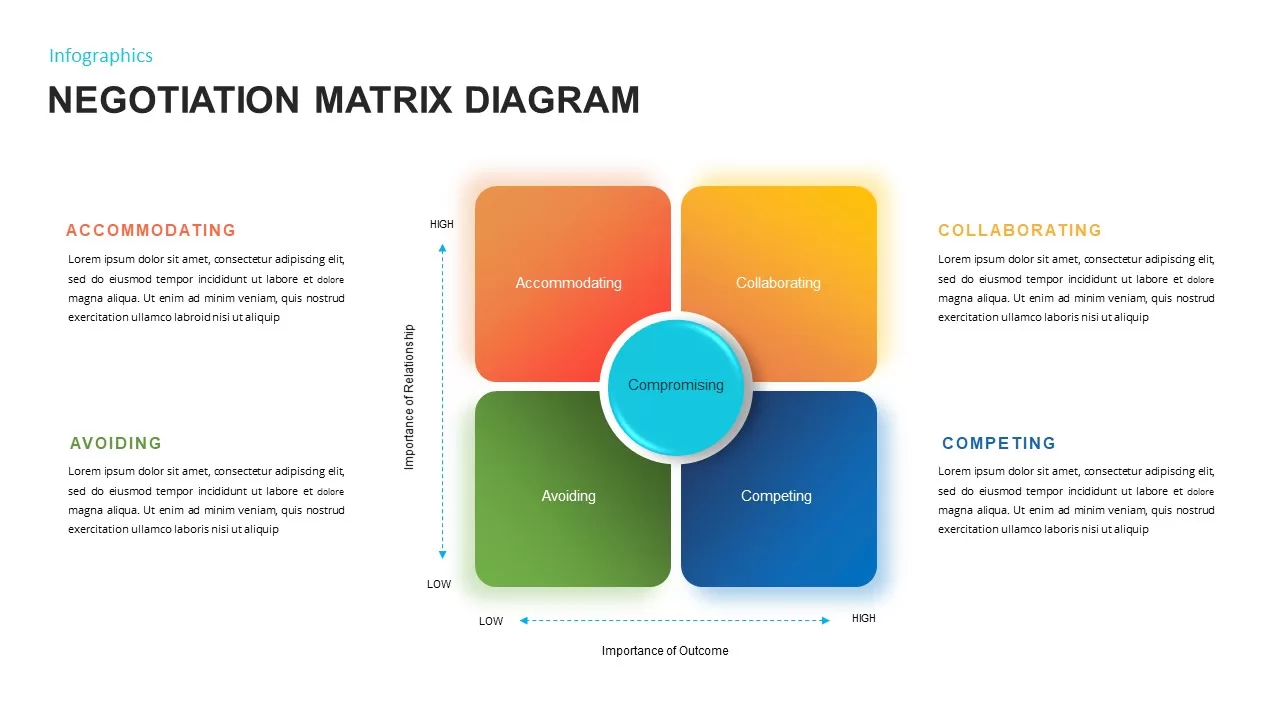
Negotiation Matrix Diagram Template for PowerPoint & Google Slides
Business
Eisenhower Matrix Decision-Making template for PowerPoint & Google Slides
Infographics
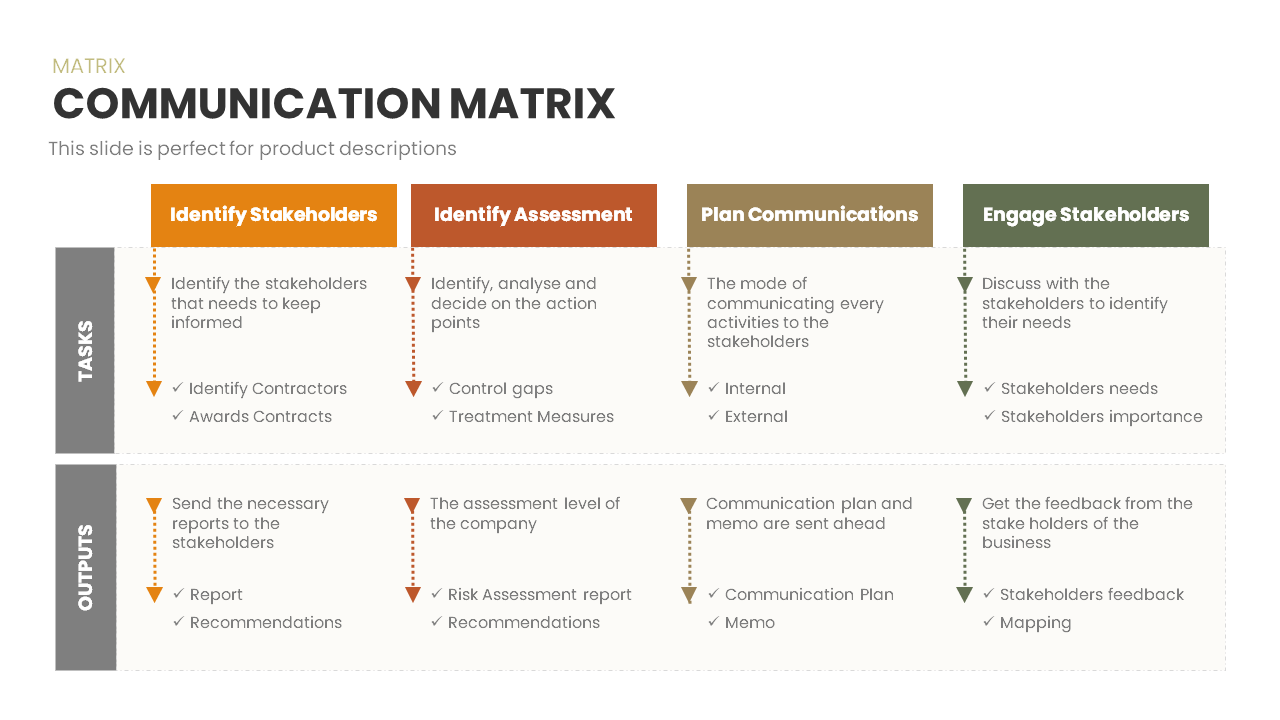
Communication Matrix Overview Template for PowerPoint & Google Slides
Business
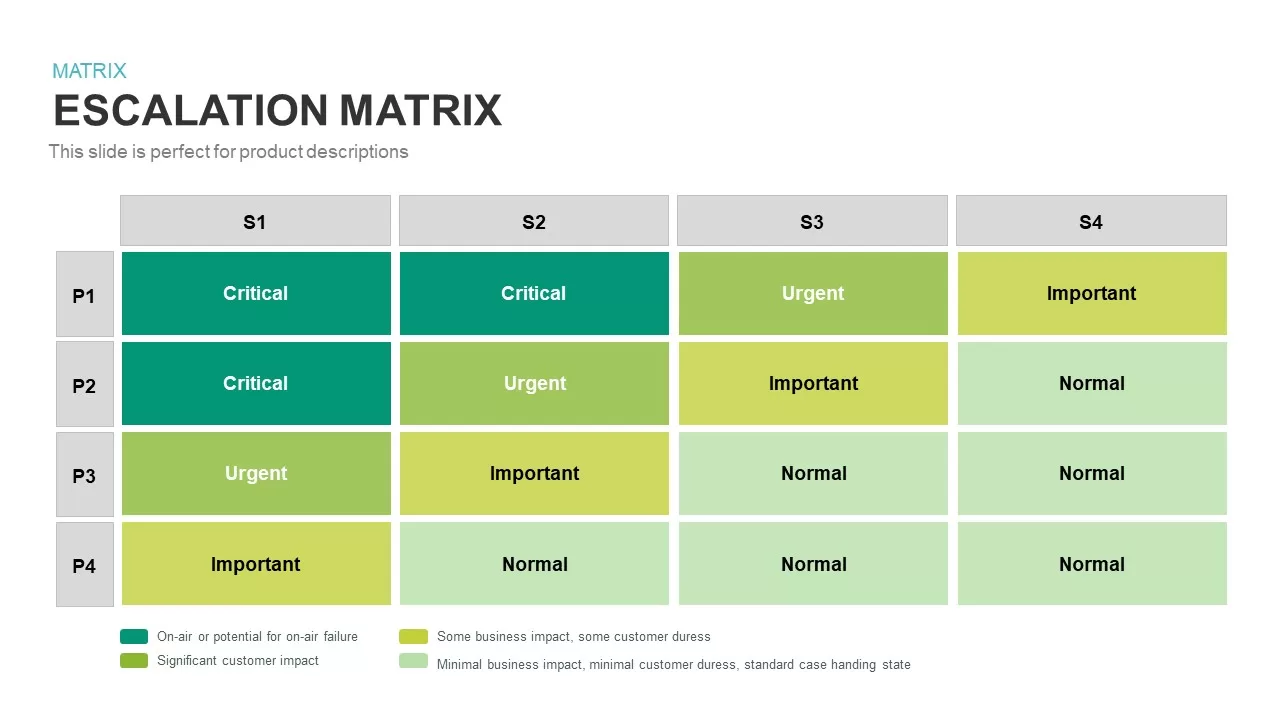
Escalation Matrix template for PowerPoint & Google Slides
Business
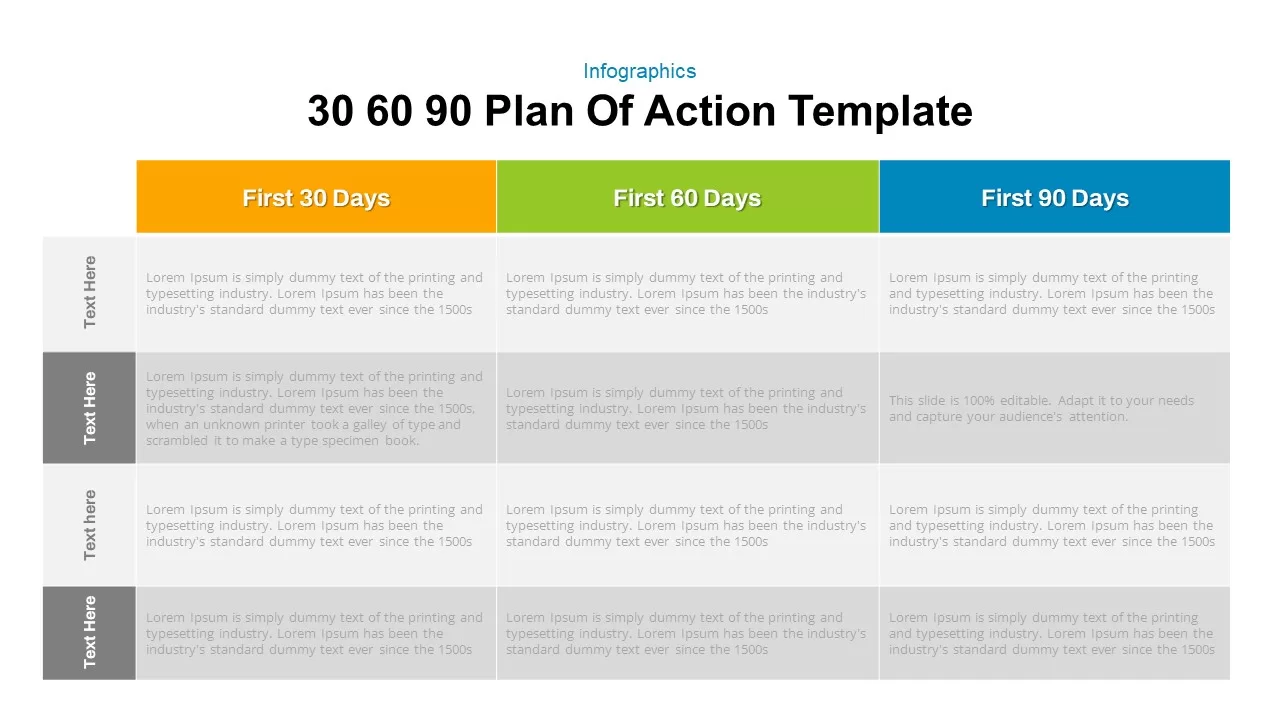
30 60 90 Day Plan Matrix Table Template for PowerPoint & Google Slides
Timeline
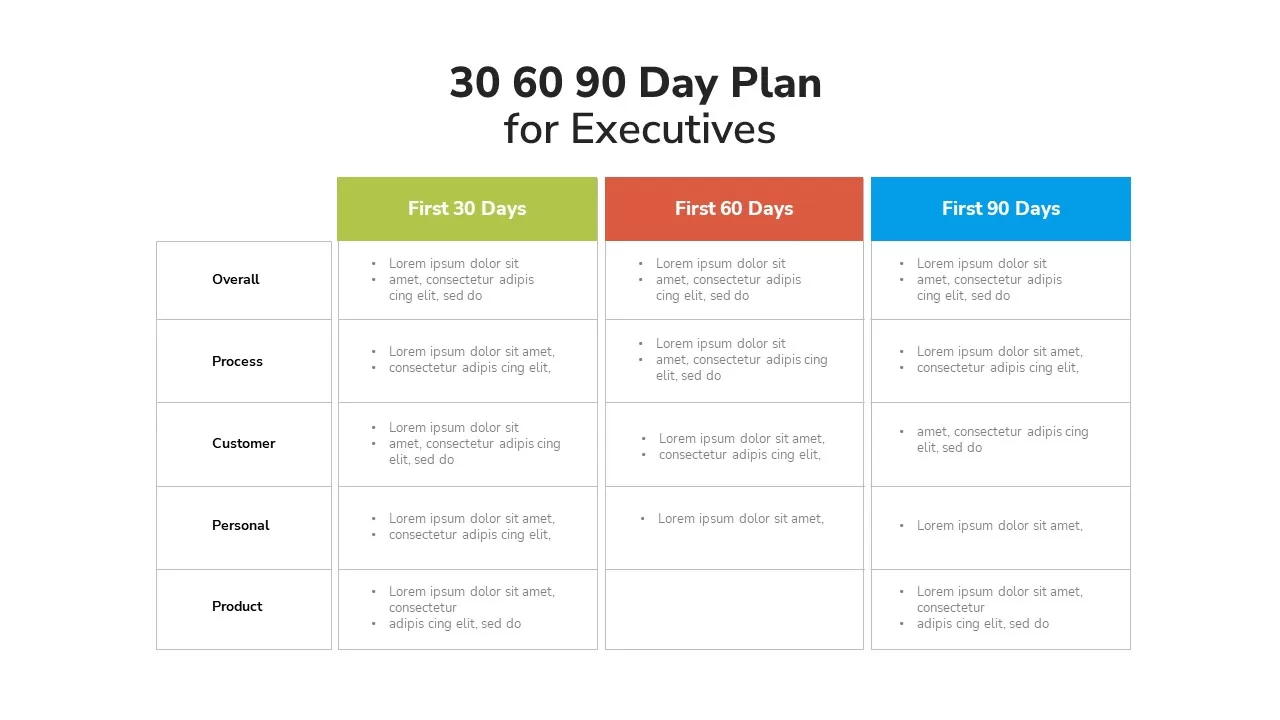
Executive 30-60-90 Day Plan Matrix Template for PowerPoint & Google Slides
Timeline
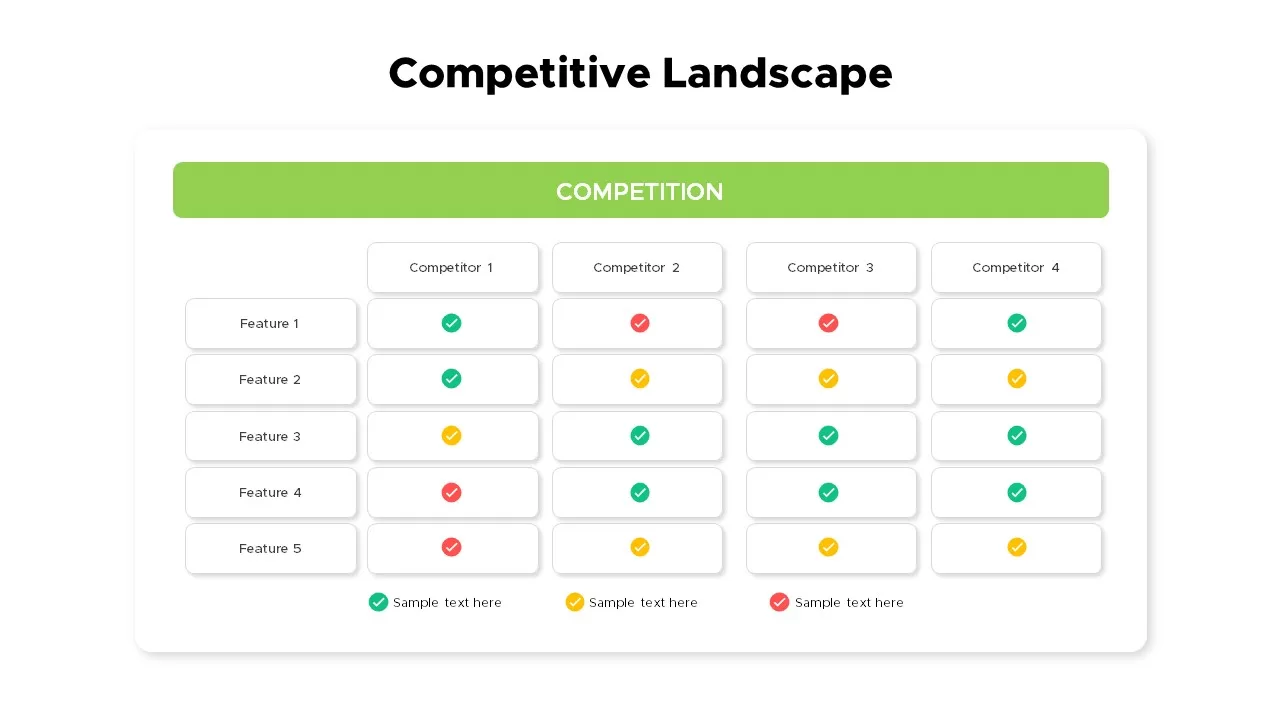
Competitive Landscape Matrix Template for PowerPoint & Google Slides
Comparison
Situational Leadership Matrix Template for PowerPoint & Google Slides
Process
Professional Interactive Heat Map Matrix Template for PowerPoint & Google Slides
Comparison Chart
Heat Map Risk Matrix Dashboard Template for PowerPoint & Google Slides
Comparison Chart
Risk Assessment Heatmap Matrix Slide Template for PowerPoint & Google Slides
Comparison Chart
Heatmap Matrix Template for PowerPoint & Google Slides
Maps
MoSCoW Prioritization Matrix Slide Template for PowerPoint & Google Slides
Business Strategy
Vendor Comparison Matrix with High-Level Requirements template for PowerPoint & Google Slides
Comparison Chart
Project Requirements Matrix Template for PowerPoint & Google Slides
Project
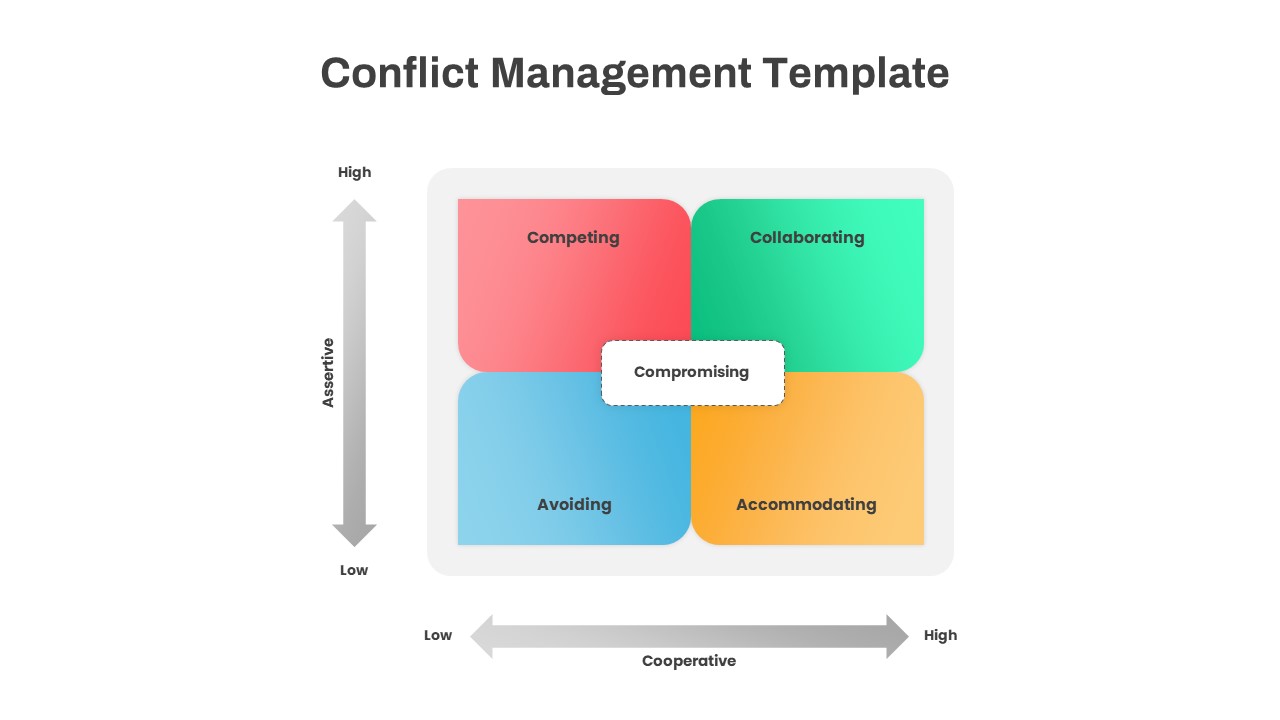
Conflict Management Matrix Template for PowerPoint & Google Slides
Leadership
Bubble Chart Scatter, Diagram & Matrix Template for PowerPoint & Google Slides
Comparison Chart
Free Competitor Analysis Matrix Template for PowerPoint & Google Slides
Competitor Analysis
Free
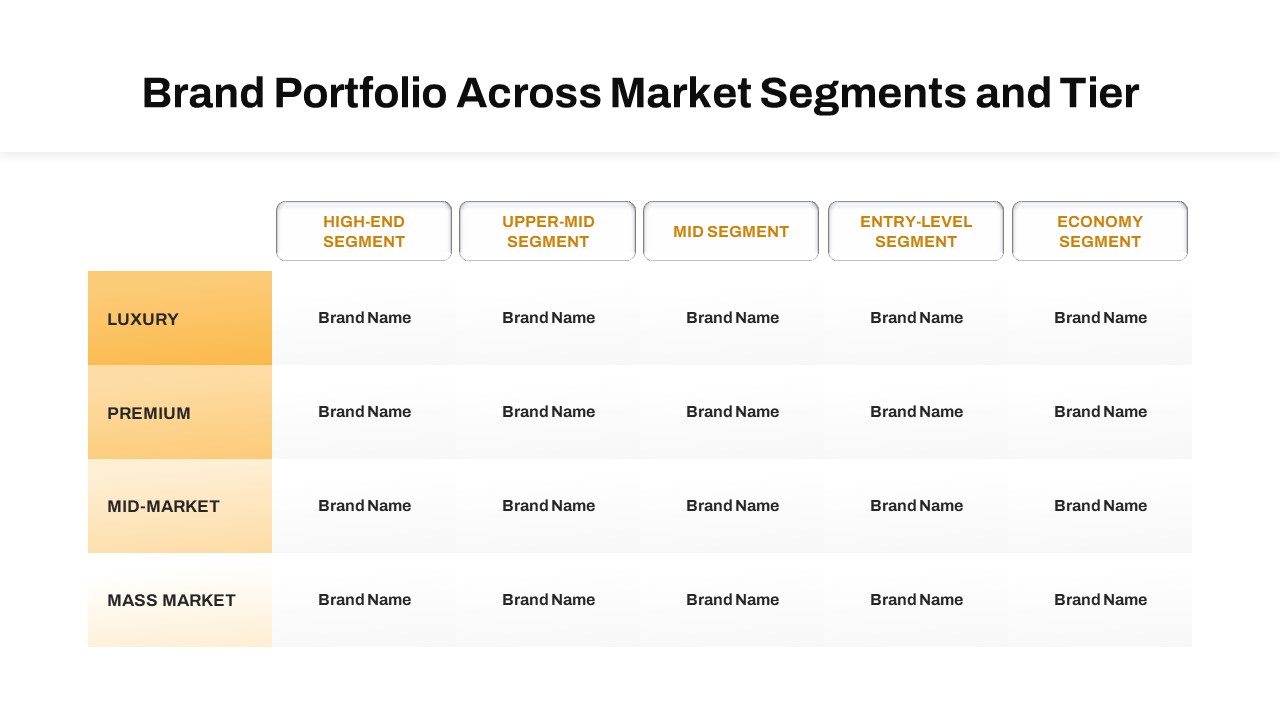
Brand Portfolio Matrix: Segments & Tiers Template for PowerPoint & Google Slides
Business Report
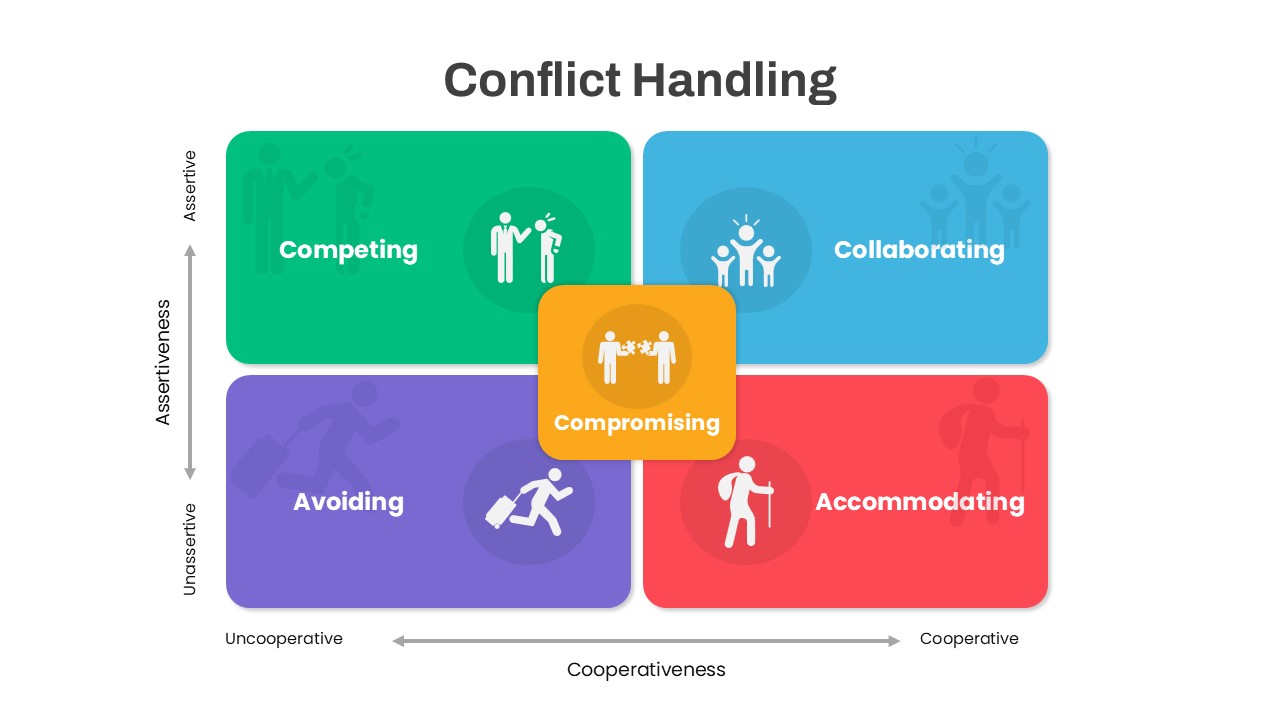
Colorful Conflict Handling Matrix Template for PowerPoint & Google Slides
Comparison
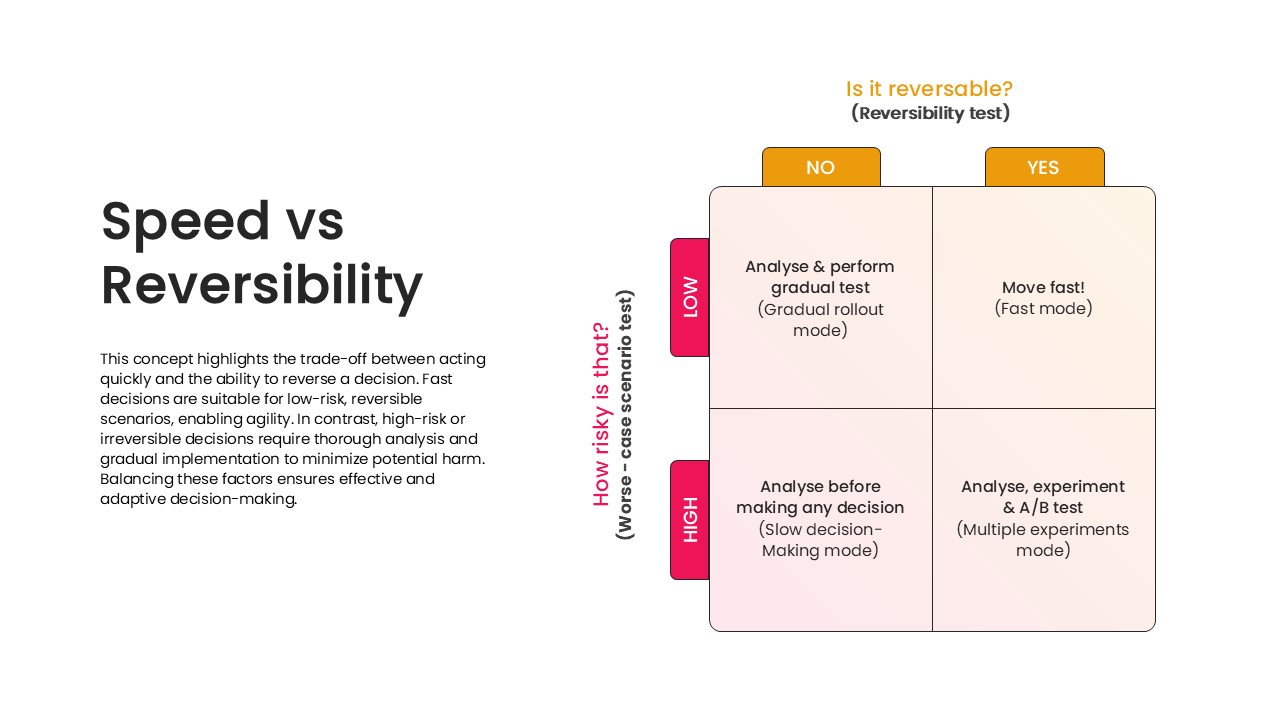
Speed vs Reversibility Decision Matrix Template for PowerPoint & Google Slides
Comparison
Ansoff Growth Matrix Professional Template for PowerPoint & Google Slides
Comparison
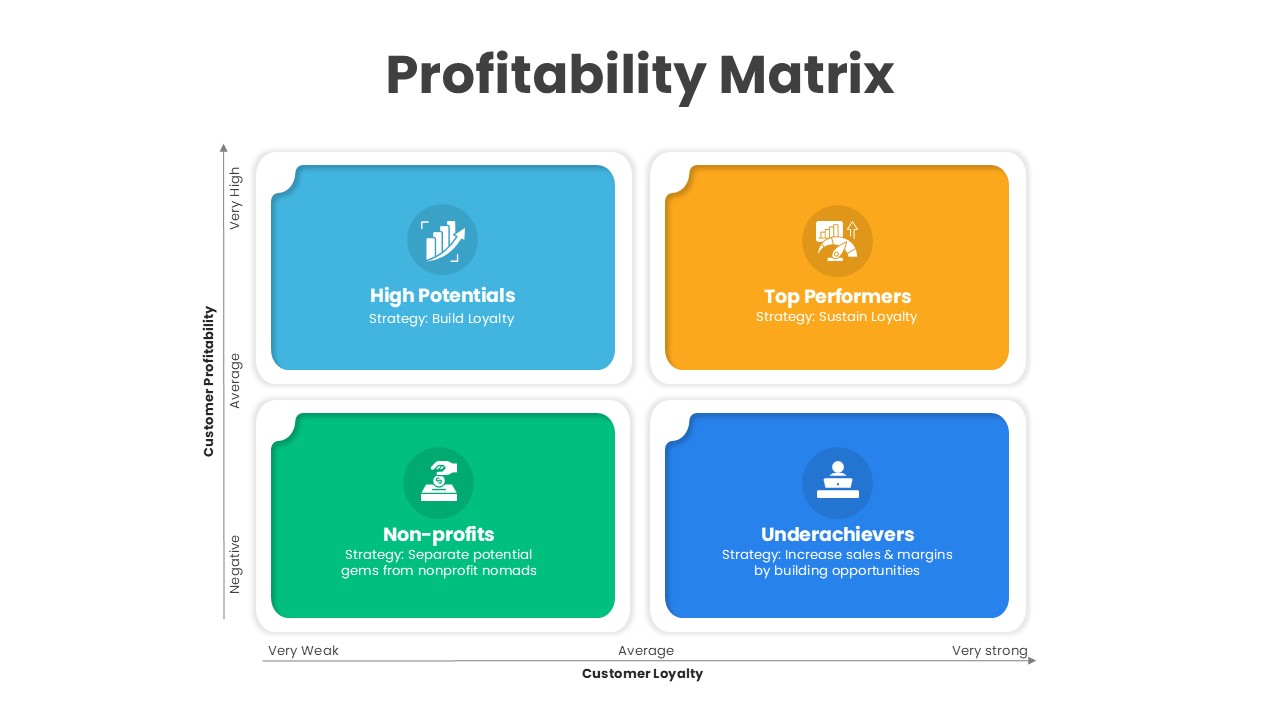
Customer Loyalty & Profitability Matrix Template for PowerPoint & Google Slides
Comparison
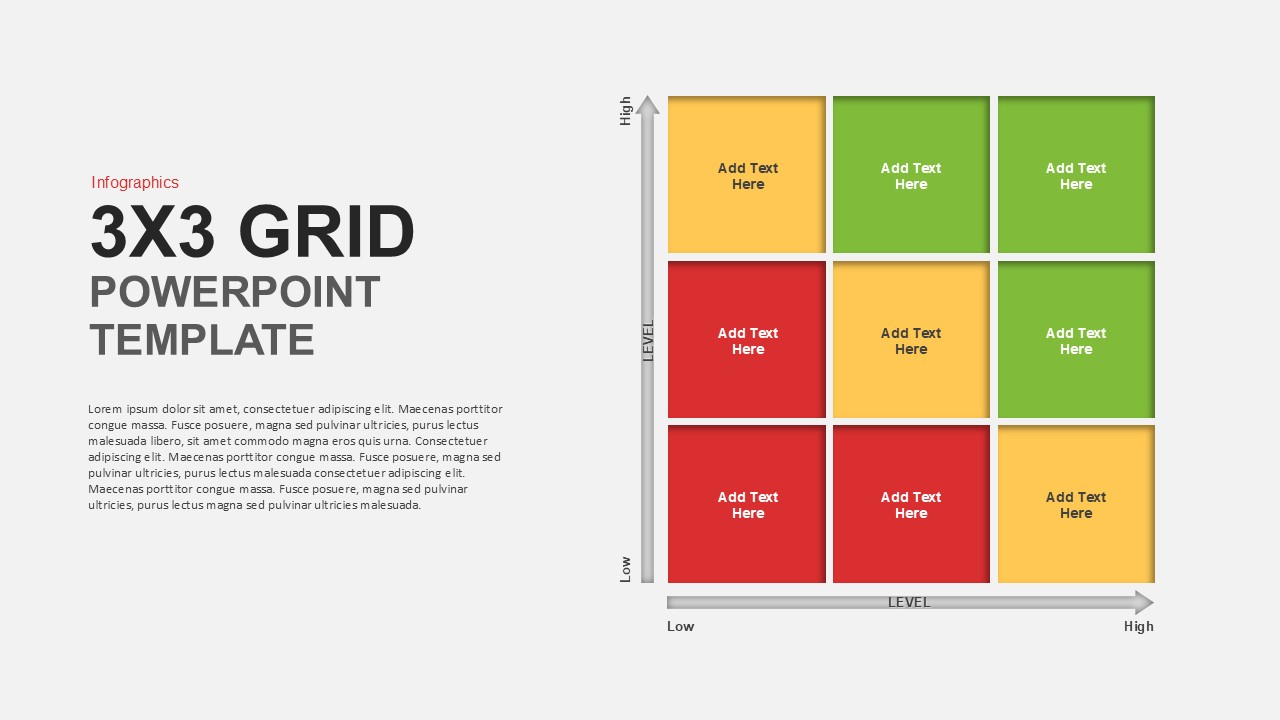
Matrix Grid Diagram Template for PowerPoint & Google Slides
Comparison
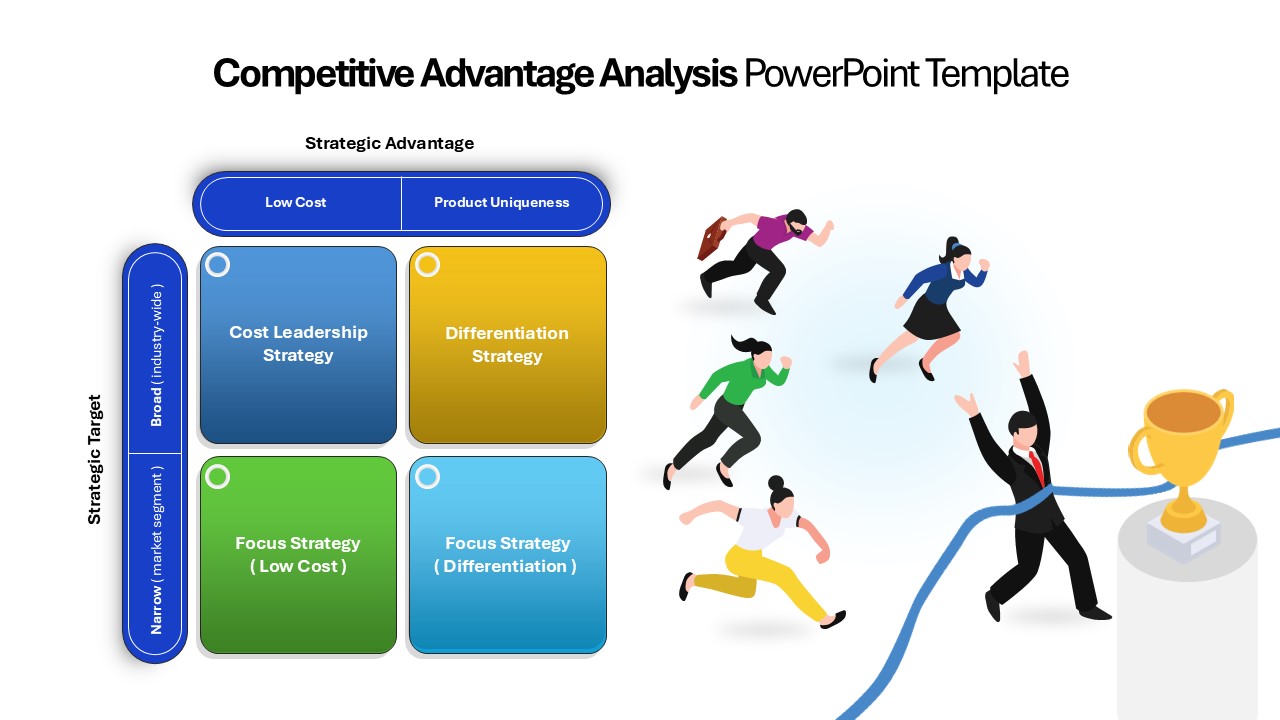
Porter’s Generic Strategies Matrix Template for PowerPoint & Google Slides
Business Strategy
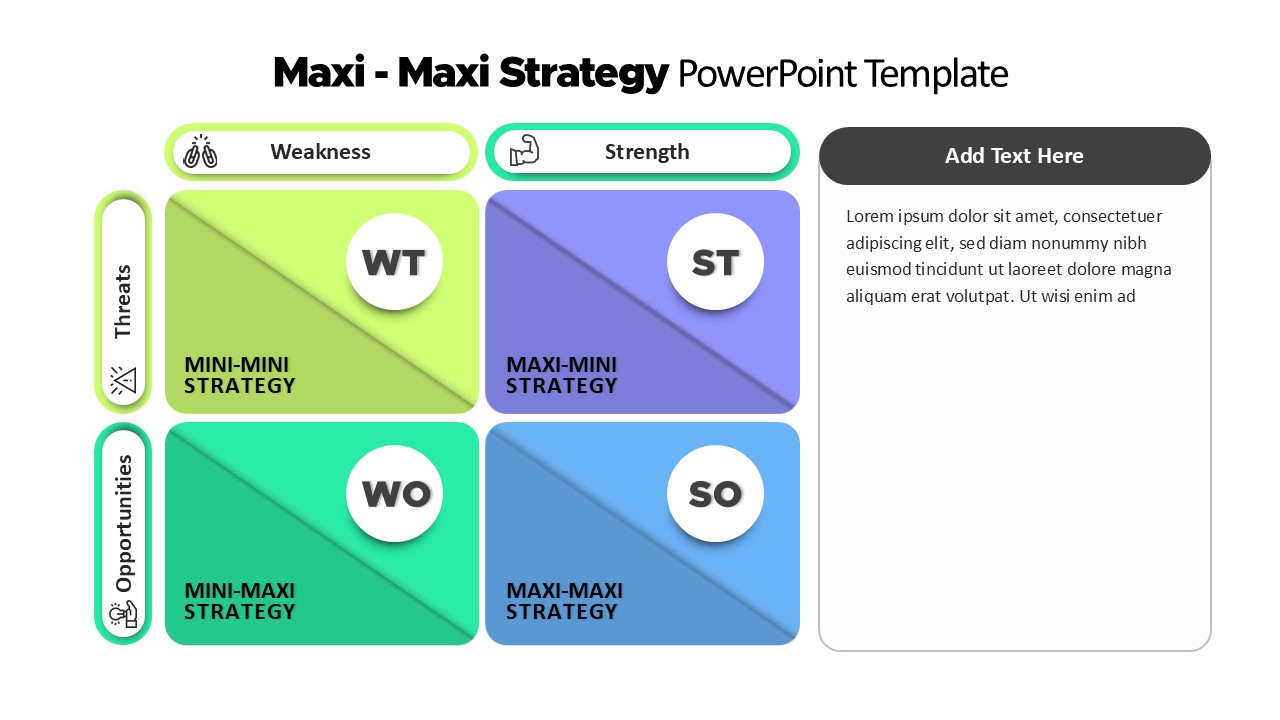
Maxi-Maxi Strategy Matrix SWOT Diagram Template for PowerPoint & Google Slides
SWOT
PAEI Leadership Roles 2×2 Matrix Diagram Template for PowerPoint & Google Slides
Business Models
2×2 Matrix PowerPoint & Google Slides Template
Business Models
Competitor Profile Matrix Comparison Template for PowerPoint & Google Slides
Comparison Chart
Confusion Matrix Diagram Overview Template for PowerPoint & Google Slides
Comparison
Feasibility Matrix Comparison Chart Template for PowerPoint & Google Slides
Comparison Chart
Risk Probability and Impact Matrix Template for PowerPoint & Google Slides
Risk Management
Quantitative Risk Analysis Matrix template for PowerPoint & Google Slides
Risk Management
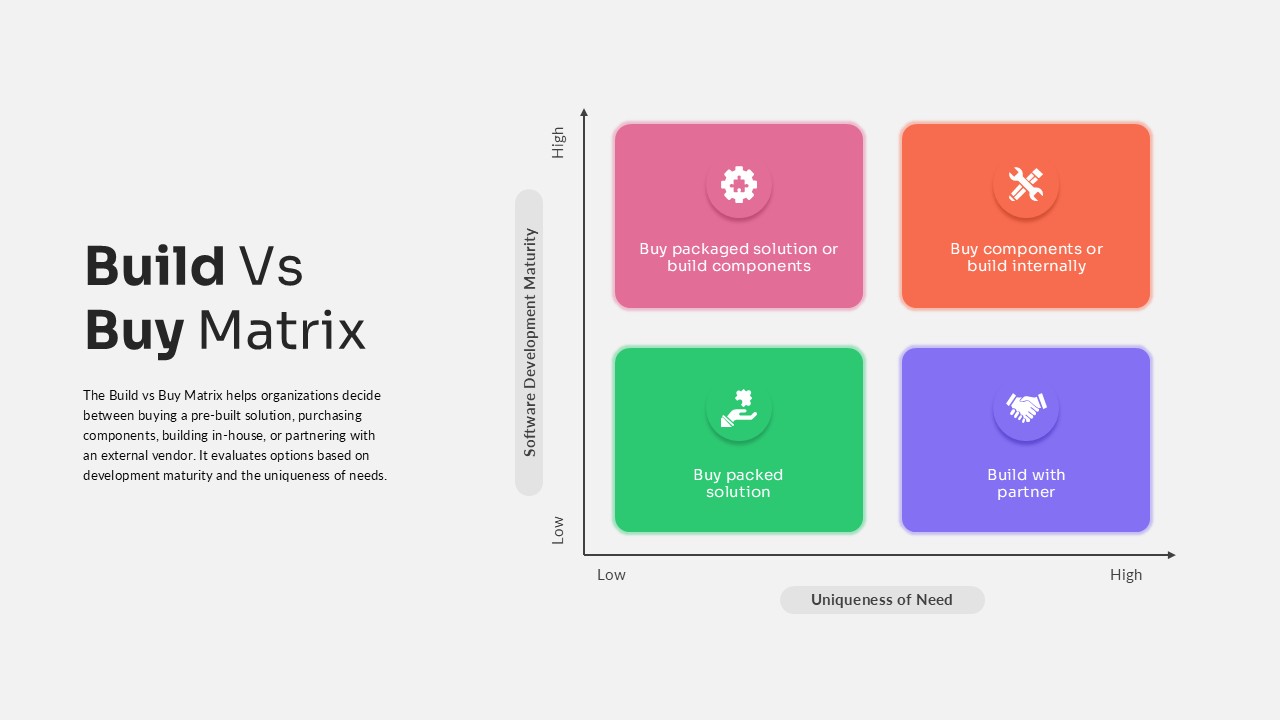
Build vs Buy Matrix Decision Framework template for PowerPoint & Google Slides
Business Strategy
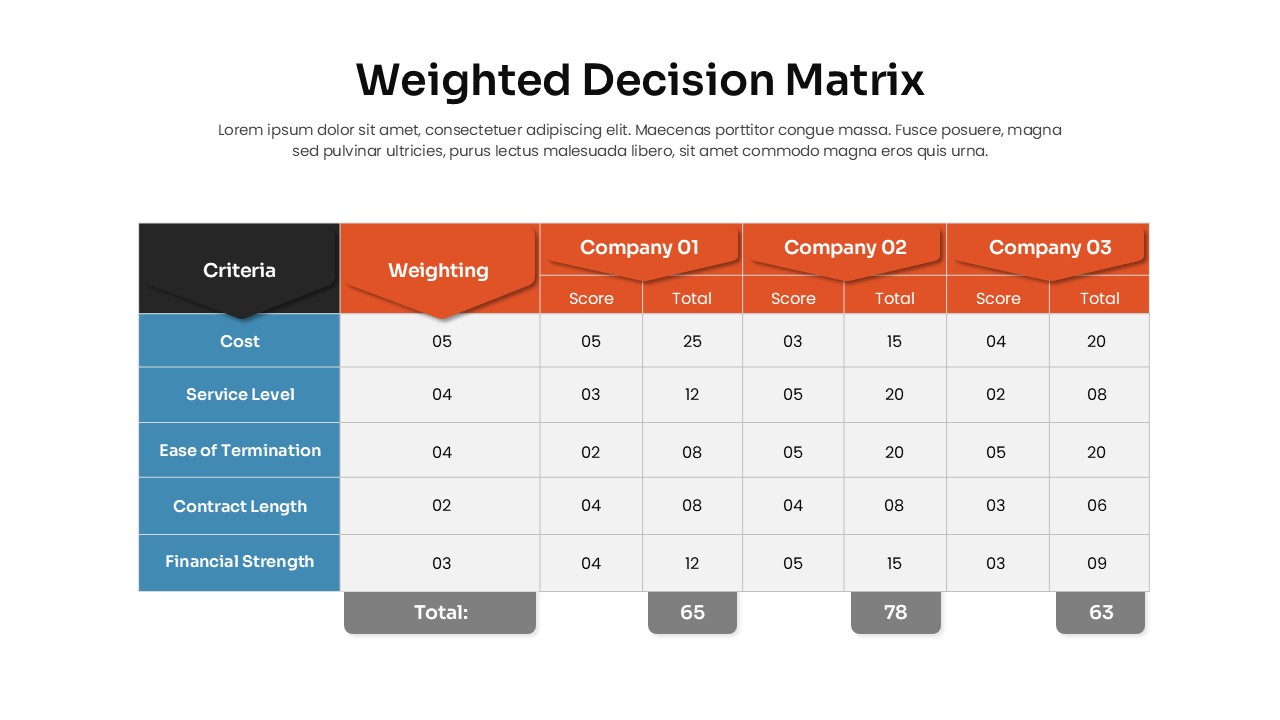
Weighted Decision Matrix template for PowerPoint & Google Slides
Business Models
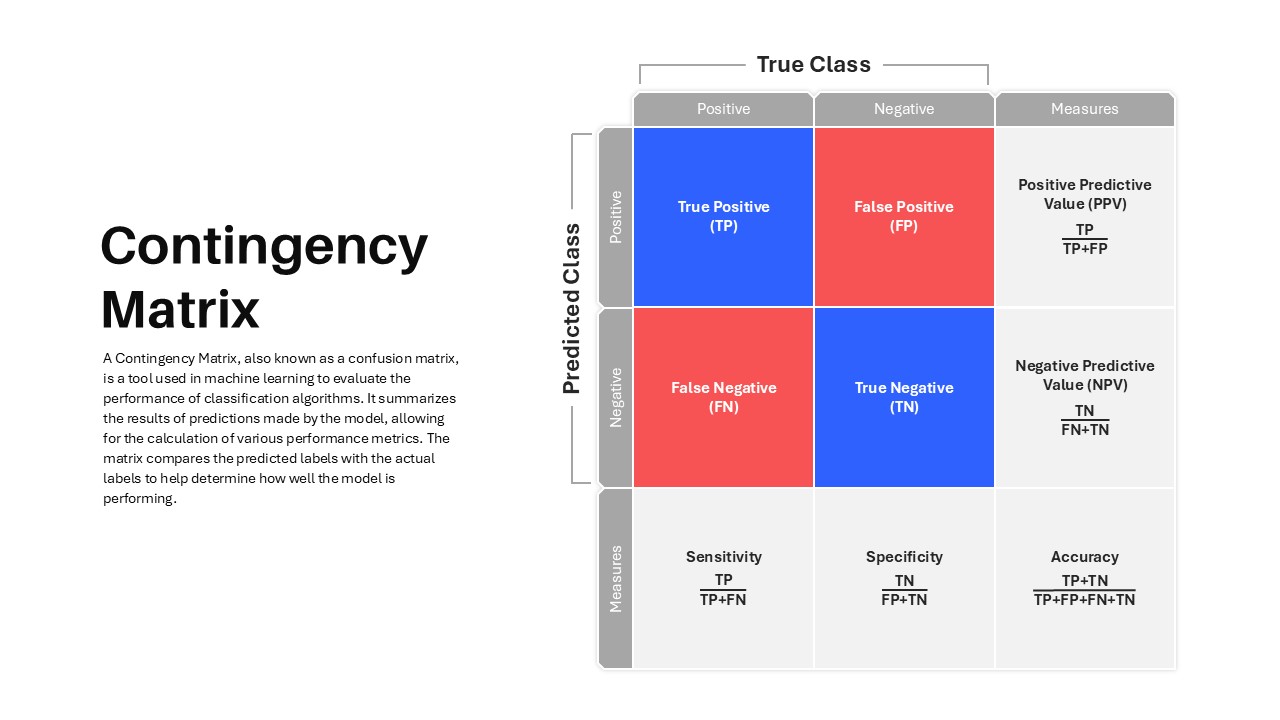
Contingency Matrix in Machine Learning template for PowerPoint & Google Slides
Technology
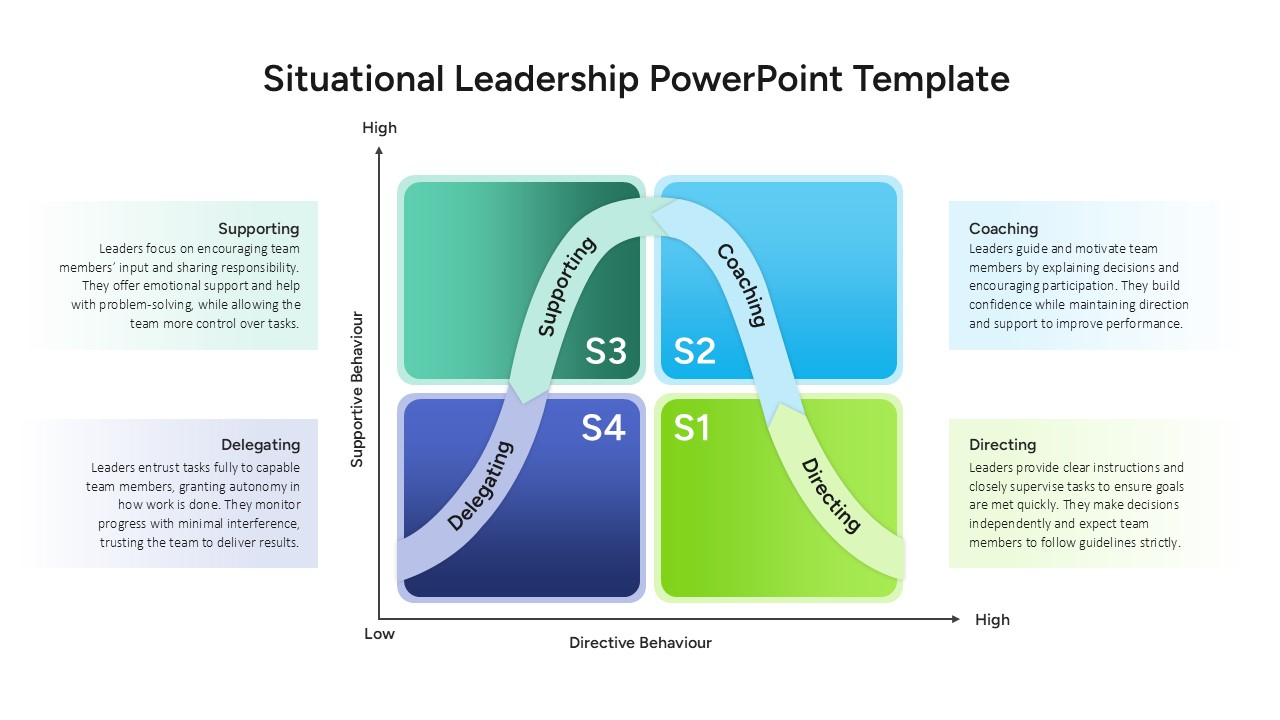
Situational Leadership Matrix Template for PowerPoint & Google Slides
Leadership
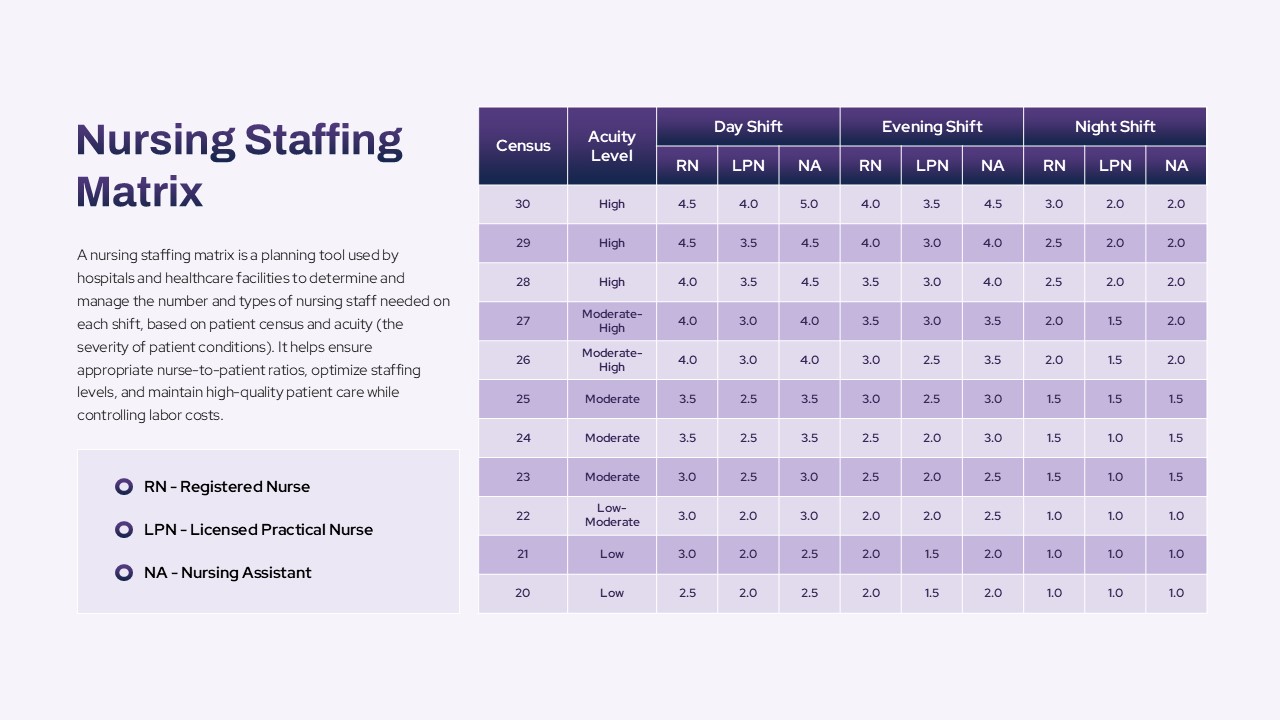
Nursing Staffing Matrix Planning Template for PowerPoint & Google Slides
Nursing
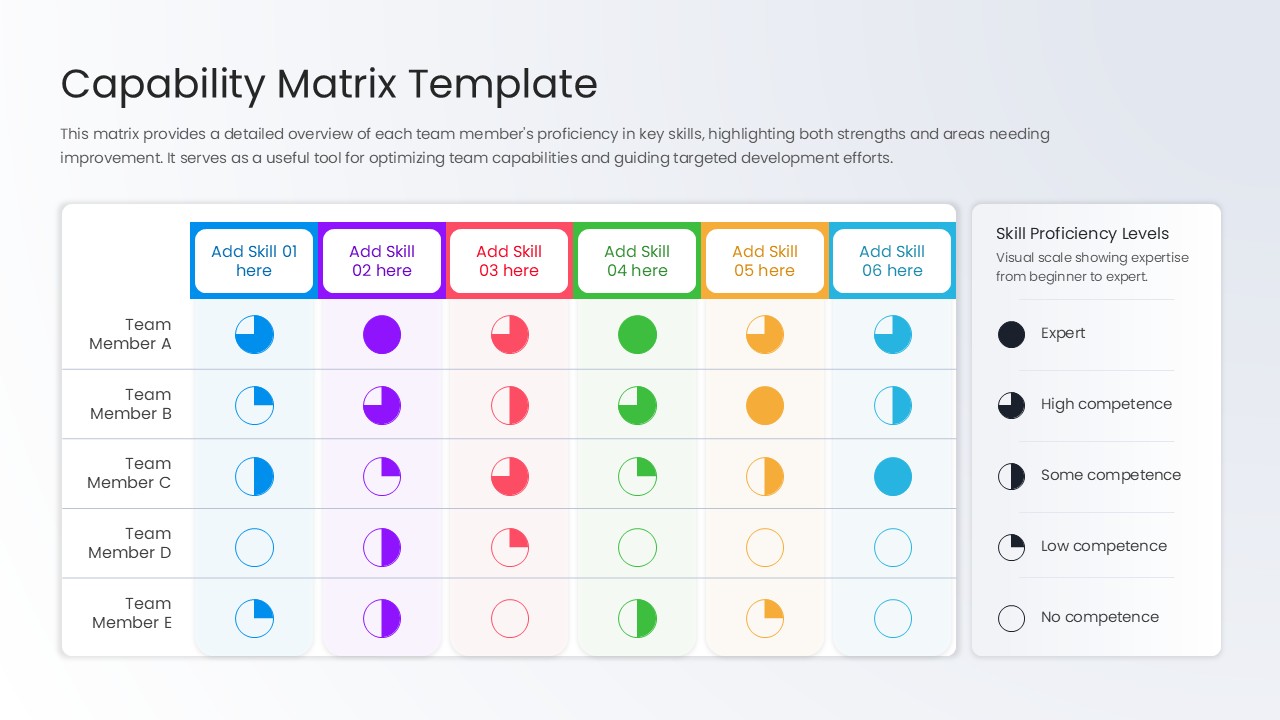
Capability Matrix Template for PowerPoint & Google Slides
HR
Personal SWOT Analysis Matrix Cards Template for PowerPoint & Google Slides
SWOT
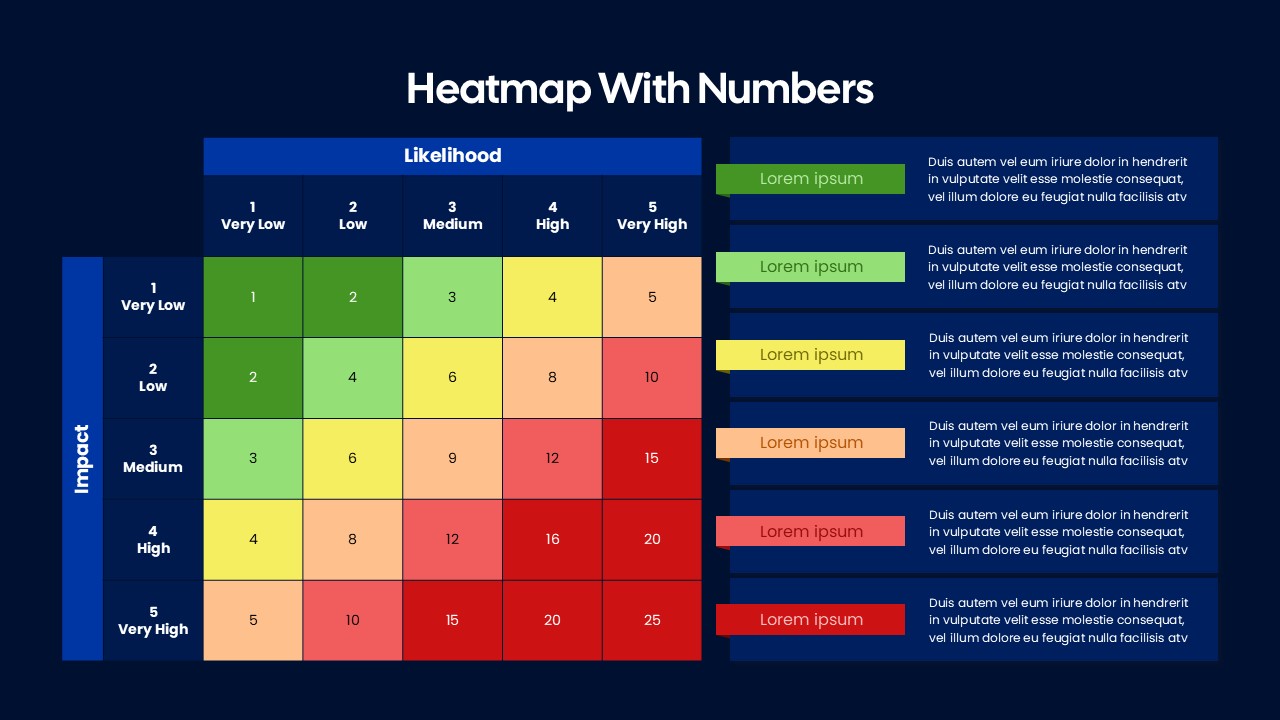
Heatmap Matrix with Numbers Template for PowerPoint & Google Slides
Project
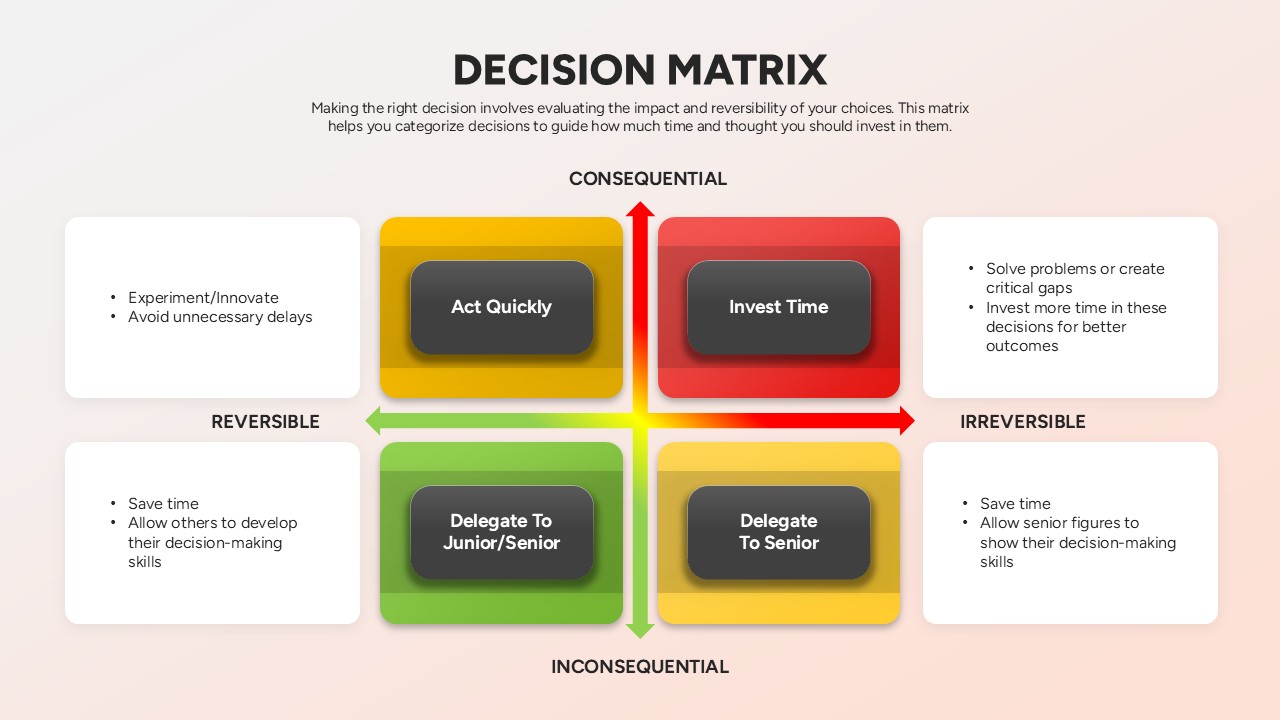
Decision Matrix Evaluation Framework Slide Template for PowerPoint & Google Slides
Leadership
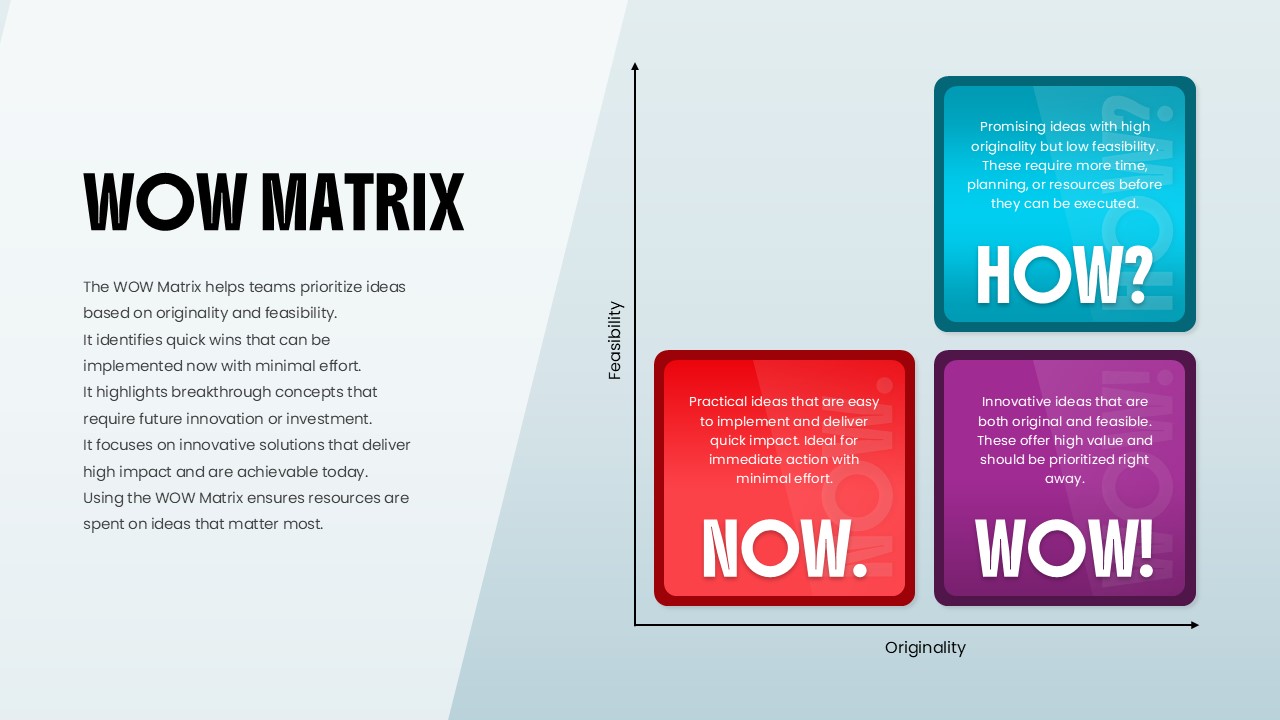
WOW Matrix Template for PowerPoint & Google Slides
Business Strategy
Ansoff Growth Matrix Template for PowerPoint & Google Slides
Business Strategy
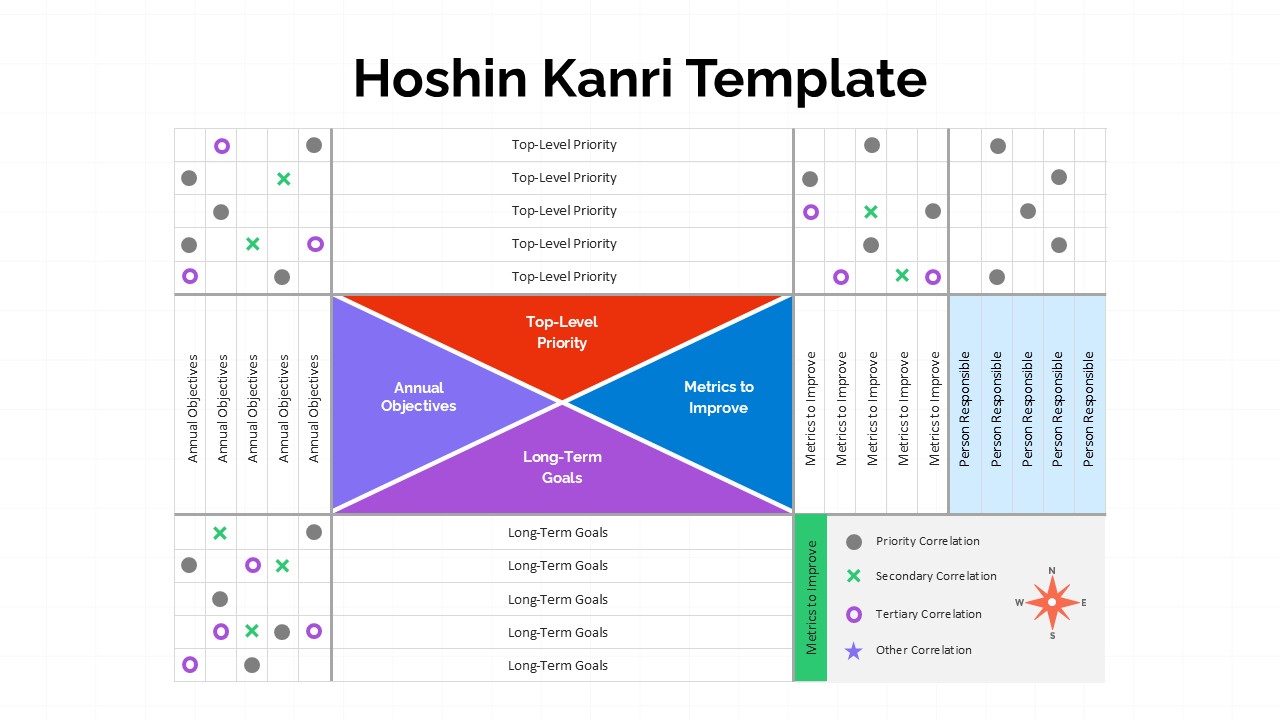
Hoshin Kanri Strategic Planning Matrix Template for PowerPoint & Google Slides
Business Strategy
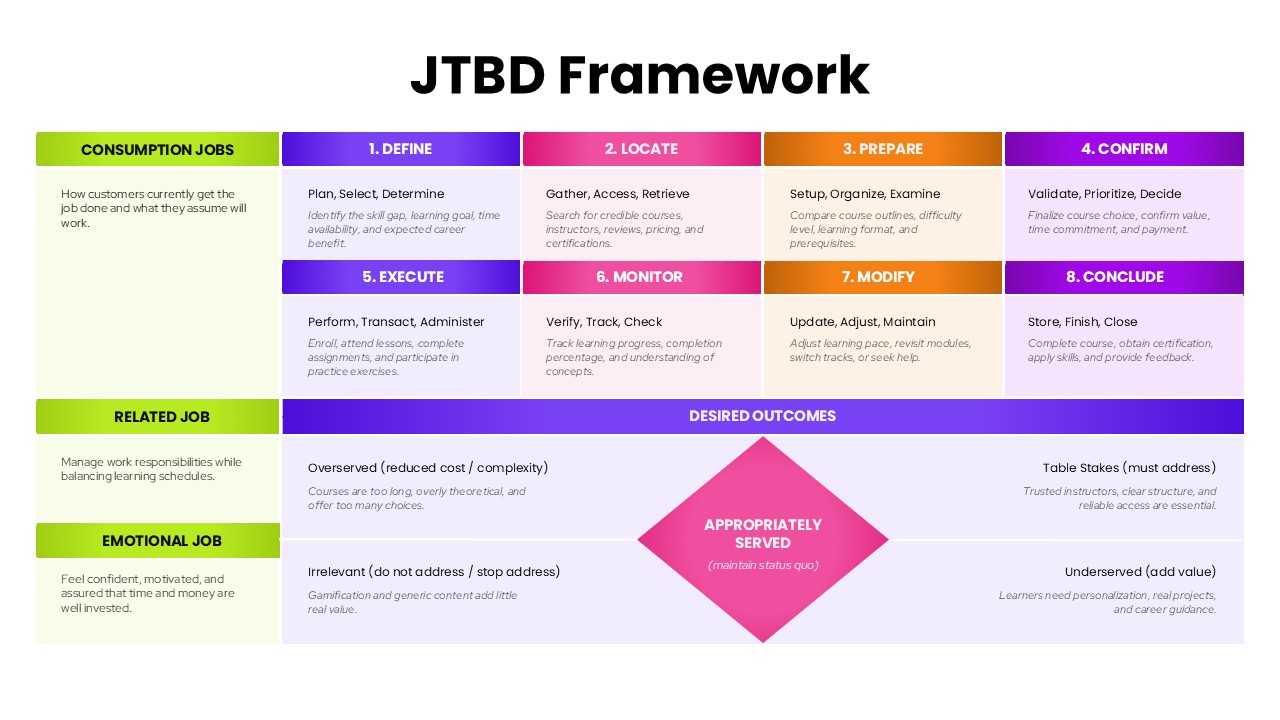
JTBD Framework Process and Outcomes Matrix Template for PowerPoint & Google Slides
Marketing
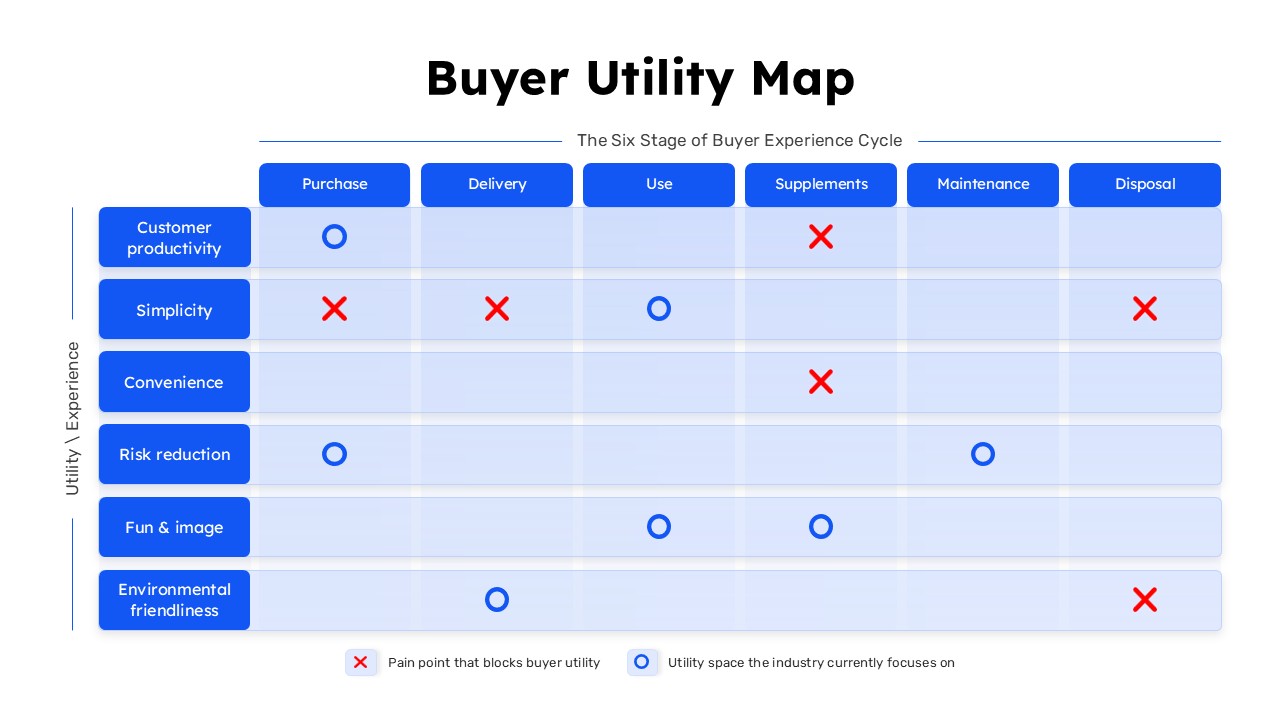
Buyer Utility Map Strategy Matrix Template for PowerPoint & Google Slides
Customer Journey
Materiality Assessment Matrix Diagram Template for PowerPoint & Google Slides
Risk Management
Action Priority Impact Effort Matrix Template for PowerPoint & Google Slides
Business Strategy
IT Gap Analysis Assessment Matrix Template for PowerPoint & Google Slides
Information Technology