Rectangle Area Chart with Gradient Fill Template for PowerPoint & Google Slides

Description
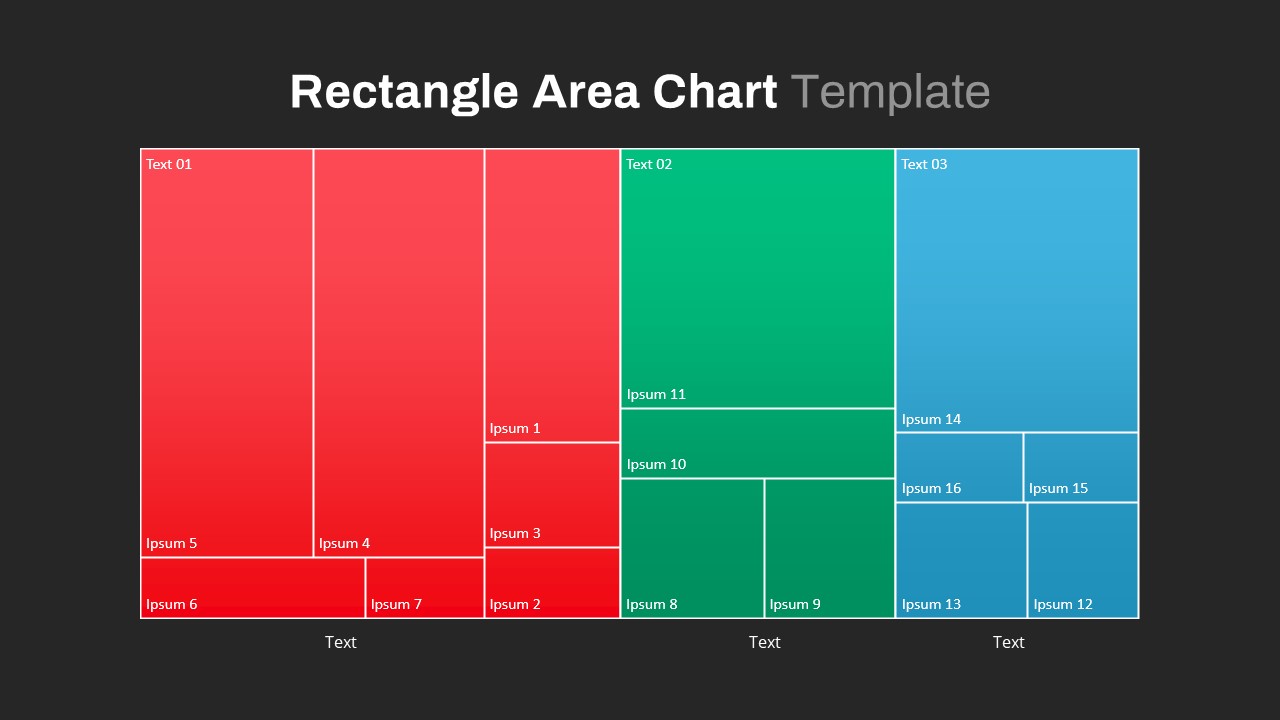
Leverage this slide to visualize hierarchical or proportional data with a modern rectangle area chart. The layout divides the canvas into three distinct sections—red, green, and blue—each filled with a smooth gradient and defined by clean white borders. Customizable text placeholders positioned inside each rectangle let you label sections and sub-segment values without clutter. With vector-based shapes, subtle drop shadows, and a minimalist aesthetic, the design balances visual appeal with data clarity. The horizontal axis labels can be edited to reflect your metrics or categories, ensuring audiences quickly grasp comparative scales and segment relationships.
Engineered for efficiency, this template offers fully editable master slides, allowing you to resize areas, swap colors, or adjust typography in seconds. Whether you are illustrating budget allocations, market share distributions, or performance dashboards, the intuitive drag-and-drop structure simplifies customization. Optimized for both PowerPoint and Google Slides, it maintains gradient integrity and precise formatting across devices. Use this rectangle area chart to drive data-driven storytelling, highlight key insights, and streamline stakeholder presentations with professionalism and ease.
Slide components include pre-defined gradient palettes, vector icons, and placeholder infographics that can be duplicated or removed to match your branding guidelines. Non-destructive layering lets you lock specific elements and prevent accidental edits during collaborations. You can also export each section individually as an image for reports or embed it in dashboards. Perfect for strategic reviews, investor updates, or academic presentations, this area chart seamlessly integrates into any deck, elevating data visualization and audience engagement.
Who is it for
Business analysts, data scientists, marketing teams, and financial planners will benefit from this chart when comparing segment sizes or illustrating resource allocations. Consultants, educators, and executives can also leverage its clear layout to present market research, sales breakdowns, and project milestones.
Other Uses
Beyond core comparisons, repurpose this slide for budget tracking, product portfolio analysis, customer segmentation, performance KPIs, risk assessments, and portfolio management overviews.
Login to download this file

Item ID
SB03708
Related Templates

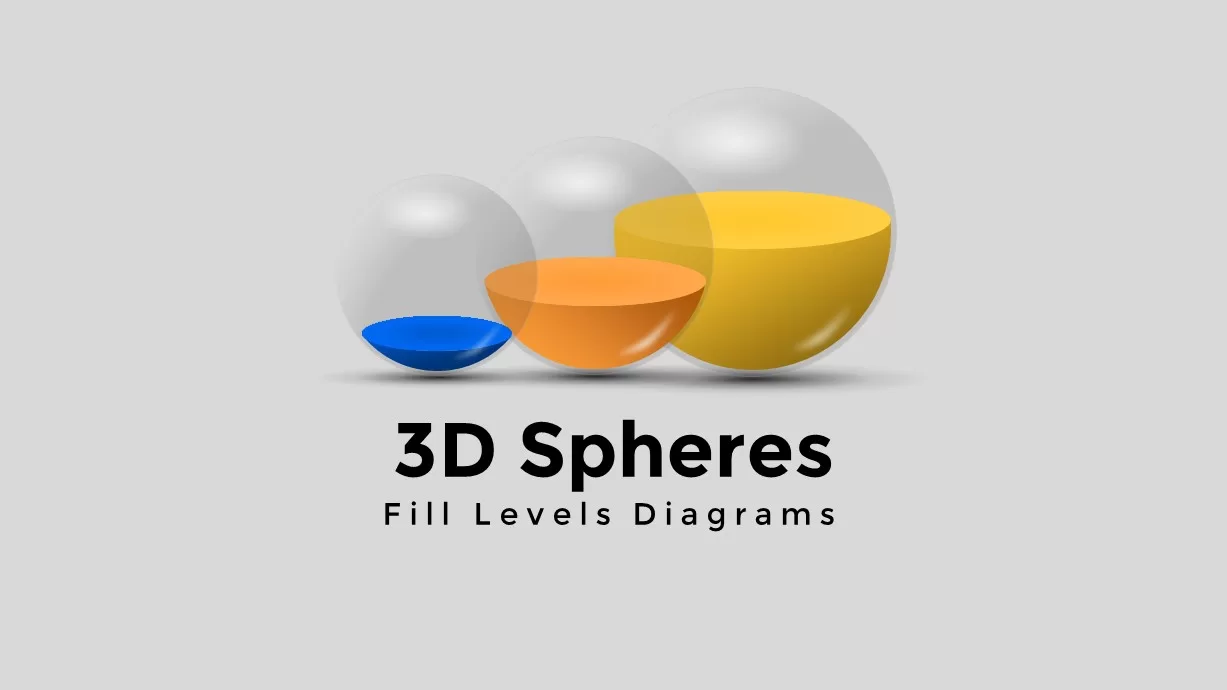
3D Spheres Fill Level Infographic Deck Template for PowerPoint & Google Slides
Comparison

Excel-Driven Gradient Timeline Chart Template for PowerPoint & Google Slides

Free Modern Gradient Wave Welcome Slides Template for PowerPoint & Google Slides
Free
Free
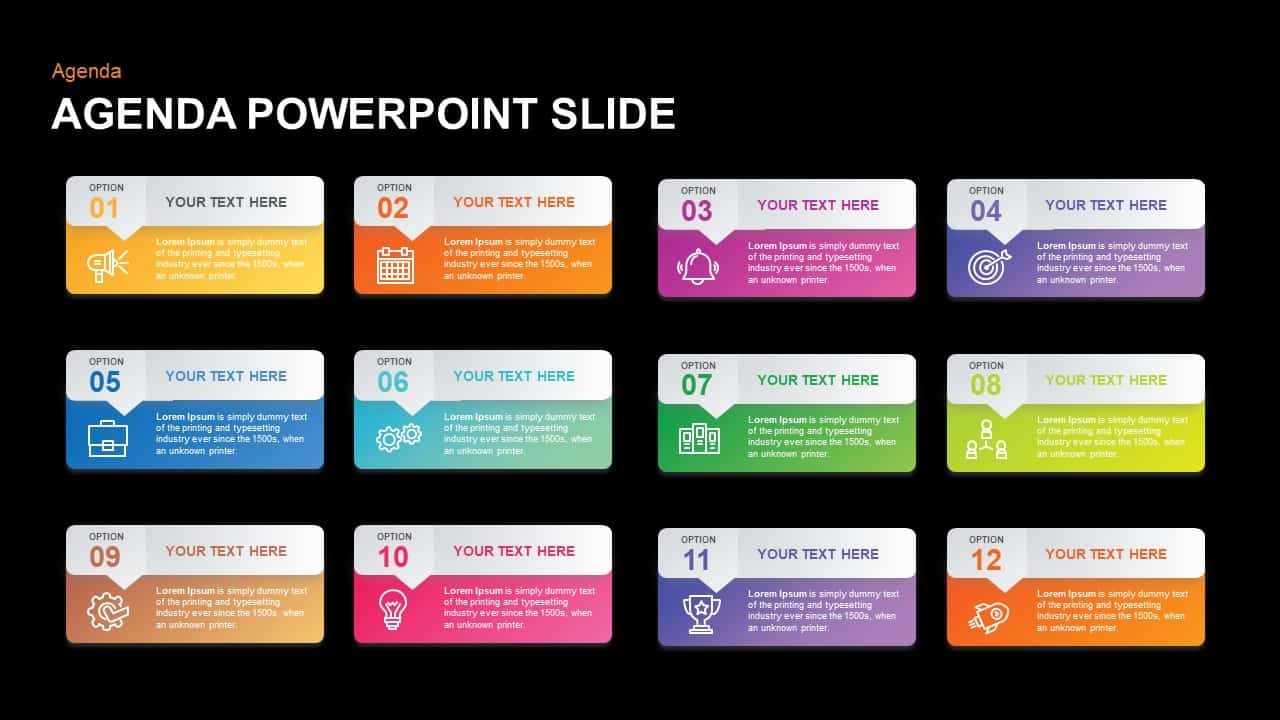
Gradient 12-Point Agenda Slide Template for PowerPoint & Google Slides
Business Report
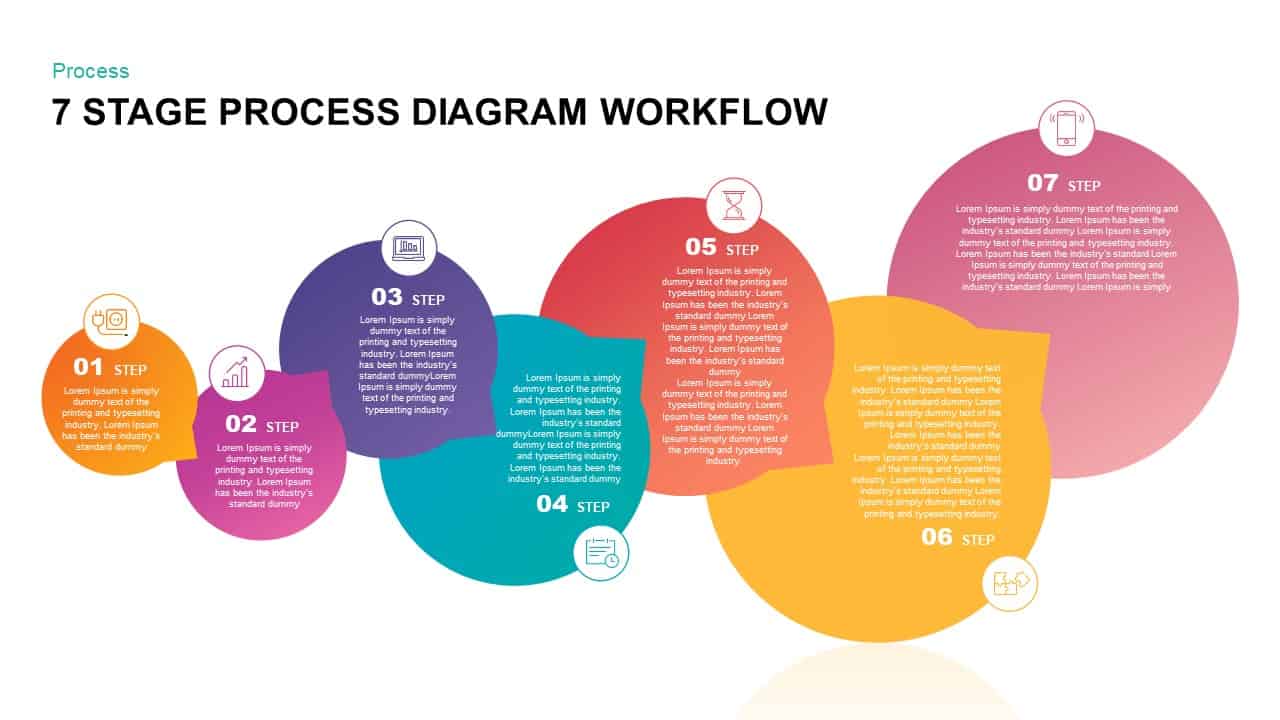
Gradient Seven-Stage Bubble Workflow Template for PowerPoint & Google Slides
Process
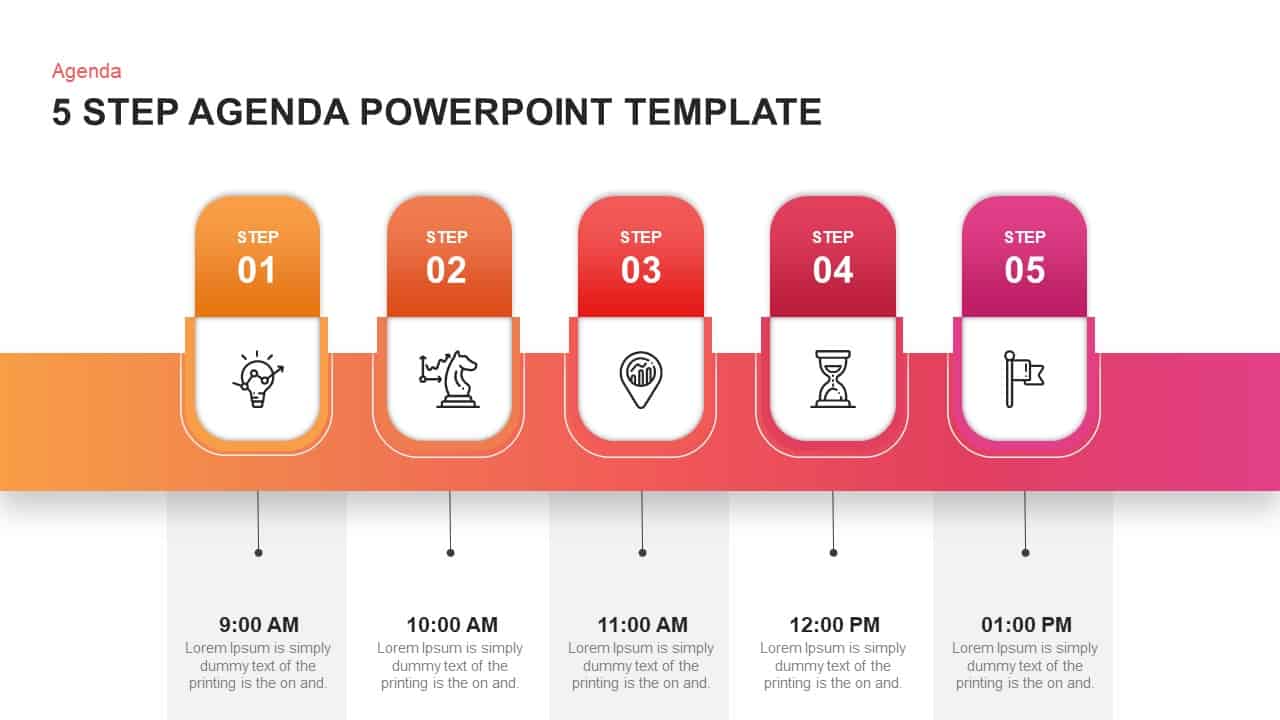
Five-Step Gradient Agenda Timeline Template for PowerPoint & Google Slides
Agenda
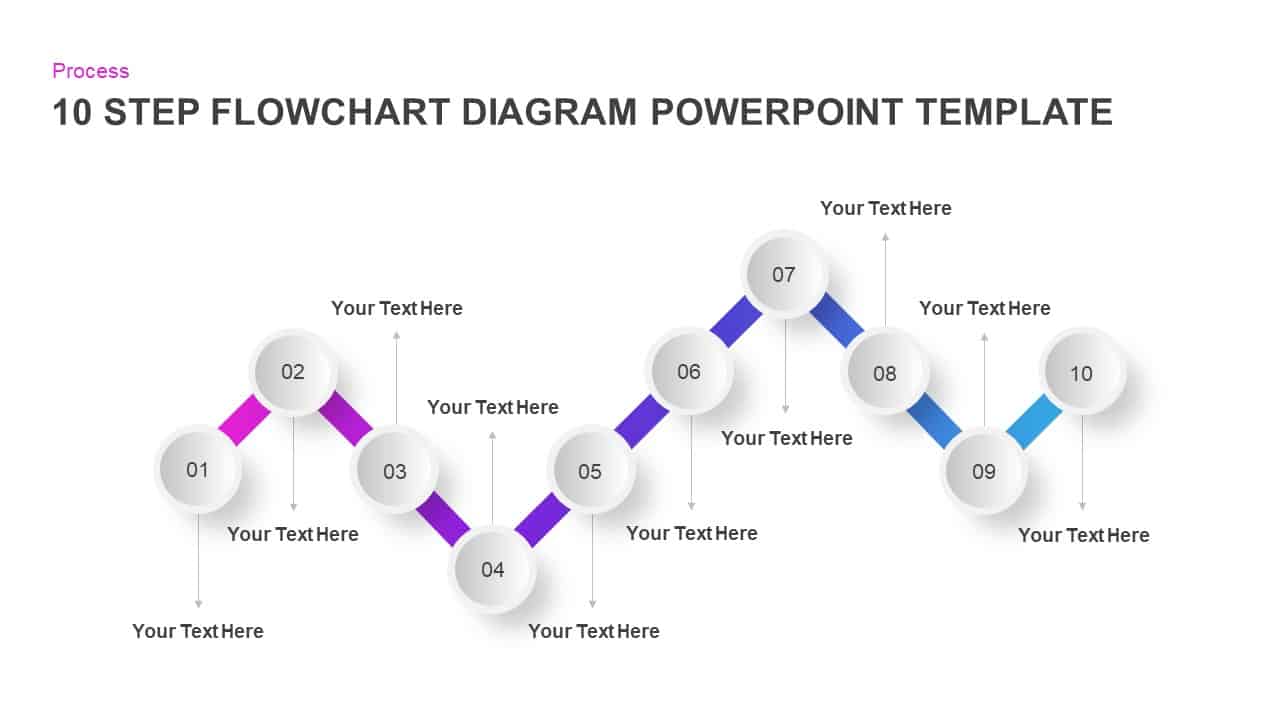
Gradient Ten-Step Flowchart Diagram Template for PowerPoint & Google Slides
Process
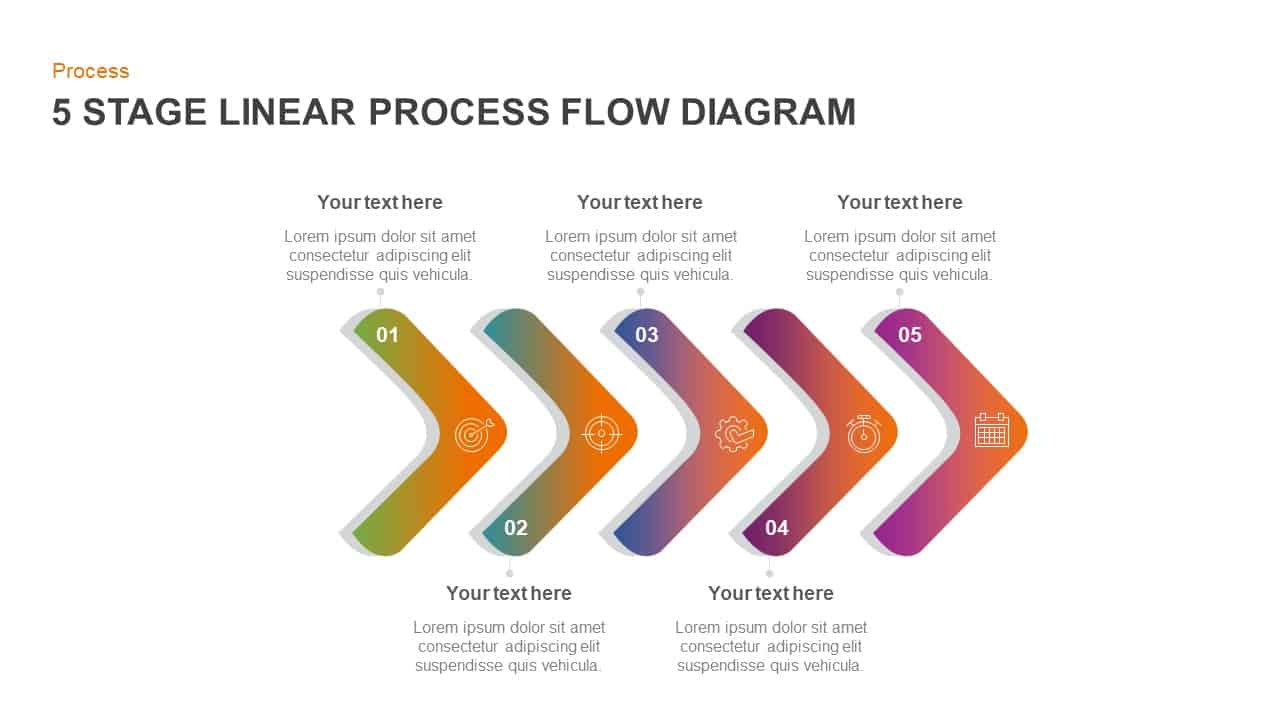
Gradient Chevron Five-Stage Process Flow Template for PowerPoint & Google Slides
Arrow
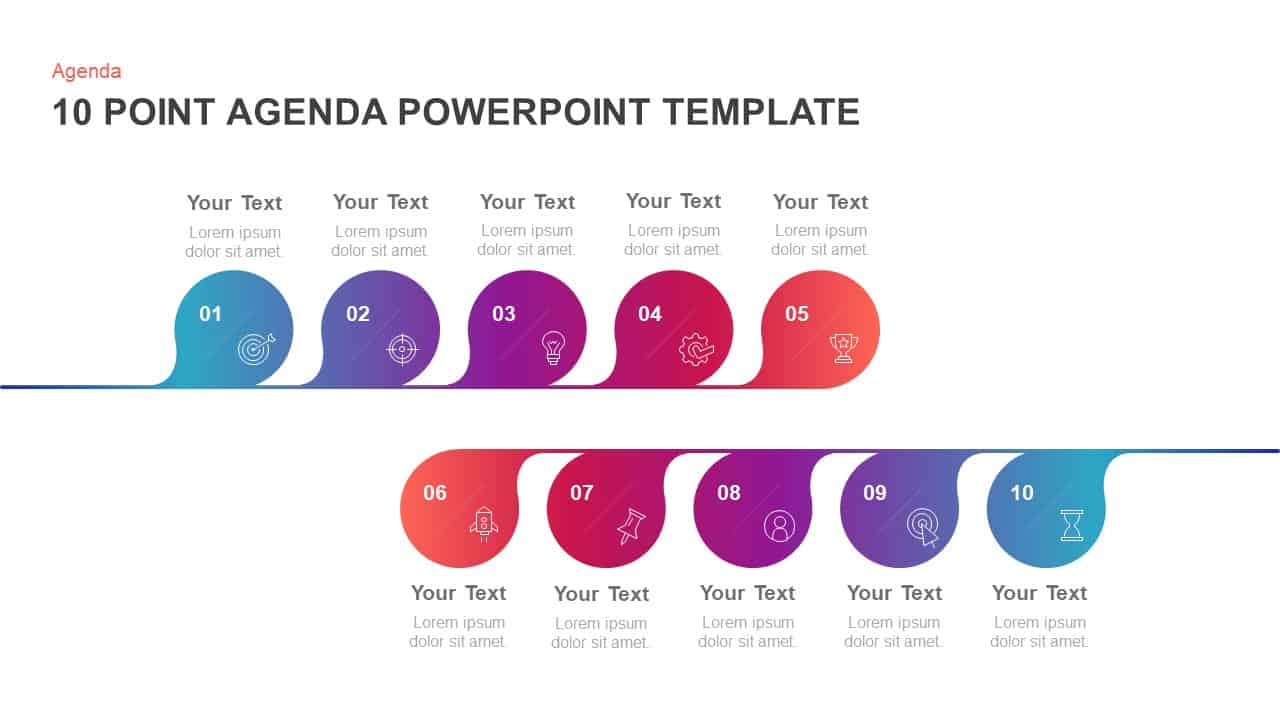
10-Point Gradient Agenda Flow Diagram Template for PowerPoint & Google Slides
Agenda
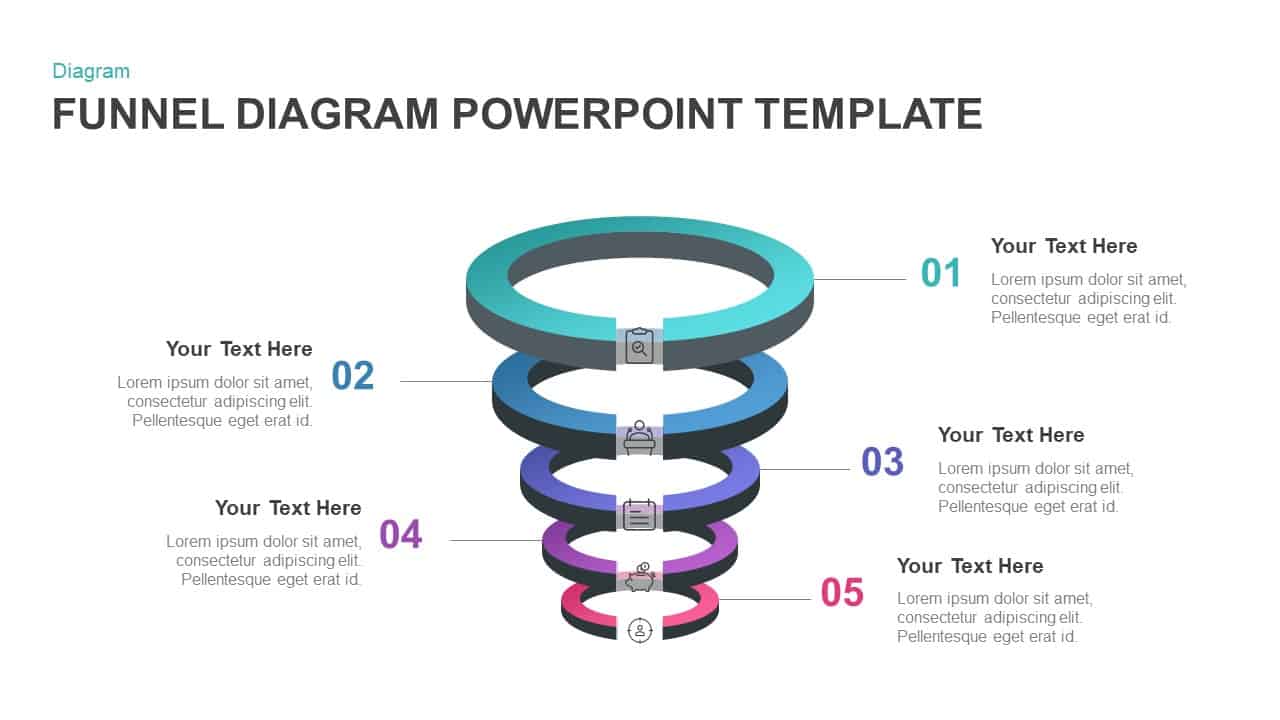
Gradient 5-Stage Funnel Infographic Template for PowerPoint & Google Slides
Funnel
Gradient Clock Agenda Timeline Diagram Template for PowerPoint & Google Slides
Agenda
Five-Step Gradient Blue Funnel Diagram Template for PowerPoint & Google Slides
Funnel
Six-Step Purple Gradient Infographics Template for PowerPoint & Google Slides
Process
Five-Year Gradient Timeline Infographic Template for PowerPoint & Google Slides
Timeline
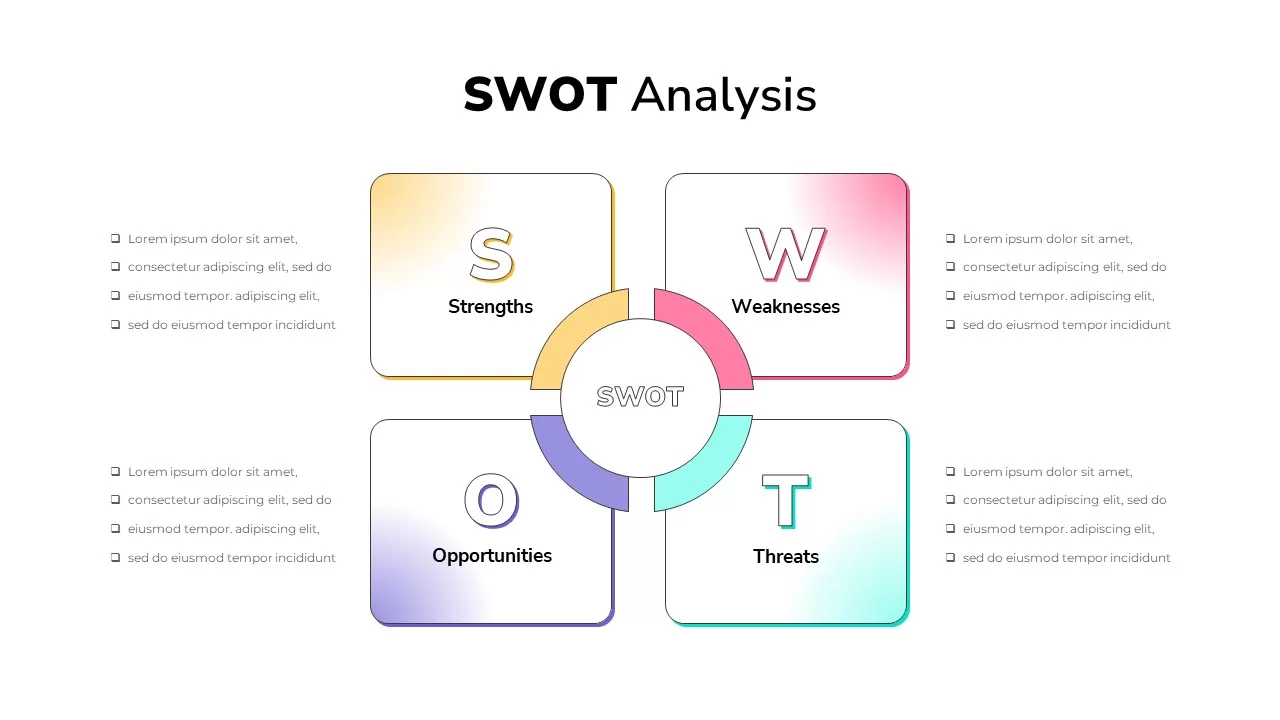
Gradient Petal SWOT Analysis Quadrant Template for PowerPoint & Google Slides
SWOT
Gradient 5-Step Infographic Process Template for PowerPoint & Google Slides
Process
Gradient Business Company Profile Template for PowerPoint & Google Slides
Company Profile
Gradient Annual Plan & Strategy Deck Template for PowerPoint & Google Slides
Decks
5-Step Circular Gradient Process Flow Template for PowerPoint & Google Slides
Process
Purple Gradient Company Profile Deck Template for PowerPoint & Google Slides
Company Profile
Gradient Company Profile Presentation Template for PowerPoint & Google Slides
Company Profile
Cybersecurity Dark Gradient Presentation Template for PowerPoint & Google Slides
Company Profile
Gradient SWOT Quadrant Diagram Template for PowerPoint & Google Slides
SWOT
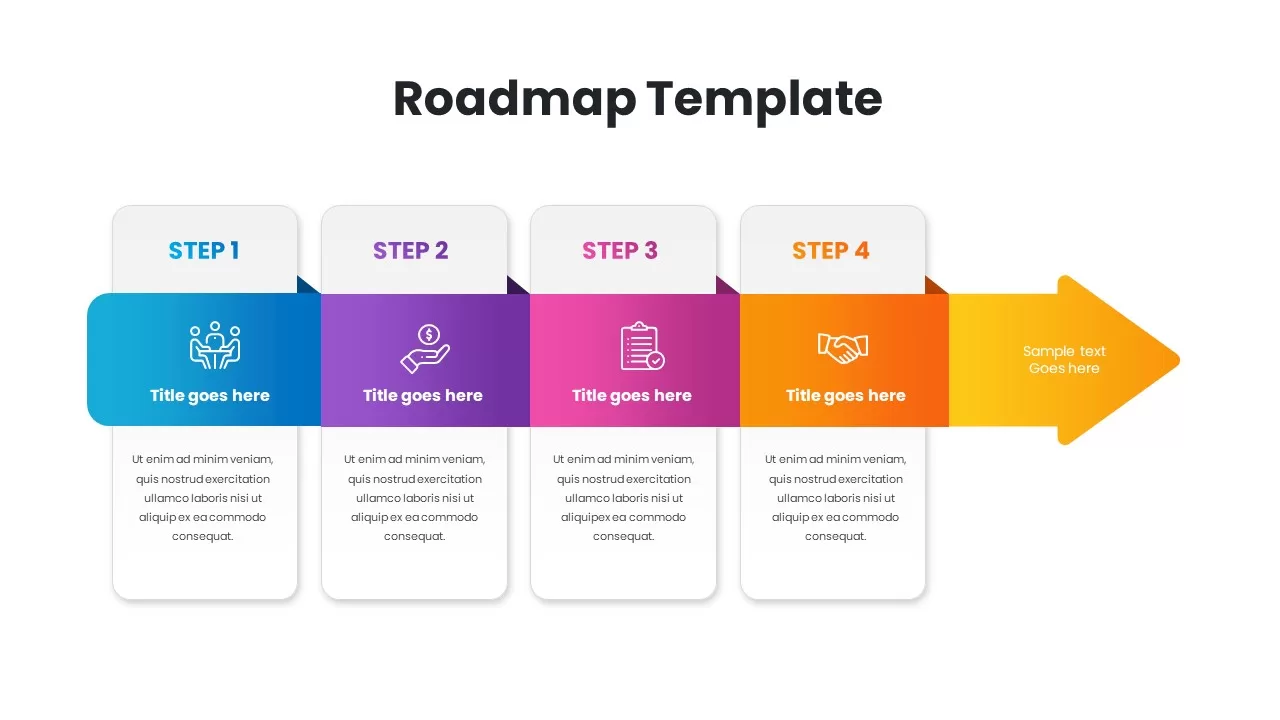
Gradient Four-Step Roadmap Diagram Template for PowerPoint & Google Slides
Roadmap
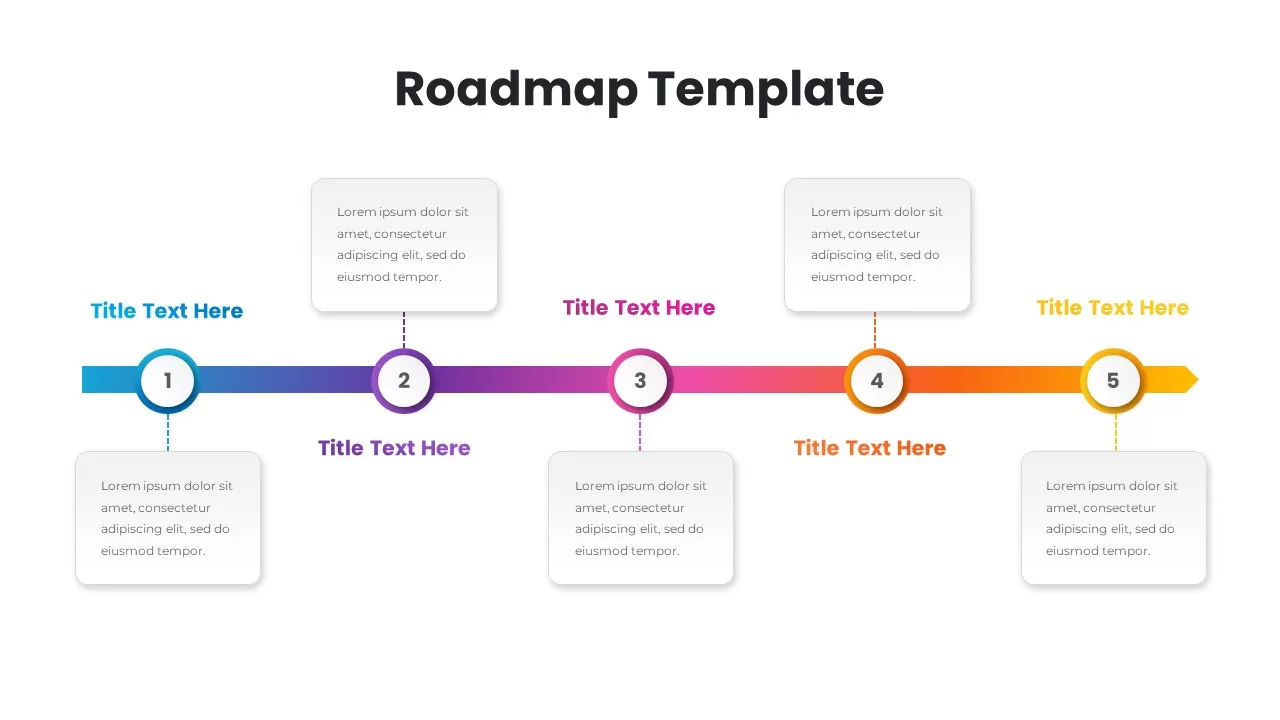
Gradient Five-Step Roadmap Diagram Template for PowerPoint & Google Slides
Roadmap
Duotone Gradient PowerPoint & Google Slides Template for Presentations
Technology
Light Duotone Gradient Business Plan PowerPoint & Google Slides Template
Company Profile

Gradient Business Plan Presentation Template for PowerPoint & Google Slides
Business Plan
Gradient Cloud Computing Dark Cover Template for PowerPoint & Google Slides
Pitch Deck
FinTech Industry Gradient Cover Template for PowerPoint & Google Slides
Pitch Deck
Modern Gradient Startup Pitch Deck Template for PowerPoint & Google Slides
Pitch Deck
Gradient Color Agenda Slide Bundle Template for PowerPoint & Google Slides
Agenda
Modern Gradient Business Plan Deck Template for PowerPoint & Google Slides
Pitch Deck
Vibrant Gradient VC Pitch Deck Template for PowerPoint & Google Slides
Pitch Deck
Gradient Business Strategy Pitch Deck Template for PowerPoint & Google Slides
Pitch Deck
Gradient Triangle Business Plan Deck Template for PowerPoint & Google Slides
Business Plan
IoT Technology Gradient Presentation Template for PowerPoint & Google Slides
Information Technology
Success Marketing Gradient Pamphlet Template for PowerPoint & Google Slides
Marketing
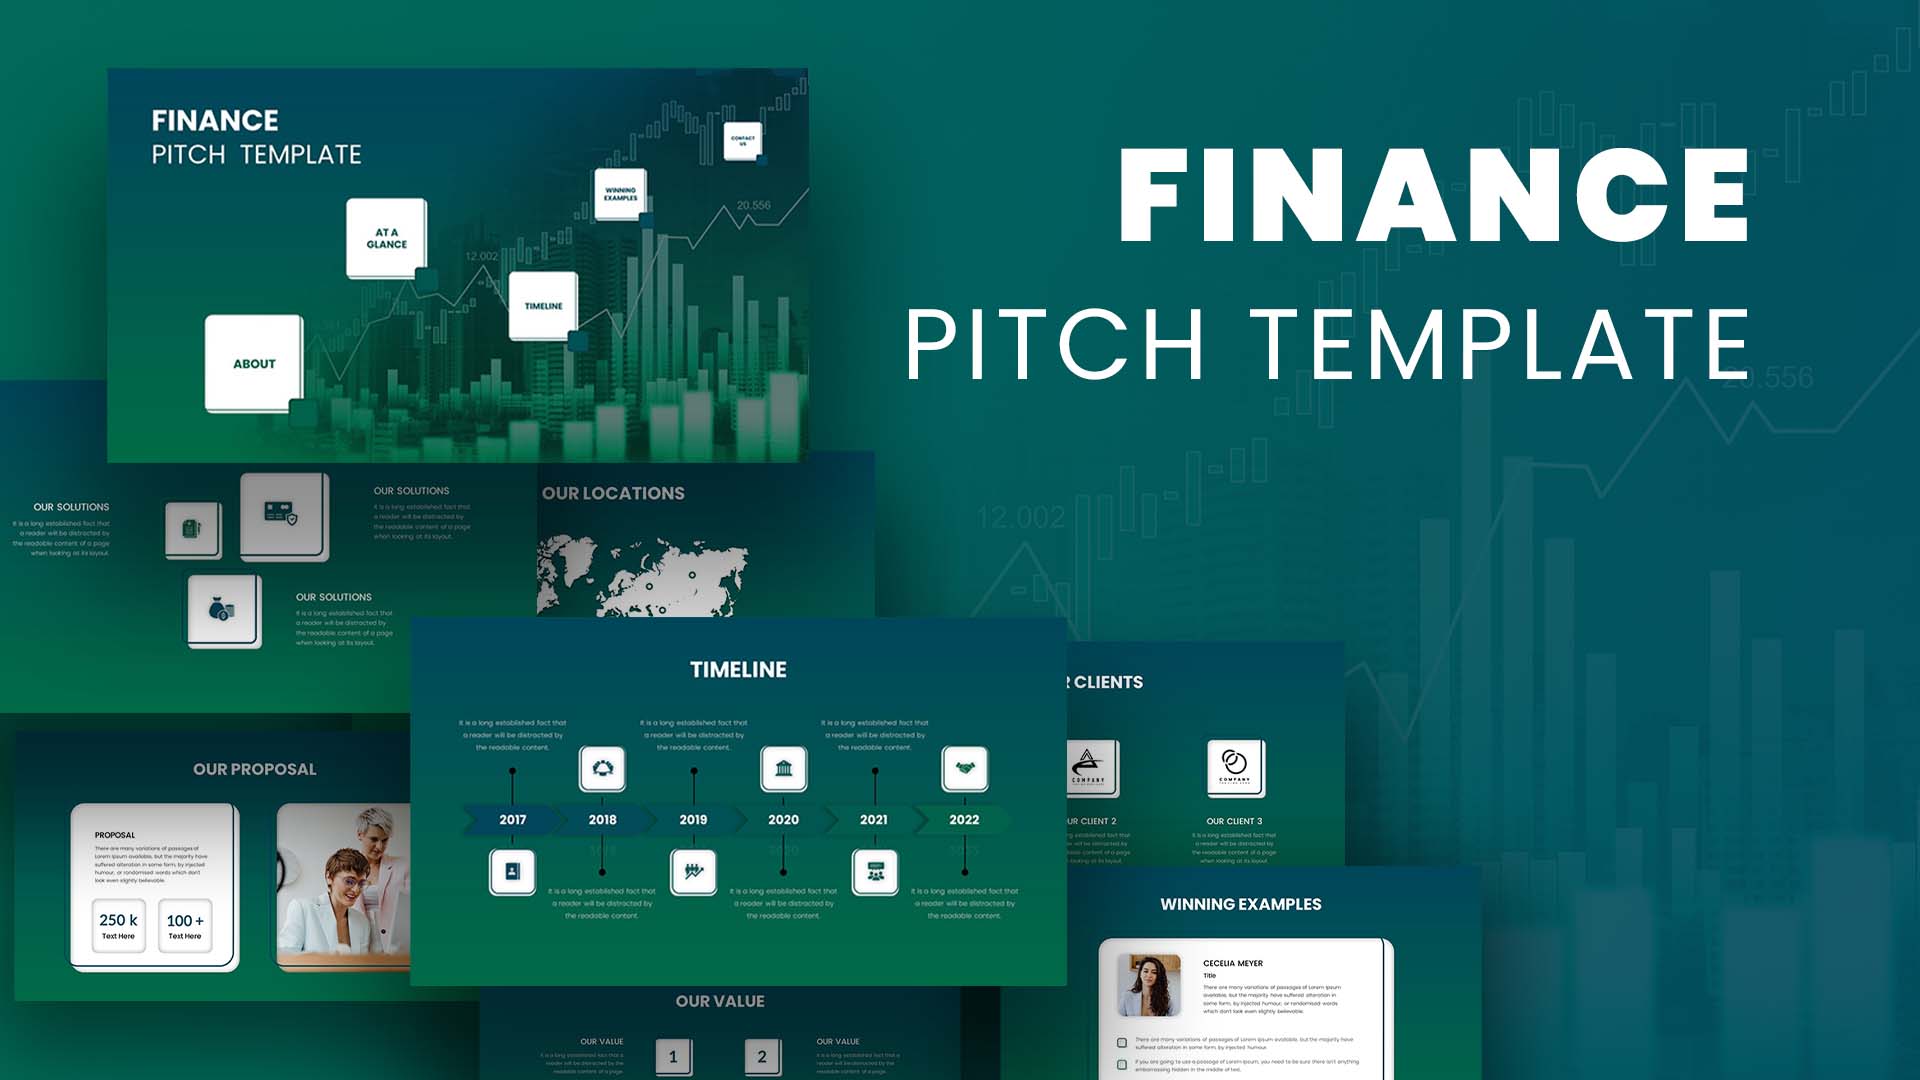
Finance Pitch Deck Template with Green Gradient for PowerPoint & Google Slides
Pitch Deck
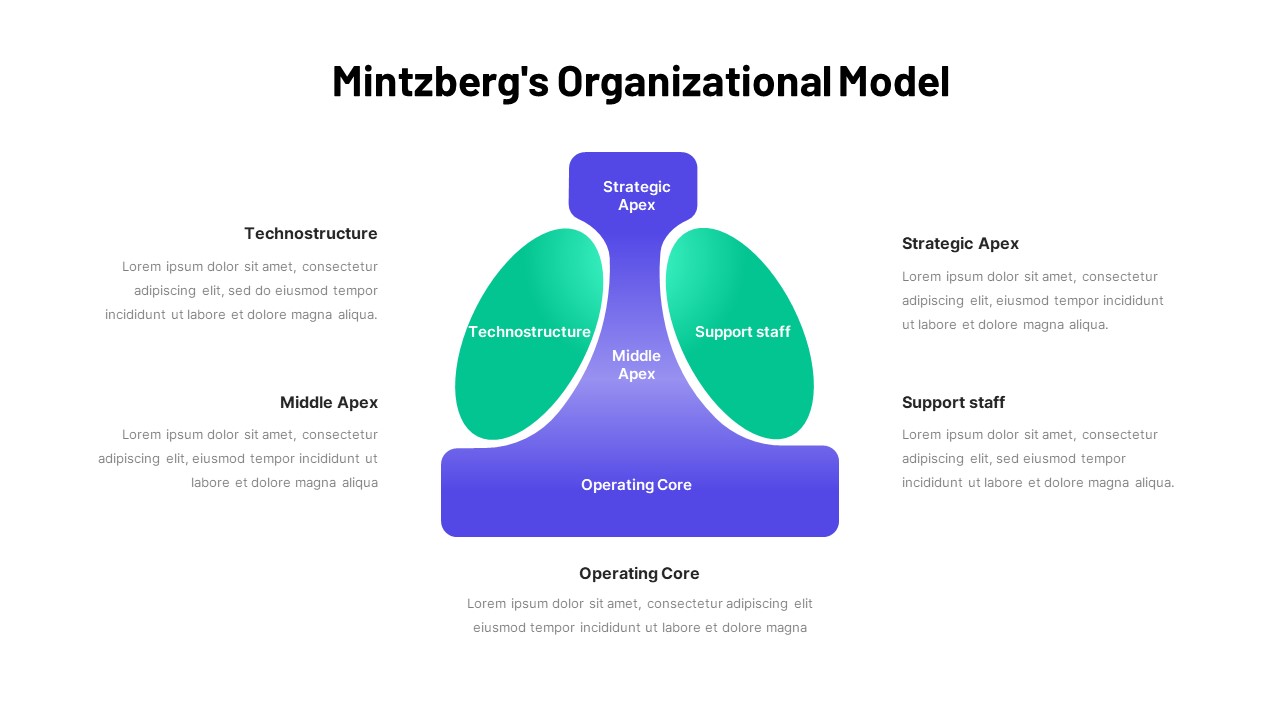
Mintzberg Organizational Model Gradient Template for PowerPoint & Google Slides
Business
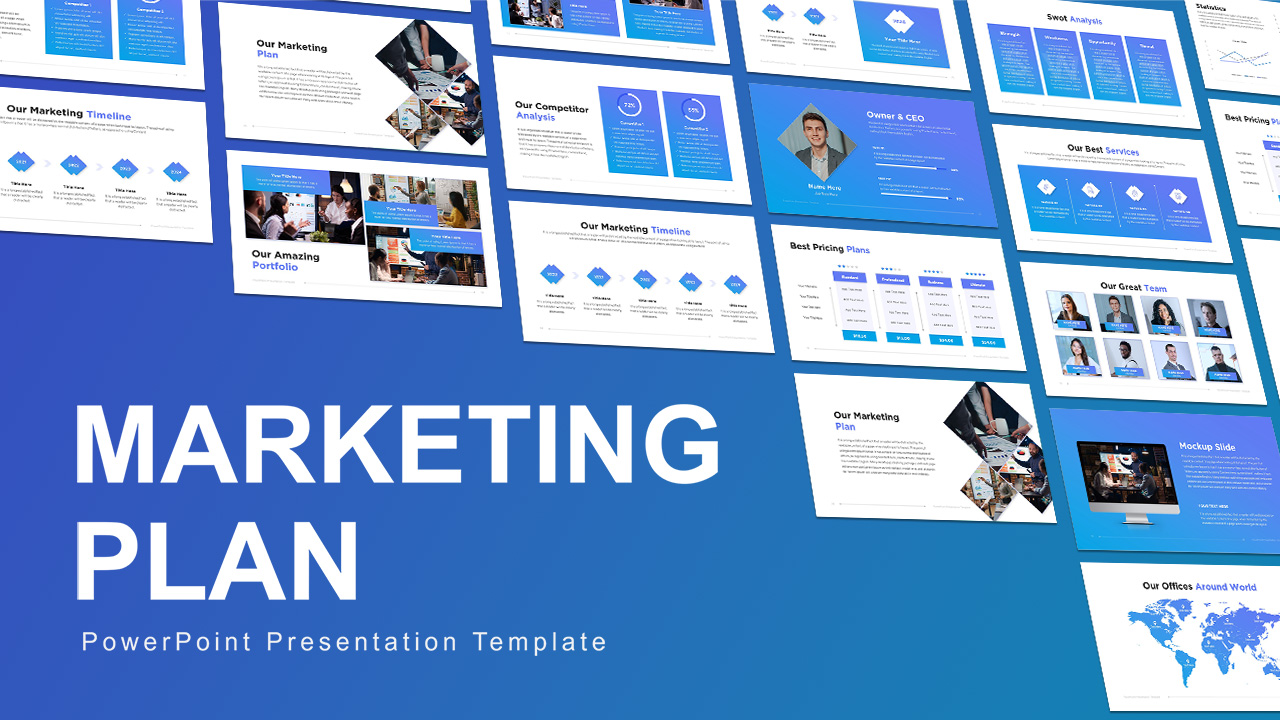
Free Blue Gradient Marketing Plan Slide Deck Template for PowerPoint & Google Slides
Marketing
Free
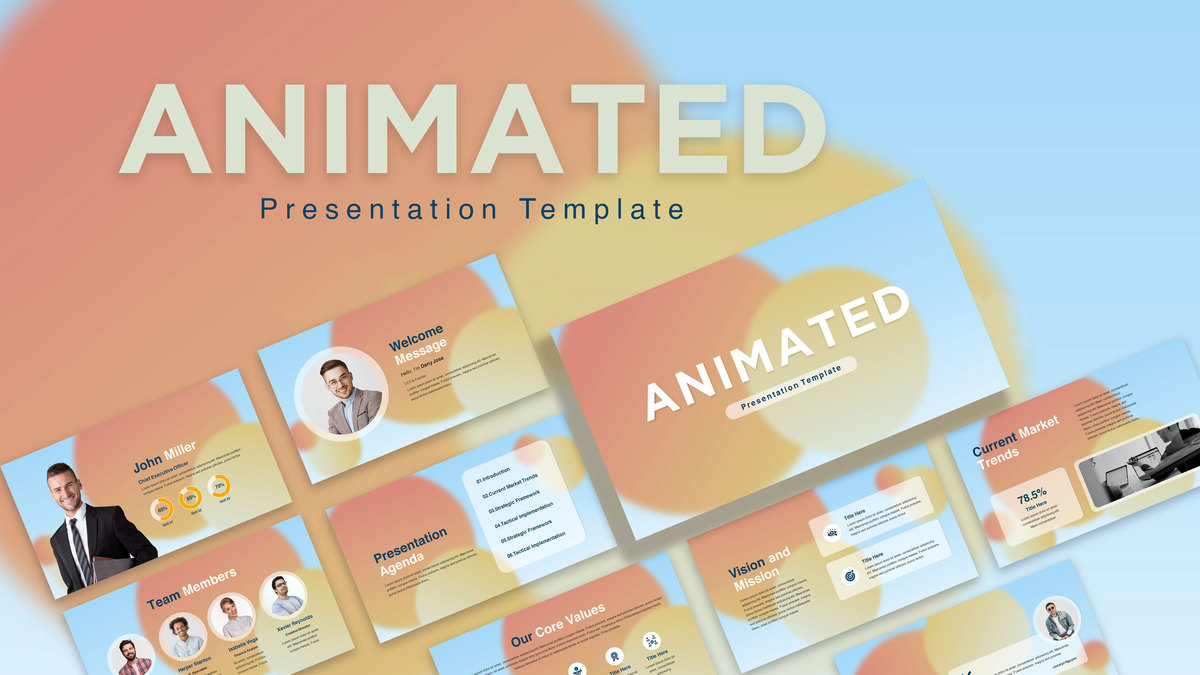
Free Animated Gradient Corporate Presentation Template for PowerPoint & Google Slides
Company Profile
Free
Galaxy Gradient Presentation Template for PowerPoint & Google Slides
Company Profile
Abstract Geometric Gradient Presentation Template for PowerPoint & Google Slides
Pitch Deck
Abstract Gradient Presentation Template for PowerPoint & Google Slides
Pitch Deck
Free Futuristic Neon Gradient Presentation Template for PowerPoint & Google Slides
Pitch Deck
Free
Free Gradient Seminar Workshop Template for PowerPoint & Google Slides
Free
Free
Cyber Security Dark Blue Gradient Template for PowerPoint & Google Slides
Information Technology
Pink Floral Gradient Background Template for PowerPoint & Google Slides
Graphics
Watercolor Splash Gradient Presentation Template for PowerPoint & Google Slides
Pitch Deck
Abstract Dark Gradient Presentation Template for PowerPoint & Google Slides
Pitch Deck
Green Organic Gradient Background Template for PowerPoint & Google Slides
Company Profile
Free Event Management Gradient Template for PowerPoint & Google Slides
Company Profile
Free
AI & Future of Work Gradient Cover Slide Template for PowerPoint & Google Slides
AI
Dark AI Ethics Gradient Diagram Template for PowerPoint & Google Slides
Infographics
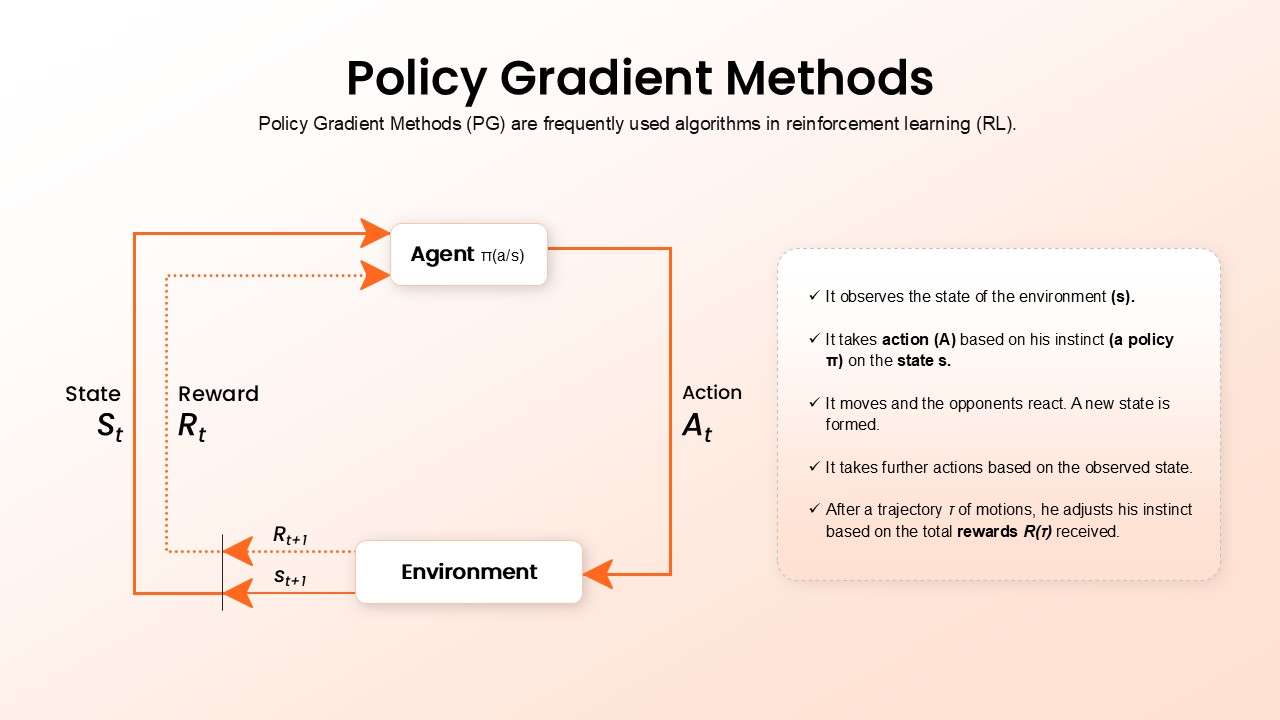
Policy Gradient Methods Flow Diagram Template for PowerPoint & Google Slides
AI
Neon Gradient SWOT Business Template for PowerPoint & Google Slides
SWOT
Active Gradient Business Pitch Deck for PowerPoint & Google Slides
Pitch Deck
Free
Blue Green Gradient Presentation for PowerPoint & Google Slides
Company Profile
Gradient Challenges and Opportunities Slide for PowerPoint & Google Slides
Opportunities Challenges
Free Gradient Backgrounds Presentation for PowerPoint & Google Slides
Graphics
Free
Free Gradient User Persona Profile Slide for PowerPoint & Google Slides
Recruitment
Free
Vibrant Abstract Gradient Theme for PowerPoint & Google Slides
Decks
Fintech Gradient Slide Deck for PowerPoint & Google Slides
Decks
Business Coach Gradient Deck for PowerPoint & Google Slides
Business

Gradient Abstract Business Deck for PowerPoint & Google Slides
Decks
Quad Chart Infographic Pack of 8 Slides Template for PowerPoint & Google Slides
Comparison Chart
Free Professional Gantt Chart Pack – 4 Slides Template for PowerPoint & Google Slides
Gantt Chart
Free
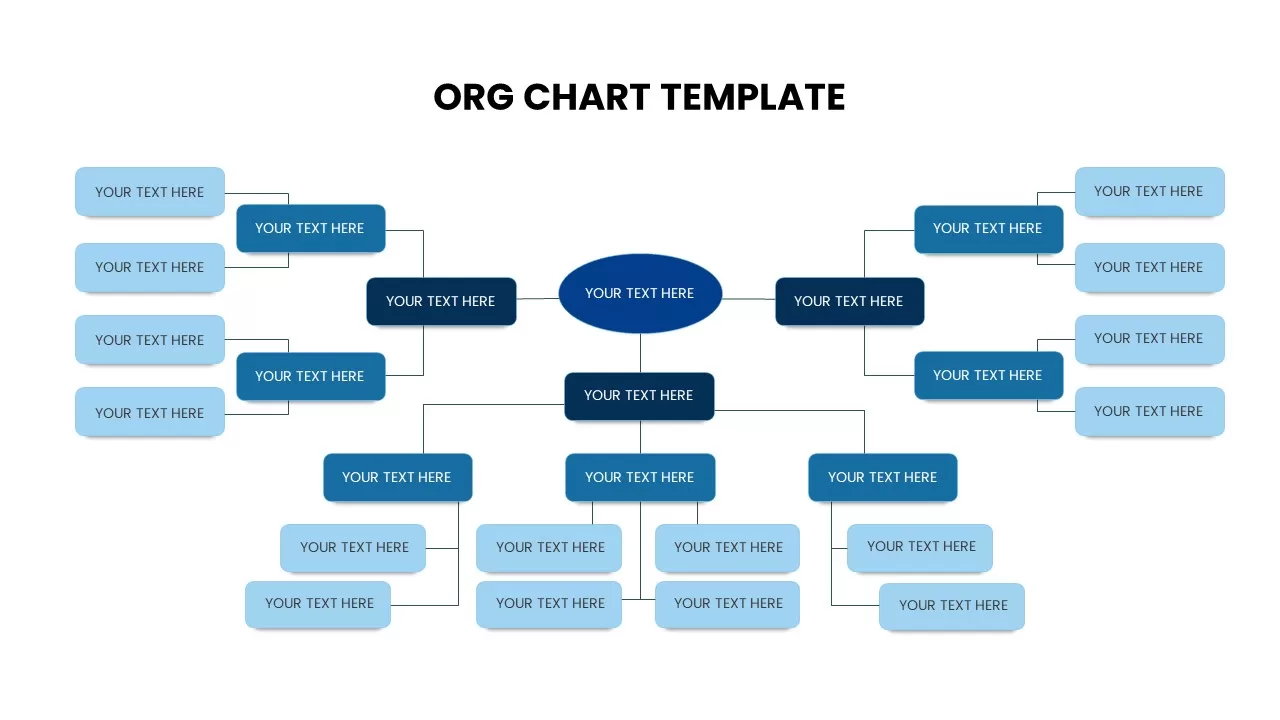
Organization Chart template for PowerPoint & Google Slides
Org Chart
Market Development Matrix Chart Template for PowerPoint & Google Slides
Comparison Chart
Organization Chart Overview template for PowerPoint & Google Slides
Org Chart
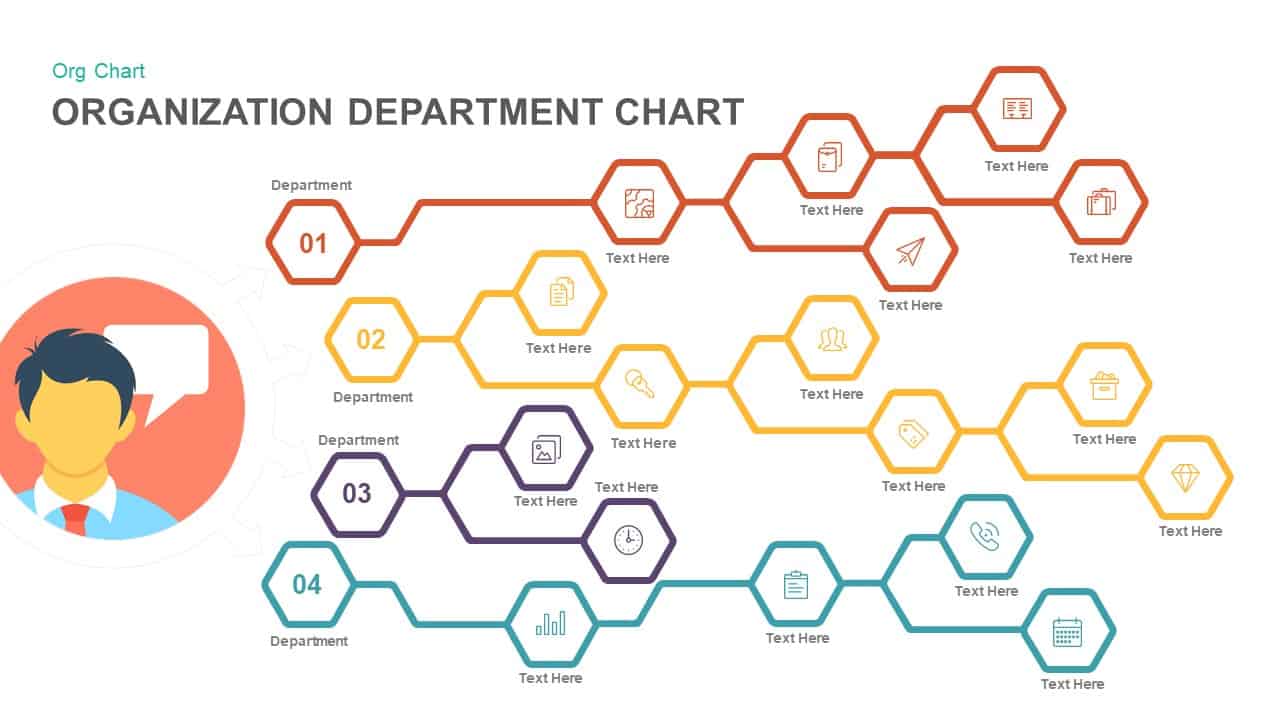
Organization Department Hexagon Chart Template for PowerPoint & Google Slides
Org Chart
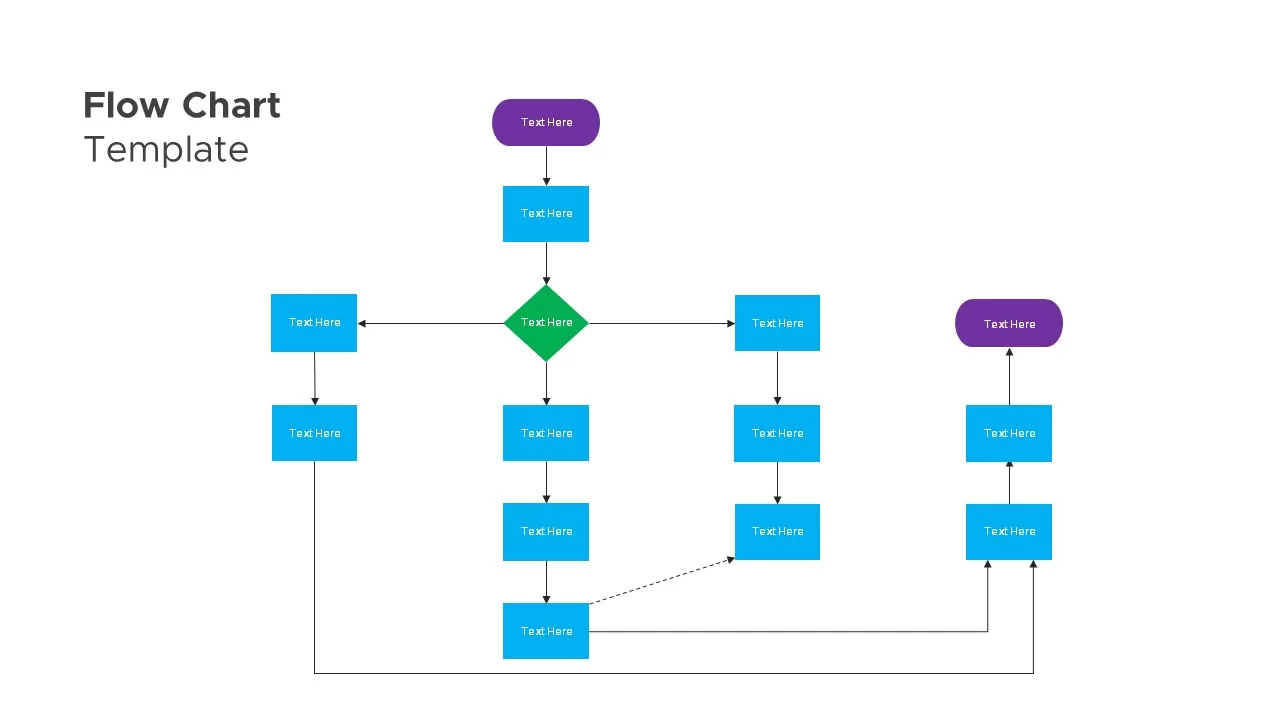
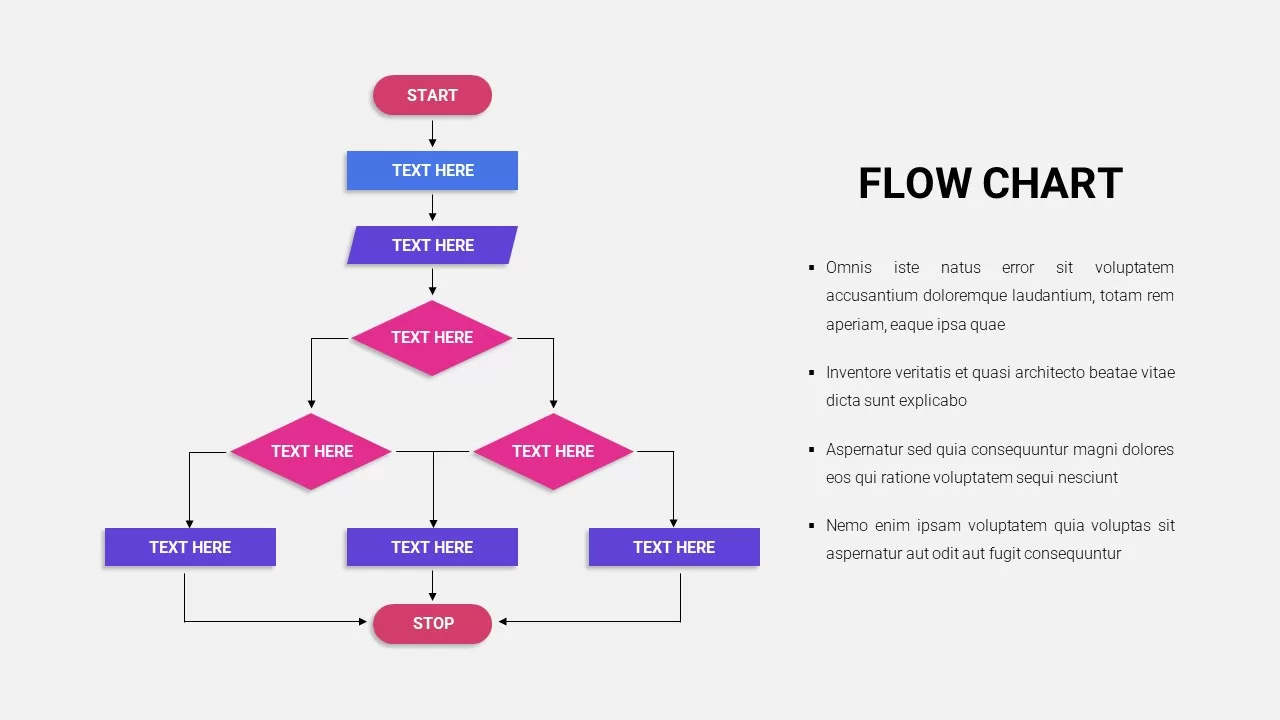
Flow Chart Diagram Template for PowerPoint & Google Slides
Flow Charts
30-60-90 Day Donut Chart Plan Infographic Template for PowerPoint & Google Slides
Timeline
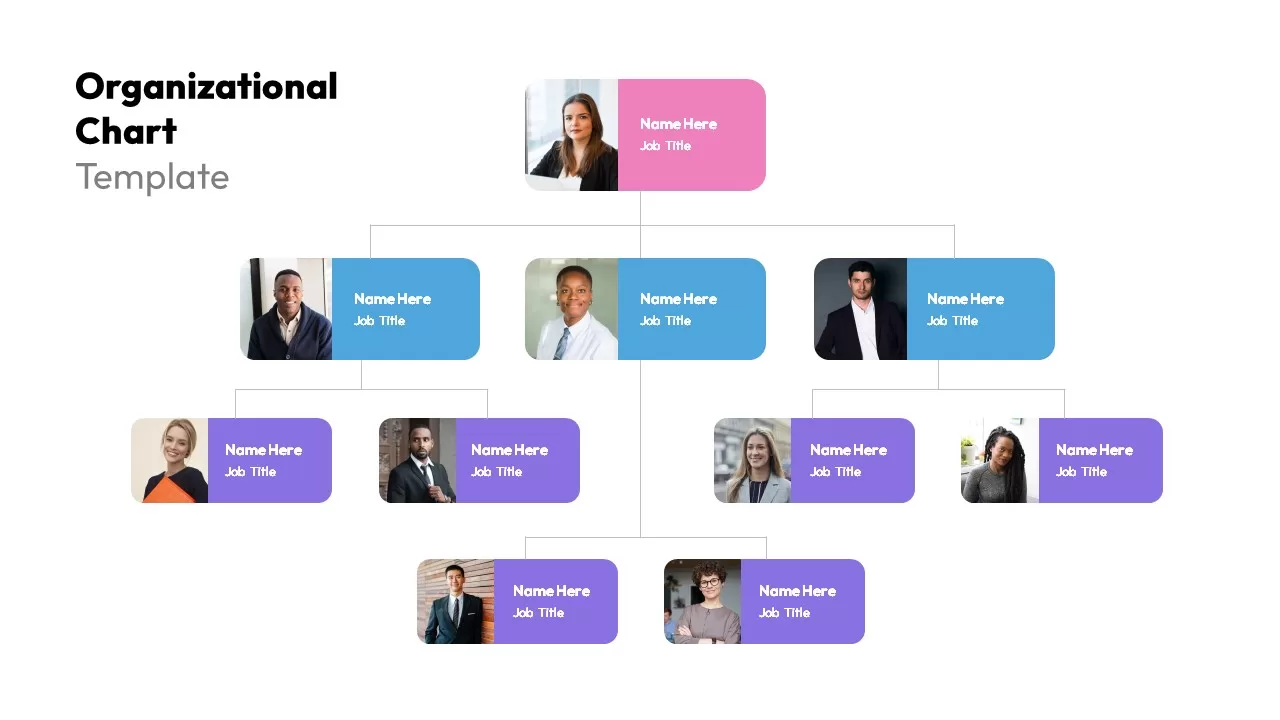
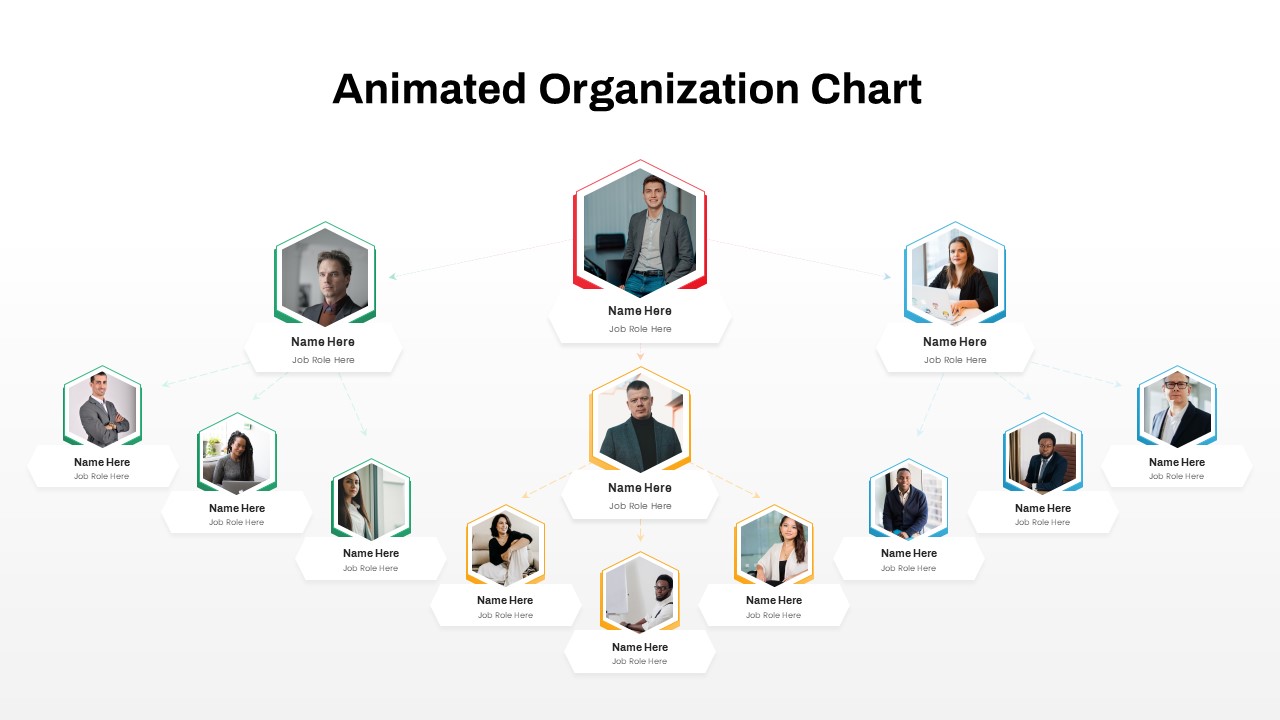
Modern Image-Based Organizational Chart Template for PowerPoint & Google Slides
Infographics
Organizational Chart Overview template for PowerPoint & Google Slides
Org Chart
Flow Chart Template for PowerPoint & Google Slides
Flow Charts
Flow Chart Template for PowerPoint & Google Slides
Flow Charts
Free Circular Multi-Step Flow Chart Diagram Template for PowerPoint & Google Slides
Flow Charts
Free
Free Curved Arrow Progress Chart template for PowerPoint & Google Slides
Project
Free
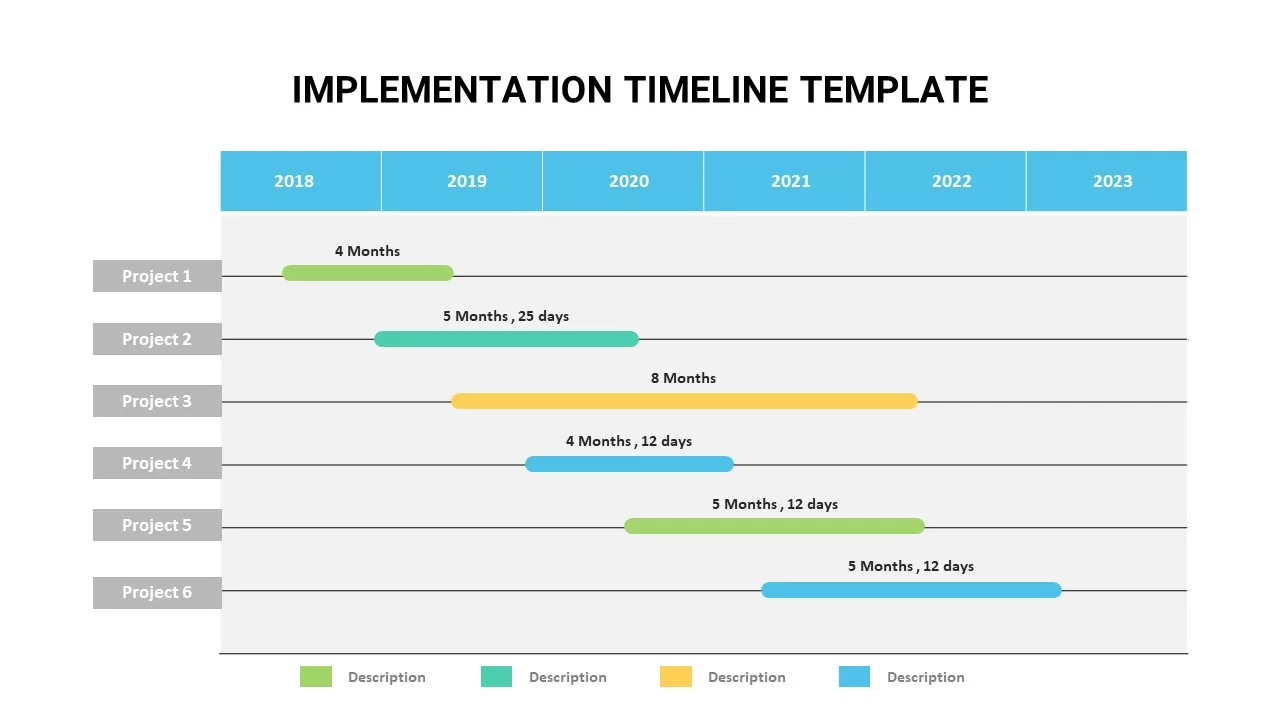
Animated Implementation Timeline Chart Template for PowerPoint & Google Slides
Timeline
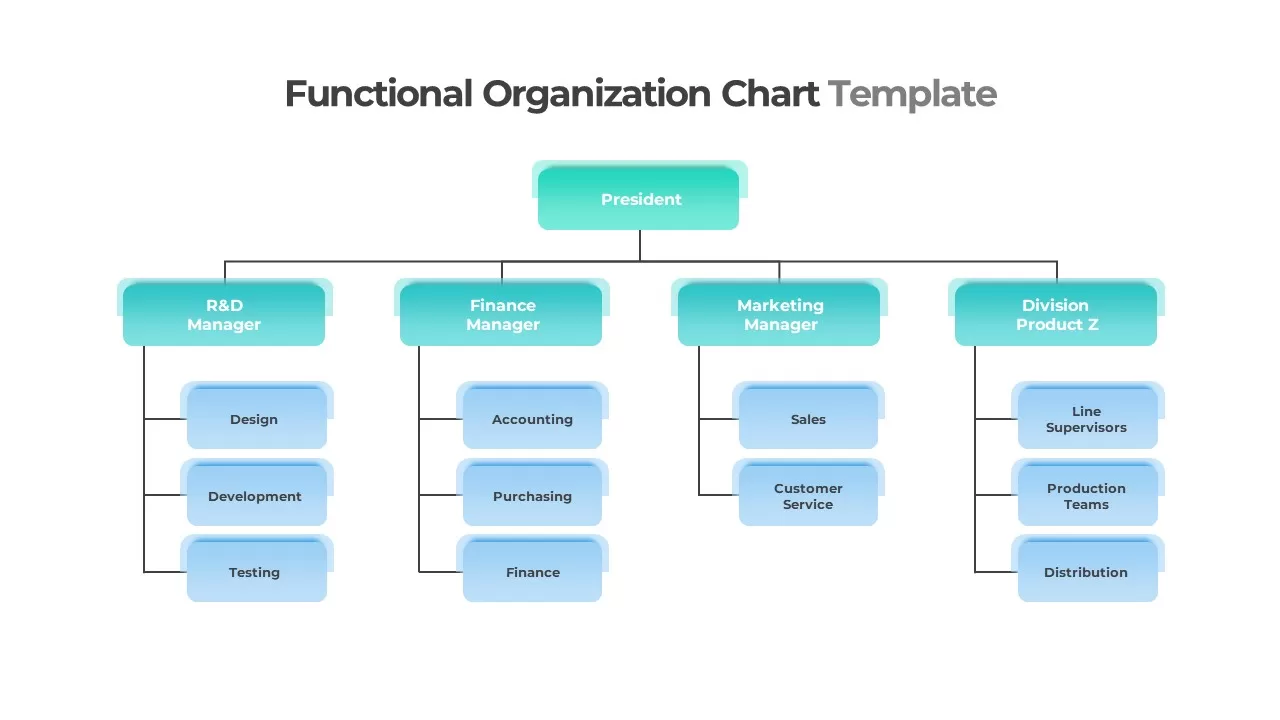
Functional Organization Chart Structure Template for PowerPoint & Google Slides
Org Chart
Free Stacked Column Chart Data Visualization Template for PowerPoint & Google Slides
Bar/Column
Free
Animated Stacked Bar Chart Template for PowerPoint & Google Slides
Bar/Column
Clustered Bar Chart Comparison Template for PowerPoint & Google Slides
Bar/Column
Simple Area Chart Data Trends Analysis Template for PowerPoint & Google Slides
Comparison Chart
Growth Curve Line Chart Visualization Template for PowerPoint & Google Slides
Charts
Year-over-Year Stacked Gender Bar Chart Template for PowerPoint & Google Slides
Bar/Column
Animated Hexagon Org Chart Diagram Template for PowerPoint & Google Slides
Org Chart
Multi-Variation Thermometer Chart Template for PowerPoint & Google Slides
Bar/Column
Wastewater Treatment Process Flow Chart Template for PowerPoint & Google Slides
Flow Charts
Multi-Level Wheel Chart Diagram template for PowerPoint & Google Slides
Pie/Donut
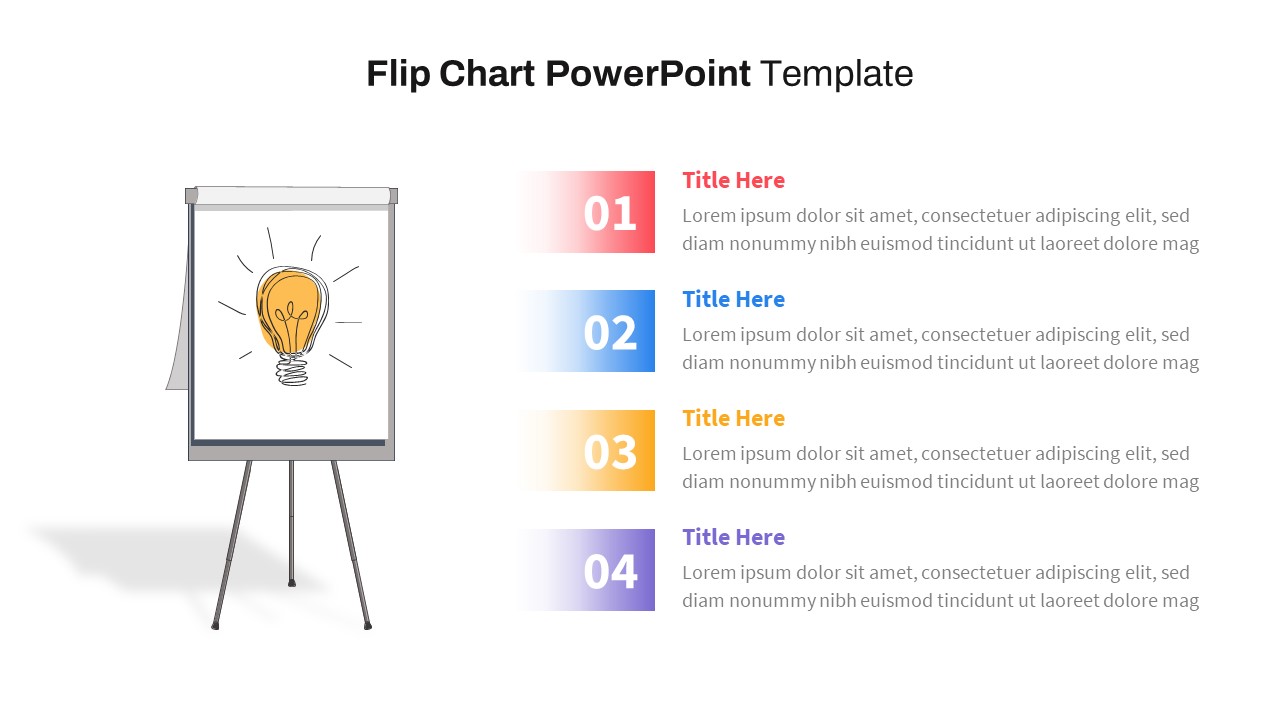
Flip Chart Four-Step List Layout Template for PowerPoint & Google Slides
Process
Dynamic Financial Analysis Line Chart Template for PowerPoint & Google Slides
Finance
Professional Table of Organization Chart Template for PowerPoint & Google Slides
Org Chart
Feasibility Matrix Comparison Chart Template for PowerPoint & Google Slides
Comparison Chart
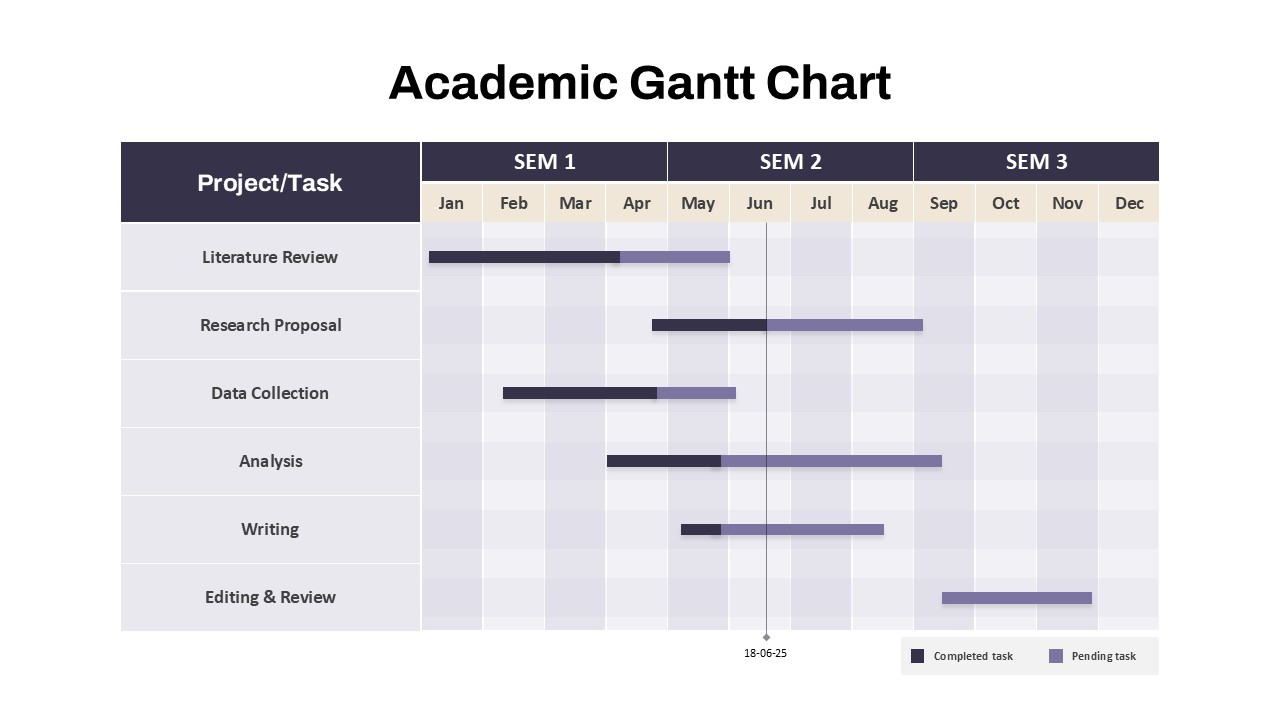
Academic Gantt Chart template for PowerPoint & Google Slides
Business
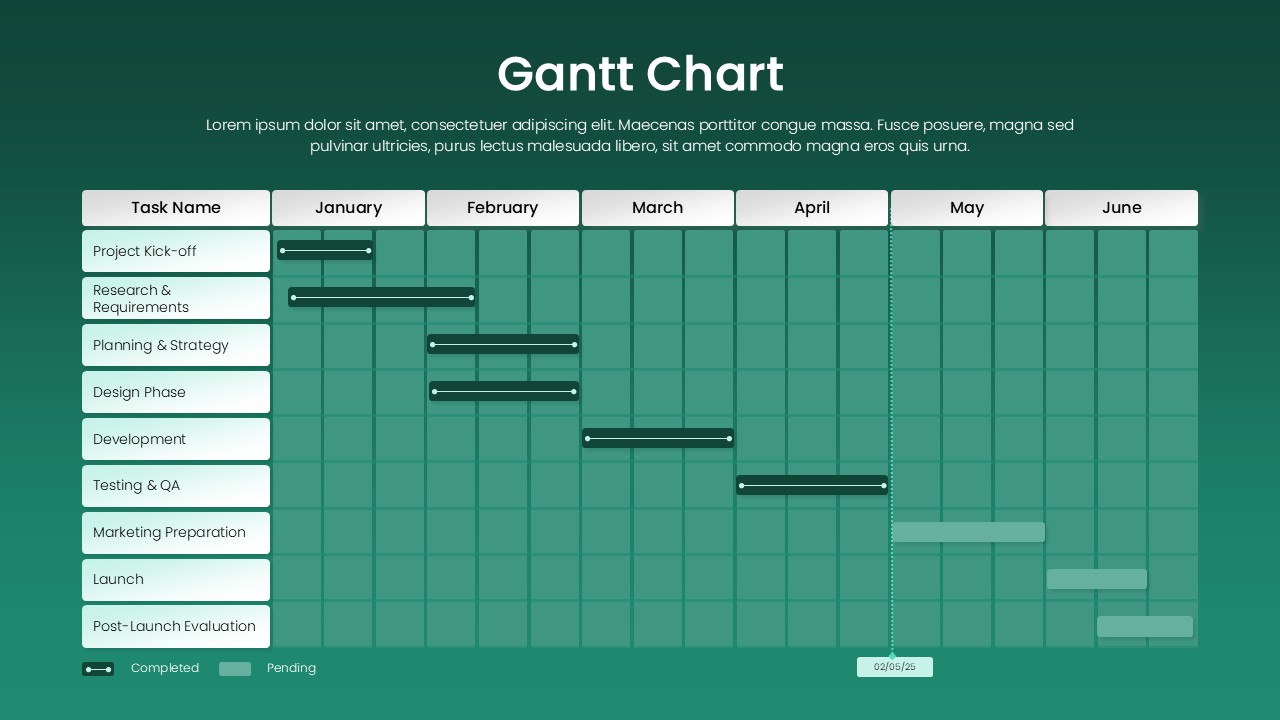
Green Gantt Chart Template for PowerPoint & Google Slides
Gantt Chart
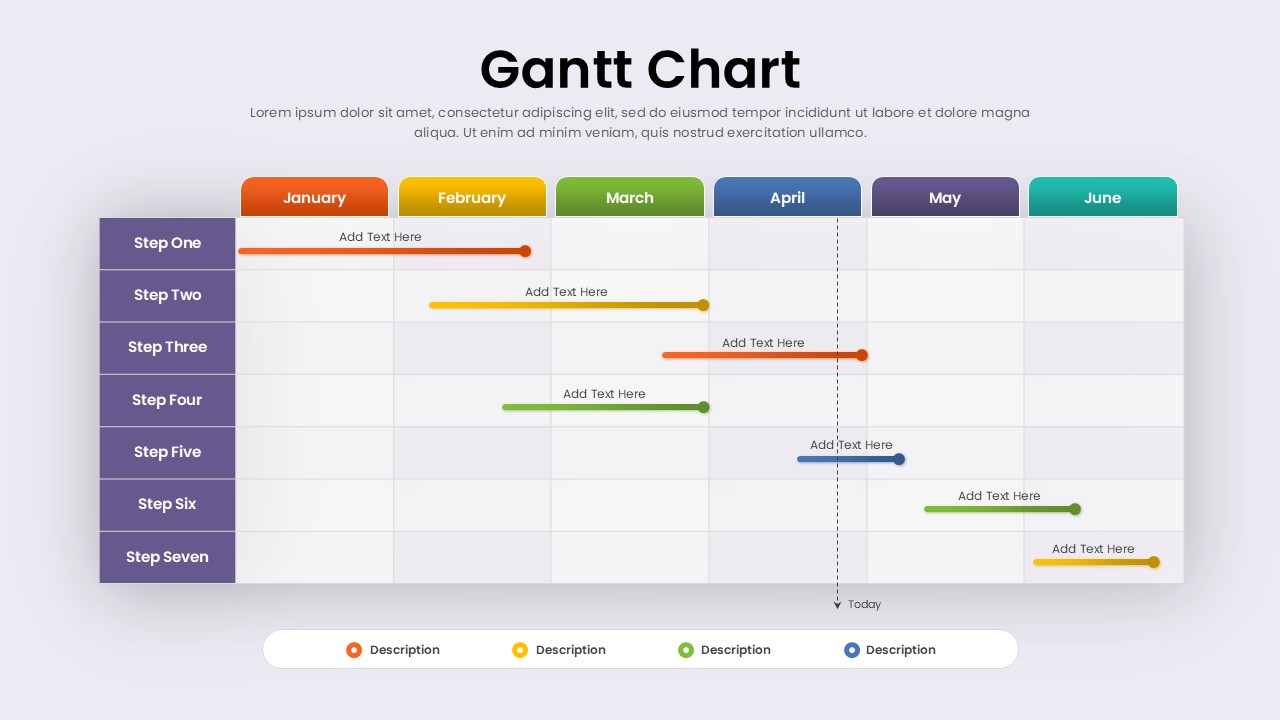
Colorful Annual Gantt Chart Project Planner Template for PowerPoint & Google Slides
Gantt Chart
7 Step 6 Month Gantt Chart Timeline Template for PowerPoint & Google Slides
Gantt Chart