Quarterly Roadmap Timeline Infographic Template for PowerPoint & Google Slides


Description
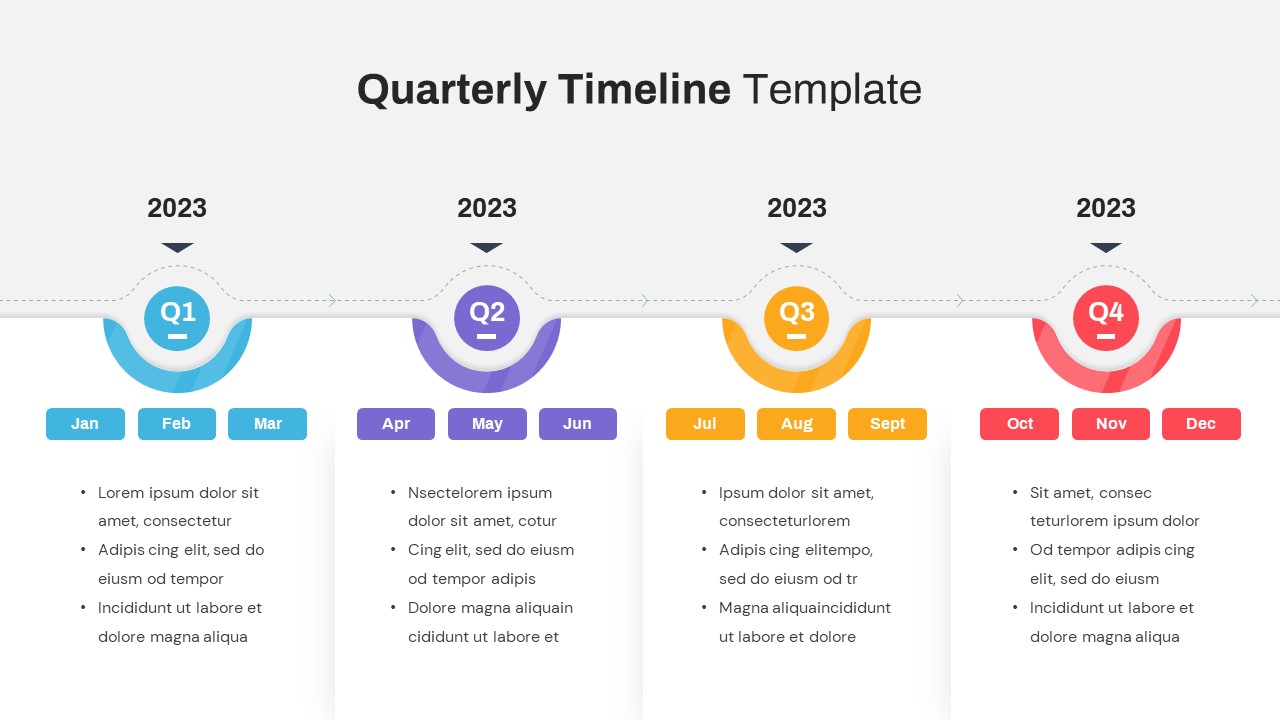
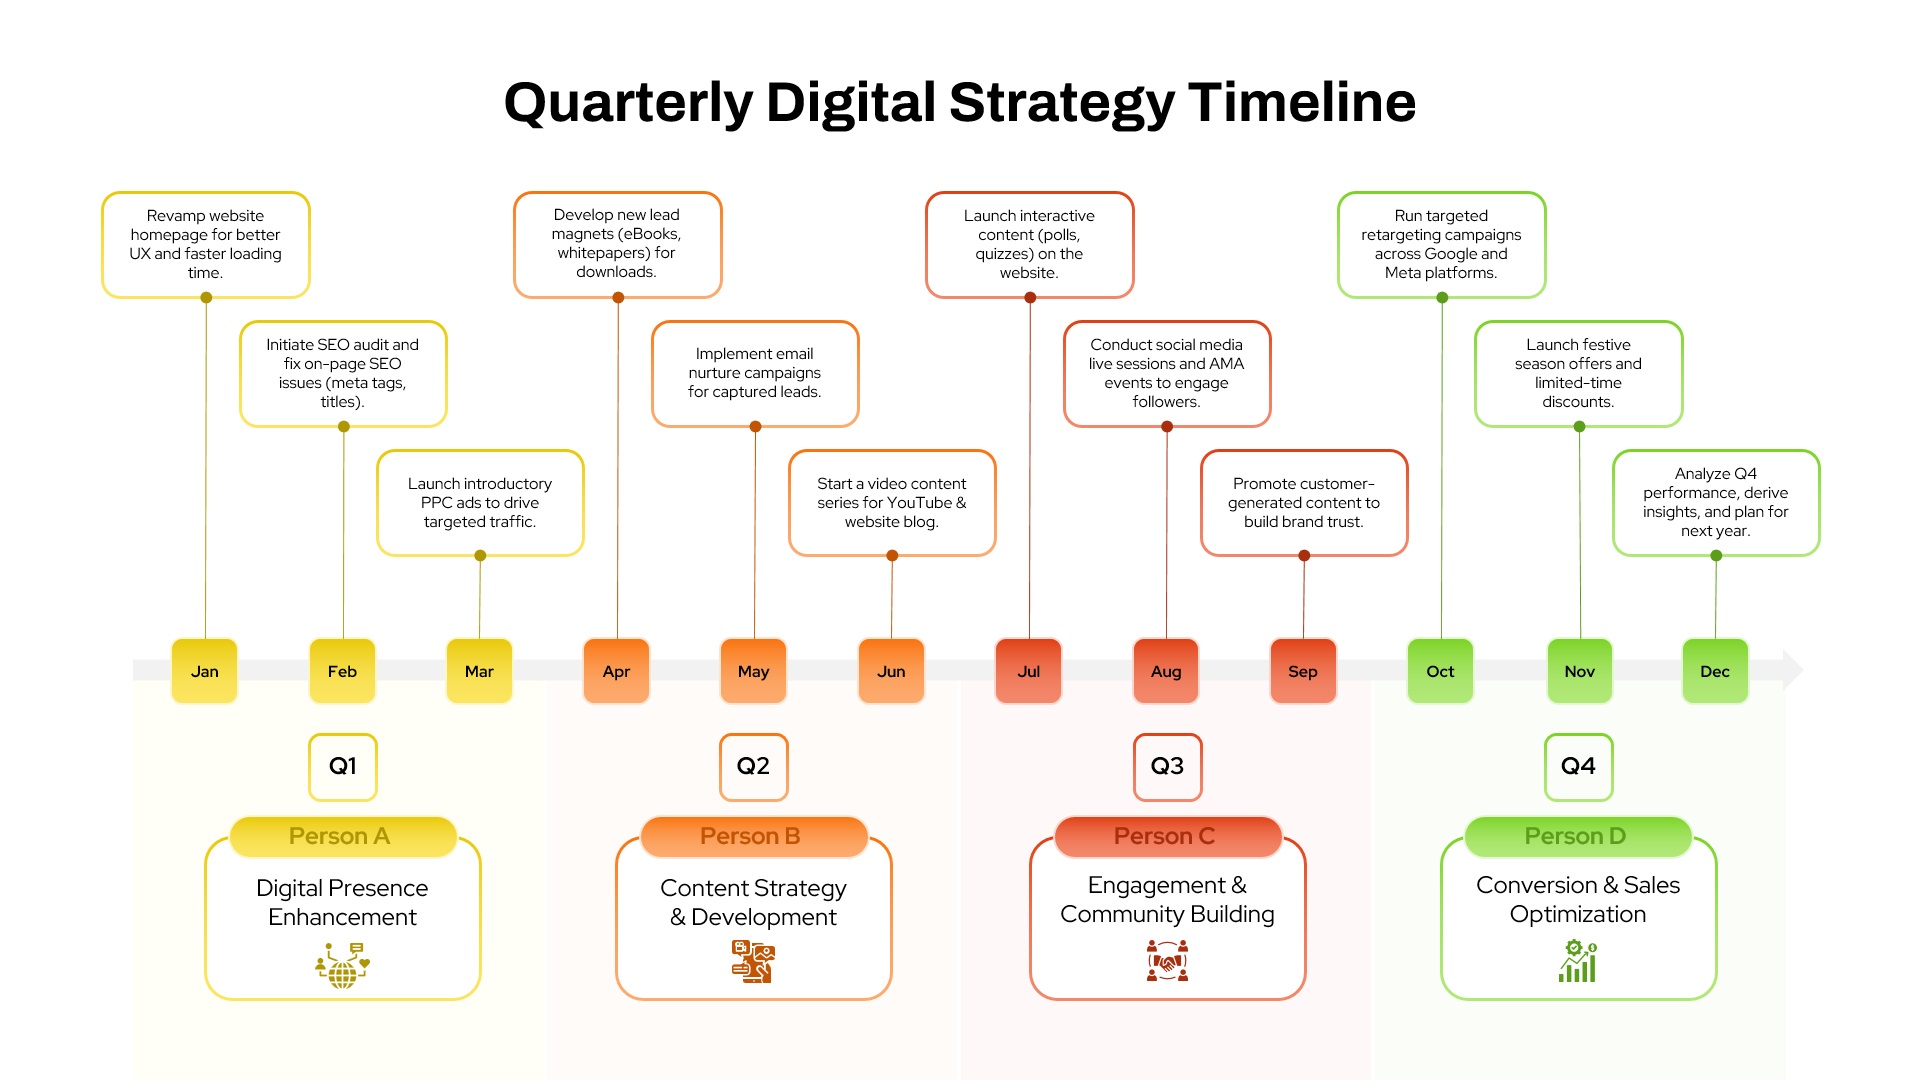
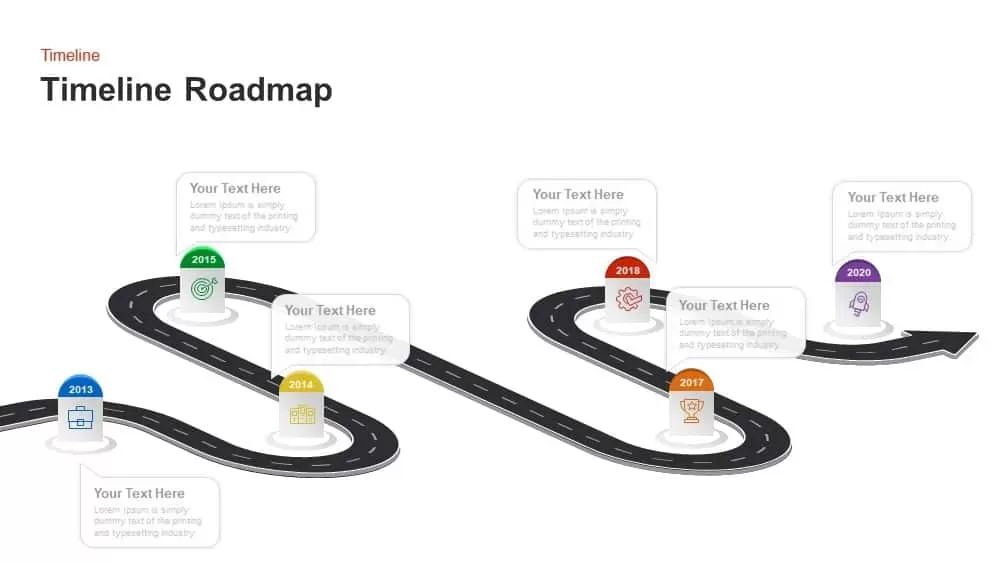
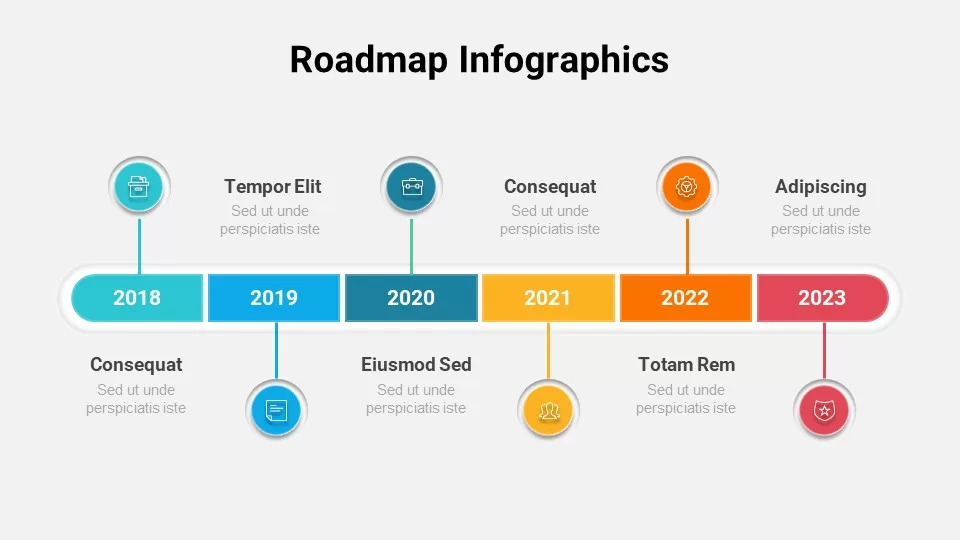
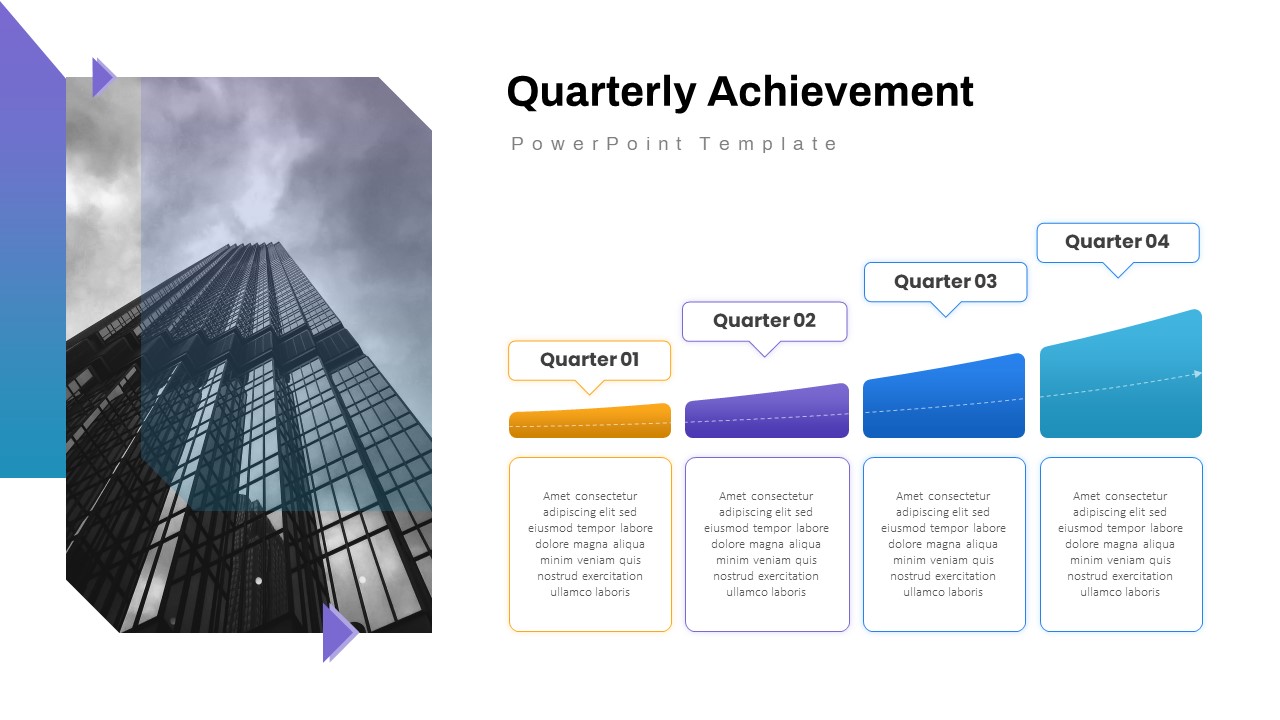
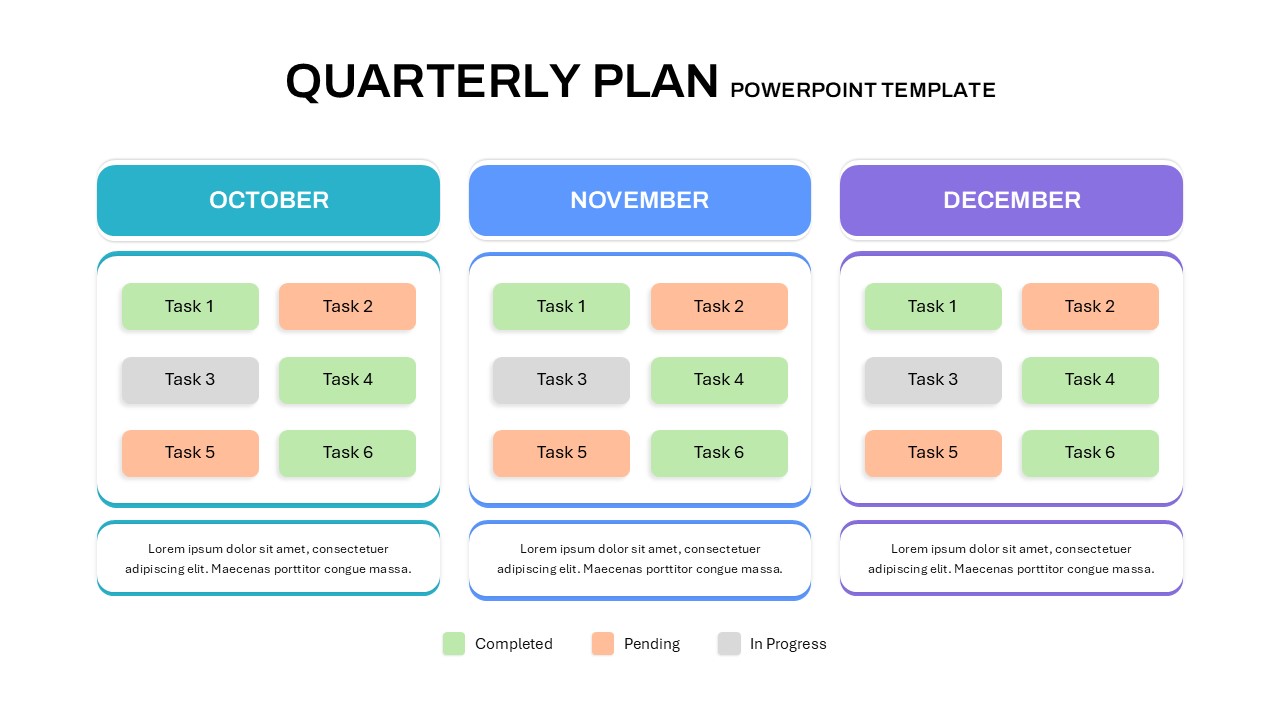
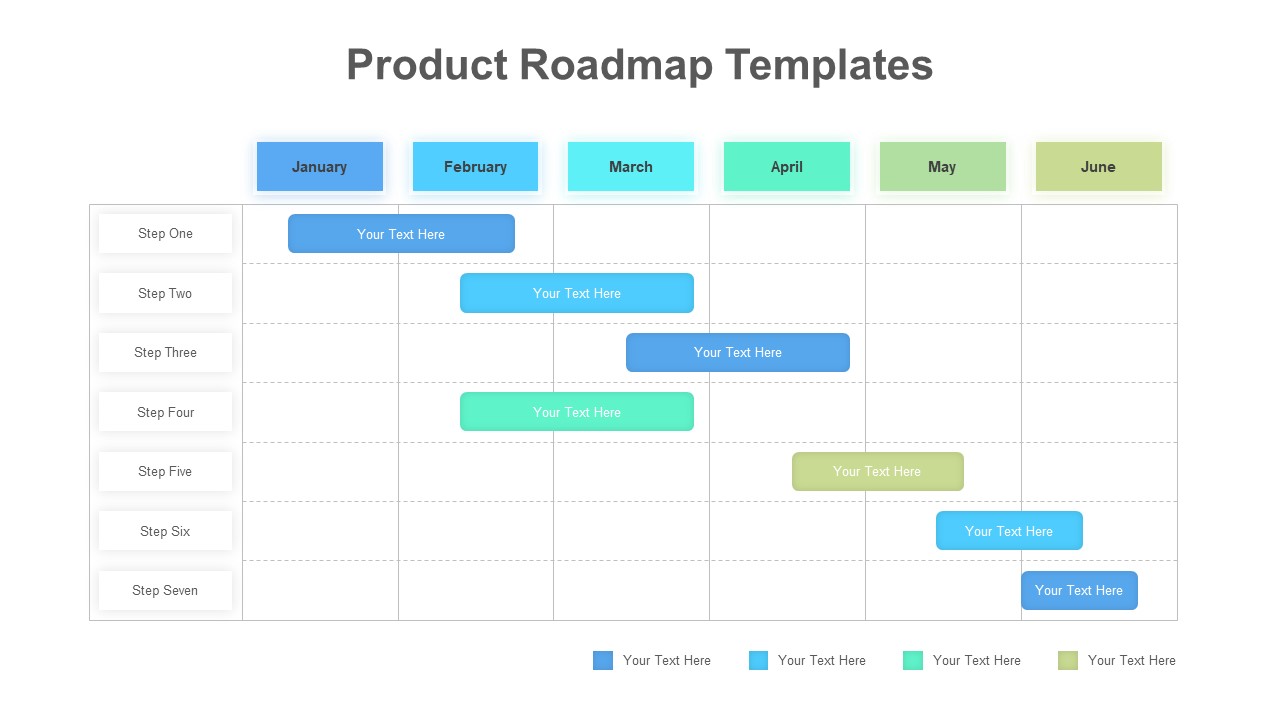
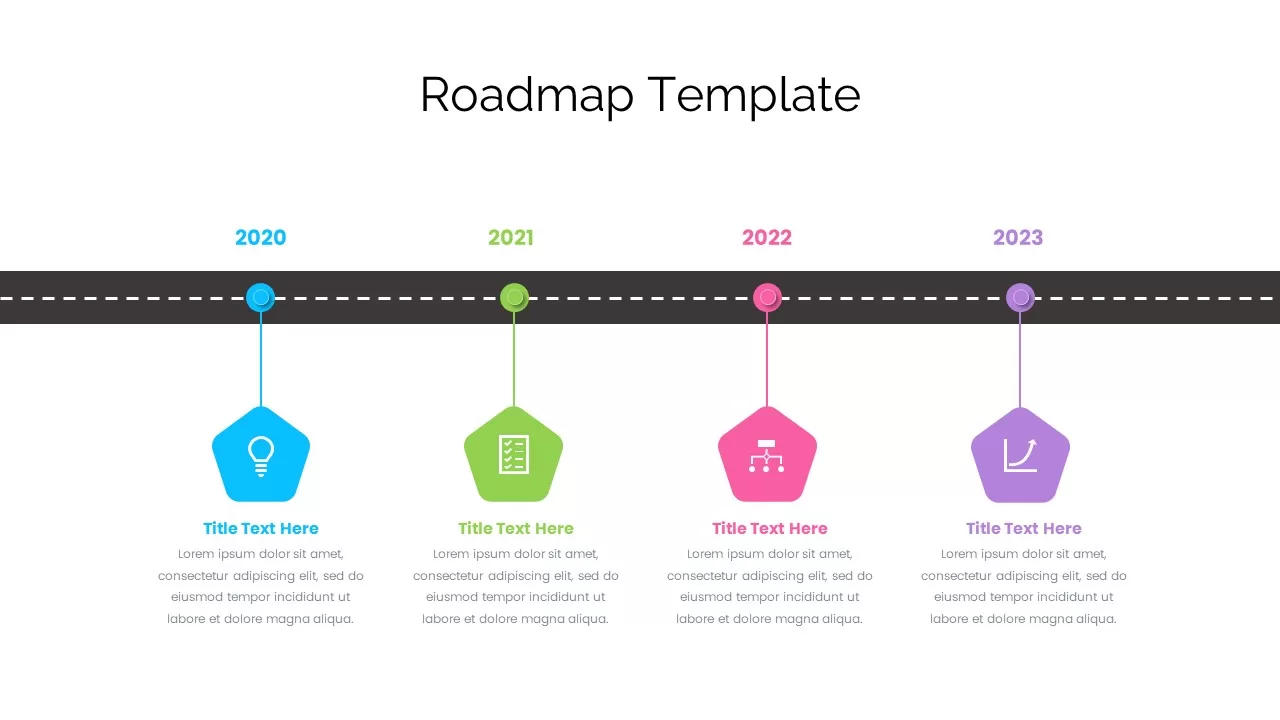
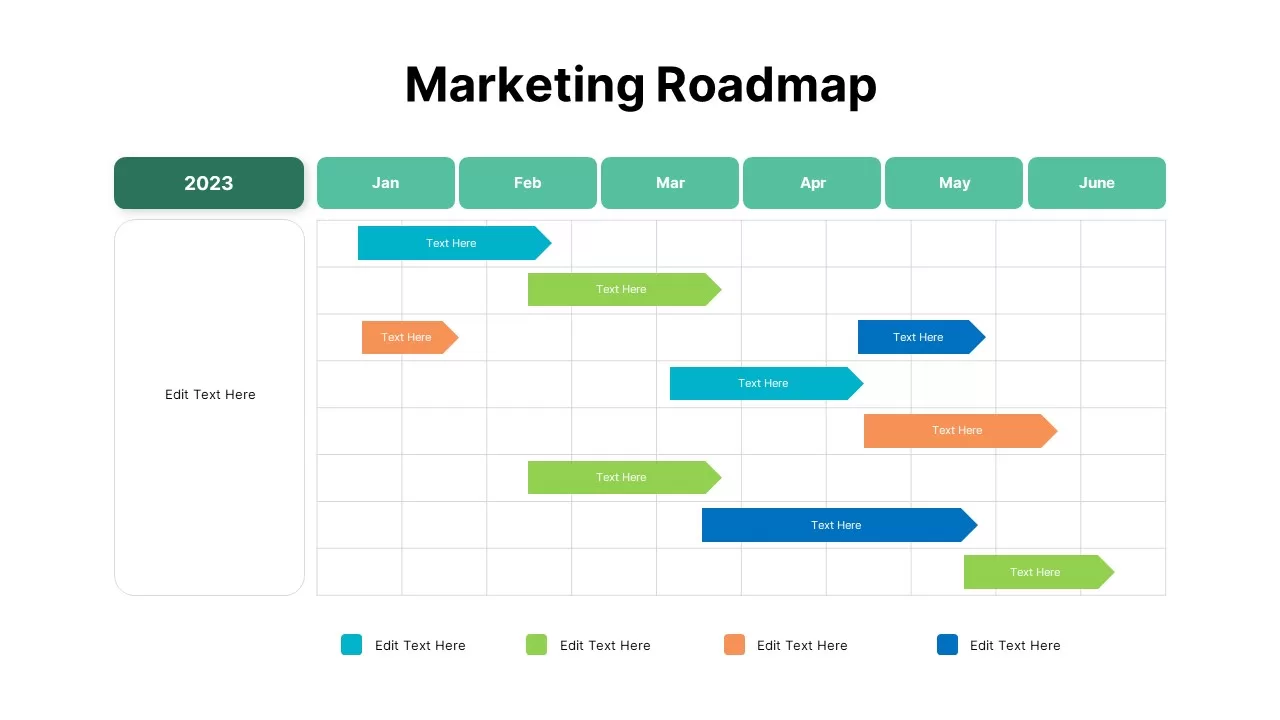
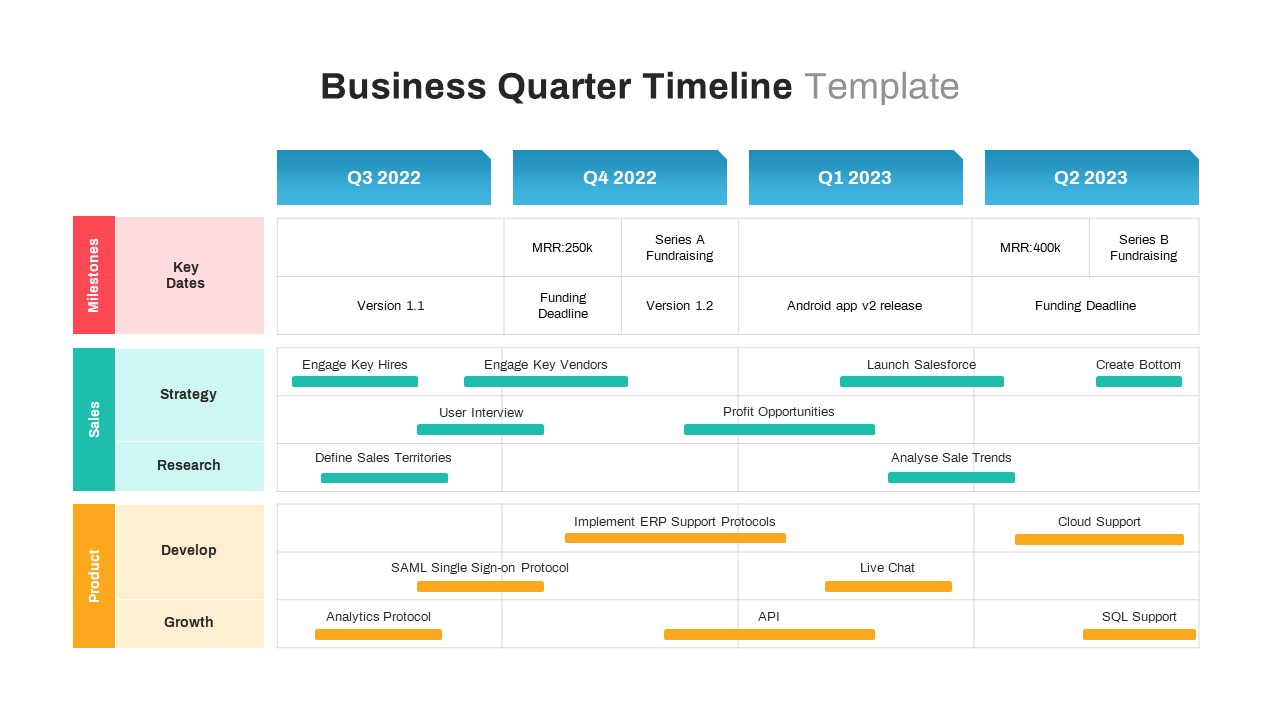
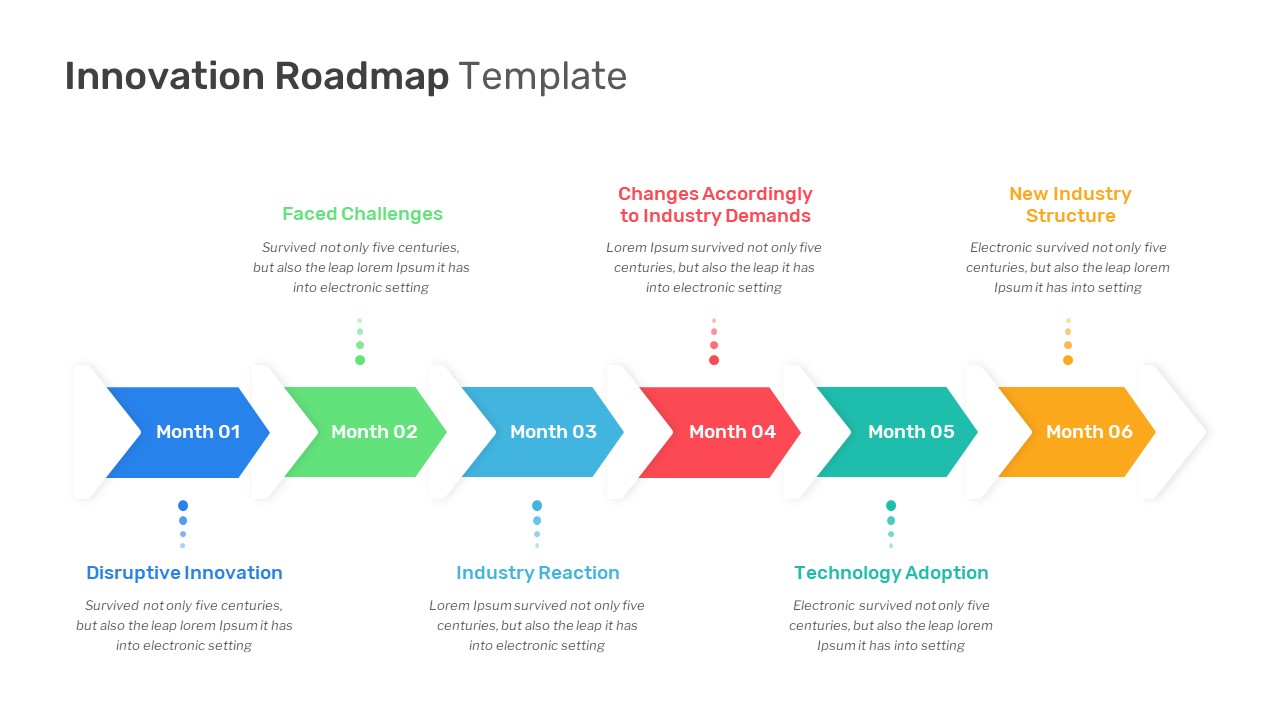
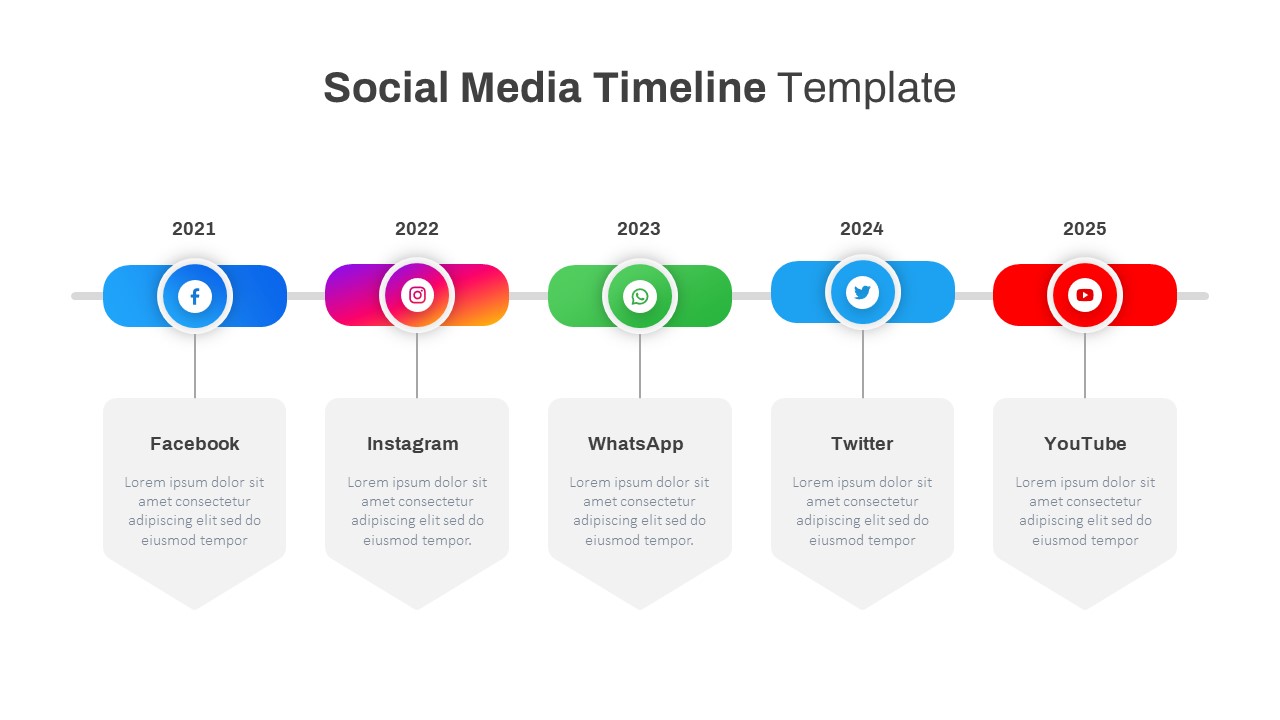
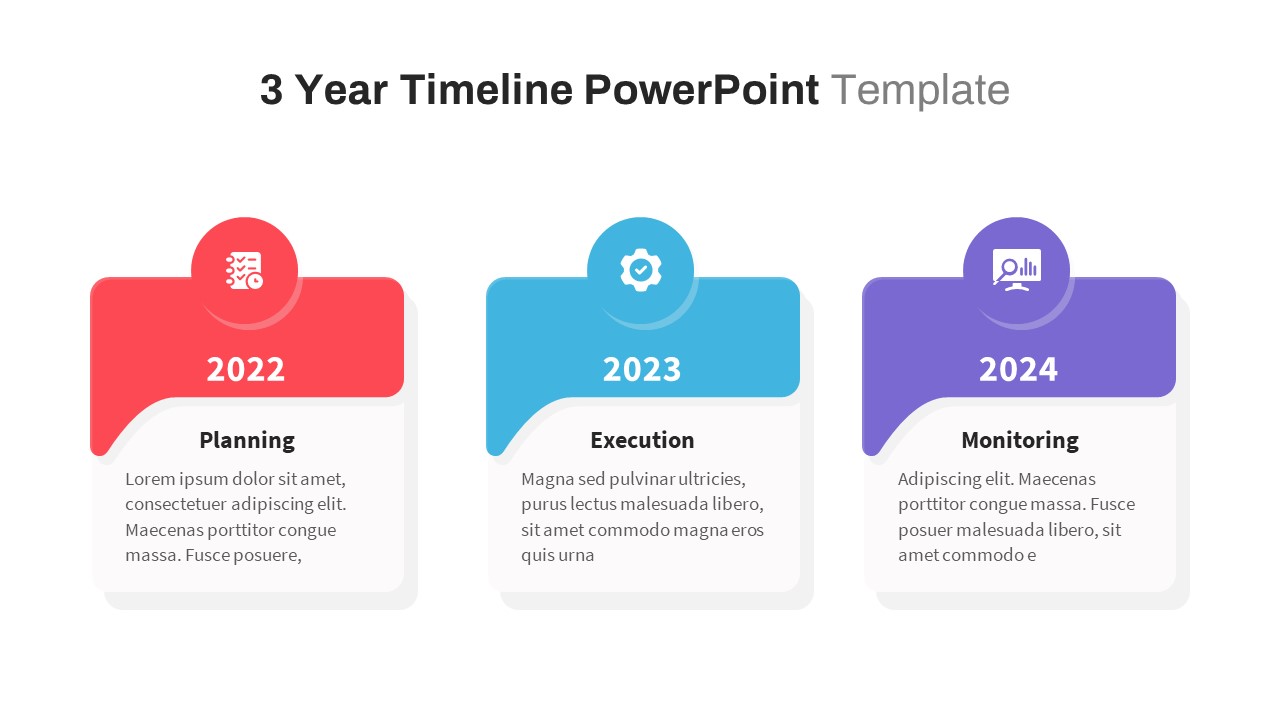
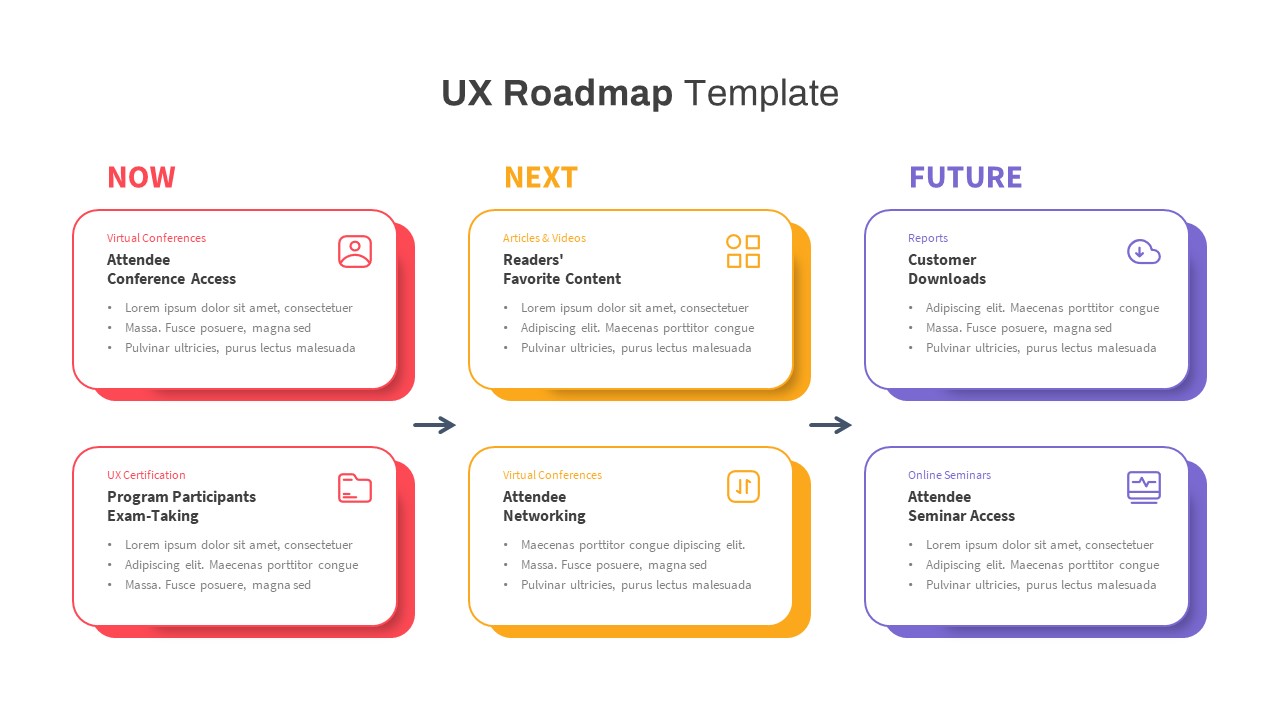
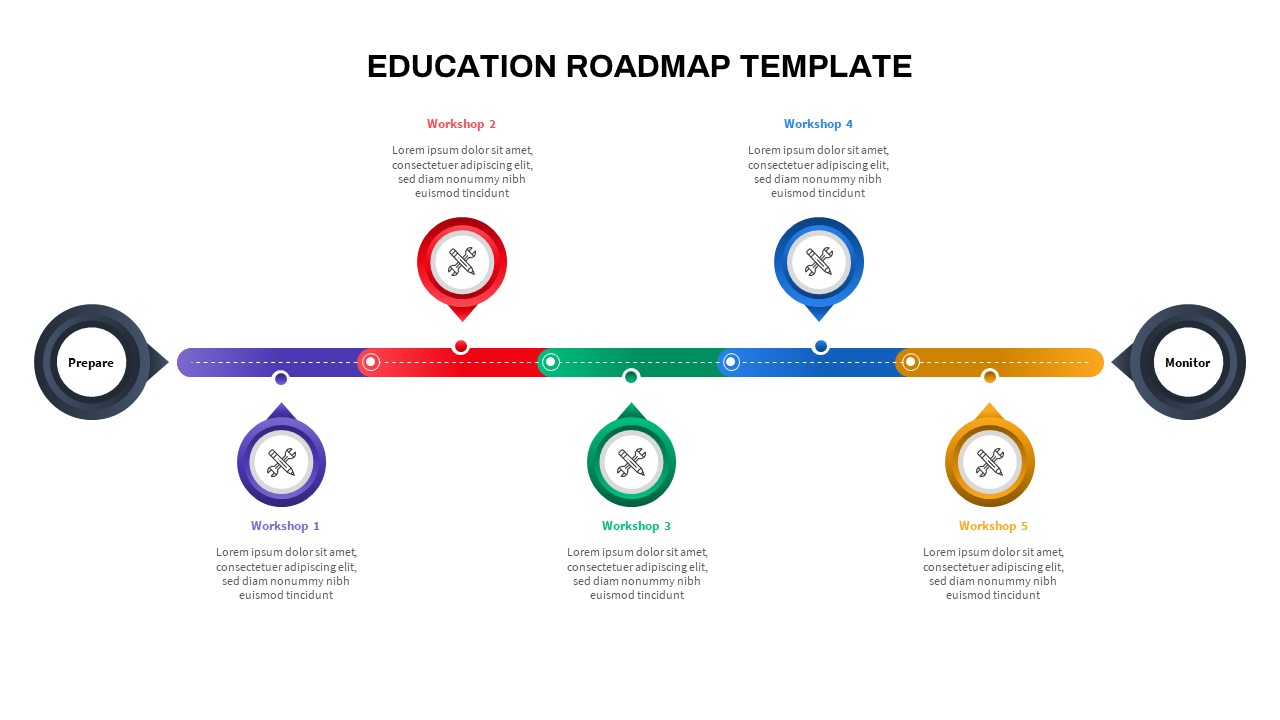
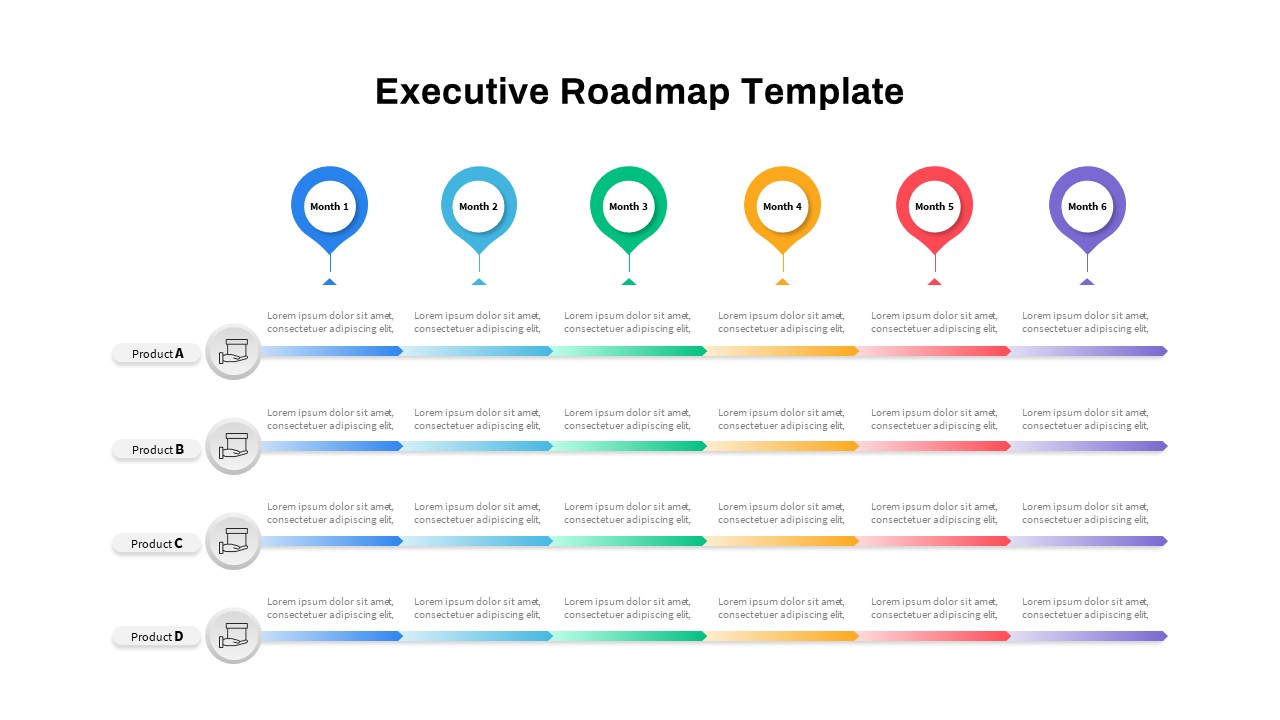
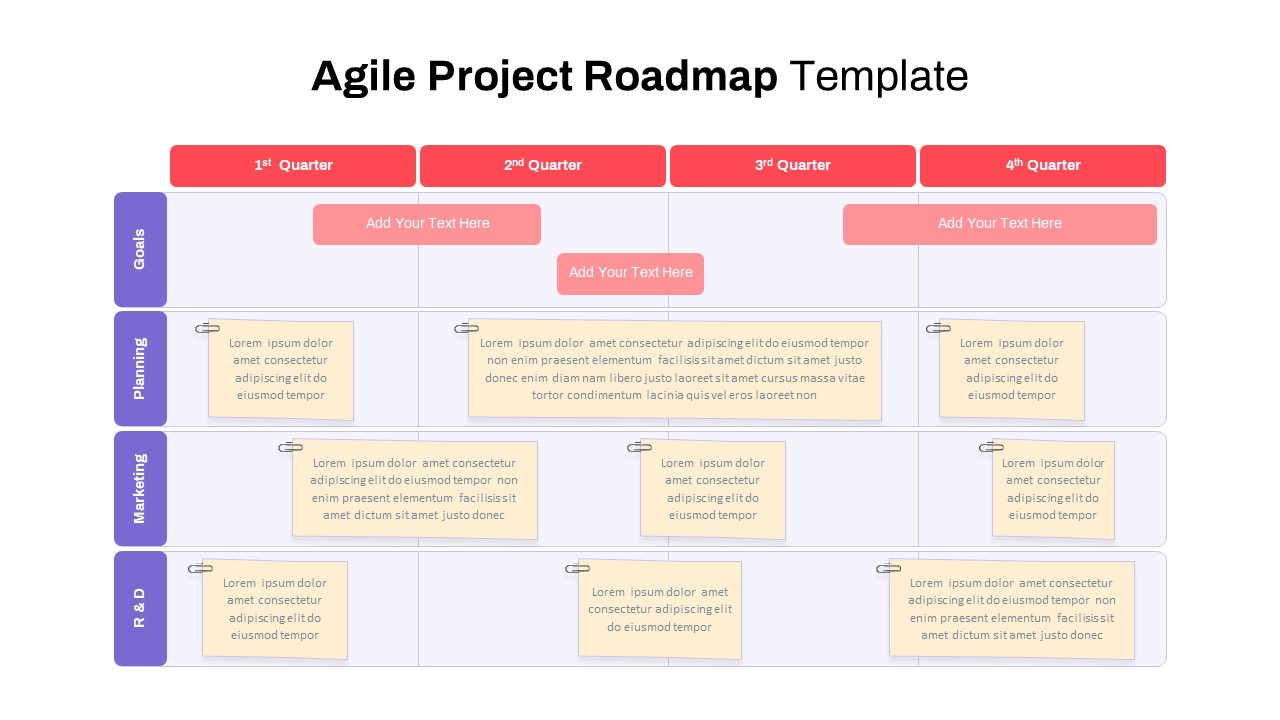
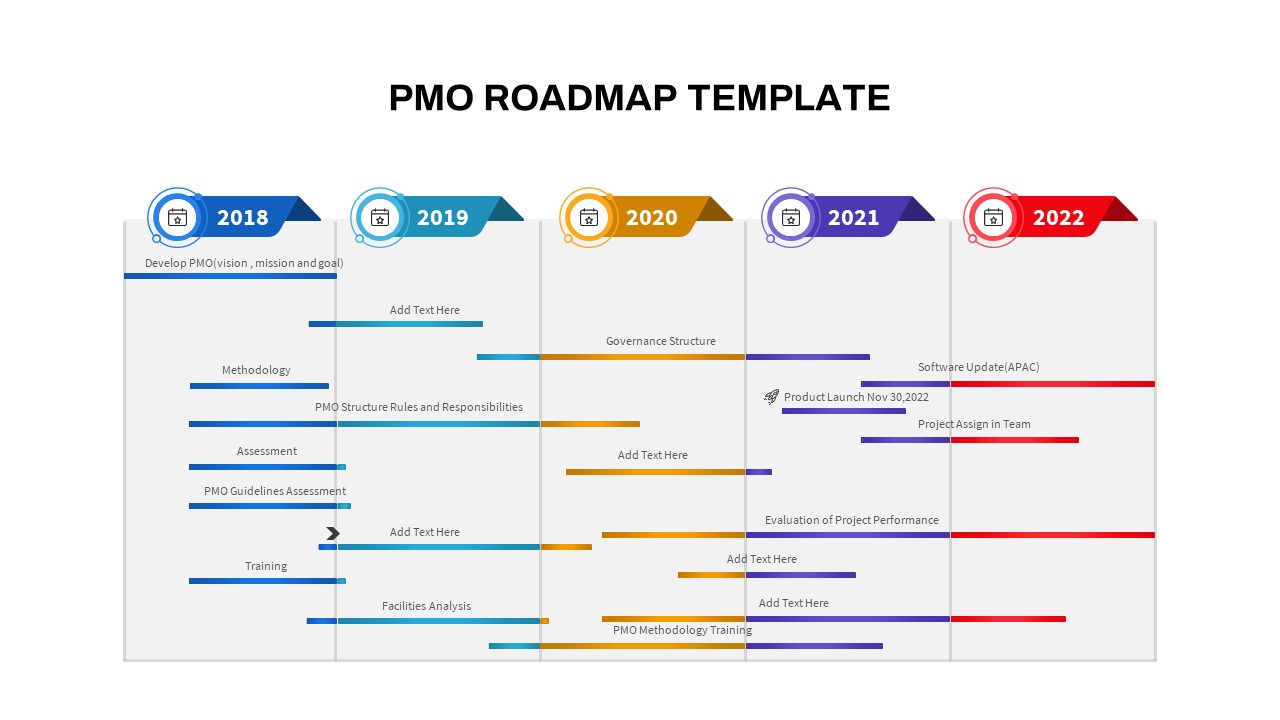
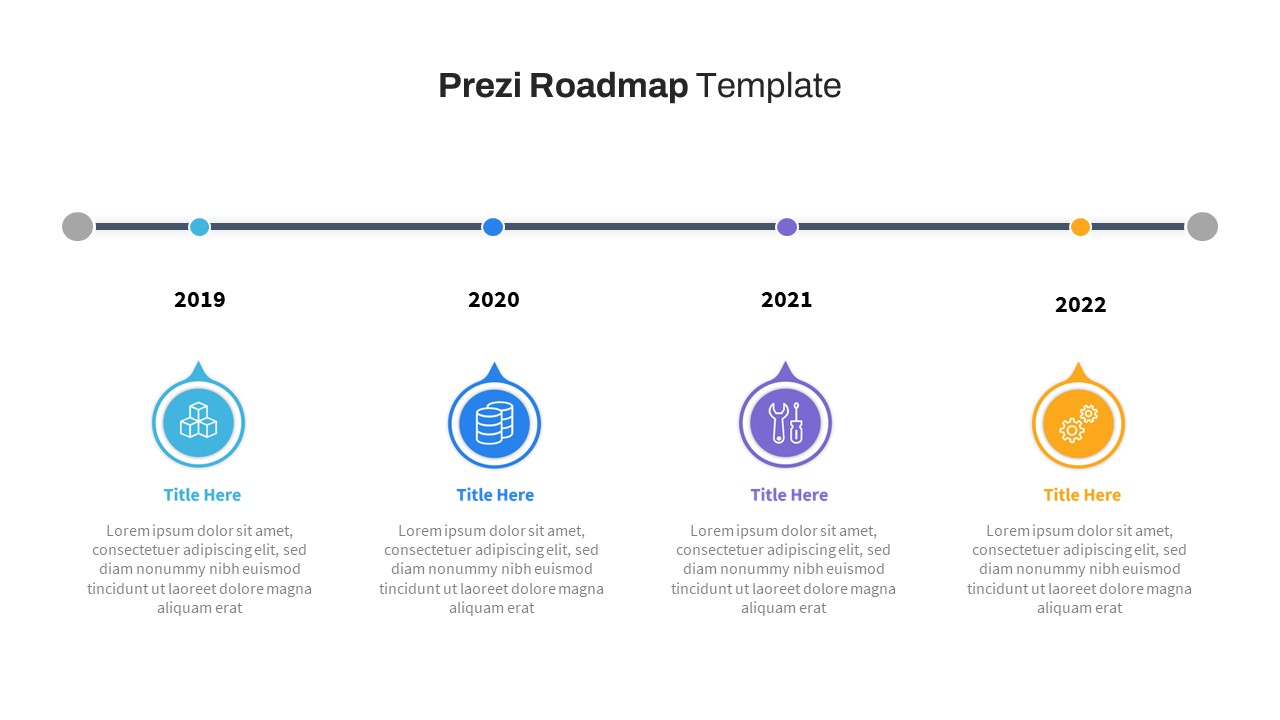
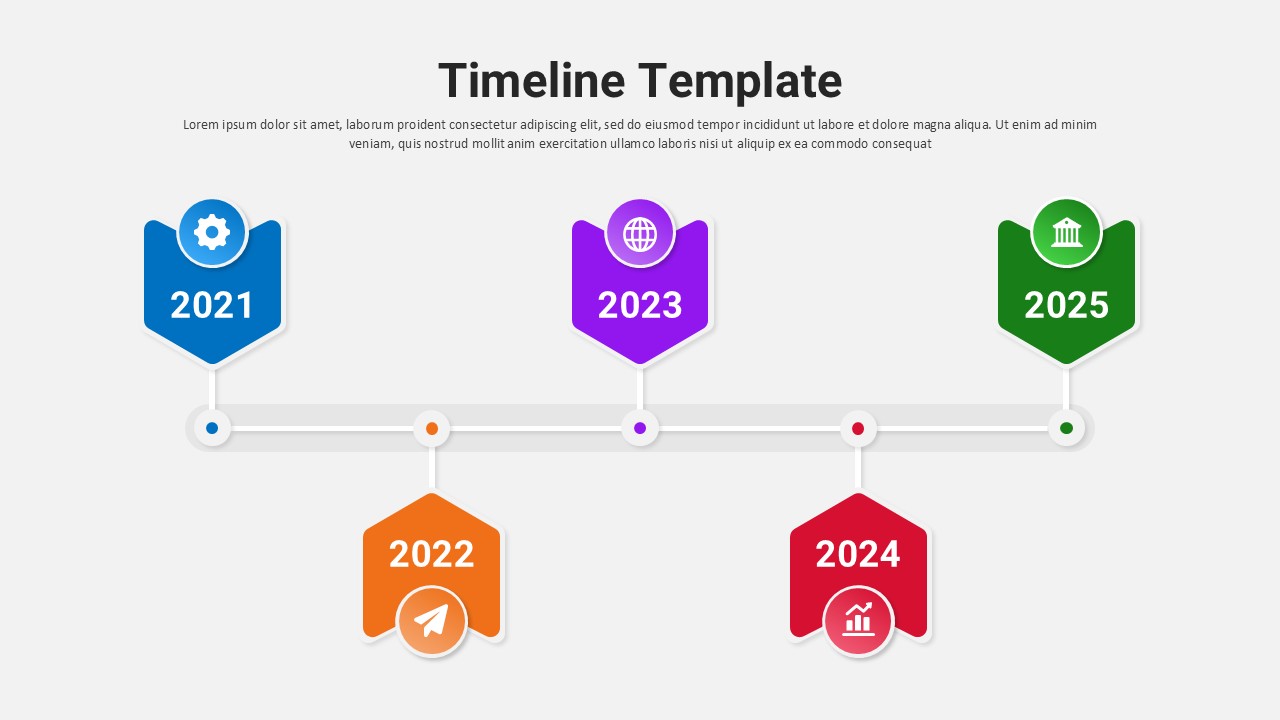
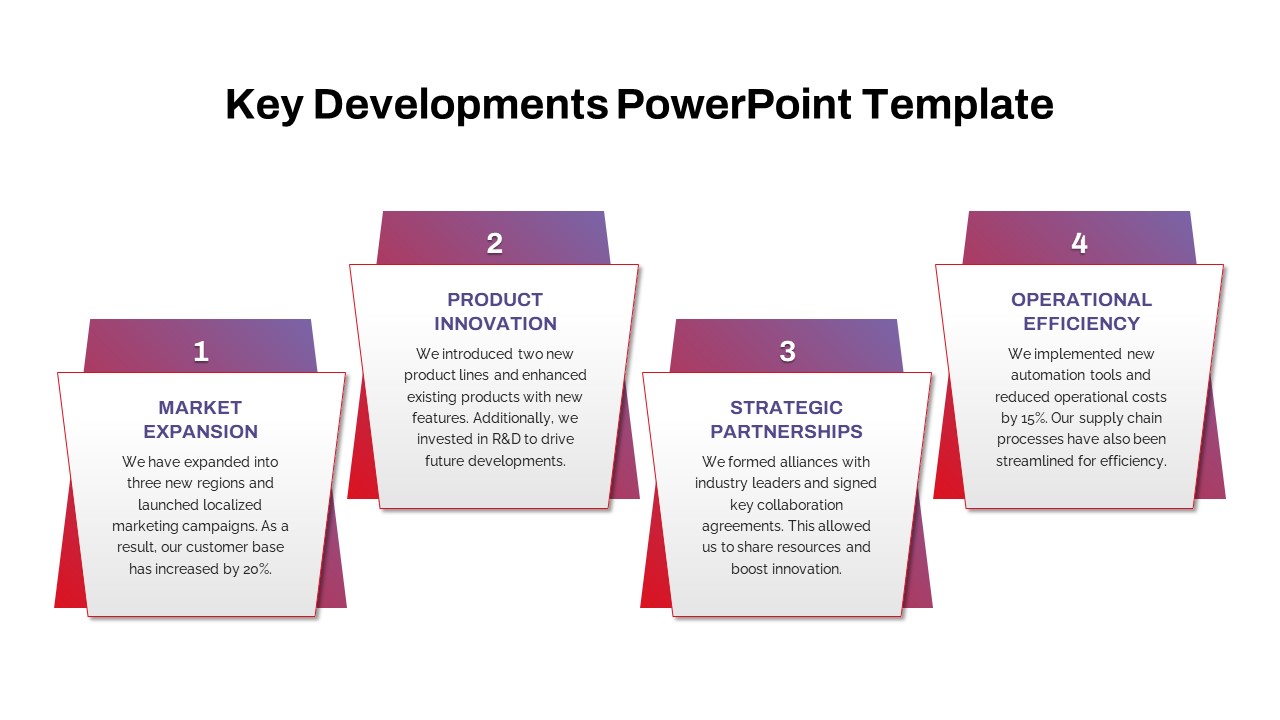
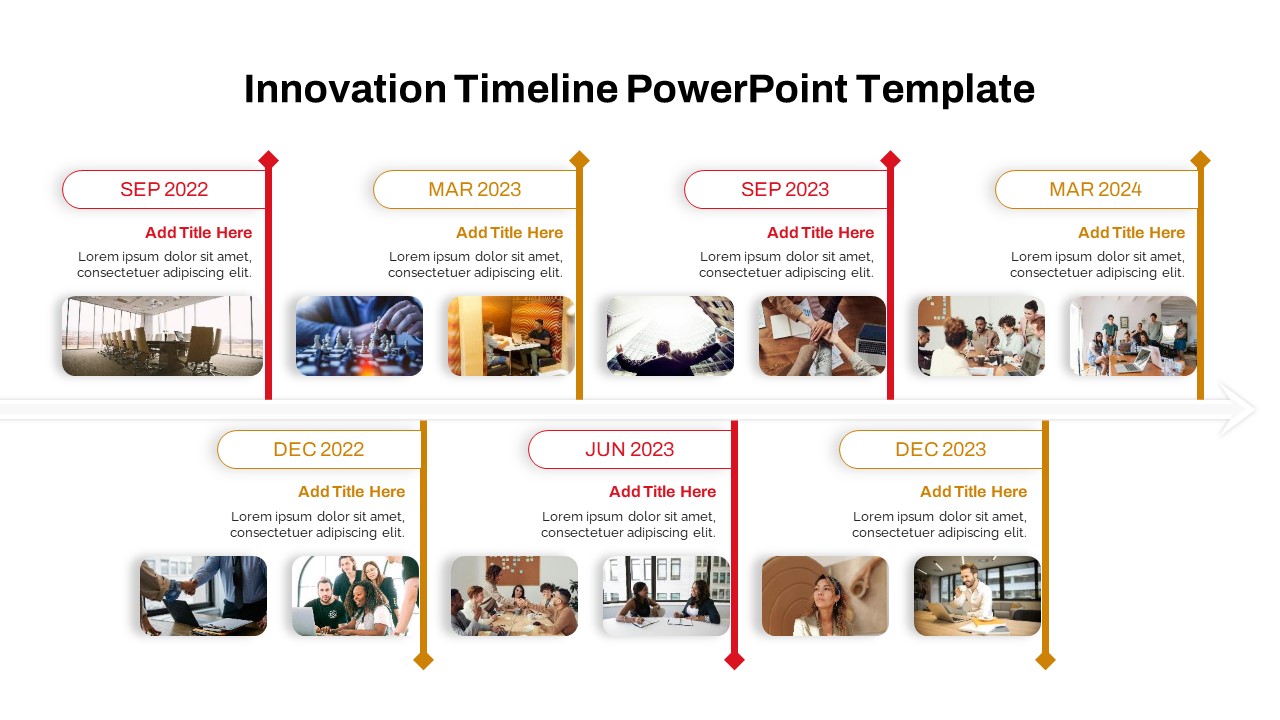
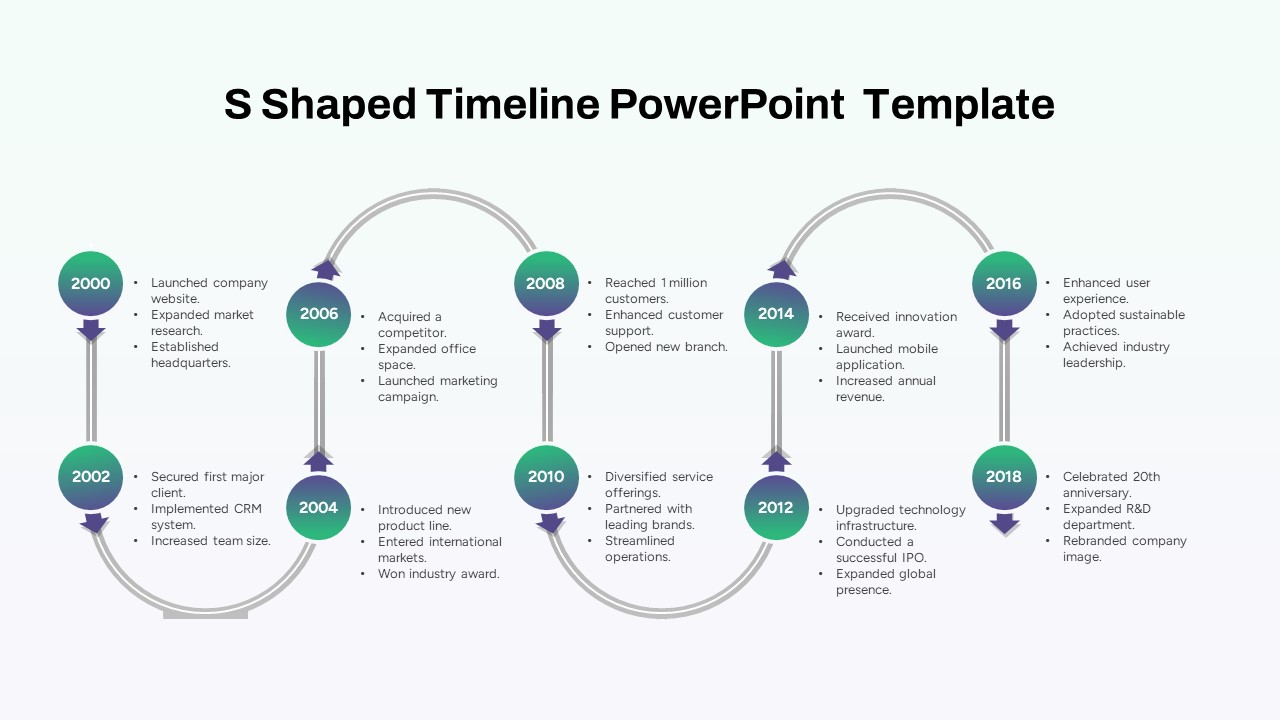
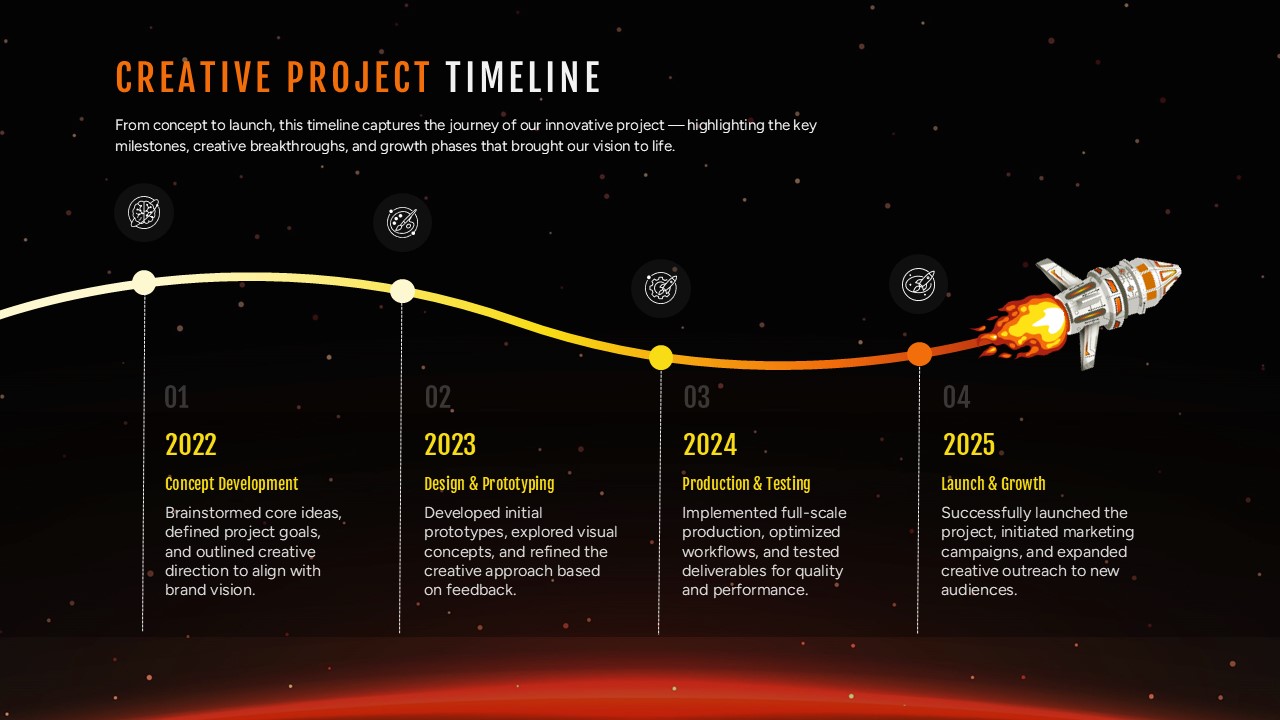
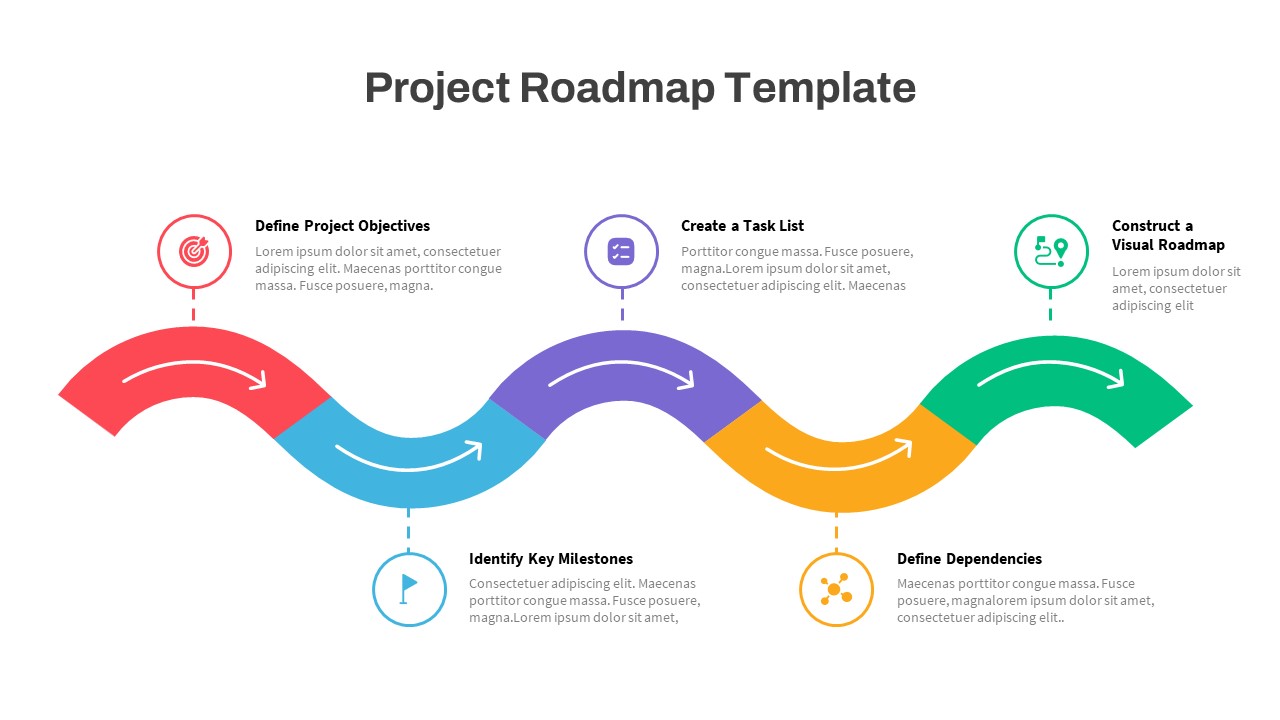
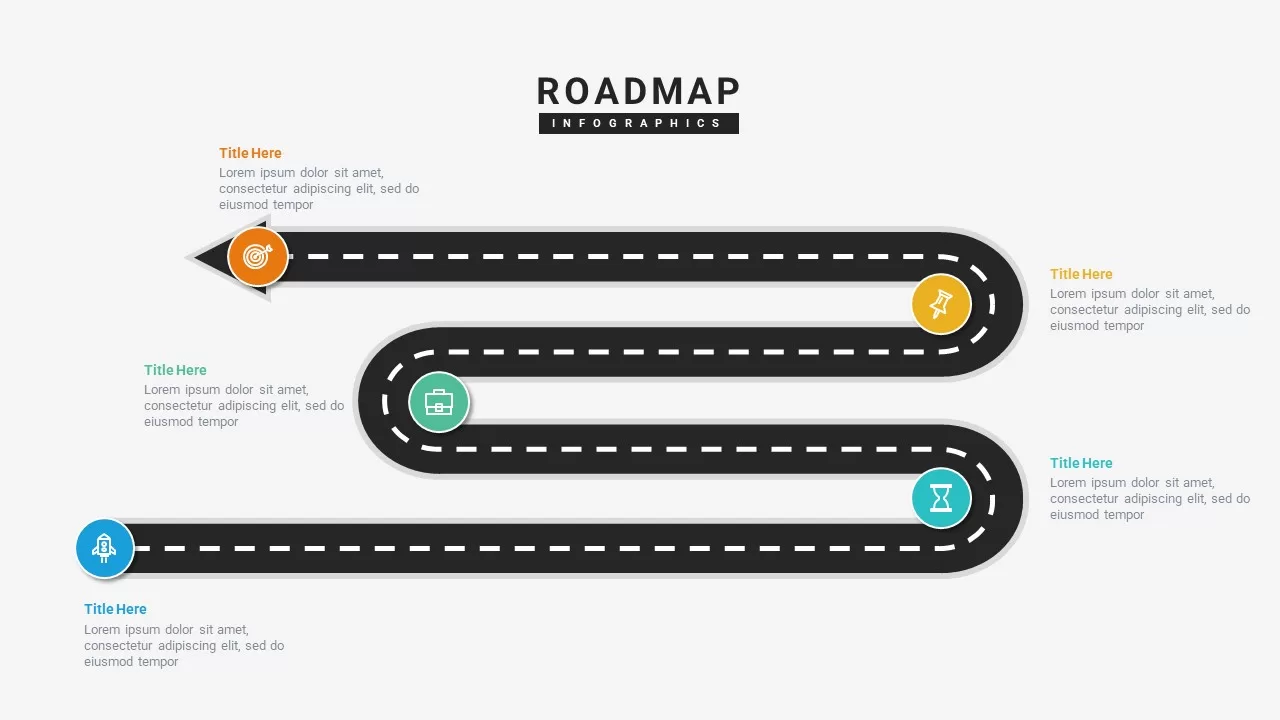
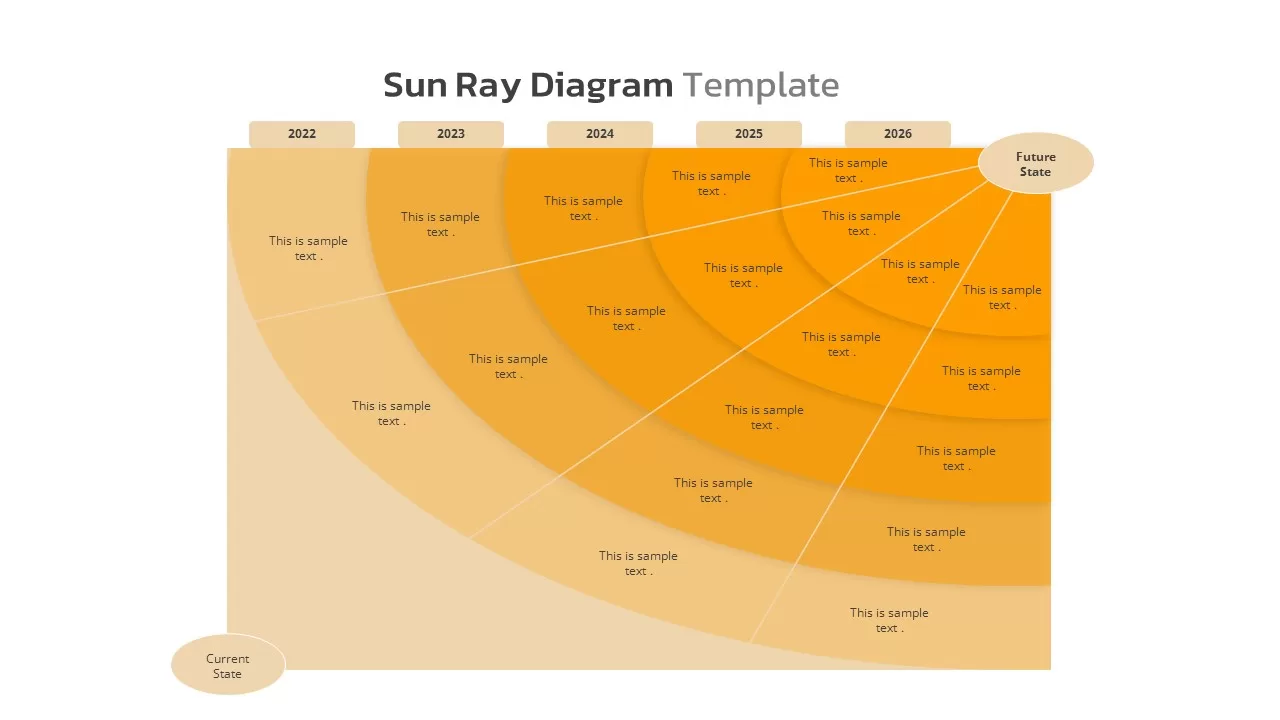
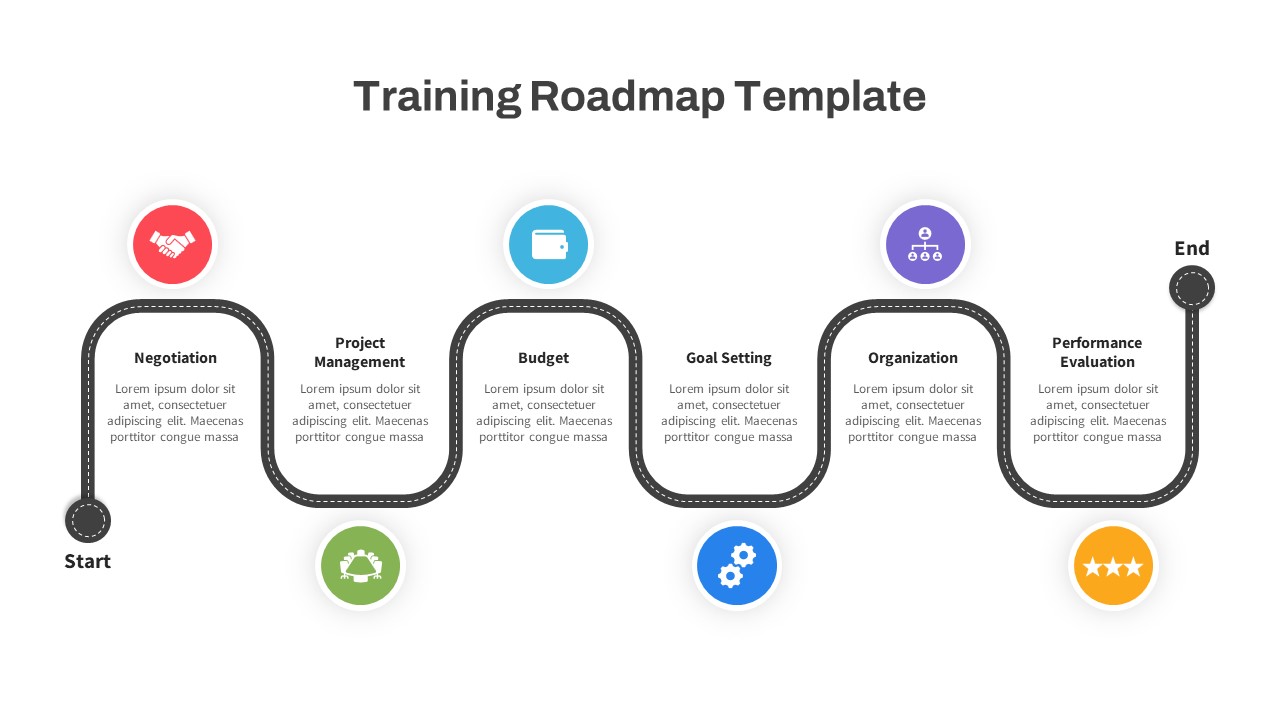
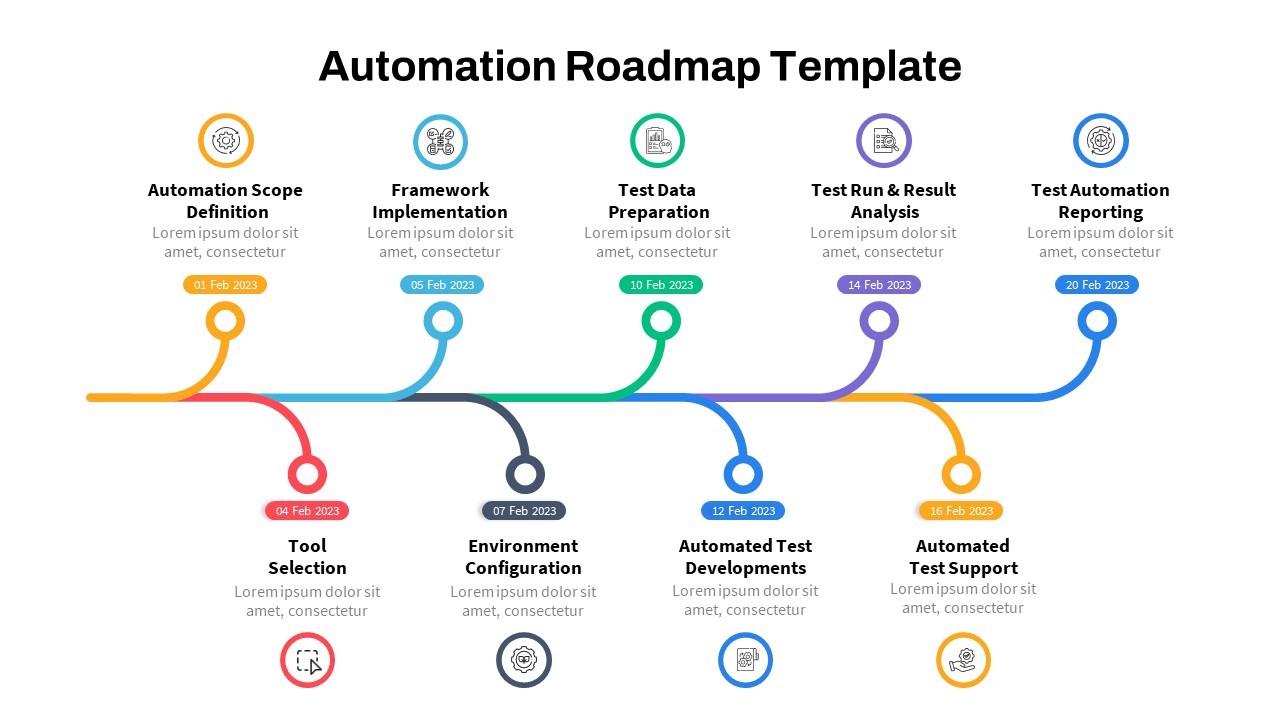
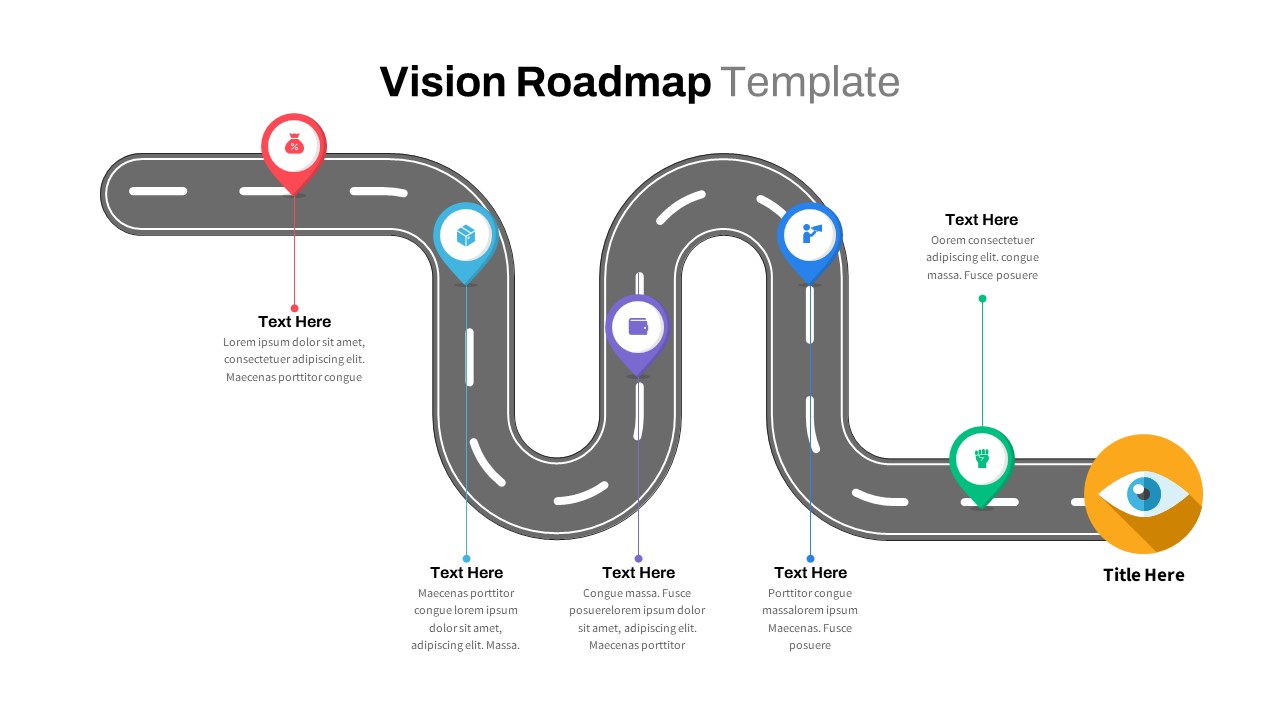
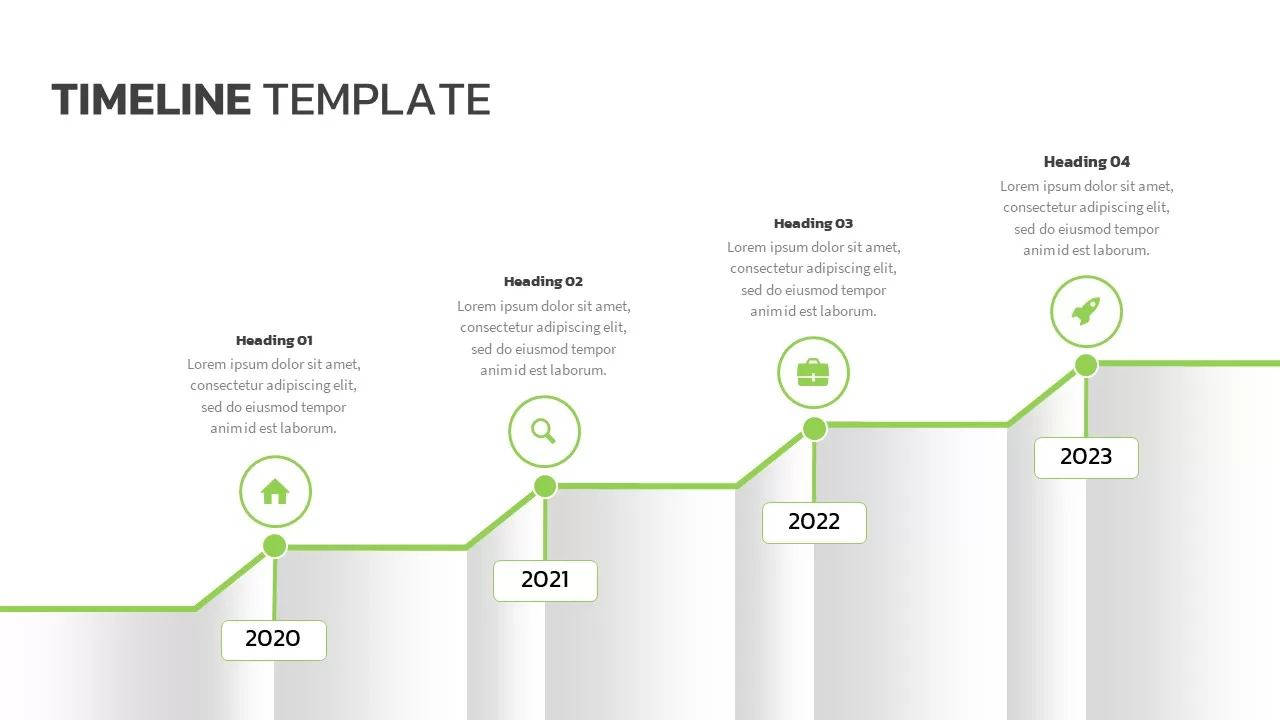
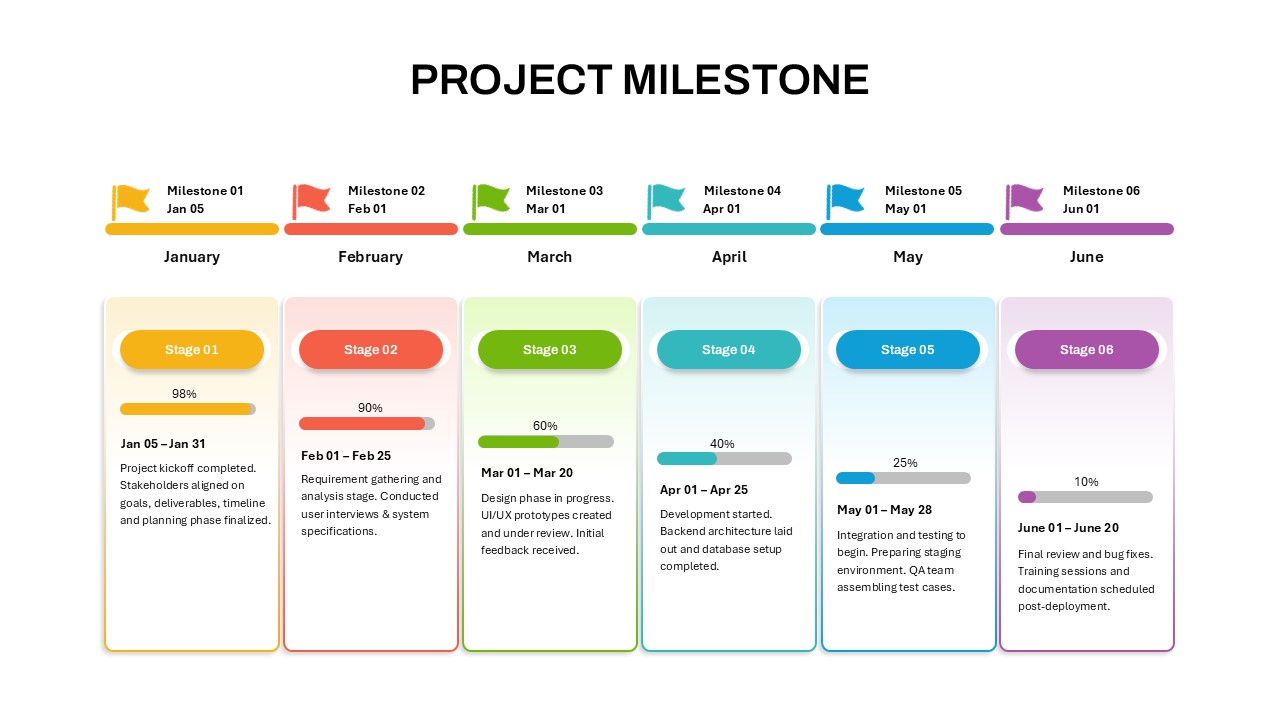
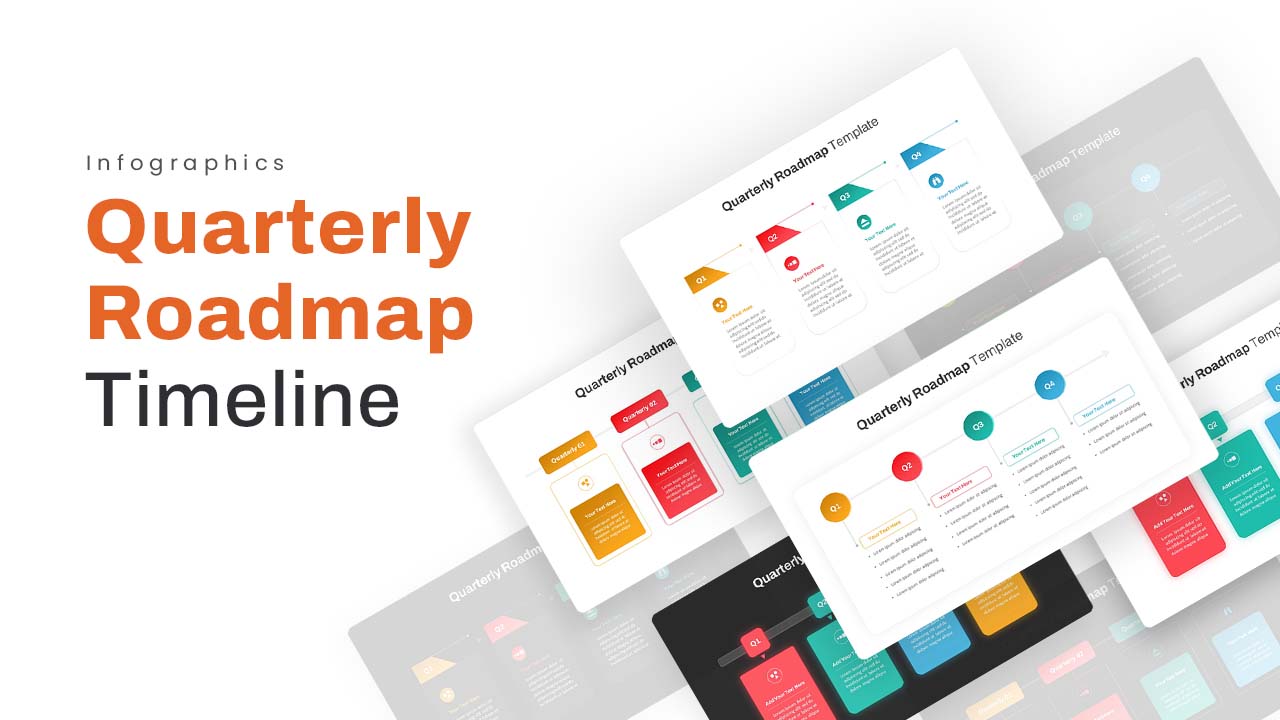
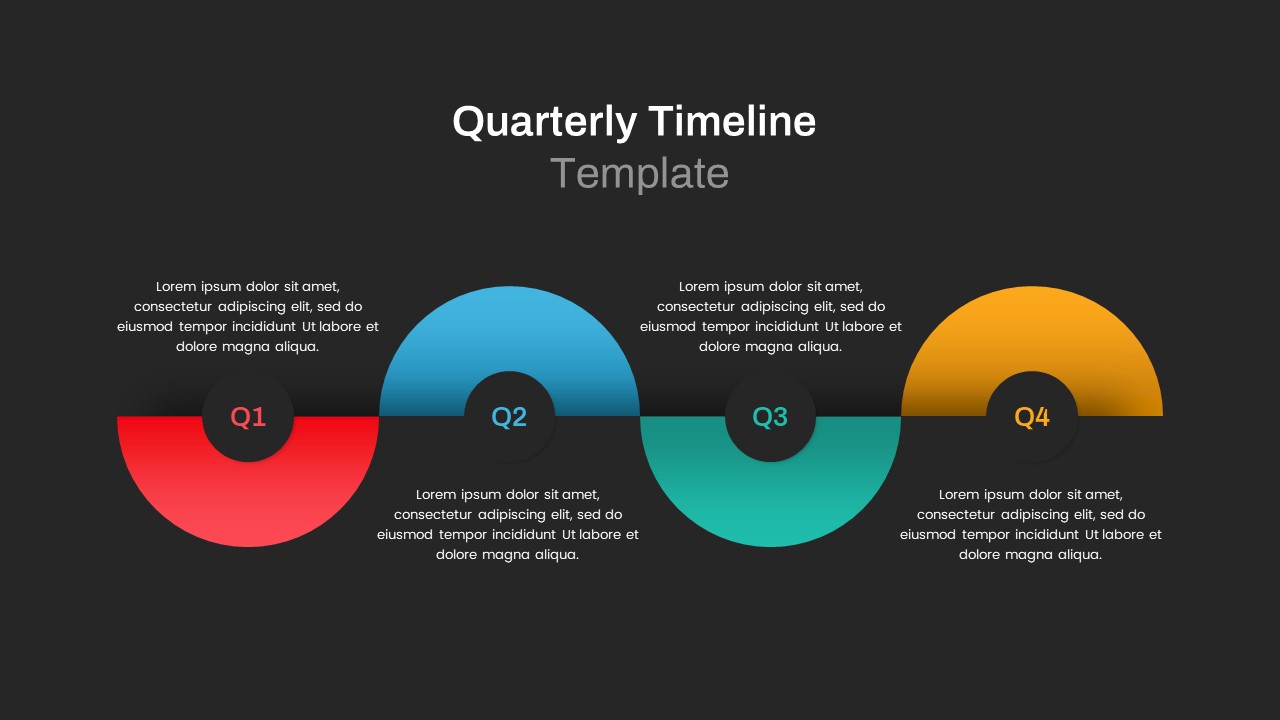
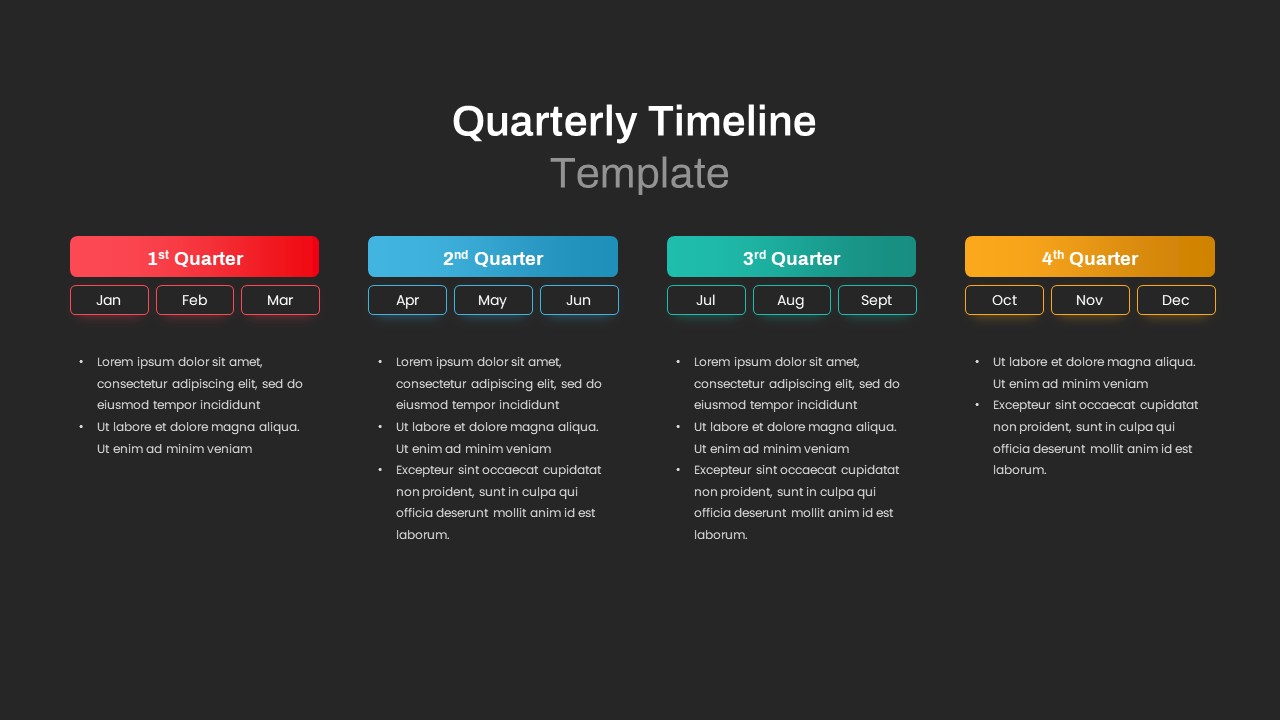
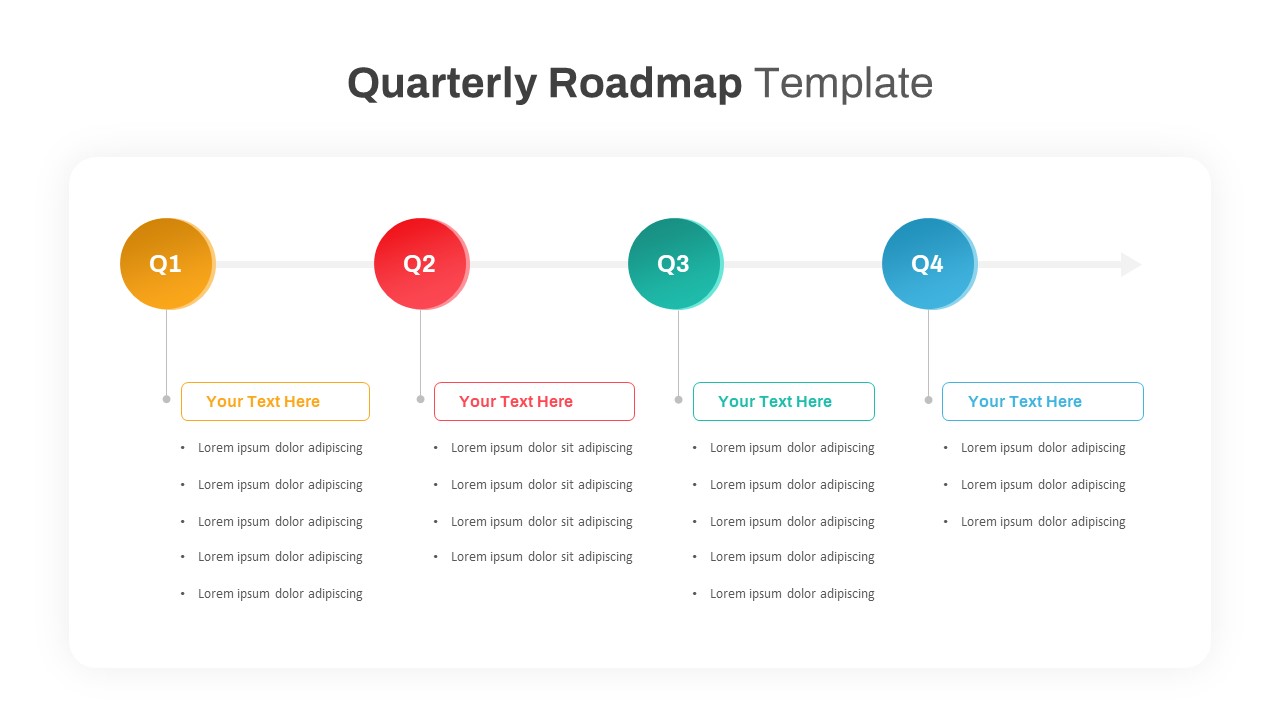
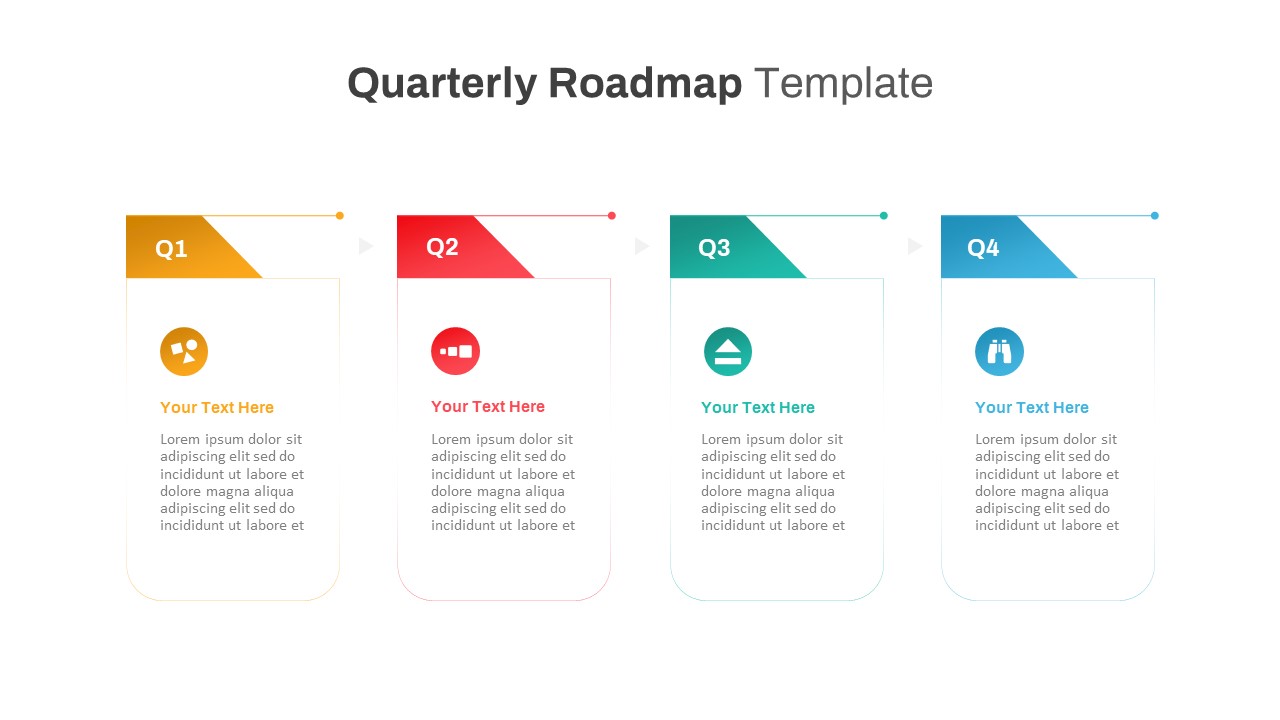
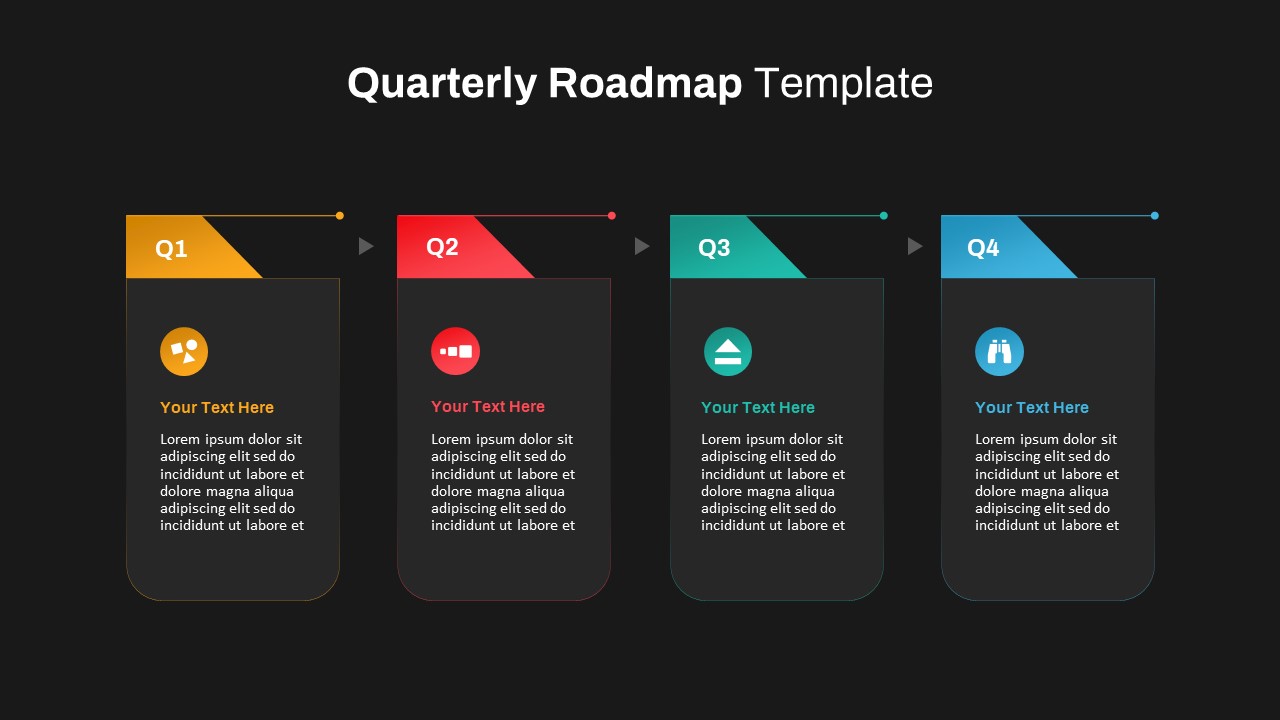
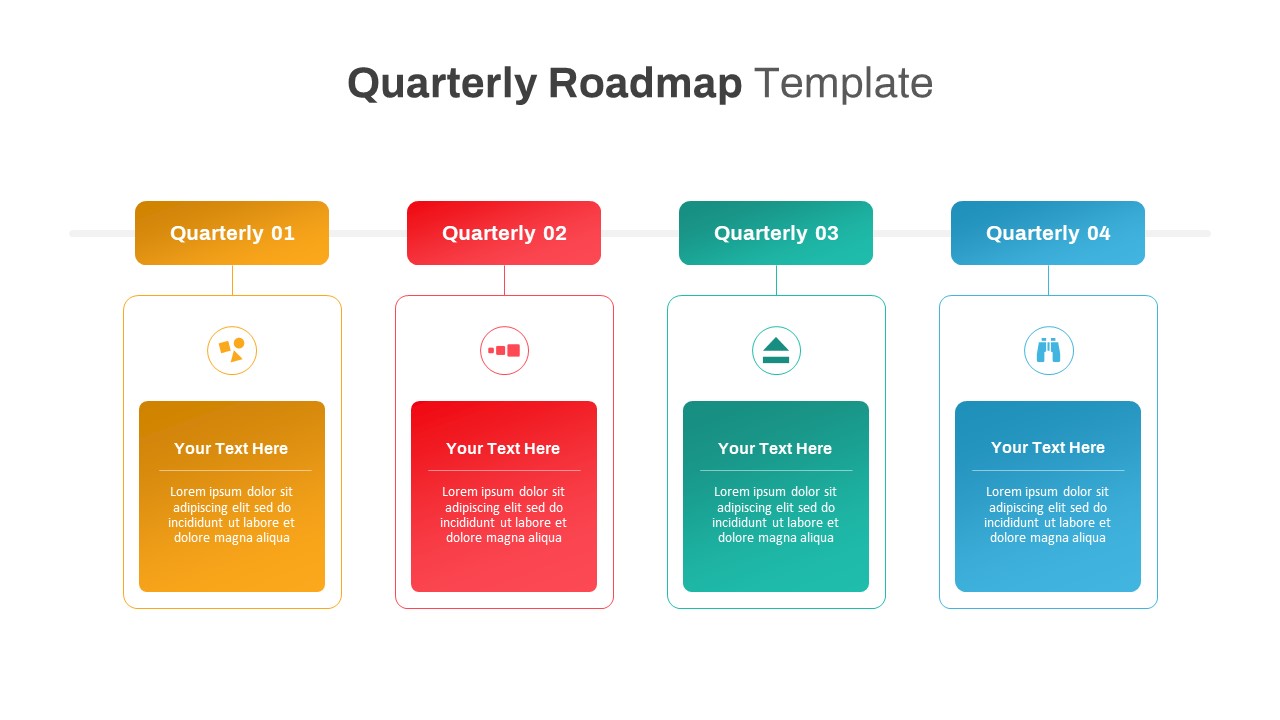
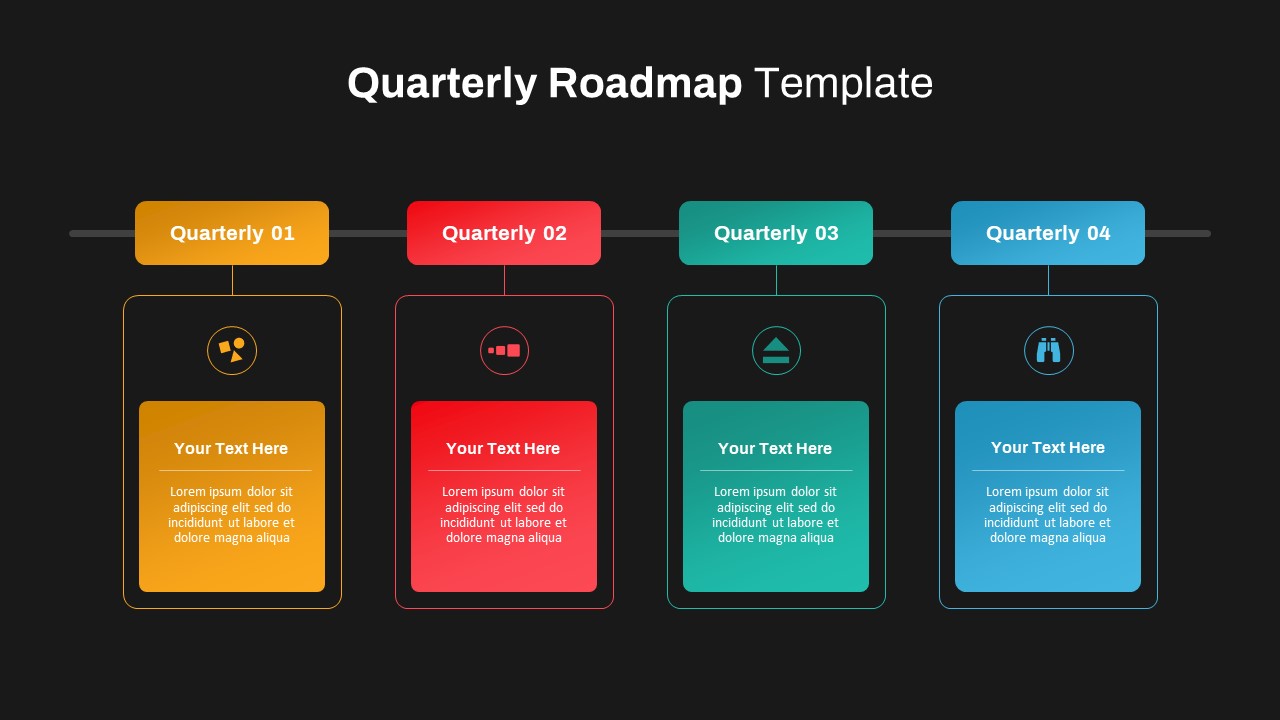
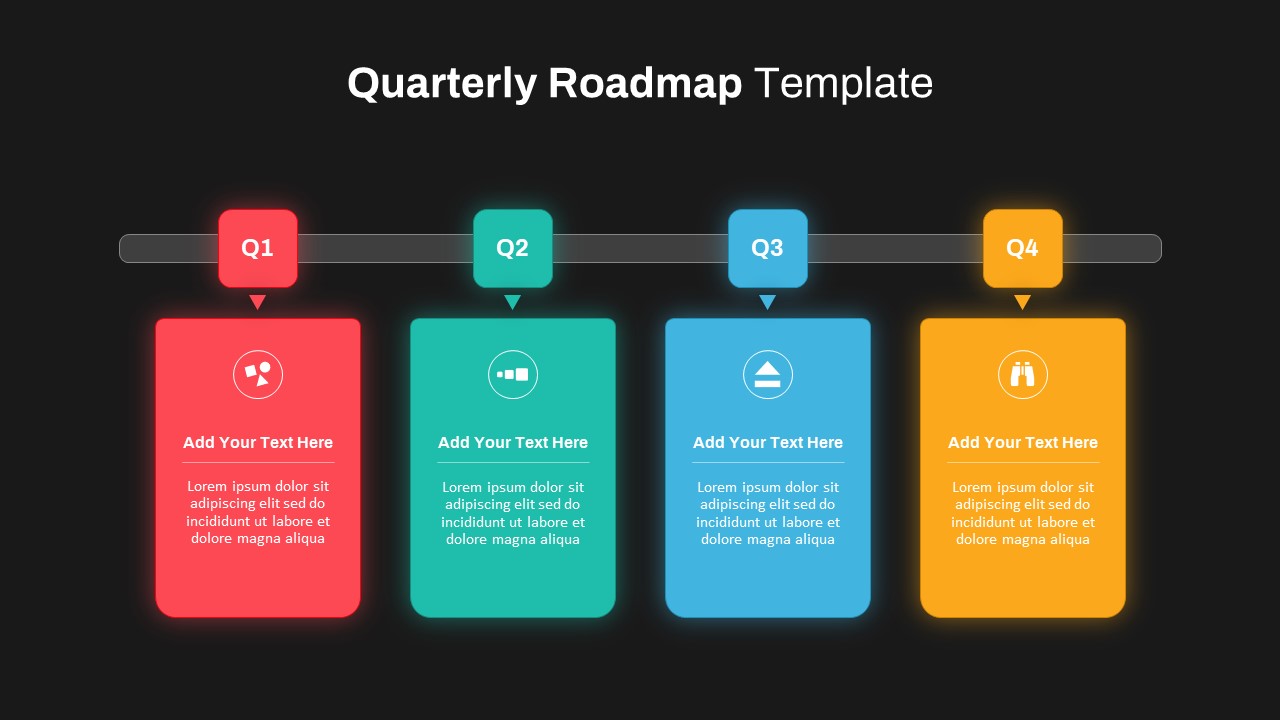
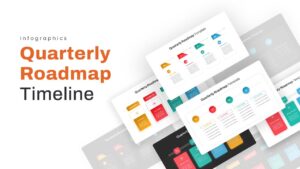
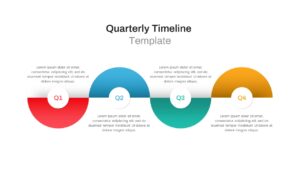
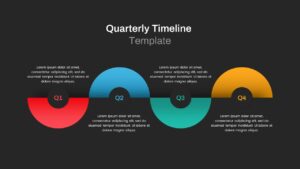
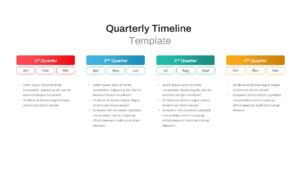
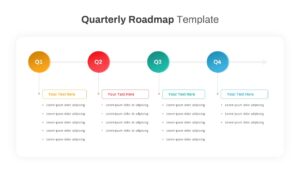
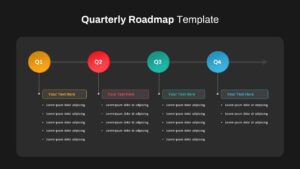
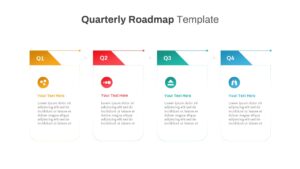
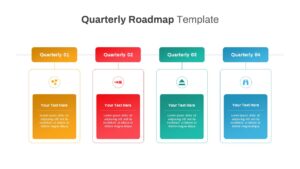
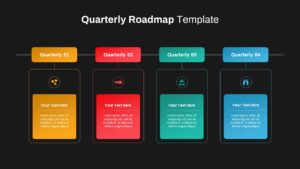
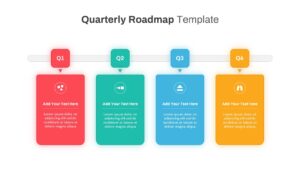
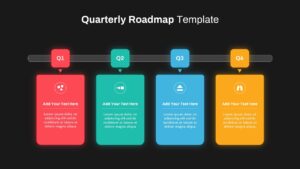
Drive strategic alignment with this comprehensive quarterly roadmap timeline infographic, designed to map key milestones across the financial year. Featuring four distinct color-coded segments—red for Q1, blue for Q2, green for Q3, and yellow for Q4—this editable twelve-slide collection offers two layout variants: a dynamic zigzag flow and a structured four-column calendar style. Each slide includes placeholders for milestone headlines, descriptive text, and icons, allowing you to customize content in PowerPoint or Google Slides with ease. Vector-based shapes and grouped elements ensure seamless resizing and recoloring, while light and dark background versions adapt to any brand palette or print format.
Built on master slides, this template streamlines theme changes, global text updates, and color palette adjustments to maintain consistency across decks. Optional animations guide audiences through each quarter in sequence, creating an engaging narrative that highlights strategic objectives, product launches, and financial forecasts. The clean, modern design—with ample white space and minimal typography—keeps focus on your roadmap without distractions. Whether conducting a quarterly business review, outlining product development sprints, or presenting executive strategies, this infographic empowers you to communicate complex timelines with clarity and professionalism.
All graphic components are 100% native to both platforms, featuring editable fonts, drag-and-drop icons, and optional grid guides for precise alignment. Light and dark themes let you tailor the visual tone to diverse audiences, while vector graphics preserve crispness at any size. This turnkey slide deck is optimized for seamless collaboration, ensuring every update reflects across slides instantaneously. Use it to illustrate quarterly marketing campaigns, product roadmaps, or project milestones with professional polish and impactful clarity.
Who is it for
Marketing managers, product teams, and project leaders will benefit from this slide when outlining quarterly strategies, tracking milestones, and presenting business reviews. Financial planners, operations executives, and C-suite stakeholders can leverage the timeline to communicate forecasts, resource allocations, and performance benchmarks with visual impact.
Other Uses
Use this versatile timeline for marketing campaign planning, product launch schedules, sprint roadmaps, or annual strategic overviews. Repurpose the zigzag layout to highlight project phases or dependency chains, and leverage the column format to compare departmental objectives side by side. Ideal for investor pitches, training programs, or event timelines across industries.
Login to download this file

Item ID
SB03430
Related Templates

Quarterly Timeline Infographic Template for PowerPoint & Google Slides
Timeline
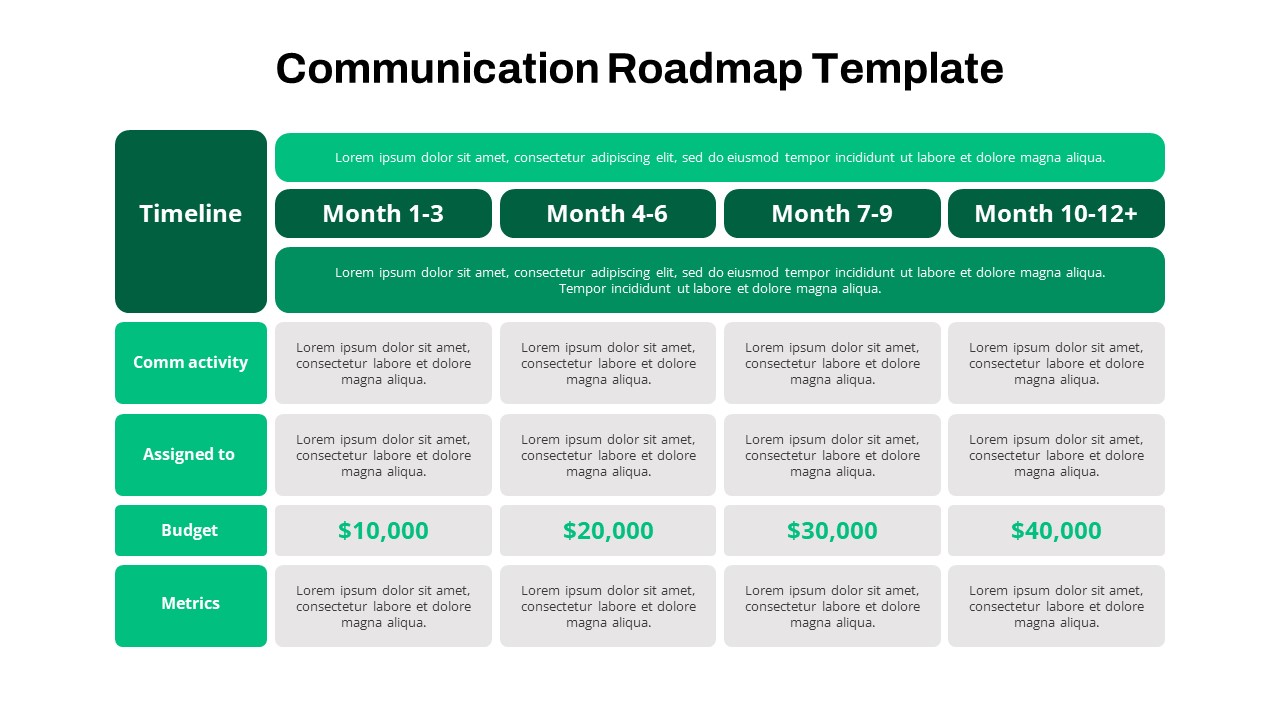
Quarterly Communication Roadmap Grid Template for PowerPoint & Google Slides
Marketing

Quarterly Digital Strategy Timeline template for PowerPoint & Google Slides
Digital Marketing
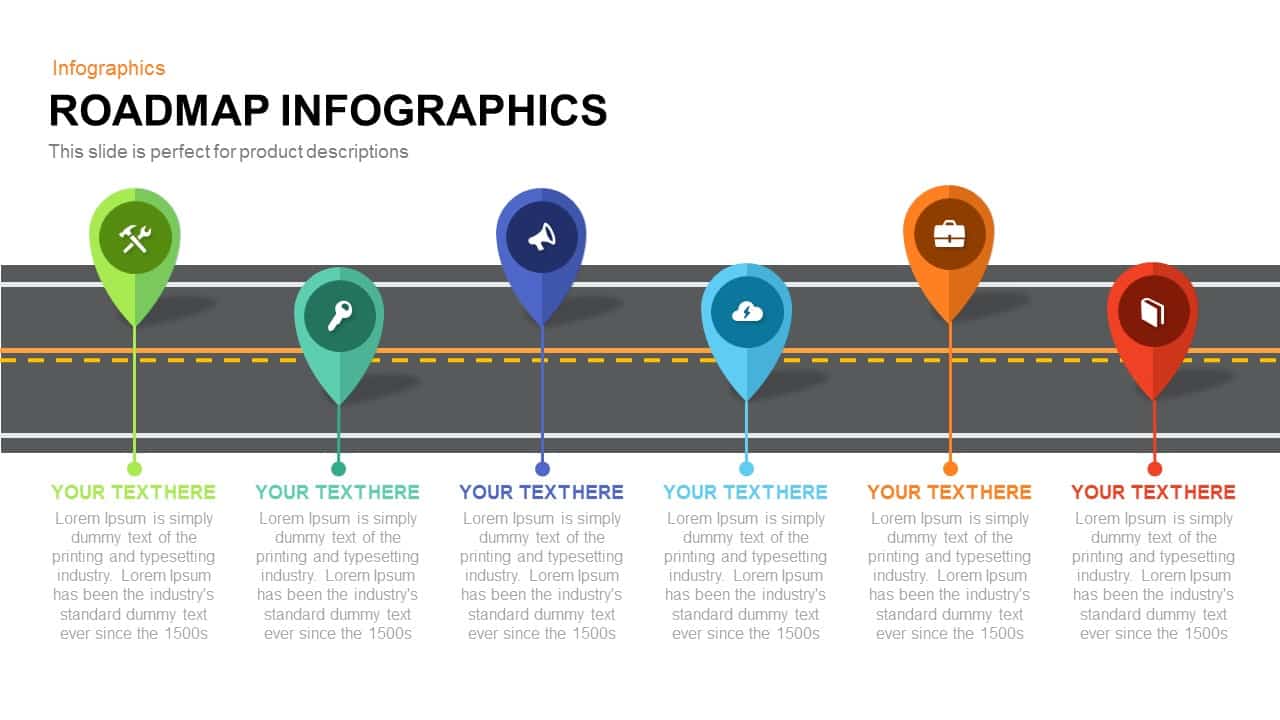
Roadmap Infographic Timeline Slide Template for PowerPoint & Google Slides
Roadmap

Timeline Roadmap Milestones Infographic Template for PowerPoint & Google Slides
Roadmap

Free Colorful Roadmap Timeline Infographic Template for PowerPoint & Google Slides
Roadmap
Free
Quarterly Sales template for PowerPoint & Google Slides
Bar/Column
Quarterly Planner Calendar Layout Template for PowerPoint & Google Slides
Project
Quarterly Achievement Progress Template for PowerPoint & Google Slides
Accomplishment
Free Quarterly Business Review Dashboard Template for PowerPoint & Google Slides
Business
Free
Quarterly Credit Loss Provisions Chart Template for PowerPoint & Google Slides
Bar/Column
Quarterly Financial Summary Dashboard Template for PowerPoint & Google Slides
Business Report
Quarterly Gross Profit Rate Chart Template for PowerPoint & Google Slides
Revenue
Quarterly Network Volume Analysis Template for PowerPoint & Google Slides
Business Report
Quarterly Business Review Dashboard Template for PowerPoint & Google Slides
Pitch Deck
Quarterly Revenue Comparison Bar Chart Template for PowerPoint & Google Slides
Bar/Column

Quarterly Net Interest Income Growth Template for PowerPoint & Google Slides
Bar/Column
Quarterly Sales Review Bar Chart Template for PowerPoint & Google Slides
Bar/Column
Quarterly Plan Template for PowerPoint & Google Slides
Project Status
Quarterly Gantt Chart with Today Marker Template for PowerPoint & Google Slides
Gantt Chart
Quarterly Comparison Pie Chart Template for PowerPoint & Google Slides
Pie/Donut
Quarterly Financial Report Dashboard Template for PowerPoint & Google Slides
Finance
Strategy Roadmap Timeline Slides Template for PowerPoint & Google Slides
Roadmap

Product Roadmap Gantt Chart Timeline template for PowerPoint & Google Slides
Gantt Chart
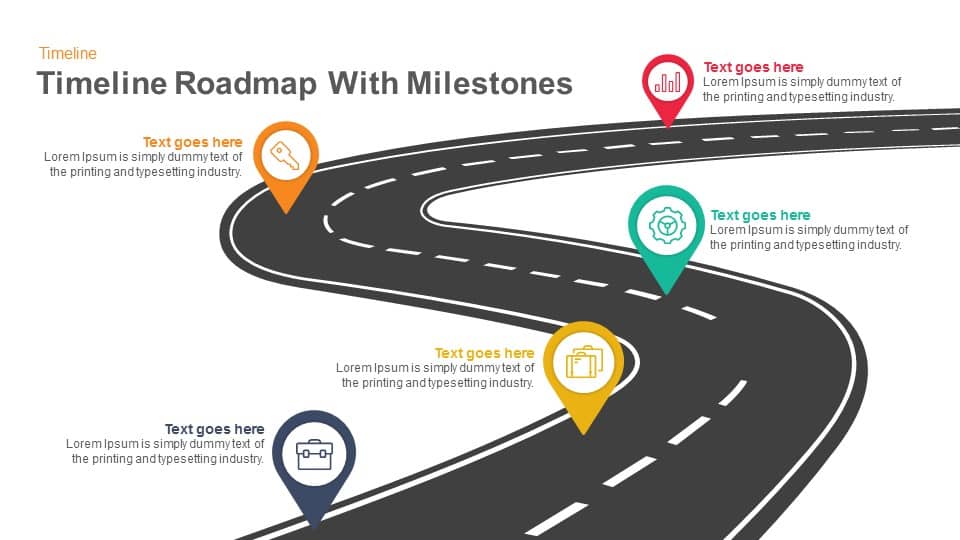
Timeline Roadmap with Milestones template for PowerPoint & Google Slides
Roadmap
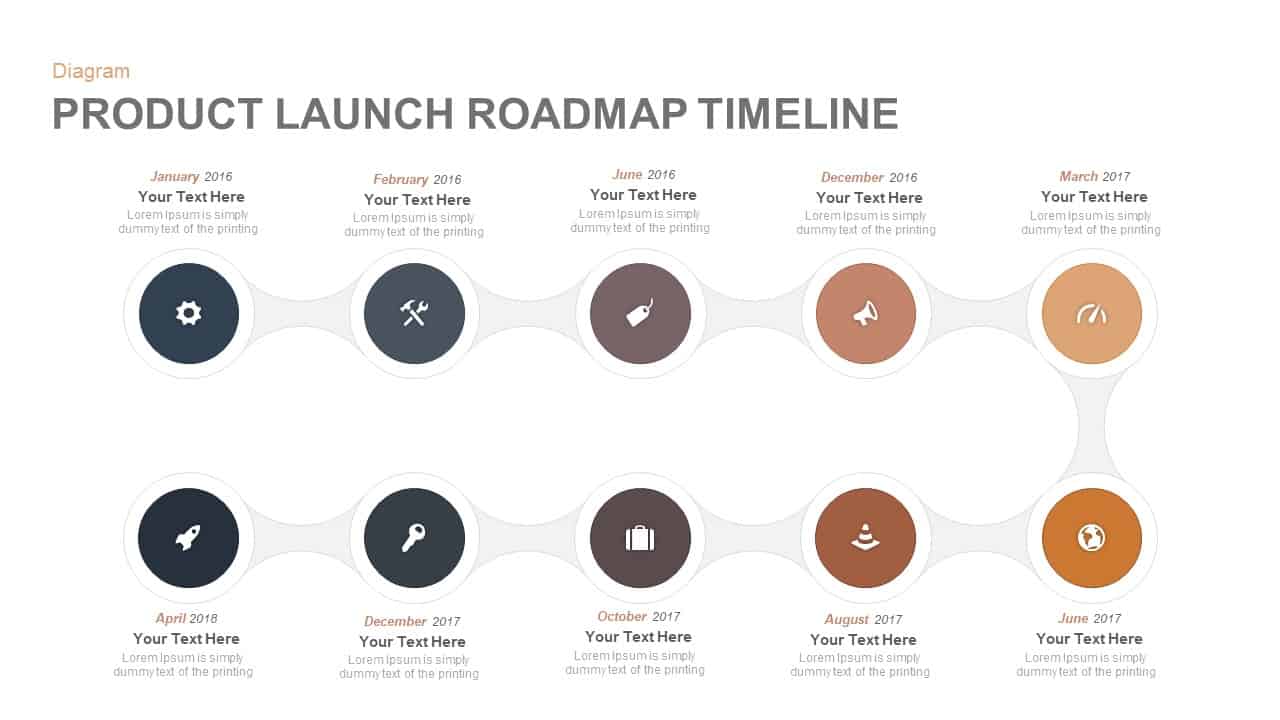
Product Launch Roadmap Timeline Template for PowerPoint & Google Slides
Timeline
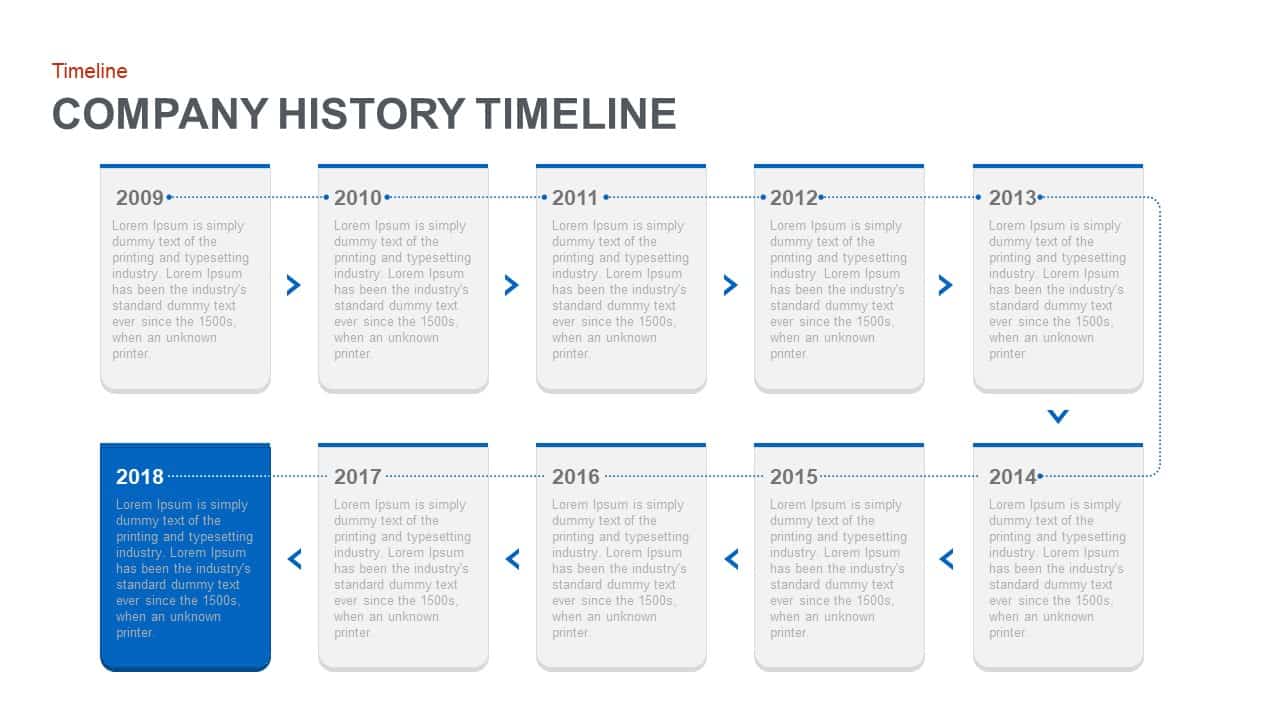
Company History Timeline Roadmap Template for PowerPoint & Google Slides
Timeline
Curved Road Roadmap Timeline Diagram Template for PowerPoint & Google Slides
Roadmap
Product Roadmap Timeline template for PowerPoint & Google Slides
Project Status
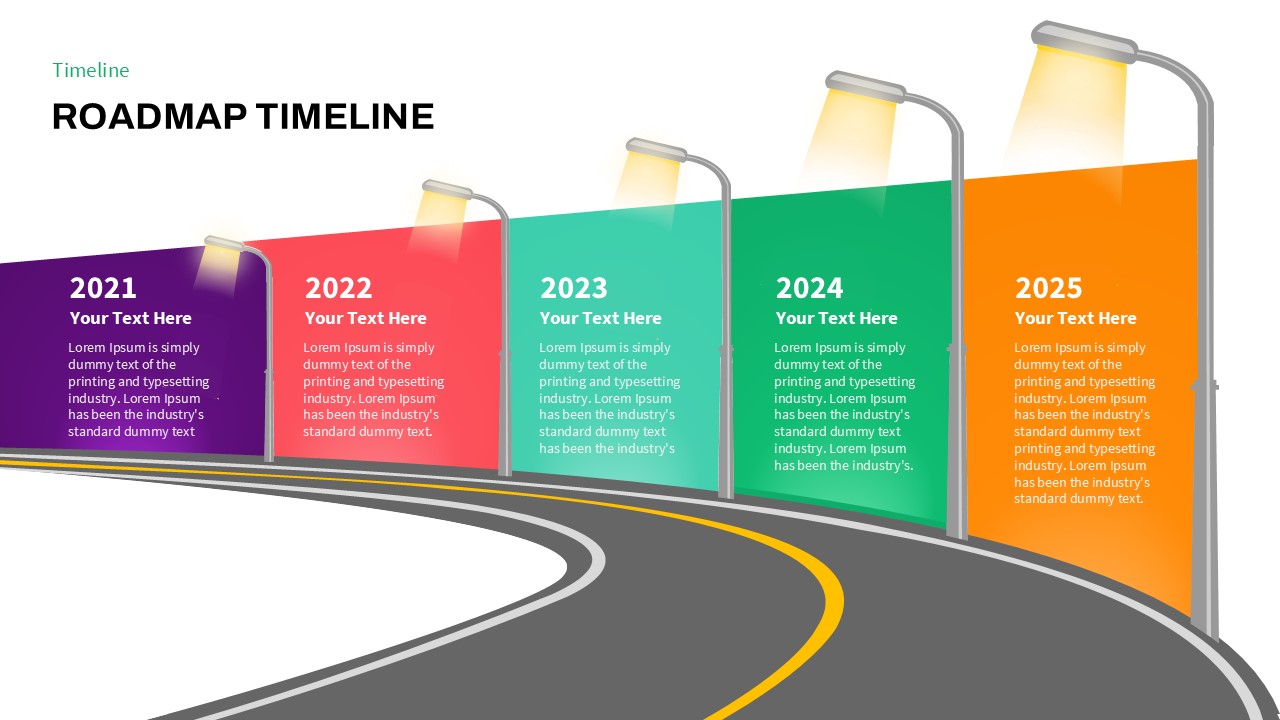
Roadmap Timeline Template for PowerPoint & Google Slides
Timeline
Customizable Marketing Roadmap Timeline Template for PowerPoint & Google Slides
Roadmap
Business Quarter Roadmap Timeline Template for PowerPoint & Google Slides
Timeline
Six-Month Innovation Roadmap Timeline Template for PowerPoint & Google Slides
Roadmap
Timeline Roadmap with Progress Bar Template for PowerPoint & Google Slides
Timeline
Modern Social Media Timeline Roadmap Template for PowerPoint & Google Slides
Timeline
Three-Year Project Roadmap Timeline Template for PowerPoint & Google Slides
Timeline
UX Roadmap Timeline Template for PowerPoint & Google Slides
Roadmap
Colorful Education Roadmap Workshop Timeline Template for PowerPoint & Google Slides
Roadmap
Executive Roadmap Six-Month Timeline Template for PowerPoint & Google Slides
Roadmap
Agile Project Roadmap Timeline Template Pack for PowerPoint & Google Slides
Scrum
Comprehensive PMO Roadmap Timeline Template for PowerPoint & Google Slides
Roadmap
Clean Minimalist Roadmap Timeline Template for PowerPoint & Google Slides
Roadmap
Multi-color Curved Timeline Roadmap Template for PowerPoint & Google Slides
Timeline
Multicolor Alternating Timeline Roadmap Template for PowerPoint & Google Slides
Timeline
Key Developments Roadmap Timeline Template for PowerPoint & Google Slides
Timeline
Interactive Innovation Timeline Roadmap Template for PowerPoint & Google Slides
Timeline
Multi-Year S-Shaped Roadmap Timeline Template for PowerPoint & Google Slides
Timeline
Project Comparison Timeline Roadmap Template for PowerPoint & Google Slides
Comparison
AI Roadmap & Planning Timeline Template for PowerPoint & Google Slides
Roadmap
Goal Setting Timeline Roadmap Template for PowerPoint & Google Slides
Goals
Business Launch Timeline Roadmap 5-Phase Template for PowerPoint & Google Slides
Business
Creative Project Timeline Roadmap Template for PowerPoint & Google Slides
Timeline
Campaign Timeline Marketing Roadmap Slide Template for PowerPoint & Google Slides
Timeline
Business Plan Timeline Roadmap for PowerPoint & Google Slides
Roadmap
Roadmap Milestones Timeline for PowerPoint & Google Slides
Roadmap
Wavy Timeline Project Roadmap Slide for PowerPoint & Google Slides
Project Status
Cybersecurity Timeline Roadmap Slide for PowerPoint & Google Slides
Information Technology
Dynamic Winding Roadmap Infographic Template for PowerPoint & Google Slides
Roadmap
Six-Step Roadmap Infographic Template for PowerPoint & Google Slides
Roadmap
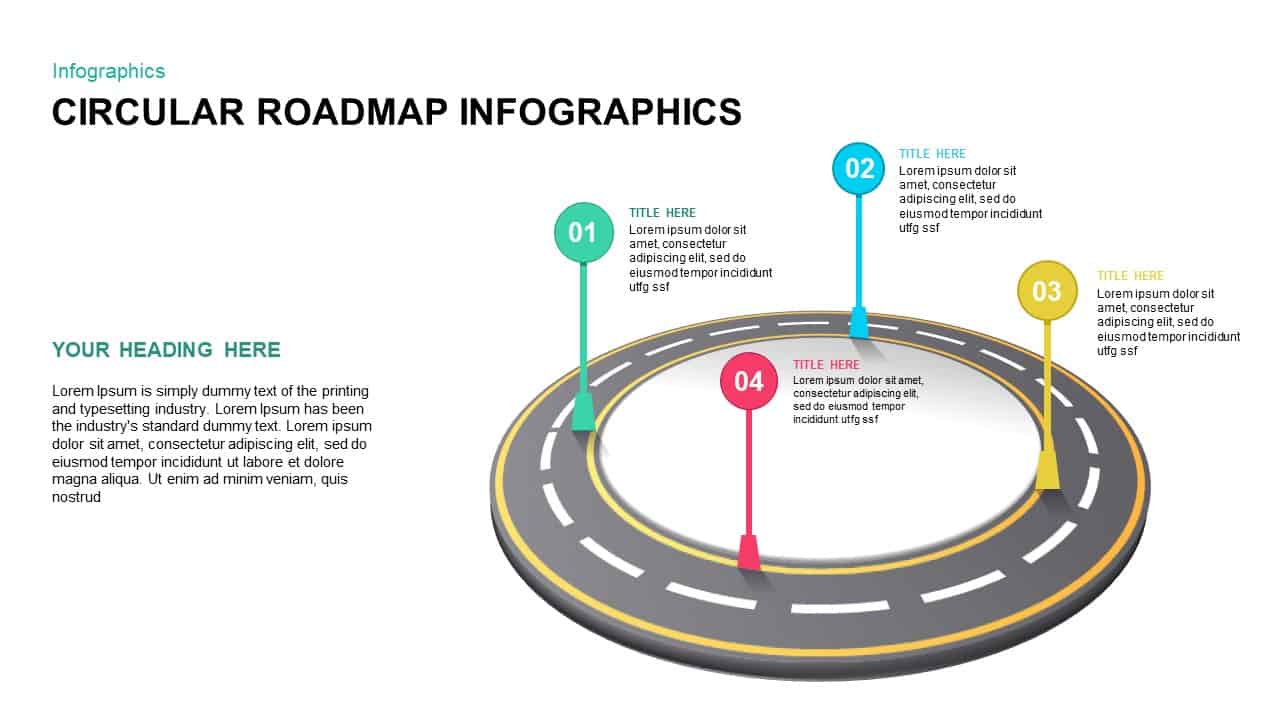
4-Step Circular Roadmap Infographic Template for PowerPoint & Google Slides
Roadmap
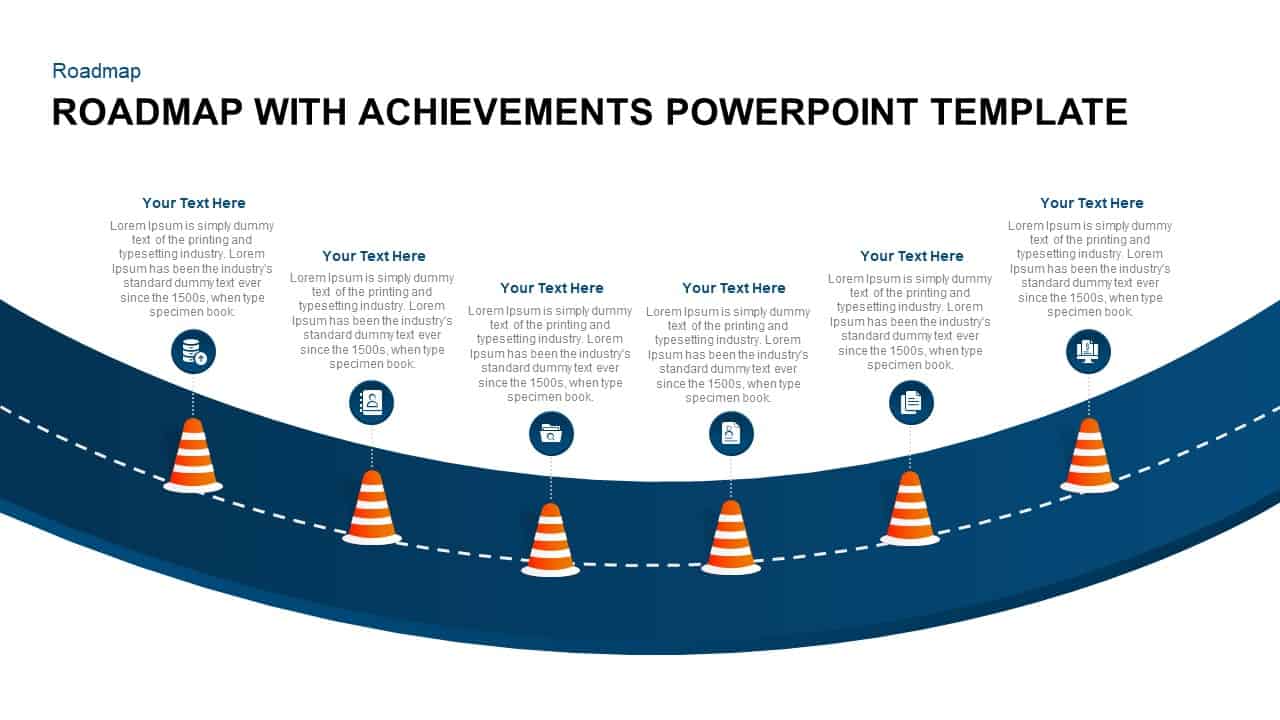
Roadmap with Achievements Infographic Template for PowerPoint & Google Slides
Roadmap
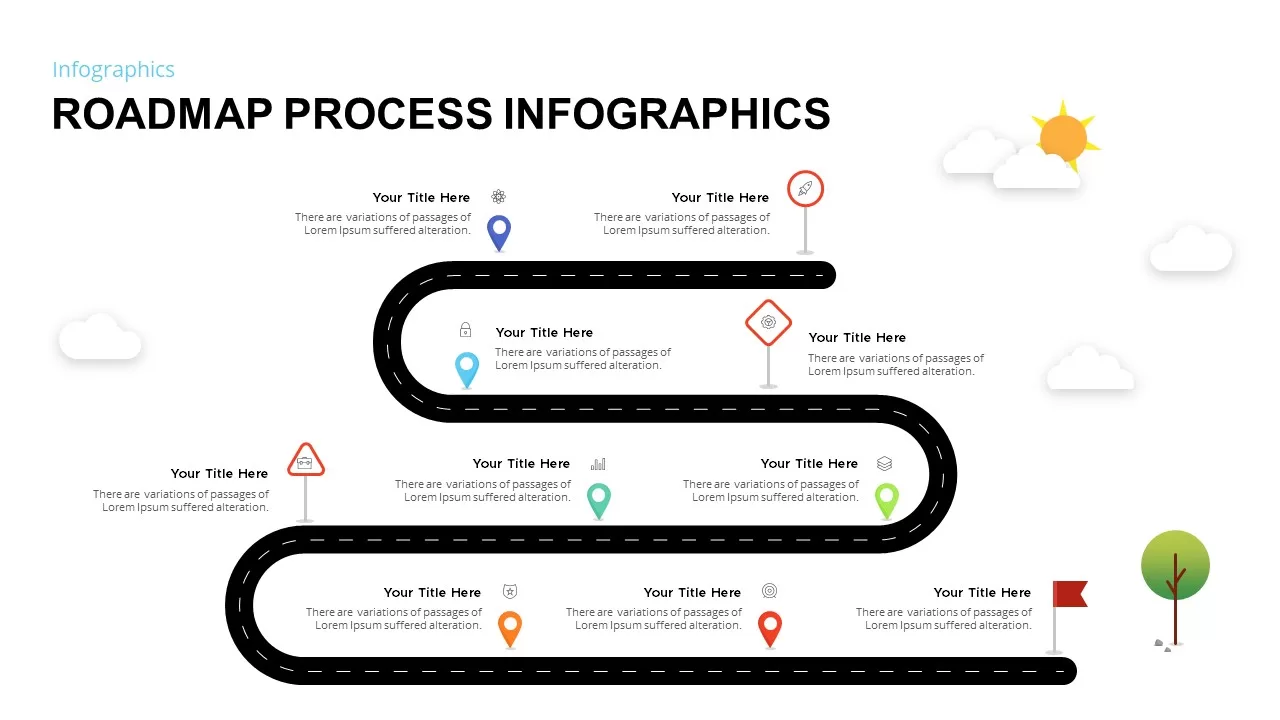
Roadmap Process Infographic Template for PowerPoint & Google Slides
Roadmap
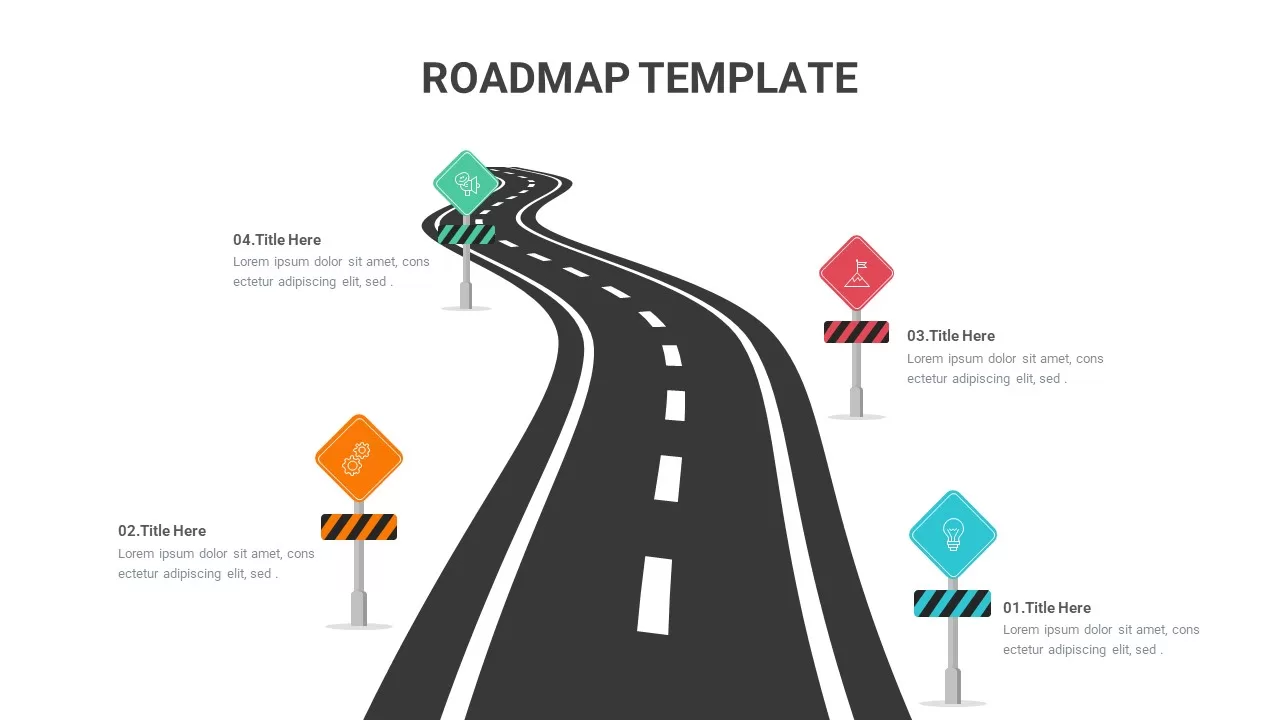
Roadmap Infographic Template for PowerPoint & Google Slides
Roadmap
Serpentine Roadmap Infographic Template for PowerPoint & Google Slides
Roadmap
Eight-Step Winding Roadmap Infographic Template for PowerPoint & Google Slides
Roadmap
Free Multi-Level Roadmap Infographic Template for PowerPoint & Google Slides
Roadmap
Free
Roadmap Infographic template for PowerPoint & Google Slides
Roadmap
Transformation Roadmap Infographic Pack Template for PowerPoint & Google Slides
Timeline
Multi-Phase Research Roadmap Infographic Template for PowerPoint & Google Slides
Roadmap
Training Roadmap Infographic Pack Template for PowerPoint & Google Slides
Roadmap
Automation Process Roadmap Infographic Template for PowerPoint & Google Slides
Roadmap
Curved Roadmap Infographic Vision Journey Template for PowerPoint & Google Slides
Business Strategy
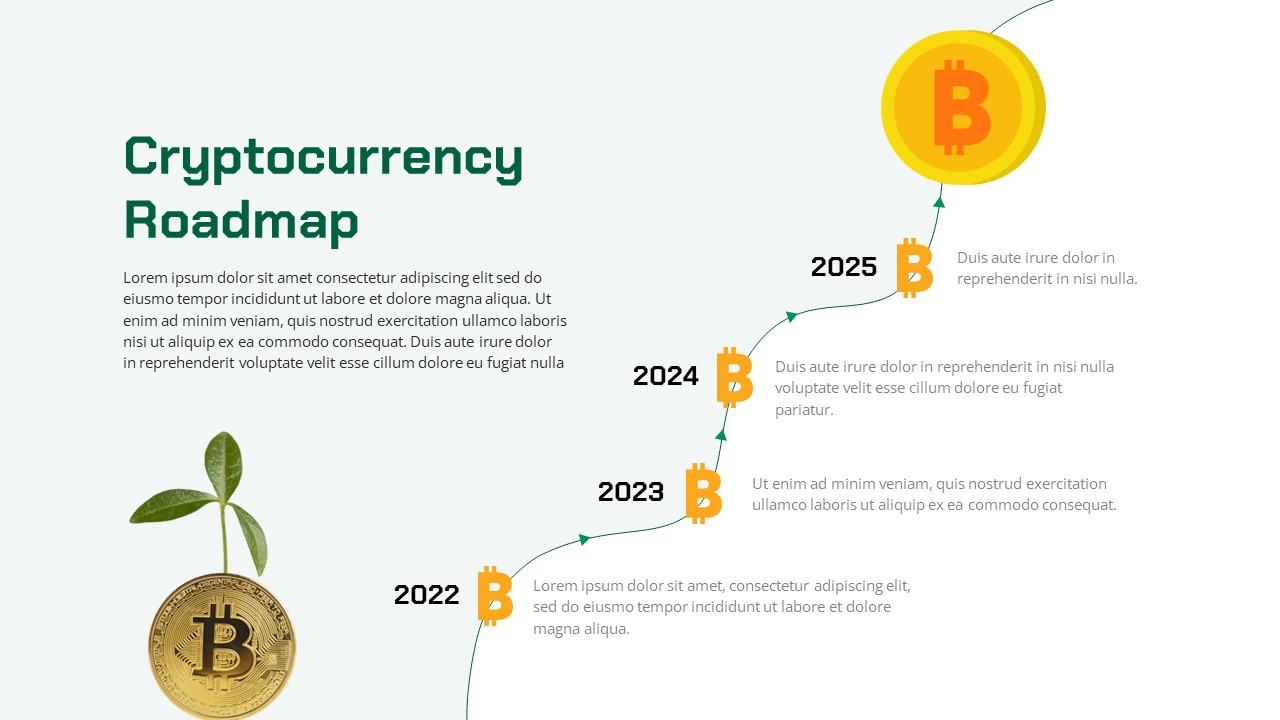
Cryptocurrency Roadmap Infographic Template for PowerPoint & Google Slides
Timeline
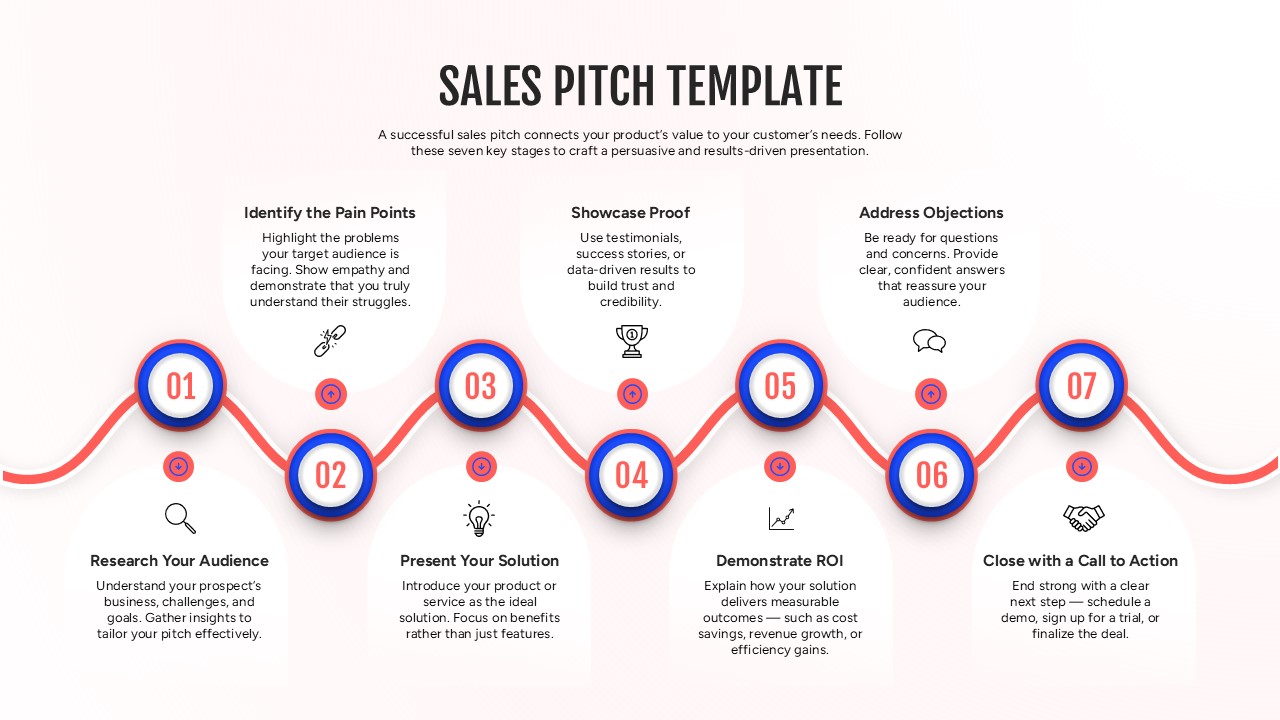
Sales Pitch Roadmap Infographic Template for PowerPoint & Google Slides
Marketing
7-Stage Colorful Timeline Infographic Template for PowerPoint & Google Slides
Timeline
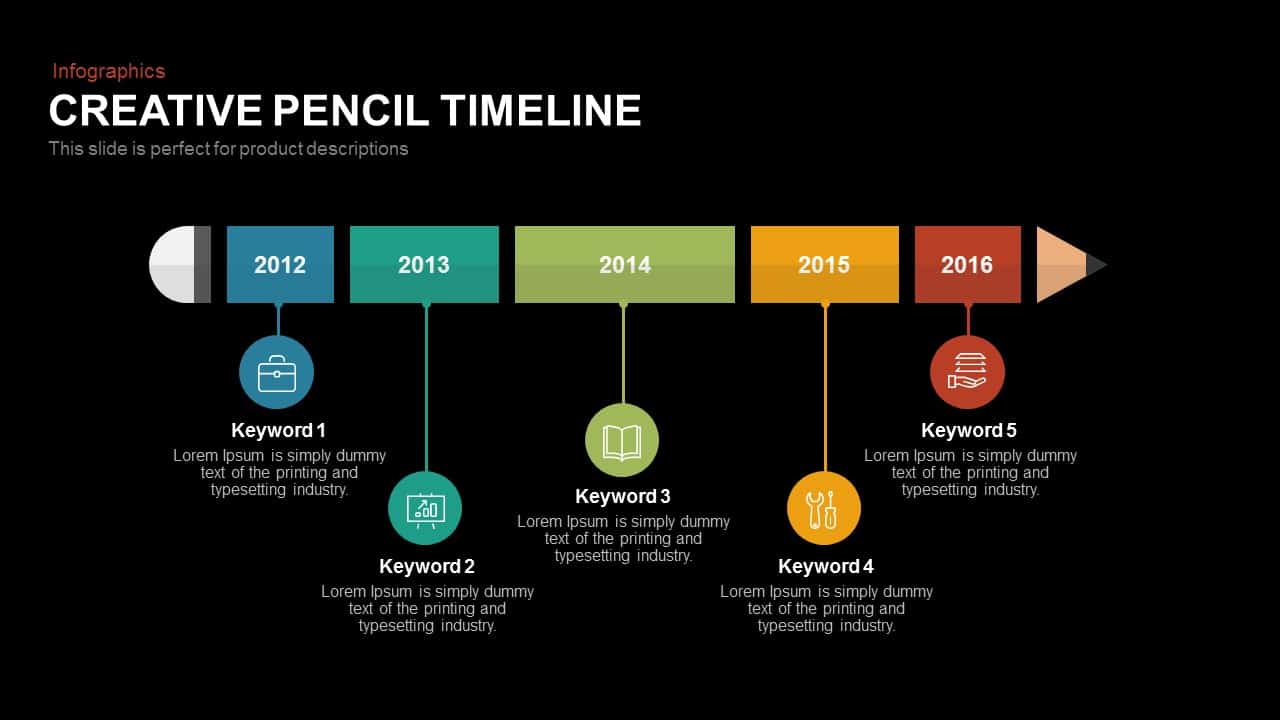
Creative Pencil Timeline Infographic Template for PowerPoint & Google Slides
Timeline
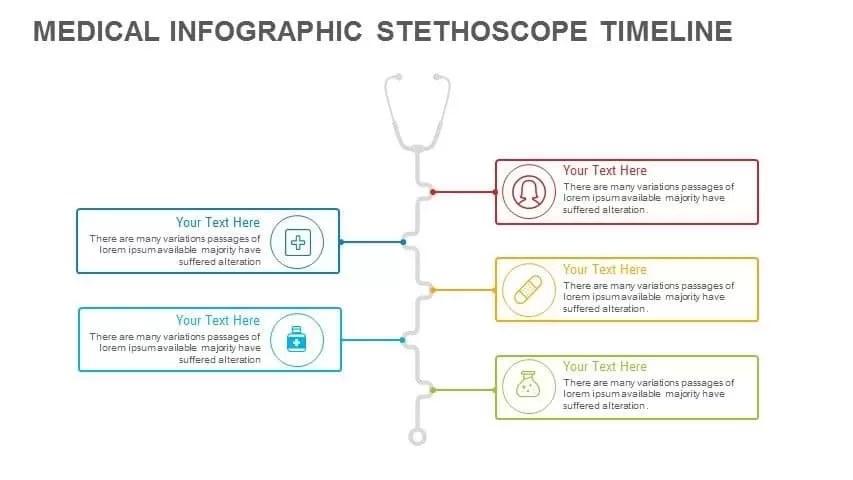
Medical Stethoscope Timeline Infographic Template for PowerPoint & Google Slides
Timeline
Modern Bubble Timeline Infographic Template for PowerPoint & Google Slides
Timeline
Creative Bubble Timeline Infographic Template for PowerPoint & Google Slides
Timeline
Arrow Timeline Infographic Slide Template for PowerPoint & Google Slides
Timeline
Animated 5-Stage Puzzle Timeline Infographic Template for PowerPoint & Google Slides
Timeline
Six-Stage Timeline Infographic Template for PowerPoint & Google Slides
Timeline
Five-Year Gradient Timeline Infographic Template for PowerPoint & Google Slides
Timeline
Business Timeline Envelope Infographic Template for PowerPoint & Google Slides
Timeline
5-Stage Timeline Infographic Slide Template for PowerPoint & Google Slides
Timeline
Seven-Stage Hexagon Timeline Infographic Template for PowerPoint & Google Slides
Timeline
Time & Date Infographic Timeline Template for PowerPoint & Google Slides
Decks
Modern Green Timeline Infographic Template for PowerPoint & Google Slides
Timeline
Free Five-Step Circular Timeline Infographic Template for PowerPoint & Google Slides
Timeline
Free
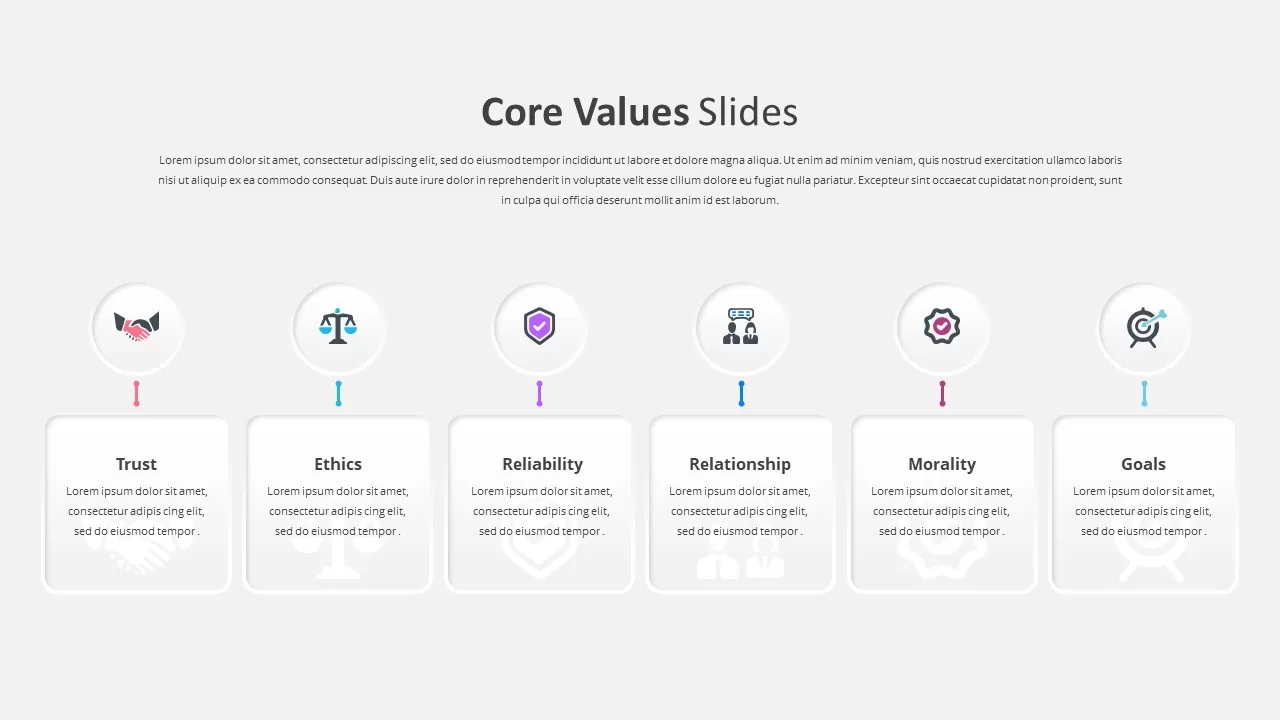
Six Core Values Infographic Timeline Template for PowerPoint & Google Slides
Comparison
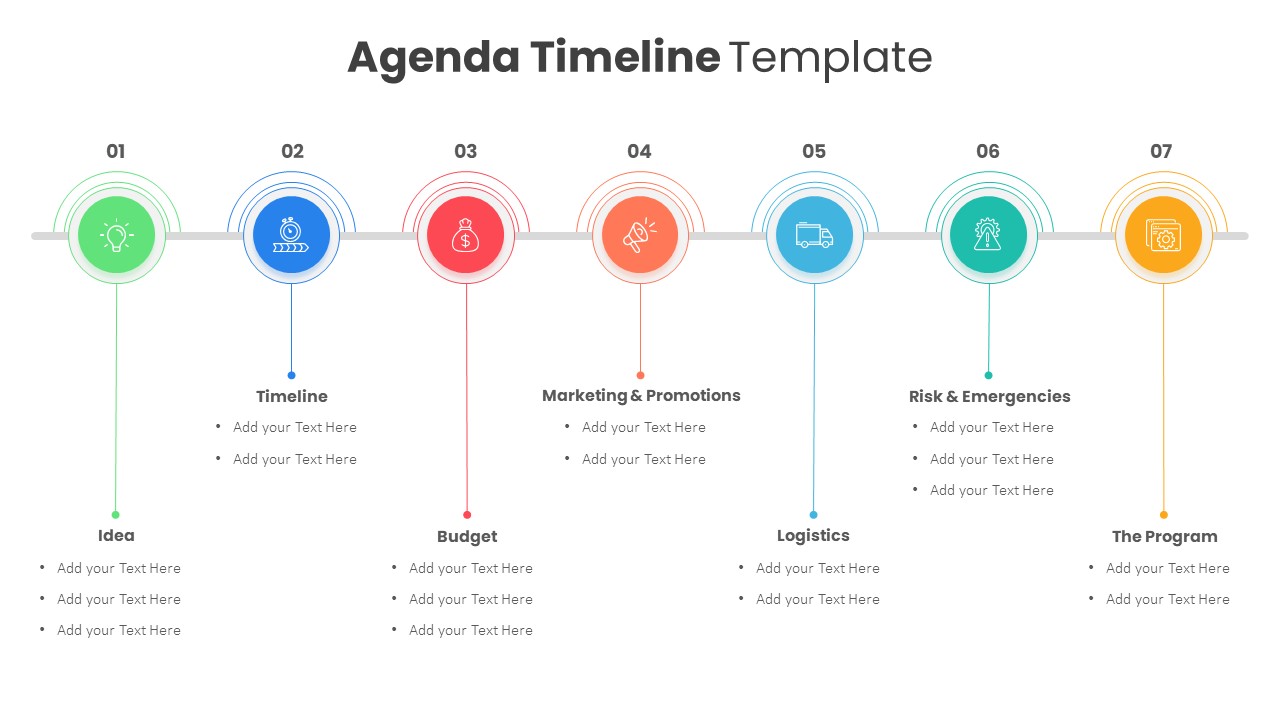
Colorful Agenda Timeline Infographic Template for PowerPoint & Google Slides
Agenda
Dynamic Chevron Timeline Infographic Template for PowerPoint & Google Slides
Timeline
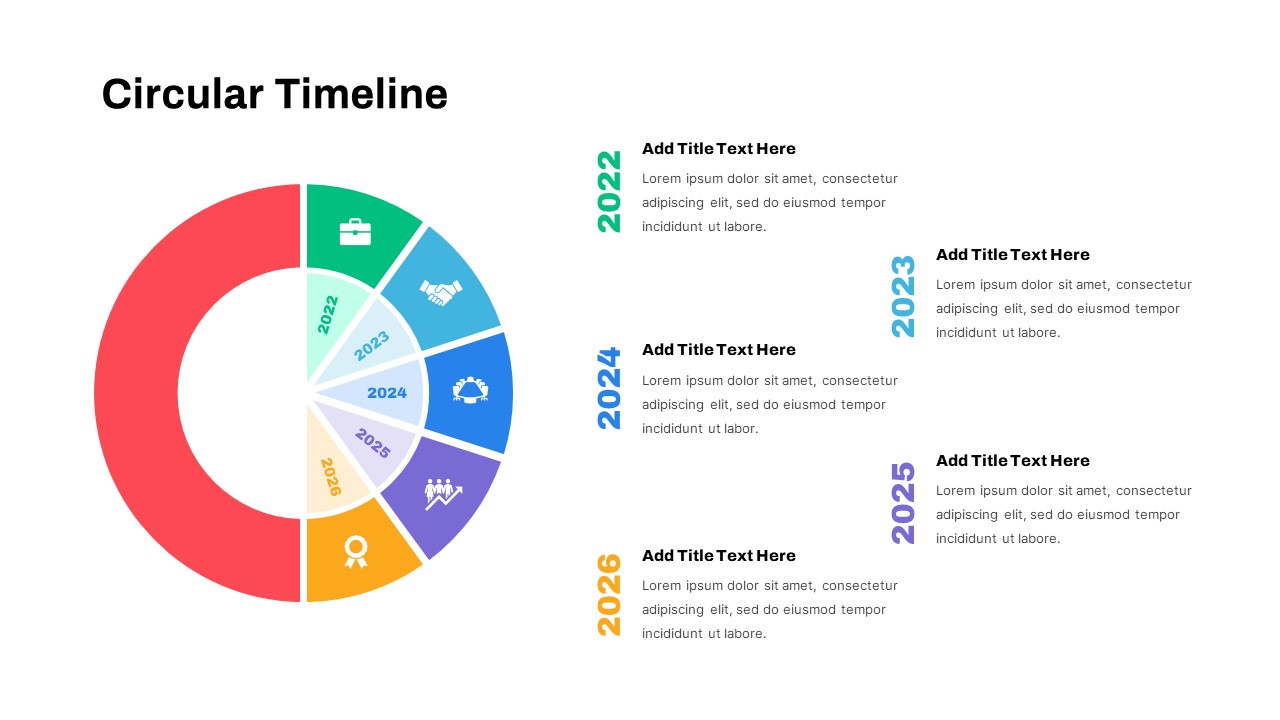
Circular Timeline Infographic Template for PowerPoint & Google Slides
Timeline
Minimalist Timeline Infographic Template for PowerPoint & Google Slides
Timeline
High-Level Timeline Infographic Template for PowerPoint & Google Slides
Timeline
Modern Six-Point Timeline Infographic Template for PowerPoint & Google Slides
Timeline
Brief History Timeline Infographic Template for PowerPoint & Google Slides
Timeline
Project Milestone Timeline Infographic Template for PowerPoint & Google Slides
Timeline
Curved Road Timeline Infographic Template for PowerPoint & Google Slides
Timeline
Dark Horizontal Timeline Infographic Template for PowerPoint & Google Slides
Timeline