Project Status with Progress & Priority Template for PowerPoint & Google Slides

Description
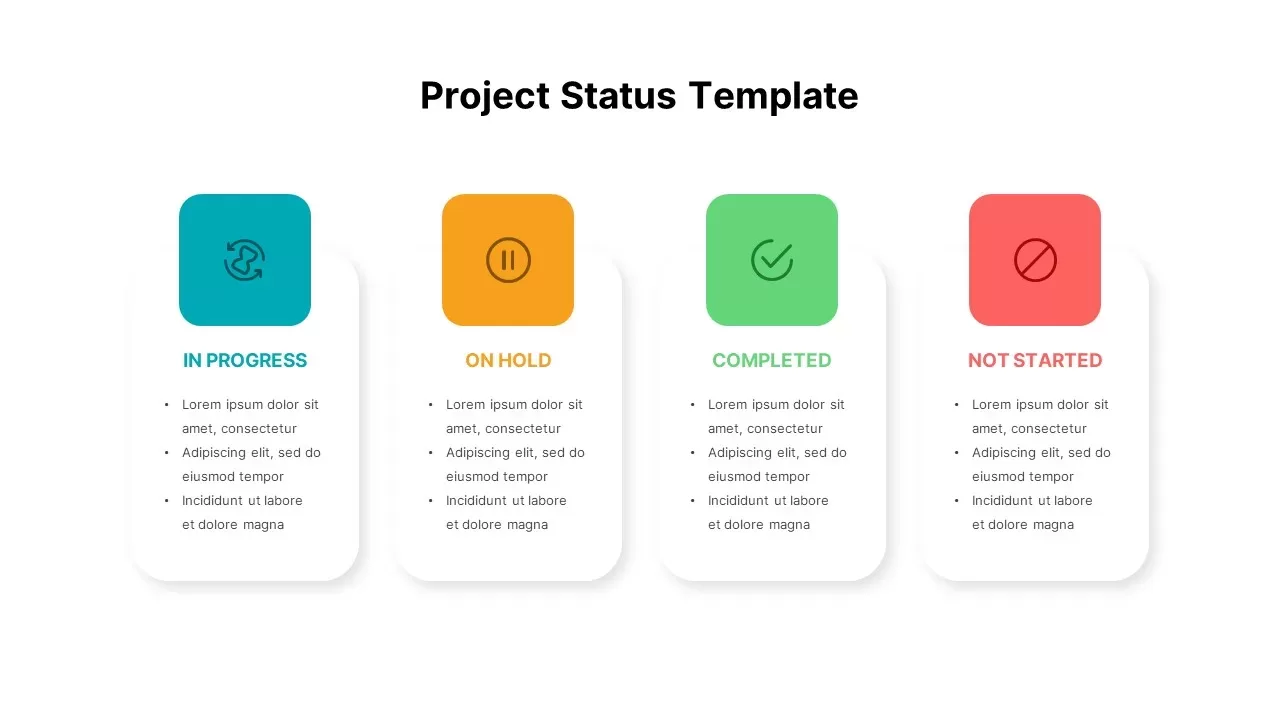
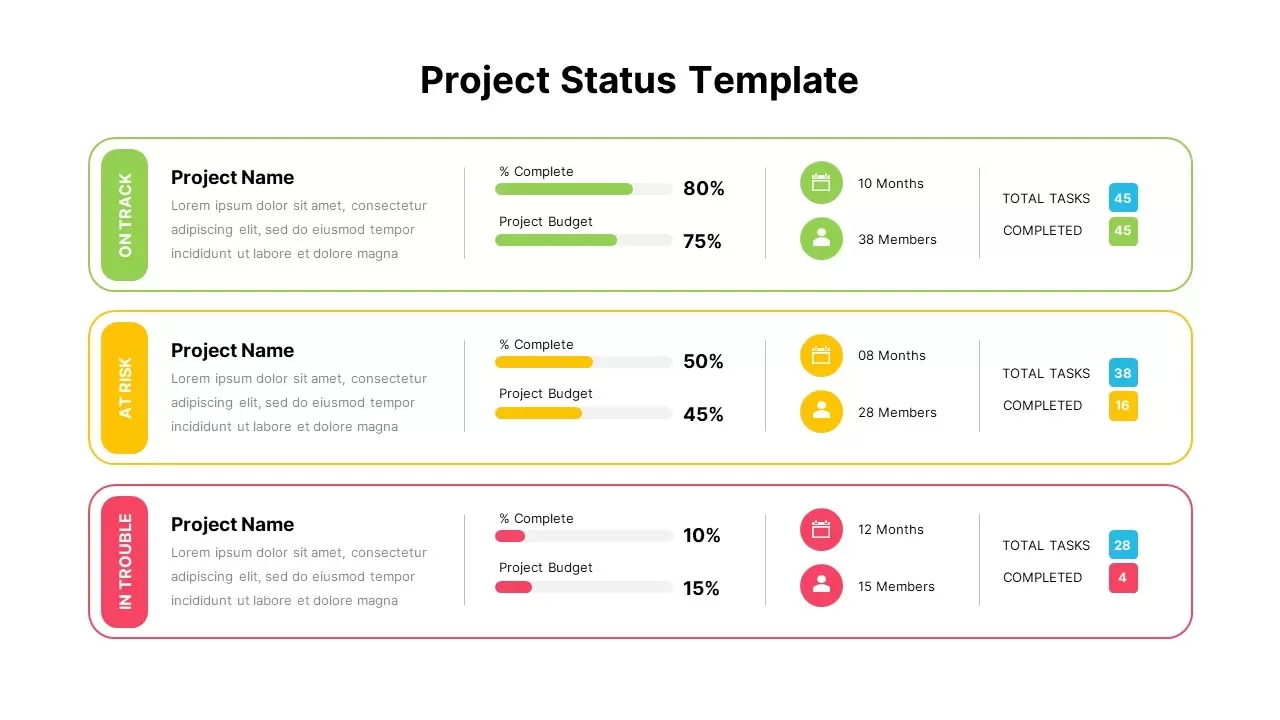
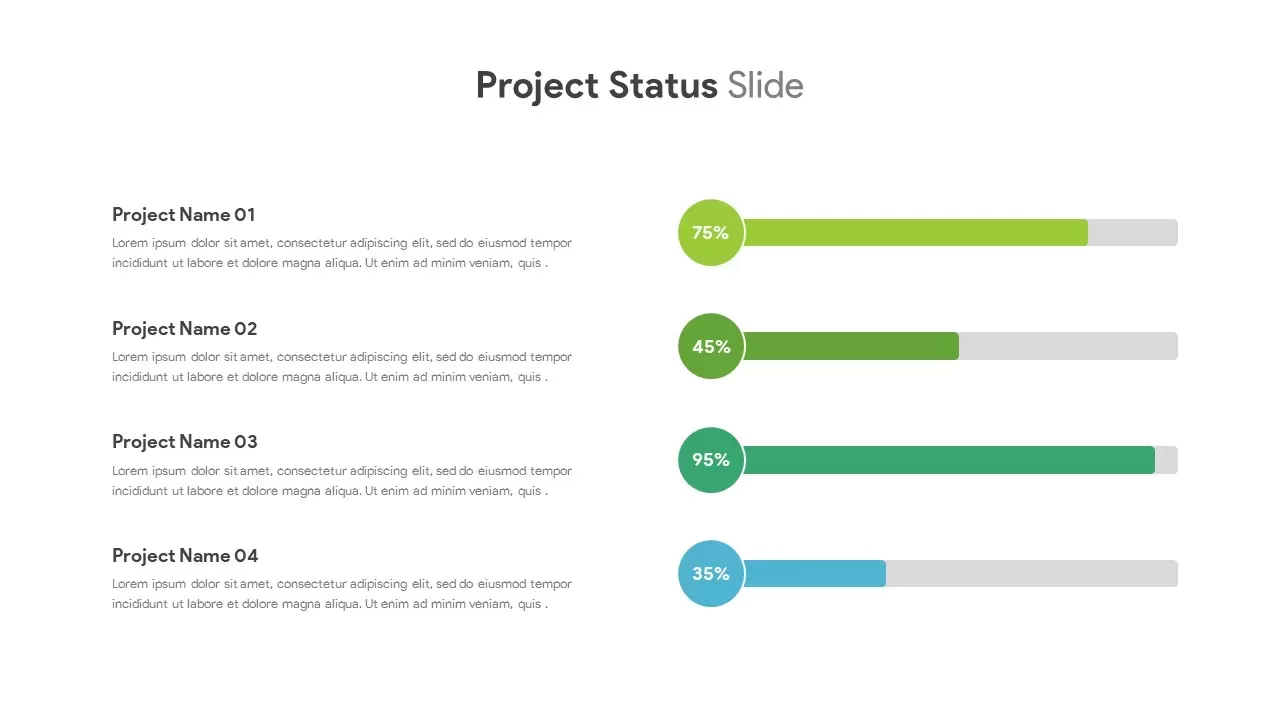
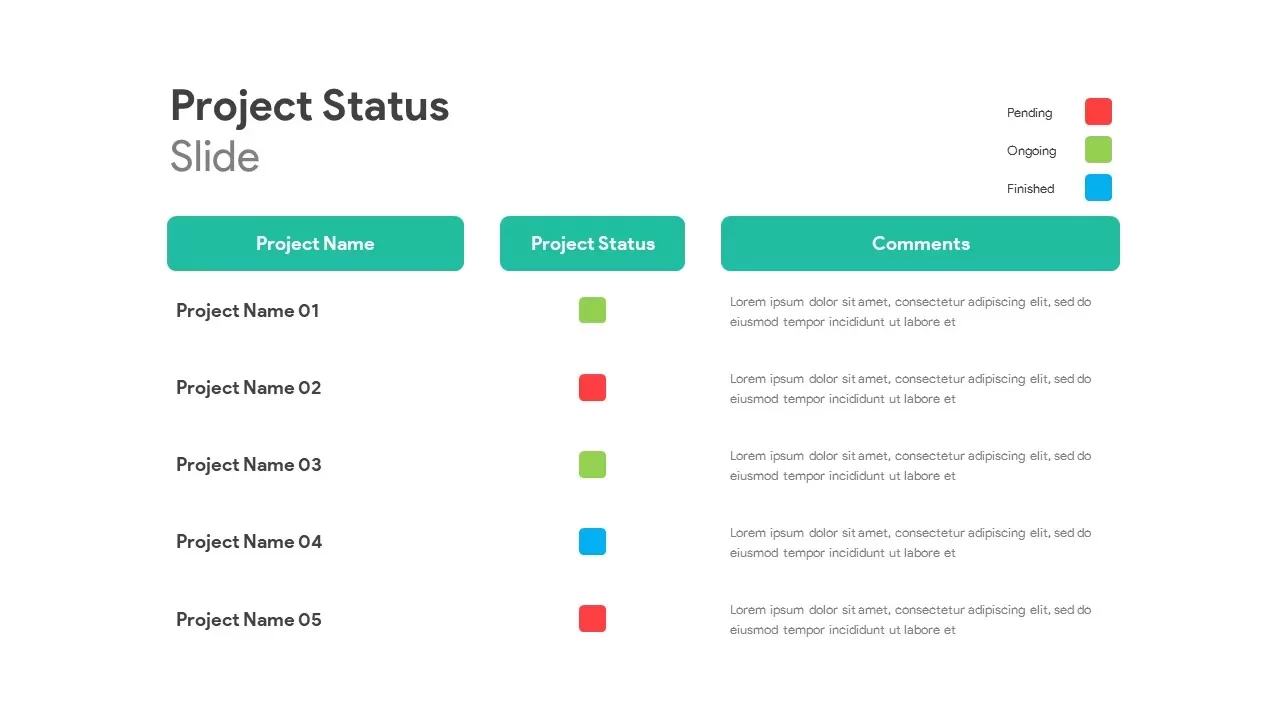
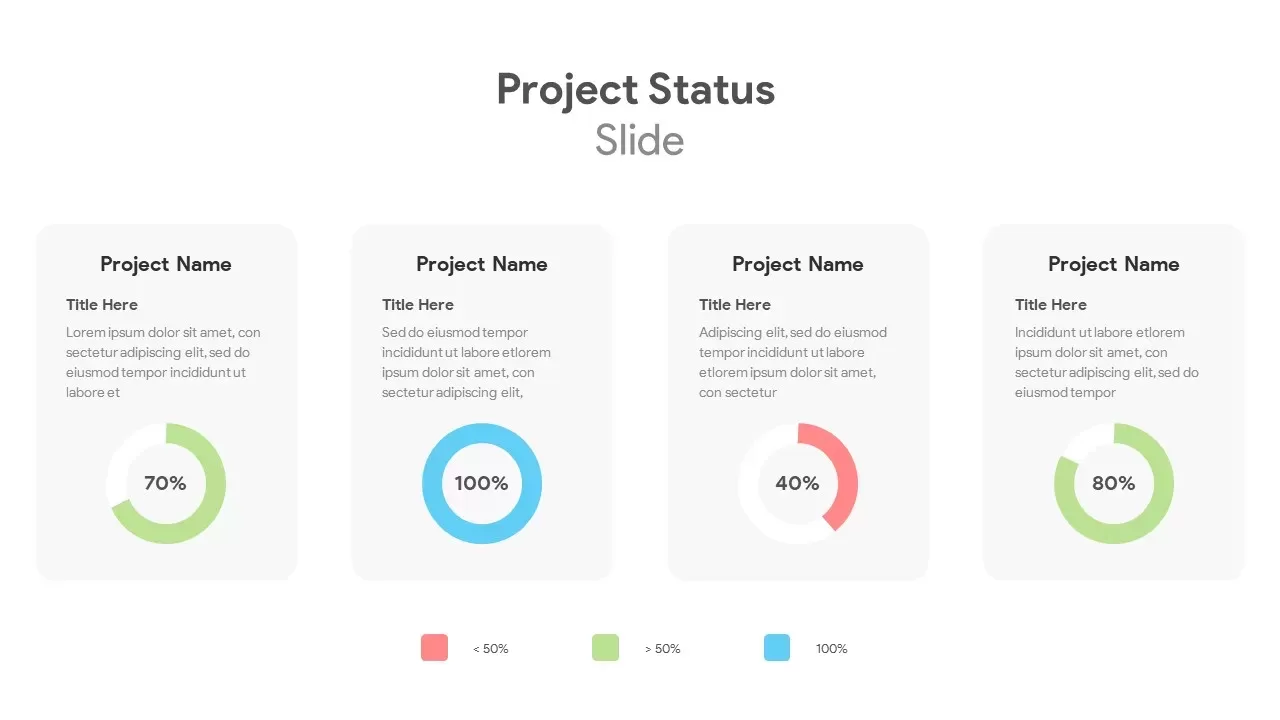
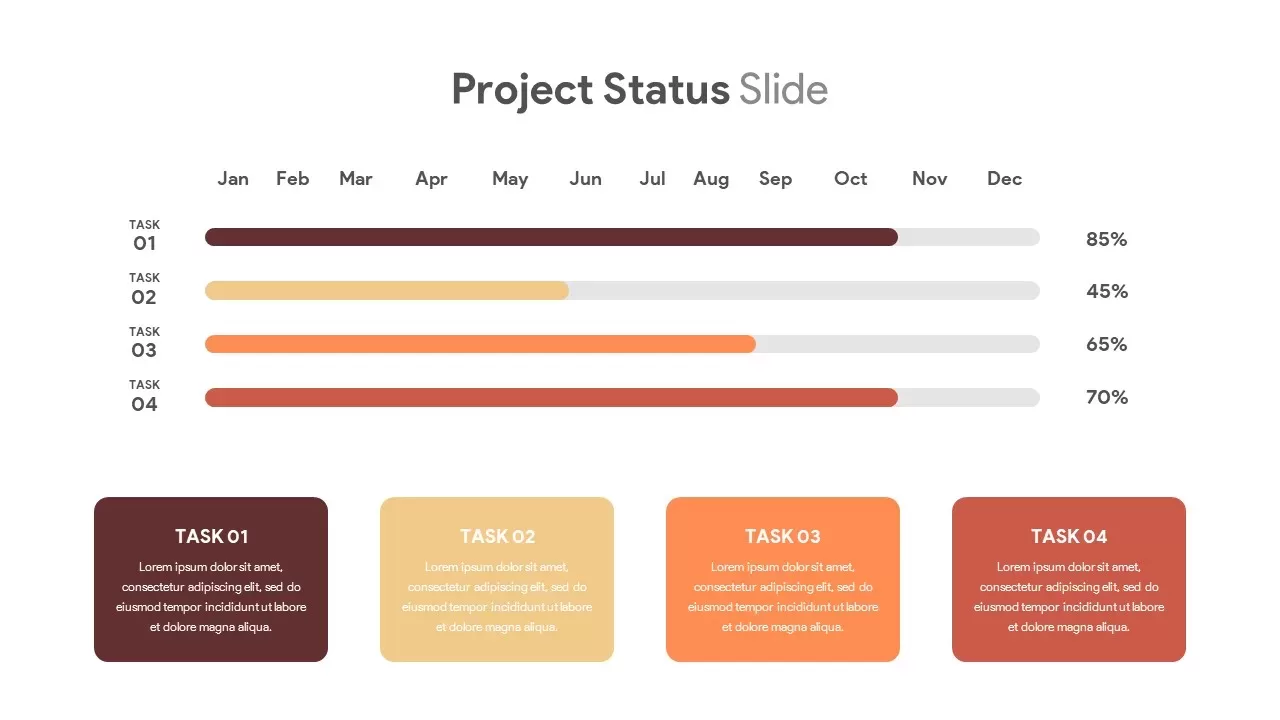
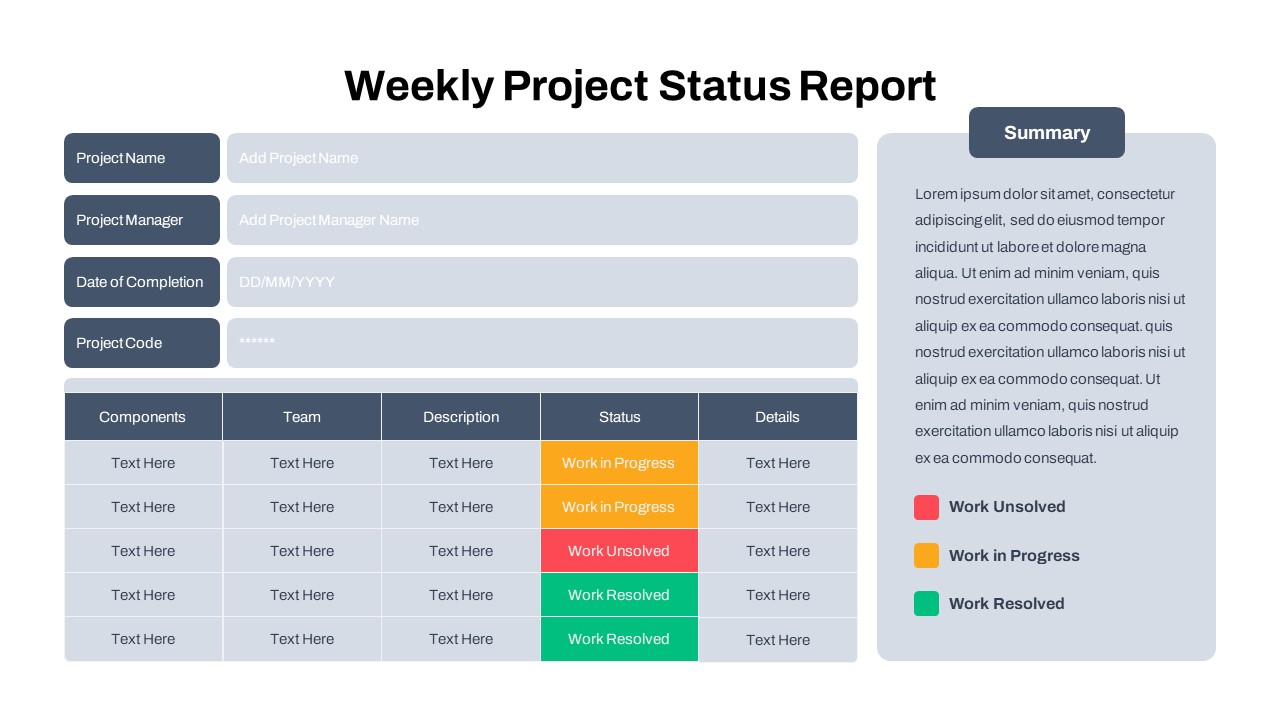
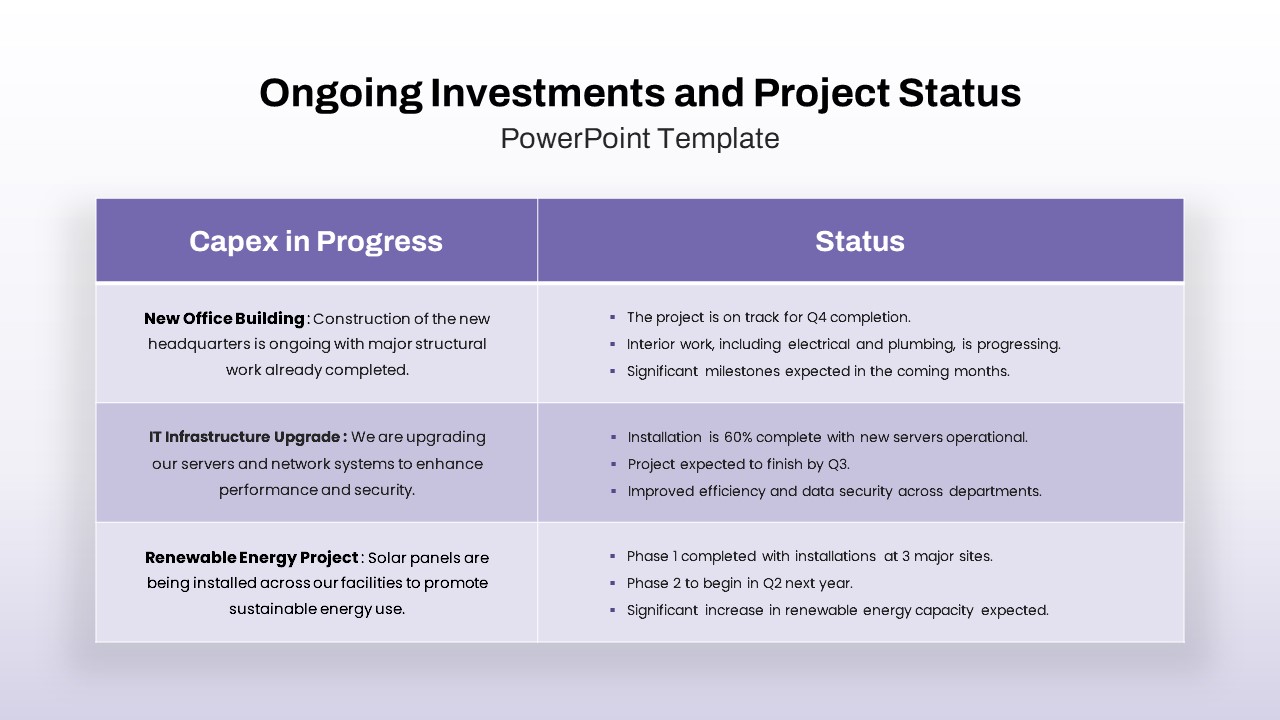
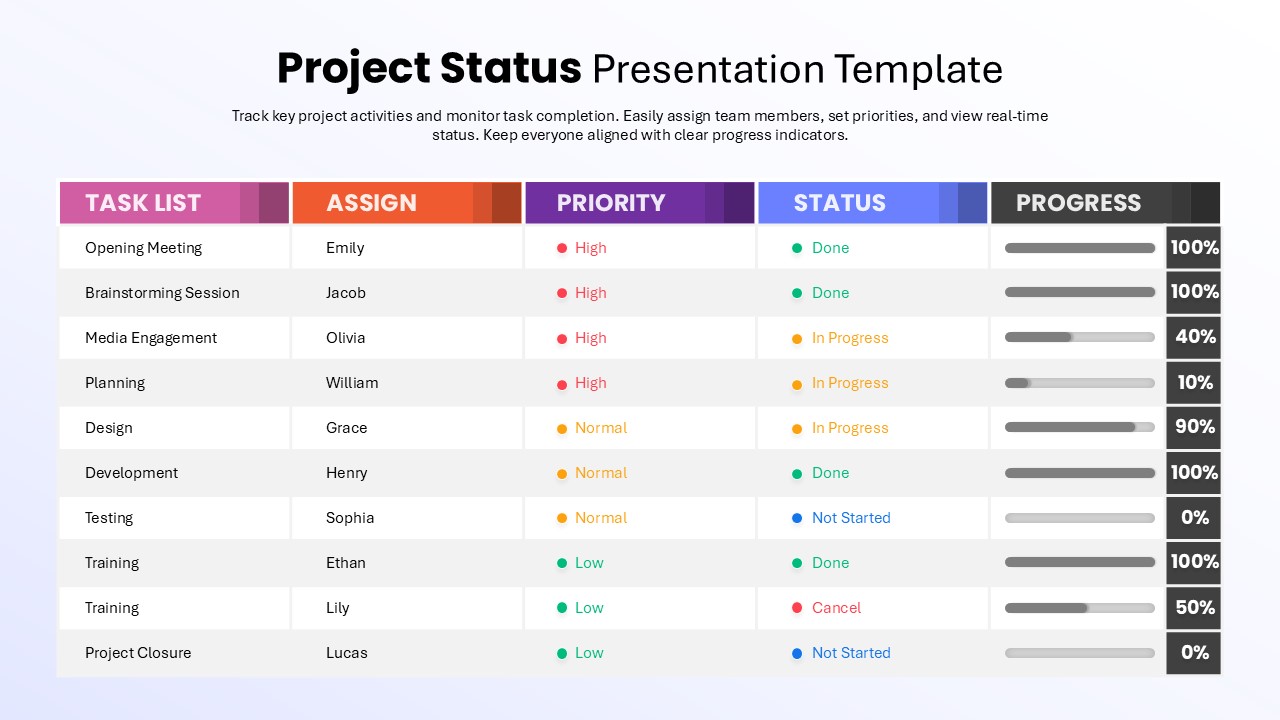
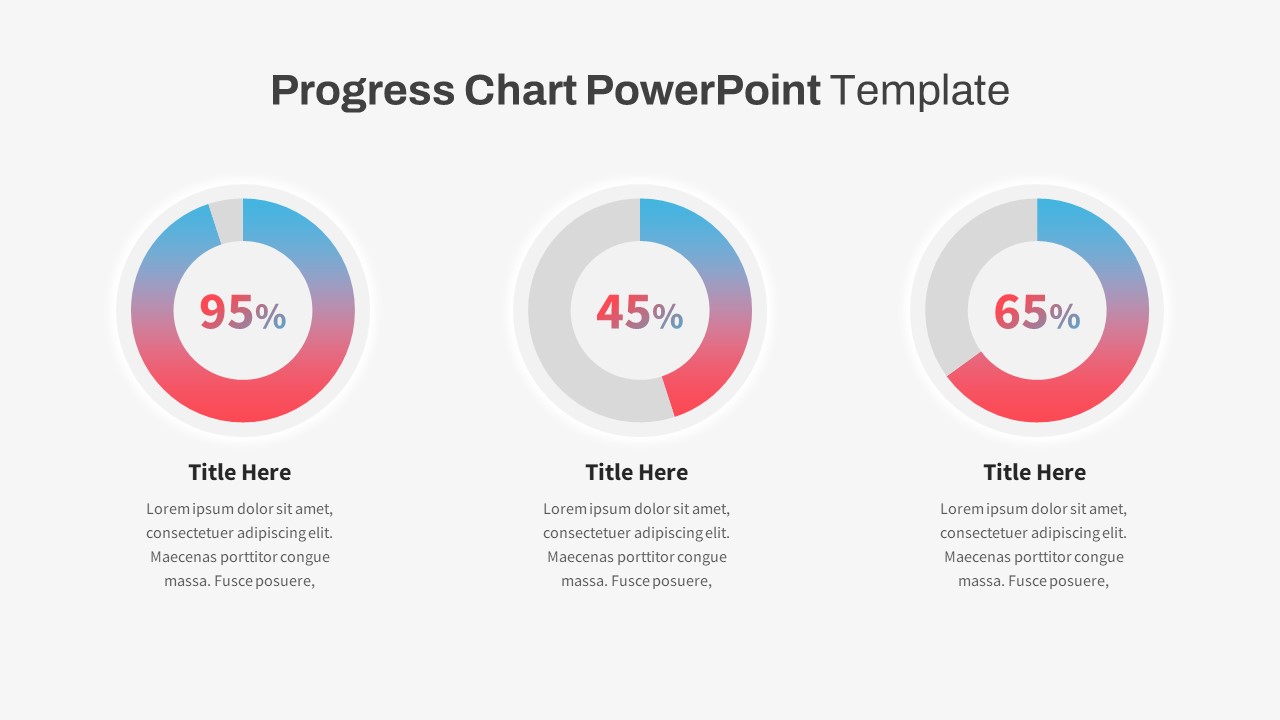
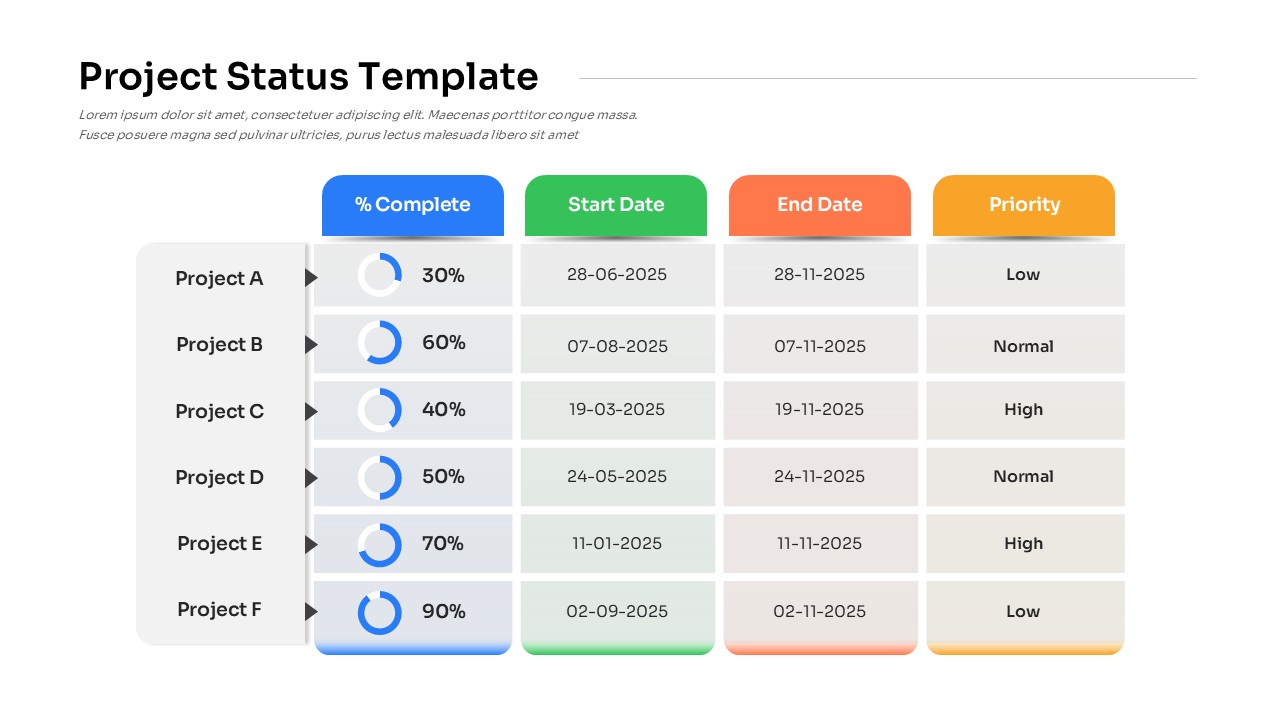
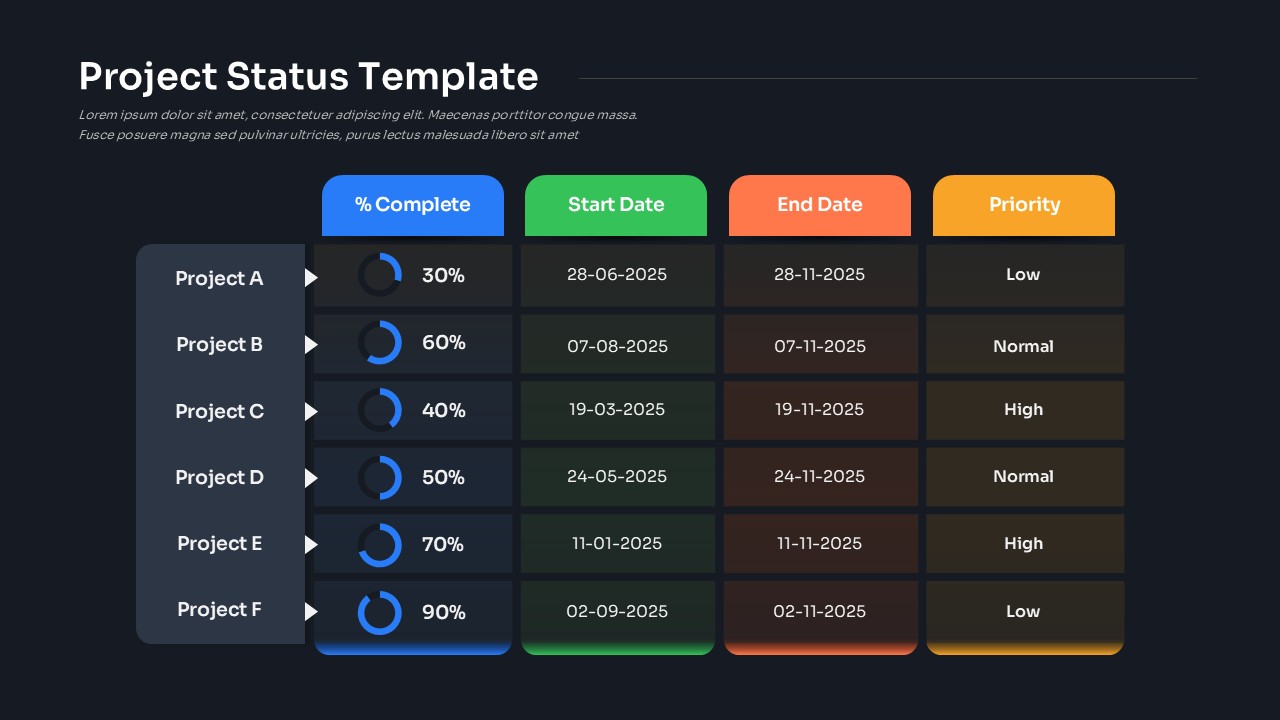
Present portfolio health at a glance with a crisp project status table. Projects are listed down the left panel, while four color-coded columns organize the essentials: % Complete, Start Date, End Date, and Priority. Each row combines a circular progress gauge with a numeric percentage, making completion easy to scan. Rounded headers in blue, green, orange, and amber, soft shadows, and alternating row fills enhance readability without clutter. Rename the row labels to teams, epics, or workstreams; add notes in the subtitle for context such as reporting period or methodology.
Everything is fully editable—type dates in your preferred format, adjust the progress rings, change priority labels (Low/Normal/High), or duplicate rows to add initiatives. The layout uses vector shapes and consistent typography, so it scales cleanly on large screens and exports sharply to PDF. Use conditional color accents to spotlight risk or on-track items, and sort rows to highlight critical efforts first. This balanced grid helps stakeholders compare timelines, spot slippage between planned dates, and align on what needs attention next.
Who is it for
PMO leaders, project and program managers, product owners, operations leads, consultants, and marketing or IT teams who report status to executives or clients and need a concise, professional snapshot.
Other Uses
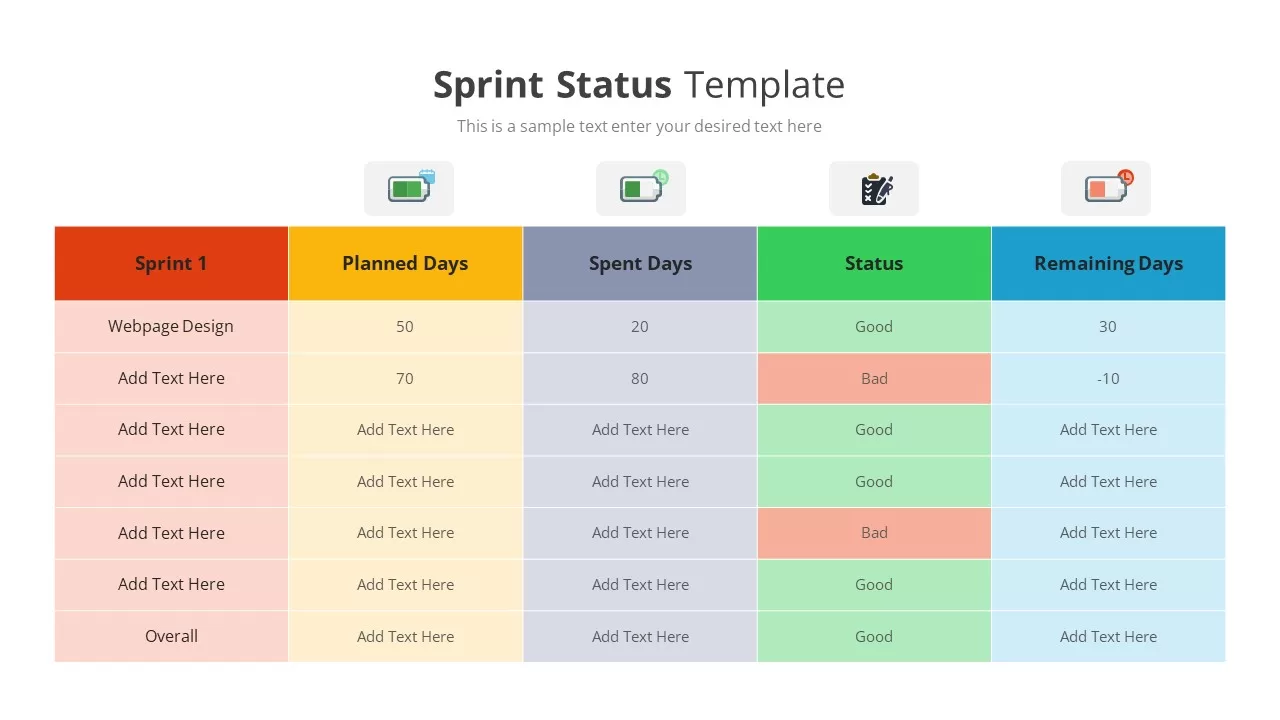
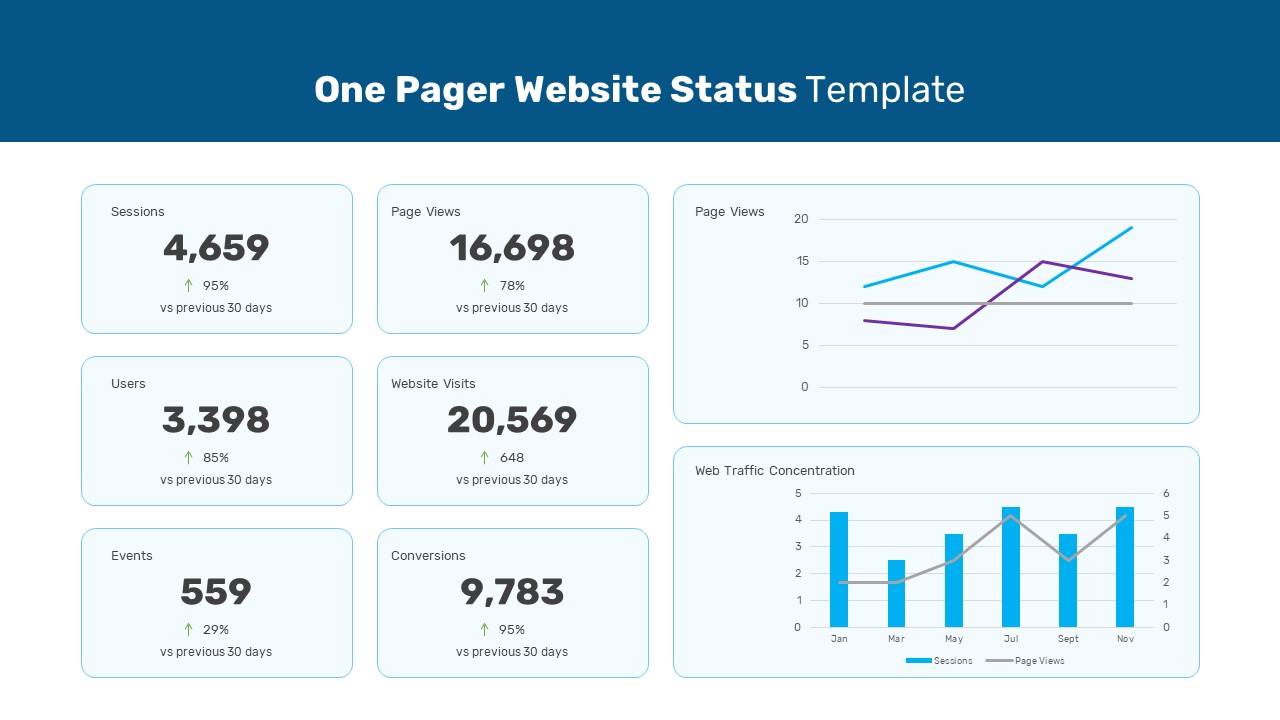
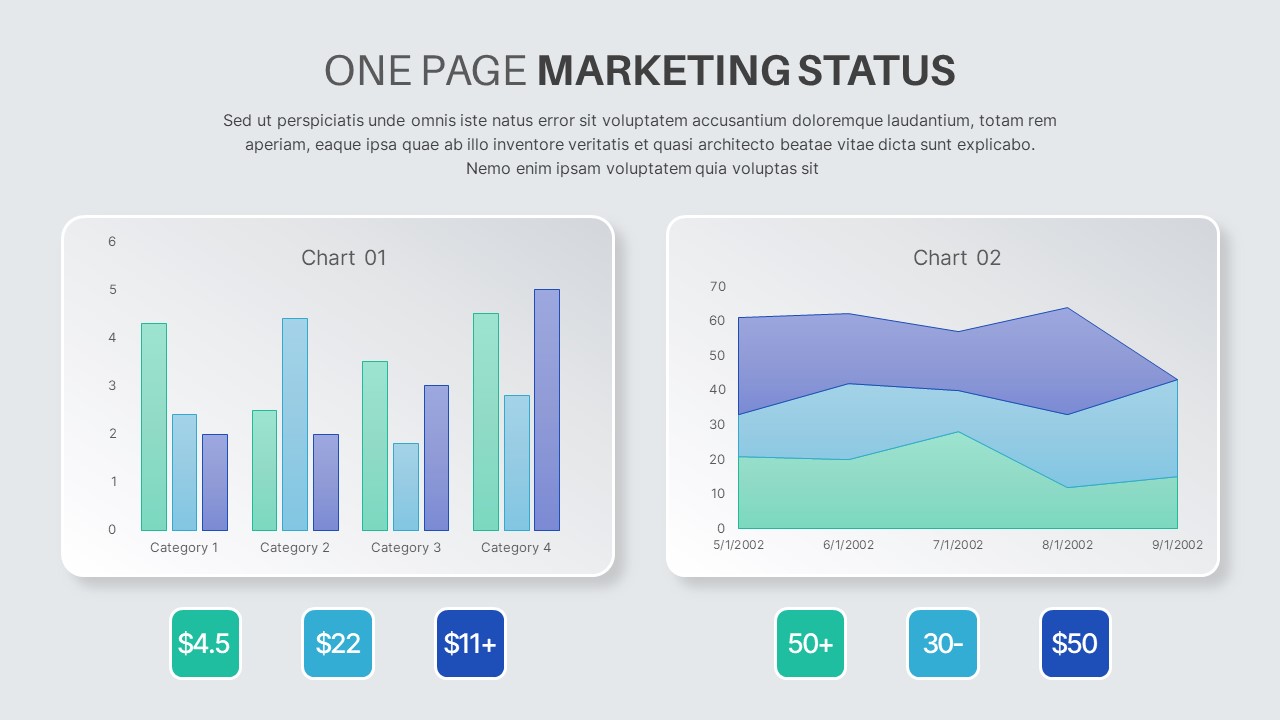
Repurpose the table for campaign tracking, sprint or release summaries, roadmap checkpoints, OKR progress, hiring plans, or vendor deliverables. Convert column titles to budget, owner, or risk to suit governance or portfolio reviews.
Login to download this file

Item ID
SB05437Designed By
Athira
Related Templates

Project Progress Dashboard Pie Charts Template for PowerPoint & Google Slides
Project
Modern Project Status Report Dashboard Template for PowerPoint & Google Slides
Project Status
Clean Minimal Project Status Update Template for PowerPoint & Google Slides
Project
Project Status Dashboard Table Template for PowerPoint & Google Slides
Project Status
Project Status Dashboard with Metrics Template for PowerPoint & Google Slides
Project Status
Colorful Project Status Dashboard Template for PowerPoint & Google Slides
Project Status
Color-Coded Project Status Template for PowerPoint & Google Slides
Project Status
Color-Coded Project Status Slide Template for PowerPoint & Google Slides
Project Status
Project Status Table Template for PowerPoint & Google Slides
Project Status
Circular Project Status Template for PowerPoint & Google Slides
Project Status
Project Status Dashboard Template for PowerPoint & Google Slides
Project Status
Horizontal Timeline Project Status Template for PowerPoint & Google Slides
Project Status
One Pager Project Status Dashboard Template for PowerPoint & Google Slides
Project Status
Weekly Project Status Dashboard Template for PowerPoint & Google Slides
Project Status
Free Simple Weekly Project Status Report Template for PowerPoint & Google Slides
Project Status
Free
Ongoing Investments and Project Status Template for PowerPoint & Google Slides
Project Status
Dynamic Project Status Tracking Table Template for PowerPoint & Google Slides
Project Status
Project Status Dashboard Report Template for PowerPoint & Google Slides
Project Status
Project Status Update Dashboard Table Template for PowerPoint & Google Slides
Project Status
Project Status Dashboard Template for PowerPoint & Google Slides
Project Status
Comprehensive Project Status Report Template for PowerPoint & Google Slides
Project Status
Dashboard Project Status Template for PowerPoint & Google Slides
Project Status
Project Status Template Dashboard with Gauge for PowerPoint & Google Slides
Project Status
Project Status Dashboard with RAG Legend Template for PowerPoint & Google Slides
Project Status
Project Status Report Tracker Slide for PowerPoint & Google Slides
Project Status
iPad App Mockup with Progress Metrics Template for PowerPoint & Google Slides
Bar/Column
Success Cloud Progress Infographics Template for PowerPoint & Google Slides
Charts

Growth Arrow for Progress & Growth template for PowerPoint & Google Slides
Arrow
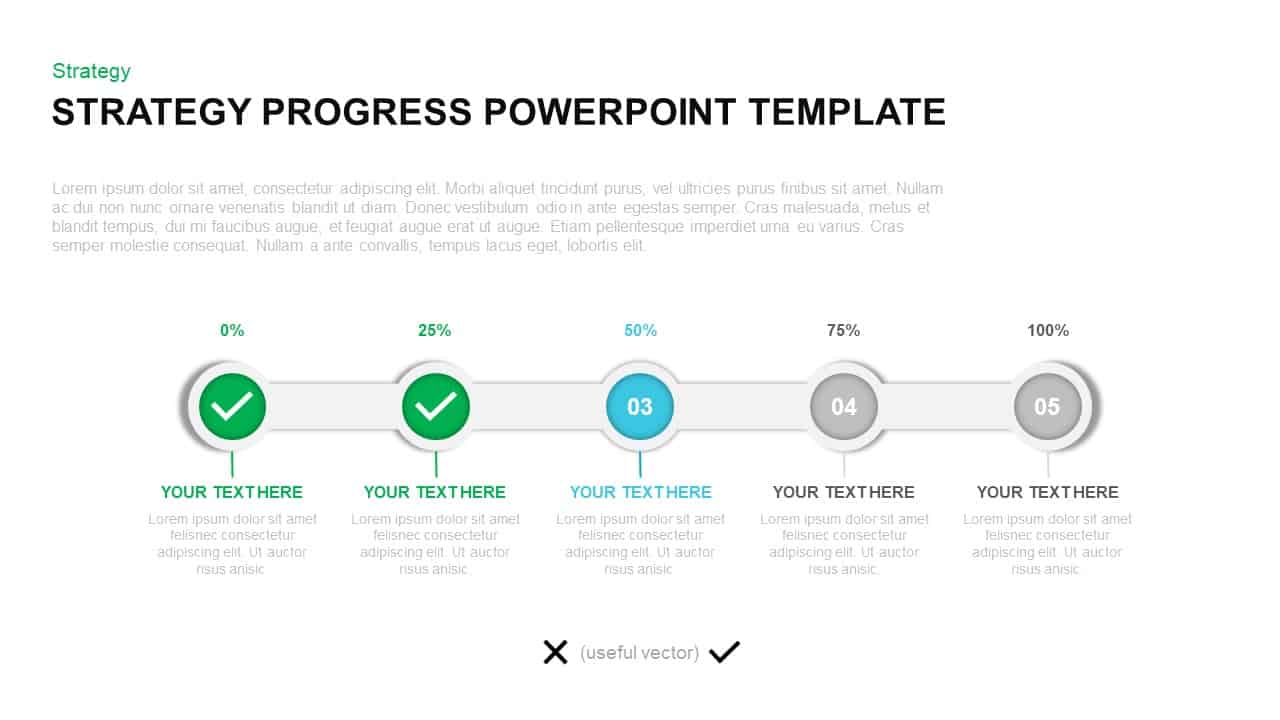
Strategy Progress Timeline Template for PowerPoint & Google Slides
Process
Performance Review Progress Management Template for PowerPoint & Google Slides
Process
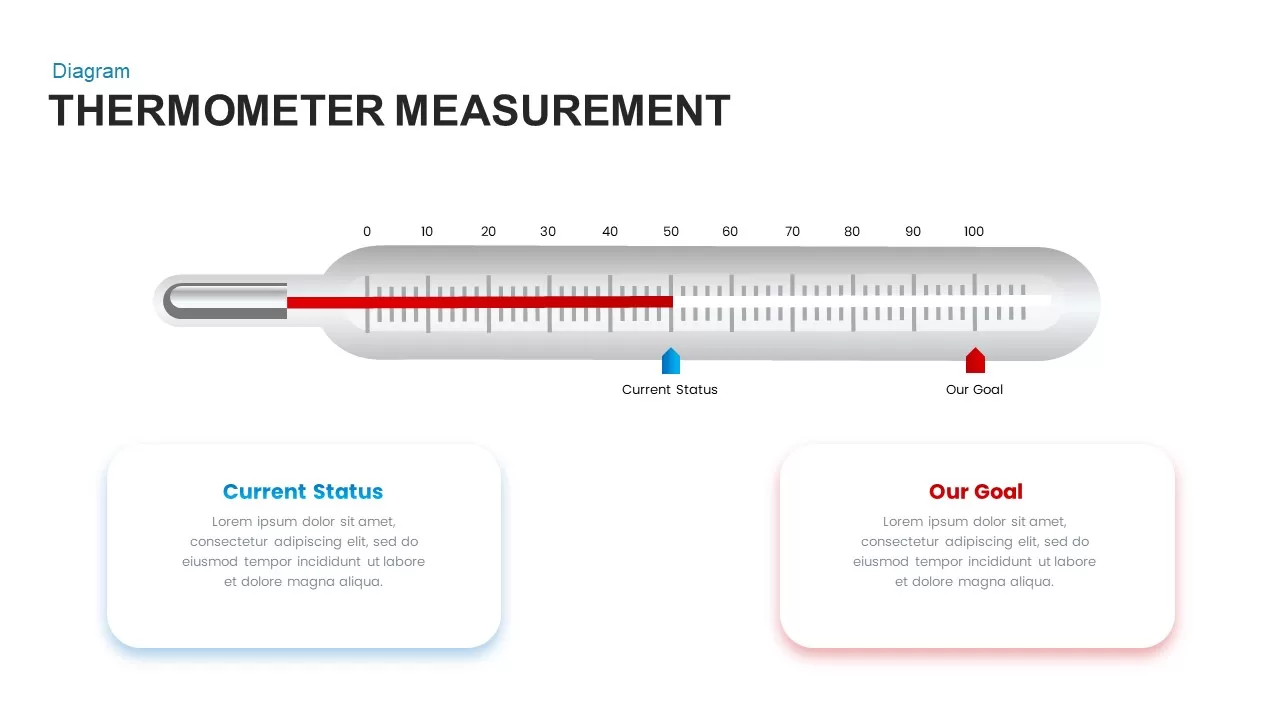
Thermometer Gauge Progress Measurement Template for PowerPoint & Google Slides
Comparison
Free Curved Arrow Progress Chart template for PowerPoint & Google Slides
Project
Free
Dynamic Statistics & Progress Charts Template for PowerPoint & Google Slides
Pie/Donut
Agriculture Infographics Slide with Progress Rings & Metrics Template for PowerPoint & Google Slides
Pie/Donut
Timeline Roadmap with Progress Bar Template for PowerPoint & Google Slides
Timeline
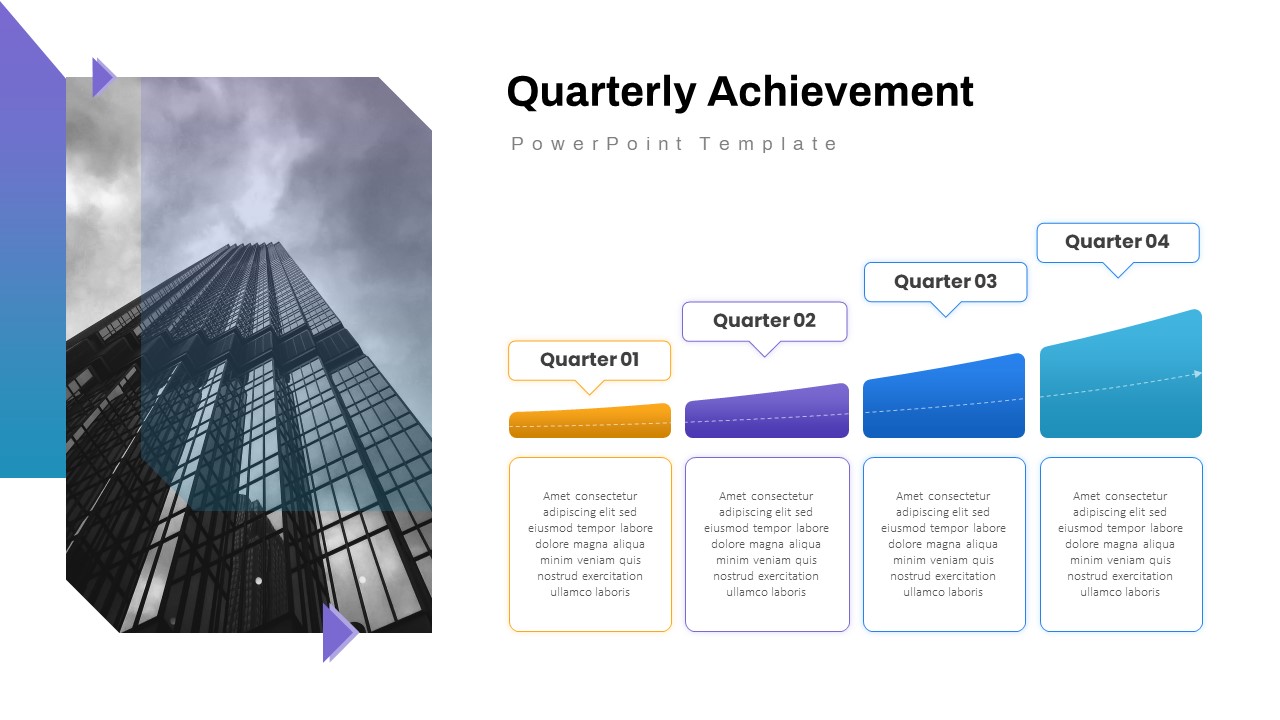
Quarterly Achievement Progress Template for PowerPoint & Google Slides
Accomplishment
Progress Bar and Milestone Visualization Template for PowerPoint & Google Slides
Timeline
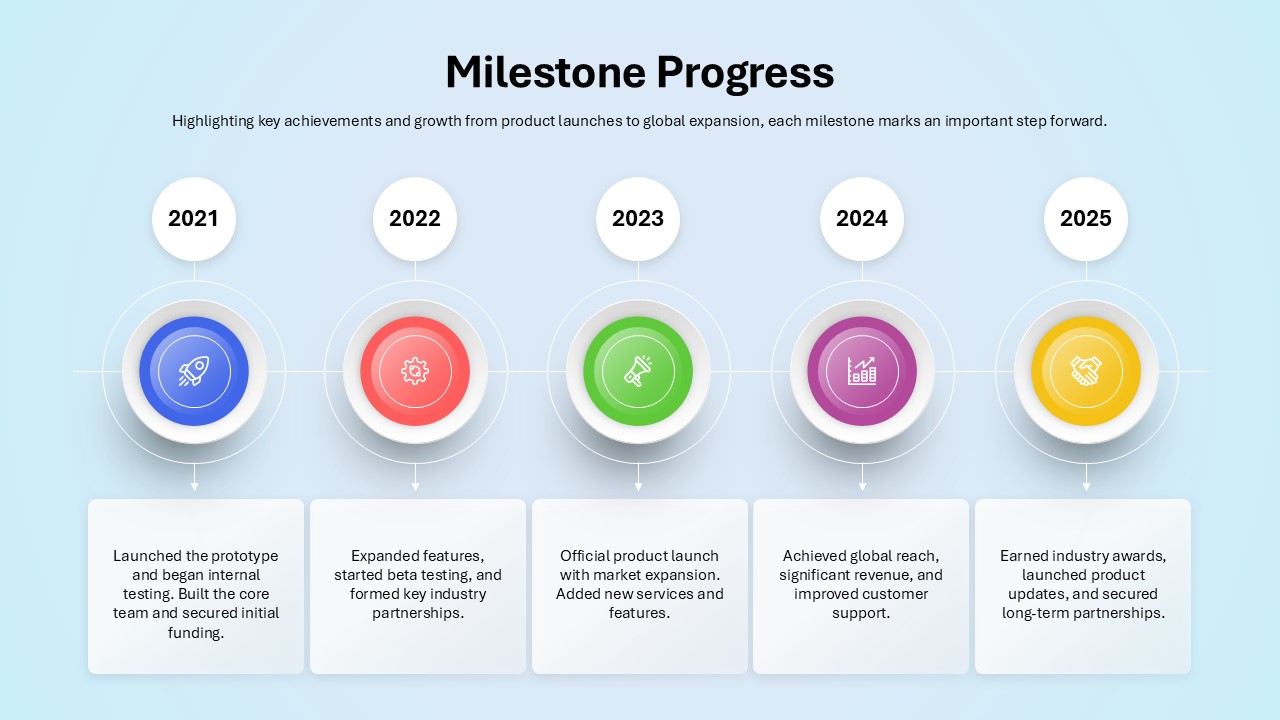
Milestone Progress template for PowerPoint & Google Slides
Business Plan
Progress Bar Graph Layout Design for PowerPoint & Google Slides
Charts
Progress Bar Infographic for PowerPoint & Google Slides
Business
Progress Bar infographic pack for PowerPoint & Google Slides
Business
Progress Chart Slide for PowerPoint & Google Slides
Charts
RAG Status Infographic Comparison Template for PowerPoint & Google Slides
Project
Weekly Status Report Dashboard Template for PowerPoint & Google Slides
HR
Sprint Status Tracking Template for PowerPoint & Google Slides
Infographics
One Pager Website Status Template for PowerPoint & Google Slides
Digital Marketing
One Page Marketing Status Template for PowerPoint & Google Slides
Marketing
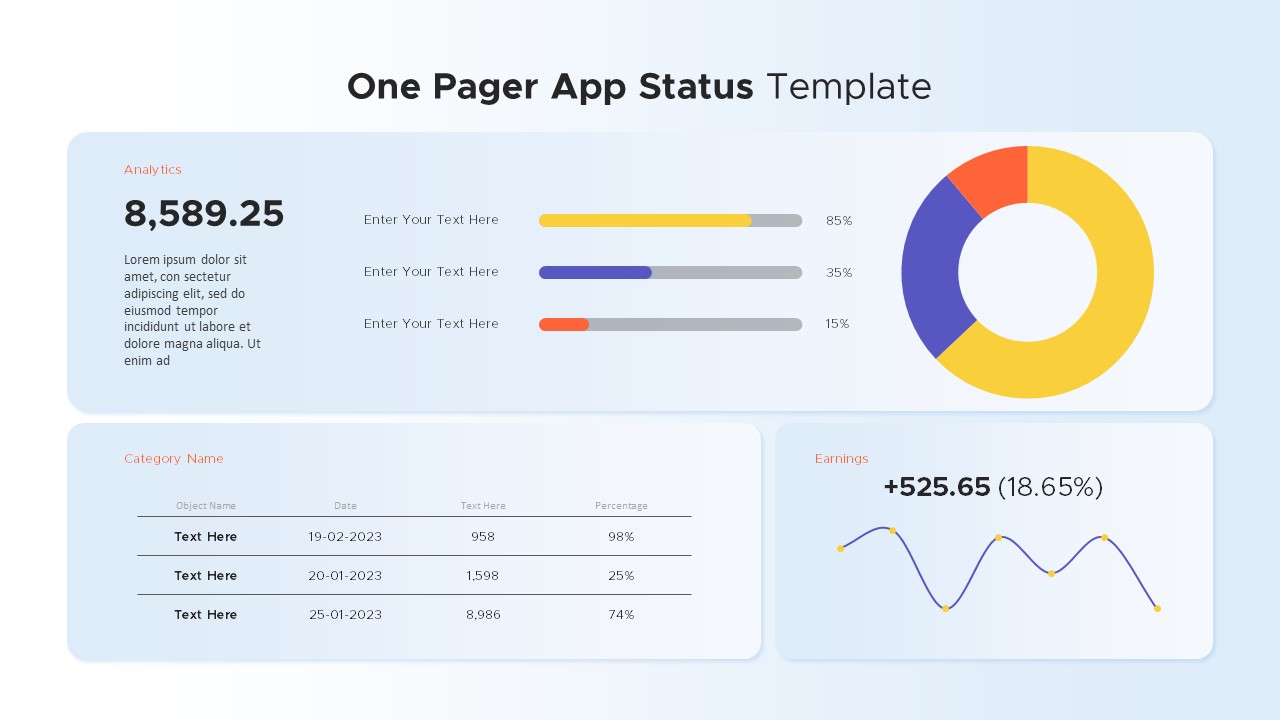
One Pager App Status template for PowerPoint & Google Slides
Business Report
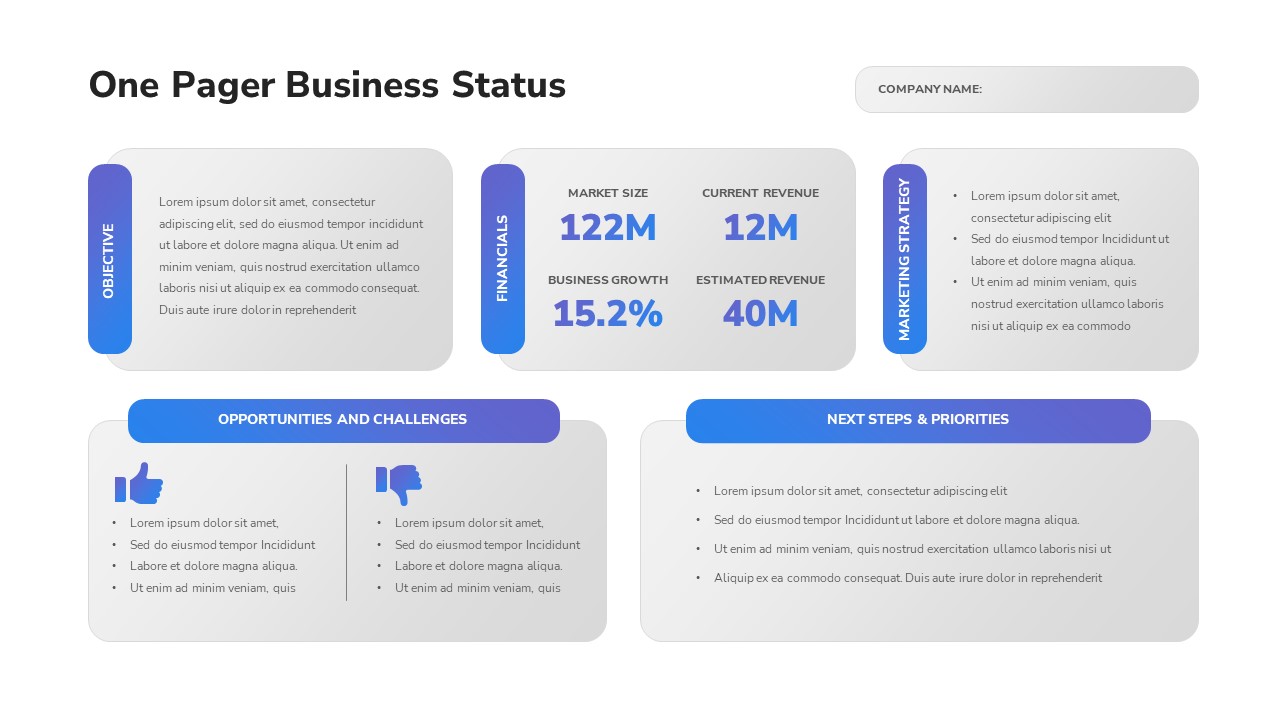
One-Pager Business Status Report Slide Template for PowerPoint & Google Slides
Business Report
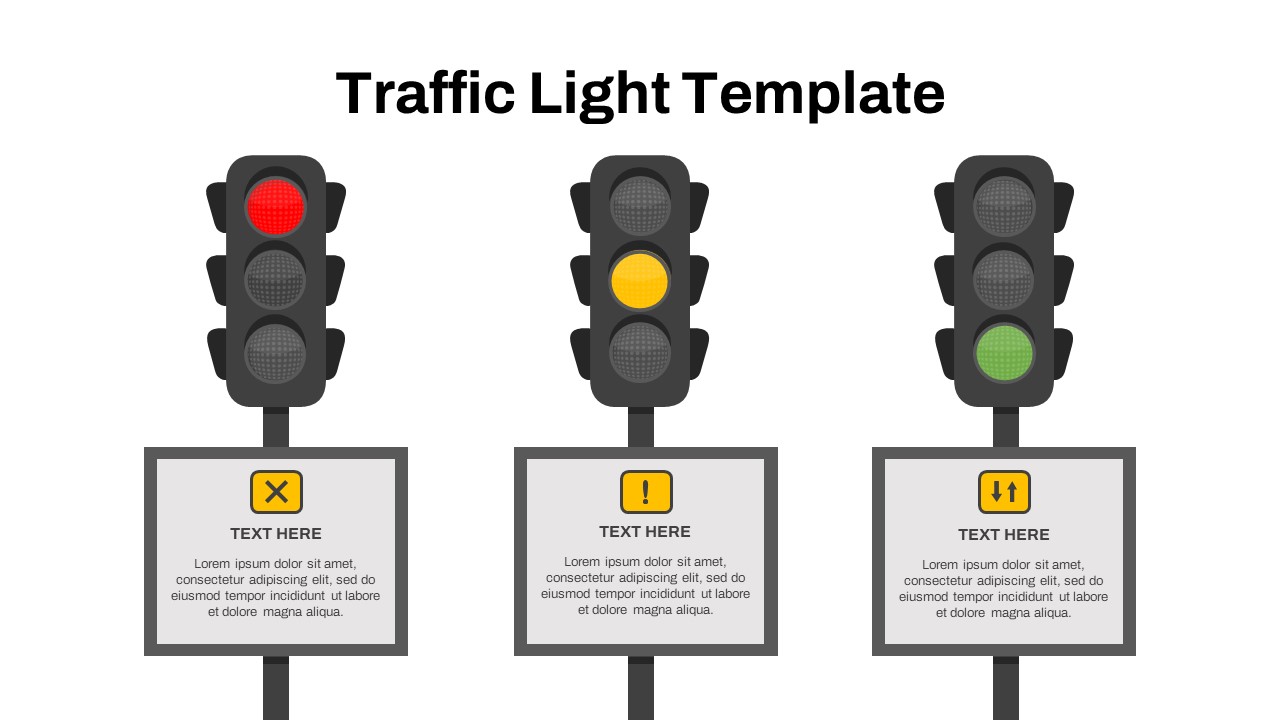
Free Traffic Light Status Indicator Slide Template for PowerPoint & Google Slides
Project Status
Free
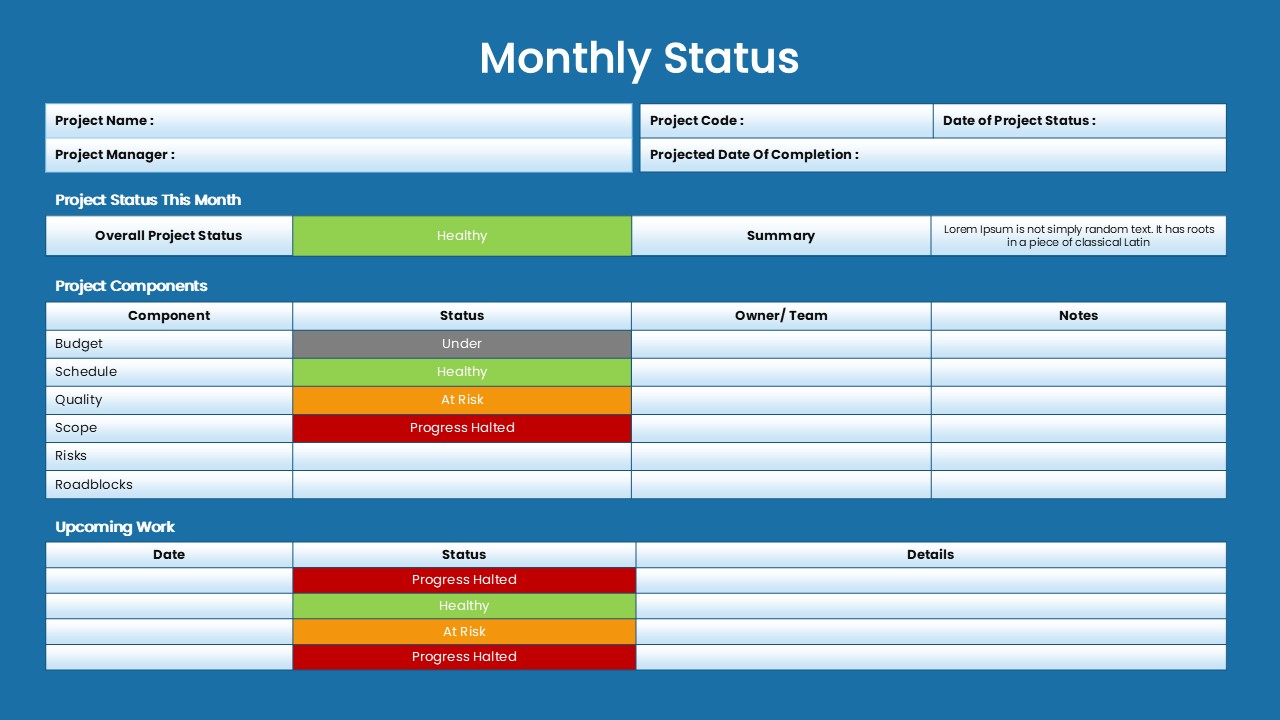
Monthly Status Report Template for PowerPoint & Google Slides
Project Status

Project Management Dashboard Template for PowerPoint & Google Slides
Project
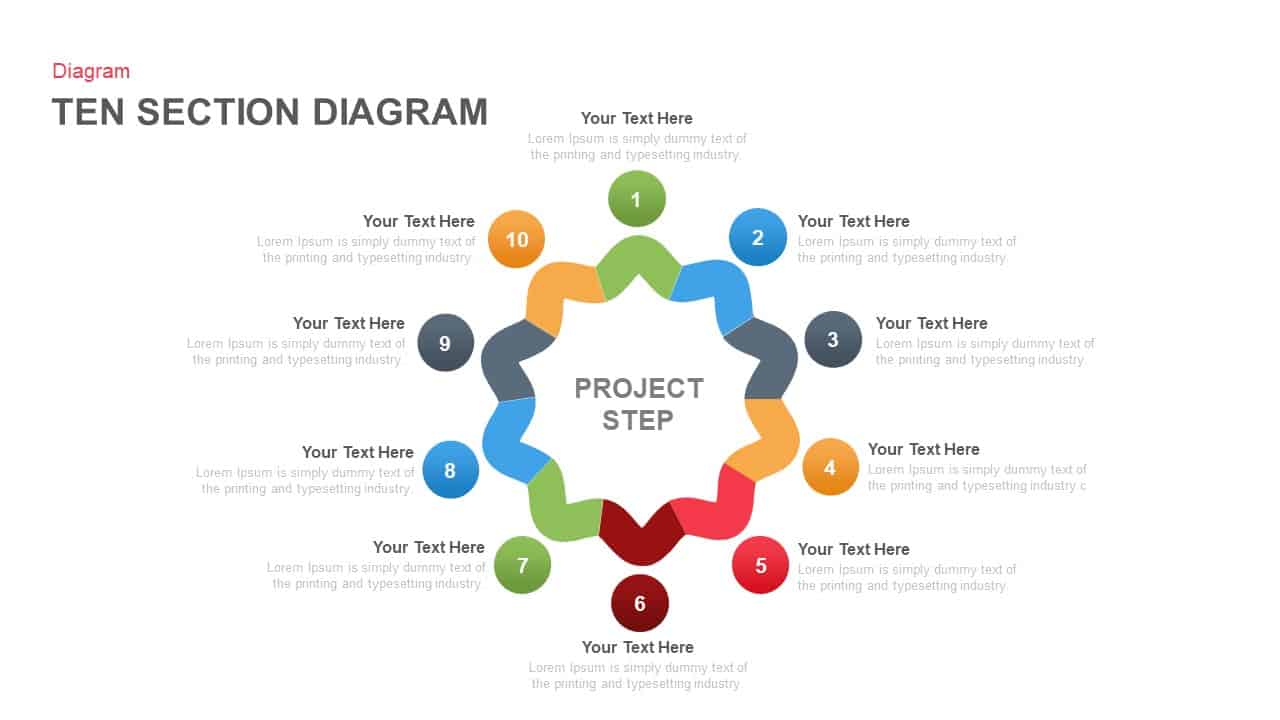
Ten-Section Project Steps Diagram Template for PowerPoint & Google Slides
Process
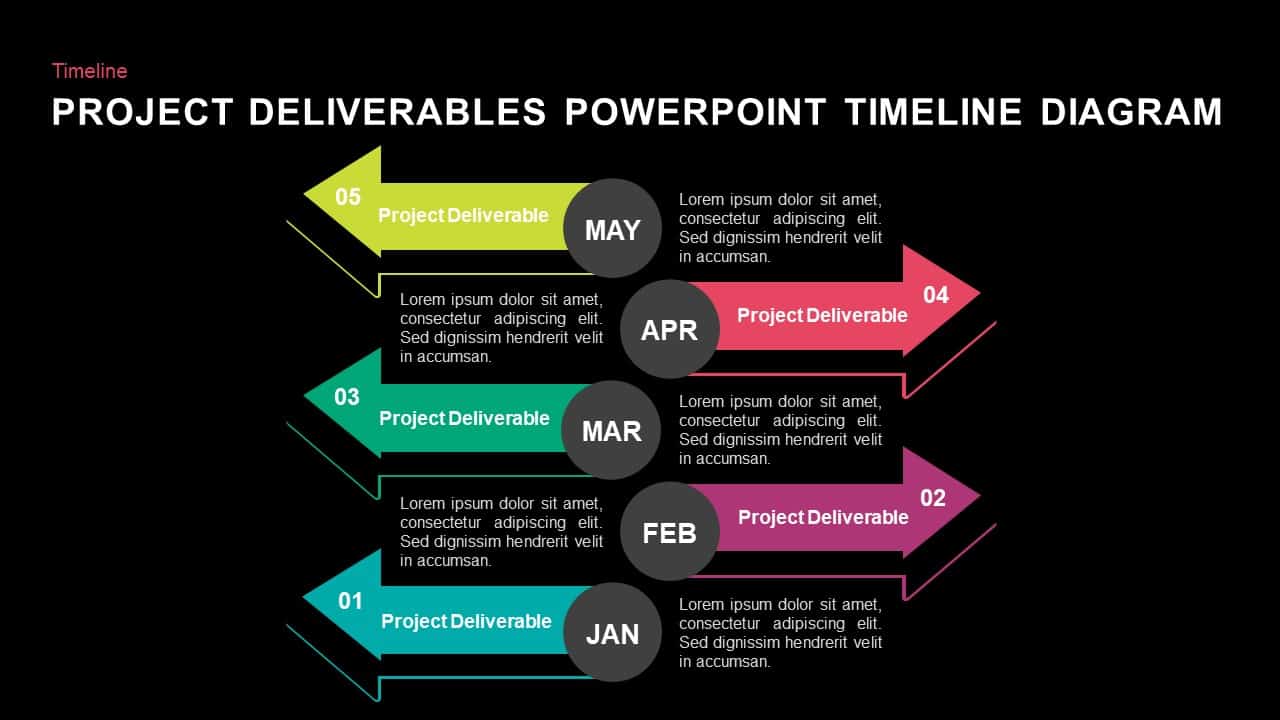
Project Deliverables Timeline Template for PowerPoint & Google Slides
Timeline
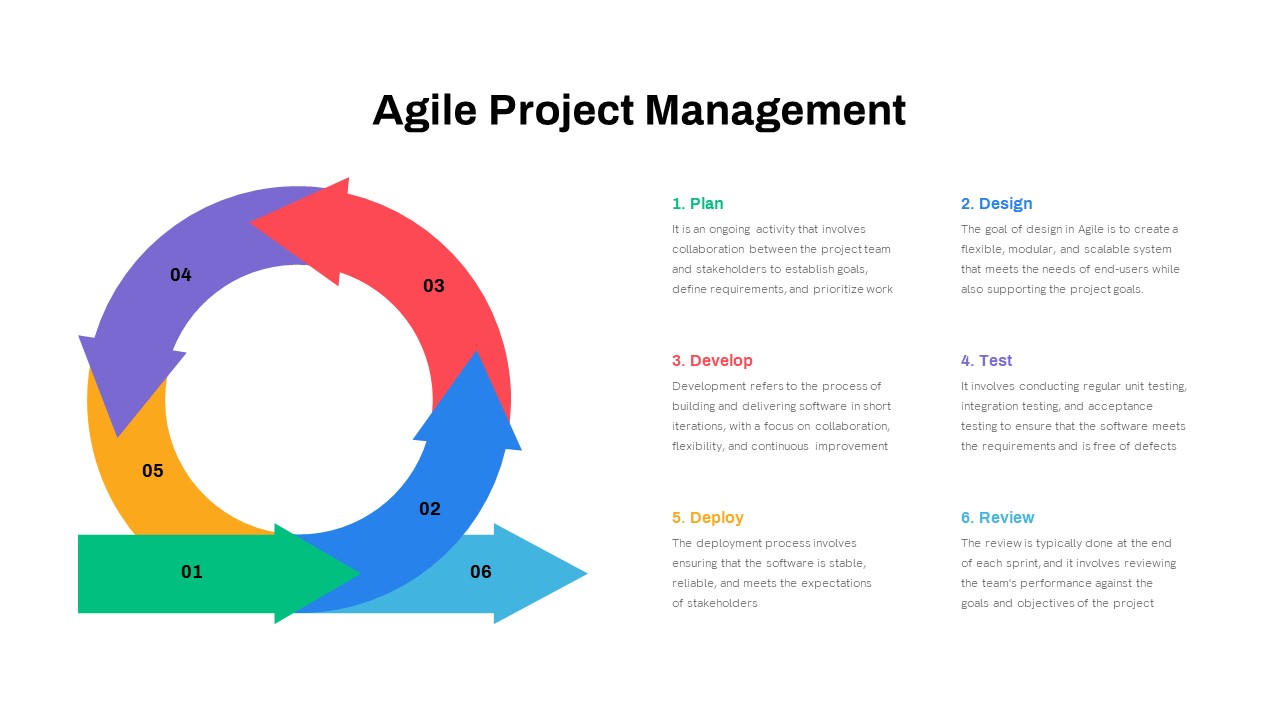
Comprehensive Agile Project Management Template for PowerPoint & Google Slides
Scrum
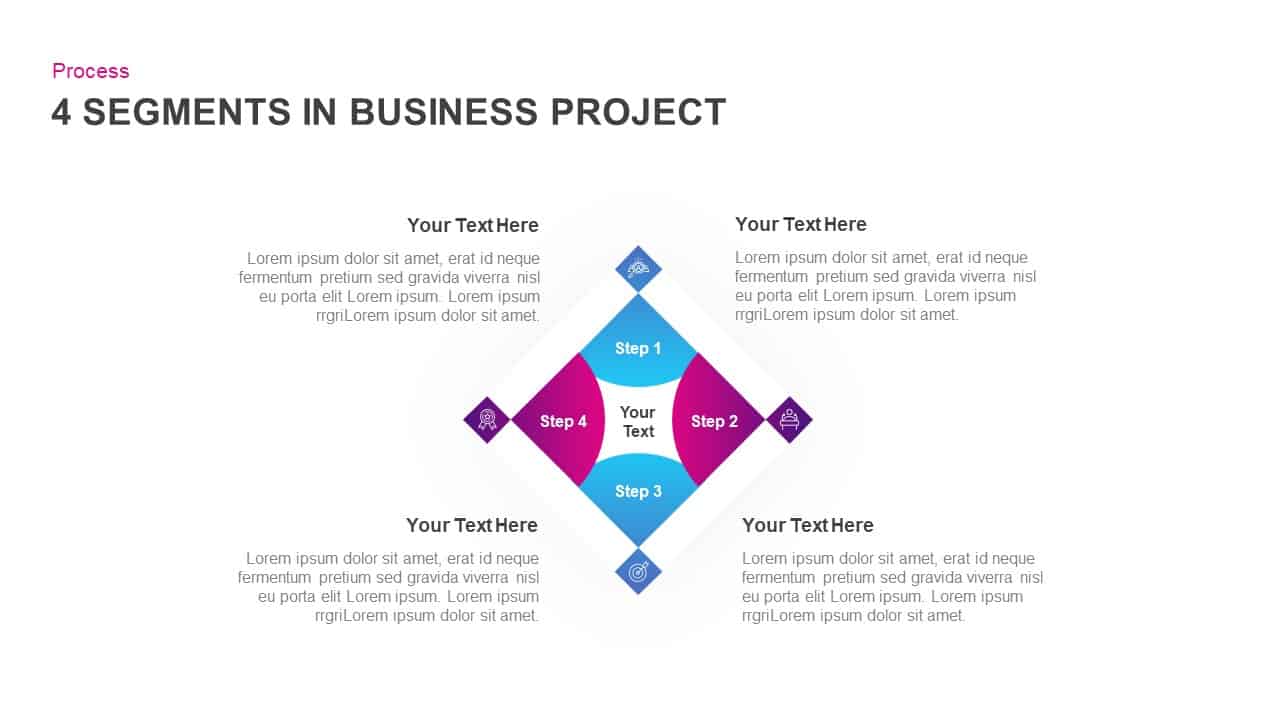
4-Segment Business Project Diamond Diagram Template for PowerPoint & Google Slides
Process
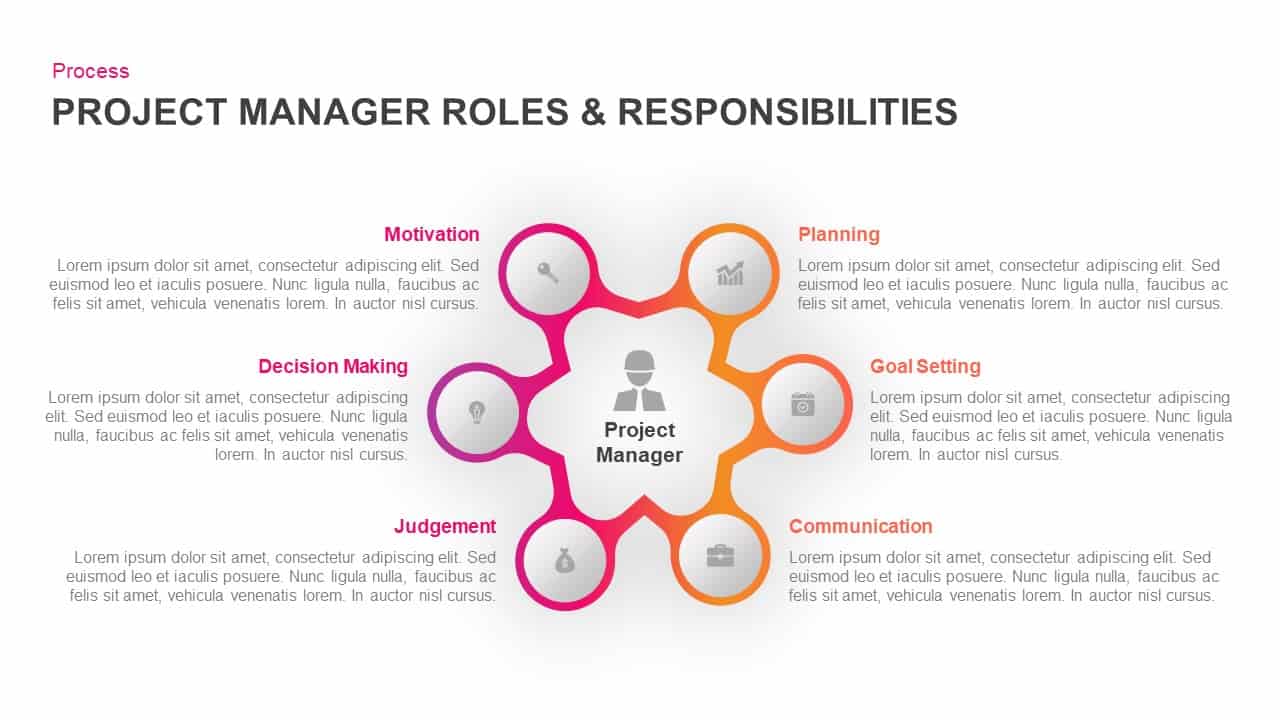
Project Manager Roles Hub-Spoke Process Template for PowerPoint & Google Slides
Process
Multi-Style Project Life Cycle Diagram Template for PowerPoint & Google Slides
Process

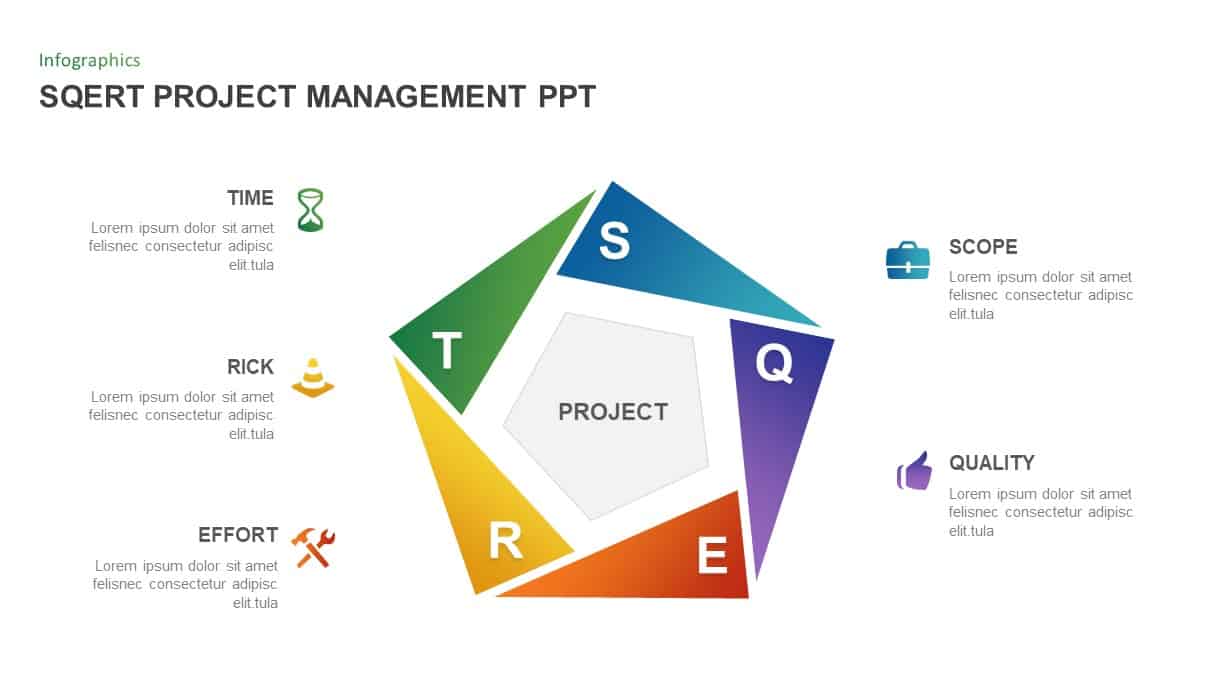
SQERT Project Management Infographic Template for PowerPoint & Google Slides
Process
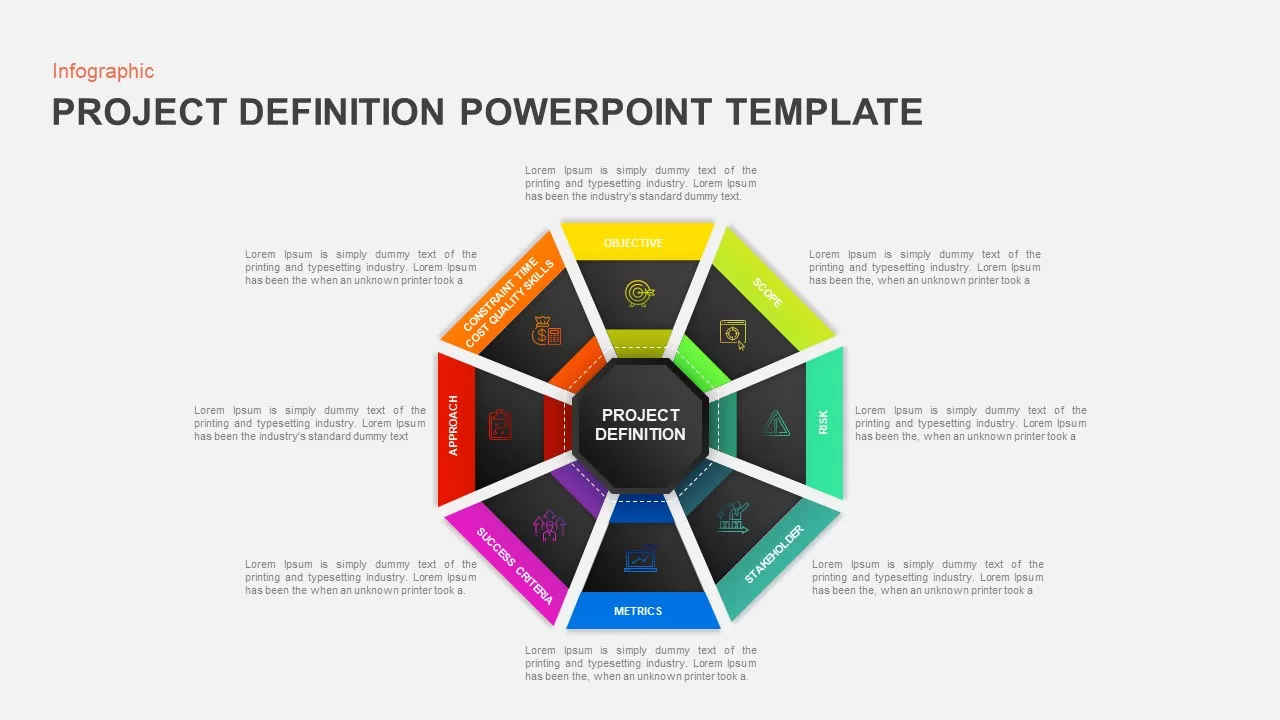
Octagonal Project Definition Infographic Template for PowerPoint & Google Slides
Process
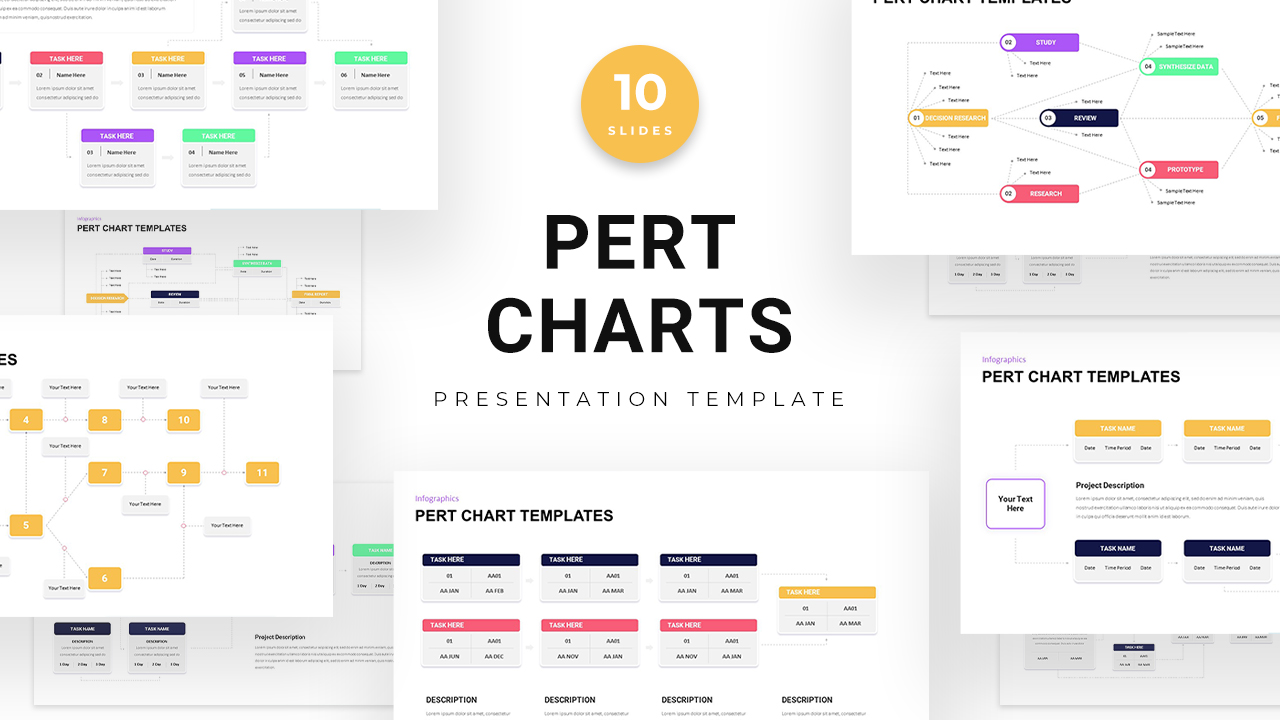
PERT Chart Project Management template for PowerPoint & Google Slides
Project Status
Project Timeline Management template for PowerPoint & Google Slides
Infographics
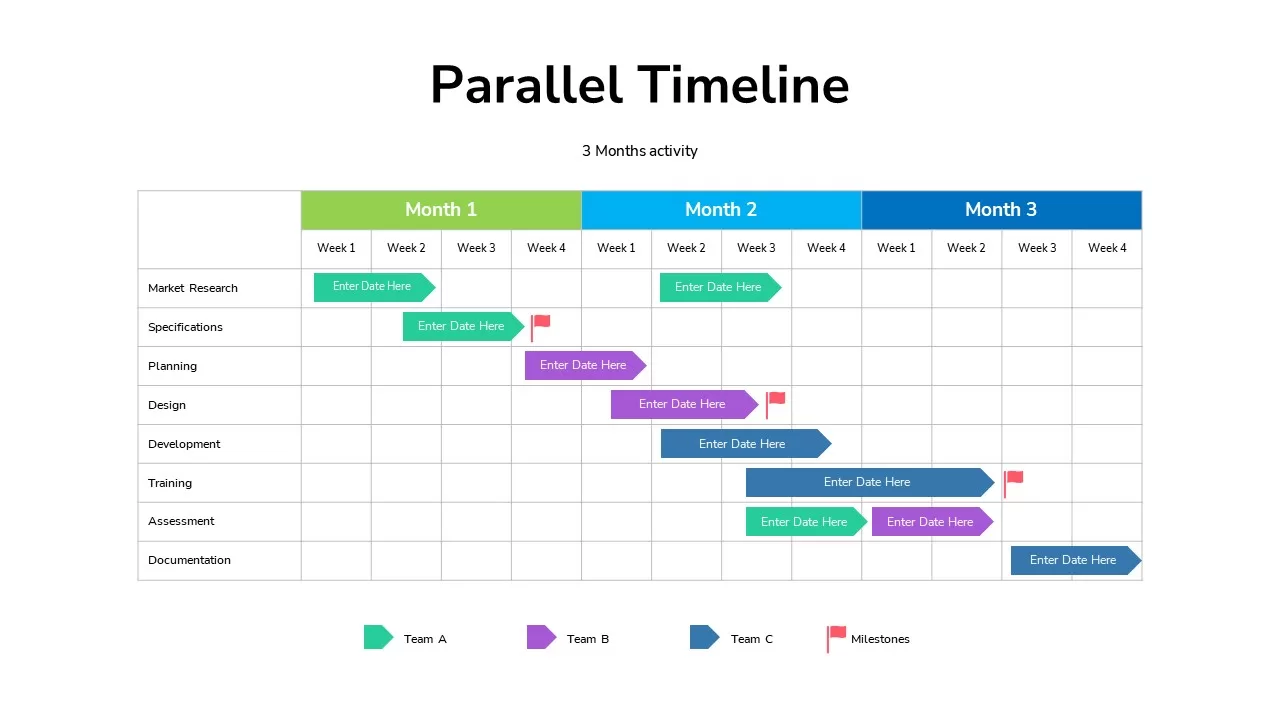
Animated Parallel Timeline Project template for PowerPoint & Google Slides
Infographics
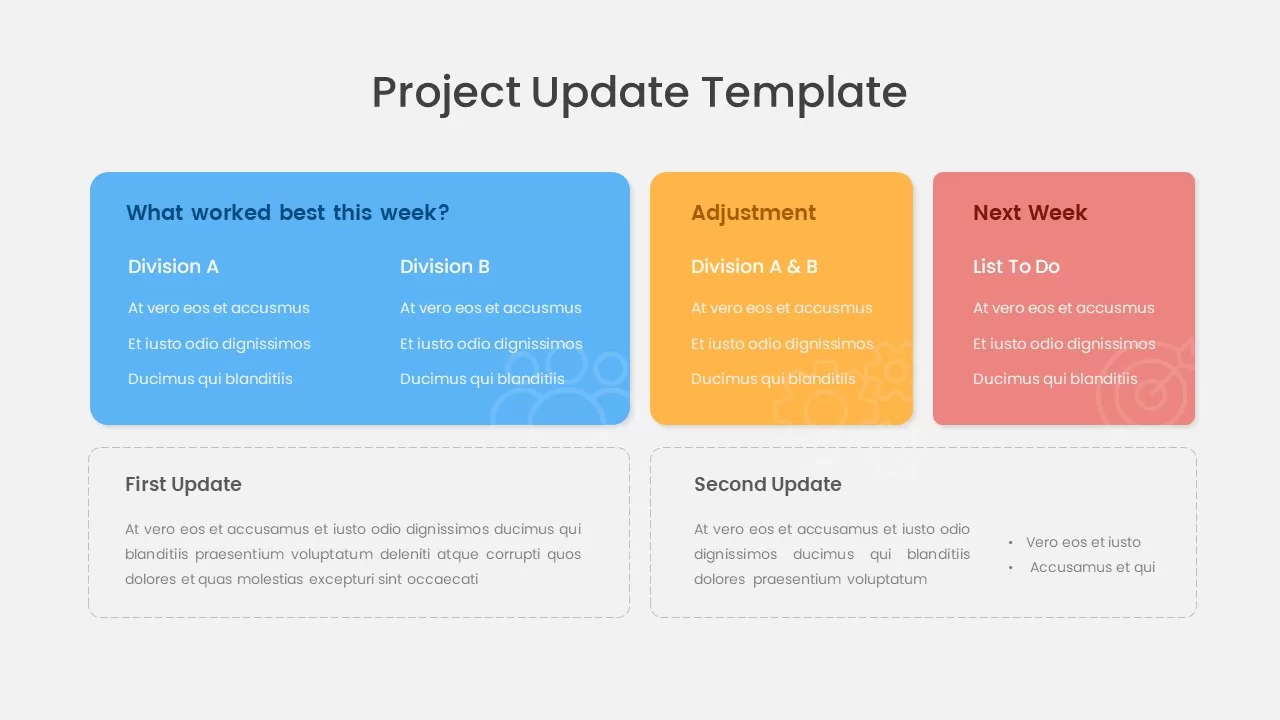
Project Update & Timeline Infographic Template for PowerPoint & Google Slides
Business
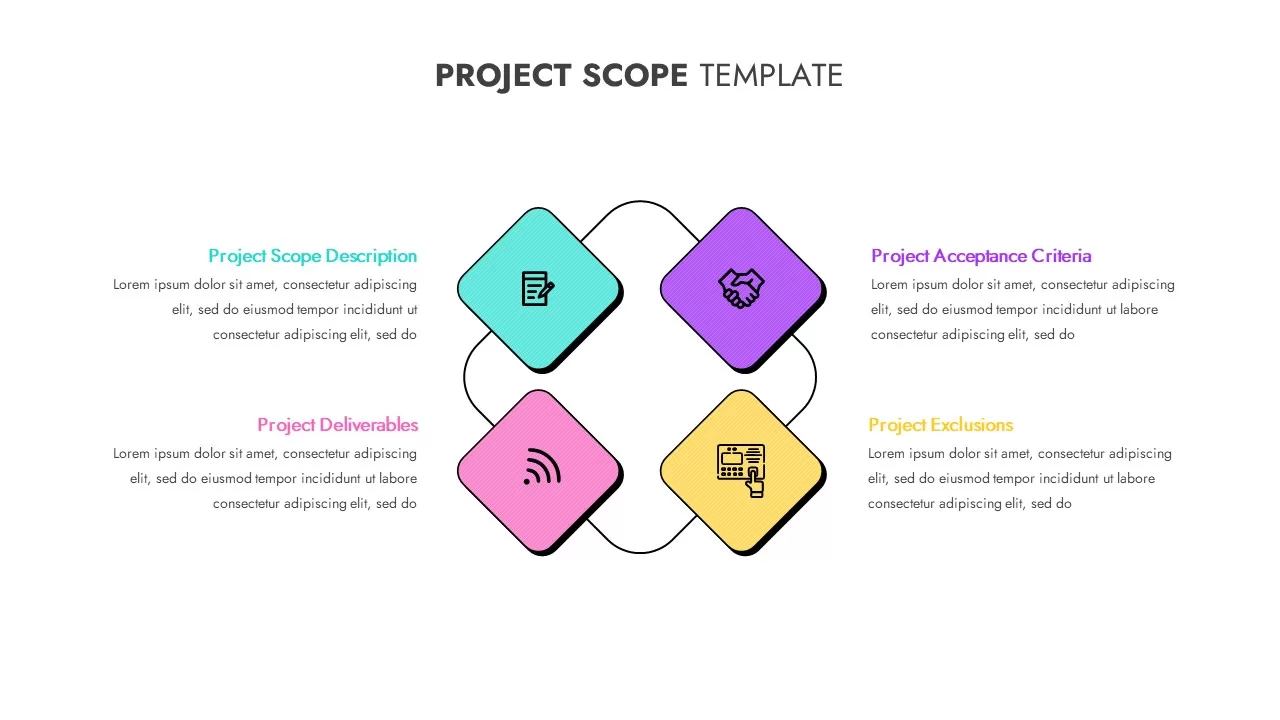
Project Scope Diamond Framework Template for PowerPoint & Google Slides
Project Status
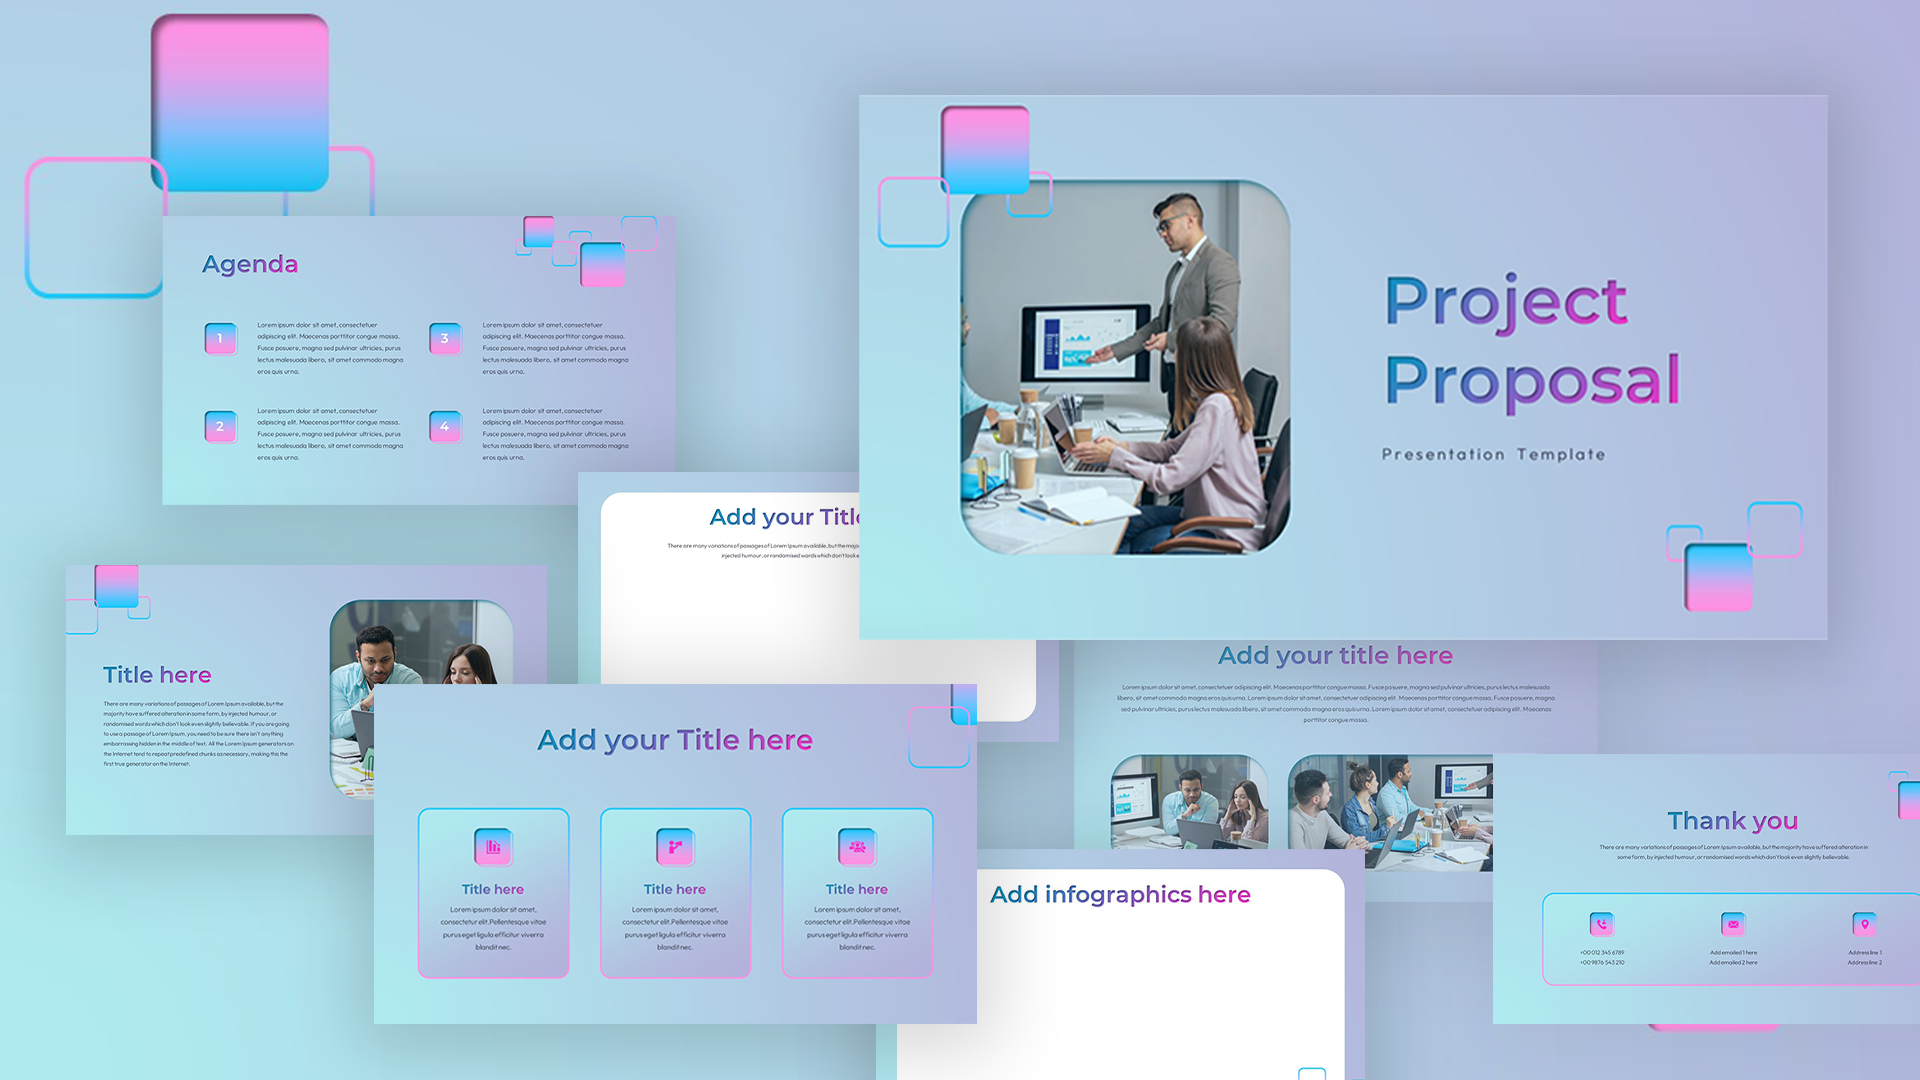
Minimal Project Proposal Presentation Template for PowerPoint & Google Slides
Pitch Deck
Interactive Project Gantt Chart Timeline Template for PowerPoint & Google Slides
Gantt Chart
Project Execution Plan Template for PowerPoint & Google Slides
Project
Project Execution Gantt Timeline Template for PowerPoint & Google Slides
Gantt Chart
Project Execution Plan Overview Template for PowerPoint & Google Slides
Business Proposal
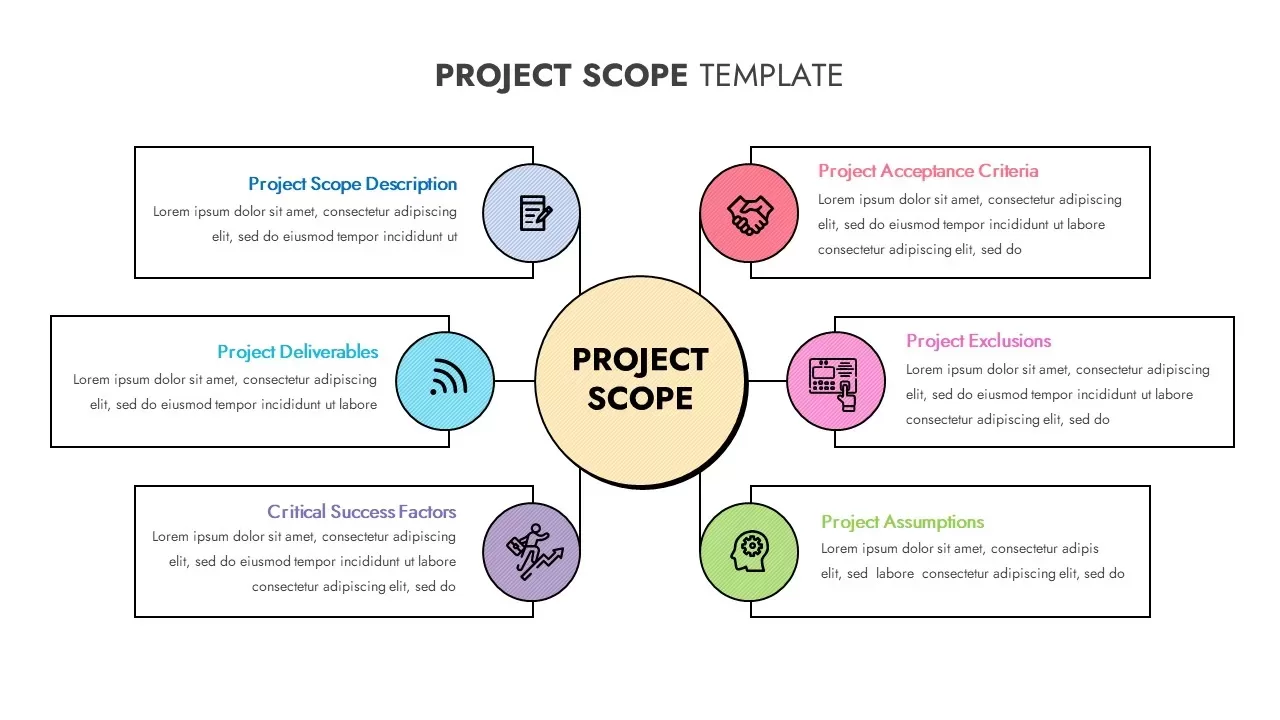
Project Scope Hub & Spoke Layout Template for PowerPoint & Google Slides
Process
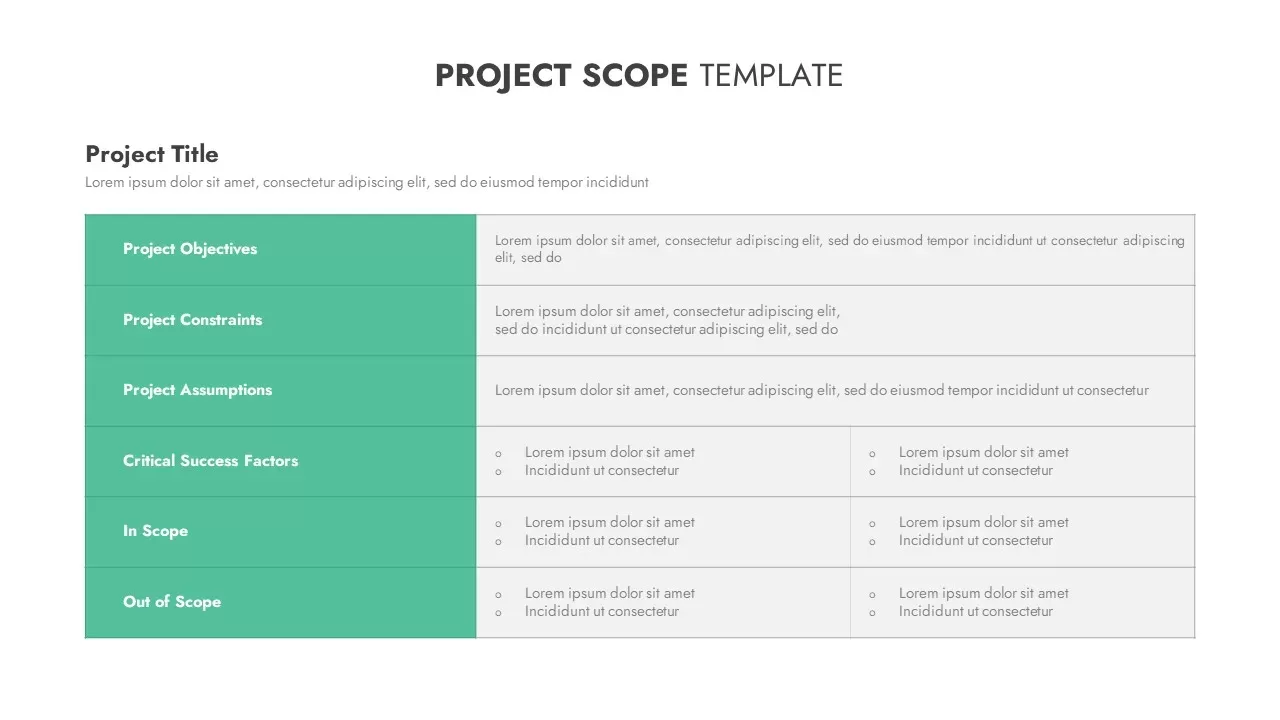
Modern Project Scope Template for PowerPoint & Google Slides
Project
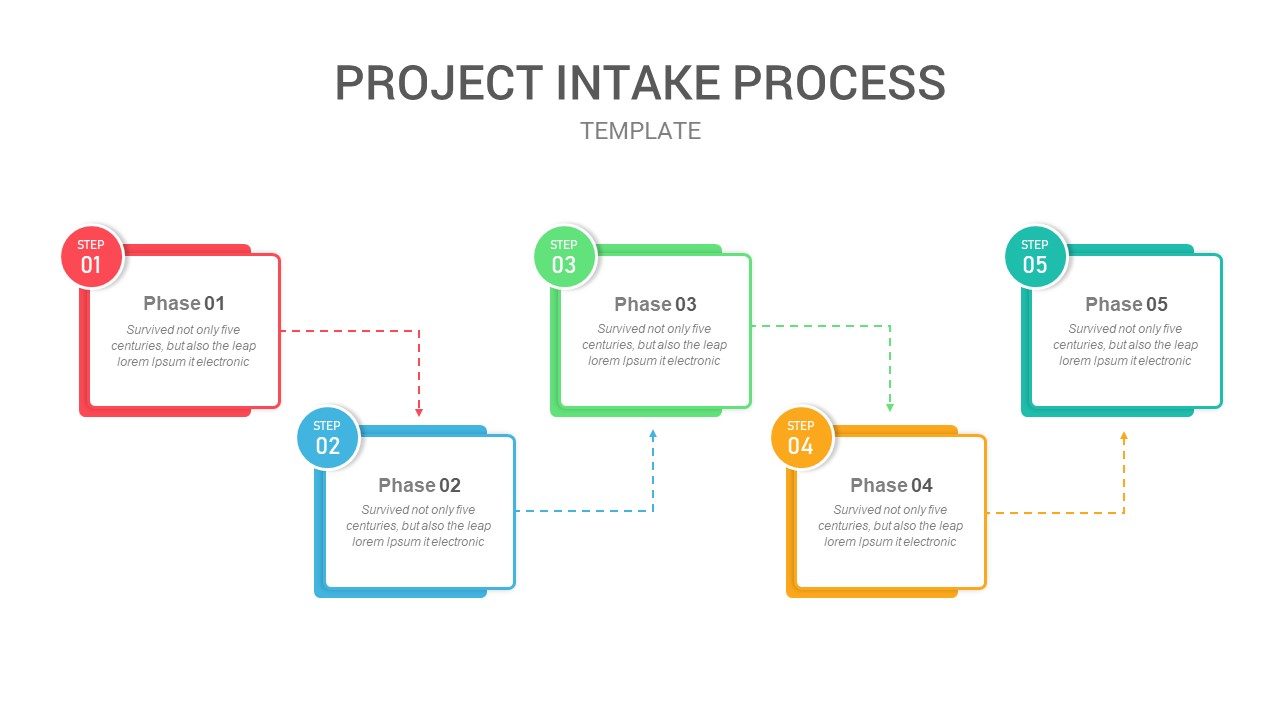
Five-Phase Project Intake Process Flow Template for PowerPoint & Google Slides
Process
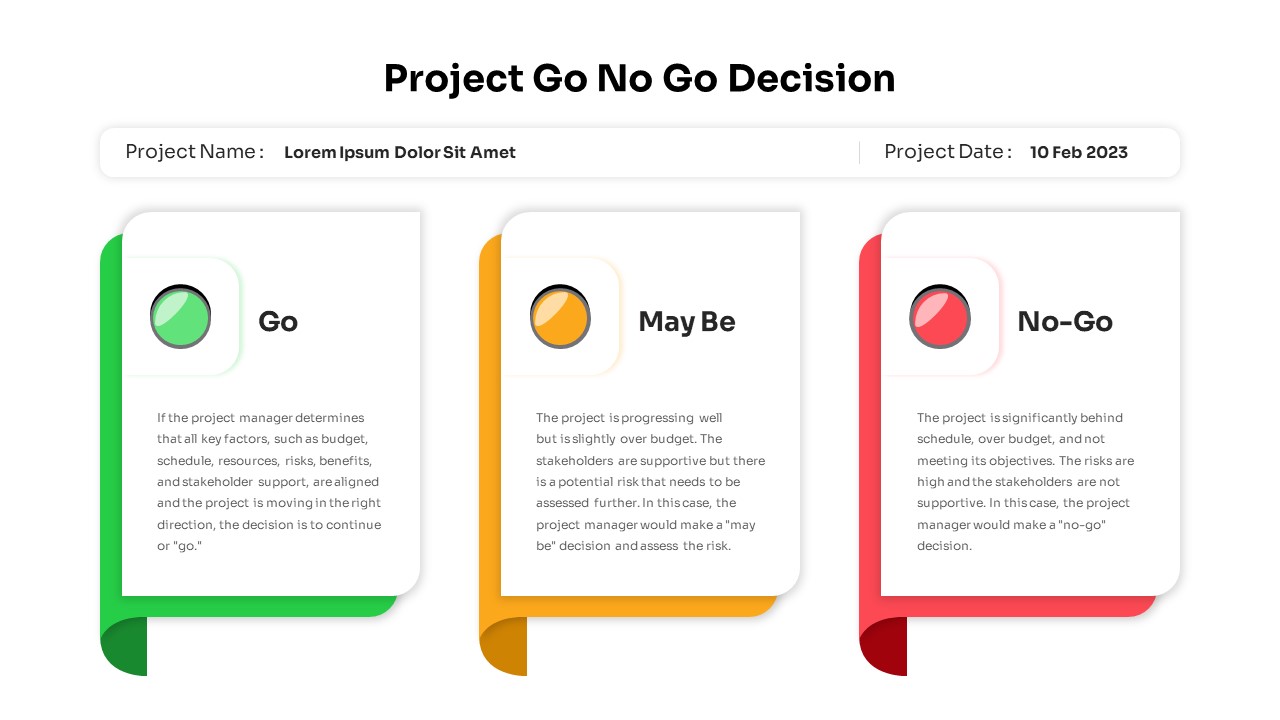
Project Go No-Go Decision Slide Template for PowerPoint & Google Slides
Process
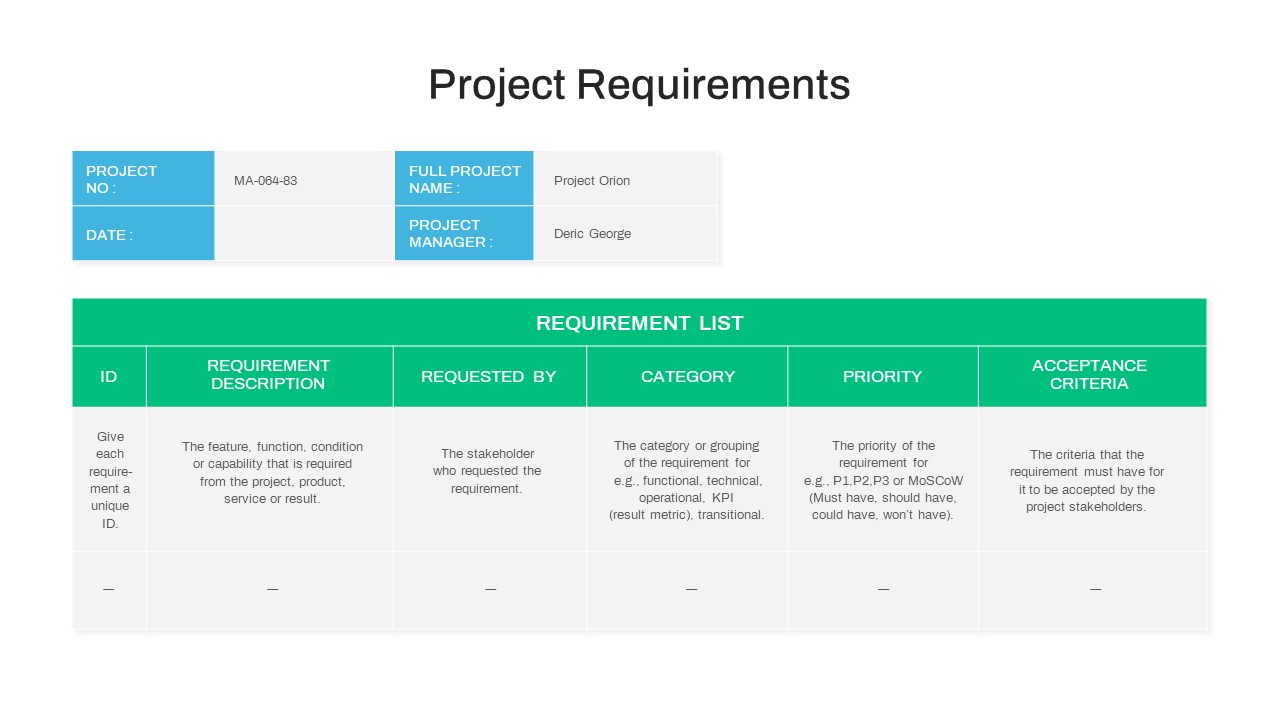
Project Requirements Matrix Template for PowerPoint & Google Slides
Project
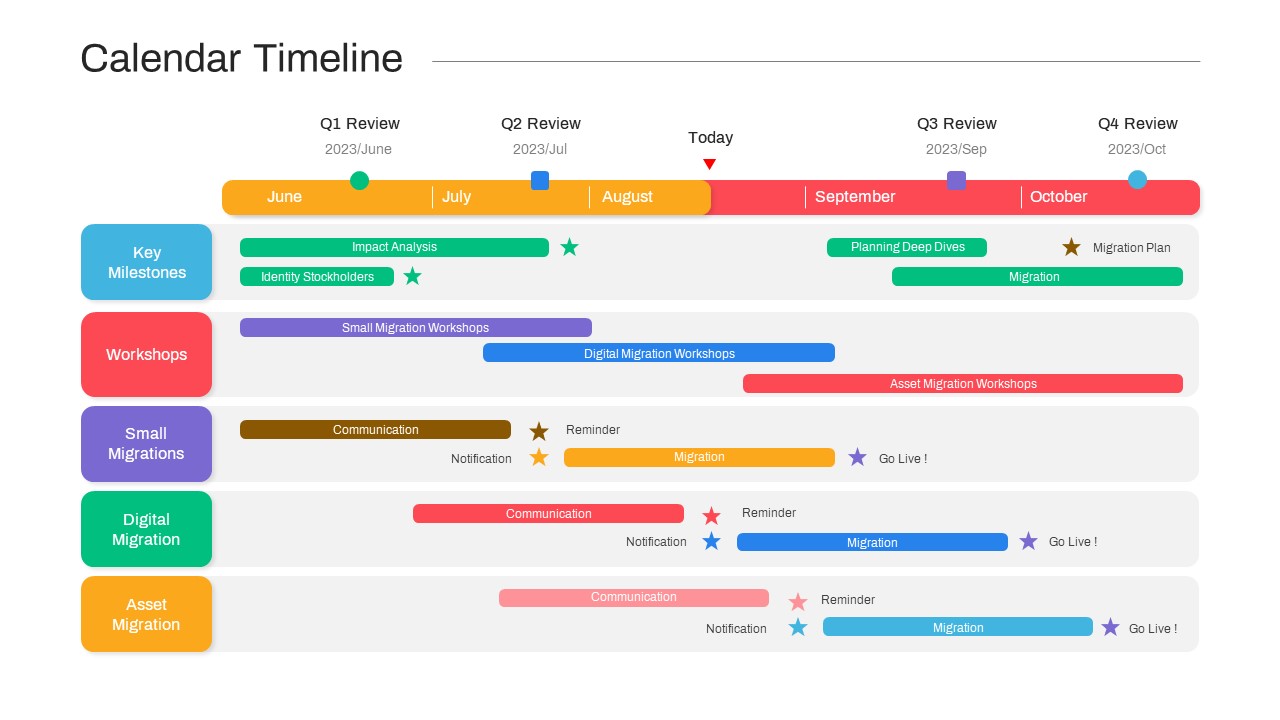
Calendar Migration Project Timeline Template for PowerPoint & Google Slides
Timeline
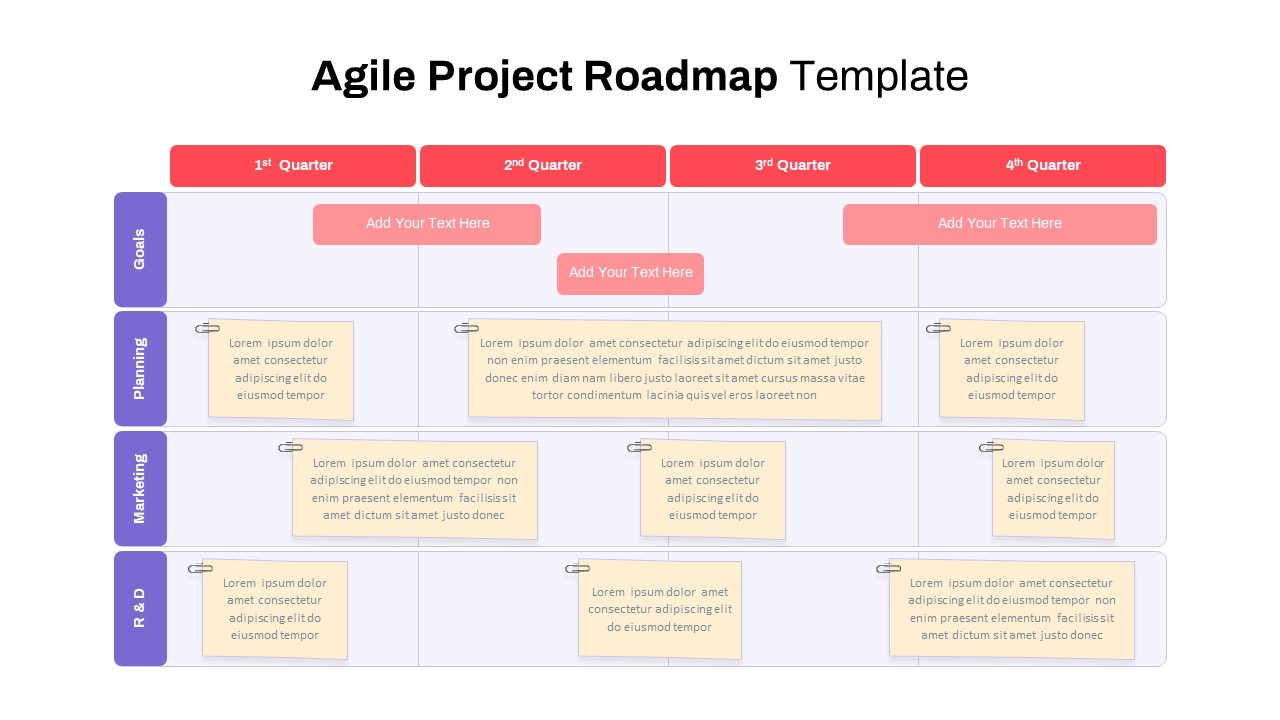
Agile Project Roadmap Timeline Template Pack for PowerPoint & Google Slides
Scrum
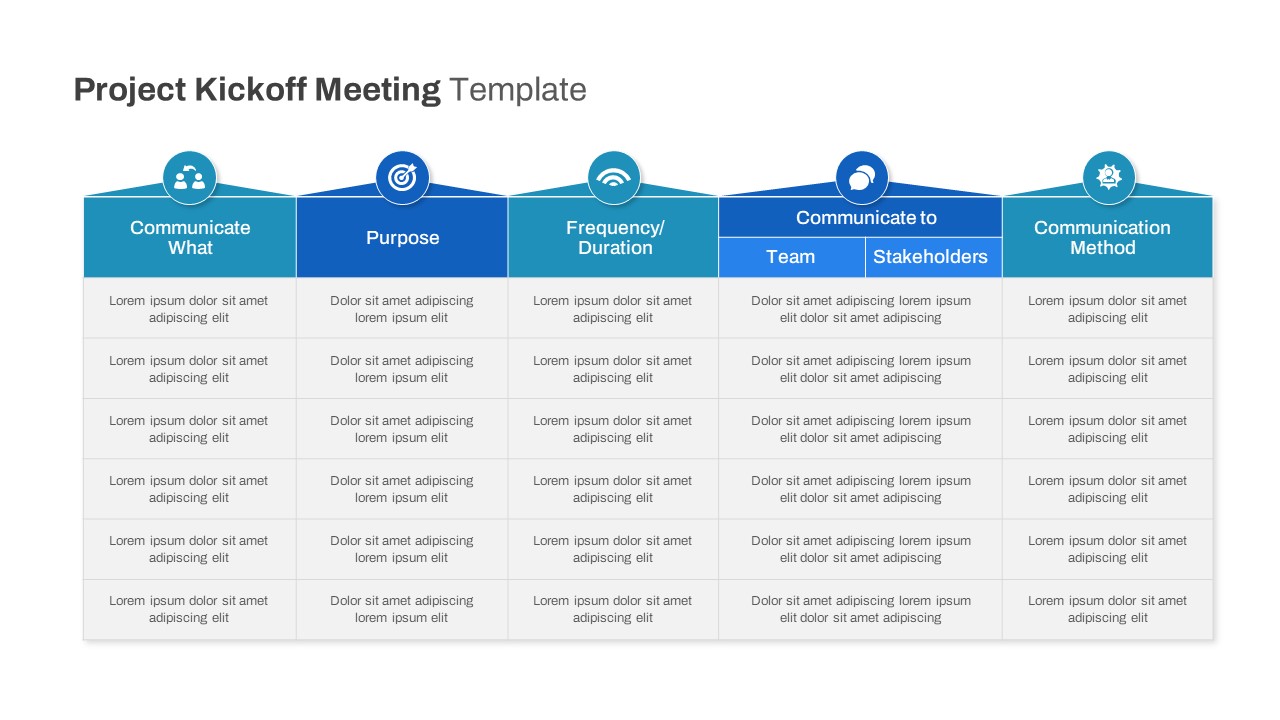
Free Project Kickoff Communication Plan Template for PowerPoint & Google Slides
Project
Free

Project Proposal Deck Template for PowerPoint & Google Slides
Pitch Deck
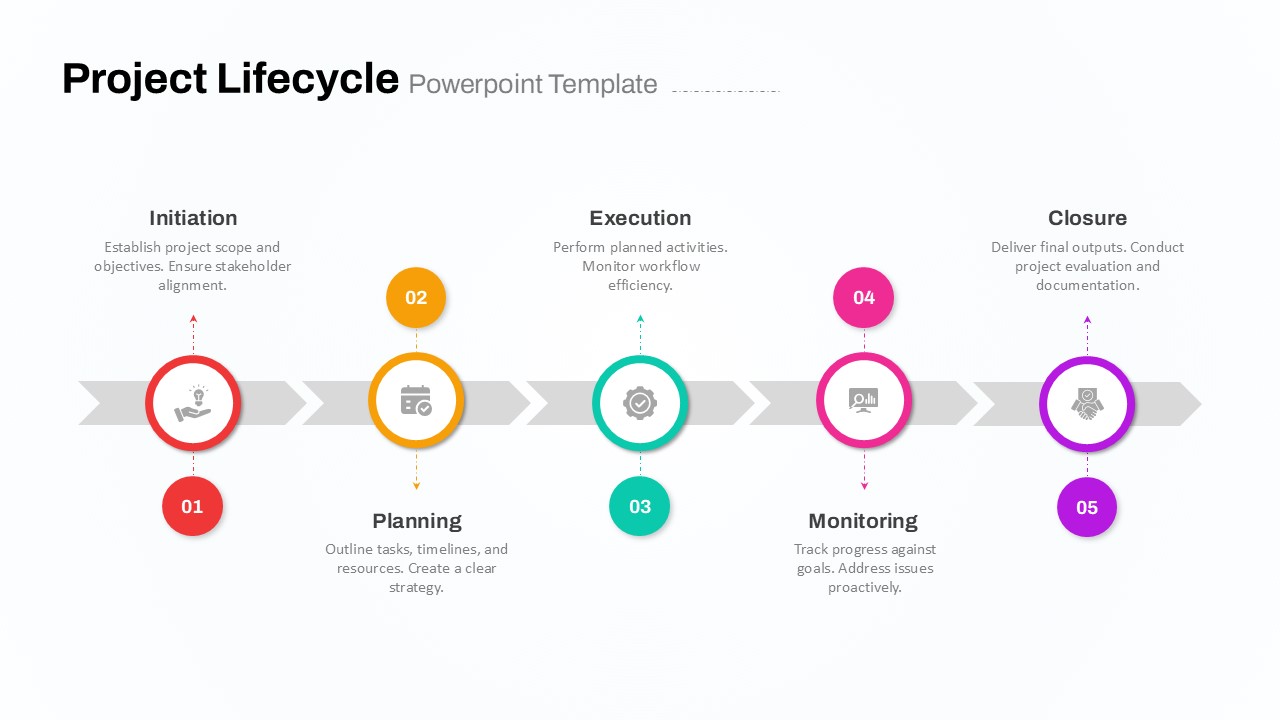
Five-Phase Project Lifecycle Diagram Template for PowerPoint & Google Slides
Infographics
Project Comparison Timeline Roadmap Template for PowerPoint & Google Slides
Comparison
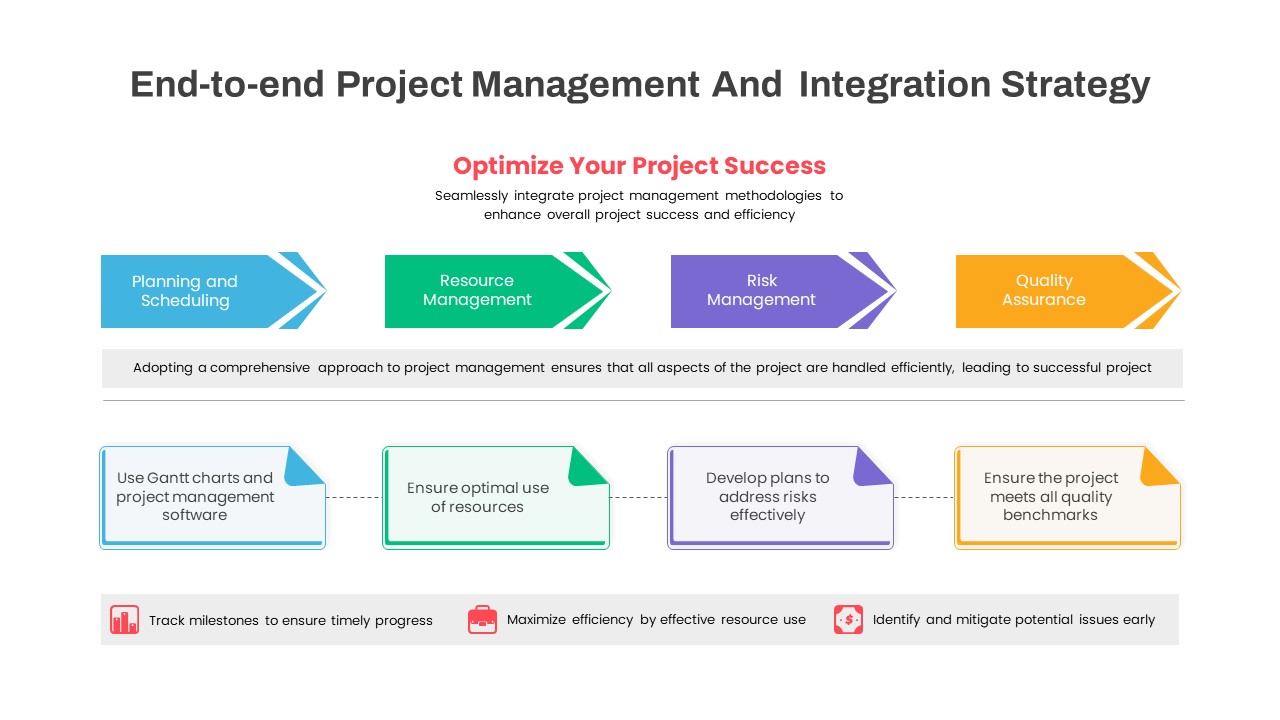
End-to-End Project Management Strategy Template for PowerPoint & Google Slides
Project
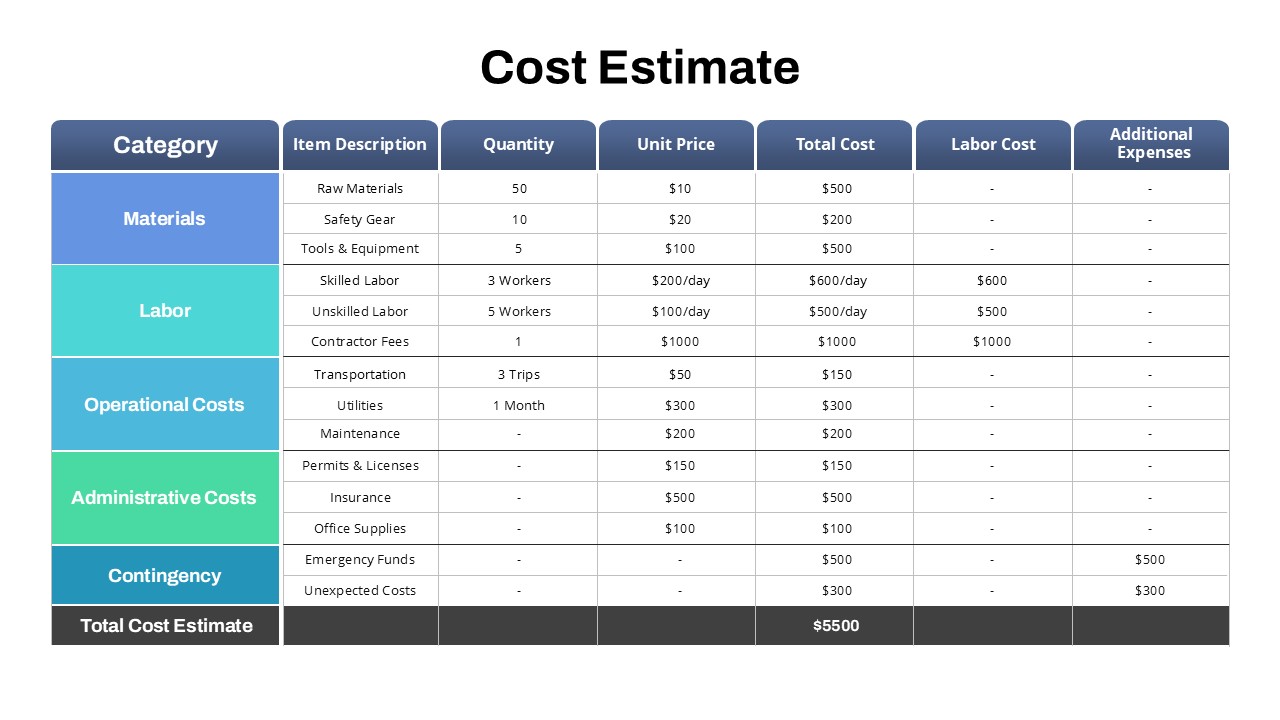
Project Detailed Cost Estimate Table Template for PowerPoint & Google Slides
Project
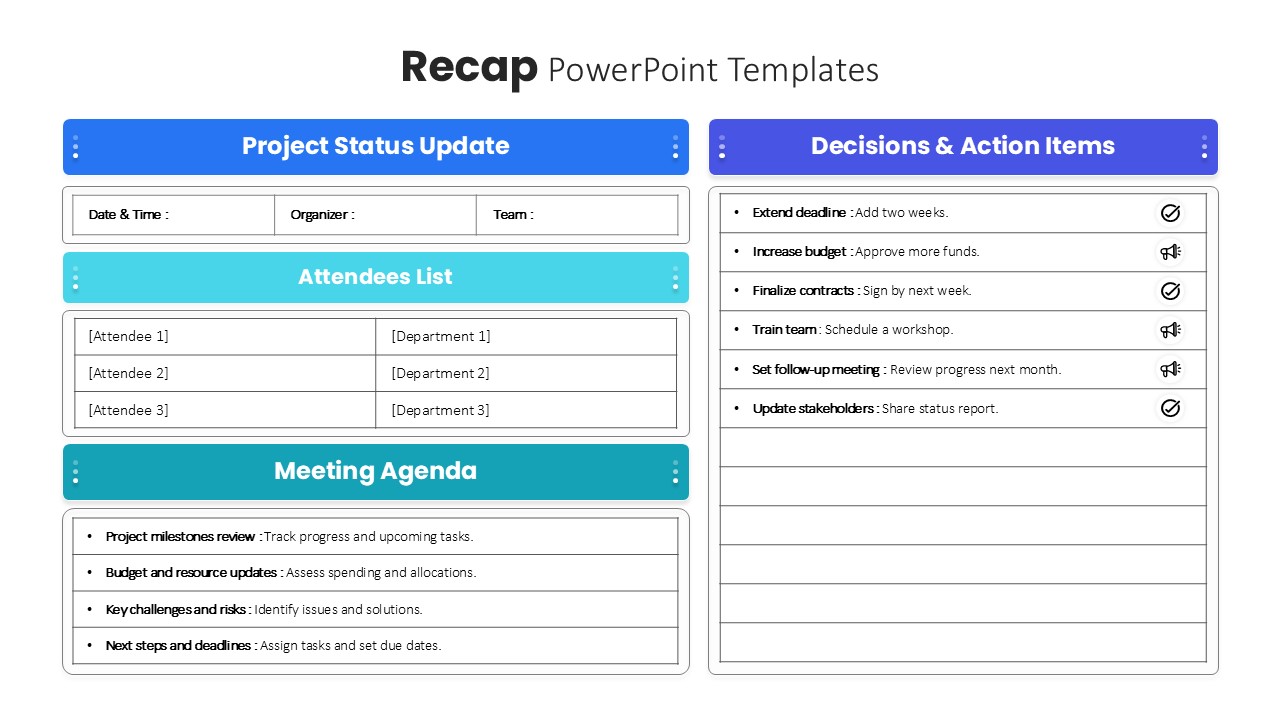
Project Meeting Recap & Action Items Template for PowerPoint & Google Slides
Project Status
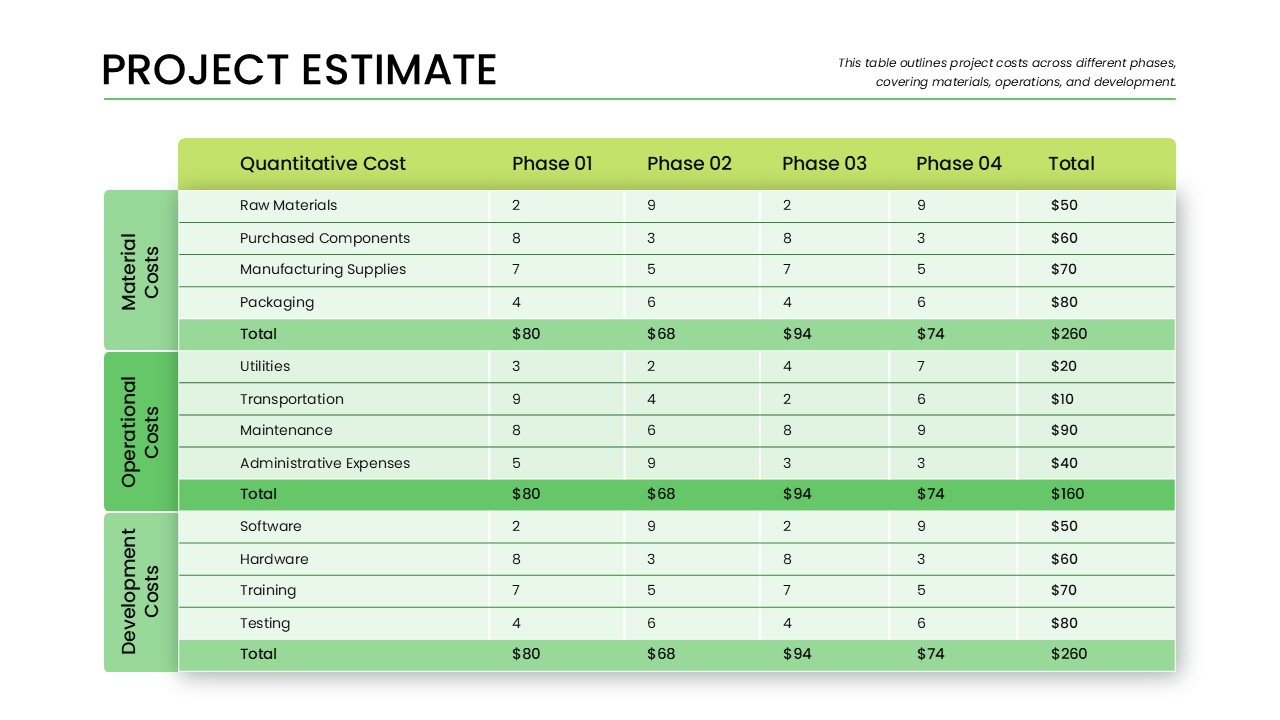
Phase-Wise Project Estimate Table Template for PowerPoint & Google Slides
Business Report
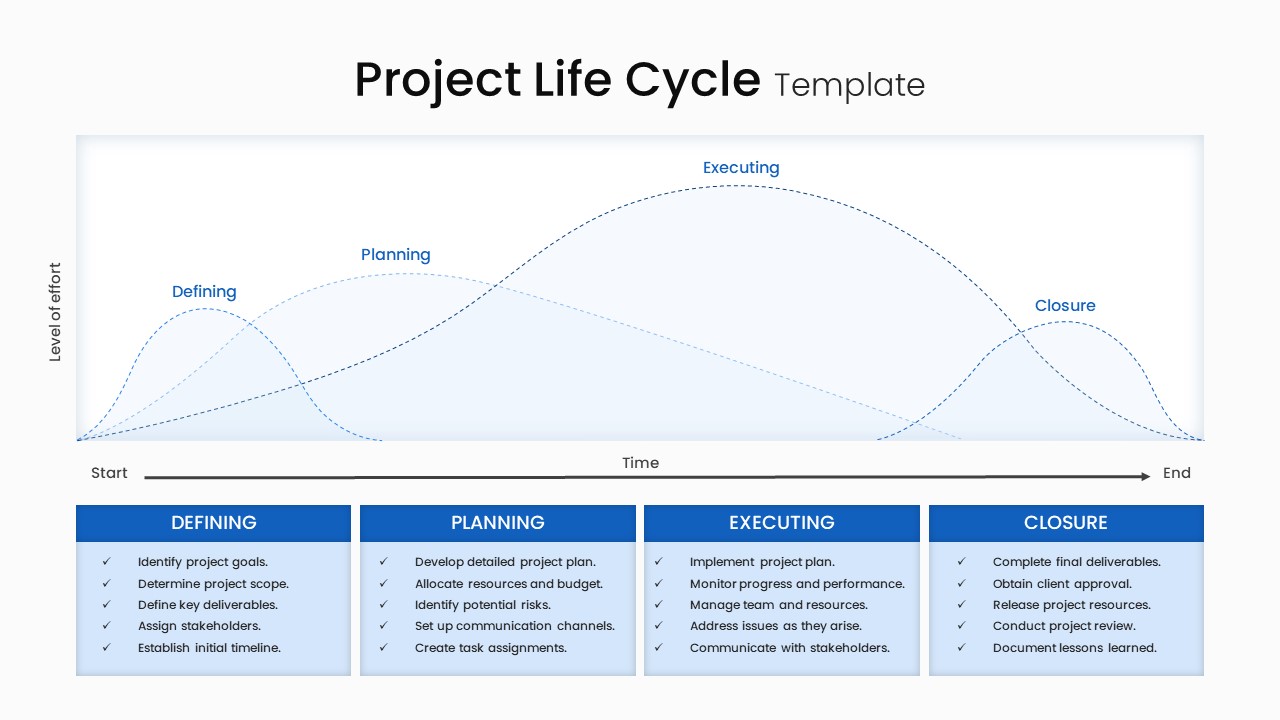
Project Life Cycle Workflow Diagram Template for PowerPoint & Google Slides
Process
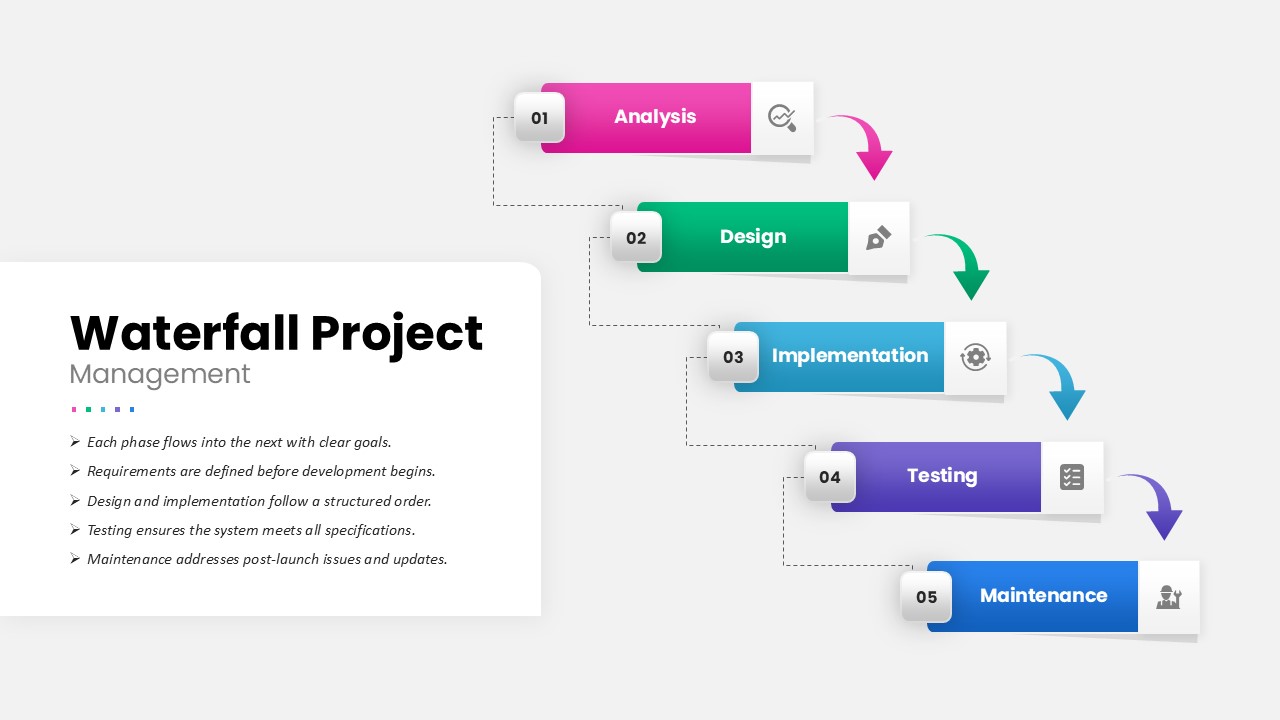
Waterfall Project Management Process template for PowerPoint & Google Slides
Process
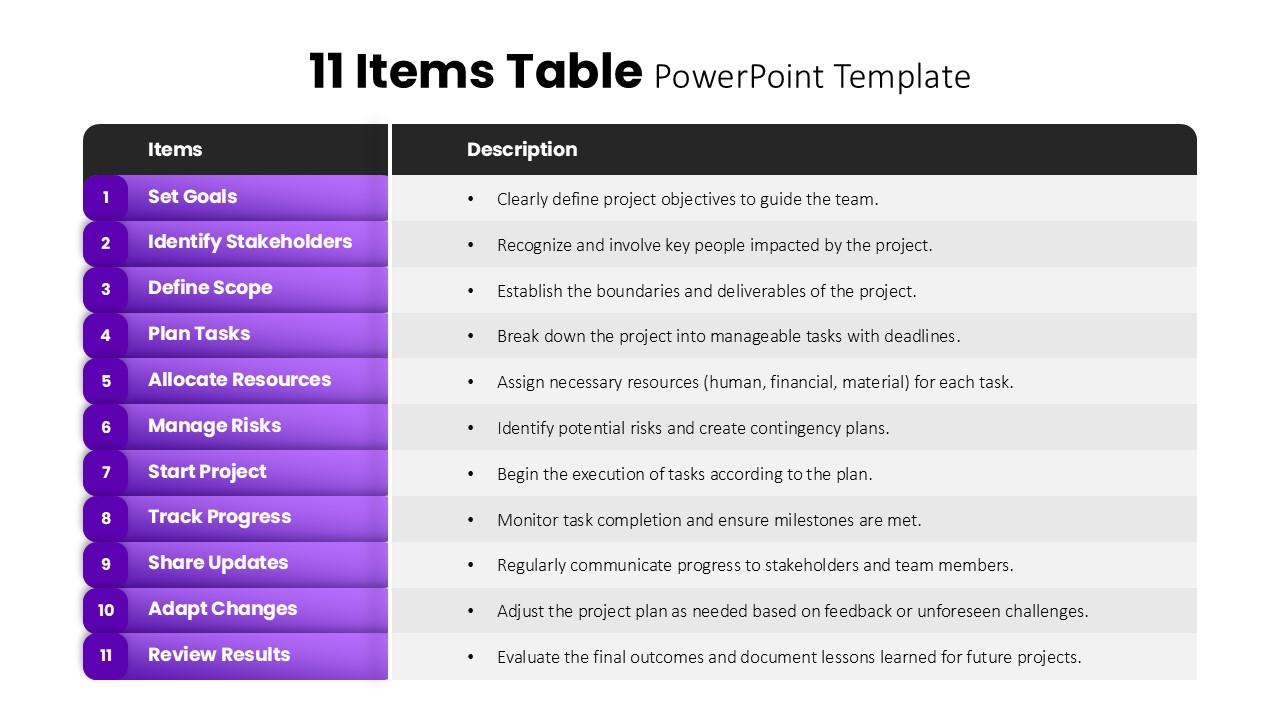
11 Items Table Project Planning Steps template for PowerPoint & Google Slides
Business
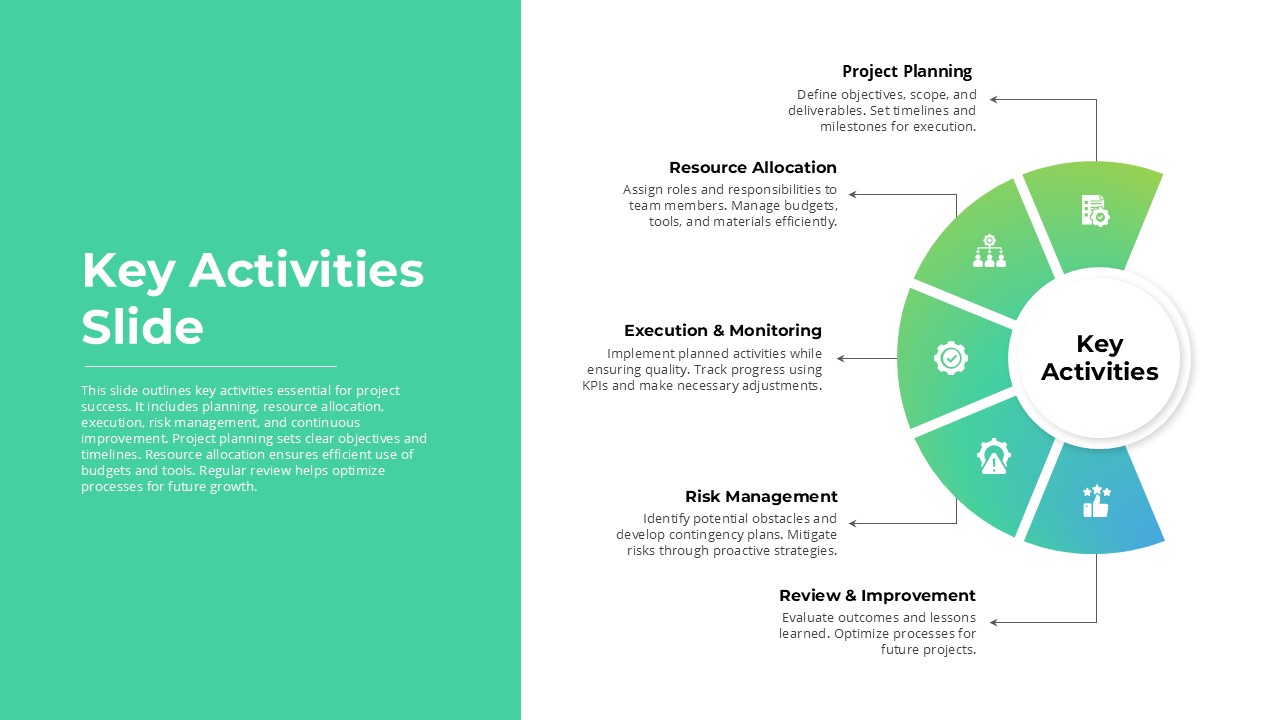
Project Key Activities Circular Diagram Template for PowerPoint & Google Slides
Process
Weekly Gantt Chart Project Timeline Template for PowerPoint & Google Slides
Gantt Chart
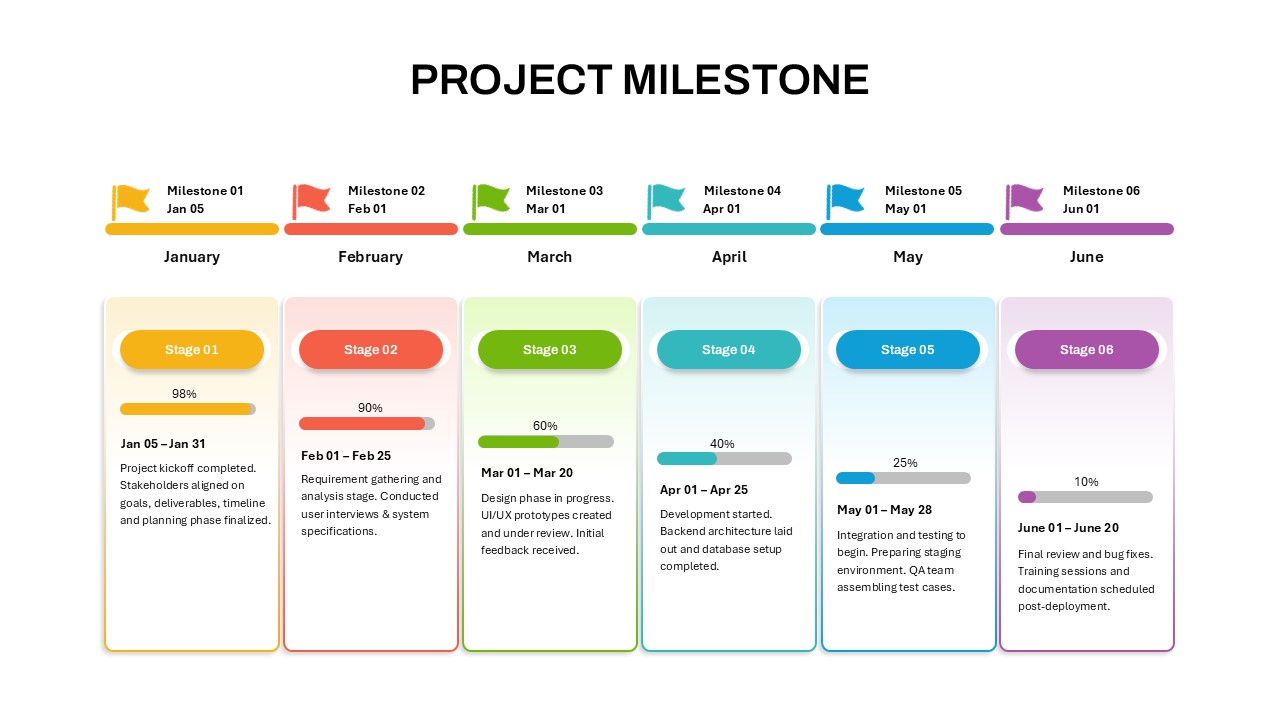
Project Milestone Timeline Infographic Template for PowerPoint & Google Slides
Timeline
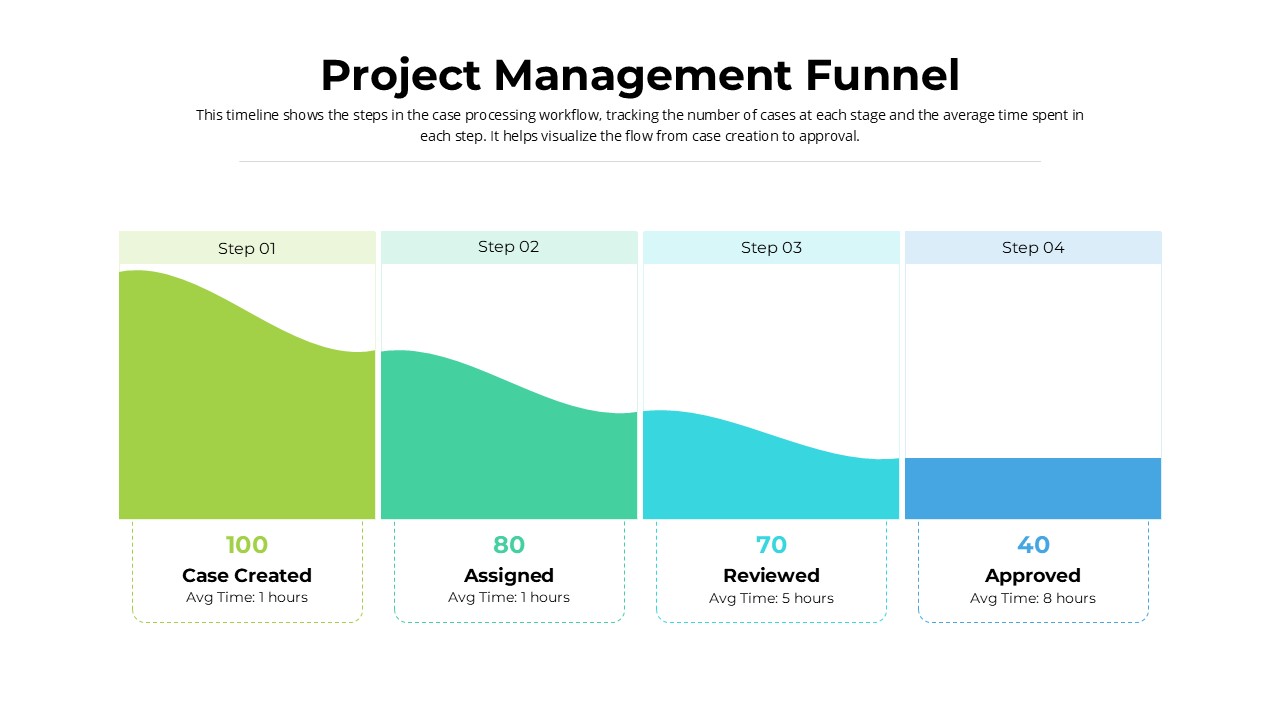
Project Management Funnel Template for PowerPoint & Google Slides
Funnel
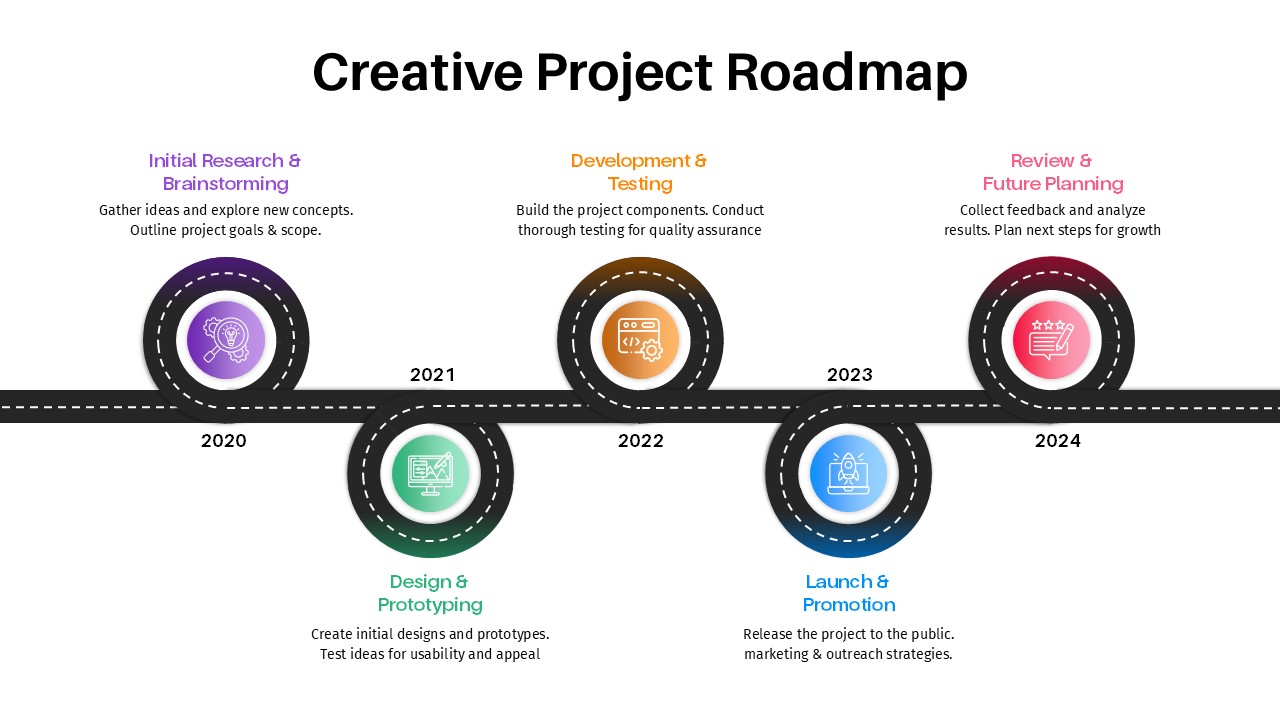
Creative Project Roadmap template for PowerPoint & Google Slides
Business
Colorful Annual Gantt Chart Project Planner Template for PowerPoint & Google Slides
Gantt Chart
Civil Engineering Project Overview Deck Template for PowerPoint & Google Slides
Decks
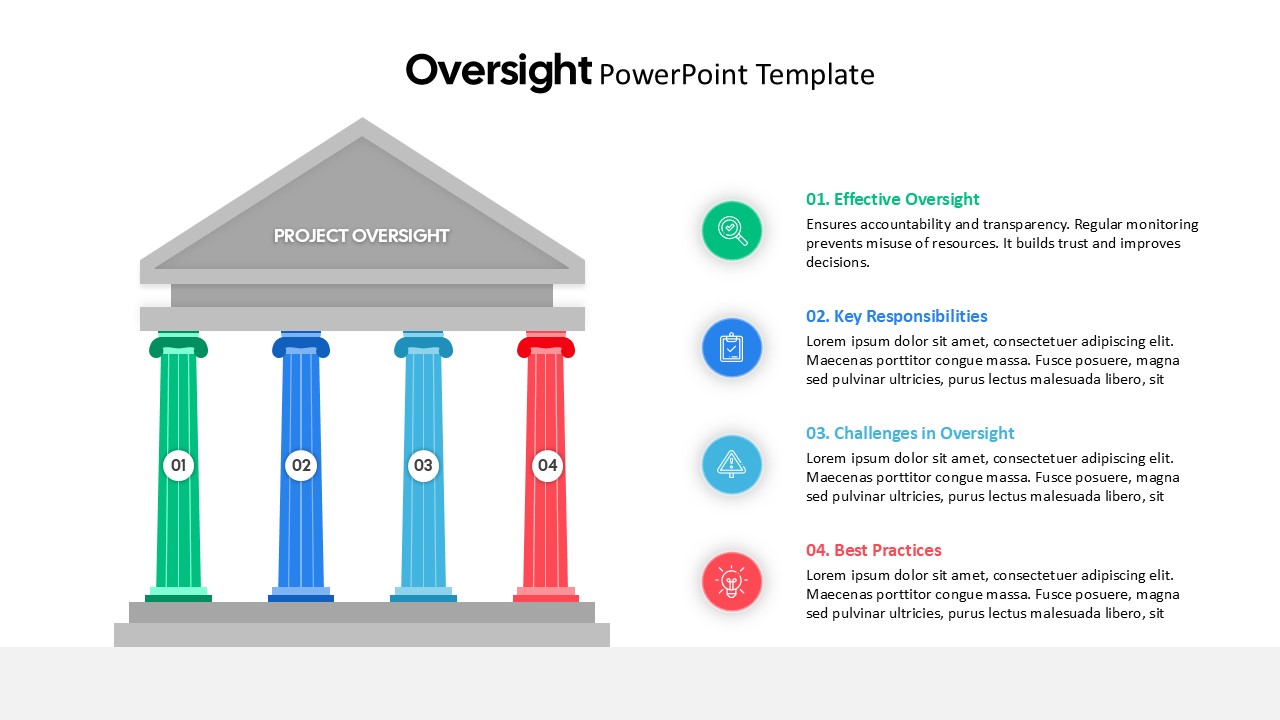
Project Oversight Pillars Infographic Template for PowerPoint & Google Slides
Process
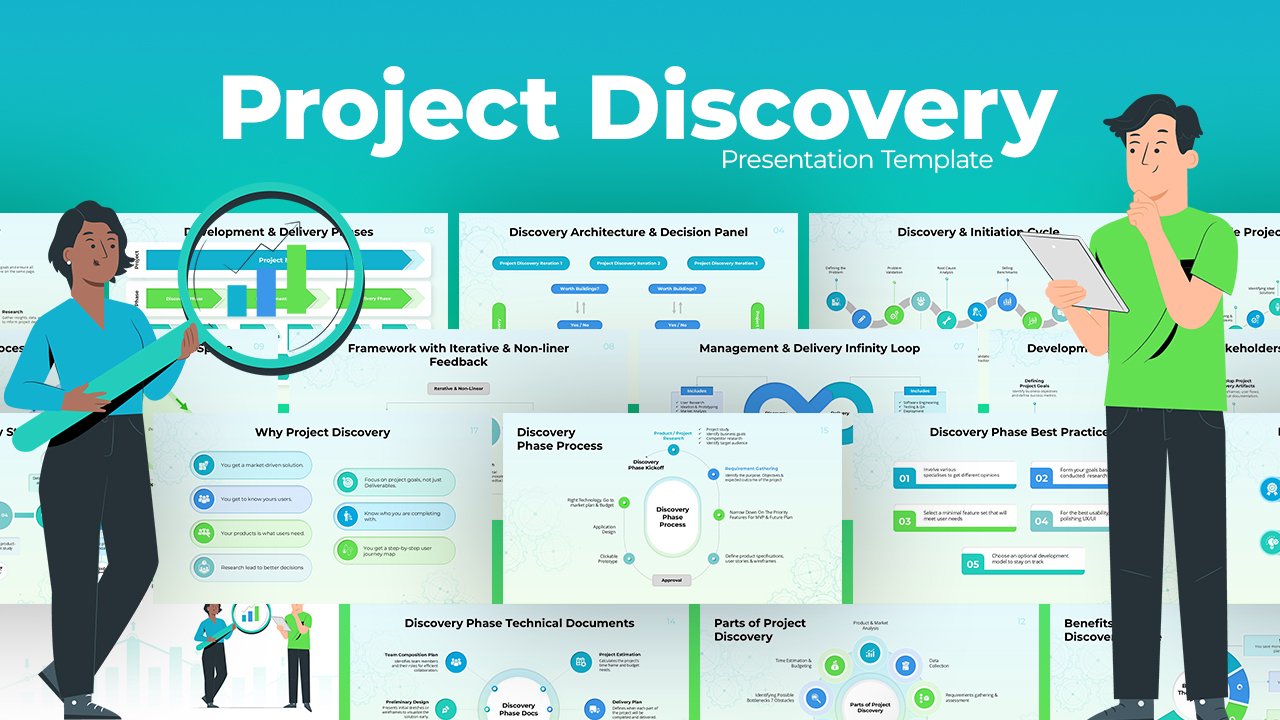
Project Discovery Template for PowerPoint & Google Slides
Pitch Deck
Six Step Project Workflow Template for PowerPoint & Google Slides
Project
Construction Project Dashboard Template for PowerPoint & Google Slides
Project
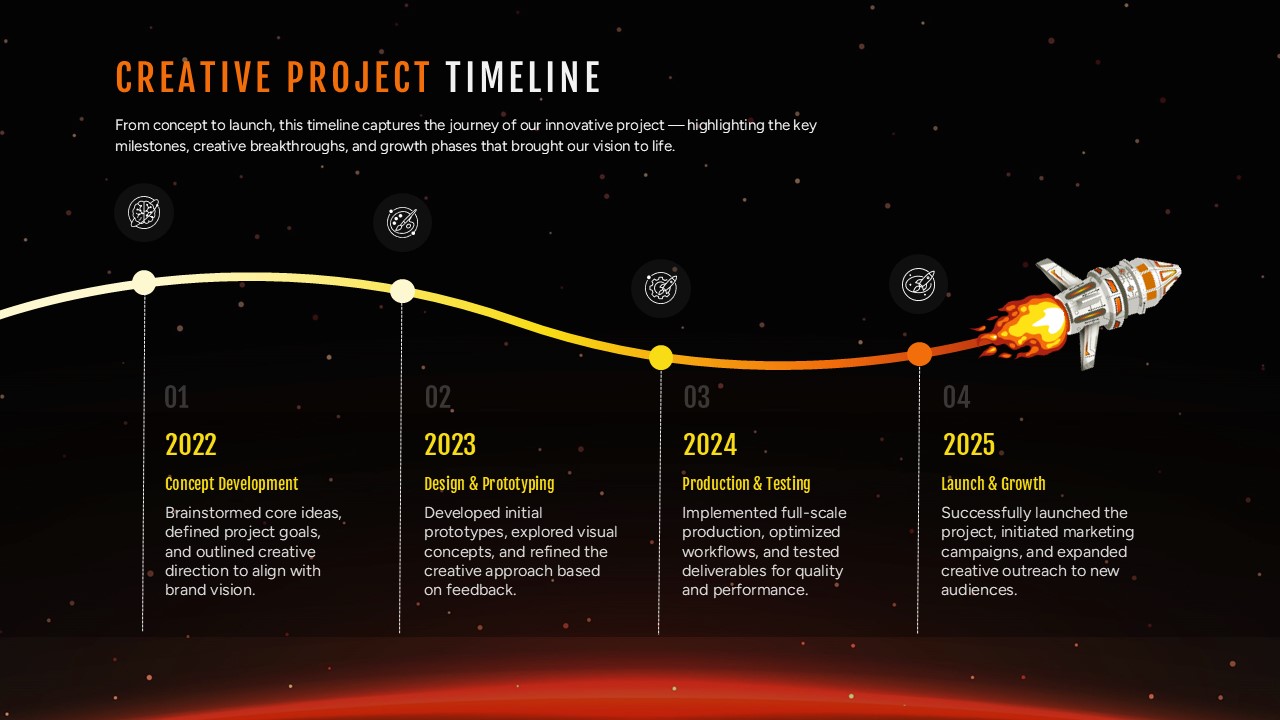
Creative Project Timeline Roadmap Template for PowerPoint & Google Slides
Timeline