Progress Bar infographic pack for PowerPoint & Google Slides


Description
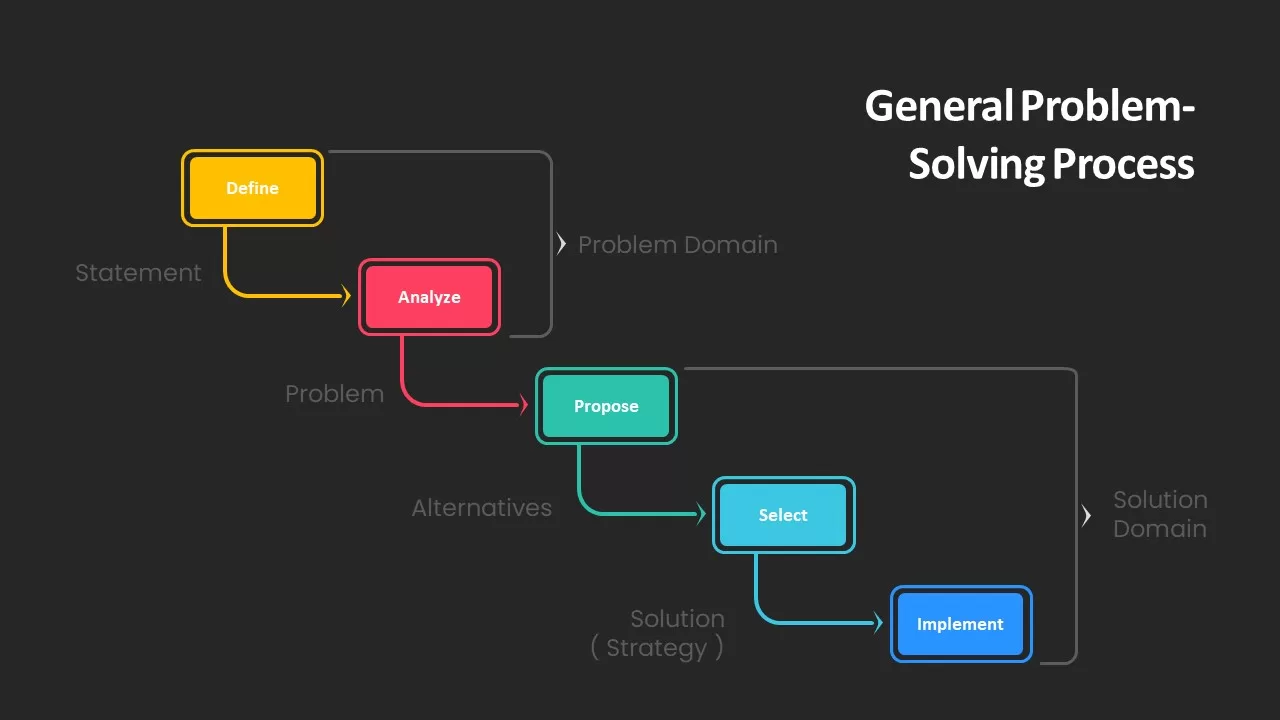
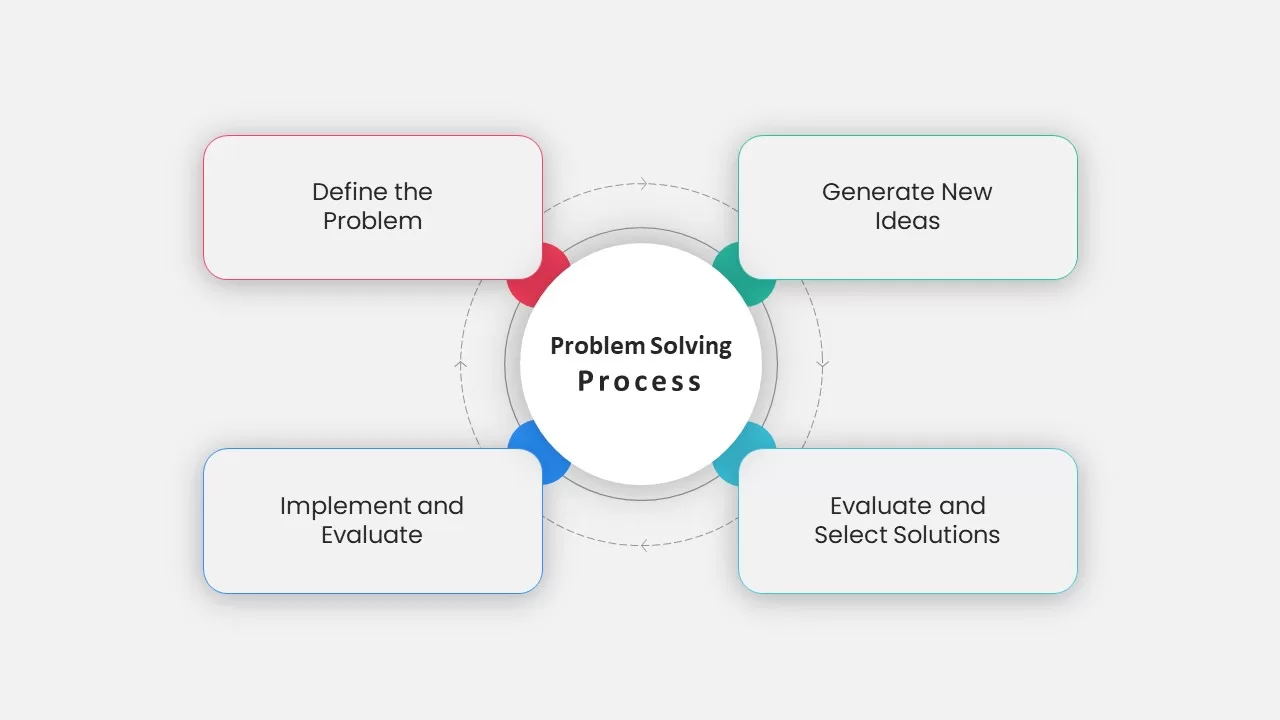
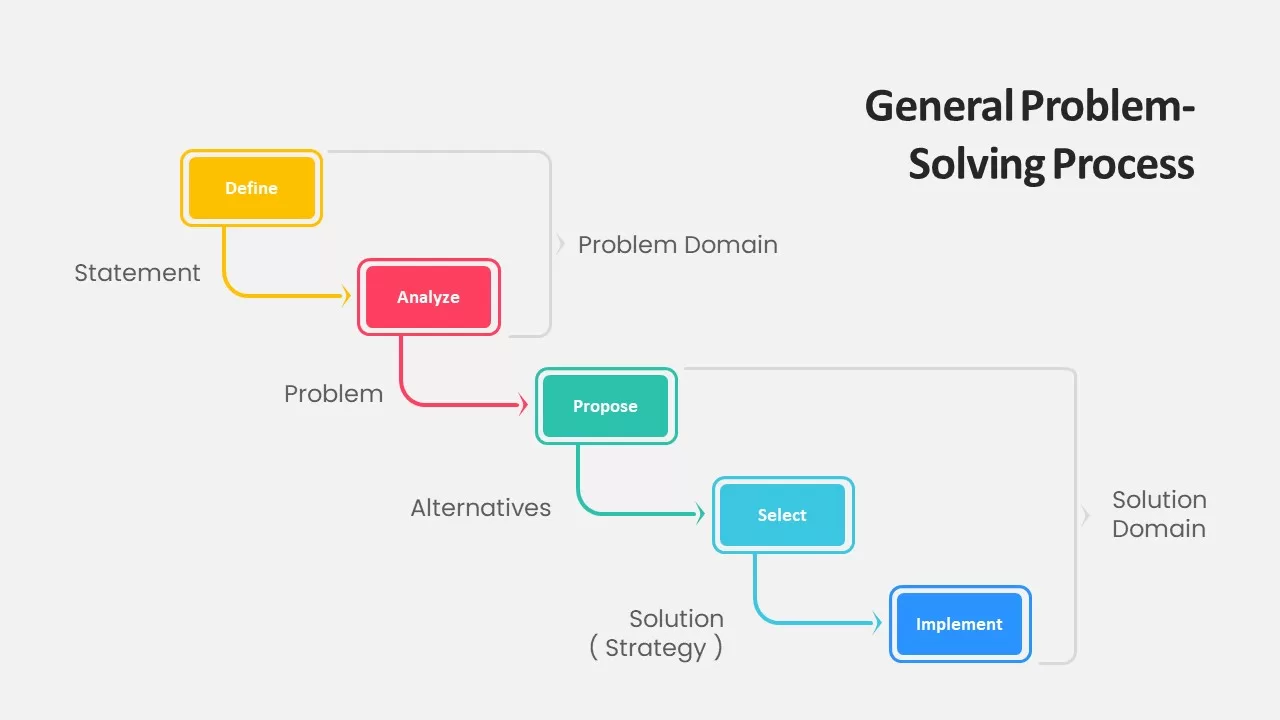
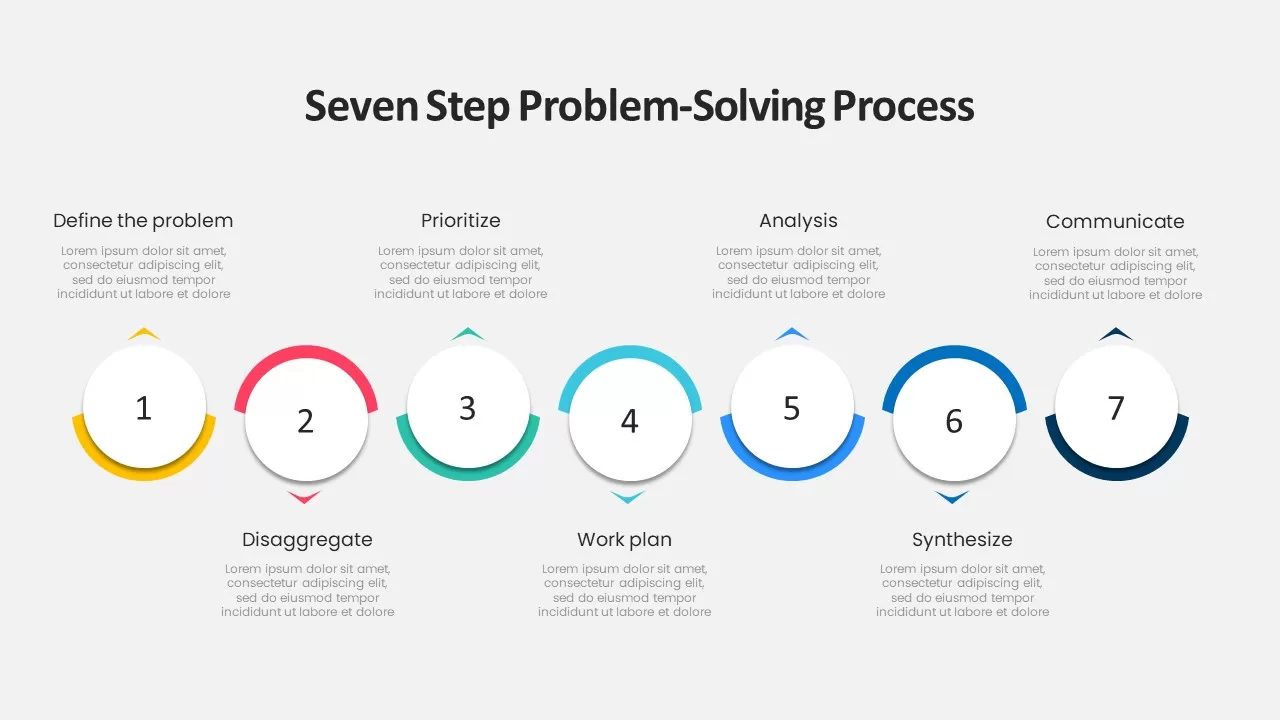
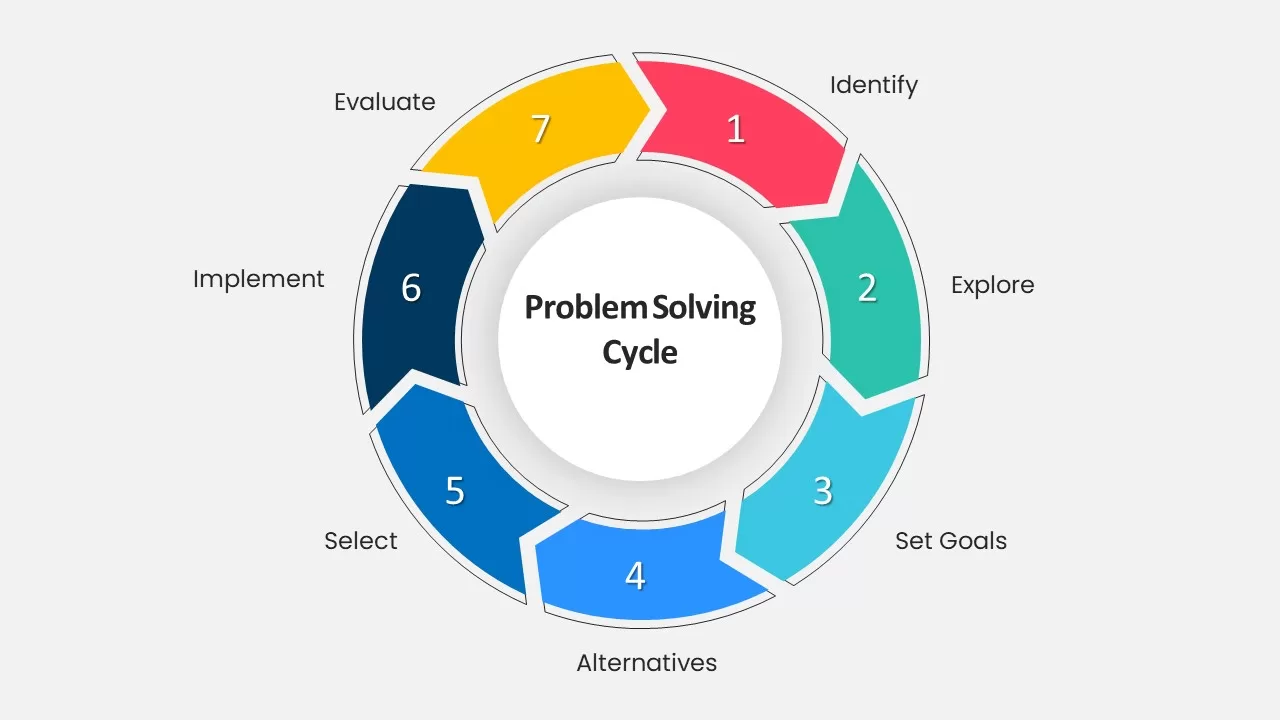
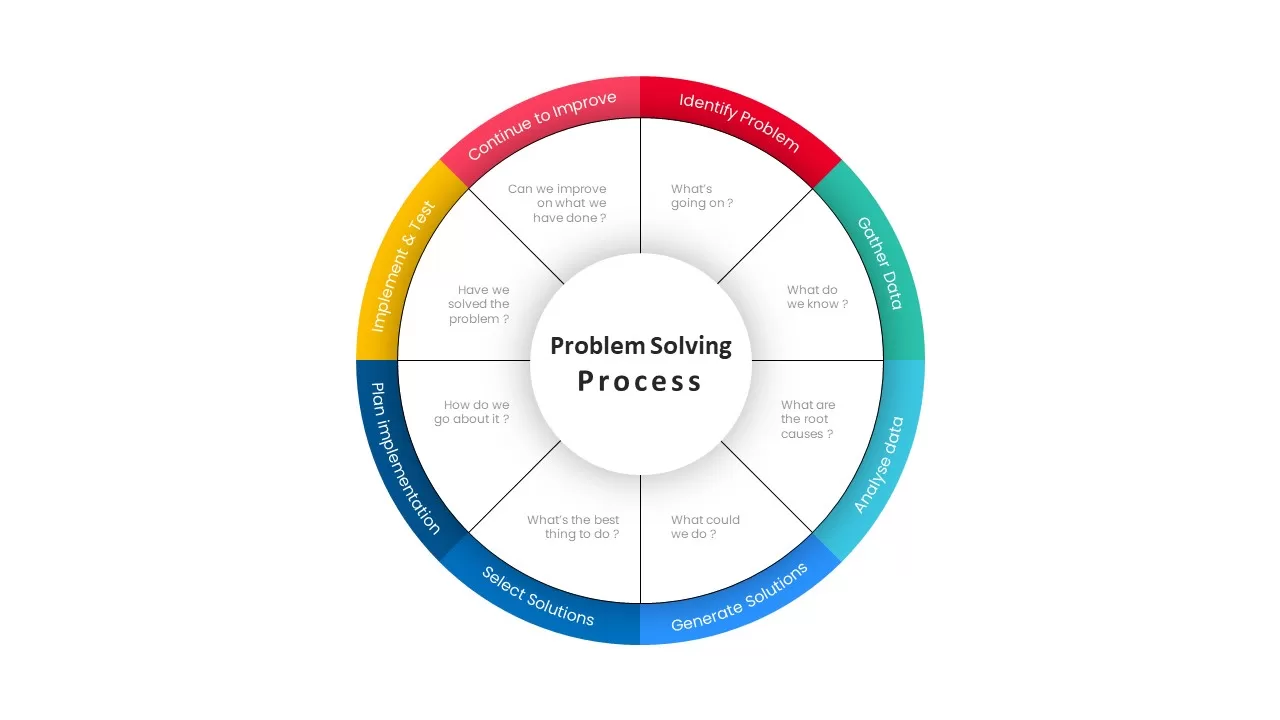
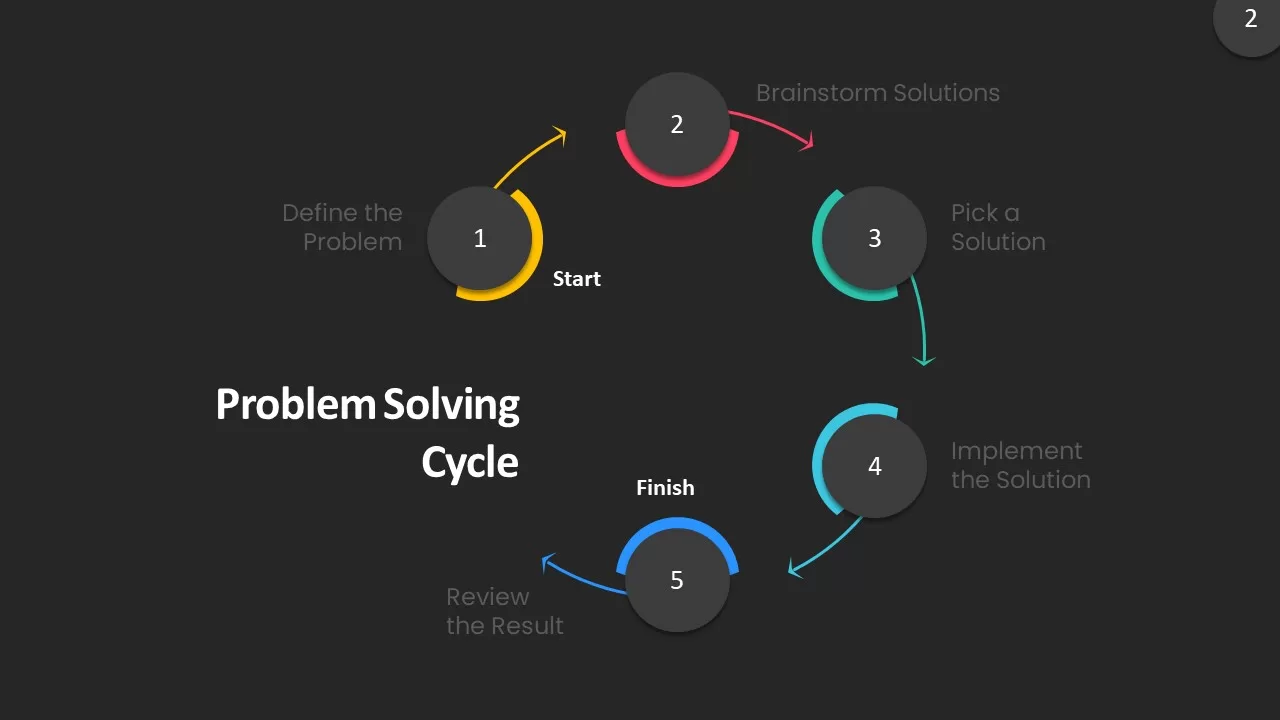
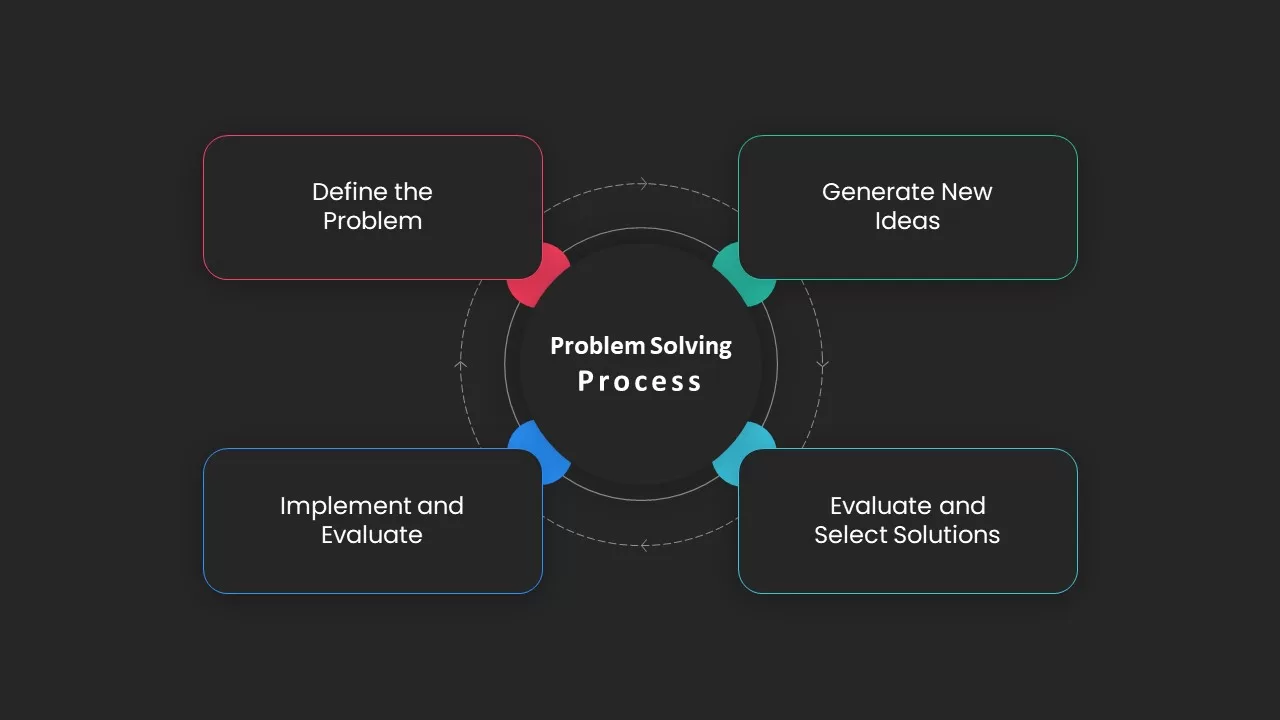
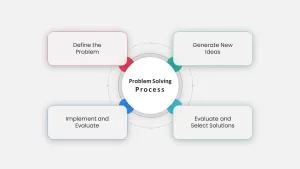
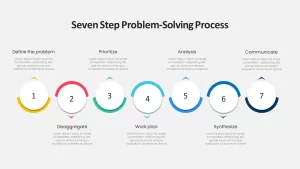
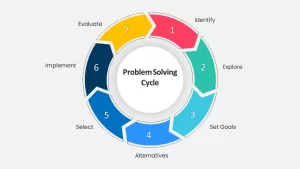
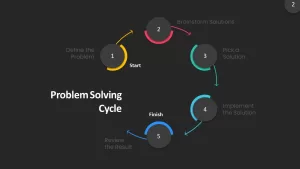
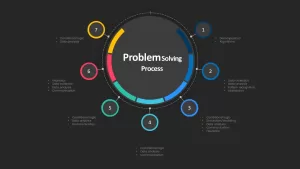
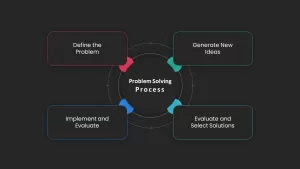
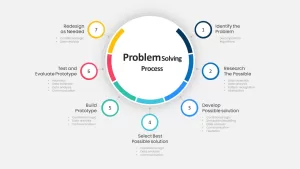
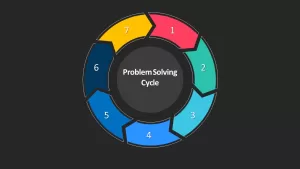
This comprehensive pack of 14 infographic slides showcases various progress bar designs to effectively represent progress, milestones, and status in a visually engaging format. The slides feature diverse progress bar styles, including circular, linear, segmented, and horizontal bars with vibrant color schemes. These infographics are perfect for presenting project milestones, team achievements, sales progress, goal completion, and performance tracking. The clean design and intuitive layout allow for easy customization of data, making these slides adaptable to a variety of contexts, from business reports to academic presentations. Whether you’re illustrating the progress of a project, evaluating performance metrics, or visualizing stages of a process, these slides will add clarity and professionalism to your presentation.
Who is it for
This infographic pack is ideal for project managers, business analysts, marketers, and team leaders who need to track and display progress visually. It is also great for educators and students who wish to present data in an easy-to-understand and visually compelling manner. Whether you’re presenting project timelines, KPI reports, or performance reviews, these slides provide the perfect tool to communicate your progress effectively.
Other Uses
Beyond progress tracking, these slides can be repurposed for comparing multiple data points, illustrating project stages, or visualizing sales targets. They can also be used to highlight performance improvements, employee achievements, product development phases, or customer satisfaction levels, making them versatile for various industries and functions.
Login to download this file

Item ID
SB02301
Related Templates

Progress Bar Infographic for PowerPoint & Google Slides
Business
Progress Bar Graph Layout Design for PowerPoint & Google Slides
Charts
Timeline Roadmap with Progress Bar Template for PowerPoint & Google Slides
Timeline
Progress Bar and Milestone Visualization Template for PowerPoint & Google Slides
Timeline

Sales Process Infographic Slides Pack Template for PowerPoint & Google Slides
Process
Agenda Infographic Pack of 2 Slides Template for PowerPoint & Google Slides
Agenda
Quad Chart Infographic Pack of 8 Slides Template for PowerPoint & Google Slides
Comparison Chart
Game Plan Infographic Slides Pack Template for PowerPoint & Google Slides
Infographics
Free Infographic Deck PowerPoint Pack for PowerPoint & Google Slides
Infographics
Free

North Korea Map with Provinces Infographic Pack Template for PowerPoint & Google Slides
Maps
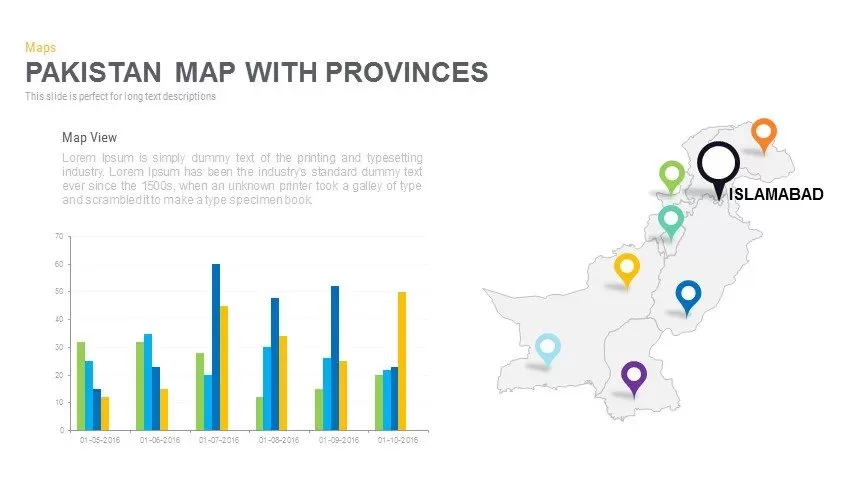
Pakistan Provinces Map Infographic Pack Template for PowerPoint & Google Slides
Maps
Sri Lanka Map Infographic Pack Template for PowerPoint & Google Slides
Maps
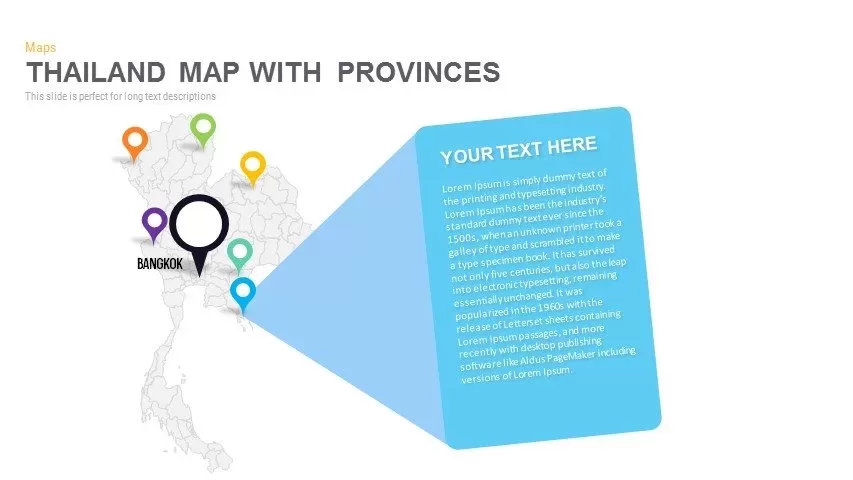
Thailand Provinces Map Infographic Pack Template for PowerPoint & Google Slides
Maps
Vietnam Provinces Map Infographic Pack Template for PowerPoint & Google Slides
Maps
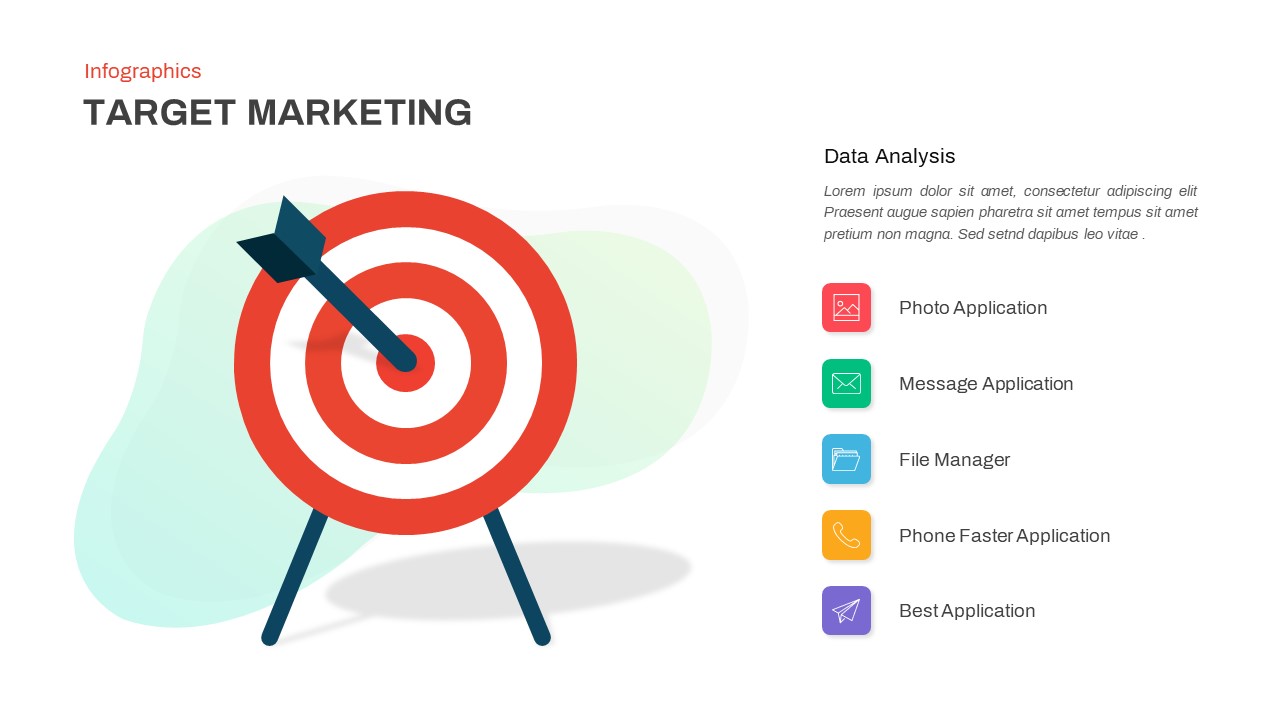
Target Marketing Infographic Slide Pack Template for PowerPoint & Google Slides
Infographics
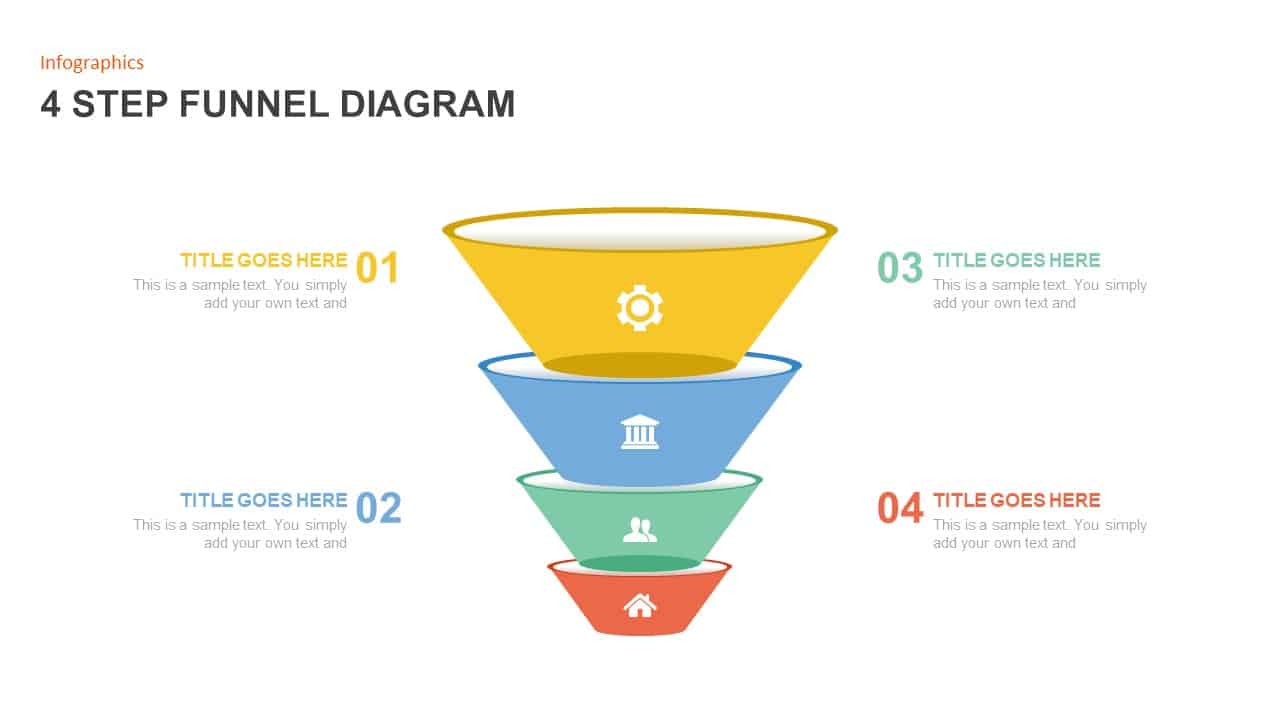
Four-Step Funnel Infographic Pack Template for PowerPoint & Google Slides
Funnel

IT Strategic Diagram Infographic Pack Template for PowerPoint & Google Slides
Business Strategy
Overcoming Challenges Infographic Pack Template for PowerPoint & Google Slides
Opportunities Challenges
Likert Scale Survey Results infographic pack for PowerPoint & Google Slides
Business
From To infographic pack for PowerPoint & Google Slides
Business Plan
1 to 5 Column infographic pack for PowerPoint & Google Slides
Business
Sales Infographic pack for PowerPoint & Google Slides
Business
Three-Year Plan Infographic Pack Template for PowerPoint & Google Slides
Timeline
Now Next Later Infographic Pack Template for PowerPoint & Google Slides
Process
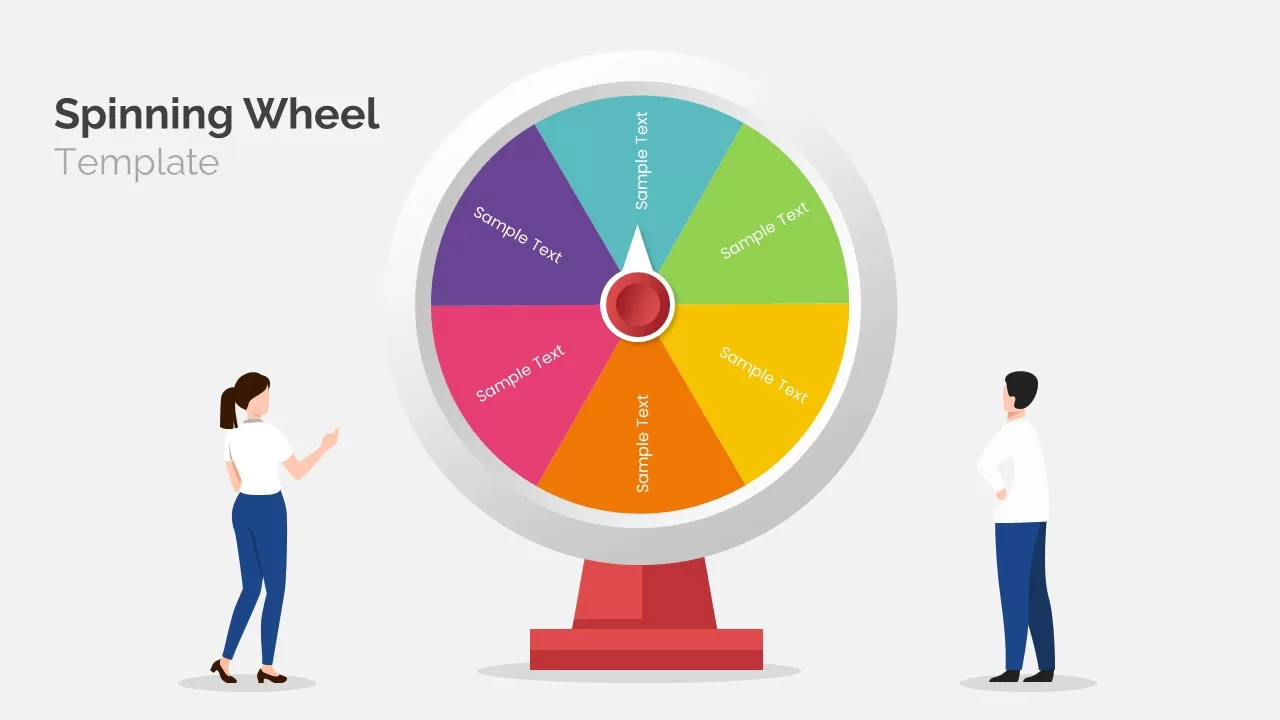
Animated Spinning Wheel Infographic Pack Template for PowerPoint & Google Slides
Circular
Root Cause Analysis Infographic Pack Template for PowerPoint & Google Slides
Process
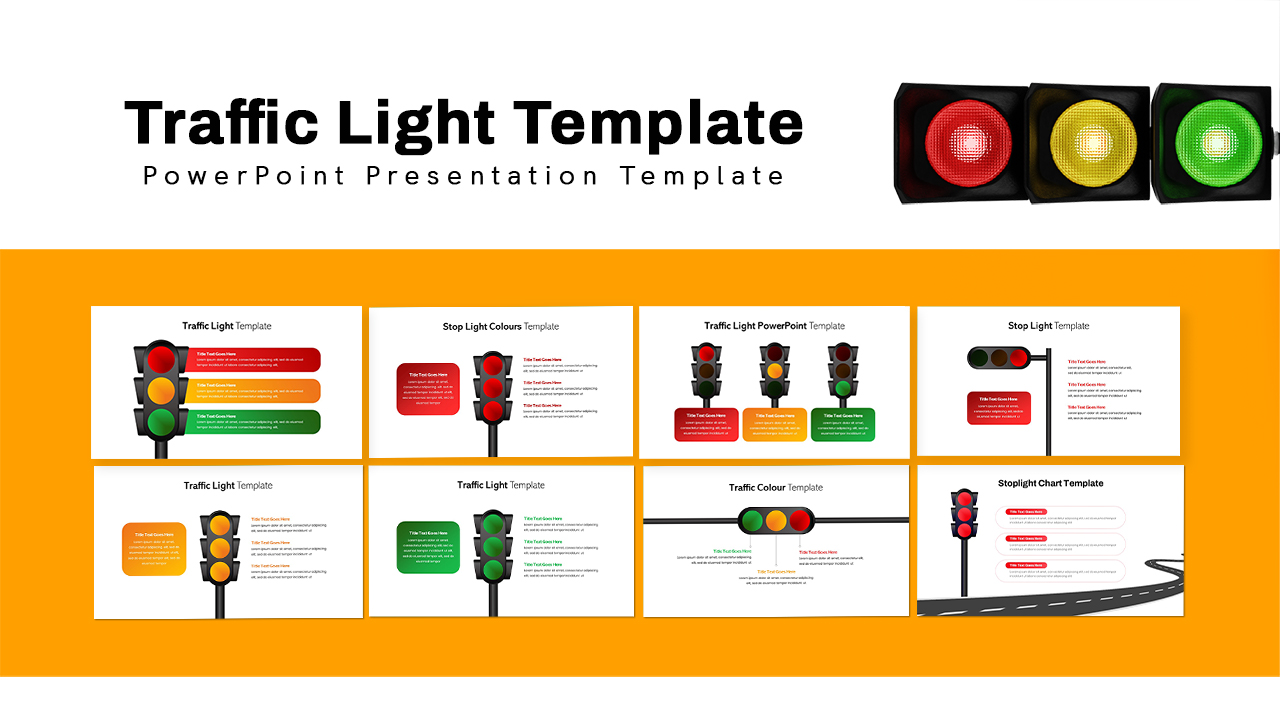
Traffic Light Infographic Pack Template for PowerPoint & Google Slides
Pitch Deck
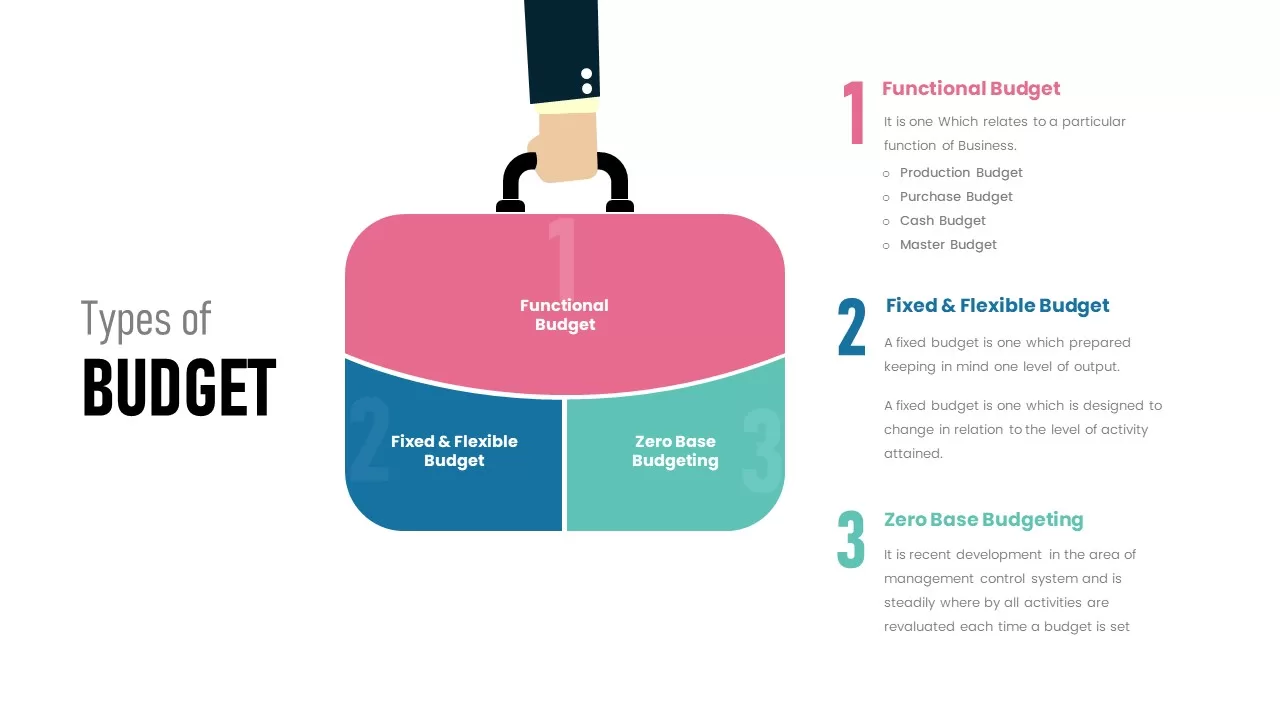
Types of Budget Infographic Pack Template for PowerPoint & Google Slides
Comparison
Data-driven GDP Growth Infographic Pack Template for PowerPoint & Google Slides
Infographics
Transformation Roadmap Infographic Pack Template for PowerPoint & Google Slides
Timeline
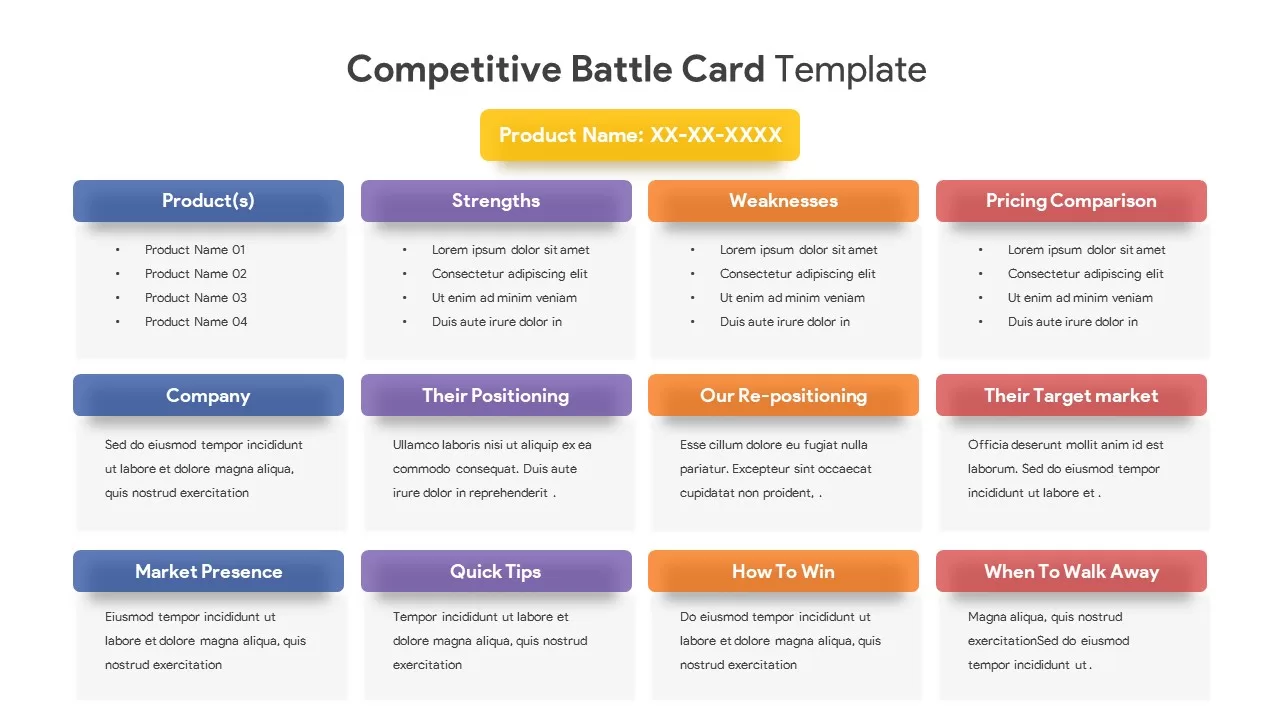
Competitive Battle Card Infographic Pack Template for PowerPoint & Google Slides
Competitor Analysis

Free Colorful Infographic Slide Pack Template for PowerPoint & Google Slides
Roadmap
Free
Free Multi-Step Funnel Infographic Slide Pack Template for PowerPoint & Google Slides
Funnel
Free
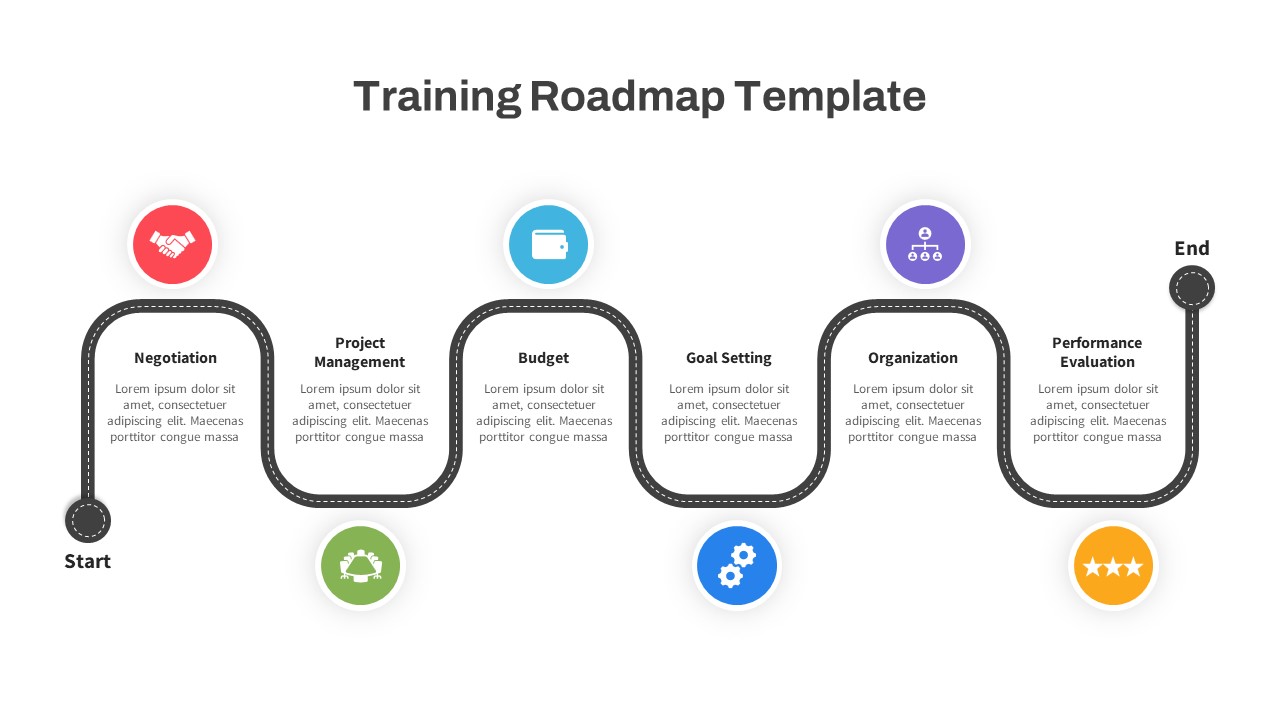
Training Roadmap Infographic Pack Template for PowerPoint & Google Slides
Roadmap
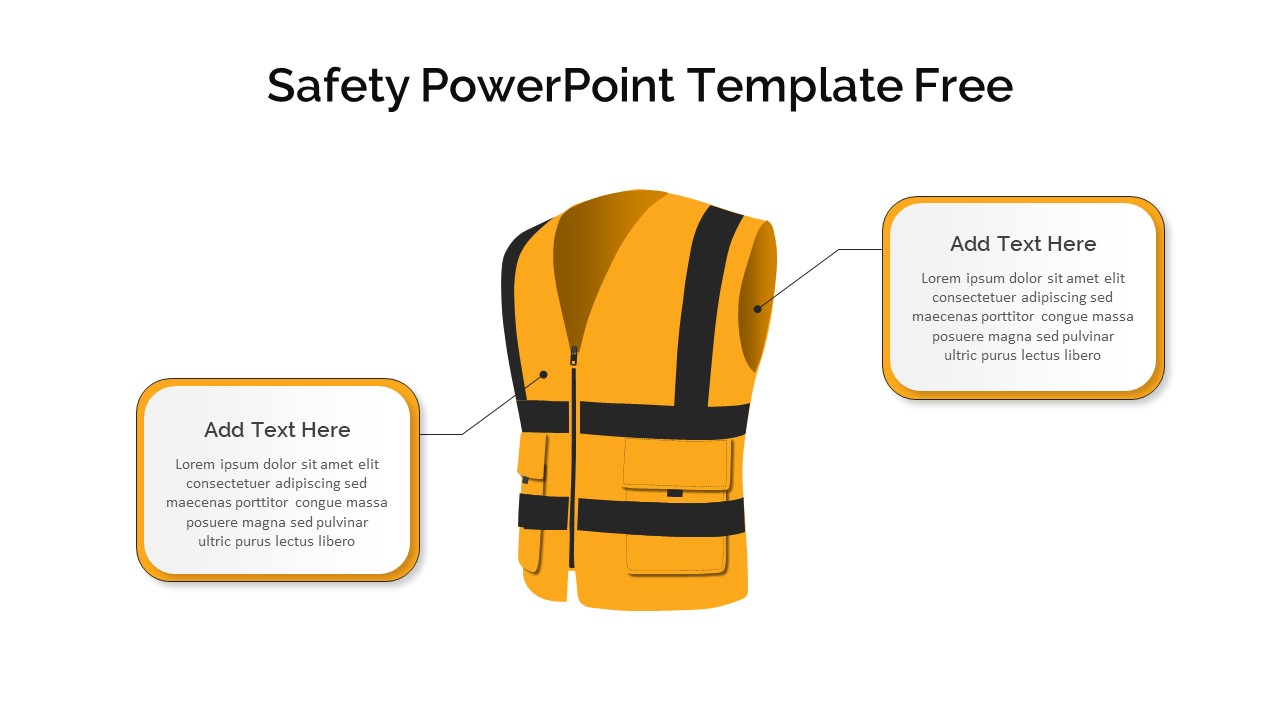
Free 4 Safety Equipment Infographic Pack Template for PowerPoint & Google Slides
Pitch Deck
Free
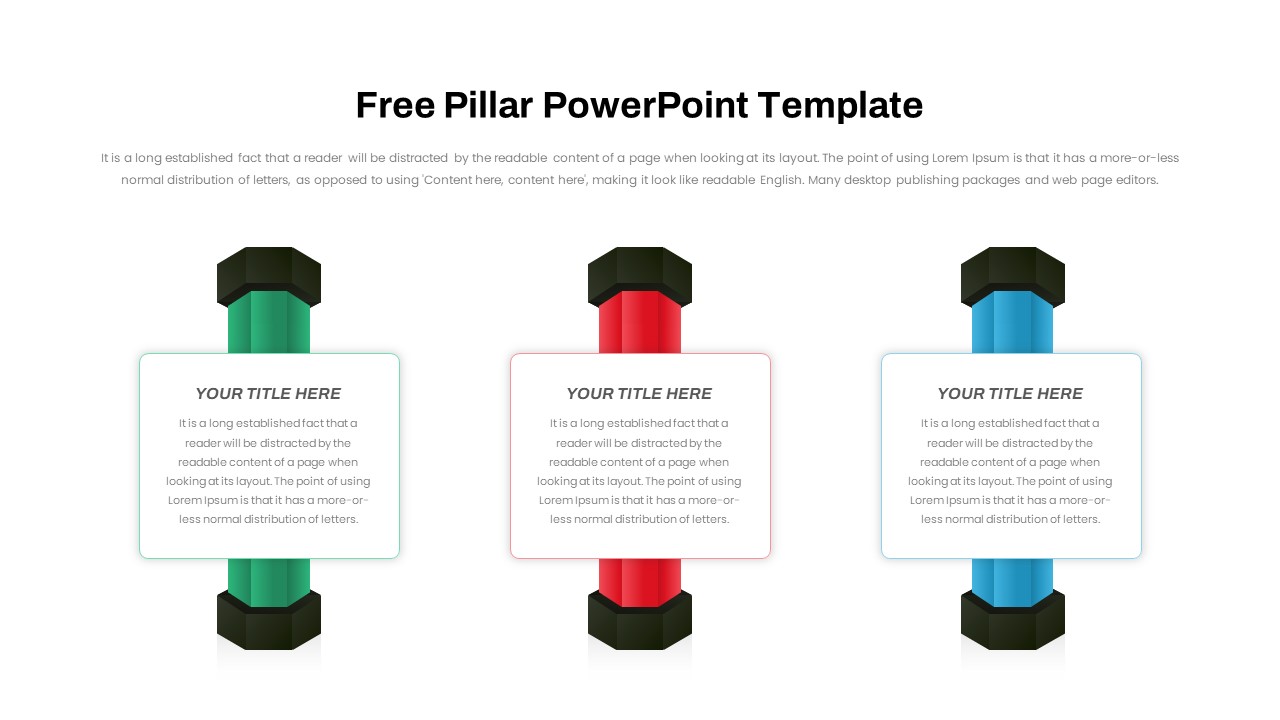
Free Three and Four Pillar Infographic Pack Template for PowerPoint & Google Slides
Process
Free
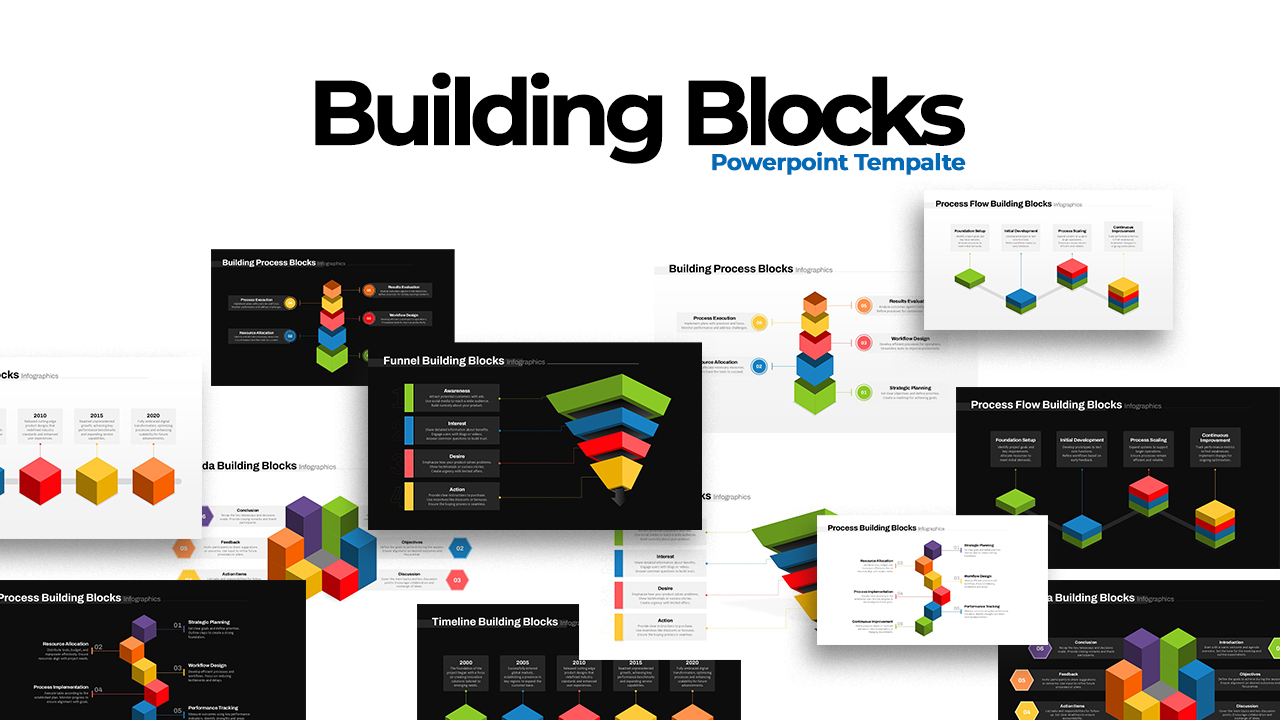
3D Building Blocks Infographic Pack Template for PowerPoint & Google Slides
Infographics
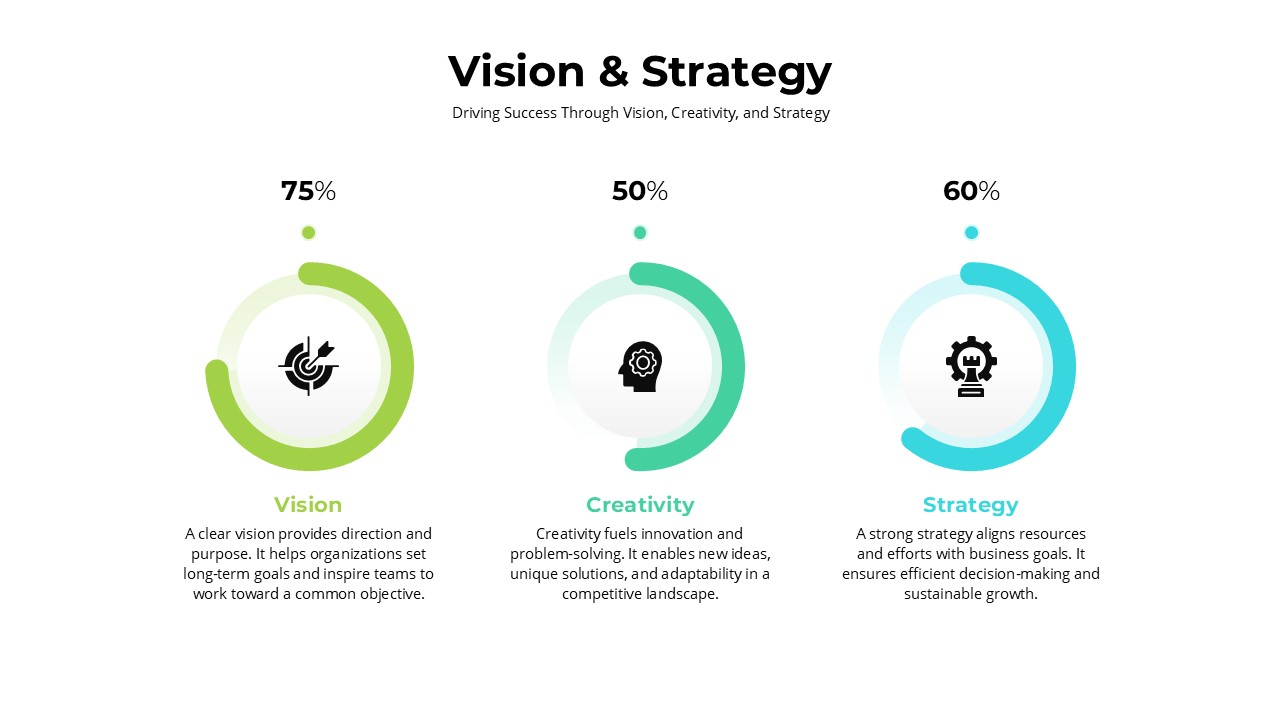
Vision & Strategy Infographic Pack Template for PowerPoint & Google Slides
Vision and Mission
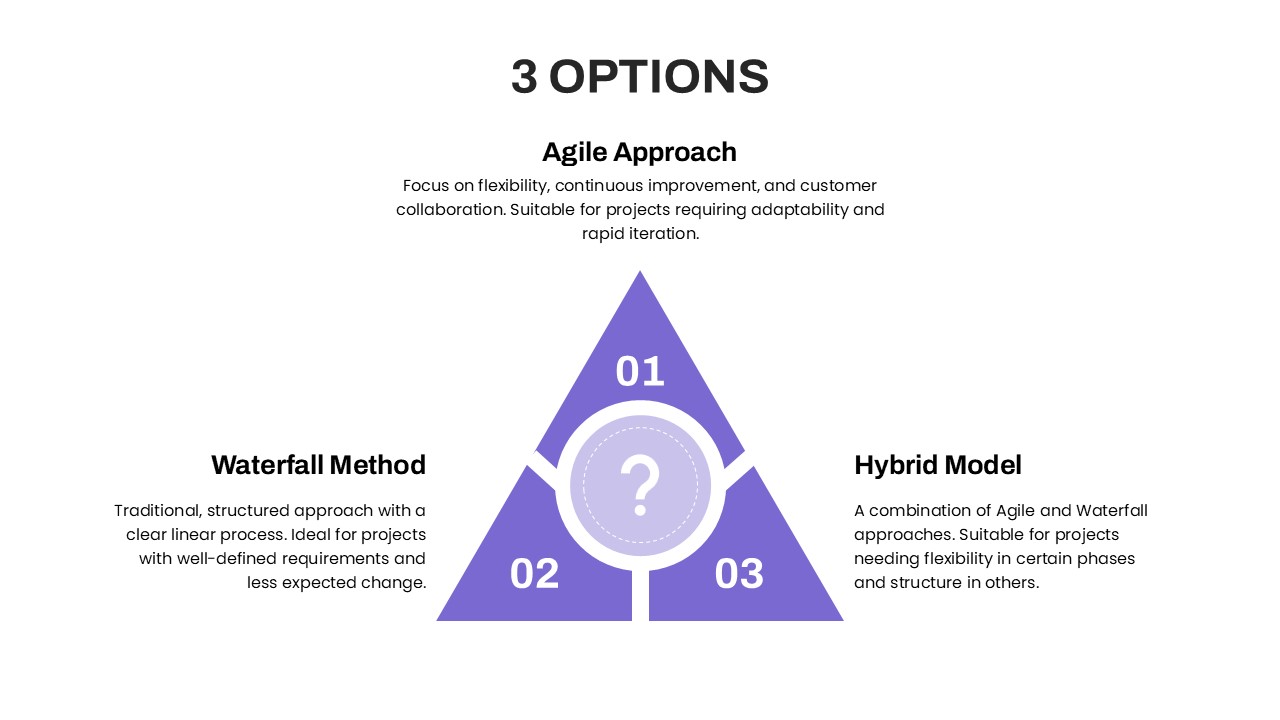
Three Options Infographic Pack Template for PowerPoint & Google Slides
Process
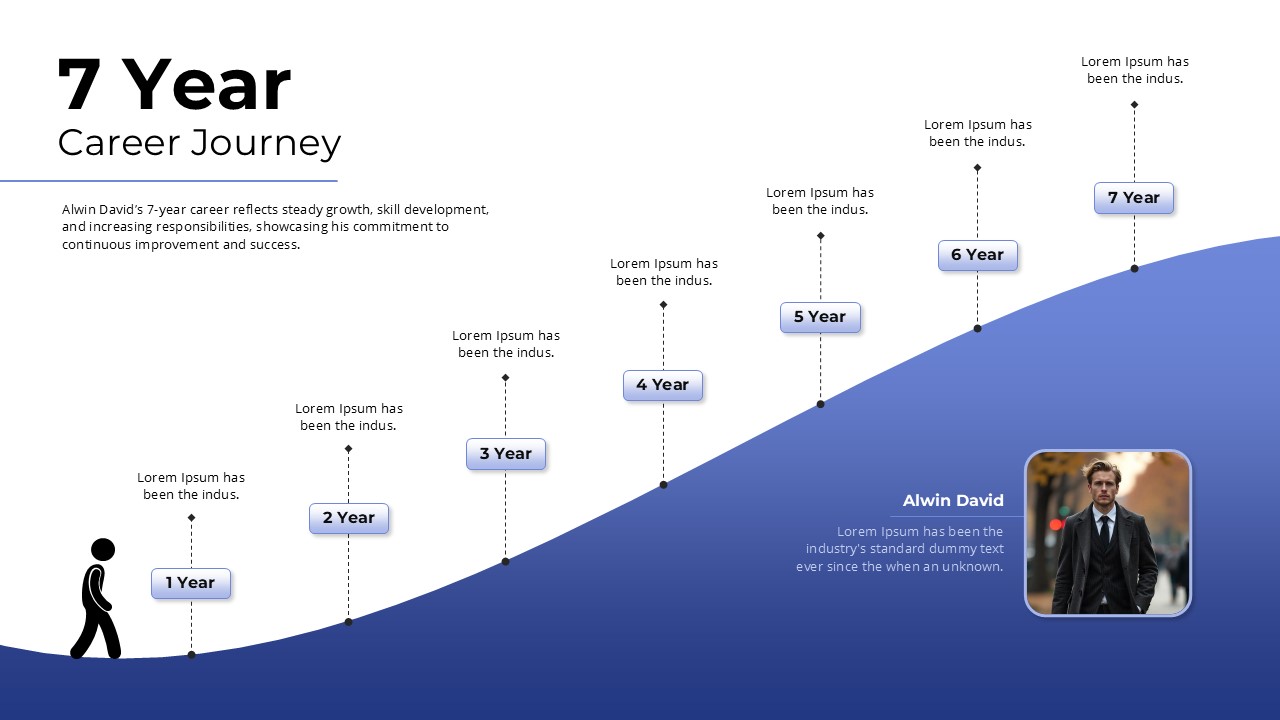
Career Journey Infographic Pack Template for PowerPoint & Google Slides
Timeline
Project Discovery Infographic Pack Template for PowerPoint & Google Slides
Timeline
Cost Driver Infographic Slide Pack Template for PowerPoint & Google Slides
Process
Pros and Cons Infographic Slide Pack Template for PowerPoint & Google Slides
Comparison
iPad App Mockup with Progress Metrics Template for PowerPoint & Google Slides
Bar/Column
Success Cloud Progress Infographics Template for PowerPoint & Google Slides
Charts

Growth Arrow for Progress & Growth template for PowerPoint & Google Slides
Arrow
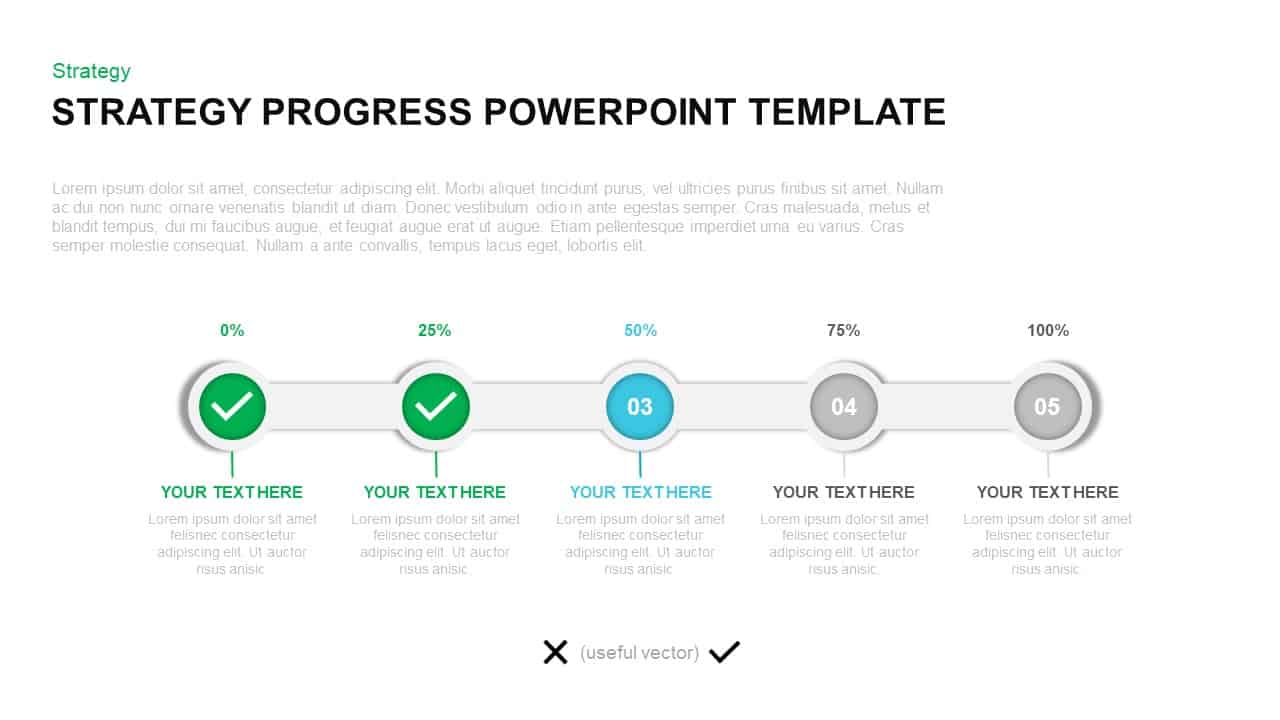
Strategy Progress Timeline Template for PowerPoint & Google Slides
Process
Performance Review Progress Management Template for PowerPoint & Google Slides
Process
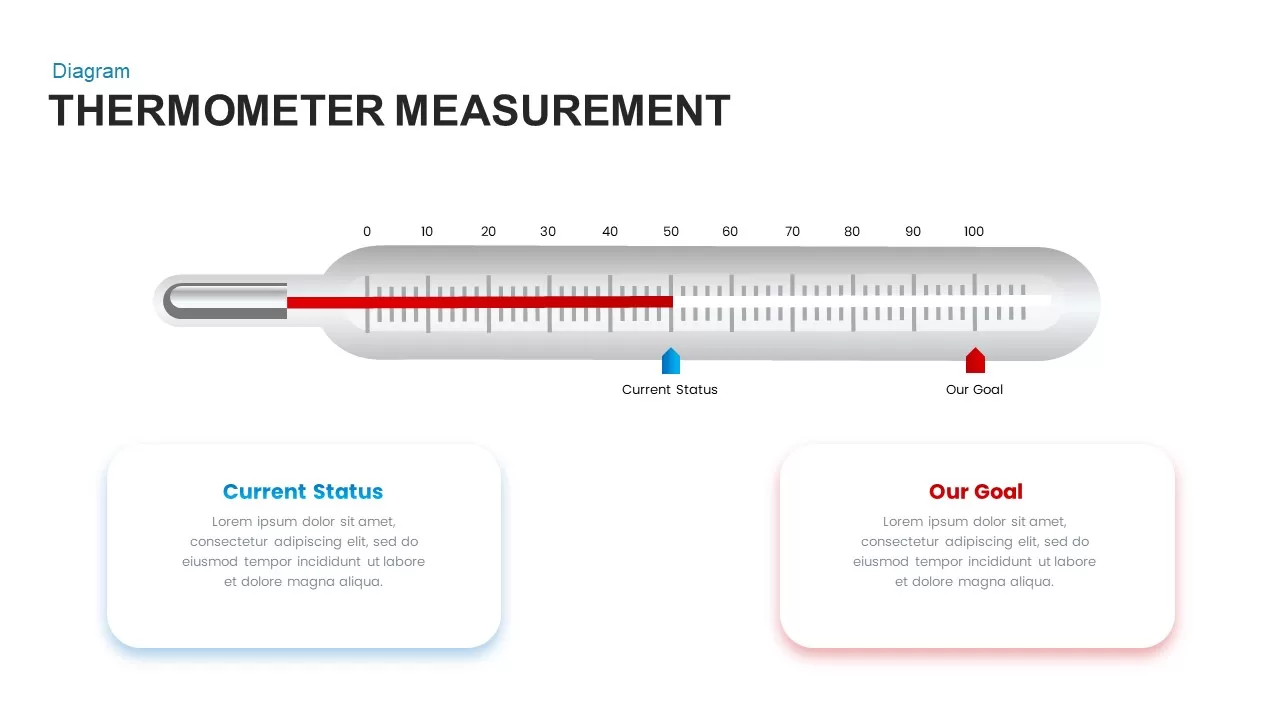
Thermometer Gauge Progress Measurement Template for PowerPoint & Google Slides
Comparison
Free Curved Arrow Progress Chart template for PowerPoint & Google Slides
Project
Free
Dynamic Statistics & Progress Charts Template for PowerPoint & Google Slides
Pie/Donut
Agriculture Infographics Slide with Progress Rings & Metrics Template for PowerPoint & Google Slides
Pie/Donut
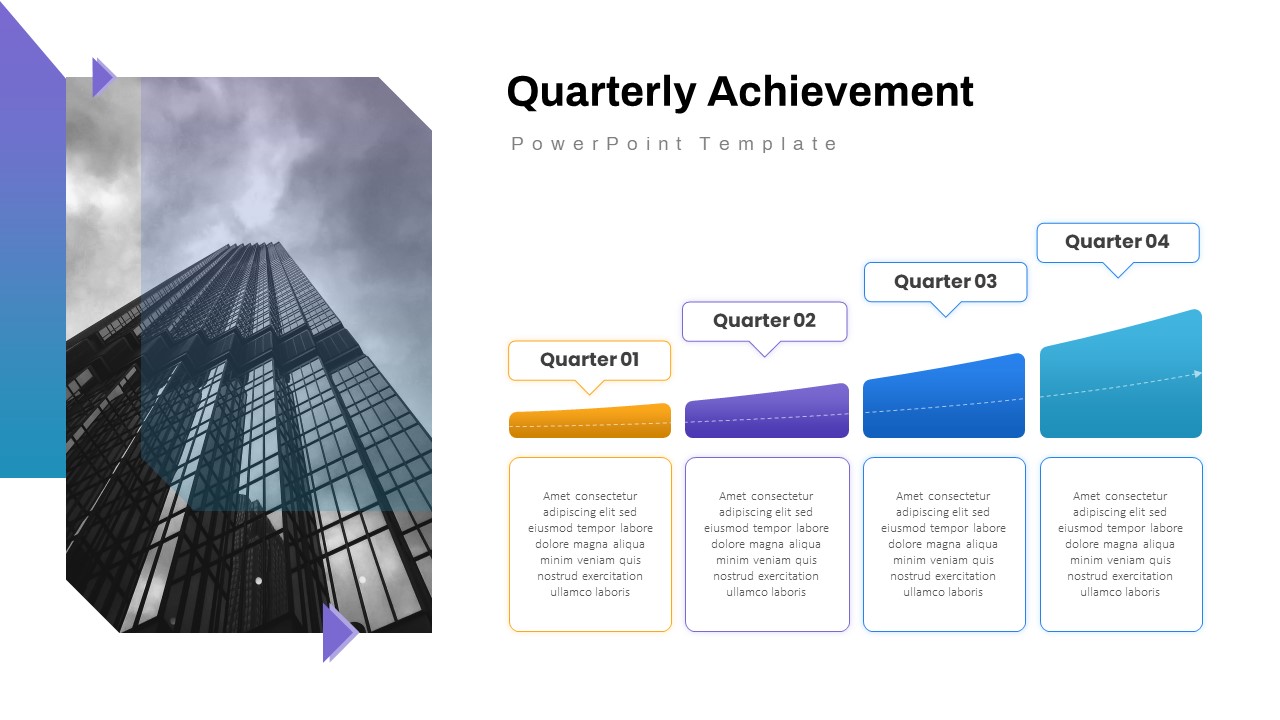
Quarterly Achievement Progress Template for PowerPoint & Google Slides
Accomplishment
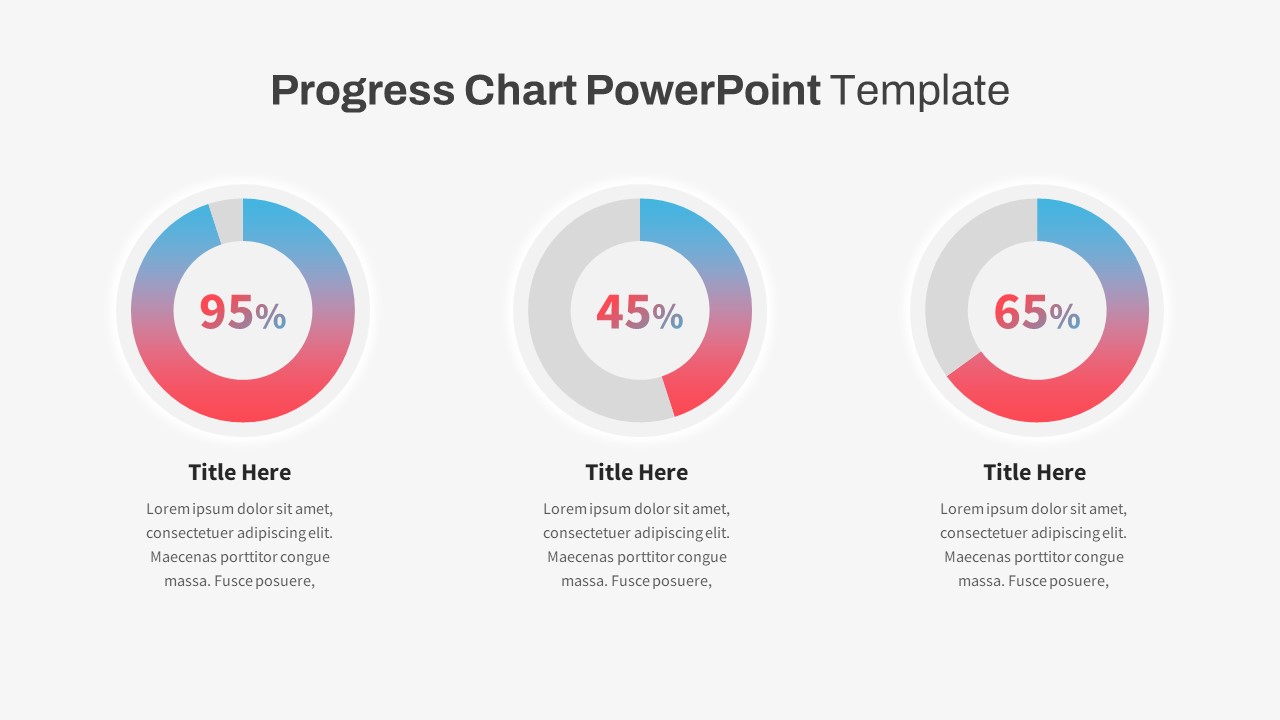
Progress Chart Slide for PowerPoint & Google Slides
Charts
Project Progress Dashboard Pie Charts Template for PowerPoint & Google Slides
Project
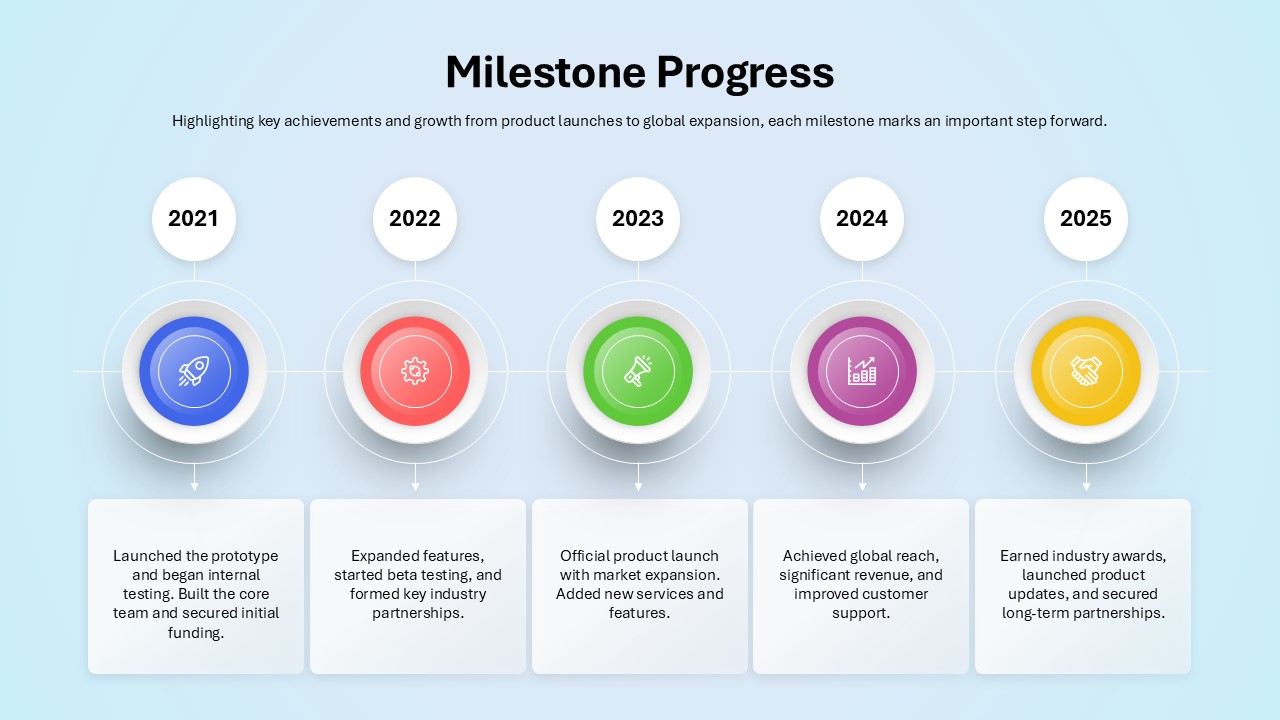
Milestone Progress template for PowerPoint & Google Slides
Business Plan
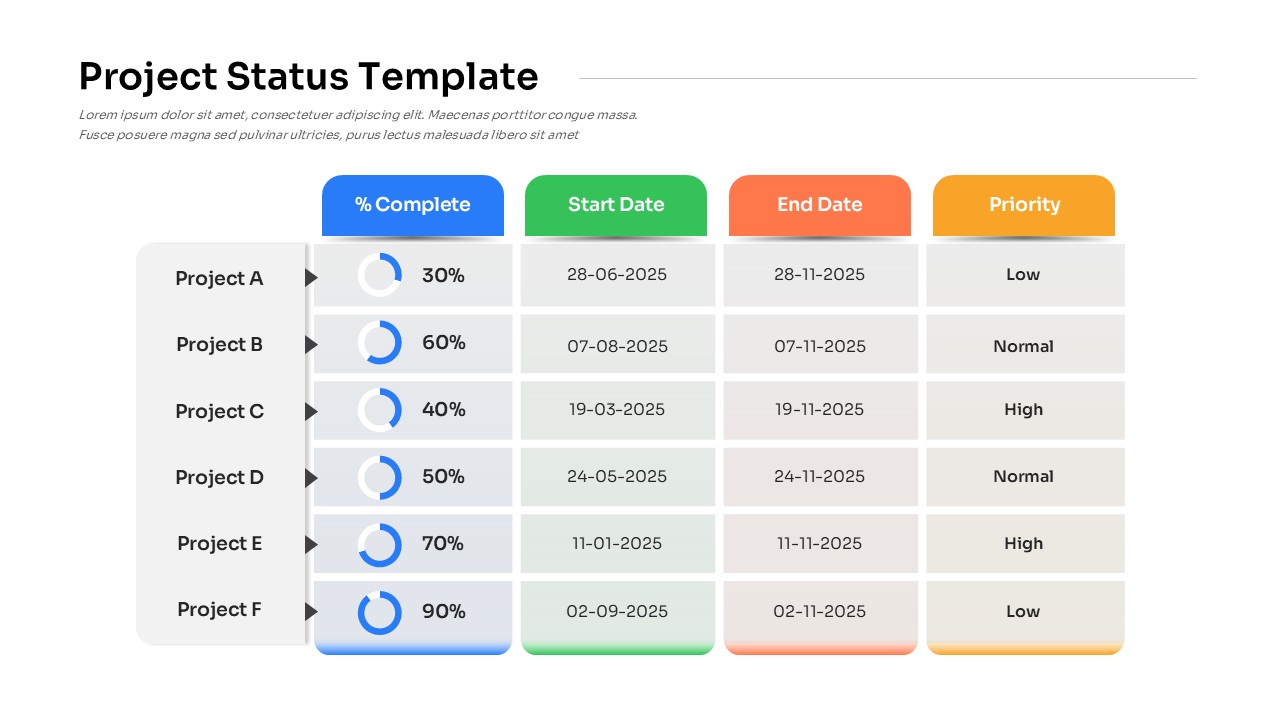
Project Status with Progress & Priority Template for PowerPoint & Google Slides
Table
Snake Diagram Pack of 8 Slides template for PowerPoint & Google Slides
Process
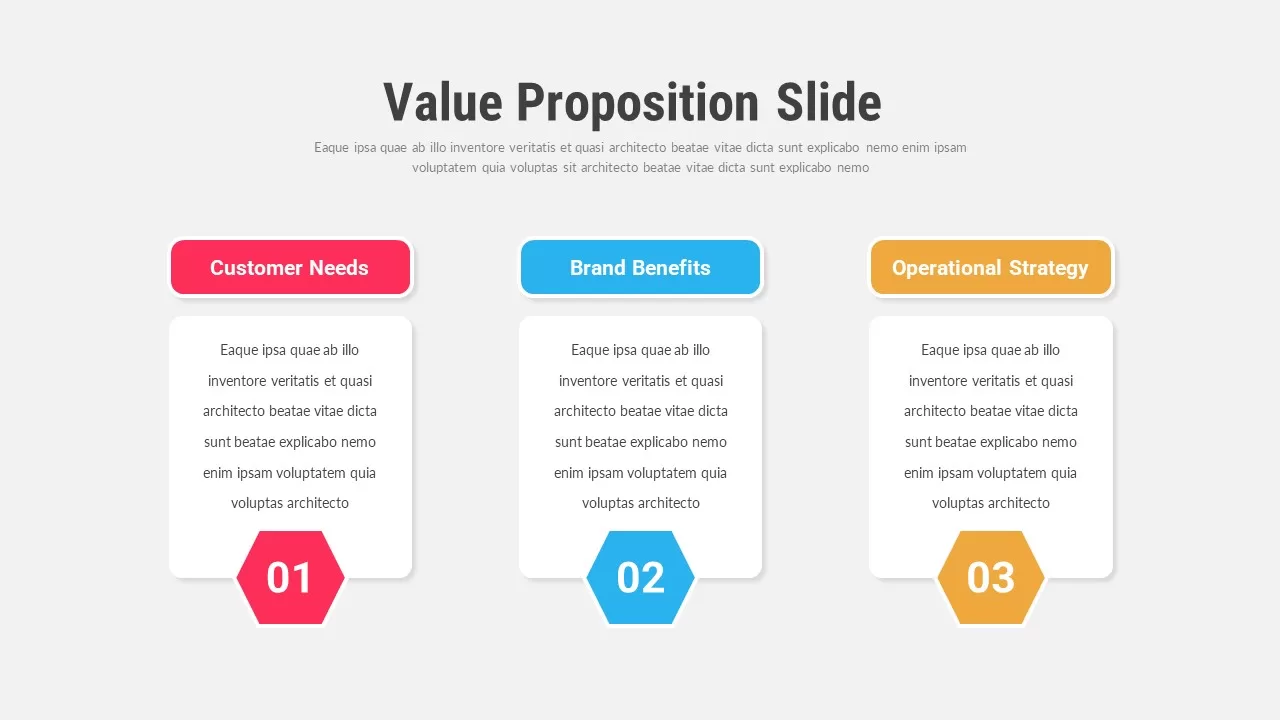
Value Proposition Slides Pack for PowerPoint & Google Slides
Infographics
Free New Year’s Resolution Slides Pack for PowerPoint & Google Slides 2023
Graphics
Free
Acknowledgement Slides Pack Template for PowerPoint & Google Slides
Our Team
Free Professional Gantt Chart Pack – 4 Slides Template for PowerPoint & Google Slides
Gantt Chart
Free
3D Bar Graph Infographic Template for PowerPoint & Google Slides
Bar/Column
Statistics Infographic & KPI Bar Chart Template for PowerPoint & Google Slides
Bar/Column
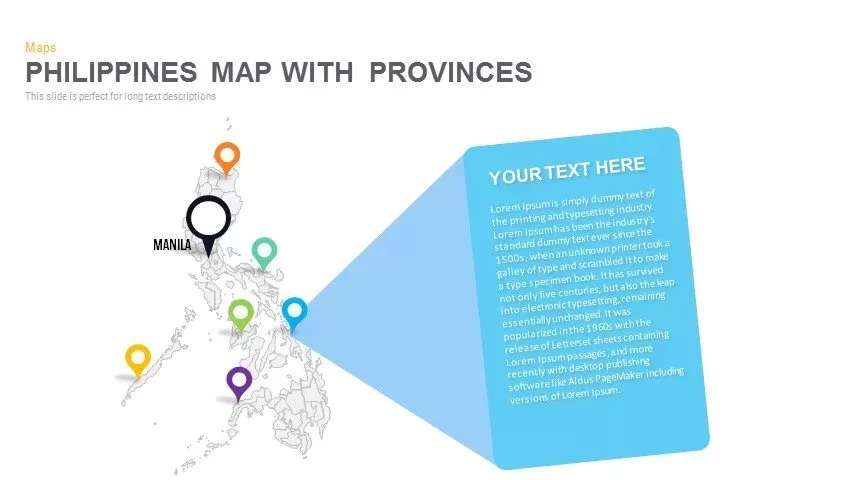
Philippines Map with Provinces Pack Template for PowerPoint & Google Slides
Maps
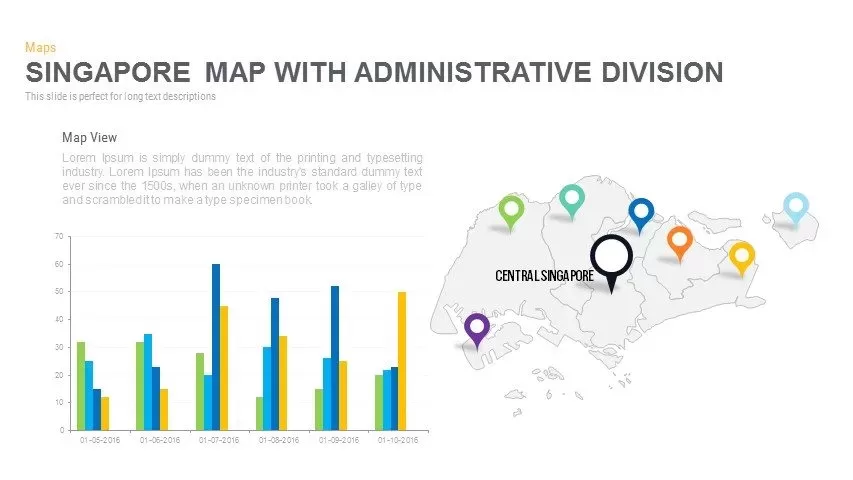
Singapore Map Pack Template for PowerPoint & Google Slides
Maps
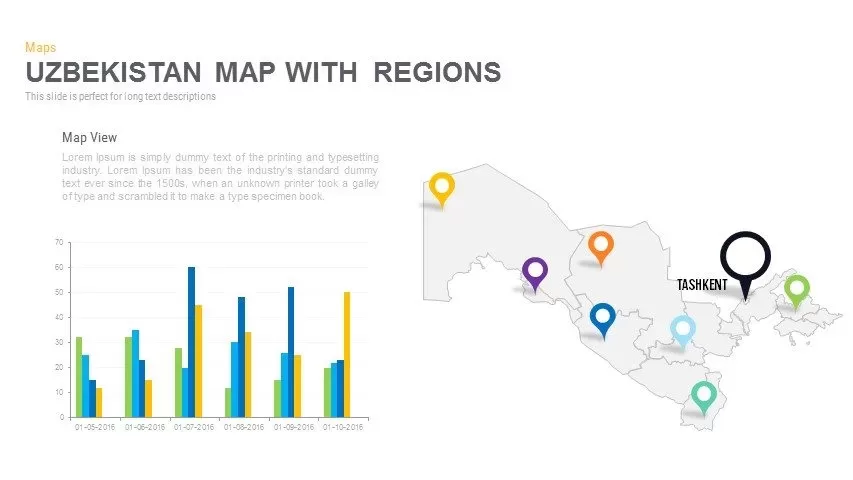
Uzbekistan Map with Regions Pack Template for PowerPoint & Google Slides
Maps
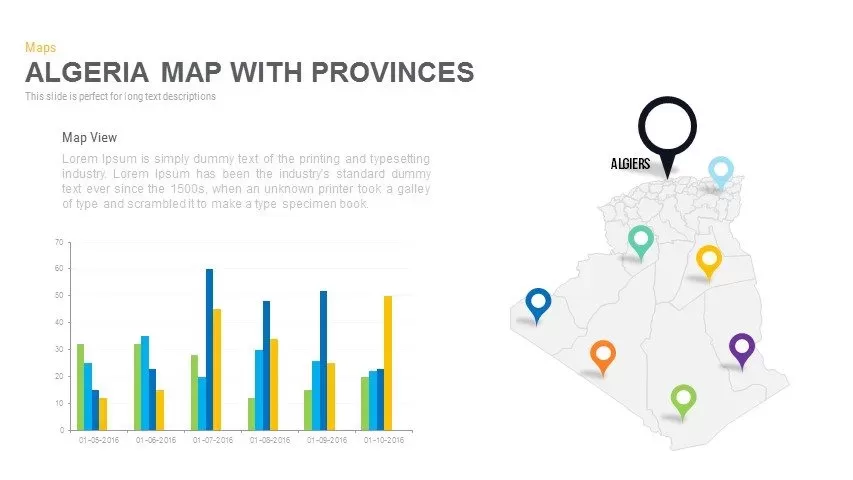
Algeria Map with Provinces Pack Template for PowerPoint & Google Slides
Maps
Angola Provinces Map Slide Pack Template for PowerPoint & Google Slides
World Maps
Angola Map with Provinces Slide Pack Template for PowerPoint & Google Slides
World Maps
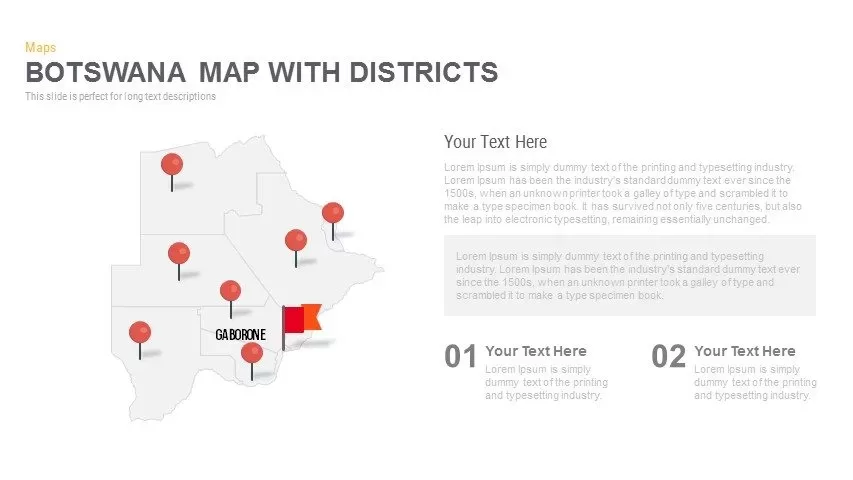
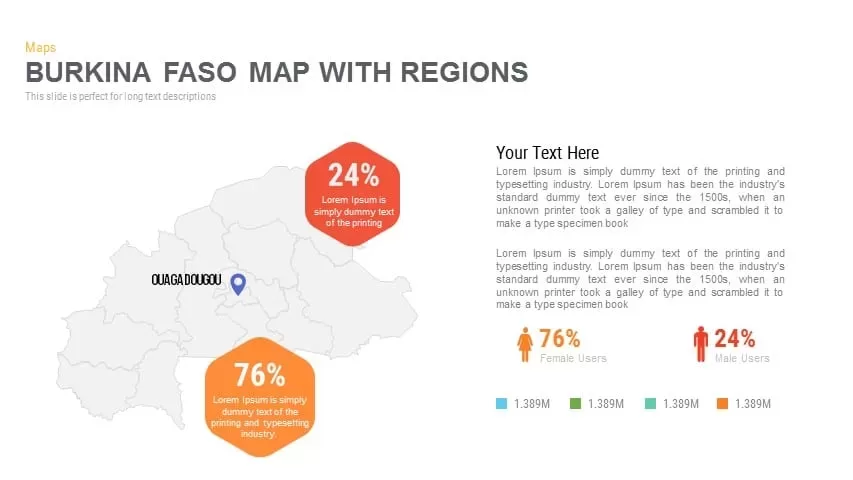
Burkina Faso Map with Regions Slide Pack Template for PowerPoint & Google Slides
World Maps
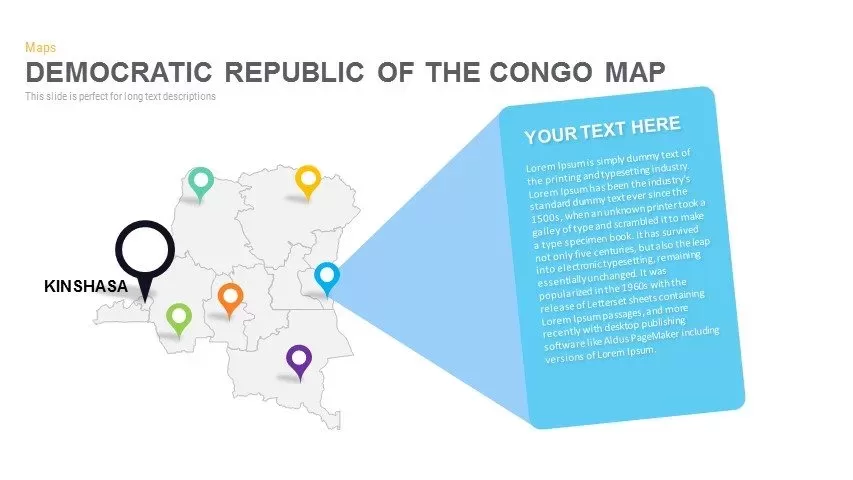
DR Congo Prefecture Map Slide Pack Template for PowerPoint & Google Slides
World Maps
Egypt Regional Map Slide Pack Template for PowerPoint & Google Slides
World Maps
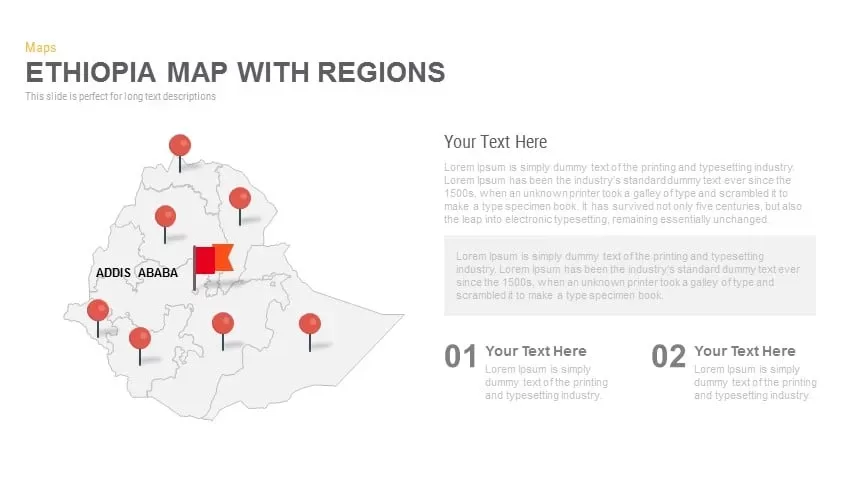
Ethiopia Map with Regions Slide Pack Template for PowerPoint & Google Slides
World Maps
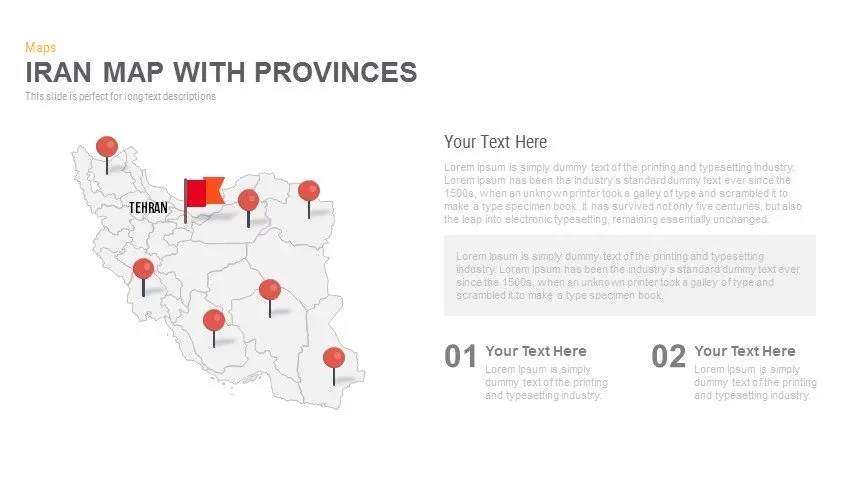
Iran Map with Provinces Slide Pack Template for PowerPoint & Google Slides
World Maps
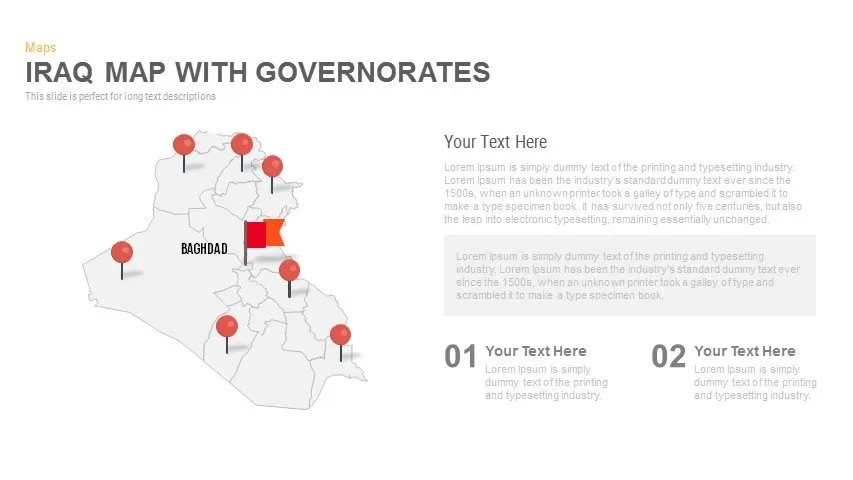
Interactive Iraq Map with Governorates Slide Pack for PowerPoint & Google Slides
World Maps
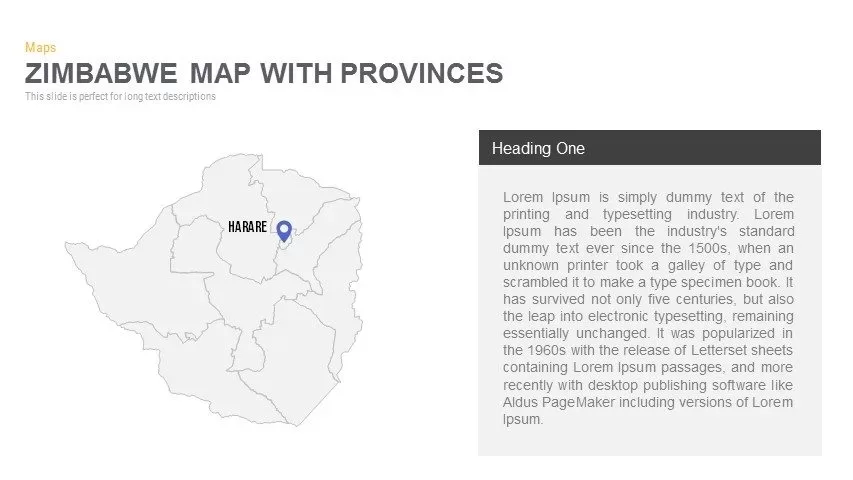
Zimbabwe Map with Provinces Slide Pack Template for PowerPoint & Google Slides
World Maps
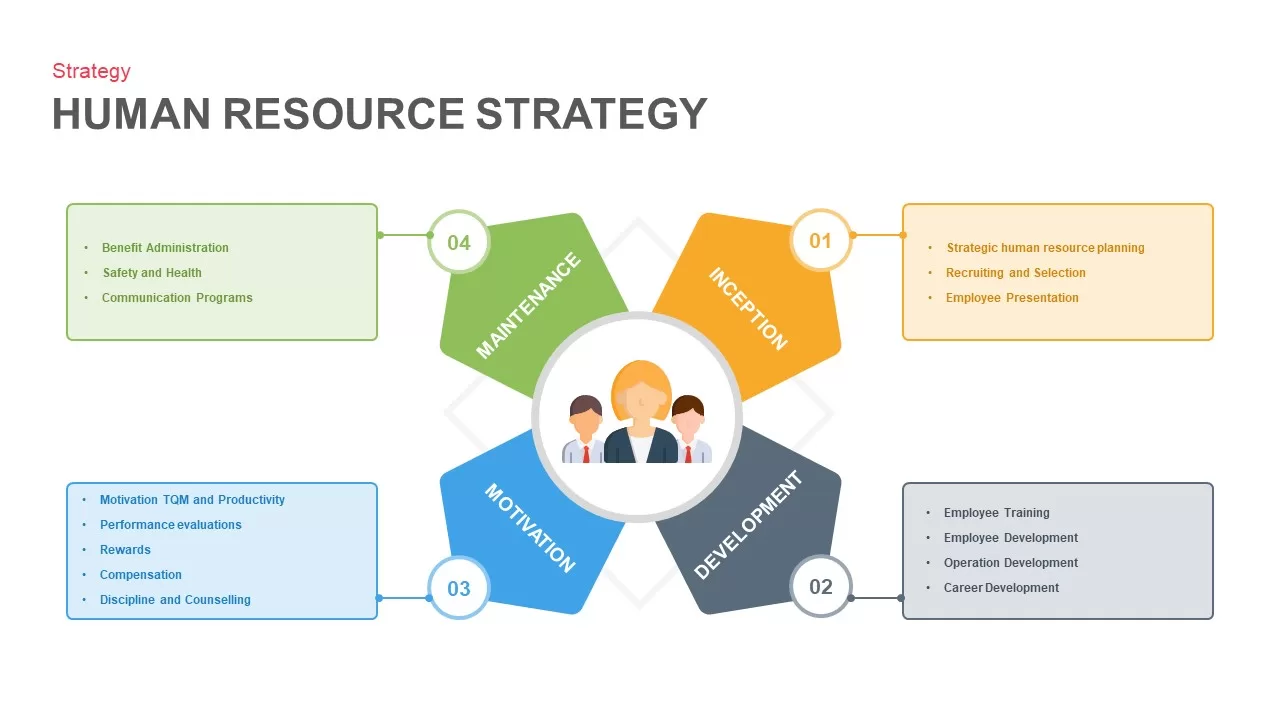
Human Resource Strategy Model Pack Template for PowerPoint & Google Slides
HR
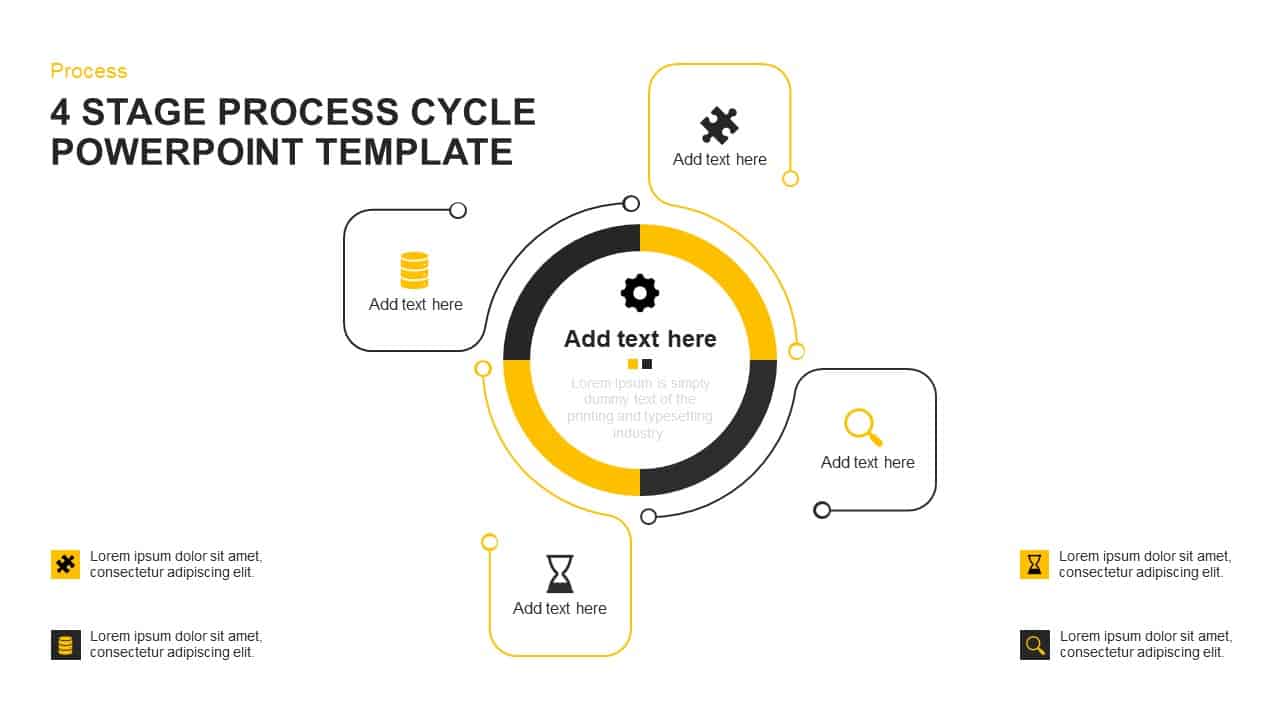
Four-Stage Process Cycle Variations Pack Template for PowerPoint & Google Slides
Process
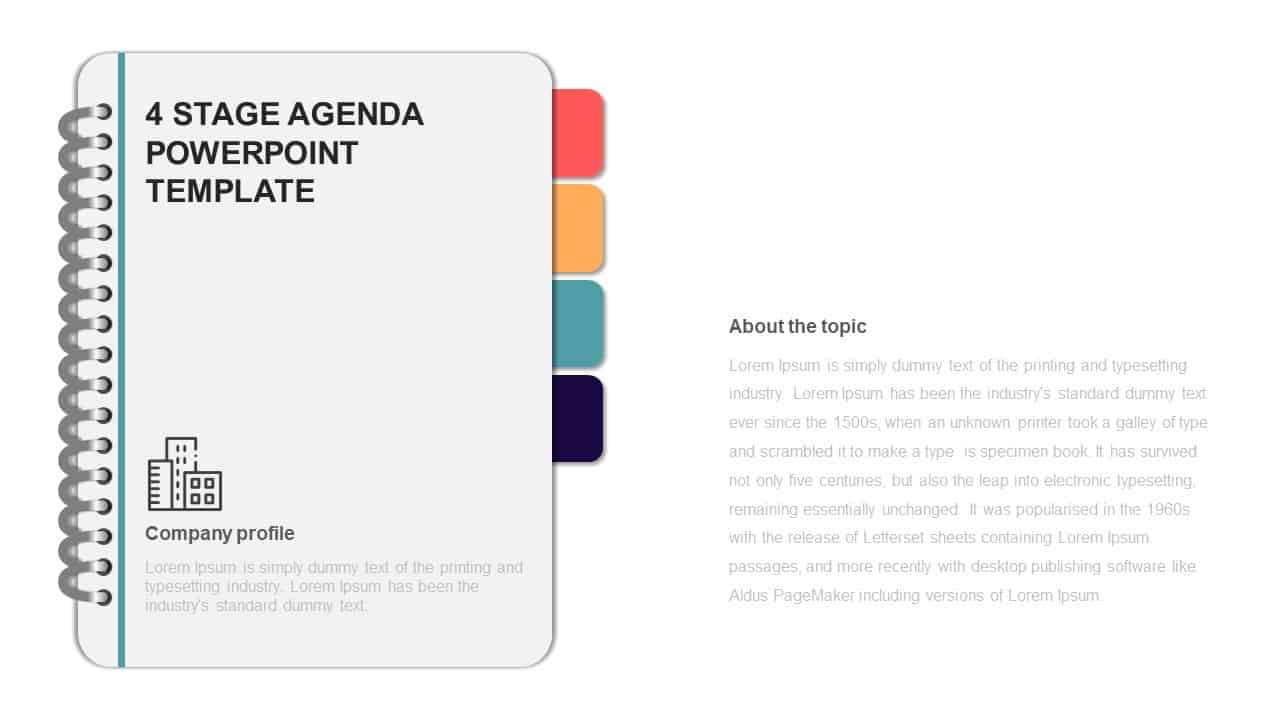
4-Stage Agenda Slide Pack Template for PowerPoint & Google Slides
Agenda
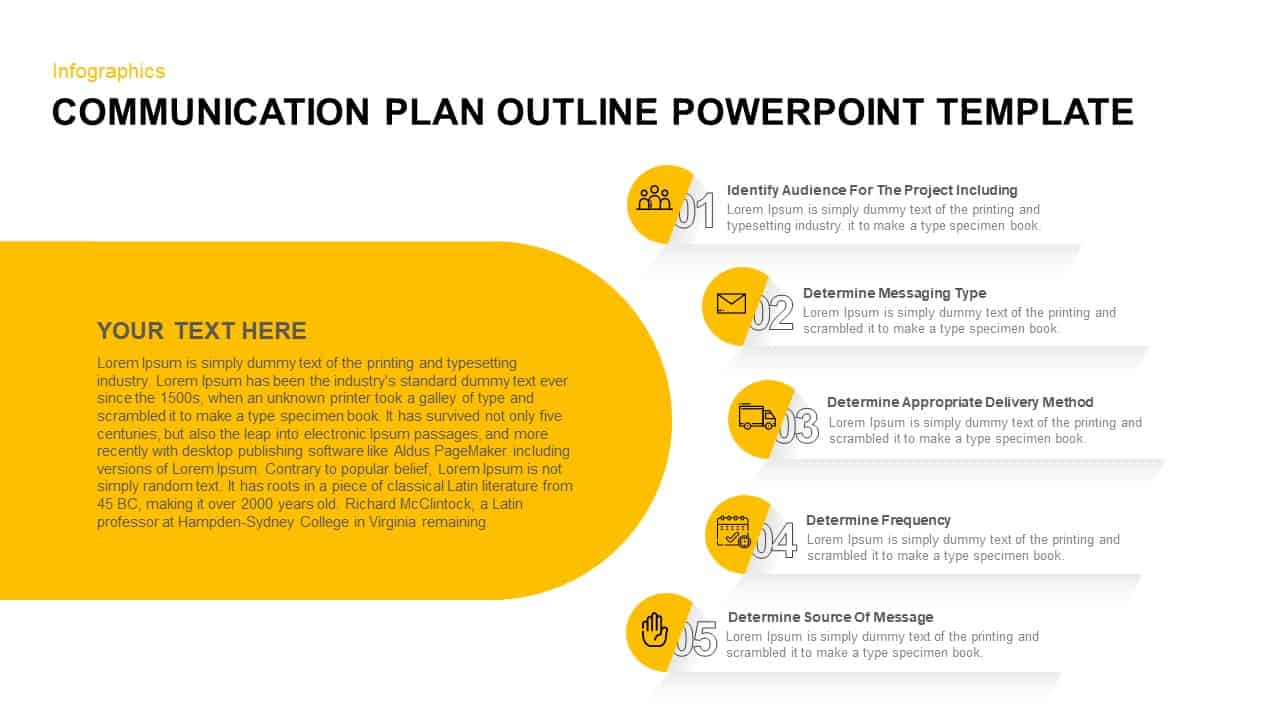
Communication Plan Outline Template Pack for PowerPoint & Google Slides
Infographics
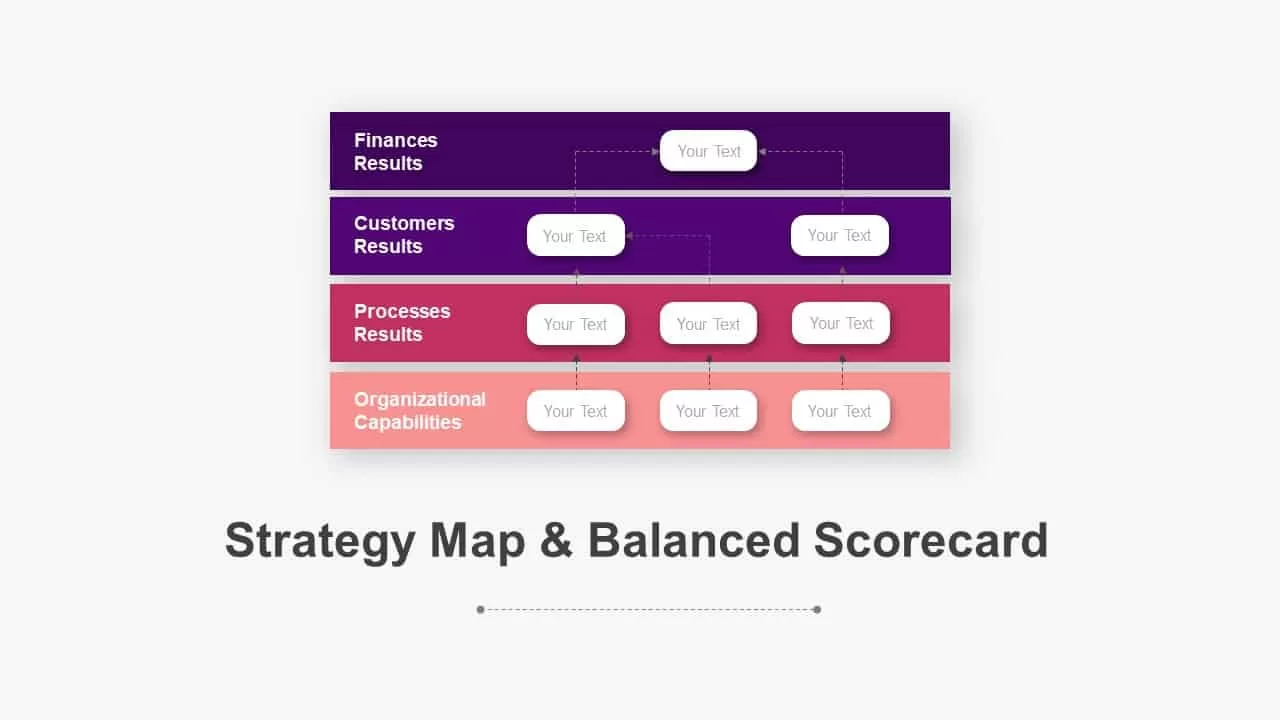
Balanced Scorecard Strategy Map Diagram Pack for PowerPoint & Google Slides
Business Strategy
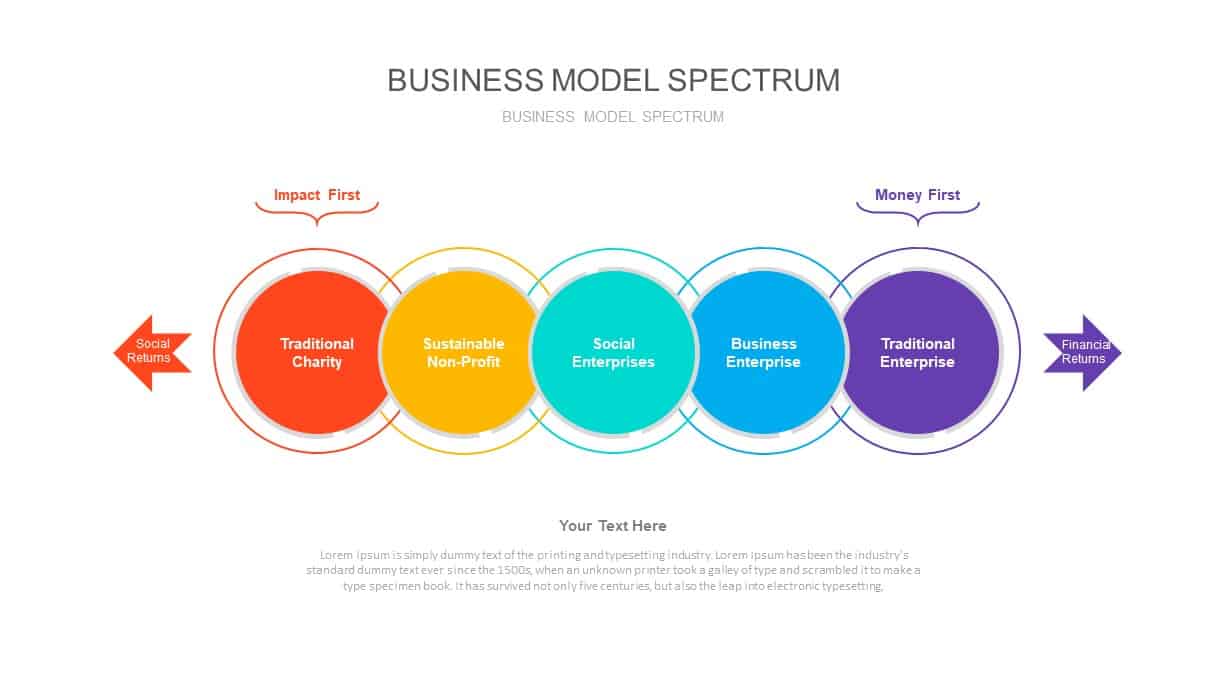
Business Model Spectrum Diagram Pack for PowerPoint & Google Slides
Business Models
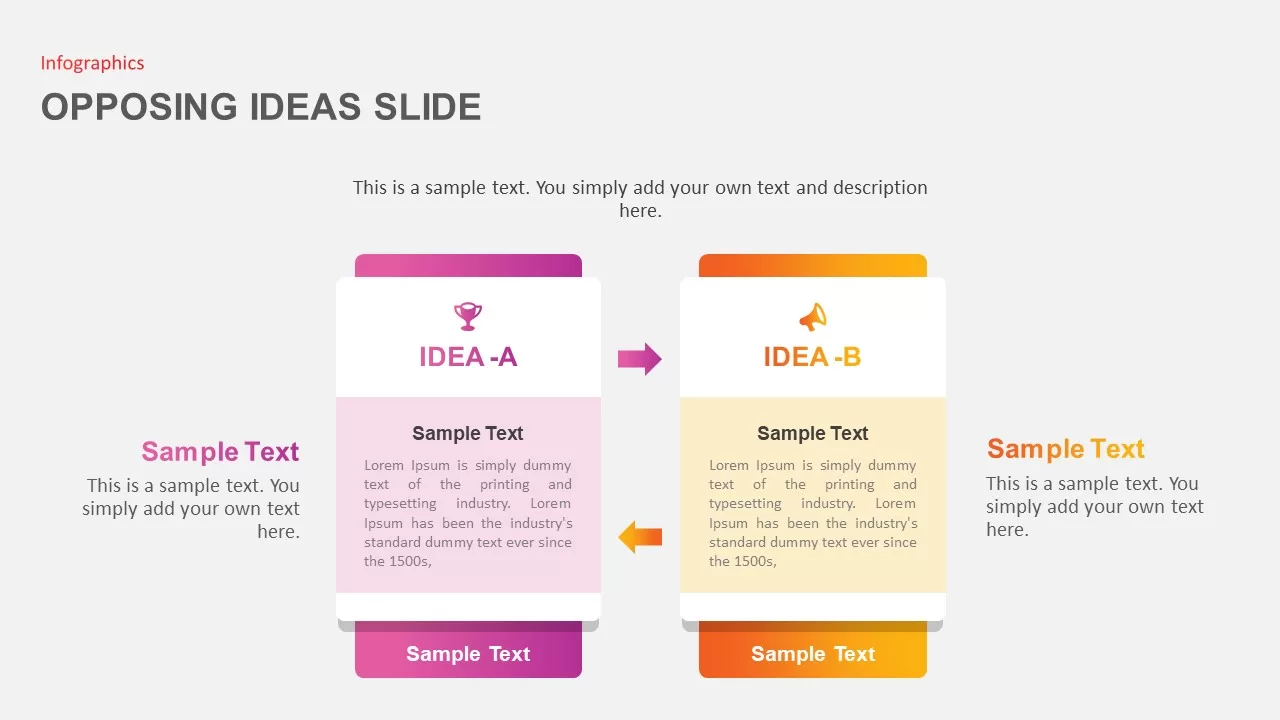
Opposing Ideas Infographics Pack Template for PowerPoint & Google Slides
Comparison
Business Growth Plant Infographics Pack Template for PowerPoint & Google Slides
Process
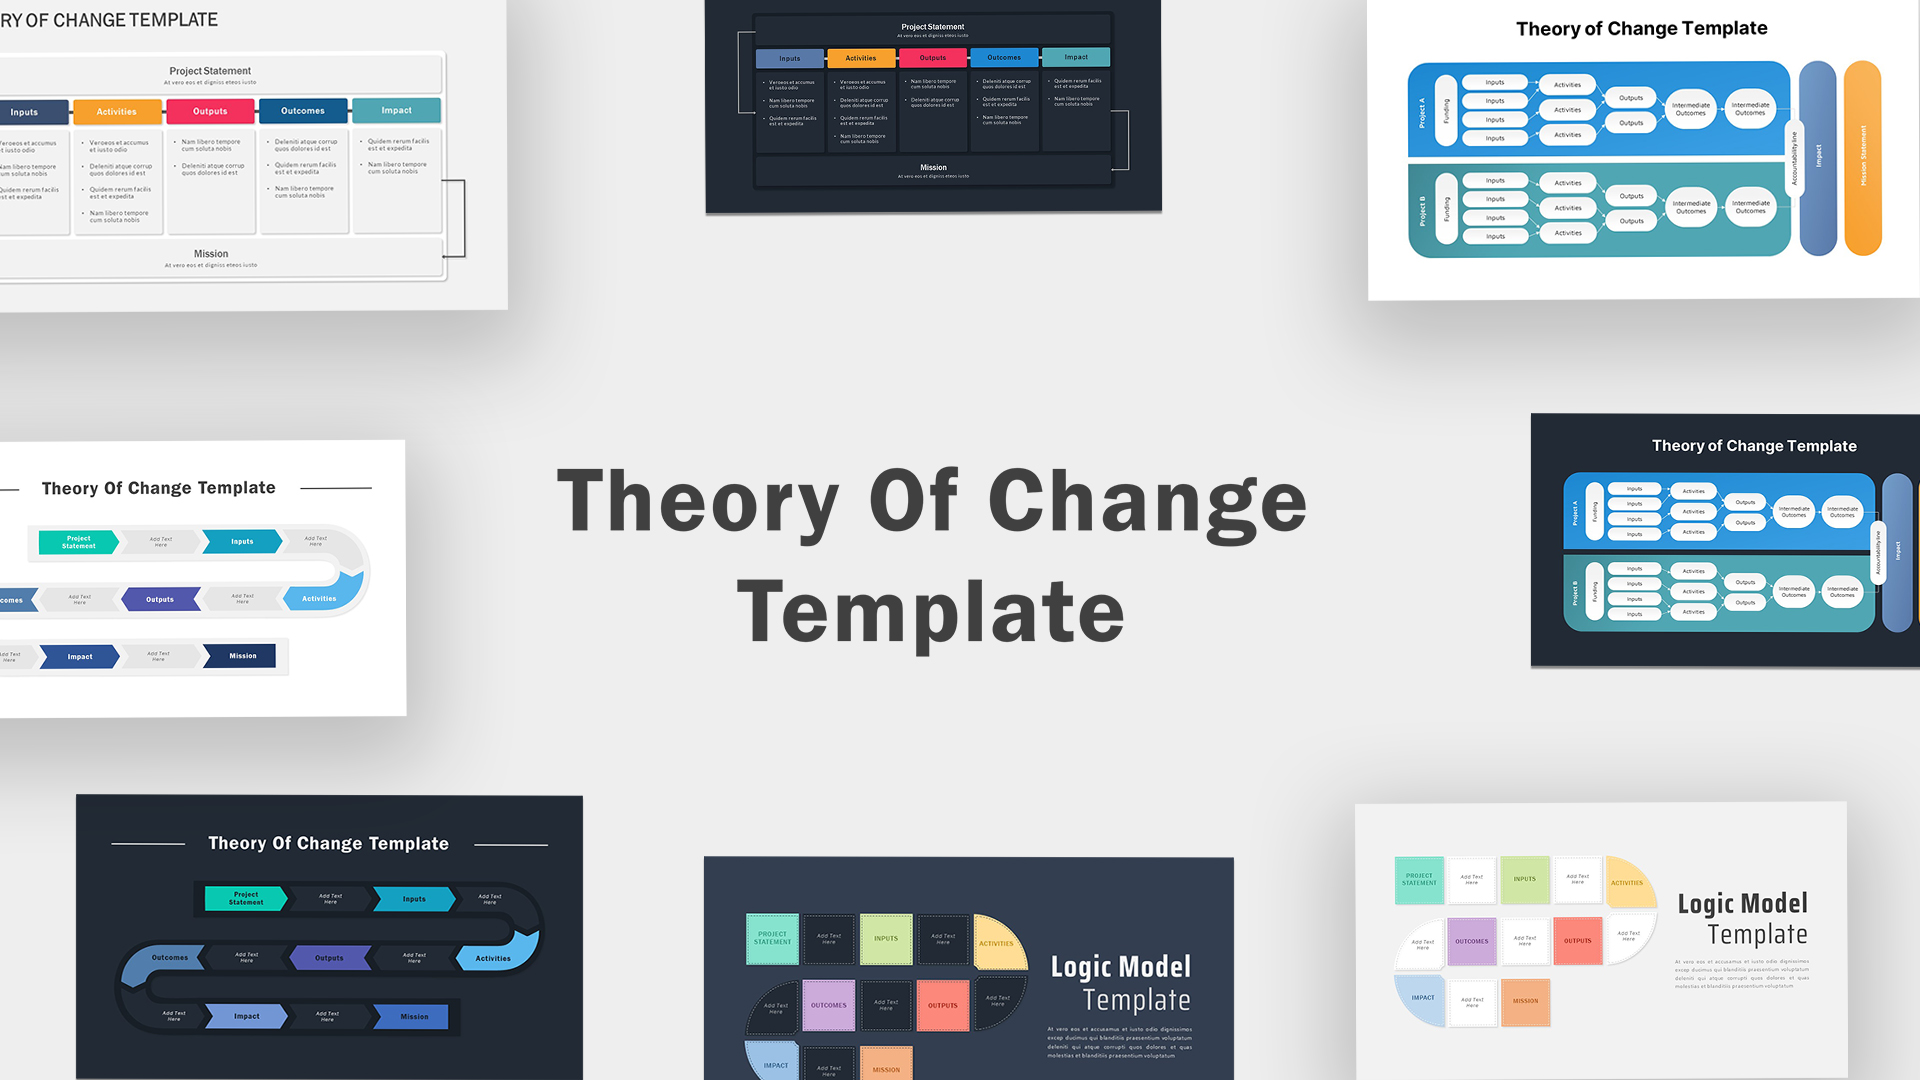
Theory of Change Infographics Pack Template for PowerPoint & Google Slides
Process
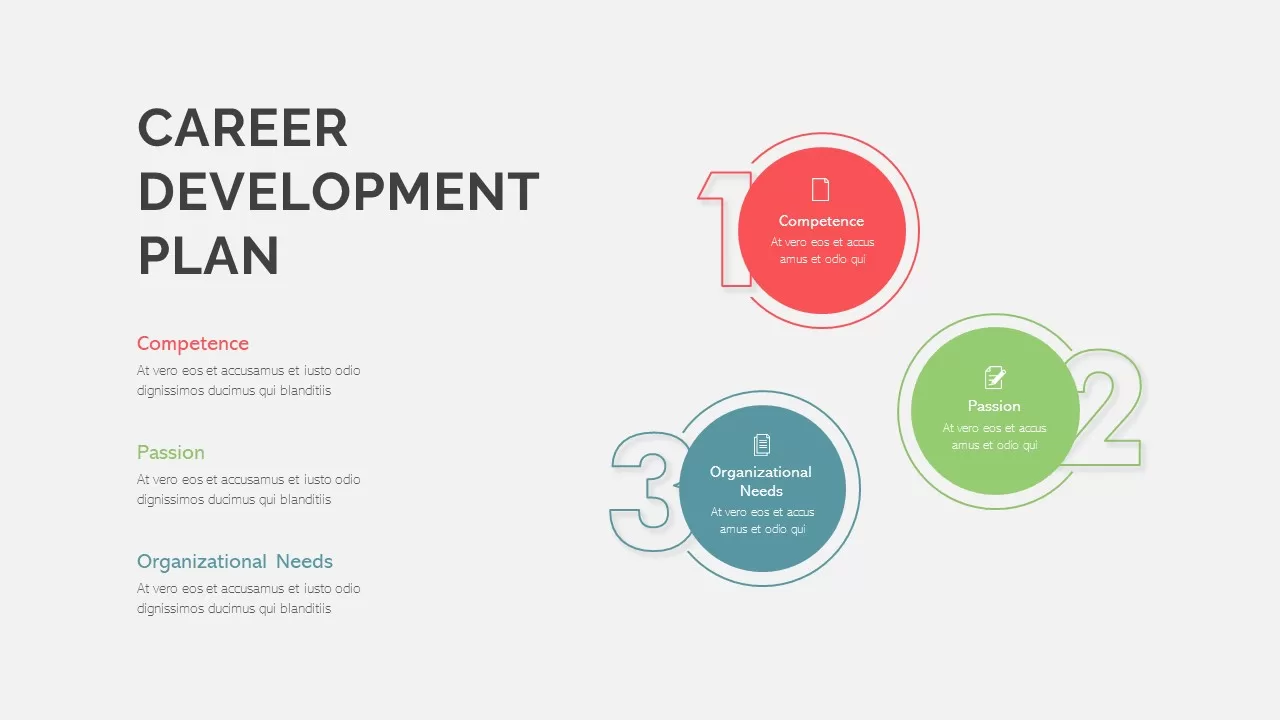
Career Development Plan Infographics Pack for PowerPoint & Google Slides
Infographics
Competitive Landscape Comparison Template Pack for PowerPoint & Google Slides
Comparison
Newspaper Template Pack for PowerPoint & Google Slides
Business Proposal
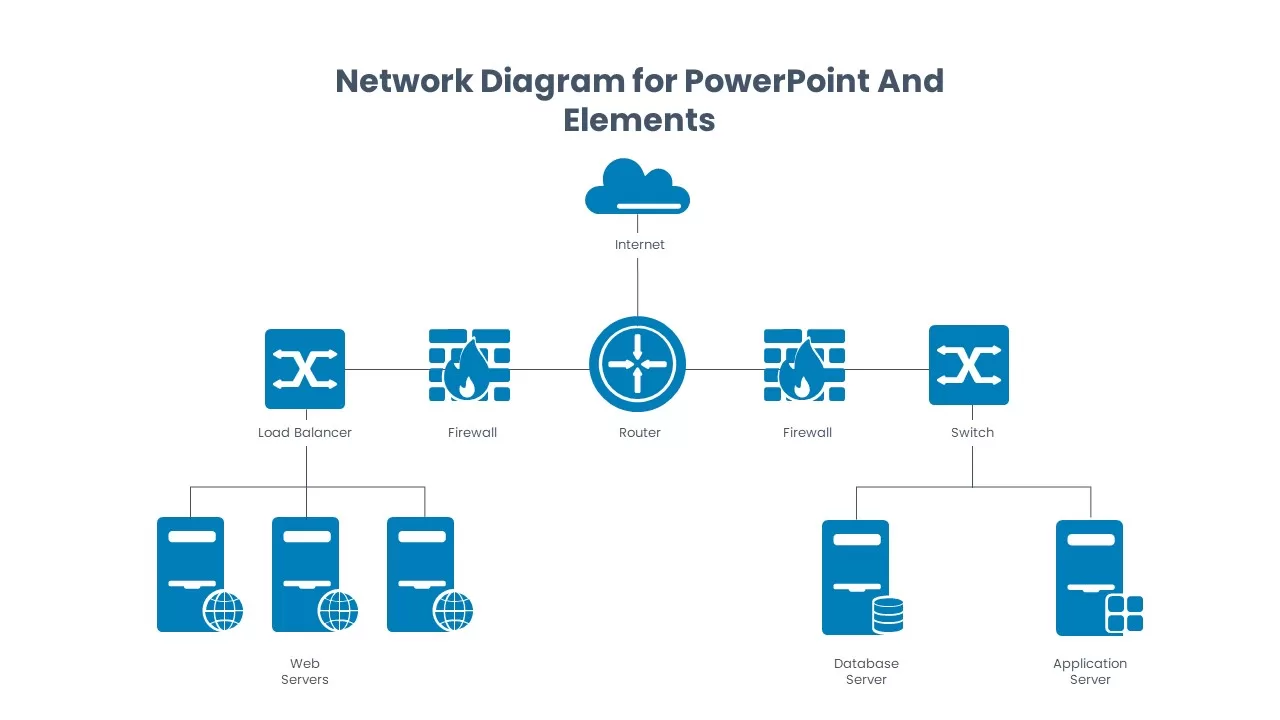
Network Diagram Elements and Icons Pack Template for PowerPoint & Google Slides
Information Technology
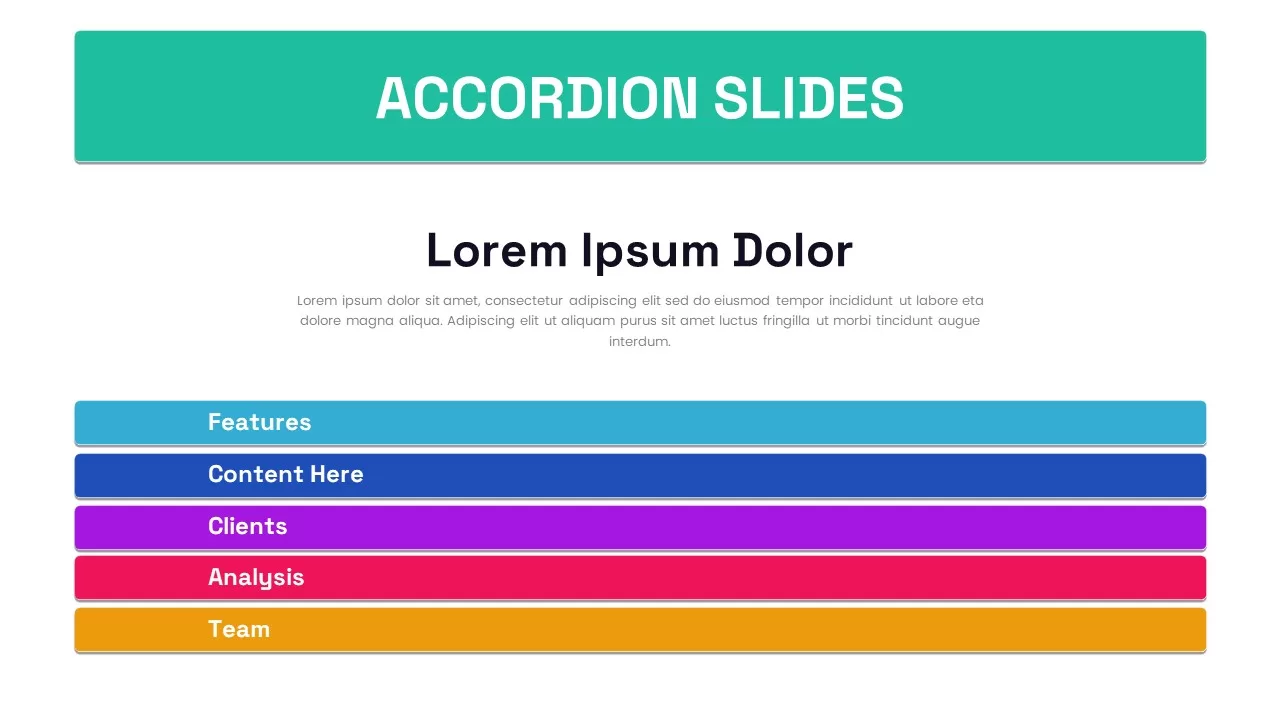
Six-Slide Animated Accordion Pack Template for PowerPoint & Google Slides
Business
Business Icon Pack Template for PowerPoint & Google Slides
Graphics
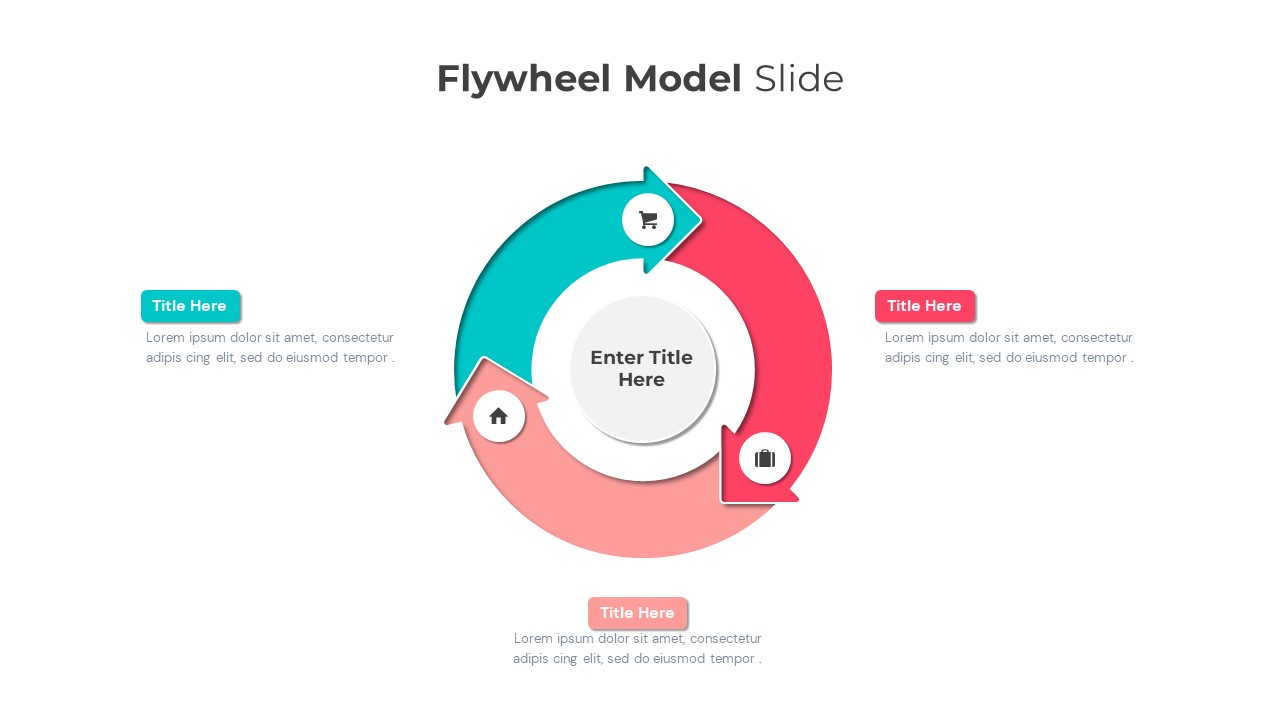
Flywheel Infographics Pack Template for PowerPoint & Google Slides
Circular
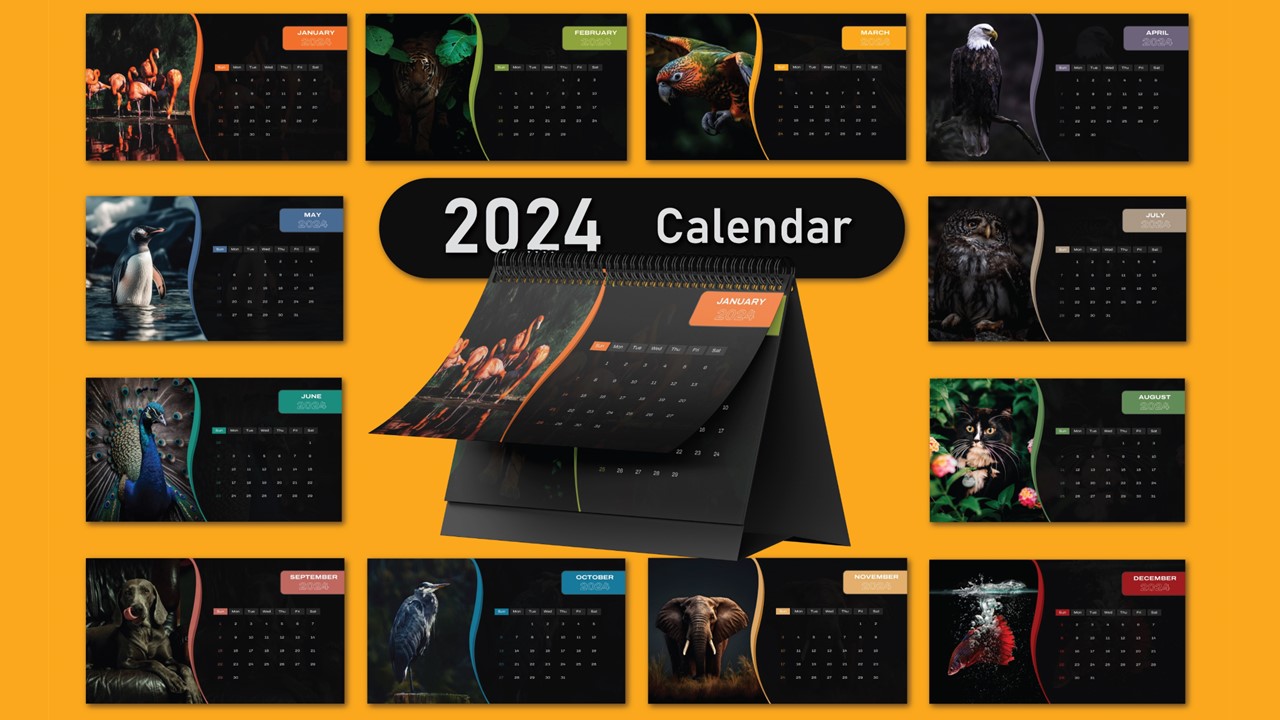
Free Colorful Animal 2024 Calendar Slide Pack Template for PowerPoint & Google Slides
Infographics
Free
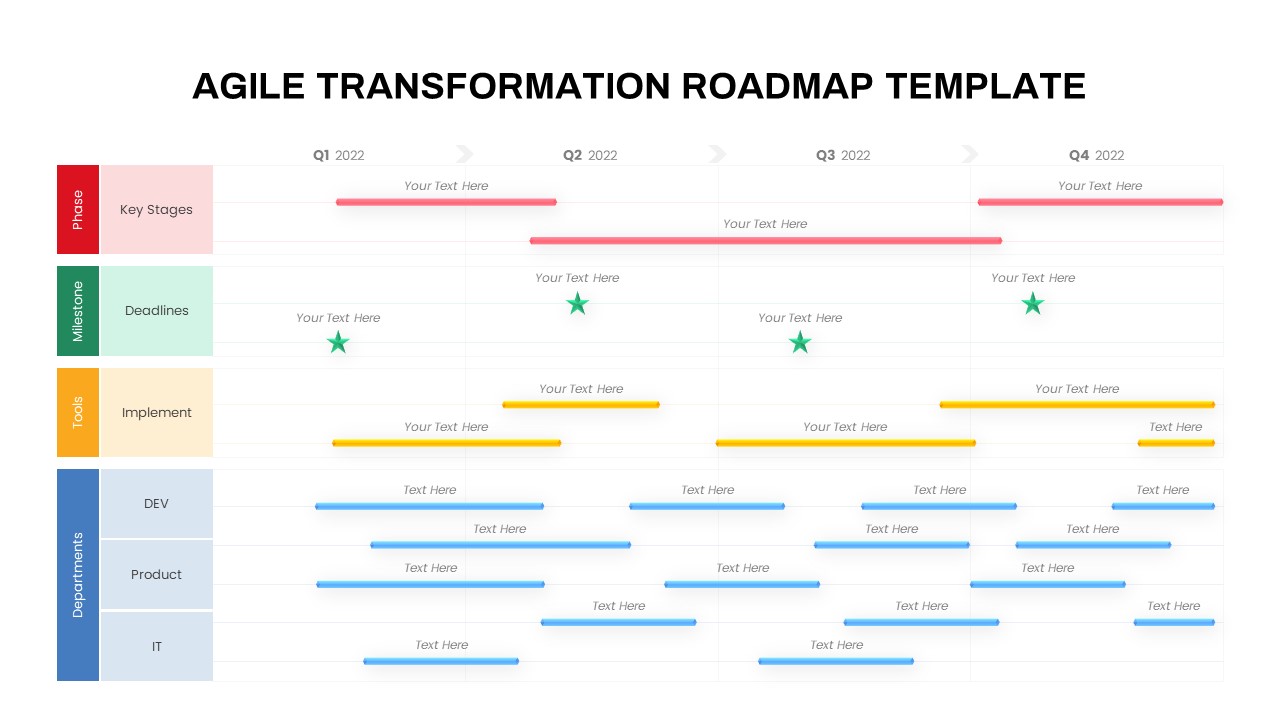
Agile Transformation Roadmap Slide Pack Template for PowerPoint & Google Slides
Roadmap
Advanced Data Flow Diagram Pack Template for PowerPoint & Google Slides
Flow Charts
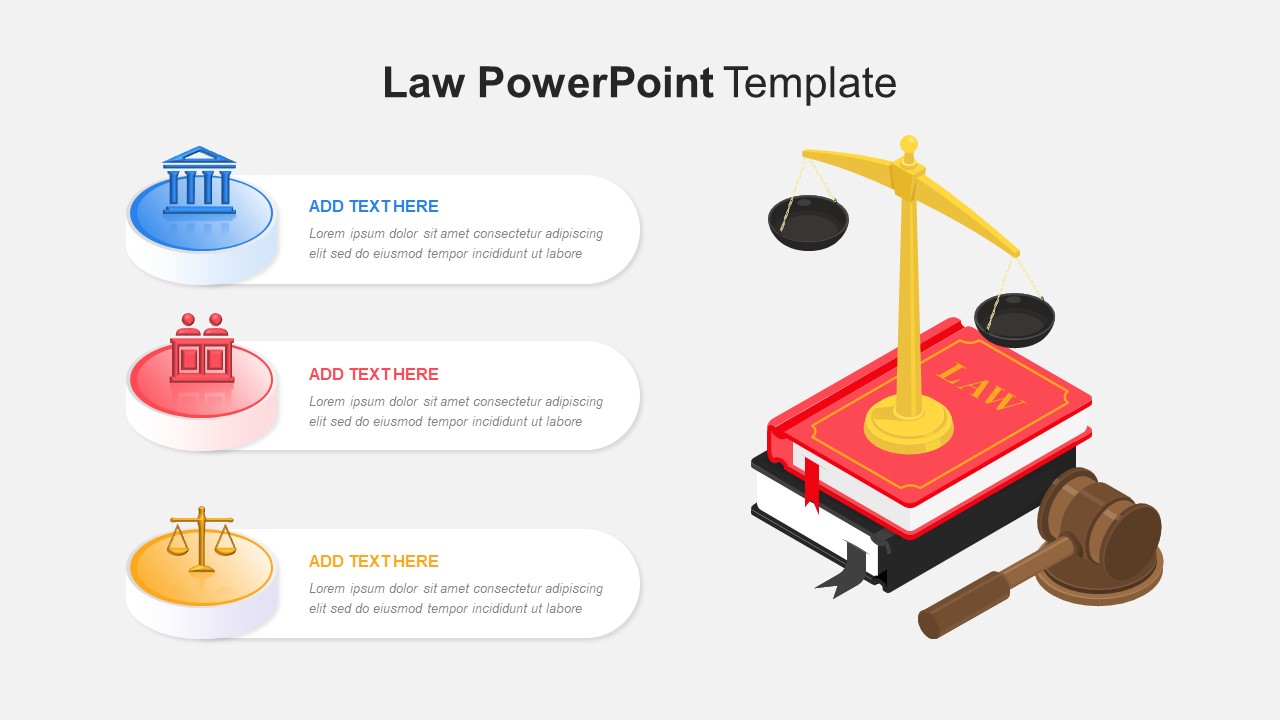
Free Law Infographics Slide Pack Collection Template for PowerPoint & Google Slides
Infographics
Free
Versatile Startup Roadmap Slide Pack Template for PowerPoint & Google Slides
Timeline
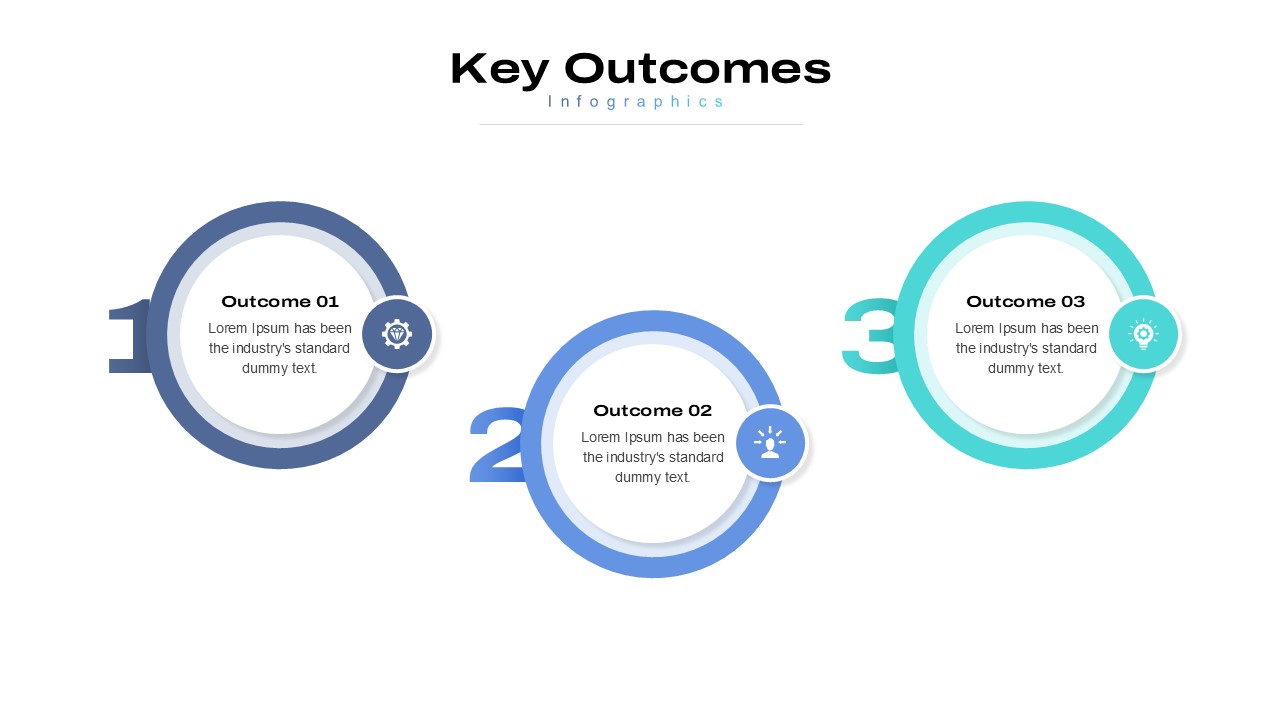
5 Styles Key Outcomes Infographics Pack Template for PowerPoint & Google Slides
Infographics
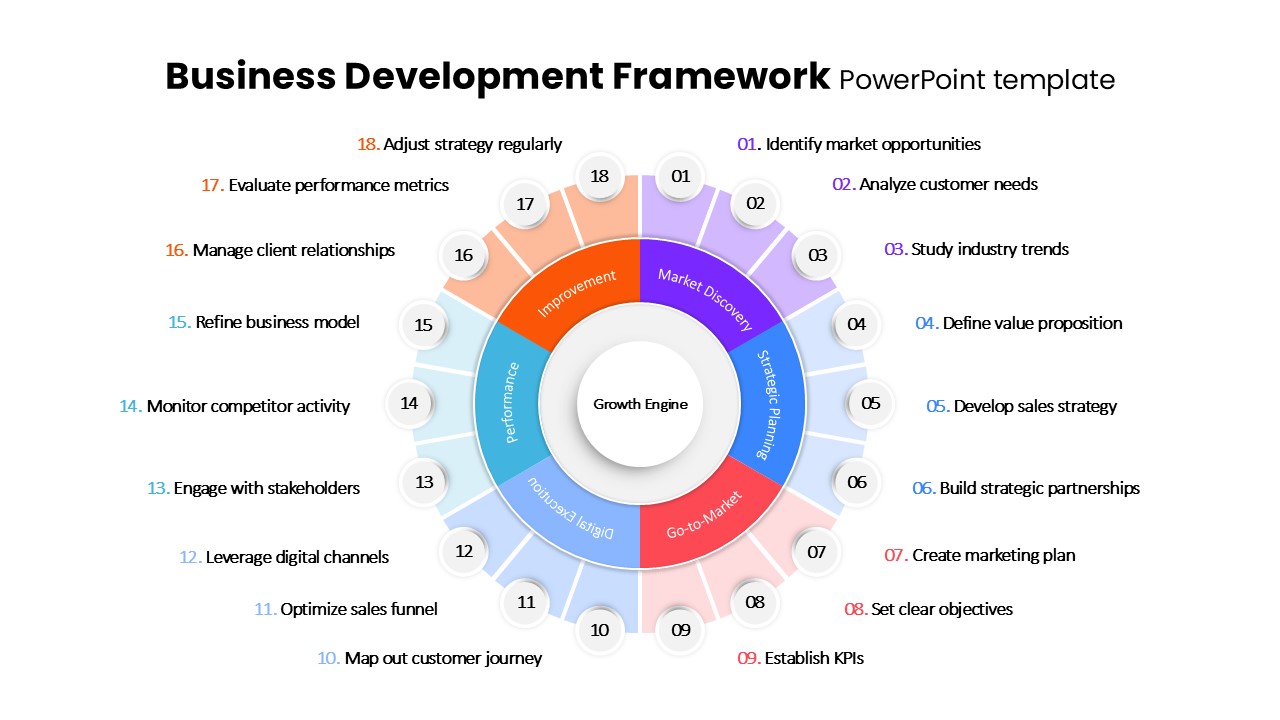
Business Development Framework Pack Template for PowerPoint & Google Slides
Business Strategy