Process Methodology Overview Diagram Template for PowerPoint & Google Slides
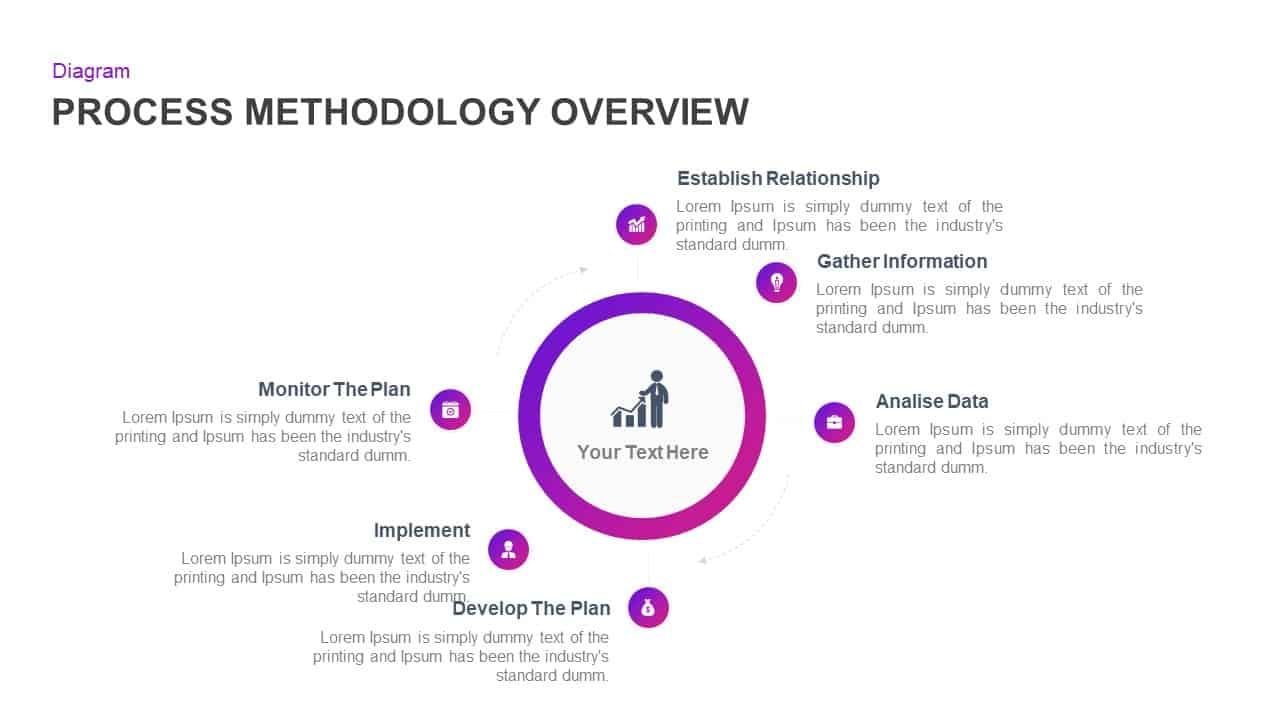
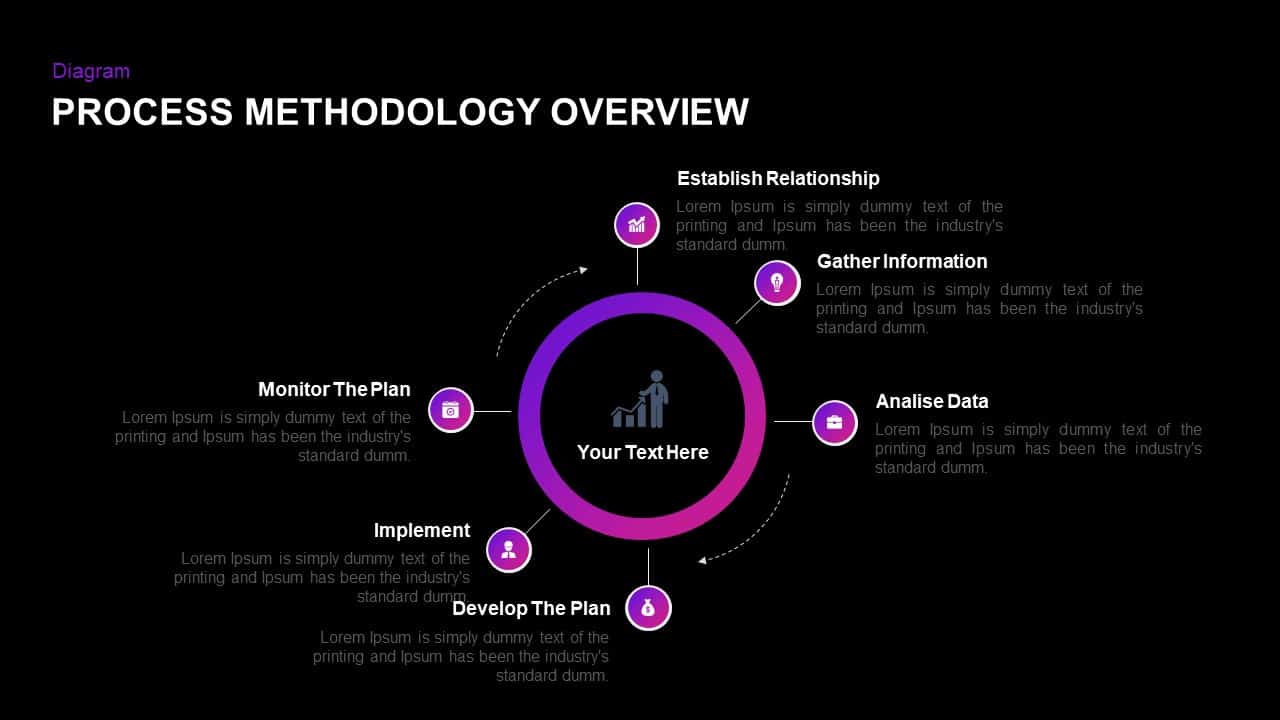
Use this process methodology overview diagram slide to present six sequential stages around a central cycle marker labeled “Your Text Here.” Each stage—Establish Relationship, Gather Information, Analyse Data, Develop The Plan, Implement, and Monitor The Plan—is highlighted by a purple gradient icon within a circular node connected by subtle dashed arrows. The vibrant ring and matching icon accents create a cohesive visual identity, while the clean white backdrop and high-contrast headings ensure clarity in any setting.
Built on custom master slides, all shapes, icons, and text placeholders are fully editable. Swap icons from the vector library, adjust gradient hues, modify stage labels, or rearrange node positions with drag-and-drop ease. Separate layers for the central cycle, nodes, and text sections enable fine-tuned control over spacing, alignment, and layering without disrupting the overall design.
Vector-based graphics guarantee crisp output on any display—from mobile screens to large-format projectors. Predefined entrance and exit animations can be applied to each node for dynamic, staggered reveals that sustain audience engagement. Embedded theme colors and unified font pairings align instantly with corporate branding guidelines, eliminating formatting inconsistencies between PowerPoint and Google Slides. Intuitive placeholders and built-in section notes streamline your workflow and reduce manual formatting time.
Whether you’re outlining project management workflows, illustrating strategic planning steps, or coaching teams on best practices, this versatile diagram adapts to a variety of contexts. Duplicate nodes for deeper breakdowns, change labels to reflect organizational processes, or repurpose the circular layout for systems mapping, stakeholder networks, or performance dashboards. This all-in-one resource empowers presenters across industries to transform complex methodologies into clear, memorable visuals.
Who is it for
Project managers, process consultants, business analysts, and team leads will find this diagram invaluable for mapping methodology overviews, guiding stakeholder workshops, and aligning cross-functional teams.
Other Uses
Adapt the circular layout to illustrate system architectures, RACI models, customer lifecycle stages, or risk management cycles. Expand or condense the node count to create deeper breakdowns or simplified dashboards in any department.
Login to download this file

Item ID
SB01416
Related Templates

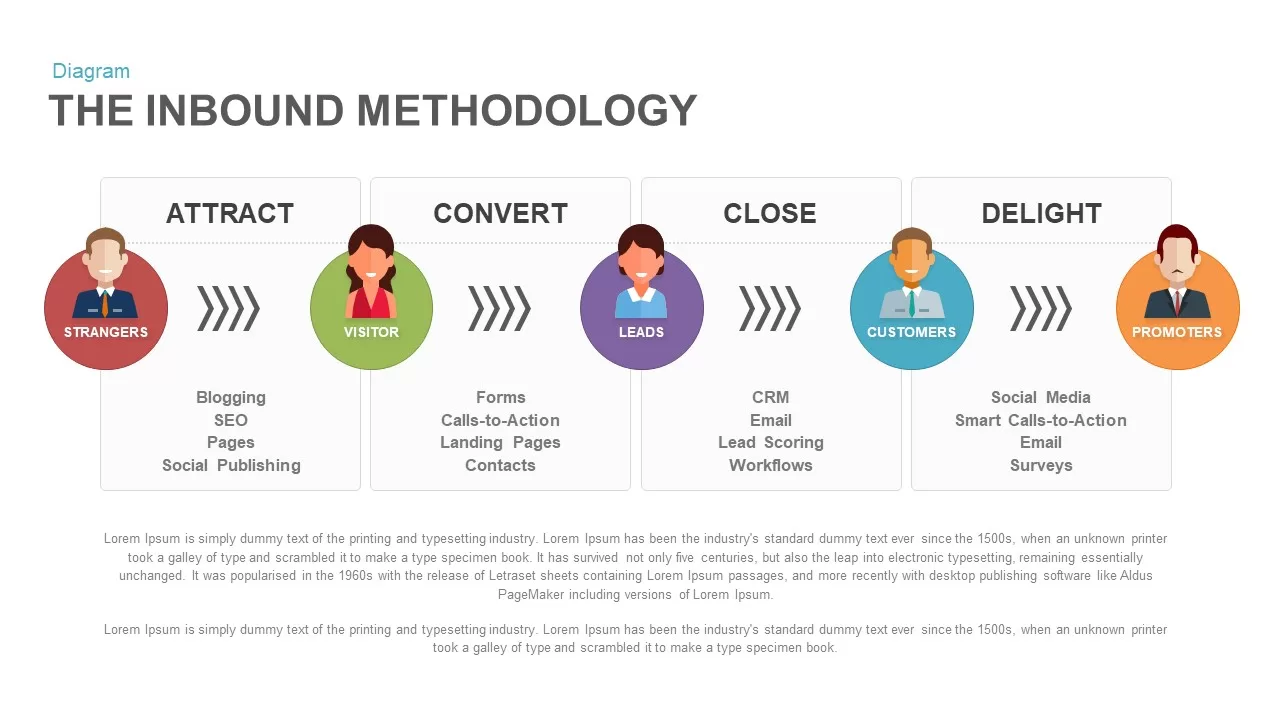
Inbound Methodology Process Diagram for PowerPoint & Google Slides
Process
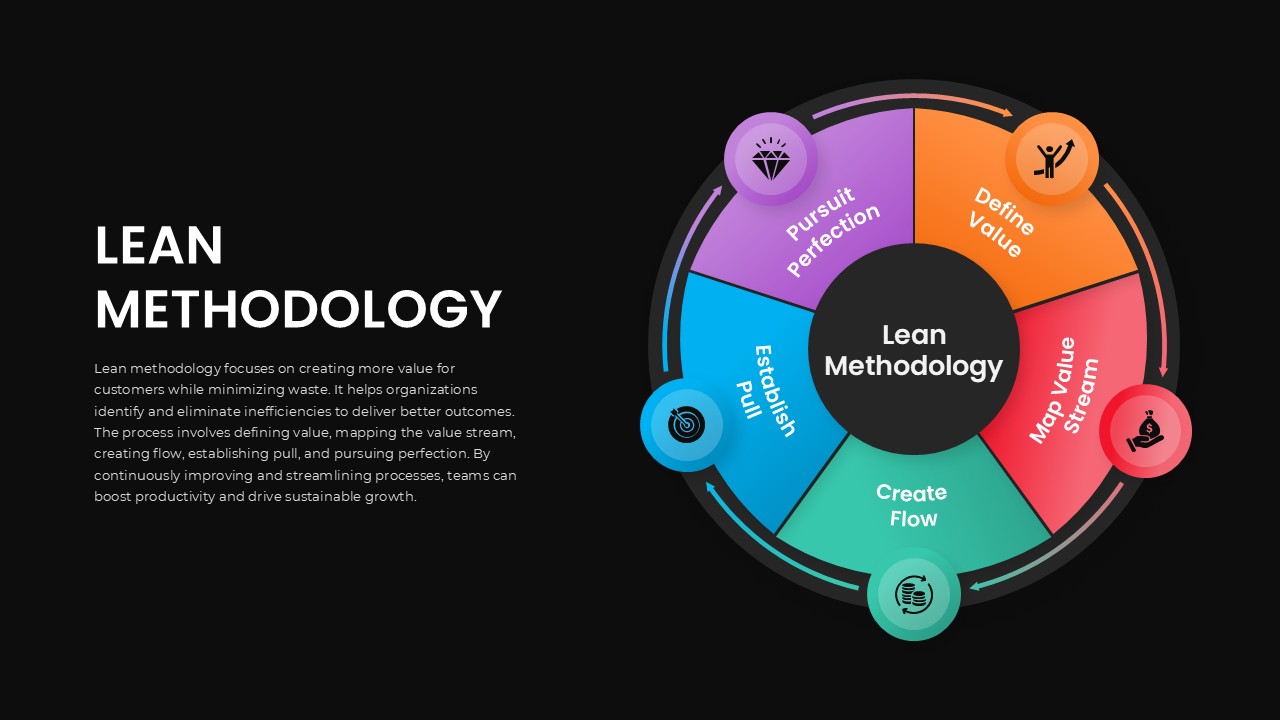
Lean Methodology Circular Process Template for PowerPoint & Google Slides
Process

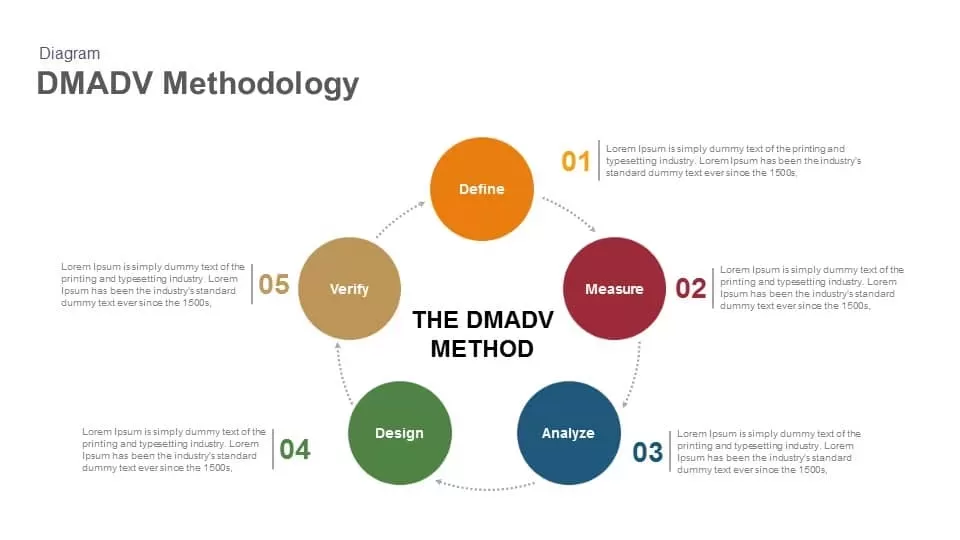
DMADV Methodology Diagram template for PowerPoint & Google Slides
Process

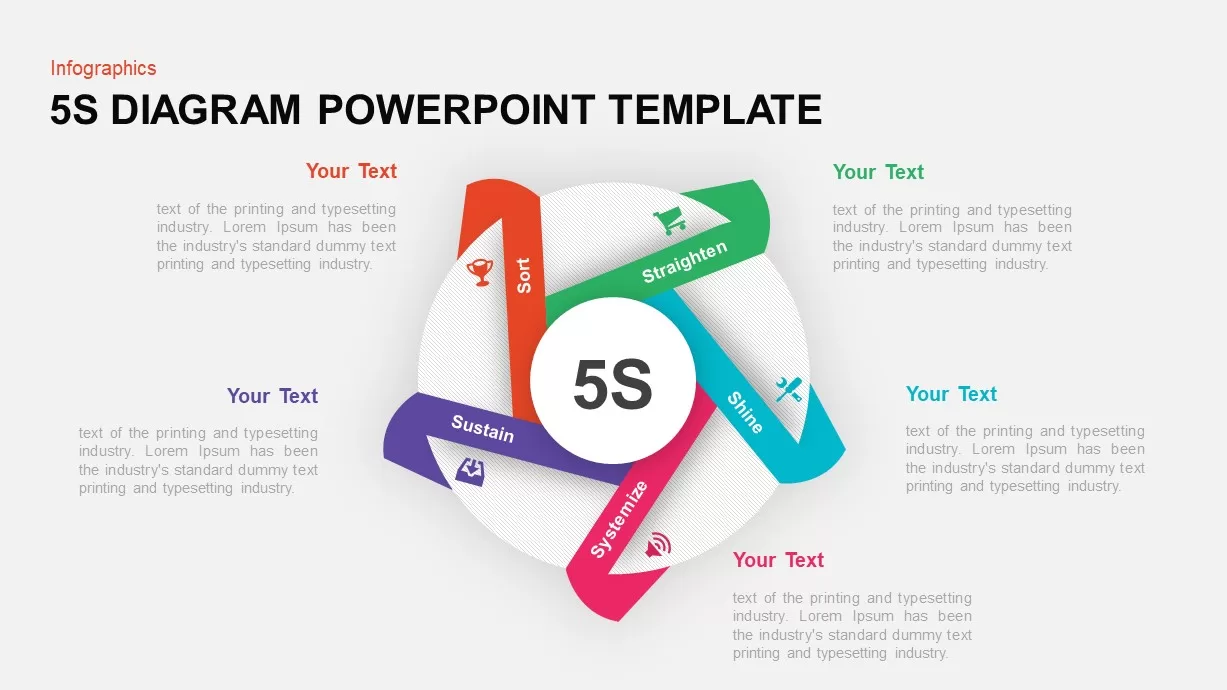
5S Lean Methodology Circular Diagram Template for PowerPoint & Google Slides
Process
4-Step Methodology Diagram Template for PowerPoint & Google Slides
Process
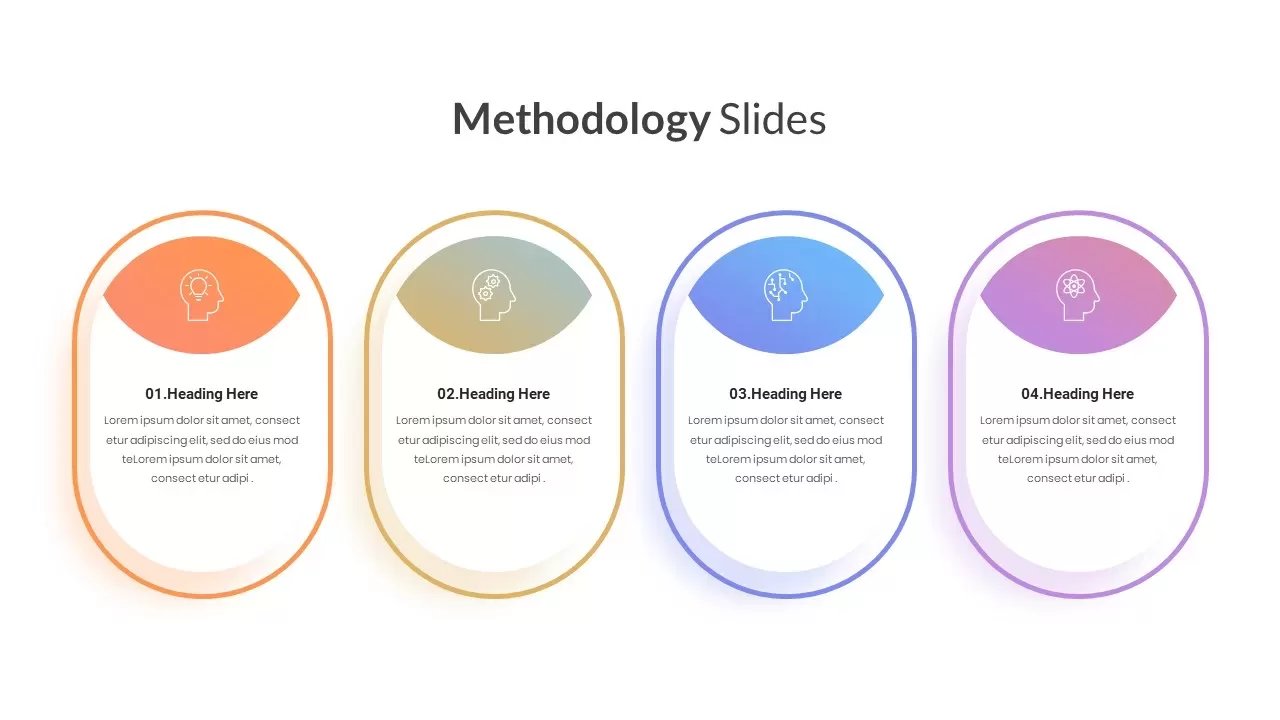
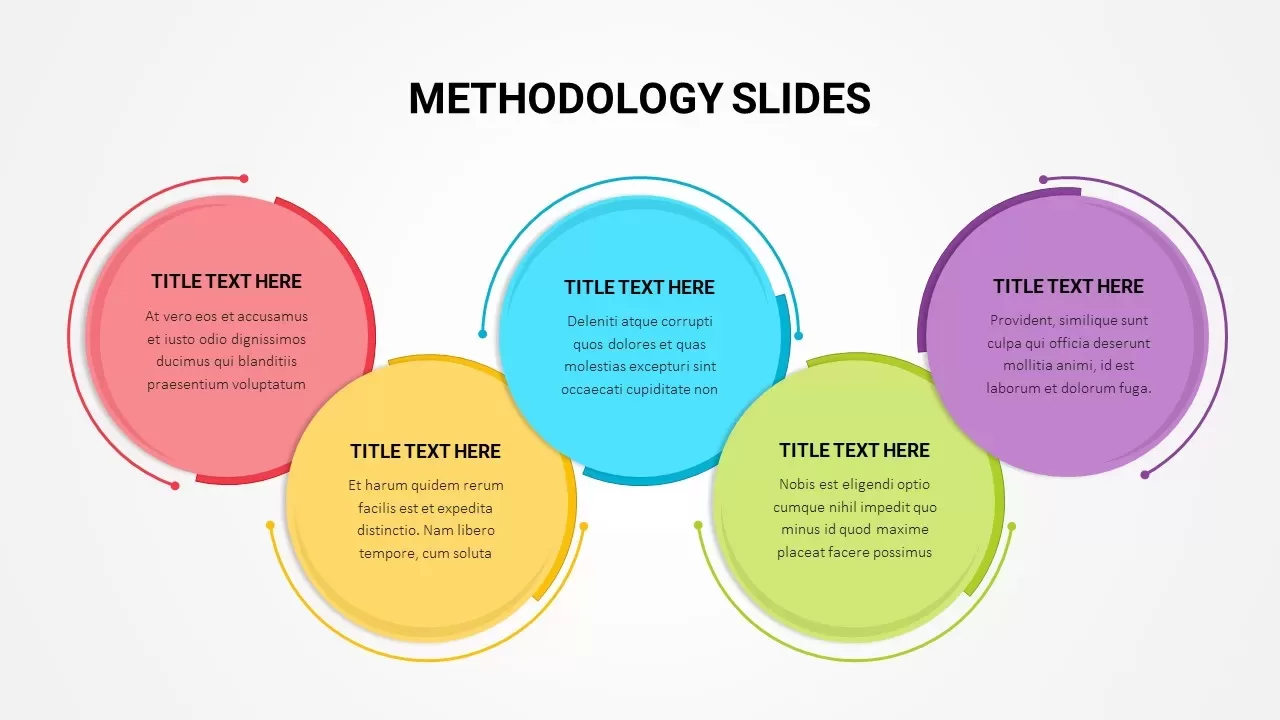
Colorful Five-Stage Methodology Diagram Template for PowerPoint & Google Slides
Process
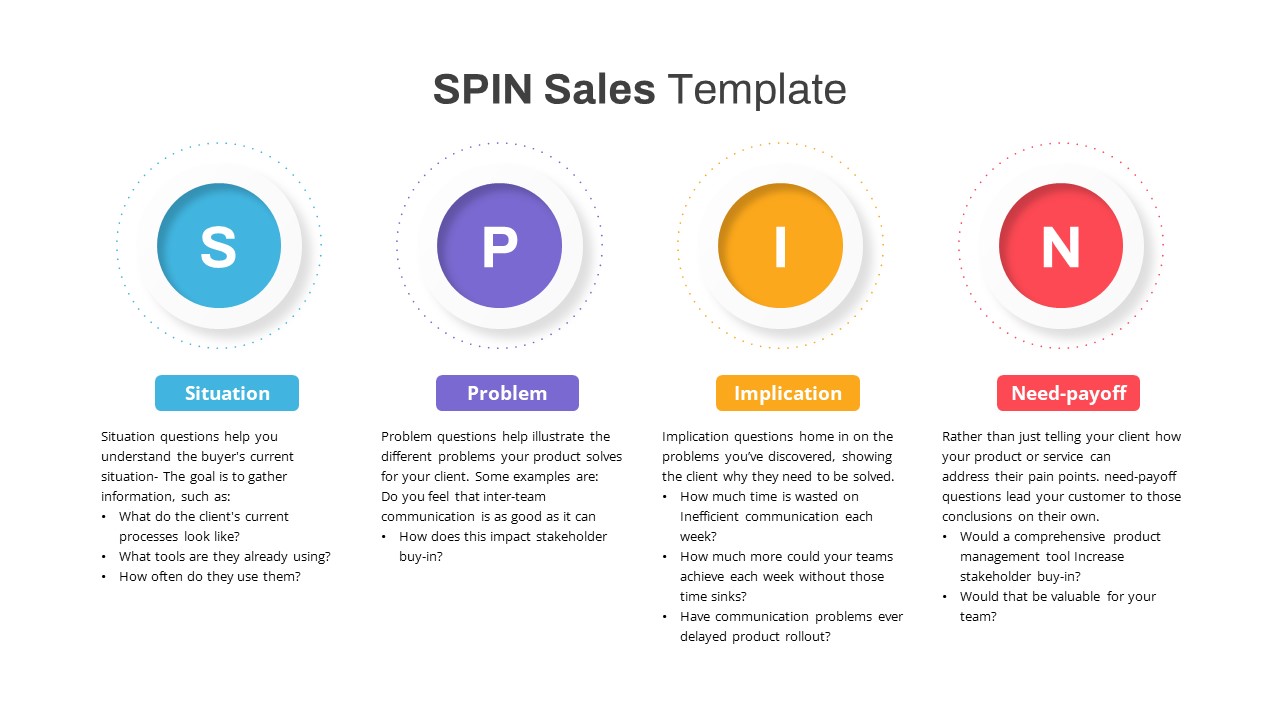
SPIN Sales Methodology Diagram Template for PowerPoint & Google Slides
Process
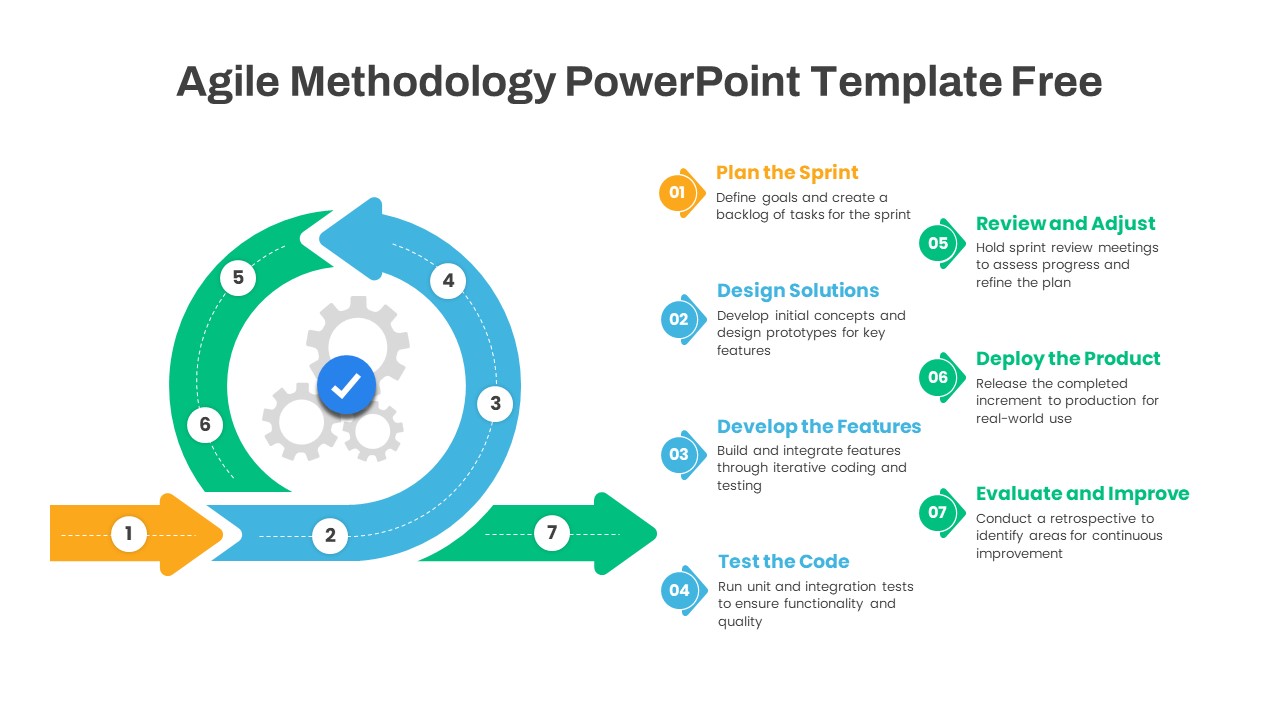
Agile Methodology Cycle Diagram Template for PowerPoint & Google Slides
Project
Free
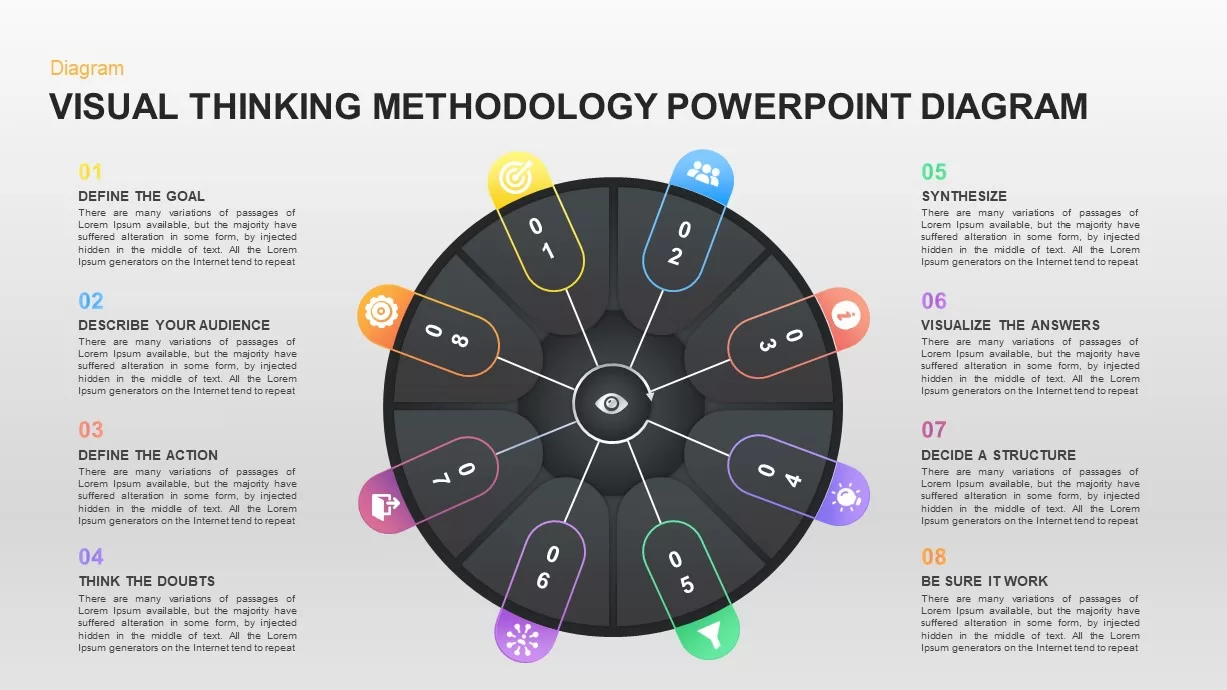
Visual Thinking Methodology diagram for PowerPoint & Google Slides
Process
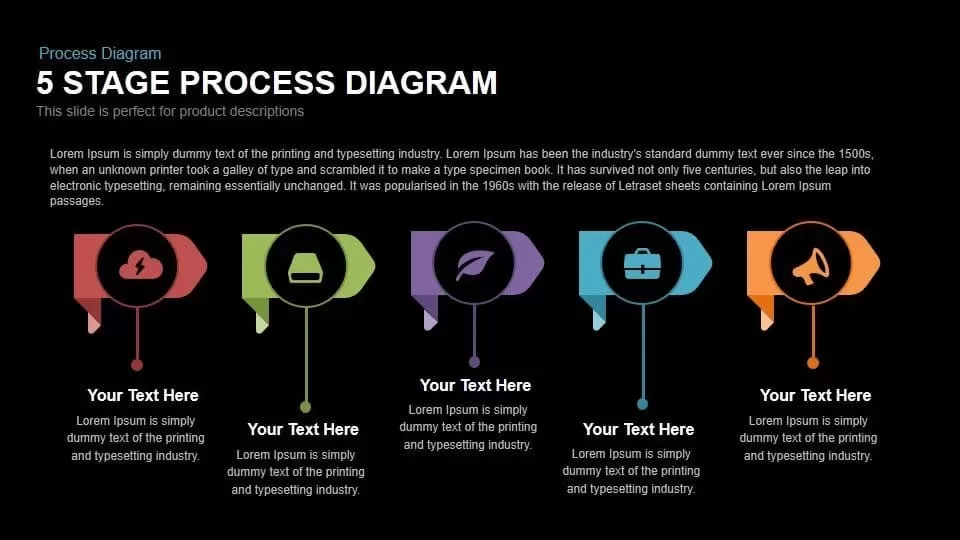
5 Stage Process Diagram Slide Overview Template for PowerPoint & Google Slides
Process
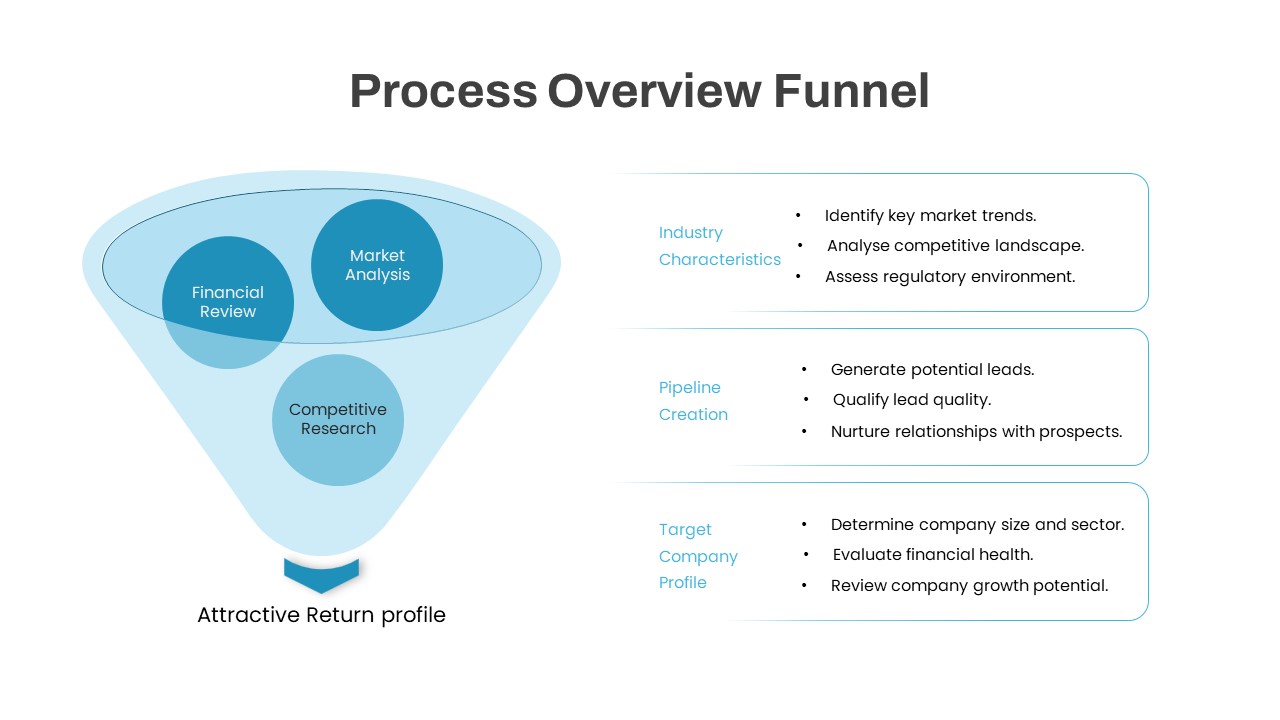
Process Overview Funnel Diagram Template for PowerPoint & Google Slides
Funnel
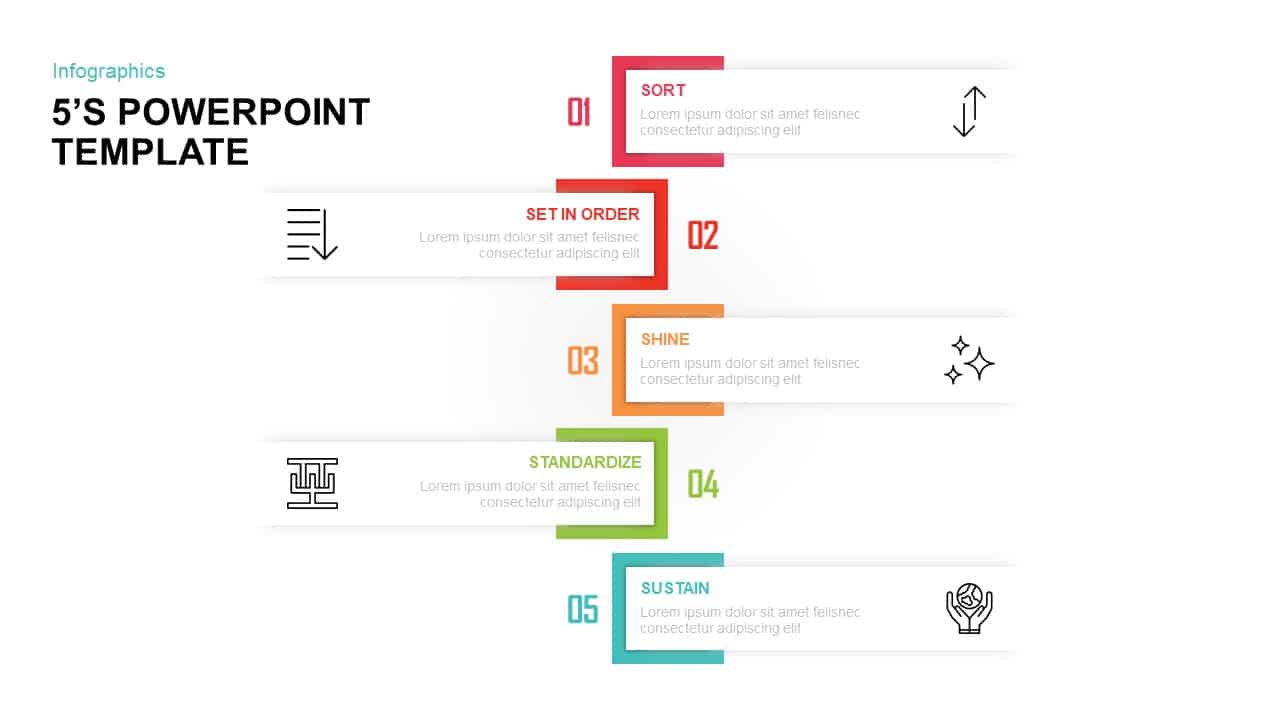
5S Lean Methodology Infographic Template for PowerPoint & Google Slides
Process
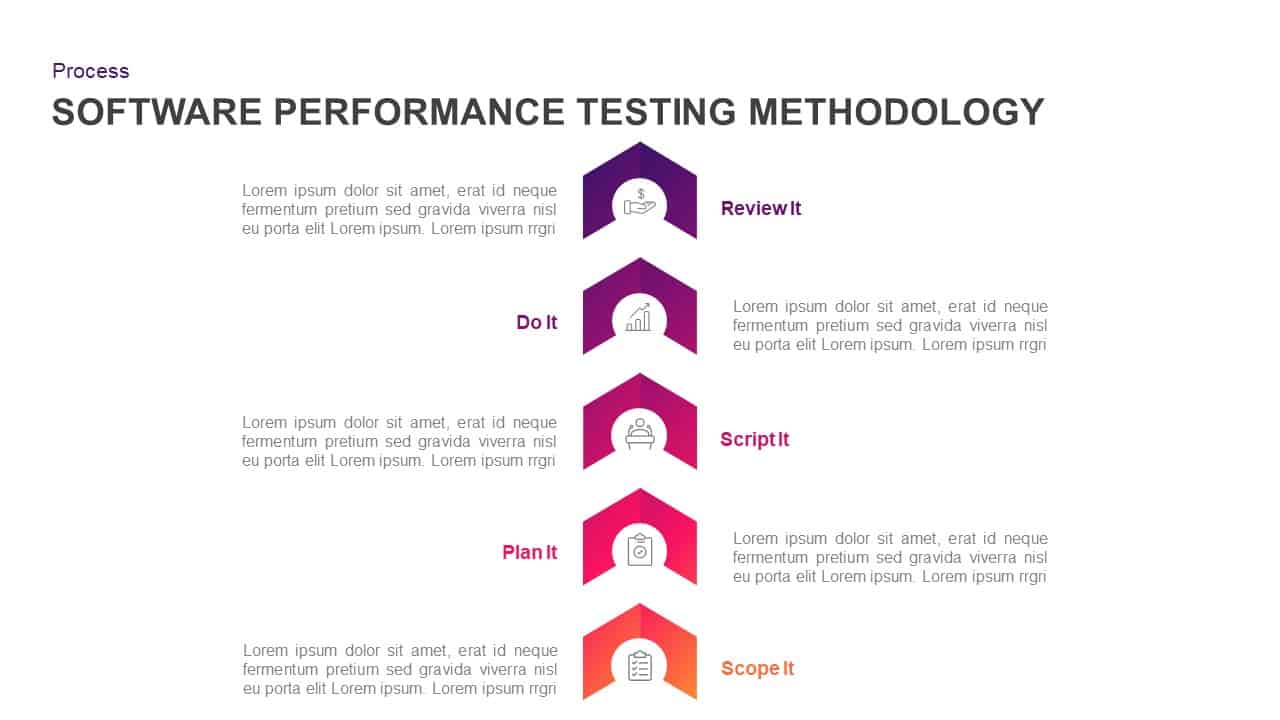
Software Performance Testing Methodology Template for PowerPoint & Google Slides
Process
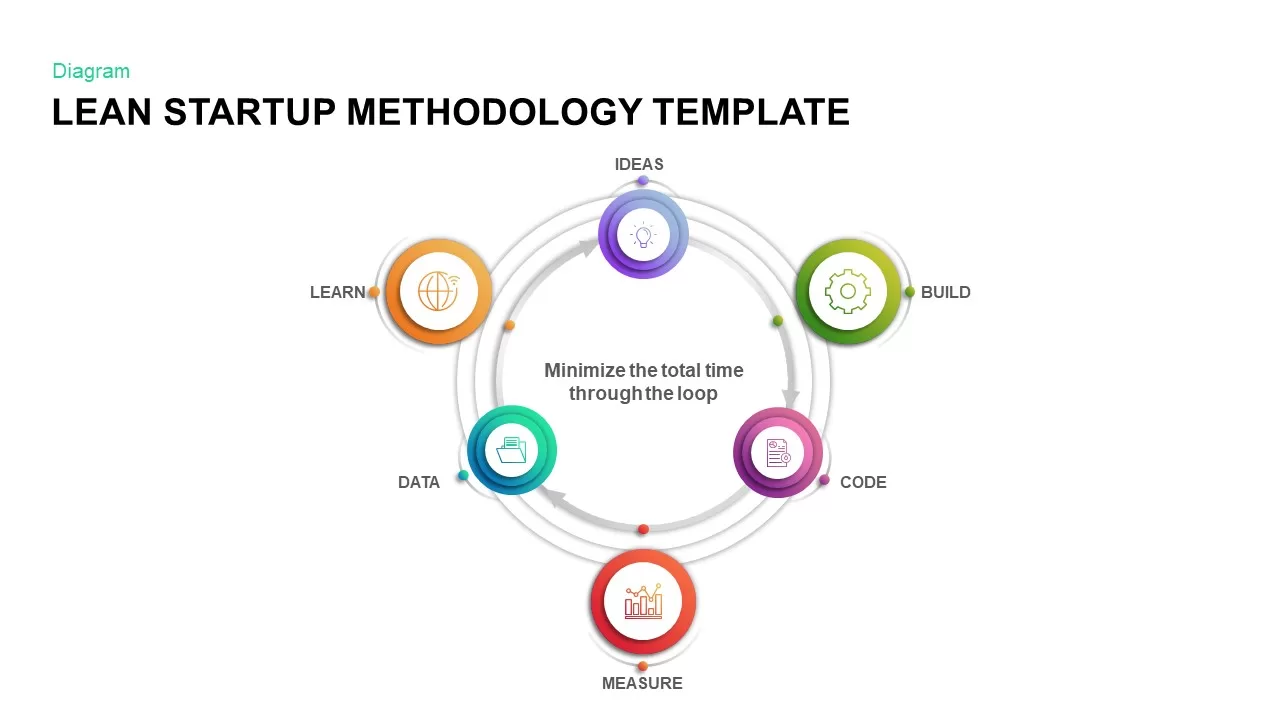
Lean Startup Methodology Infographic Template for PowerPoint & Google Slides
Circular
4 Step Methodology Infographic Template for PowerPoint & Google Slides
Process
4 Step Vibrant Colorful Methodology Template for PowerPoint & Google Slides
Process
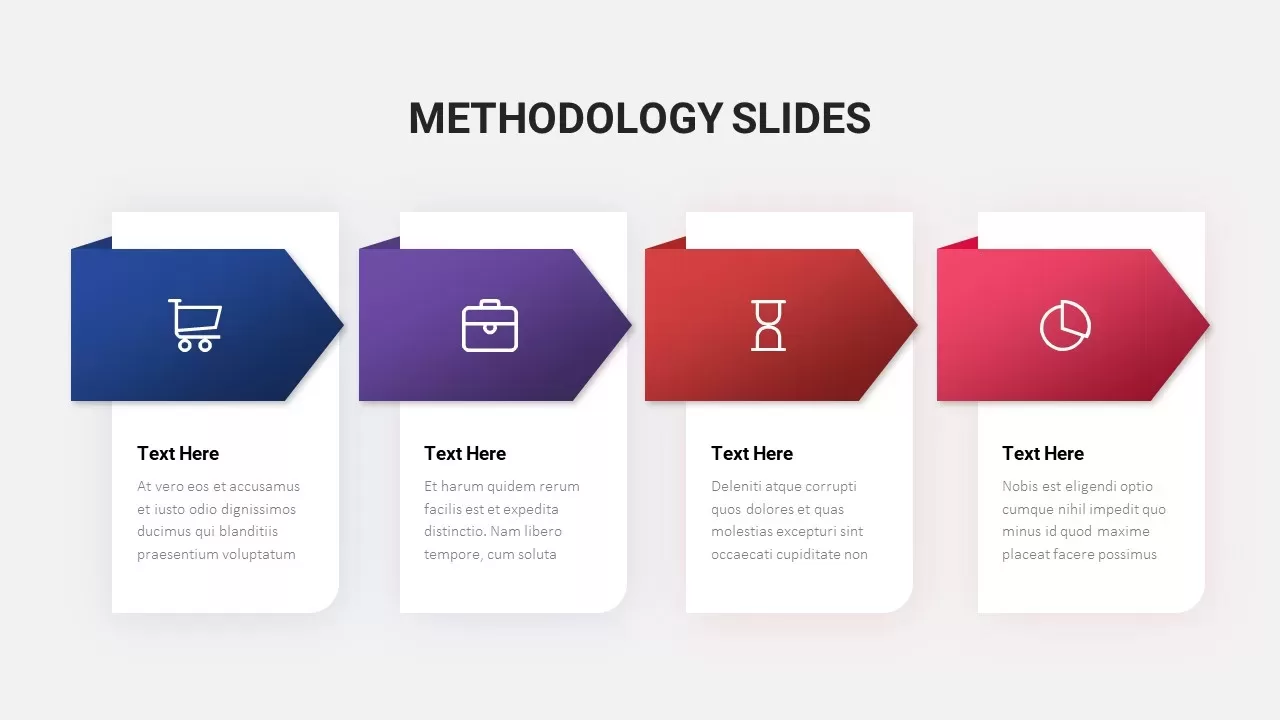
Colorful Arrow Methodology Steps Template for PowerPoint & Google Slides
Process
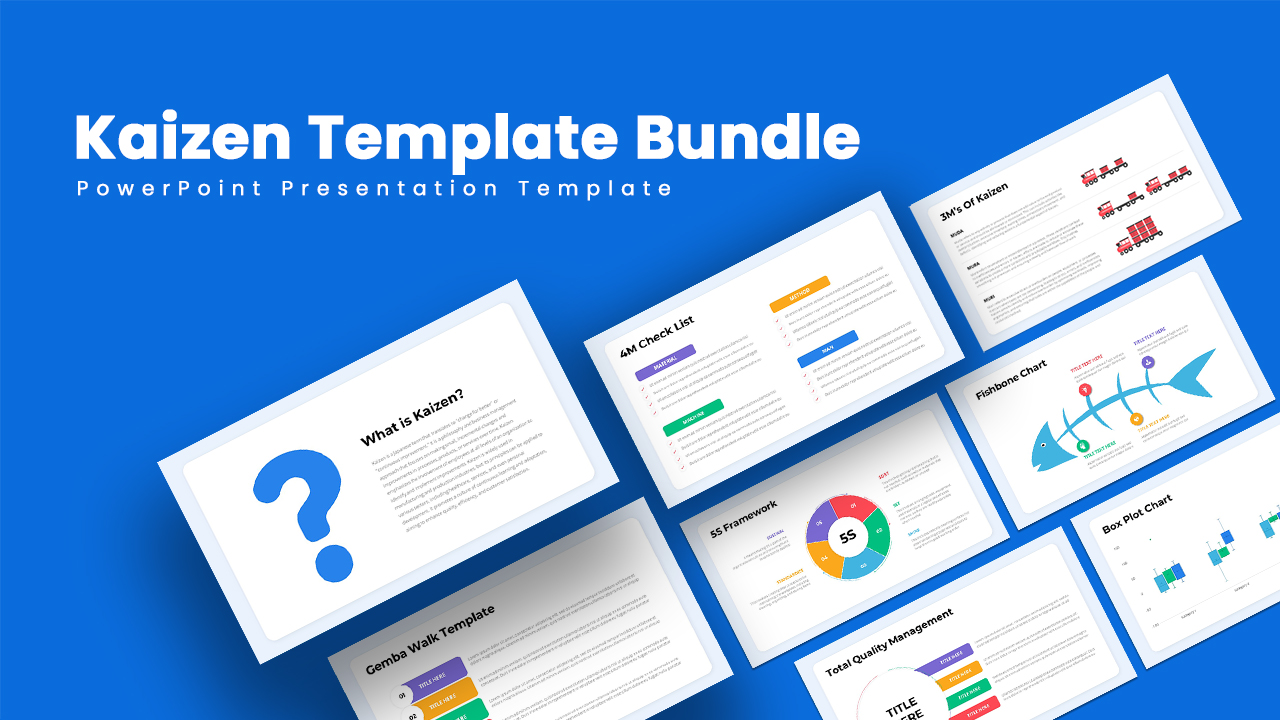
Kaizen Methodology Bundle Template for PowerPoint & Google Slides
Infographics
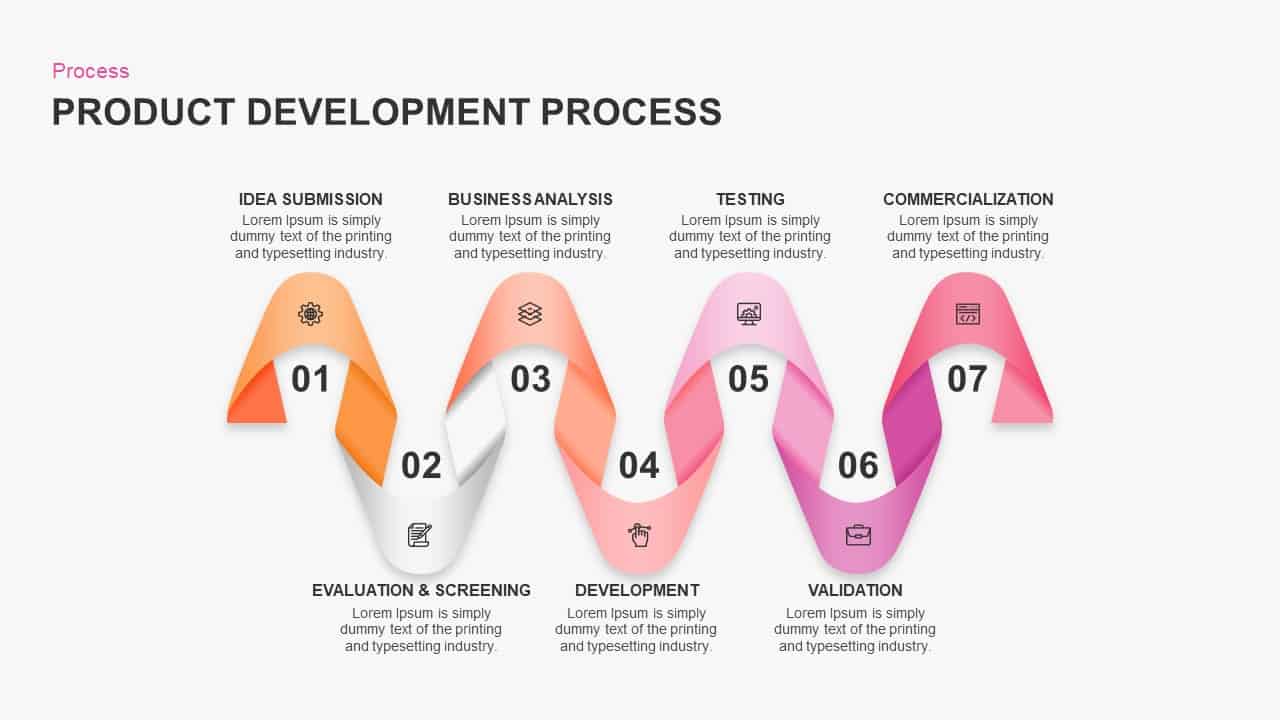
Product Development Process Overview template for PowerPoint & Google Slides
Process
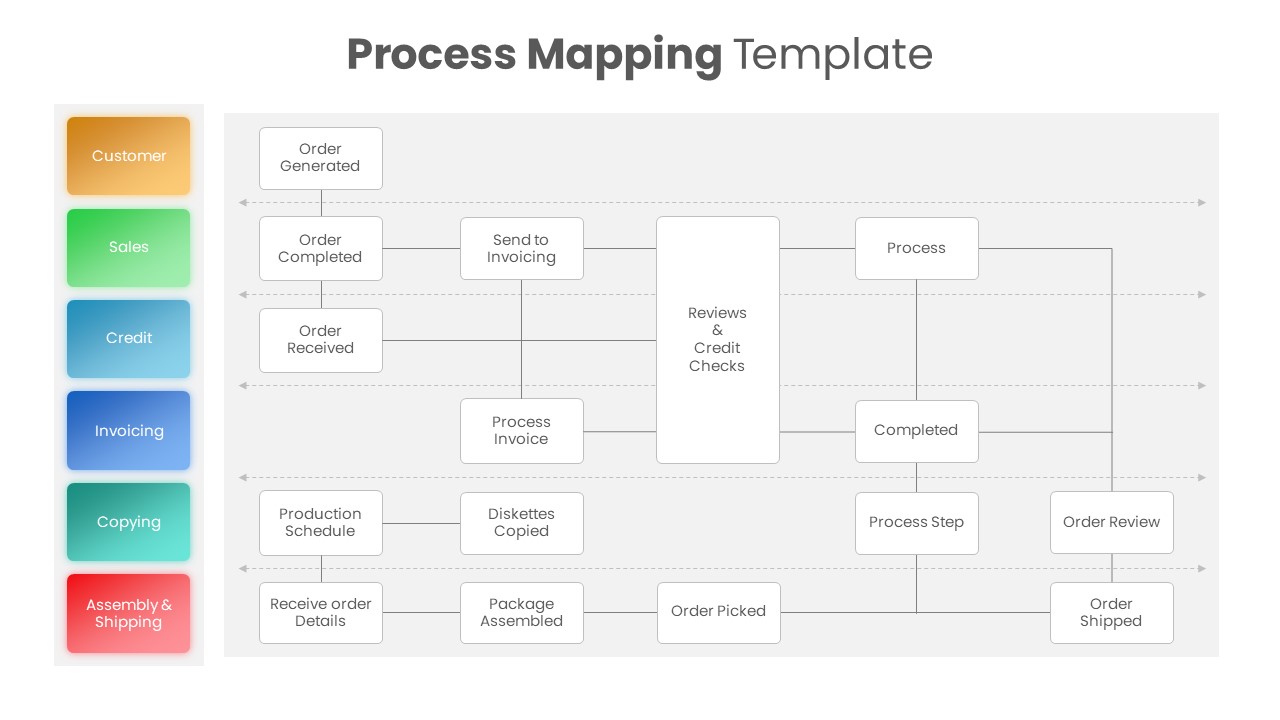
Process Mapping Overview template for PowerPoint & Google Slides
Business Plan
Demand Generation Process Overview Template for PowerPoint & Google Slides
Marketing
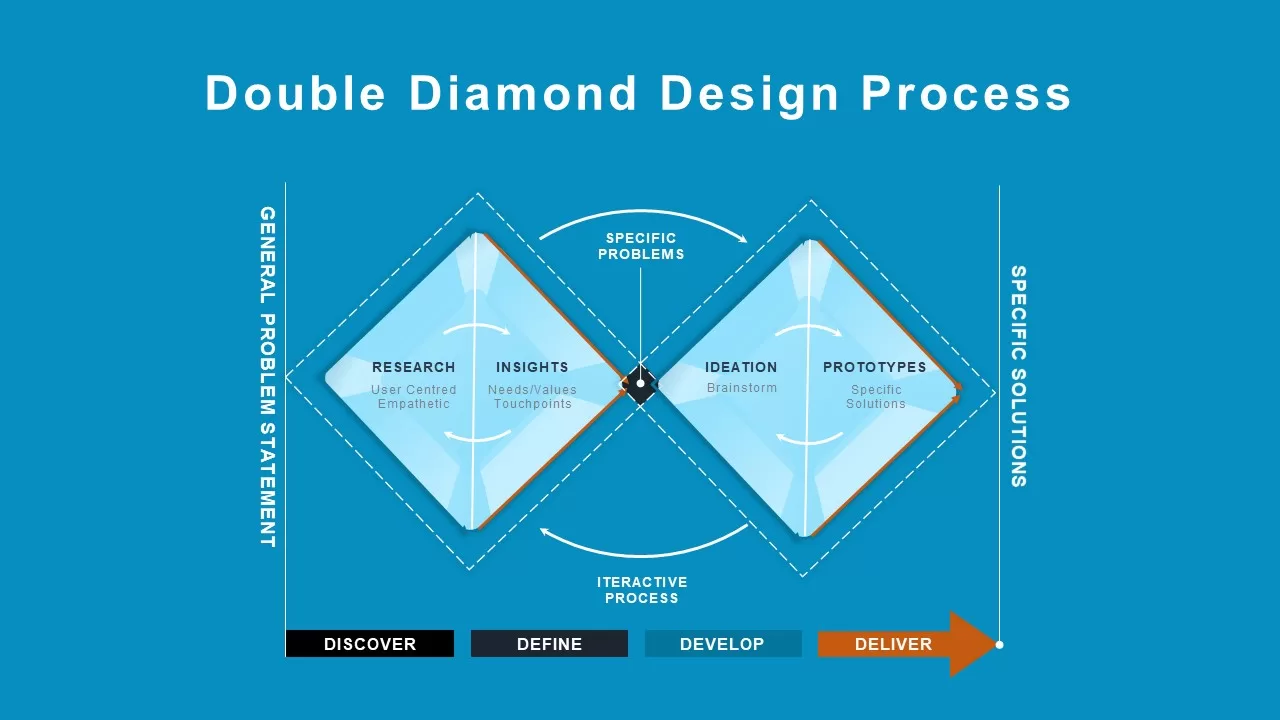
Double Diamond Design Process Overview Template for PowerPoint & Google Slides
Process
Recruitment Process Overview Template for PowerPoint & Google Slides
Recruitment
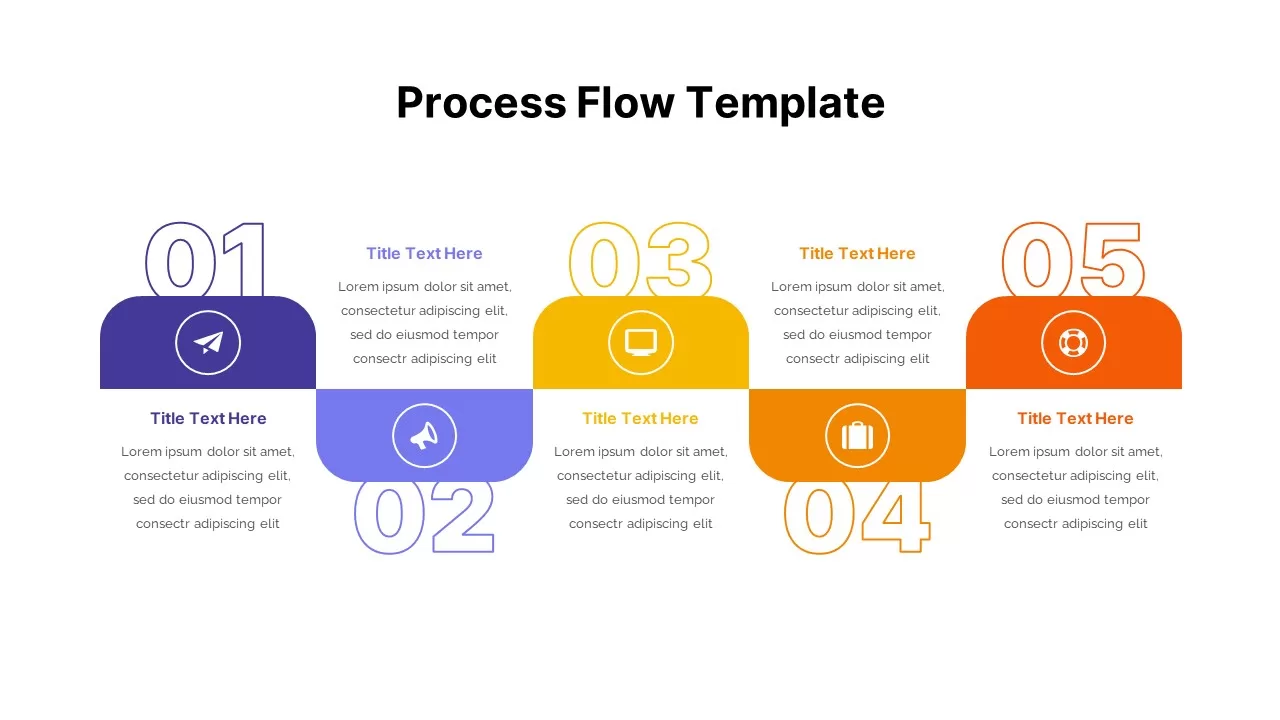
Process Flow Overview template for PowerPoint & Google Slides
Business
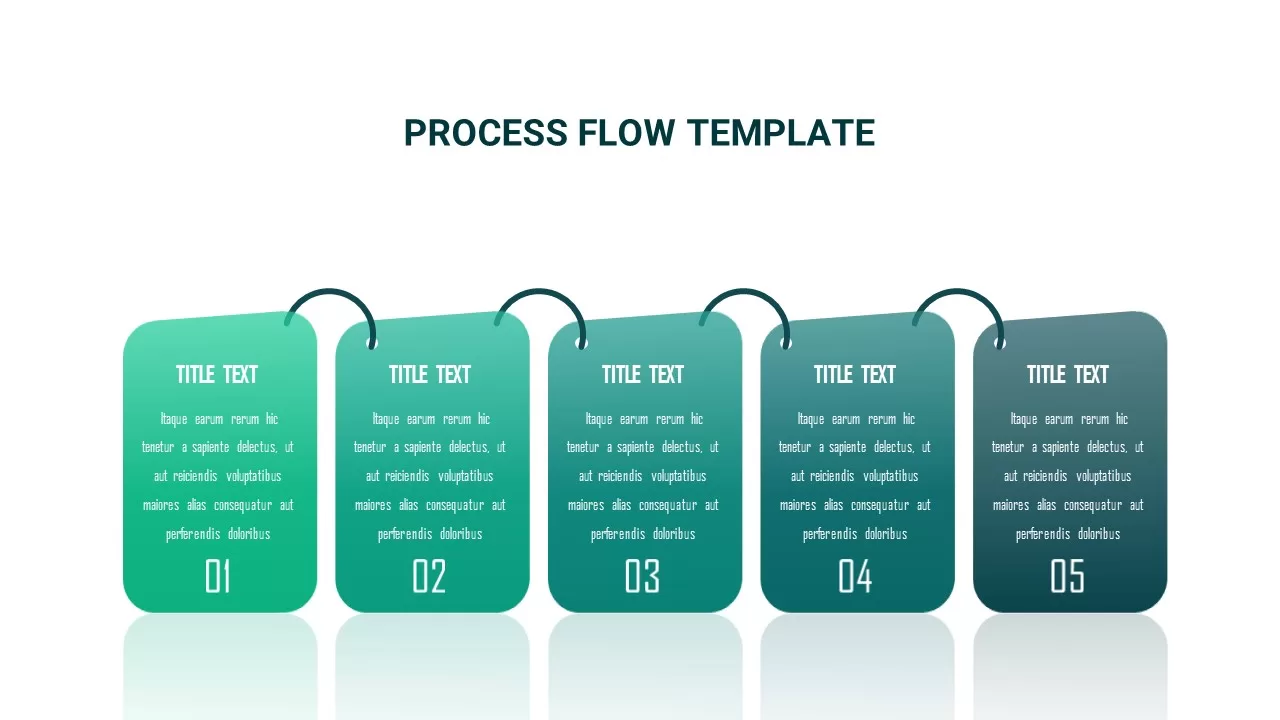
5 Stage Process Flow Overview template for PowerPoint & Google Slides
Process
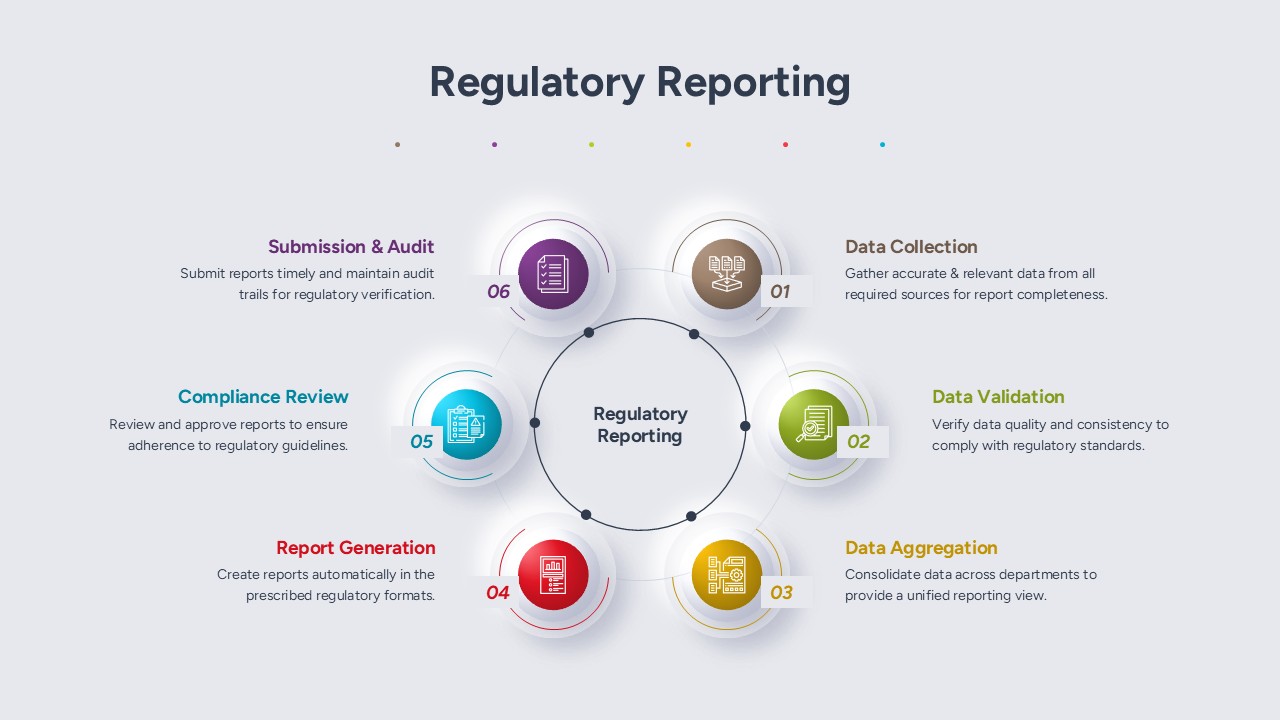
Regulatory Reporting Process Overview template for PowerPoint & Google Slides
Business
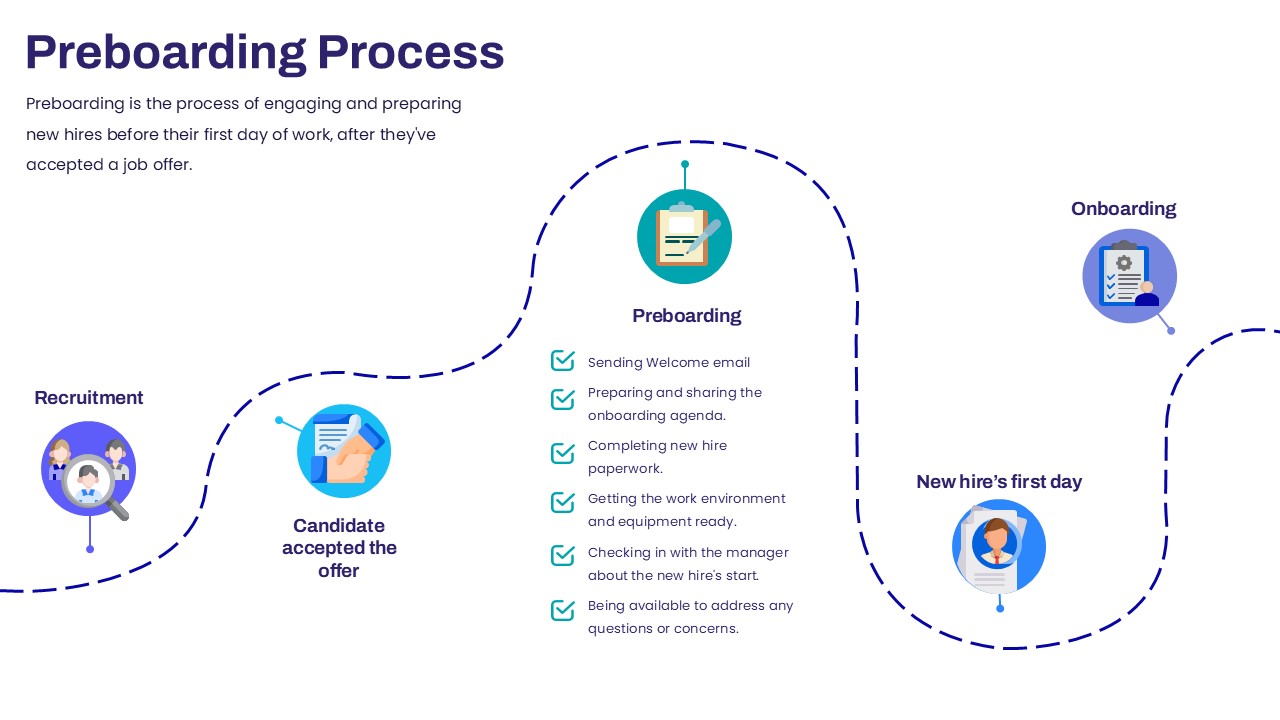
Preboarding Process Overview template for PowerPoint & Google Slides
Company Profile
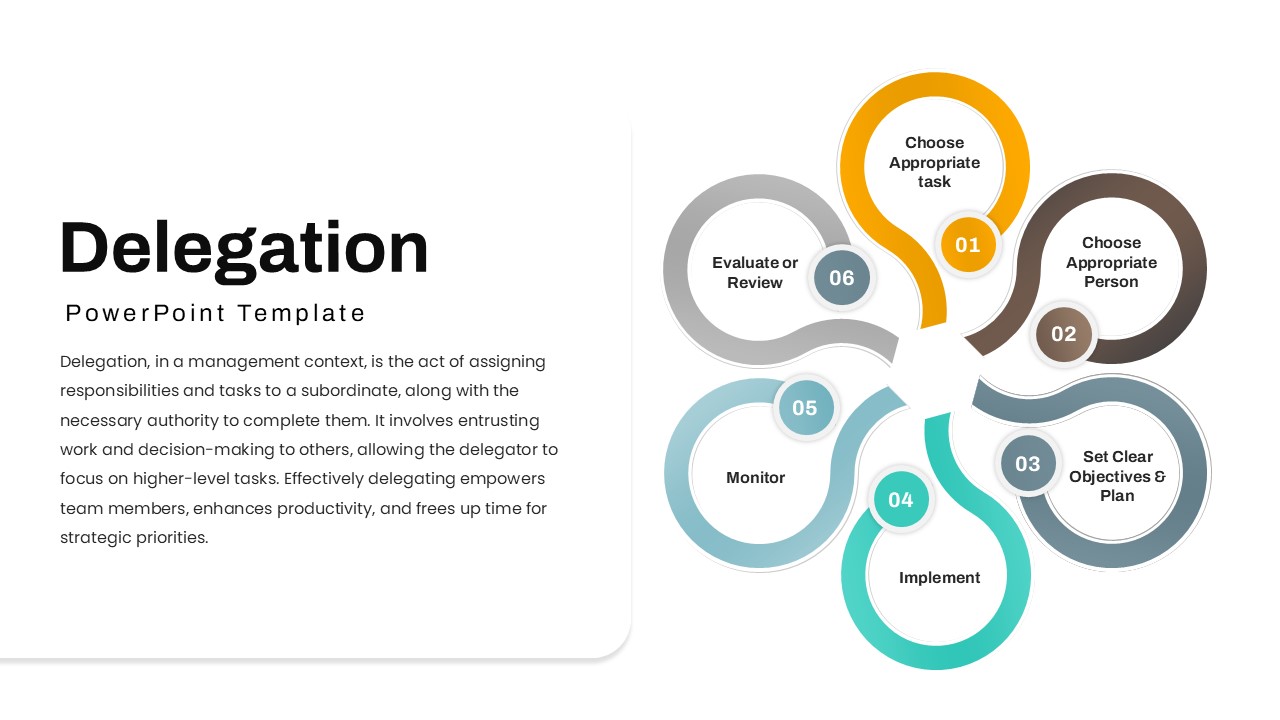
Delegation Process Overview template for PowerPoint & Google Slides
Leadership
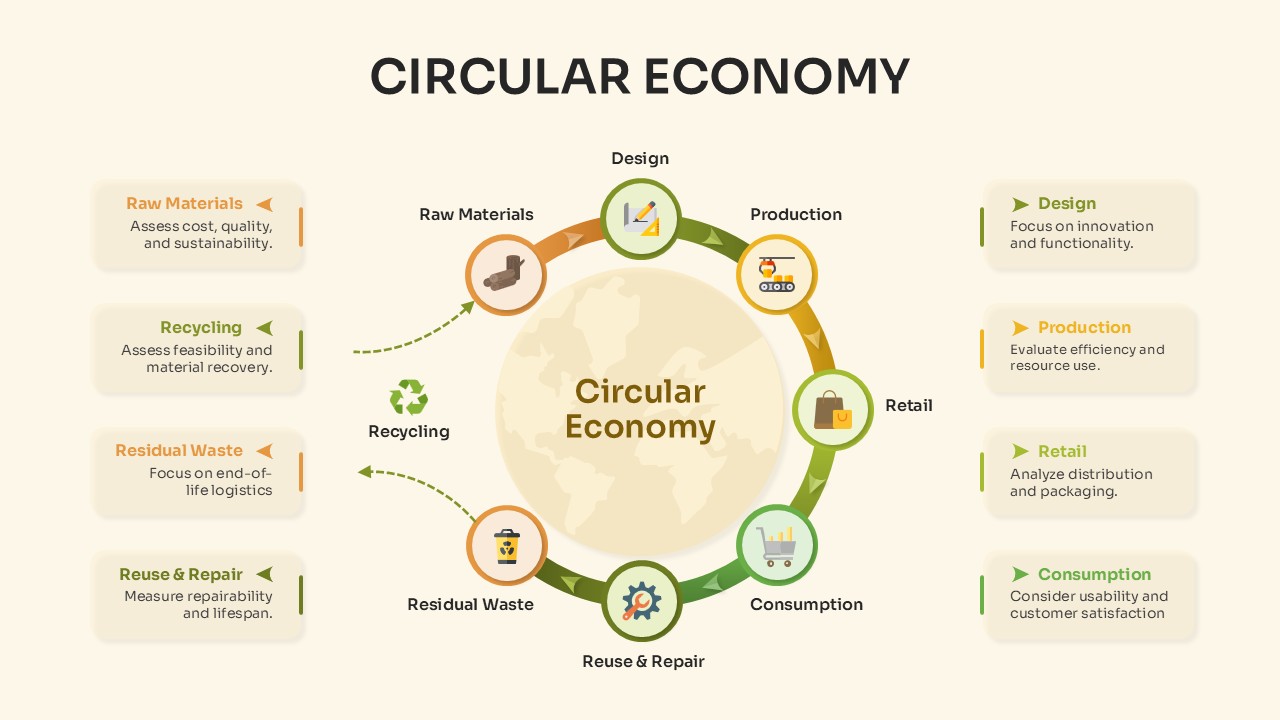
Circular Economy Process Overview Template for PowerPoint & Google Slides
Circular
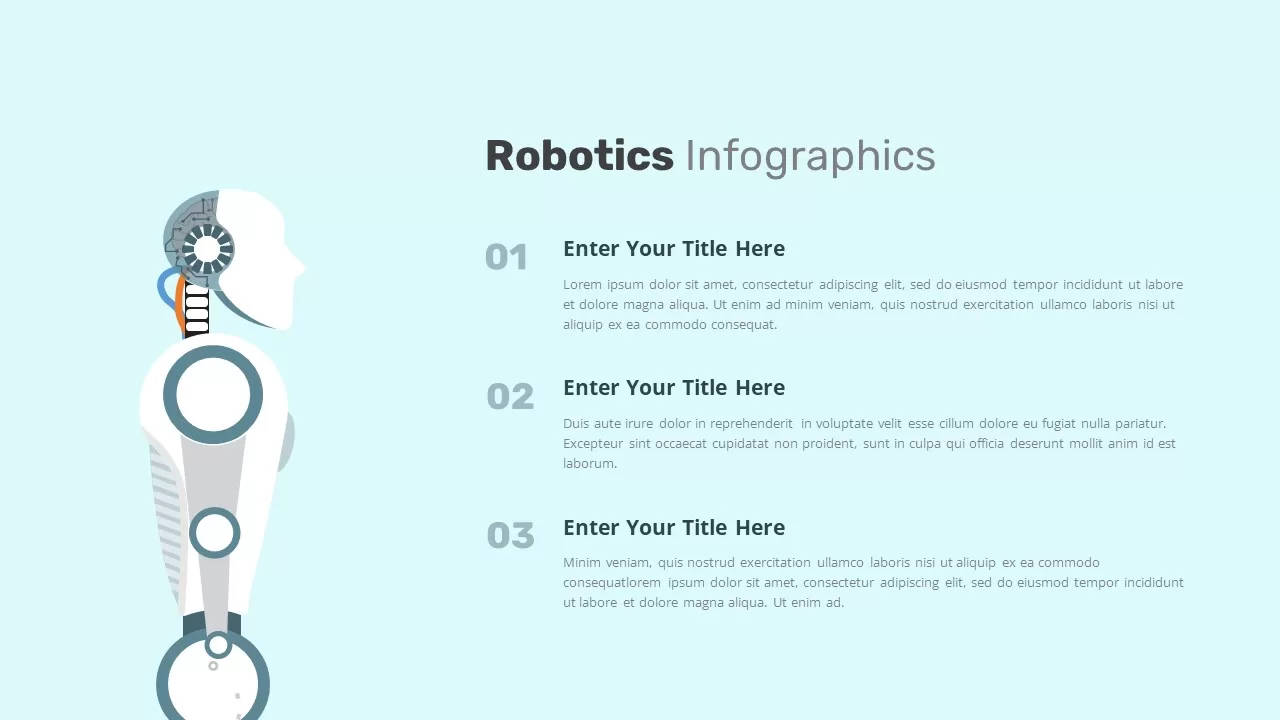
Robotics Process Overview Infographic for PowerPoint & Google Slides
AI
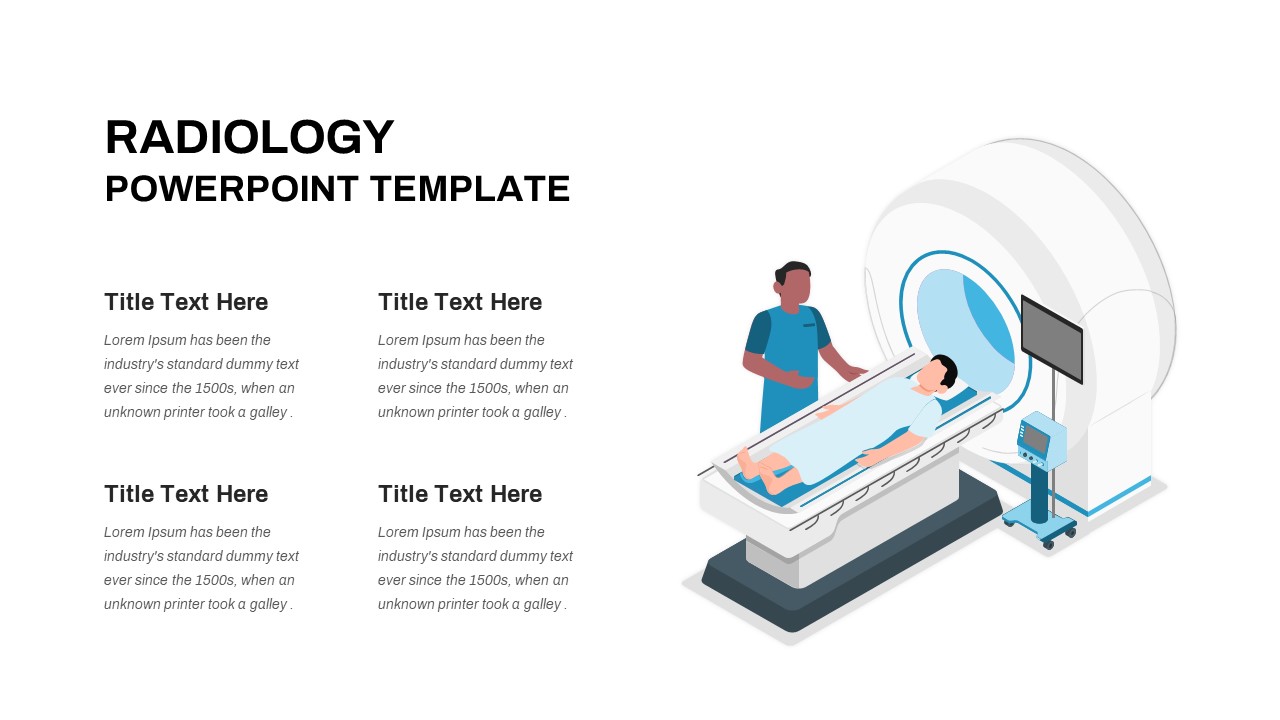
Radiology Scan Process Overview Slide for PowerPoint & Google Slides
Health
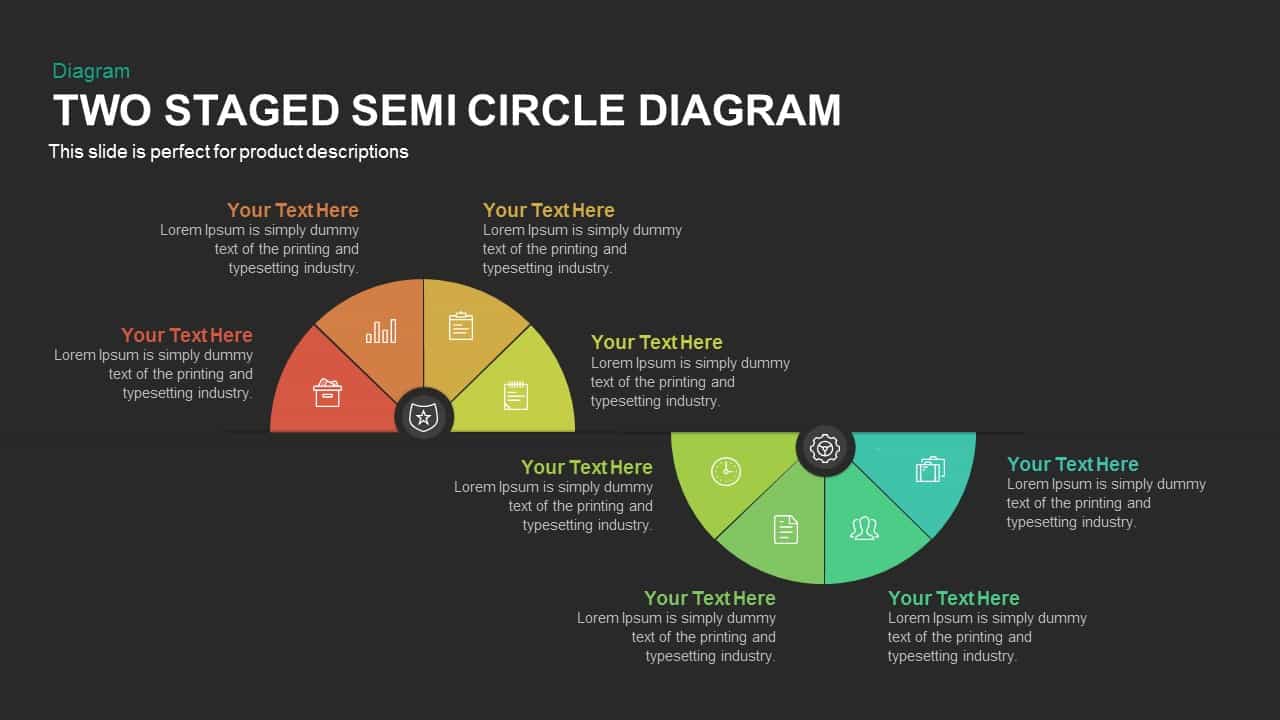
Two-Stage Semi-Circle Diagram Overview Template for PowerPoint & Google Slides
Circular
Fishbone Diagram Overview template for PowerPoint & Google Slides
Infographics
Free Simple Venn Diagram Overview template for PowerPoint & Google Slides
Comparison Chart
Free
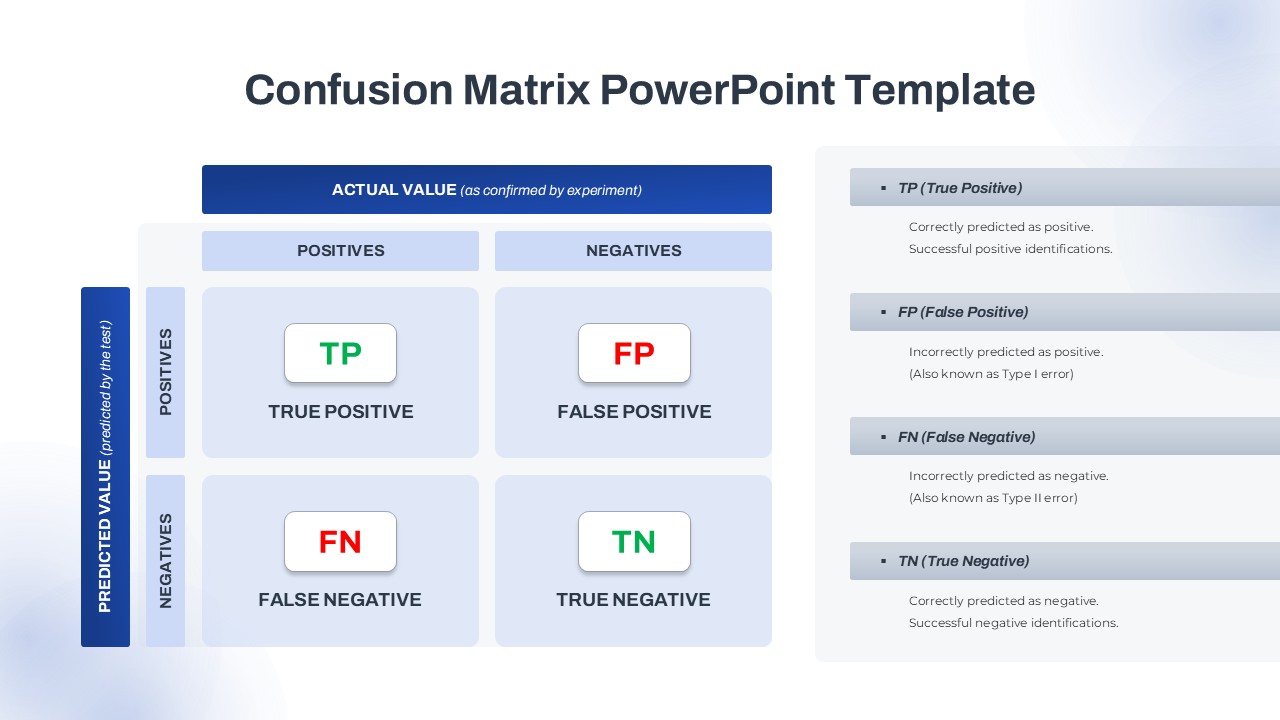
Confusion Matrix Diagram Overview Template for PowerPoint & Google Slides
Comparison
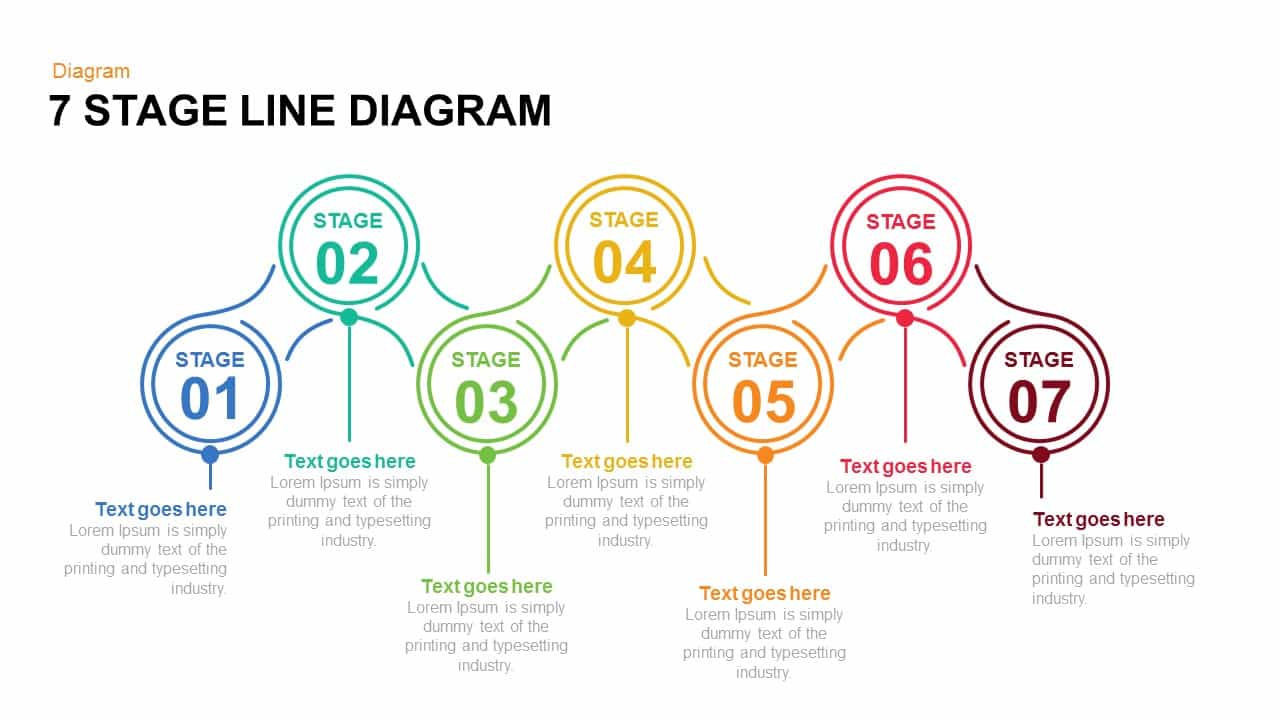
7 and 6 Stage Line Diagram Overview for PowerPoint & Google Slides
Infographics
Business Presentation Overview template for PowerPoint & Google Slides
Company Profile
Free
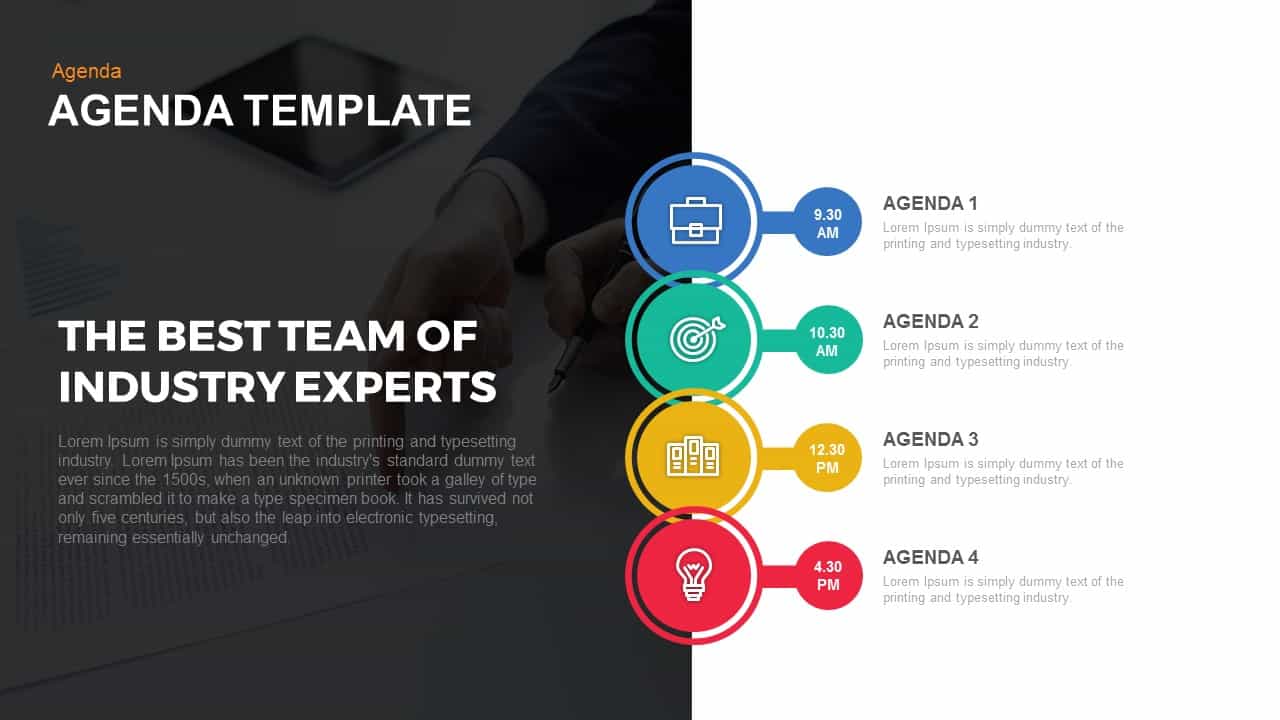
Agenda Overview template for PowerPoint & Google Slides
Agenda
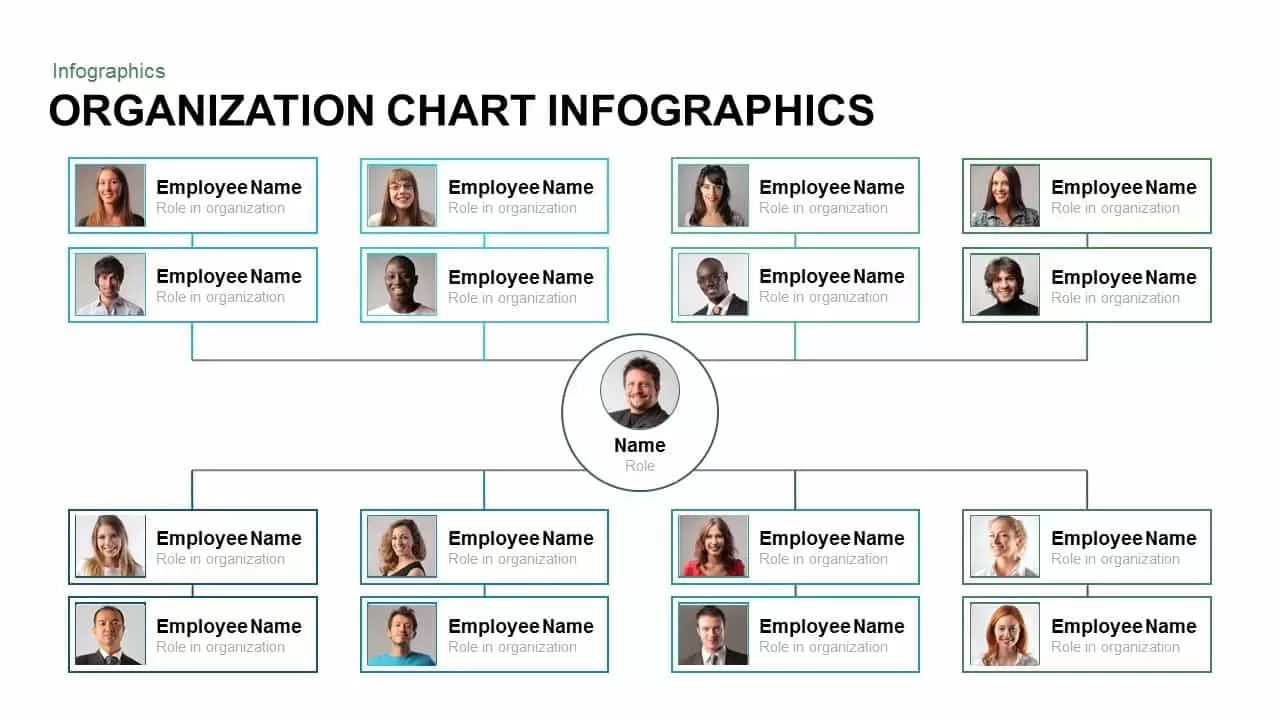
Organization Chart Overview template for PowerPoint & Google Slides
Org Chart
Comparison Chart Overview template for PowerPoint & Google Slides
Comparison Chart
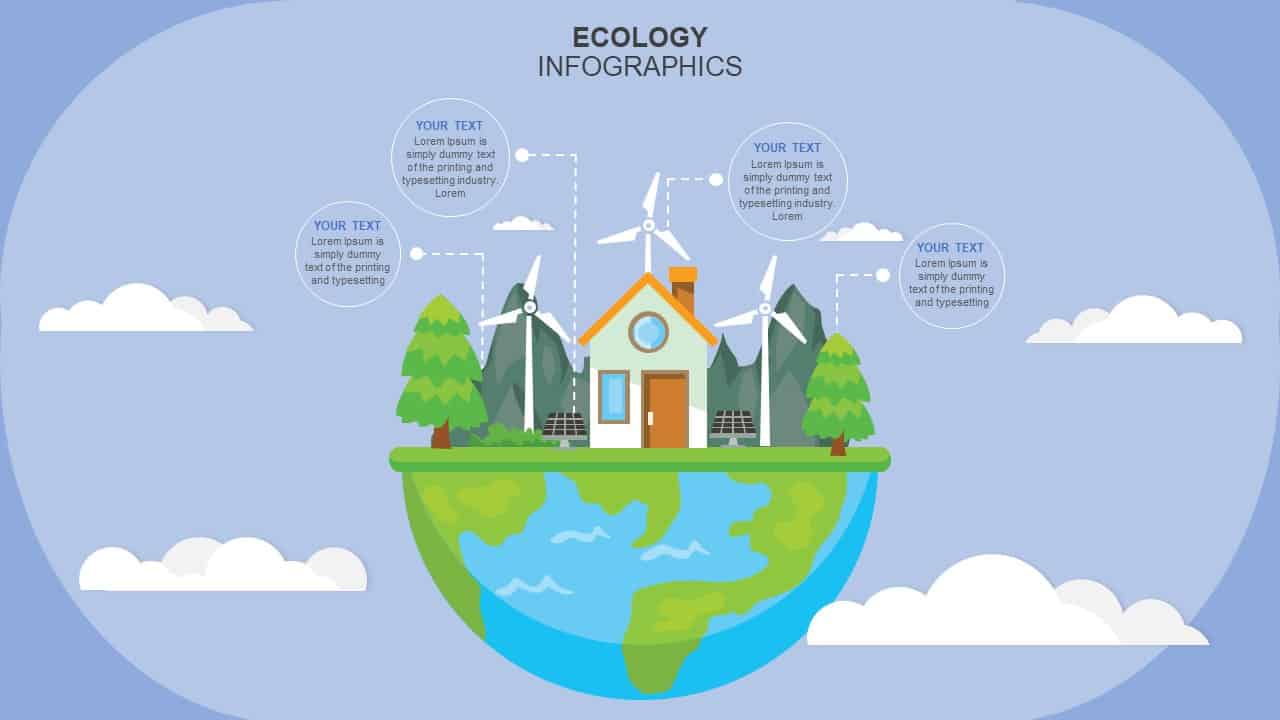
Ecology Infographics Overview template for PowerPoint & Google Slides
Business Proposal
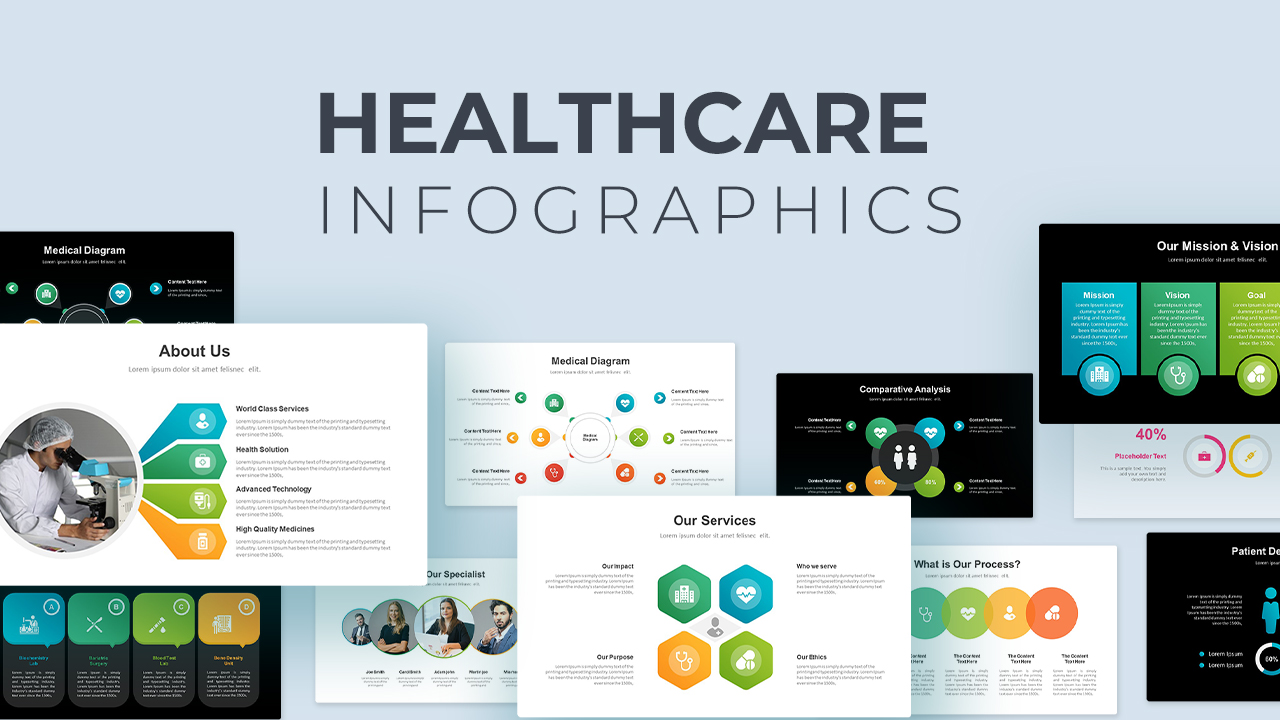
Comprehensive Healthcare Overview Deck Template for PowerPoint & Google Slides
Medical
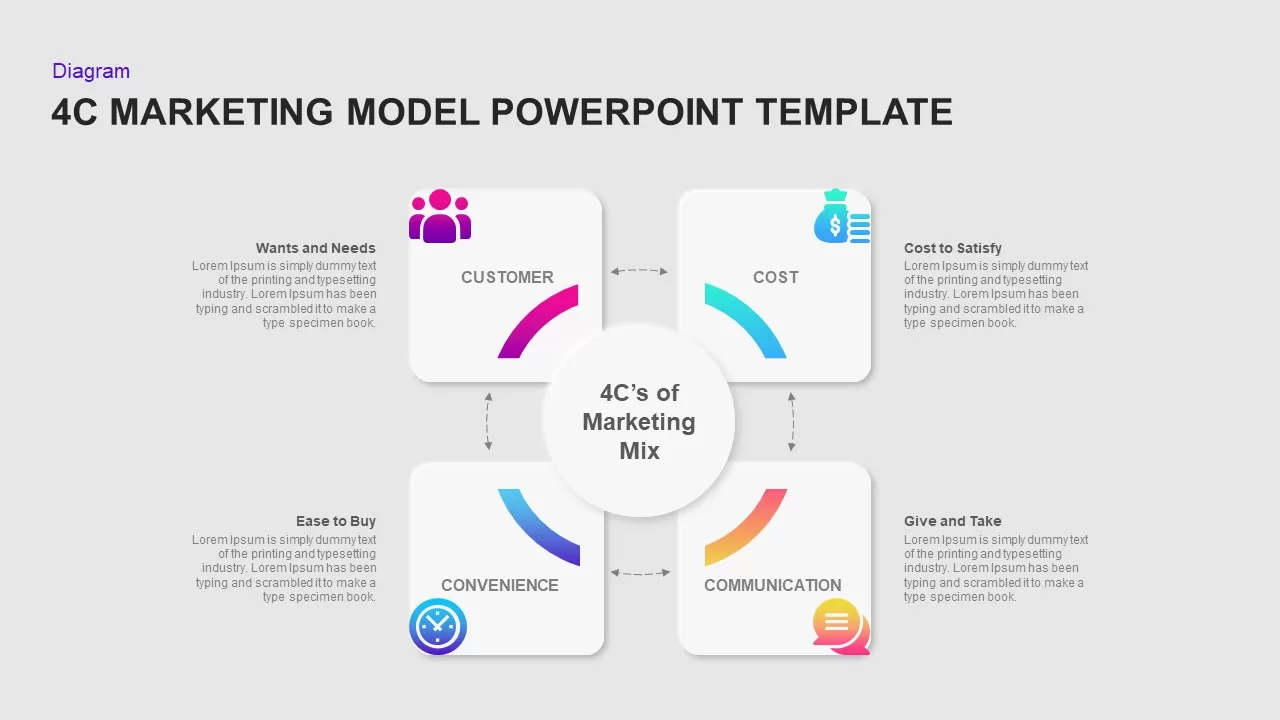
4C Marketing Model Overview Template for PowerPoint & Google Slides
Marketing
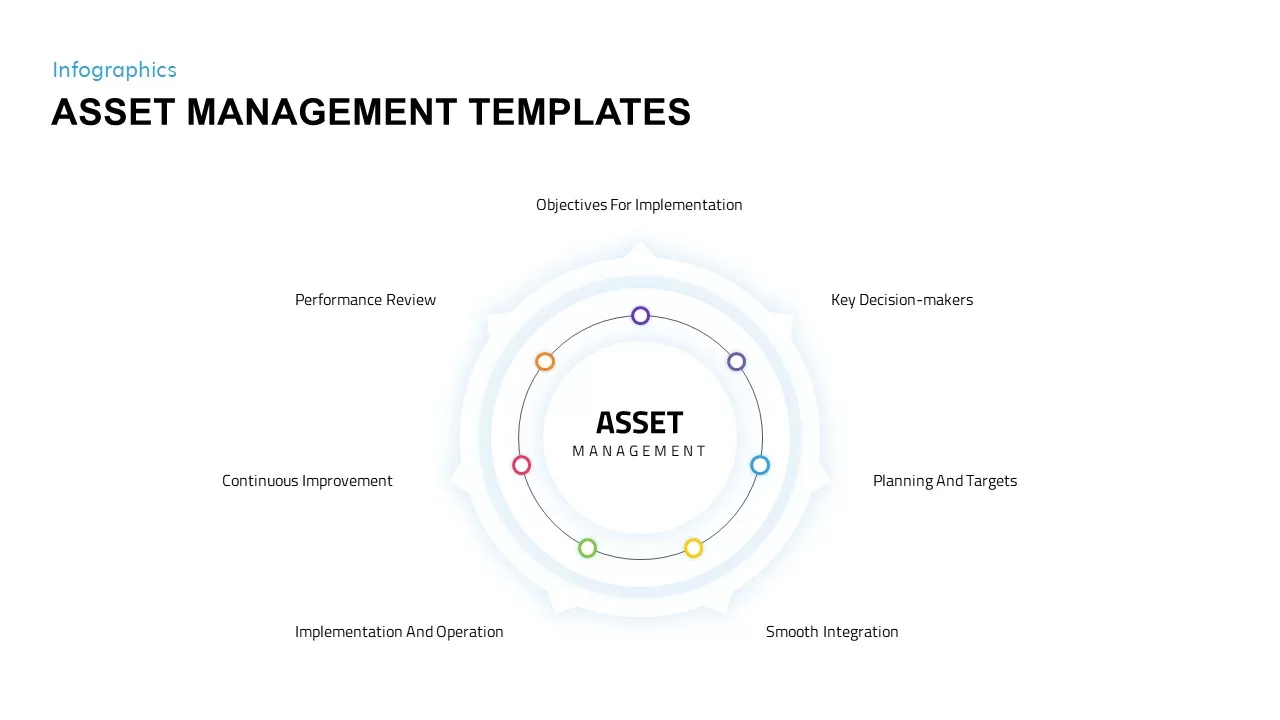
Asset Management Overview template for PowerPoint & Google Slides
Business
Home School Overview template for PowerPoint & Google Slides
Company Profile
Sales Meeting Overview template for PowerPoint & Google Slides
Pitch Deck
Lewin’s Change Model Overview Template for PowerPoint & Google Slides
Gap
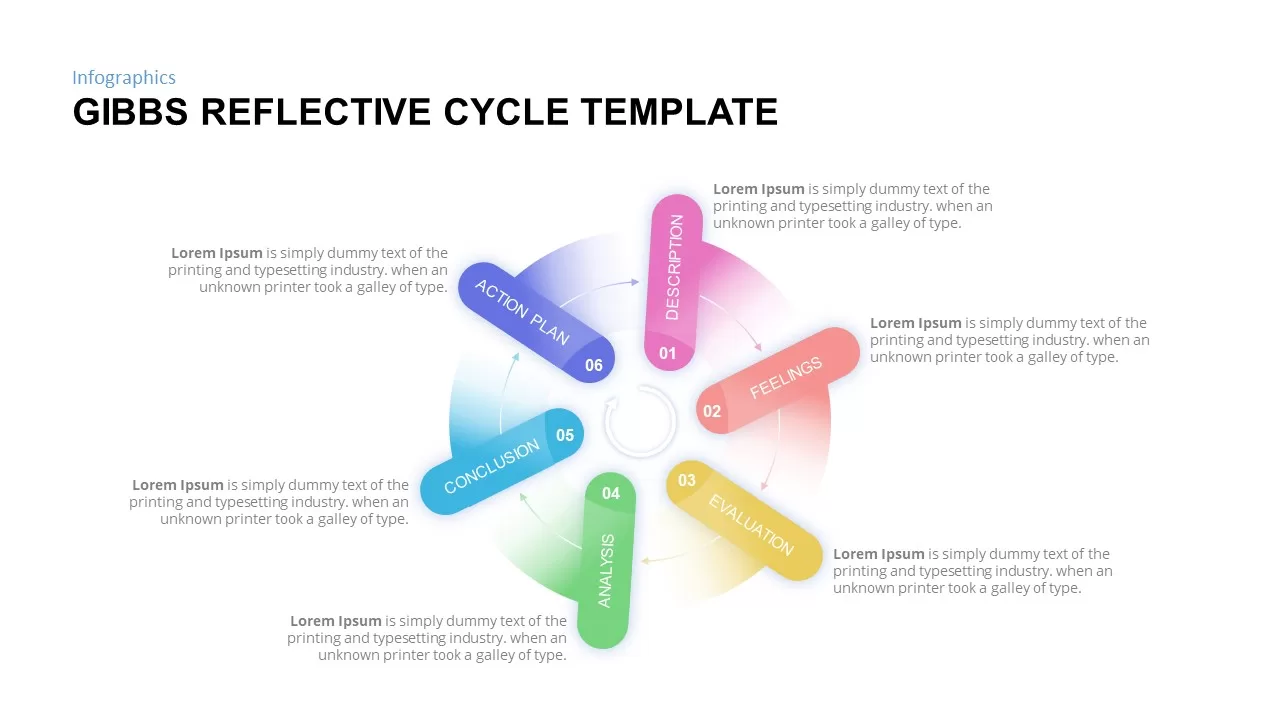
Gibbs Reflective Cycle Overview Template for PowerPoint & Google Slides
Process
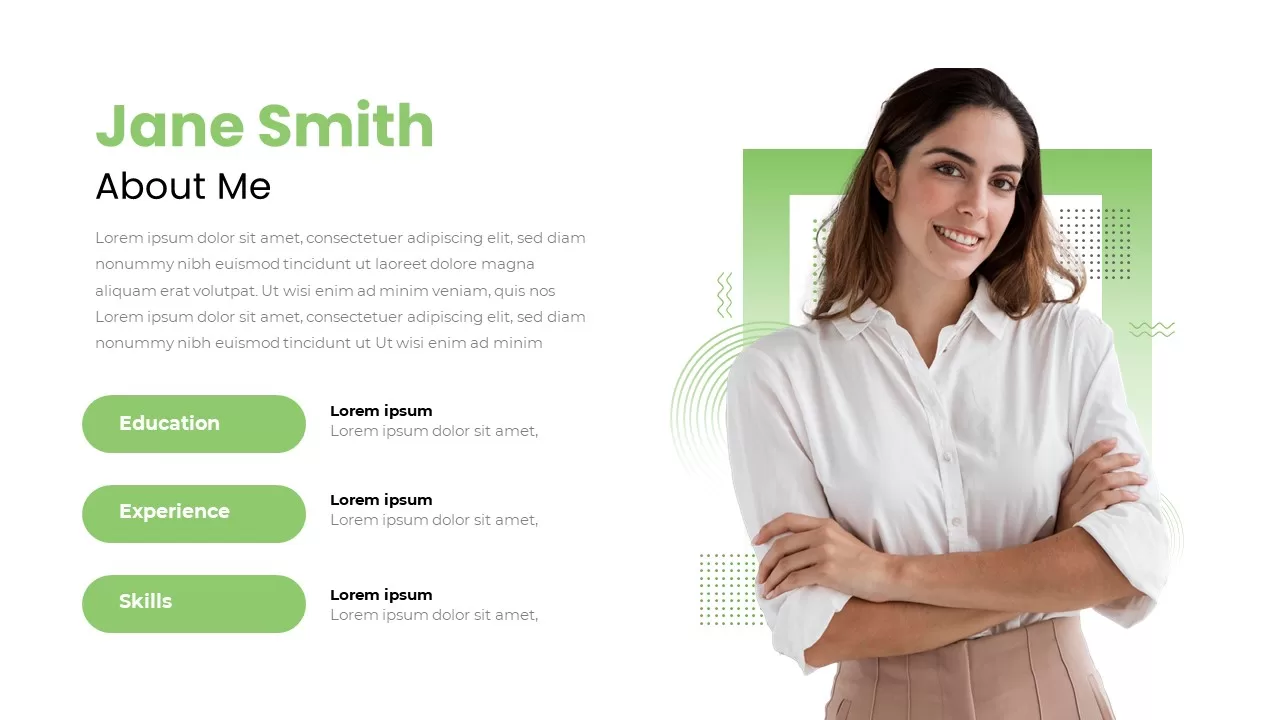
Personal Profile Overview template for PowerPoint & Google Slides
Business
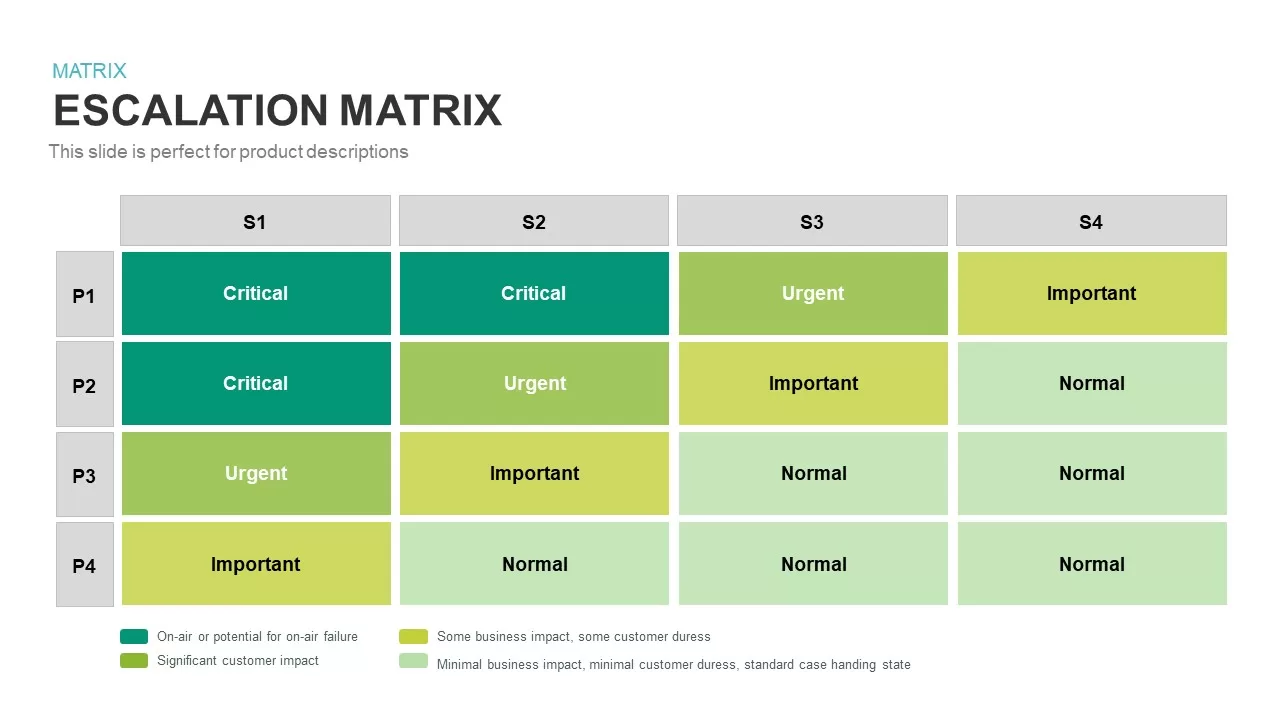
Escalation Matrix template for PowerPoint & Google Slides
Business
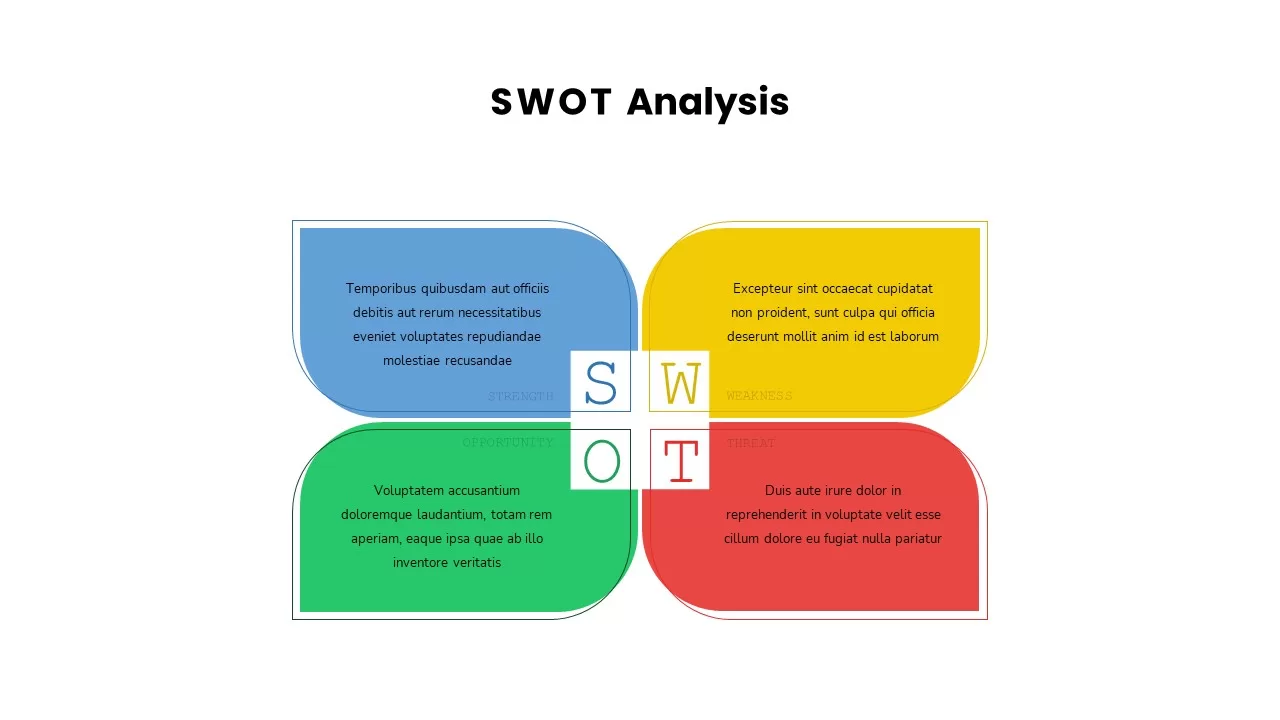
SWOT Analysis Overview template for PowerPoint & Google Slides
Business
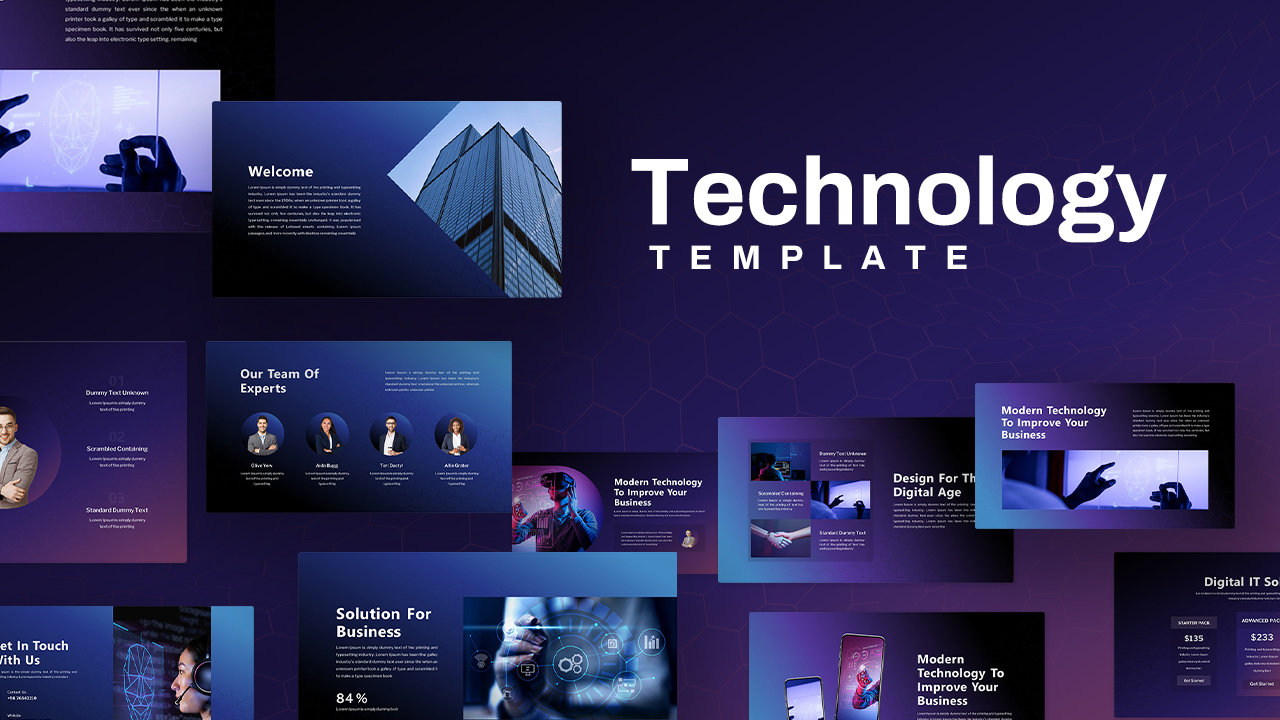
Modern Technology Solutions Overview template for PowerPoint & Google Slides
Information Technology
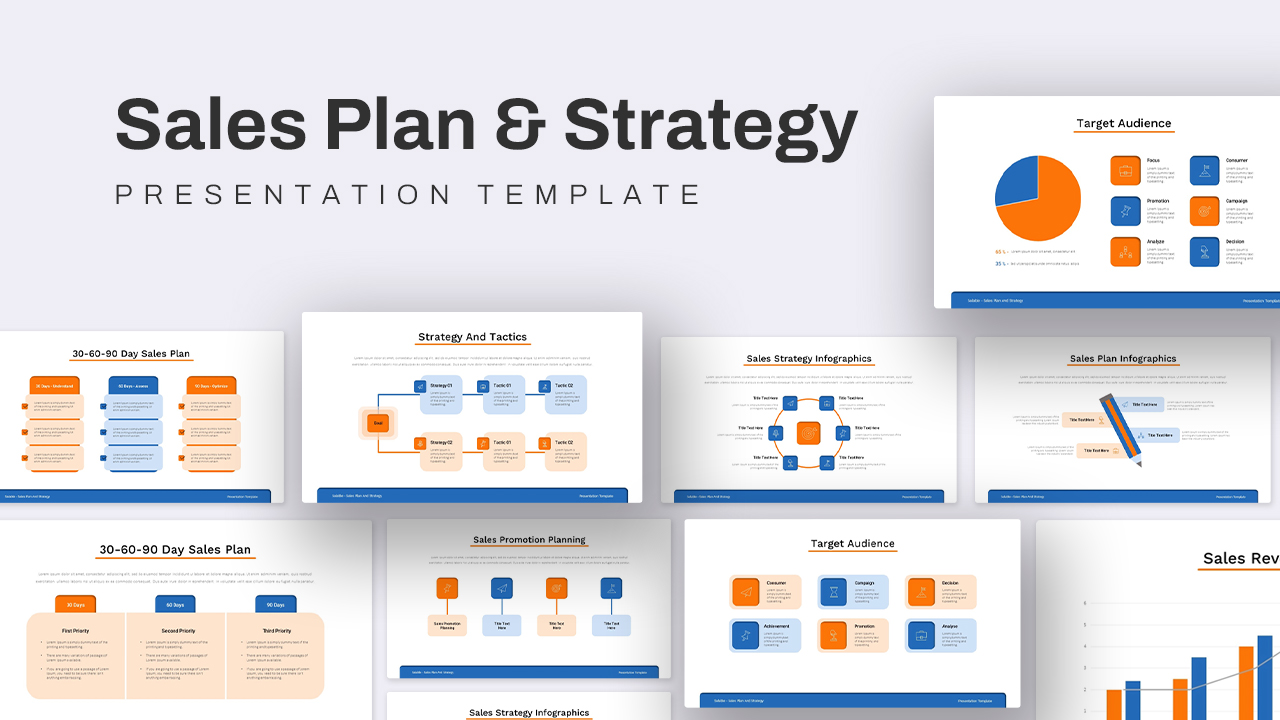
Sales Plan & Strategy Overview template for PowerPoint & Google Slides
Business Strategy
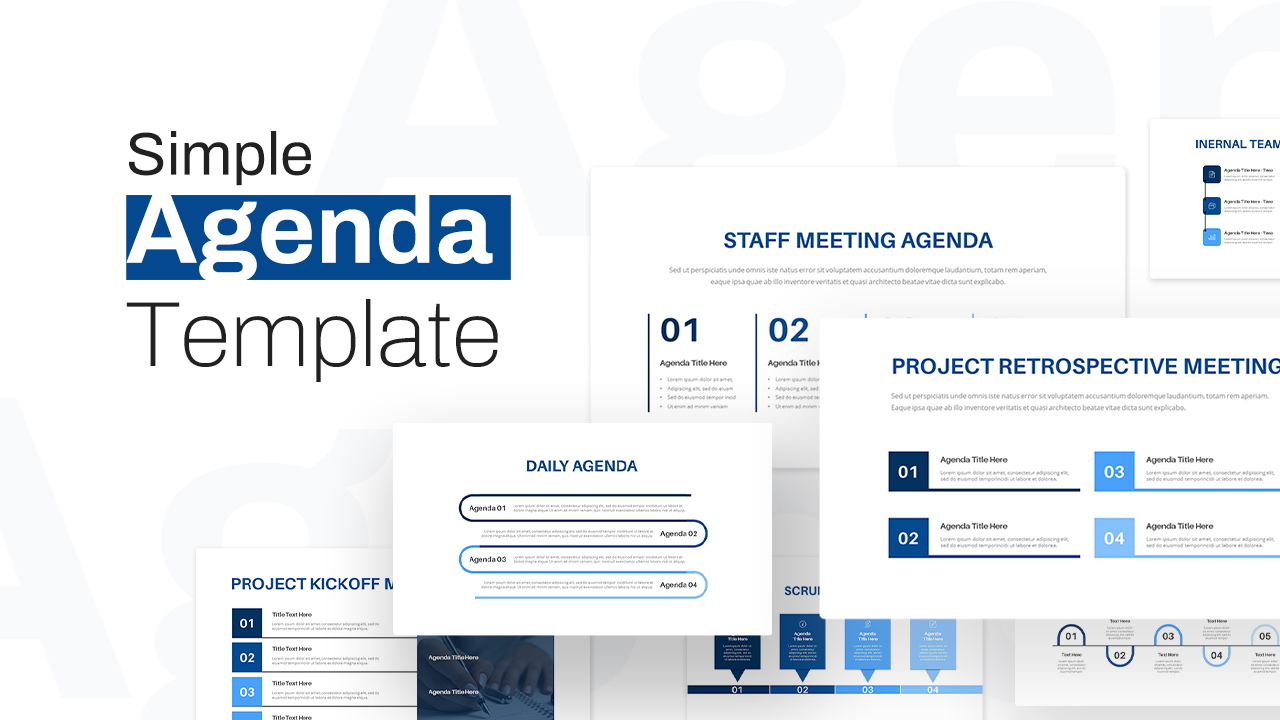
Simple Agenda Slide Deck Overview Template for PowerPoint & Google Slides
Agenda

Editable 2024 Calendar Yearly Overview Template for PowerPoint & Google Slides
Decks
Personal Profile and Resume Overview Template for PowerPoint & Google Slides
Our Team
Aviation Airline Industry Overview template for PowerPoint & Google Slides
Business
Thesis Presentation Overview template for PowerPoint & Google Slides
Business Proposal
Project Execution Plan Overview Template for PowerPoint & Google Slides
Business Proposal
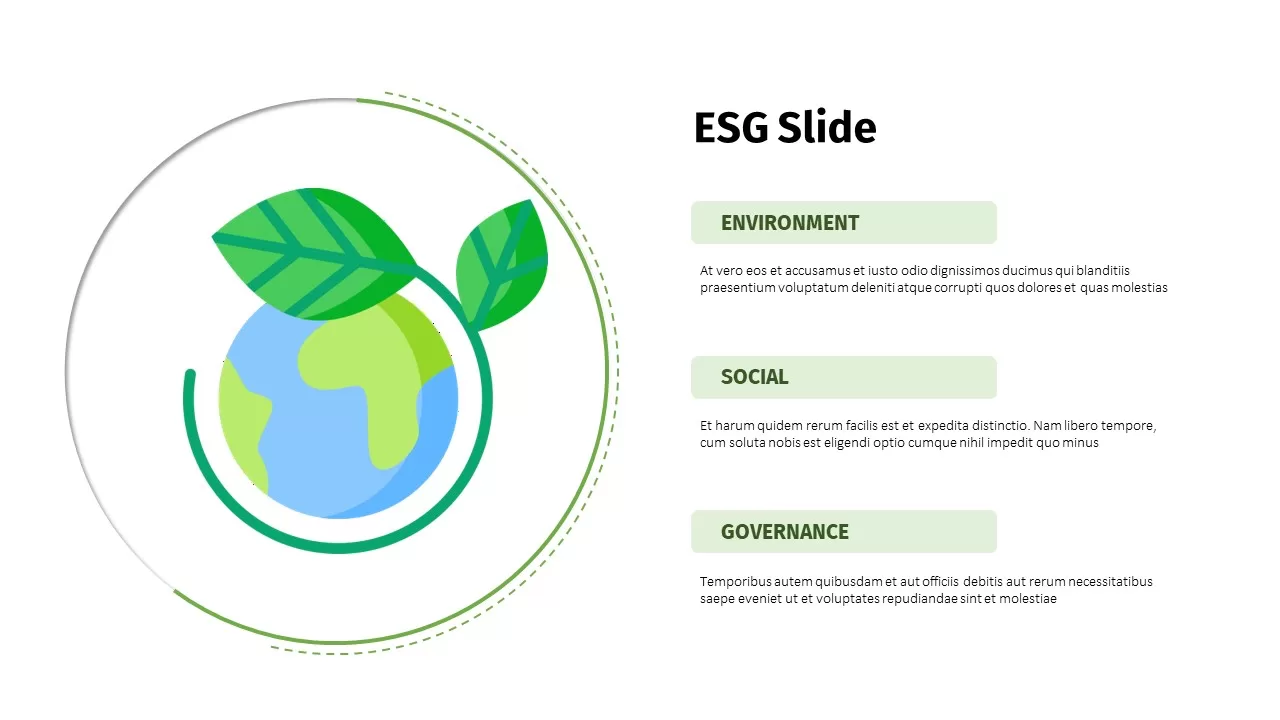
ESG Sustainability Overview Slide Template for PowerPoint & Google Slides
Risk Management
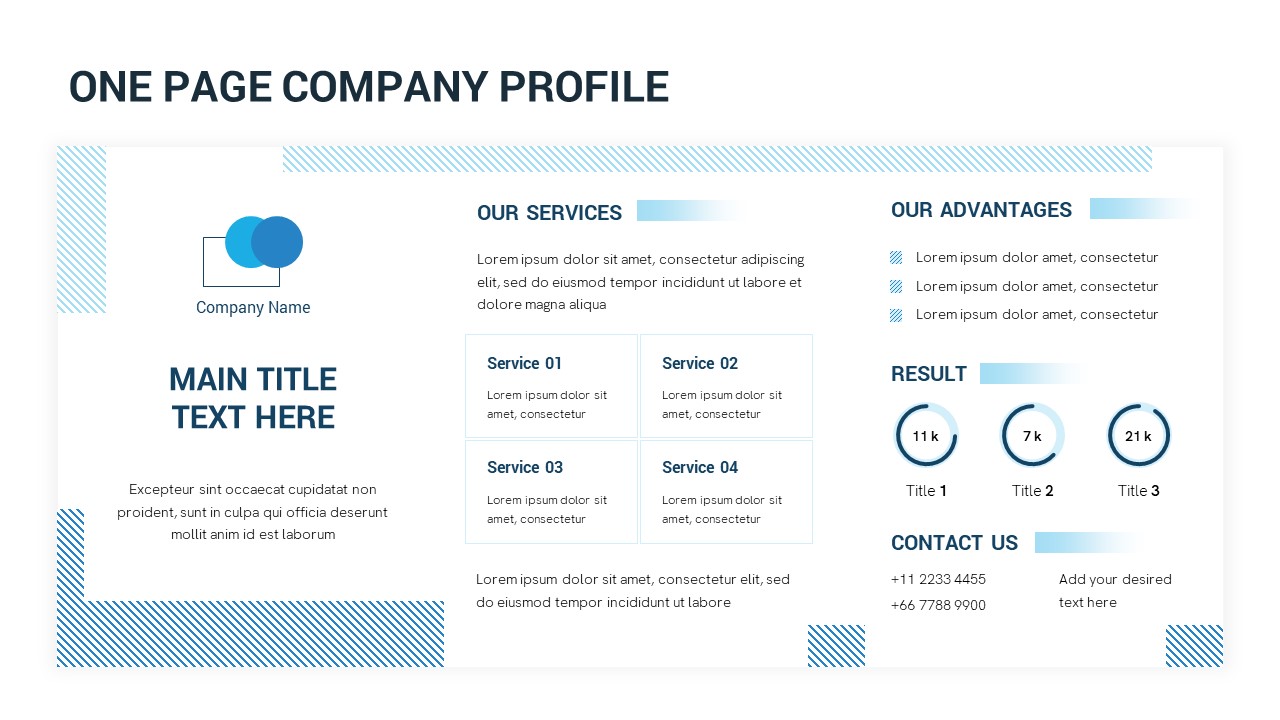
One-Page Company Profile Overview Template for PowerPoint & Google Slides
Company Profile
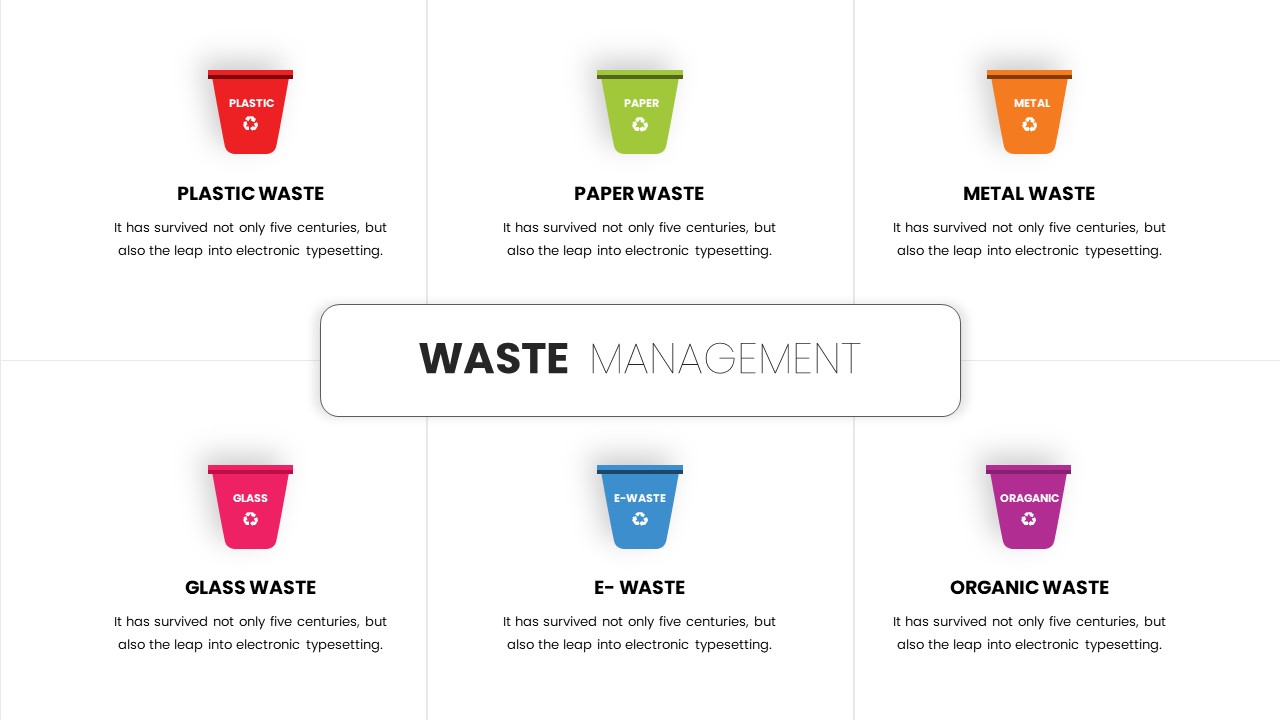
Six-Category Waste Management Overview Template for PowerPoint & Google Slides
Comparison
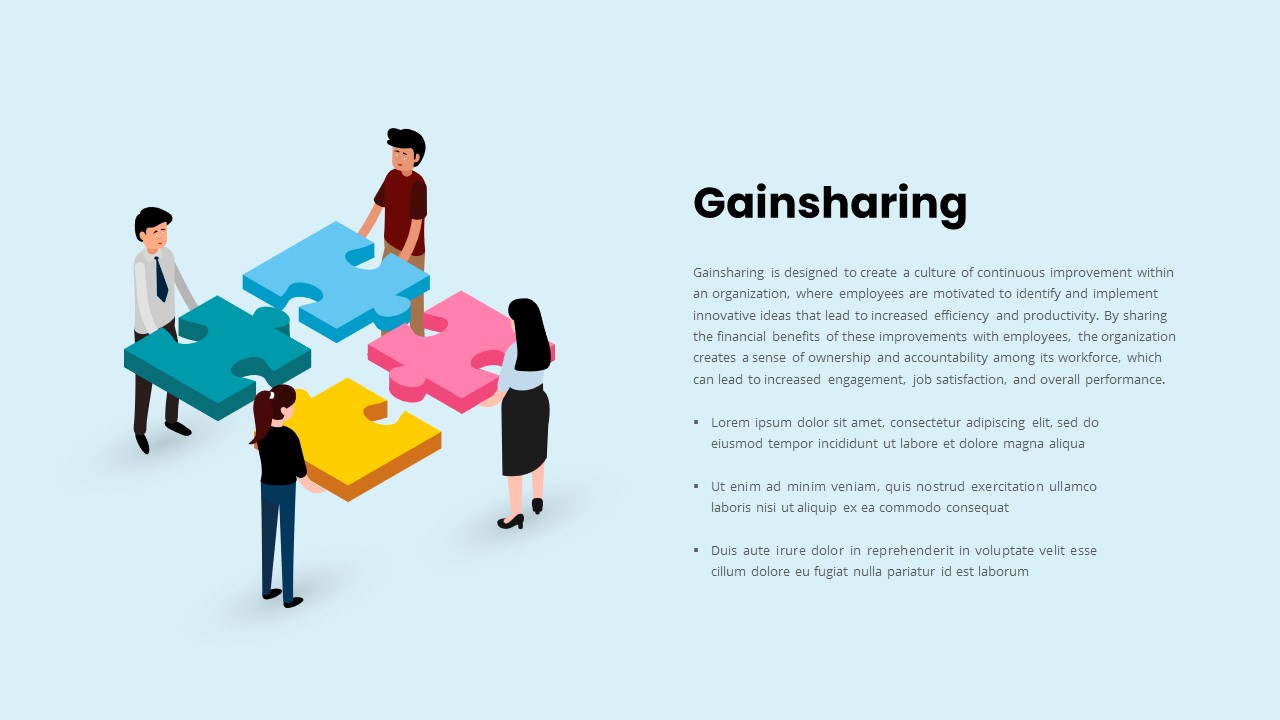
Gainsharing Culture Overview template for PowerPoint & Google Slides
Employee Performance
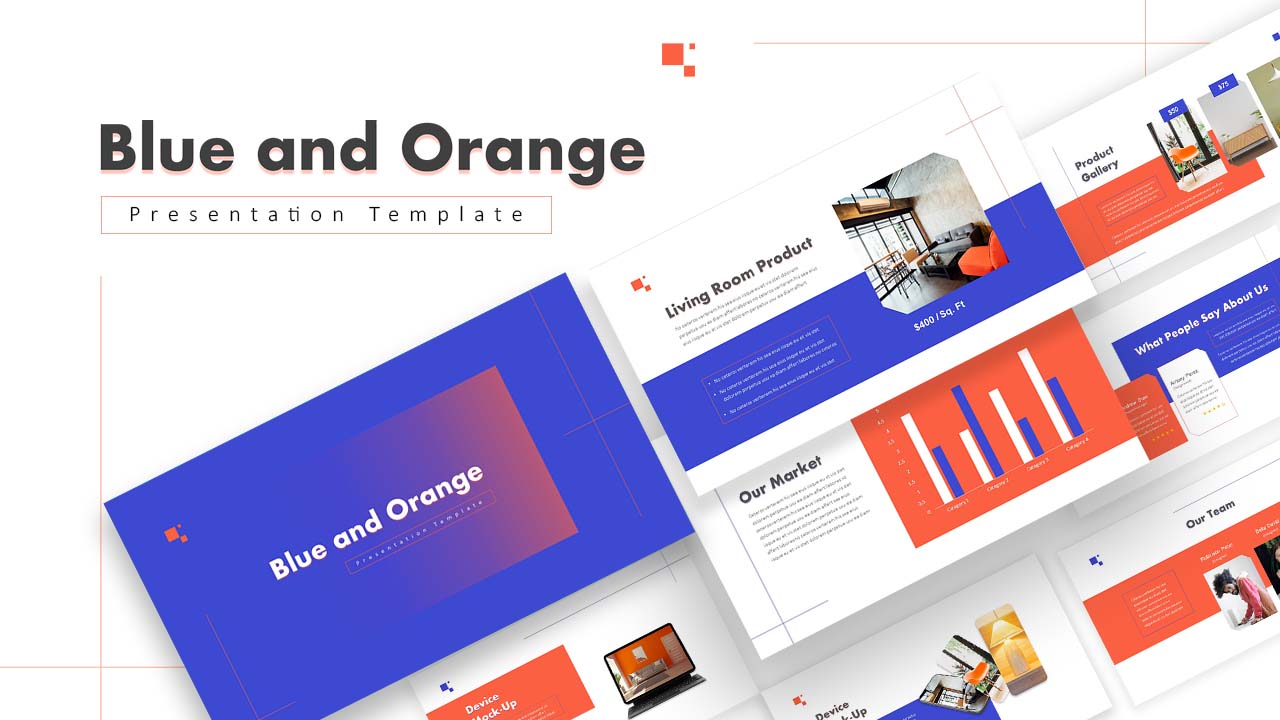
Blue and Orange Business Overview template for PowerPoint & Google Slides
Decks
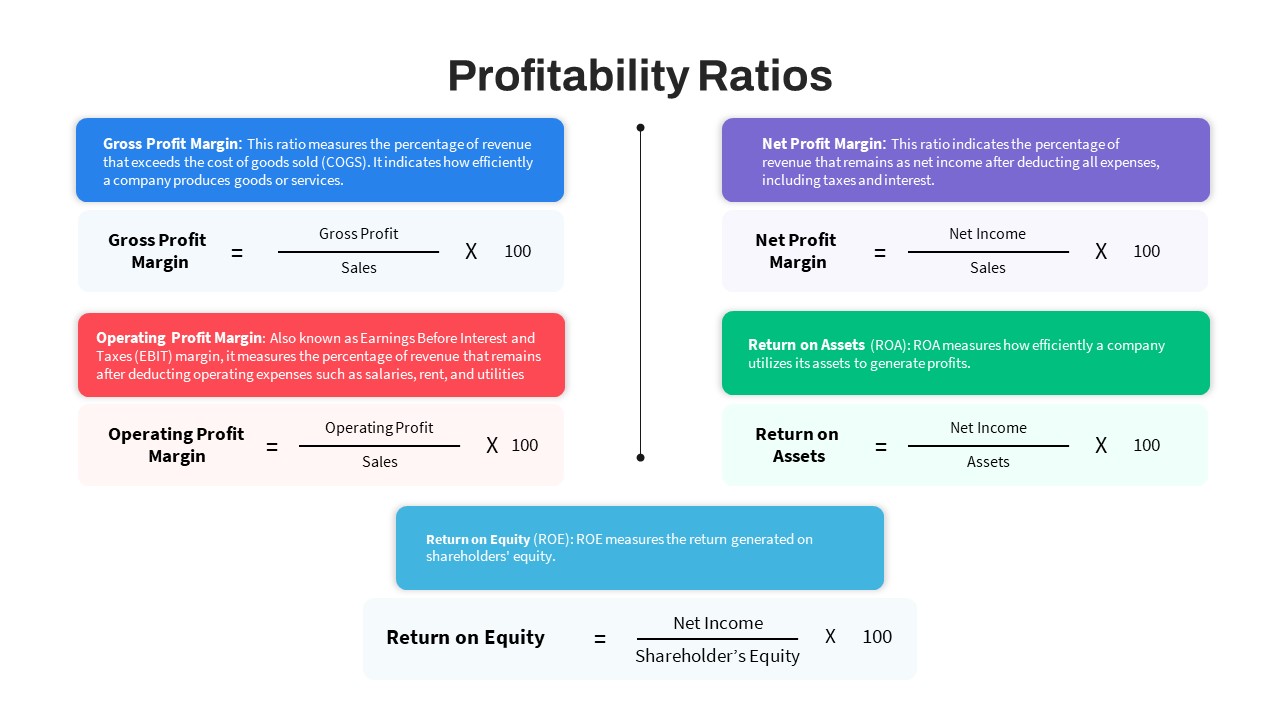
Profitability Ratios Formula Overview Template for PowerPoint & Google Slides
Revenue
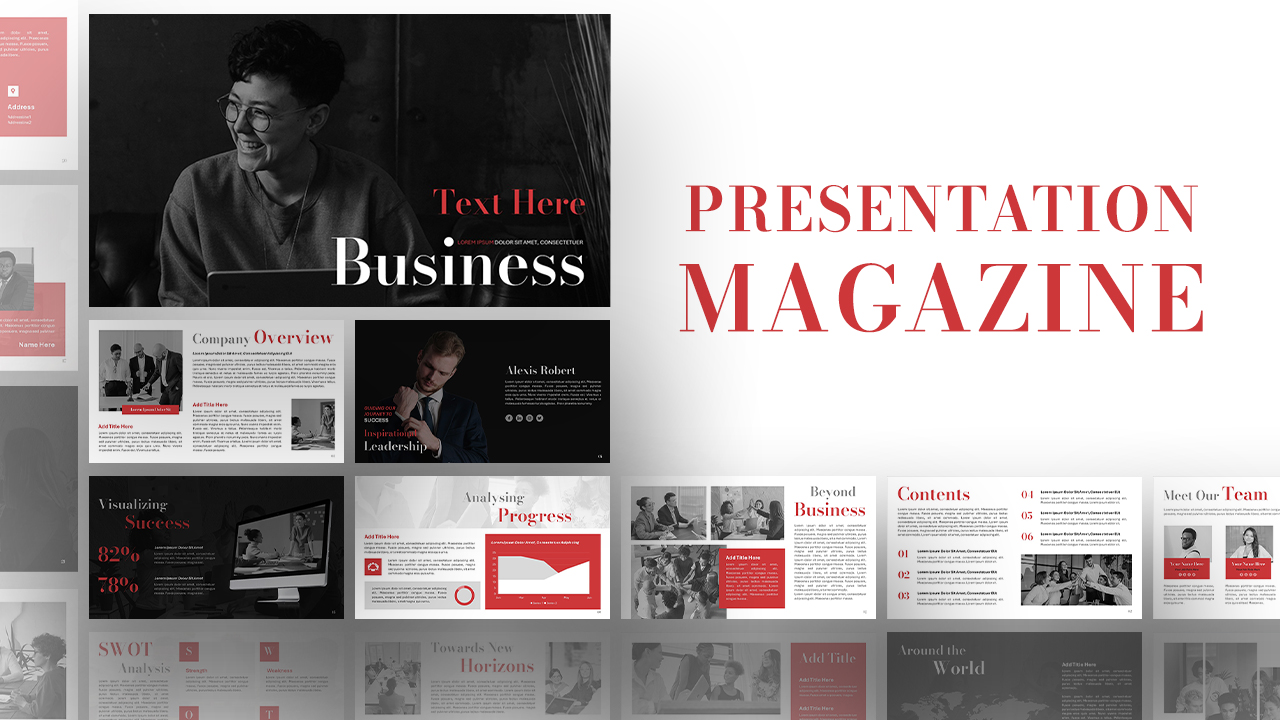
Presentation Magazine Company Overview Template for PowerPoint & Google Slides
Company Profile
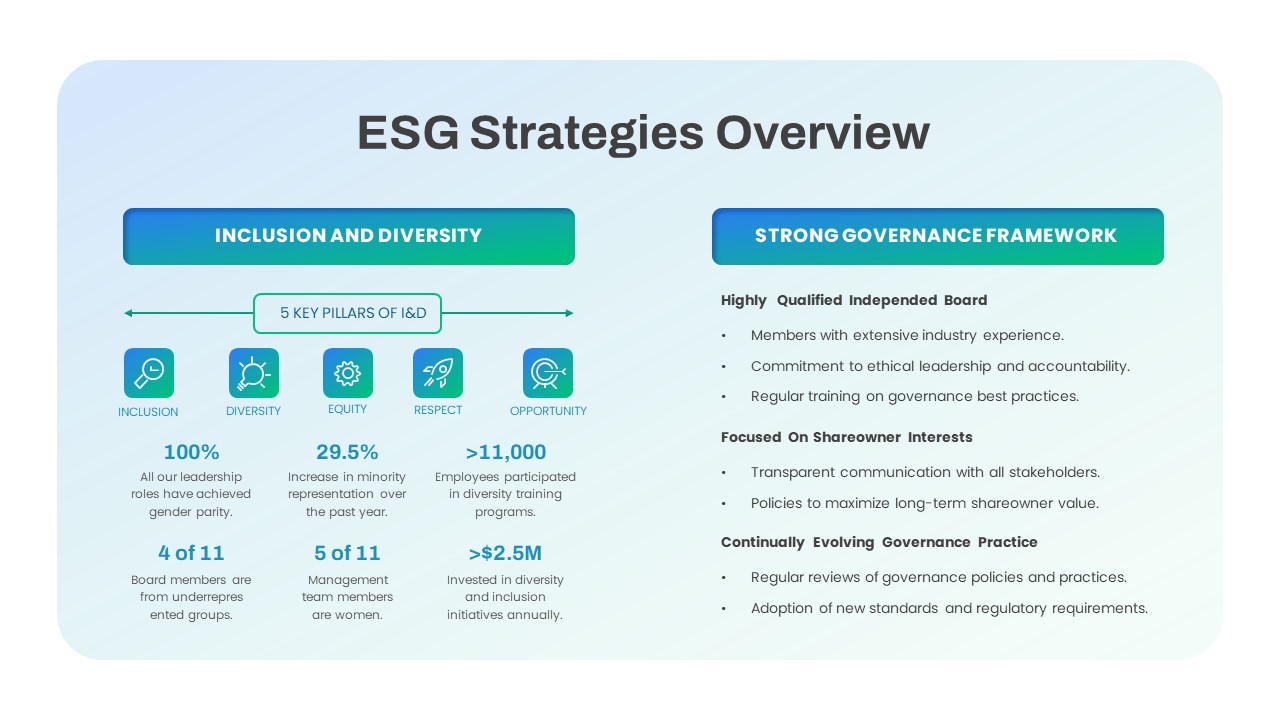
Comprehensive ESG Strategies Overview Template for PowerPoint & Google Slides
Infographics
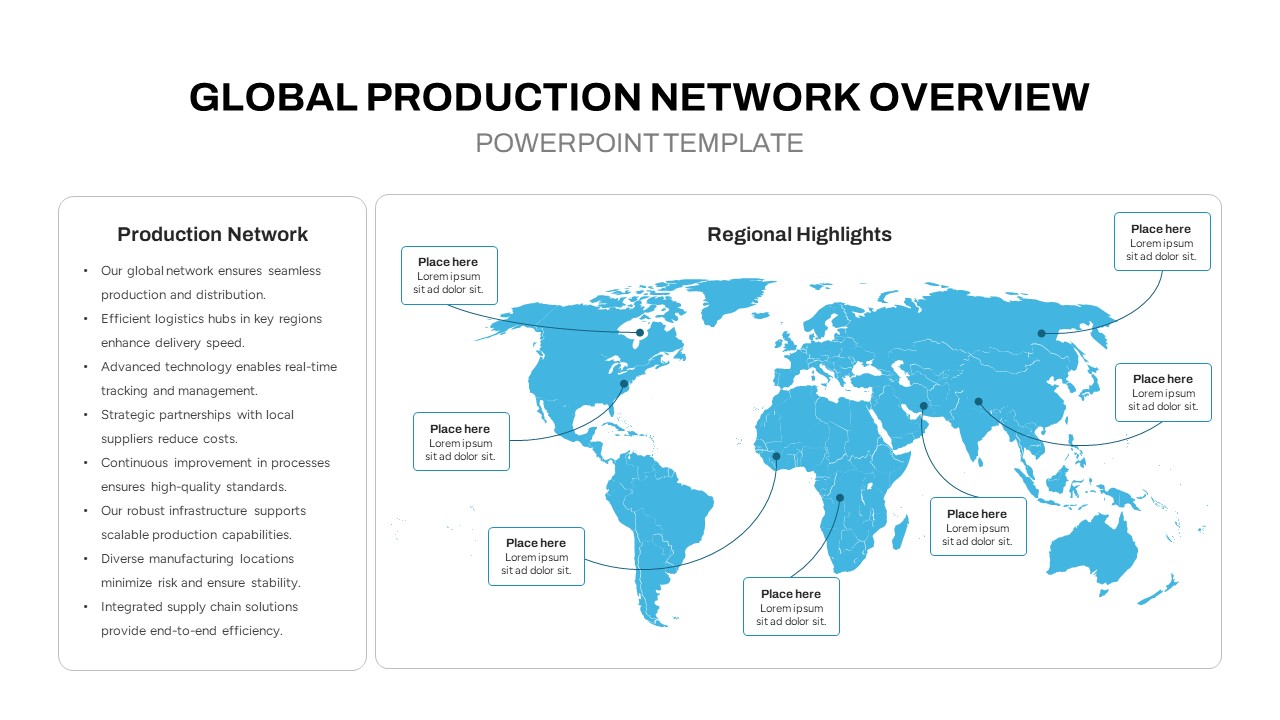
Global Production Network Overview Map Template for PowerPoint & Google Slides
World Maps
Market Validation Metrics Overview Template for PowerPoint & Google Slides
Business
Marketing Advertising Types Overview Template for PowerPoint & Google Slides
Advertising
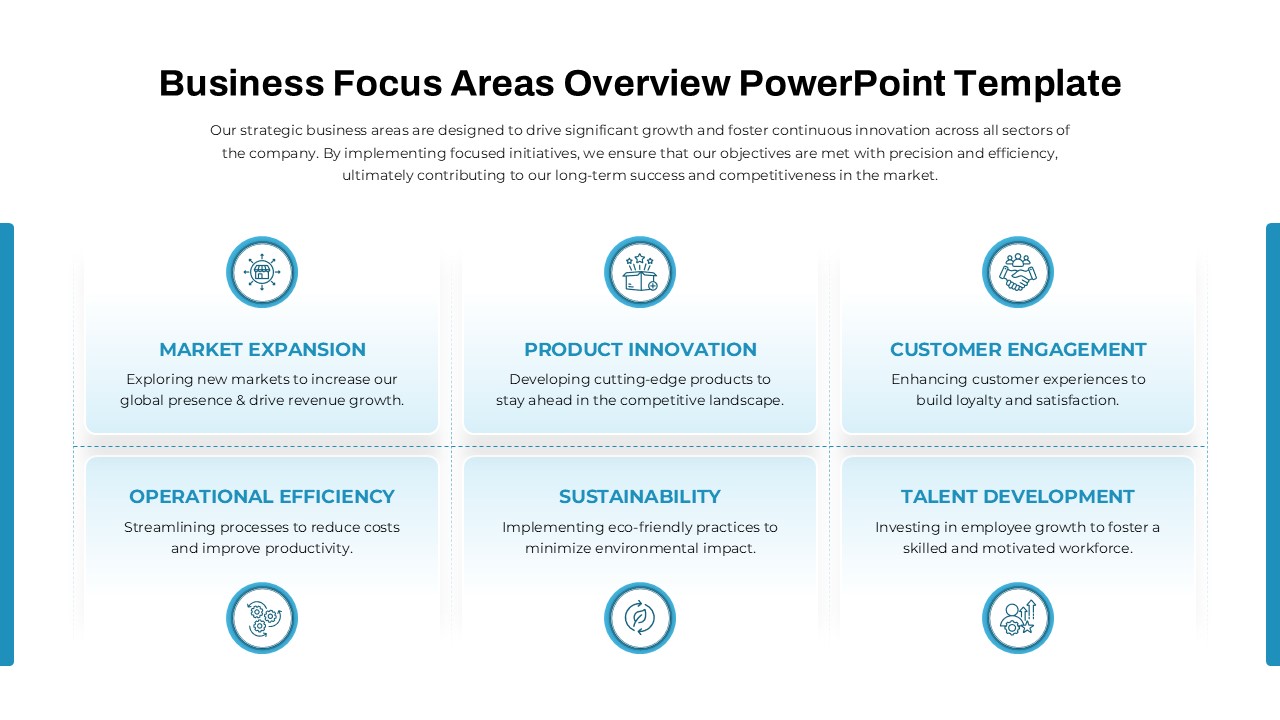
Business Focus Areas Overview Slide Template for PowerPoint & Google Slides
Business
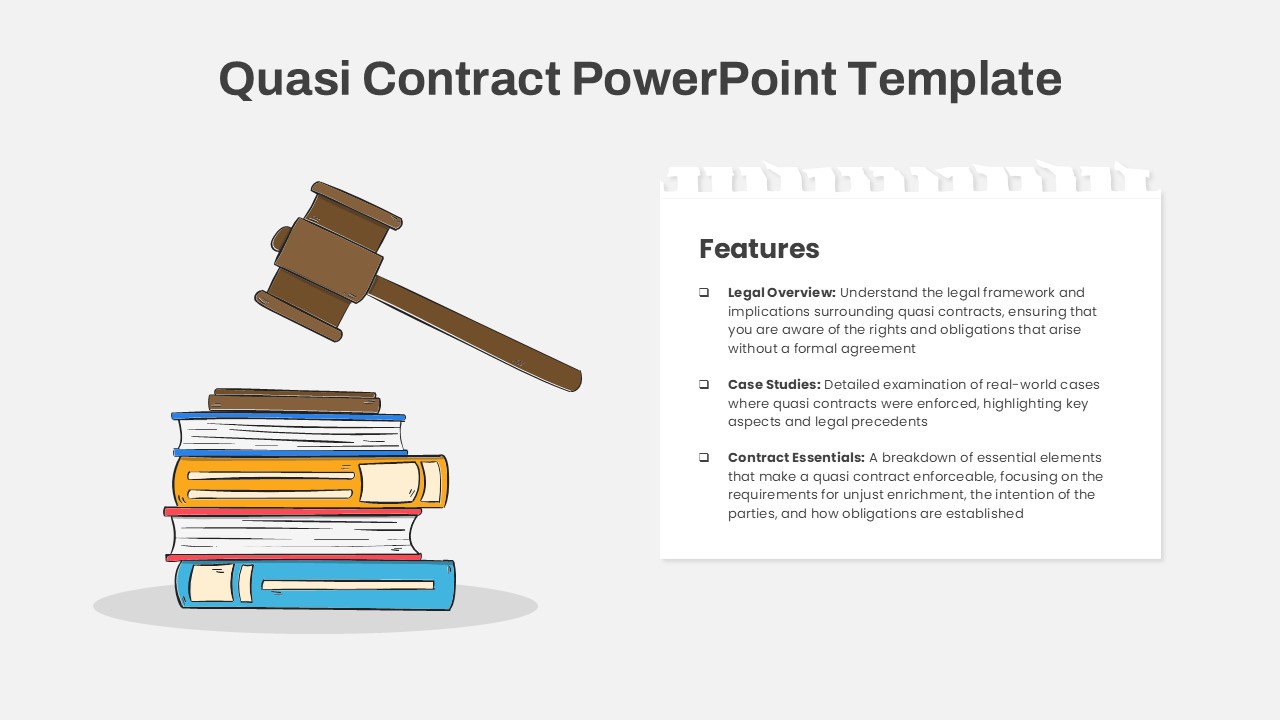
Quasi Contract Gavel & Books Overview Template for PowerPoint & Google Slides
Business Requirements
Drone Delivery Systems Overview Slide Template for PowerPoint & Google Slides
Business Models
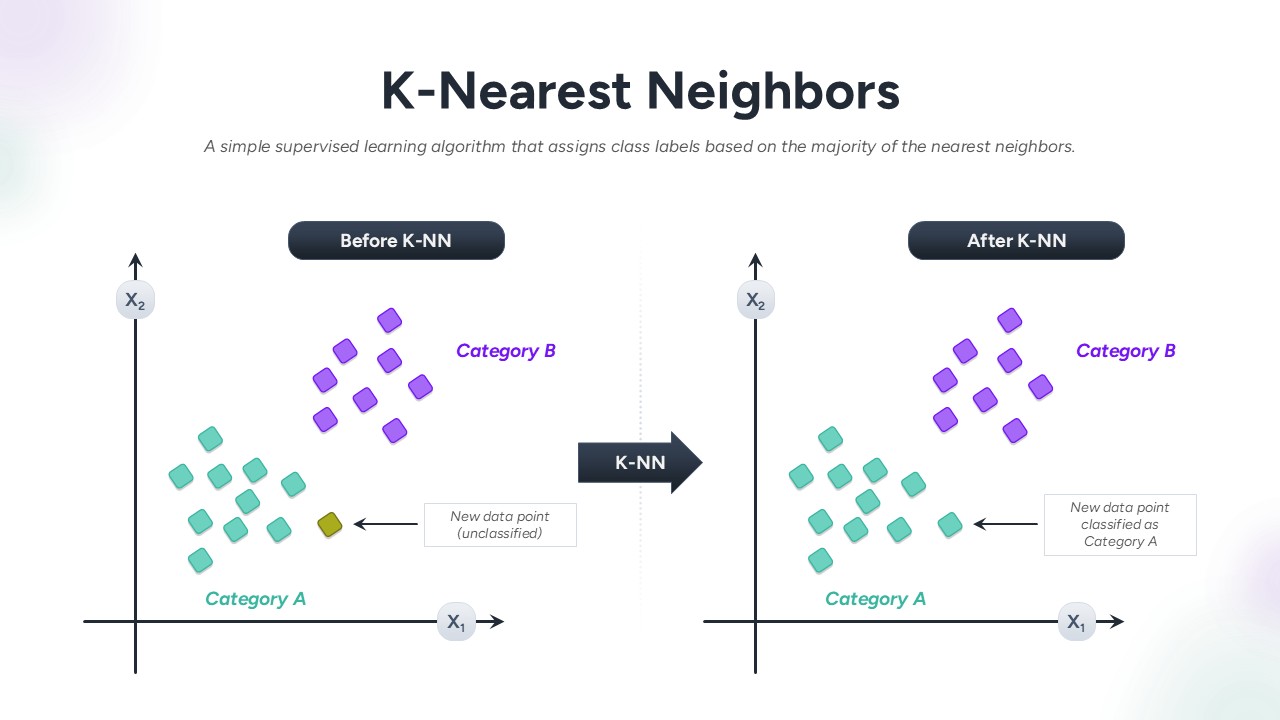
K-Nearest Neighbors Classification Overview template for PowerPoint & Google Slides
Technology
Technical Skills Donut Chart Overview Template for PowerPoint & Google Slides
HR
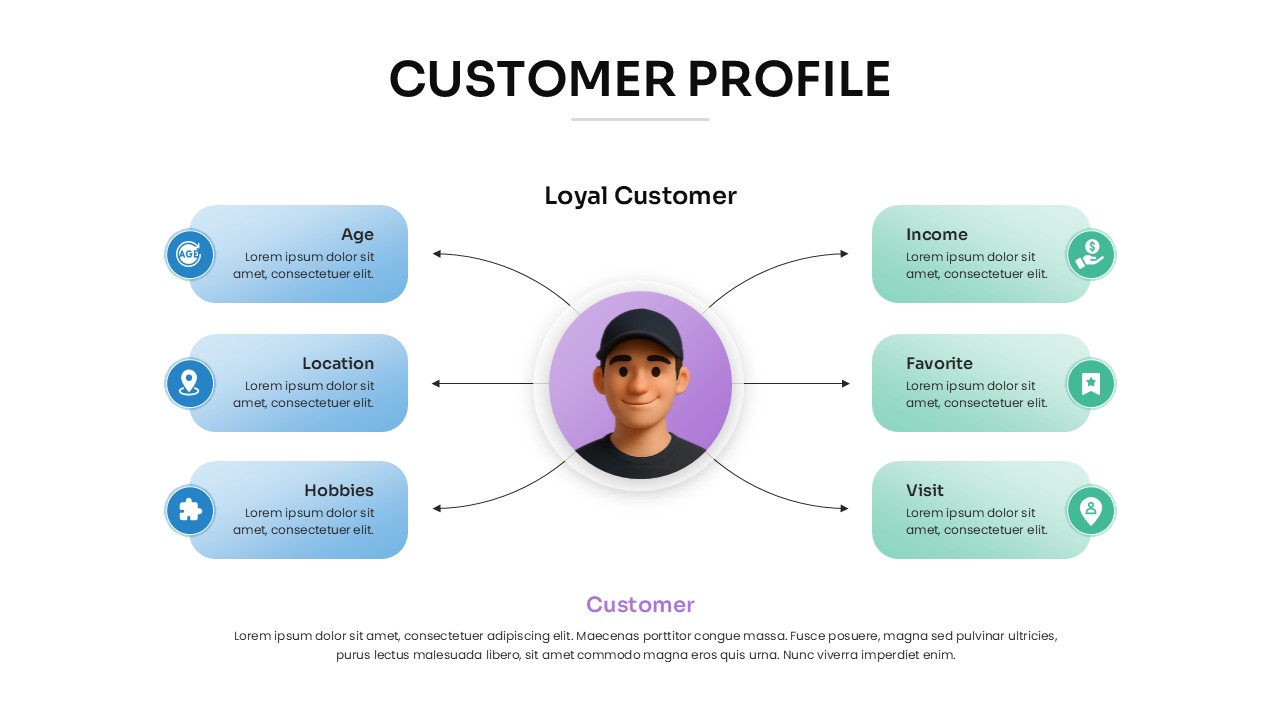
Customer Profile Overview Template for PowerPoint & Google Slides
Customer Journey
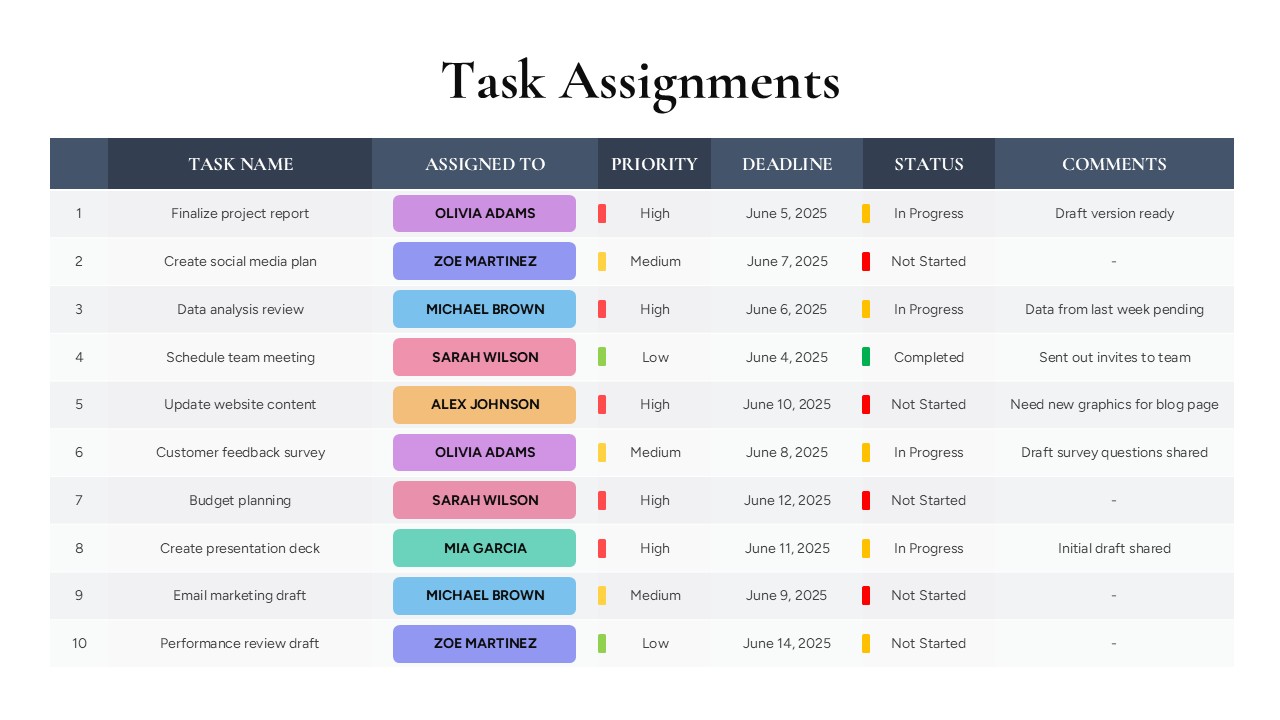
Task Assignments Overview template for PowerPoint & Google Slides
Business
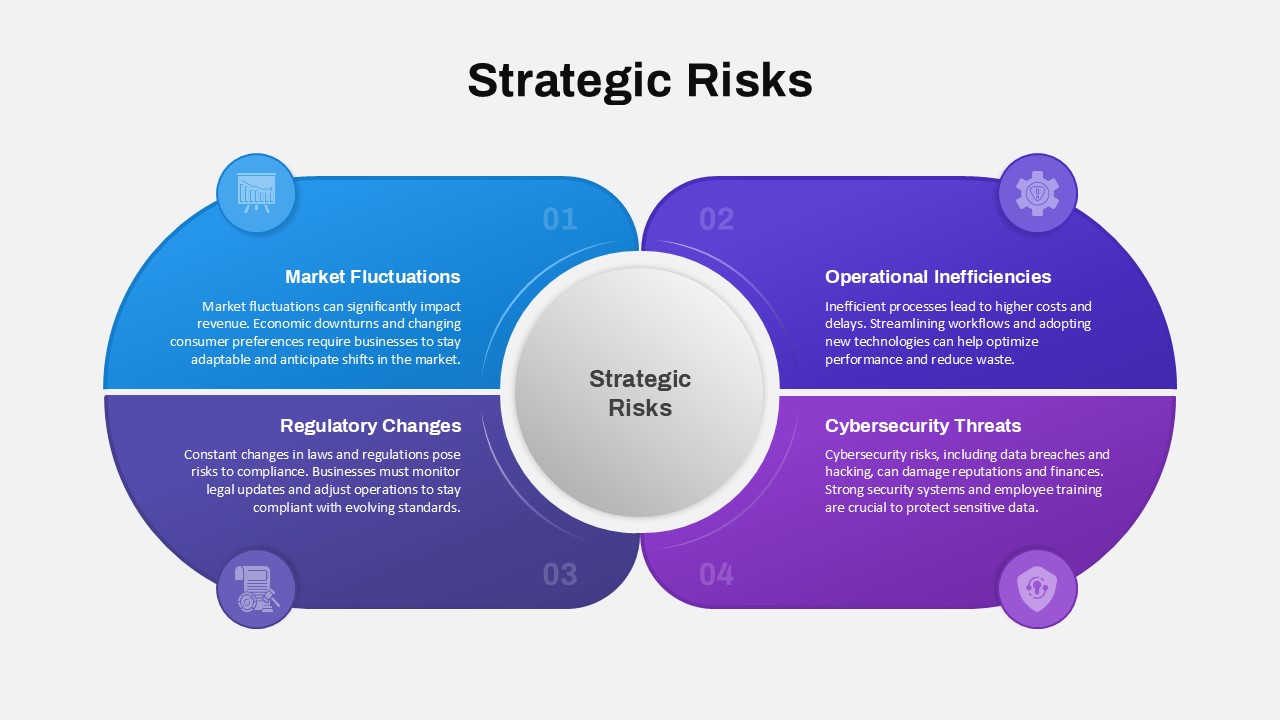
Strategic Risks Overview template for PowerPoint & Google Slides
Risk Management
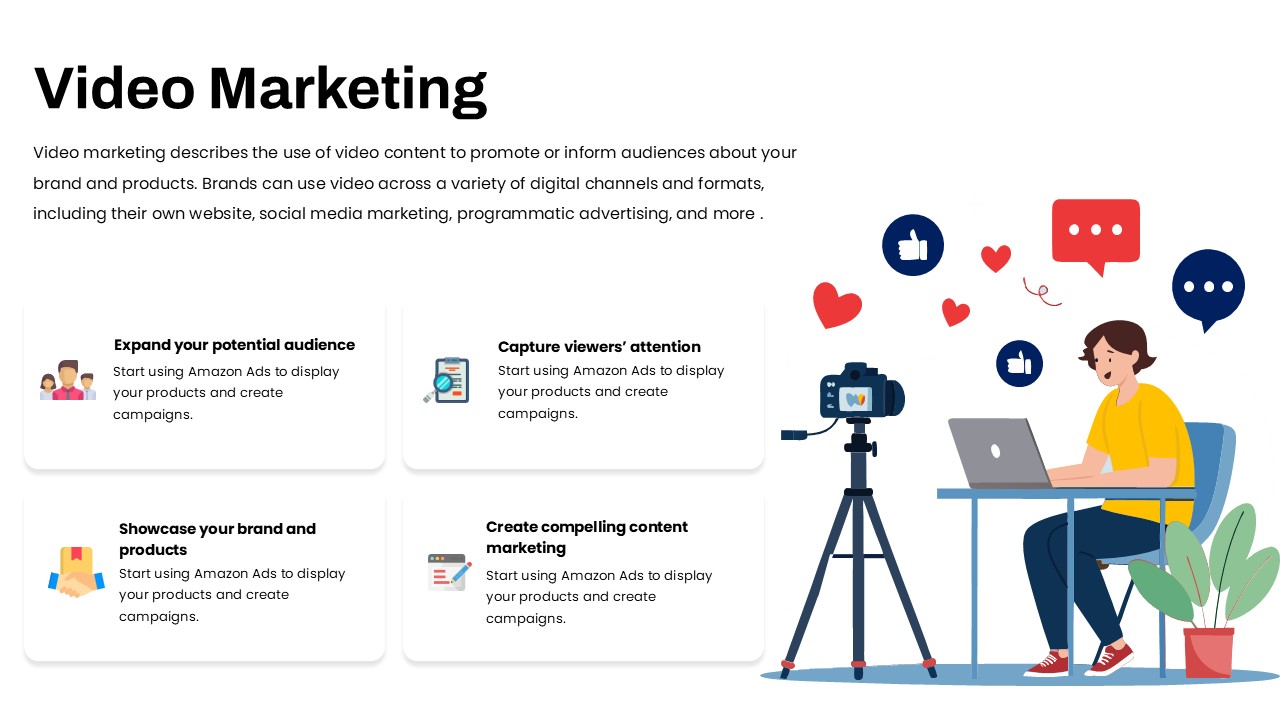
Video Marketing Overview template for PowerPoint & Google Slides
Digital Marketing
Team Gantt Chart Overview template for PowerPoint & Google Slides
Project Status
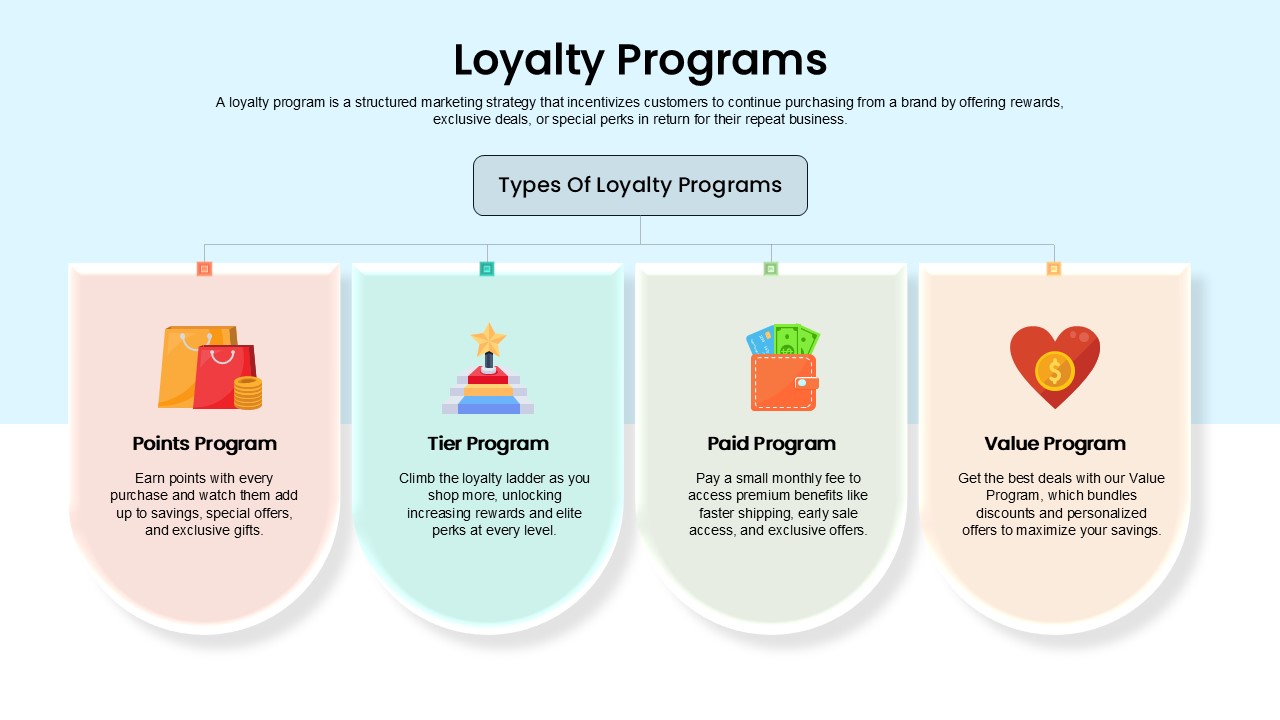
Loyalty Programs Overview template for PowerPoint & Google Slides
Business
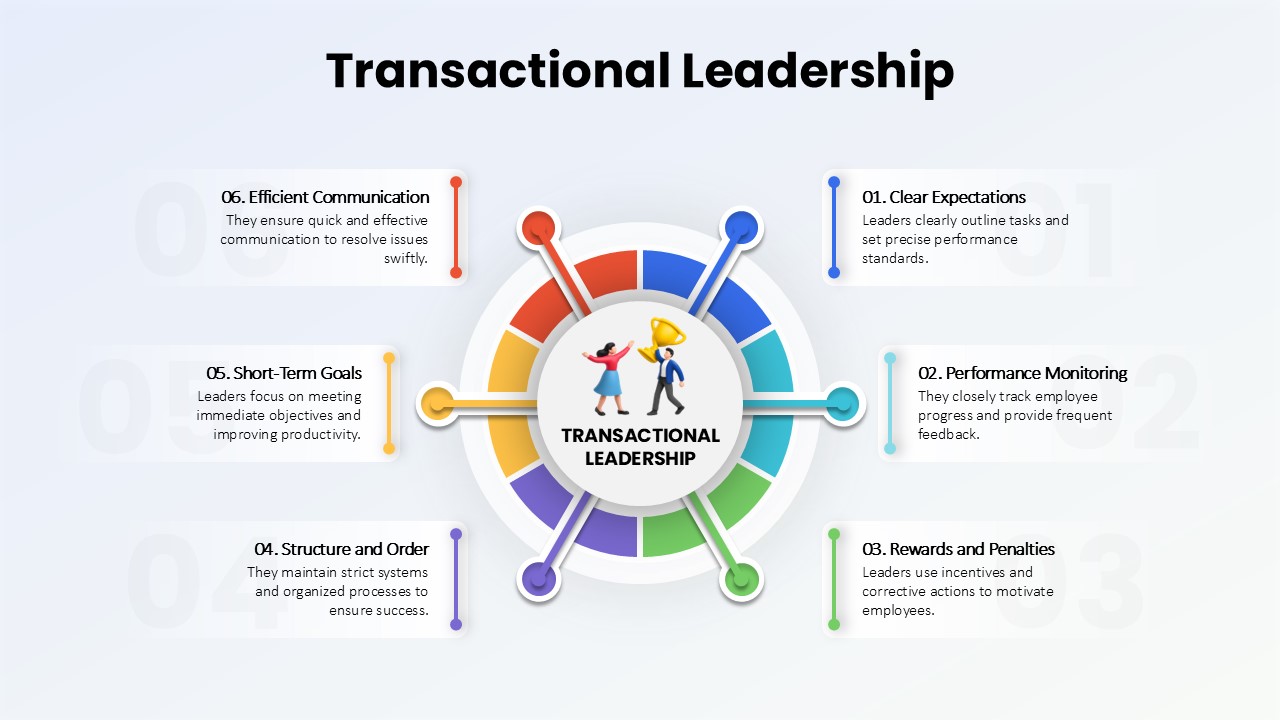
Transactional Leadership Overview template for PowerPoint & Google Slides
Process
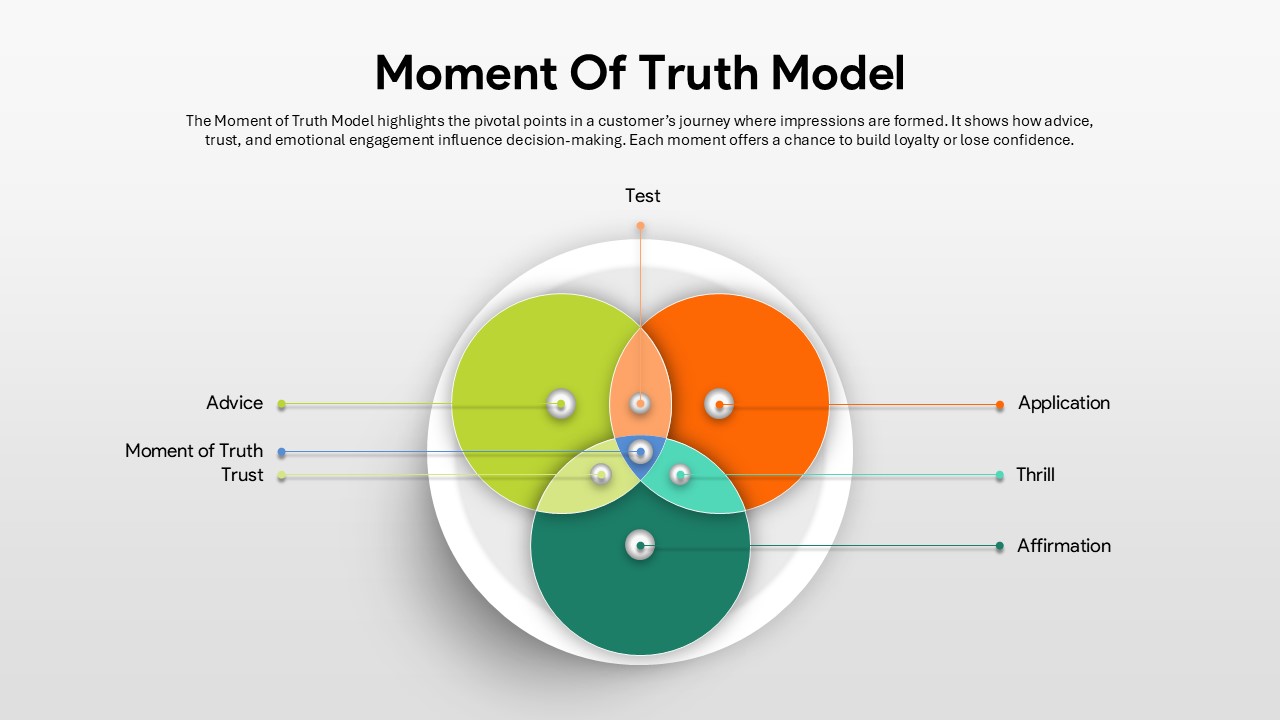
Moment of Truth Model Overview template for PowerPoint & Google Slides
Process
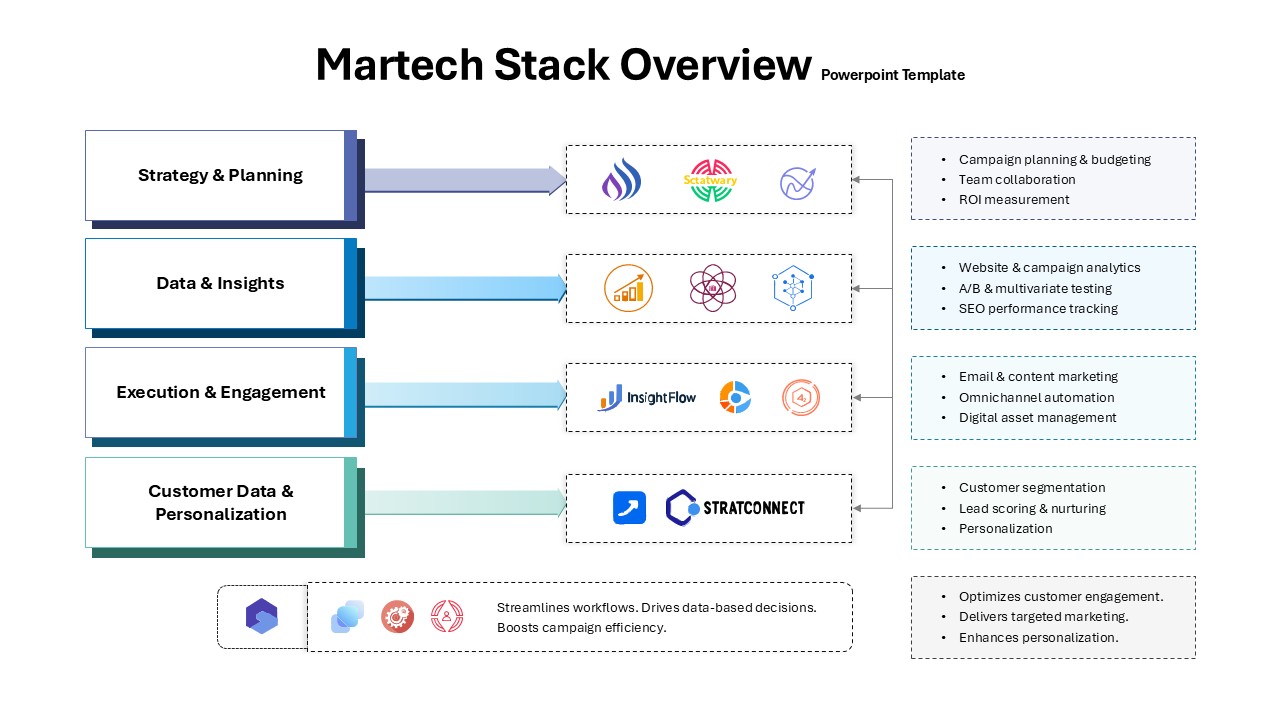
Martech Stack Overview Template for PowerPoint & Google Slides
Information Technology
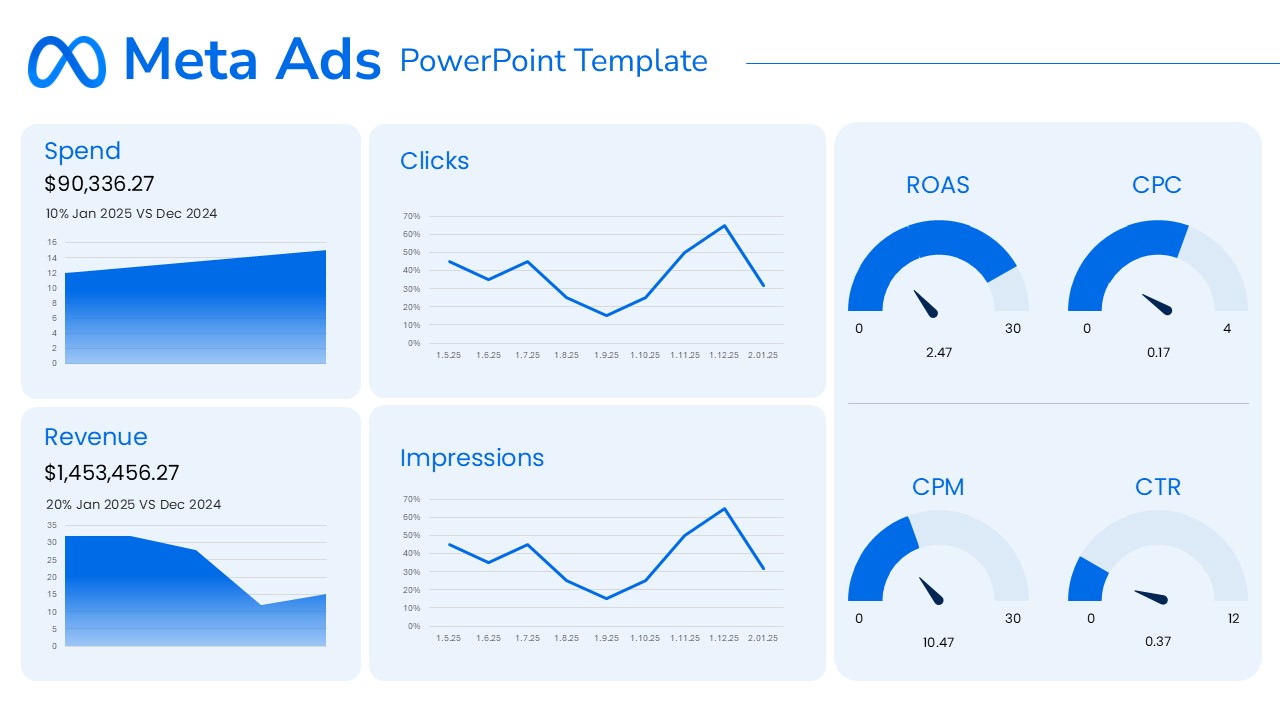
Meta Ads Performance Overview template for PowerPoint & Google Slides
Advertising
Artificial General Intelligence Overview Template for PowerPoint & Google Slides
AI
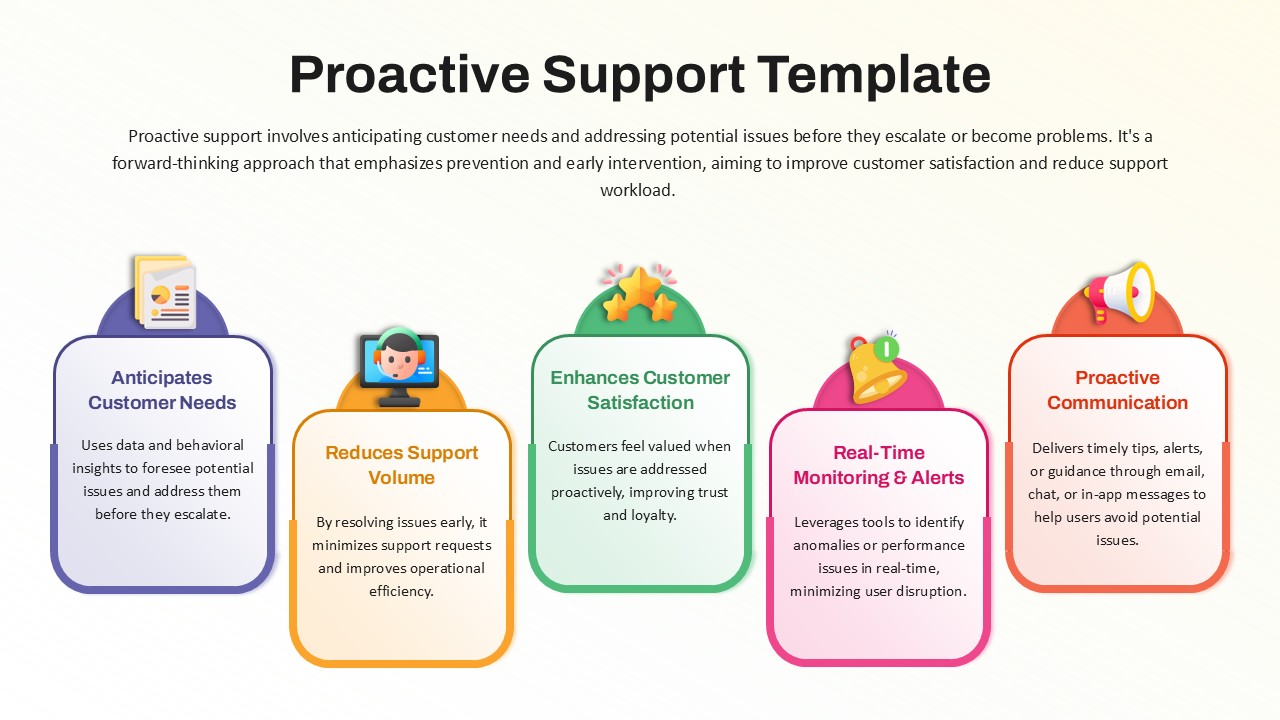
Proactive Support Overview template for PowerPoint & Google Slides
Business
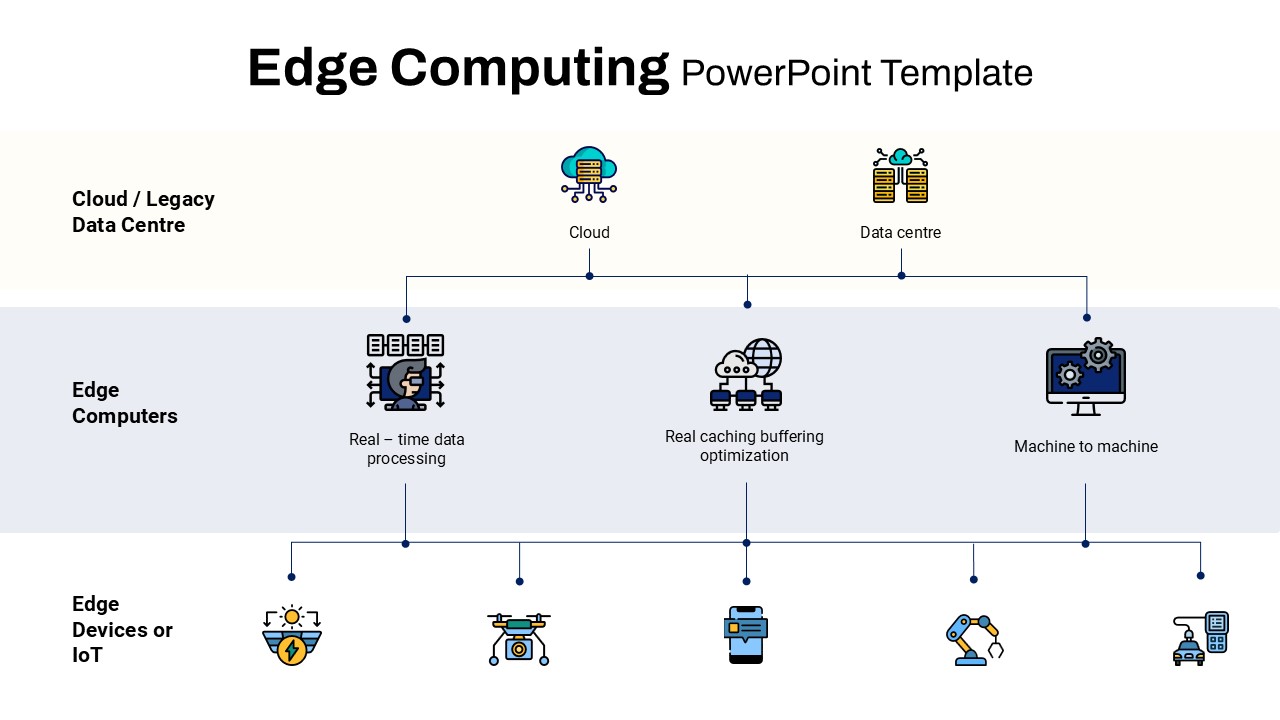
Edge Computing Overview template for PowerPoint & Google Slides
Technology
Social Media Marketing Overview Template for PowerPoint & Google Slides
Advertising
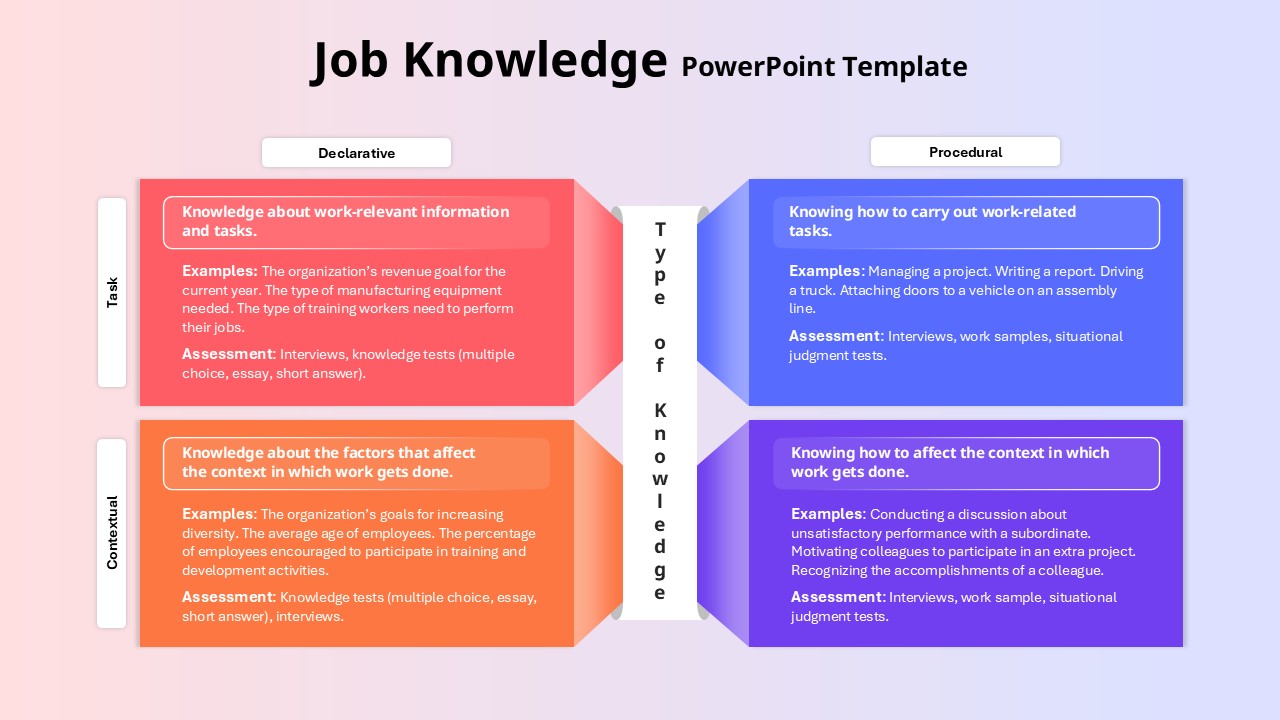
Job Knowledge Overview template for PowerPoint & Google Slides
Business
Networking Security overview template for PowerPoint & Google Slides
Technology
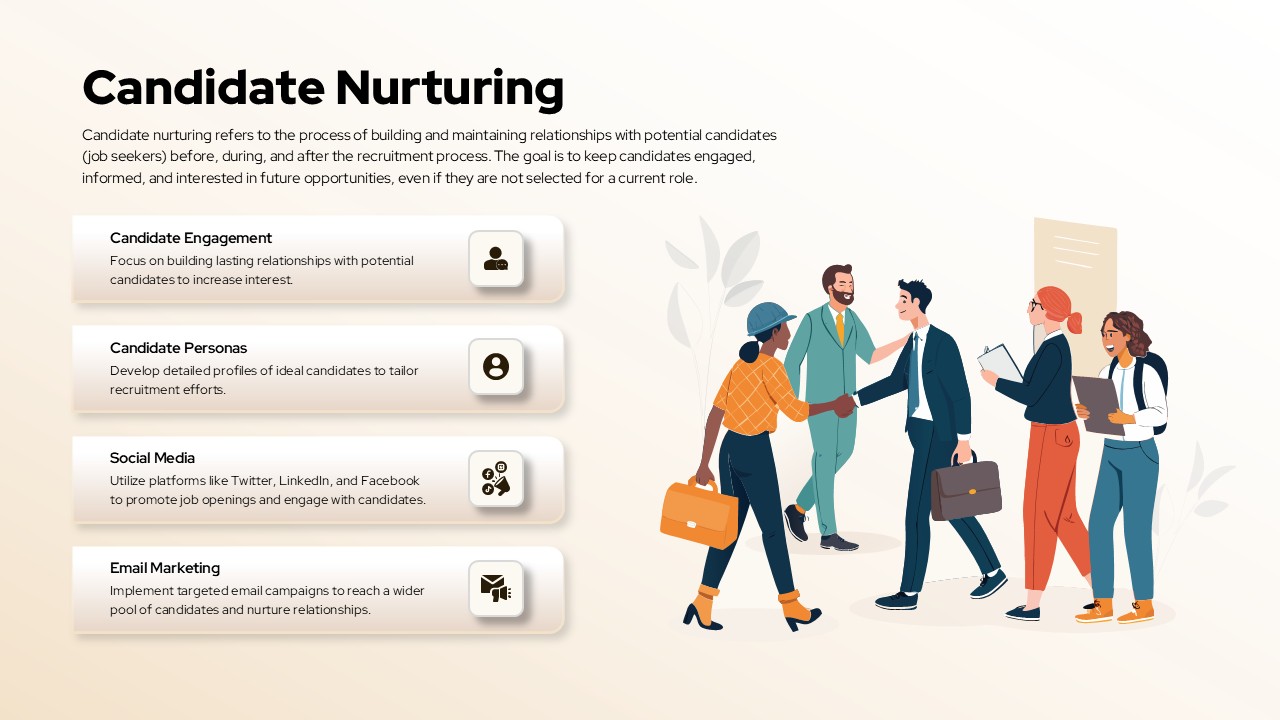
Candidate Nurturing Strategy Overview template for PowerPoint & Google Slides
Recruitment
Pediatric Health Services Overview Template for PowerPoint & Google Slides
Health
Static Gantt Chart Overview template for PowerPoint & Google Slides
Project Status
Account Overview Dashboard template for PowerPoint & Google Slides
Business
Fall Theme Business Overview template for PowerPoint & Google Slides
Decks
Machine Learning Overview Slide Template for PowerPoint & Google Slides
Machine Learning
Machine Learning Pipeline Overview Template for PowerPoint & Google Slides
Machine Learning
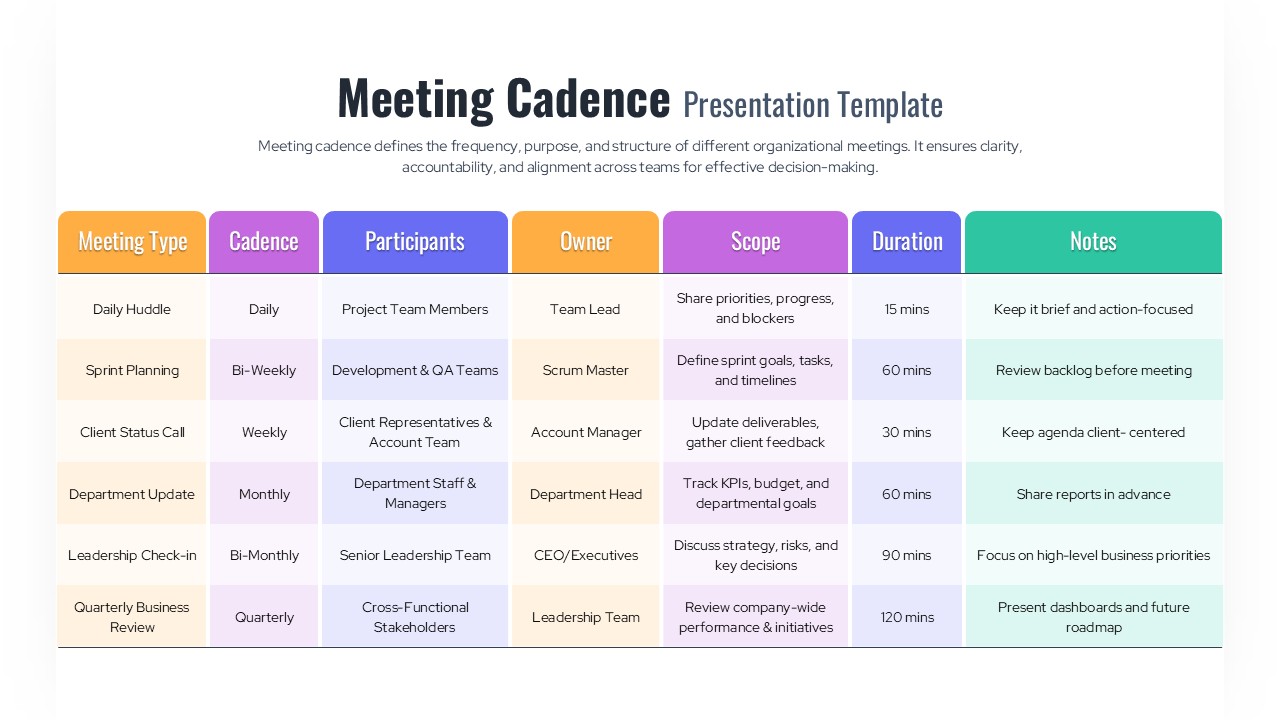
Meeting Cadence Schedule Overview Template for PowerPoint & Google Slides
Leadership
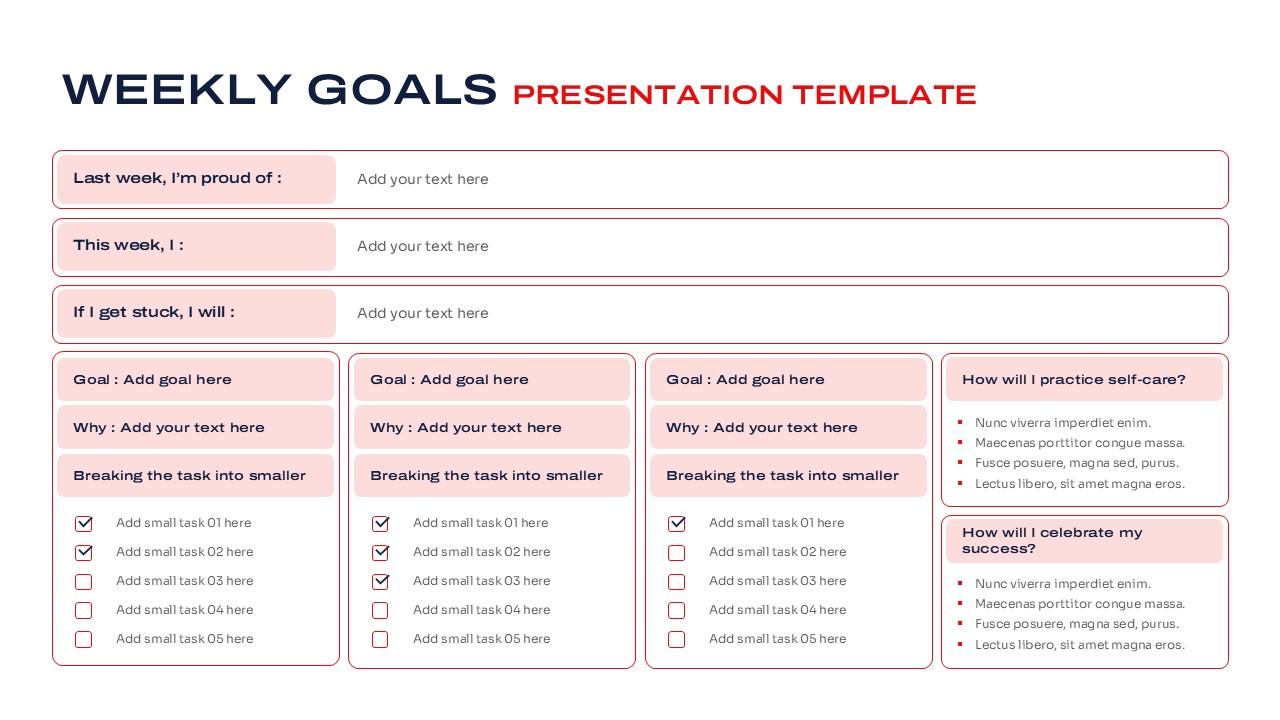
Weekly Goals Planning and Productivity Overview Template for PowerPoint & Google Slides
Goals