K-Nearest Neighbors Classification Overview template for PowerPoint & Google Slides
Description
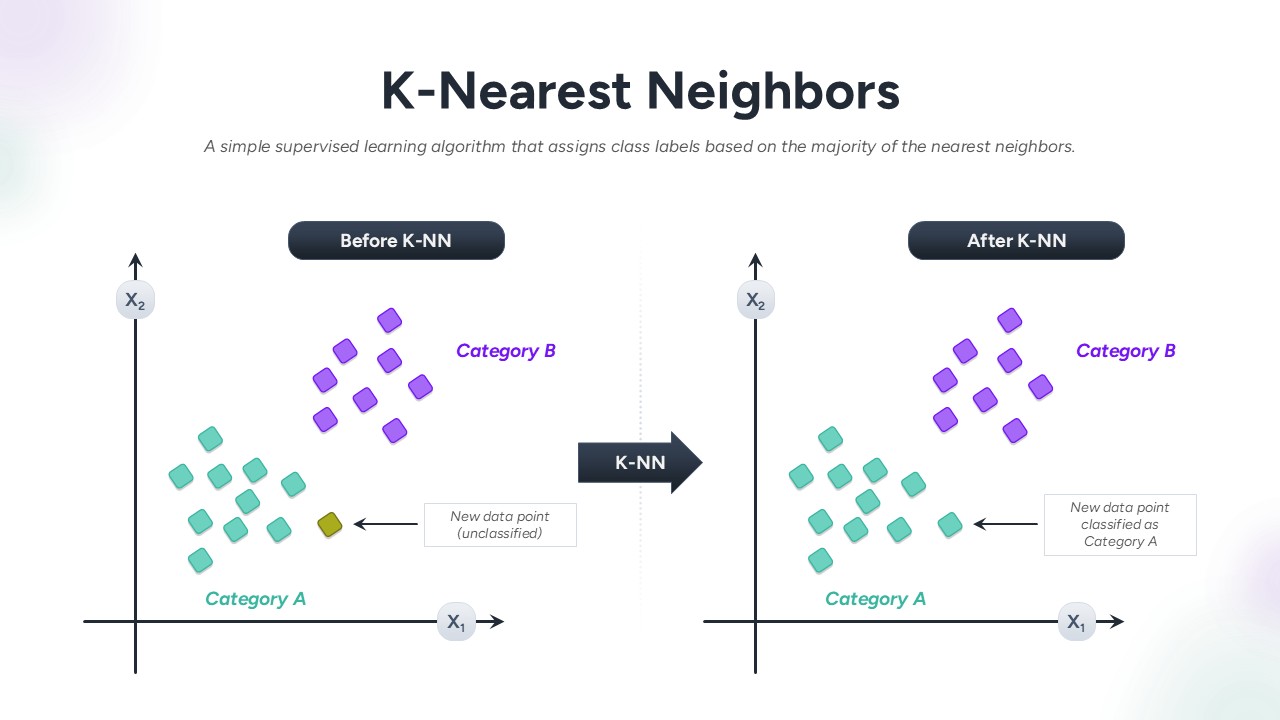
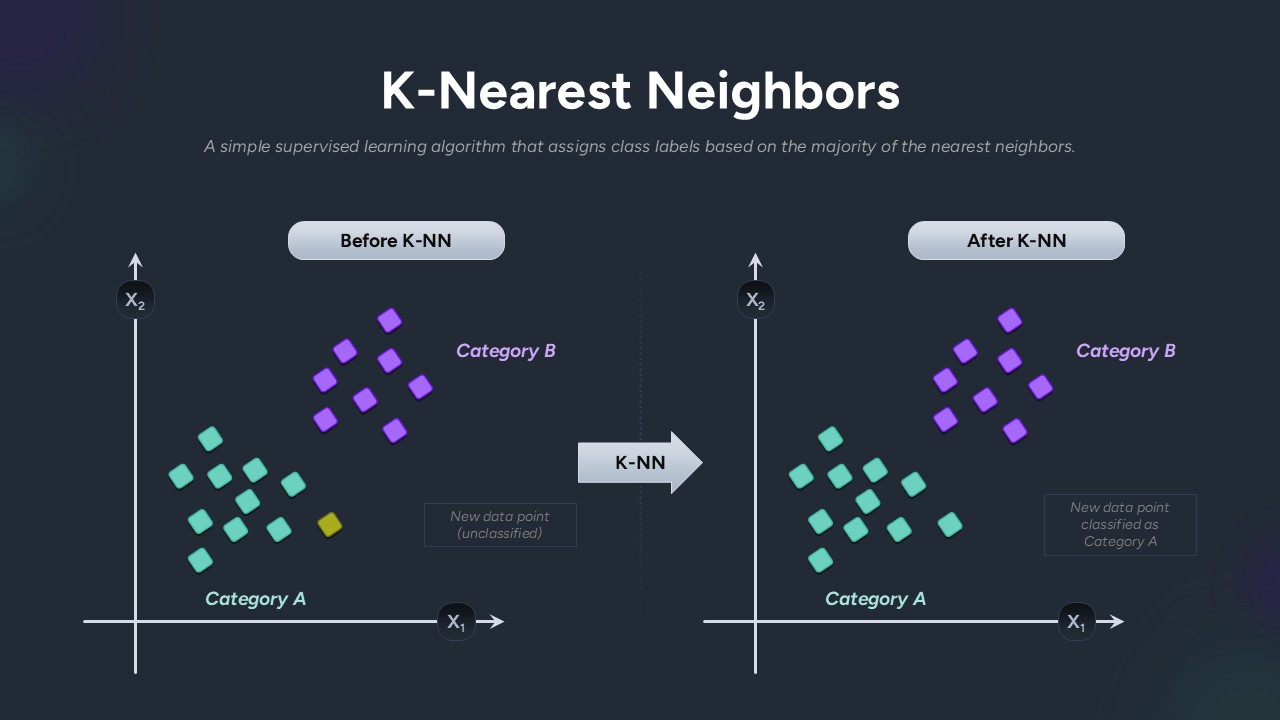
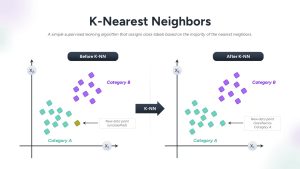
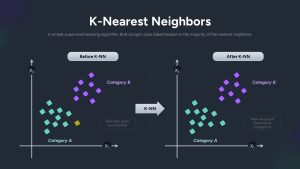
This slide explains the K-Nearest Neighbors (K-NN) classification algorithm, a fundamental supervised learning technique used in data science and machine learning. The slide visually compares the scenario before and after applying the K-NN algorithm. On the left, a data point is unclassified, positioned among two distinct categories (A and B), while on the right, the same point is classified based on its proximity to the majority of nearest neighbors. The clean, minimalist design highlights the categorization process, making it easier for audiences to understand the algorithm’s concept.
The graph uses color-coded markers for Category A (green) and Category B (purple), with a distinct new data point (yellow) placed at the center. An arrow points to the newly classified category, demonstrating how the K-NN algorithm assigns labels based on the closest data points. This simple and intuitive illustration, supported by clear axis labels and an explanatory title, provides a straightforward explanation of this machine learning technique.
This slide is customizable and ideal for presentations in data science, machine learning workshops, educational contexts, or corporate tech meetings. It aids in simplifying complex algorithms for an audience and is compatible with both PowerPoint and Google Slides for easy integration into presentations.
Who is it for
This slide is ideal for data scientists, machine learning engineers, and educators explaining K-NN classification to students, colleagues, or clients. It’s also suitable for business professionals looking to integrate machine learning concepts into strategic discussions or product development.
Other Uses
Besides explaining K-NN, this slide can be used in presentations about other classification algorithms, such as decision trees or logistic regression. It can also be adapted to visualize any supervised learning process that involves grouping or categorization based on proximity. The visual structure is flexible enough for explaining clustering techniques or any scenario requiring data point classification.
Login to download this file

Item ID
SB05078


Related Templates

Classification in Supervised Learning template for PowerPoint & Google Slides
Infographics
Classification Vs Regression Comparison Diagram
Machine Learning
APQC Process Classification Framework Template
Process
Types of AI Classification Hierarchy Template
AI
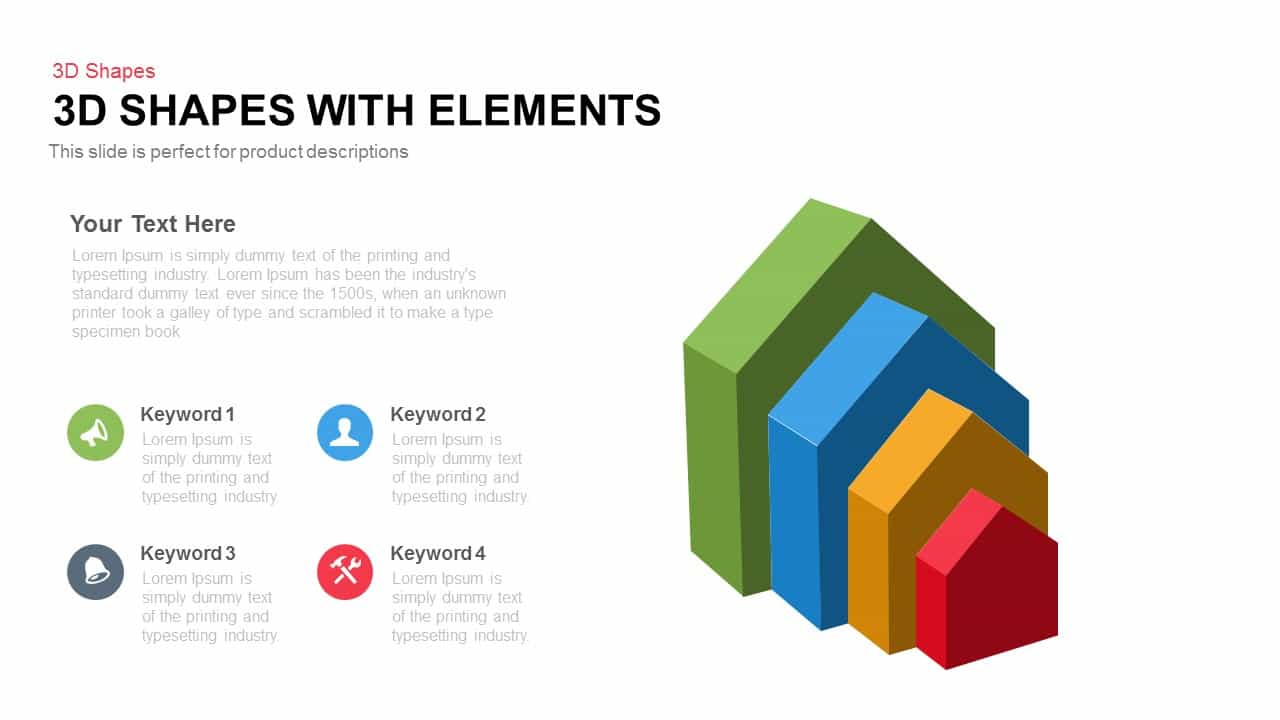
3D Shapes Overview Template for PowerPoint & Google Slides
Process
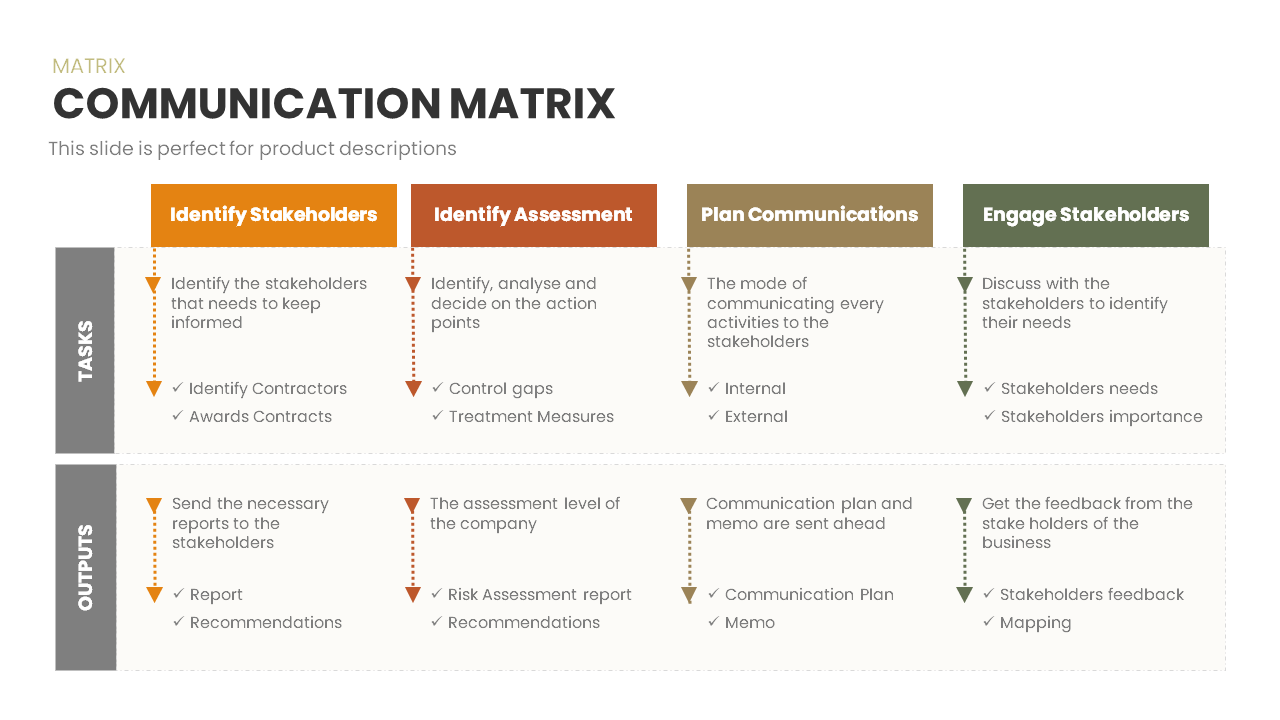
Communication Matrix Overview Template for PowerPoint & Google Slides
Business
Project Charter Overview template for PowerPoint & Google Slides
Business Plan
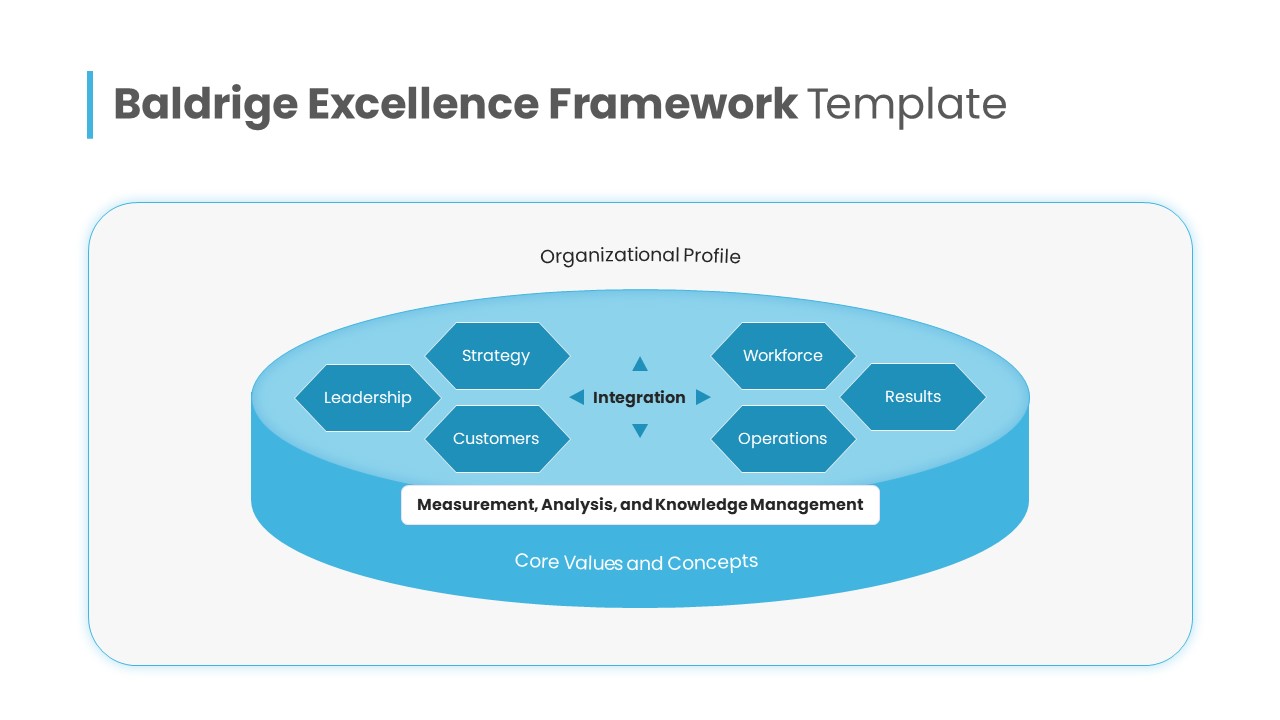
Baldrige Excellence Framework Overview Template for PowerPoint & Google Slides
Leadership
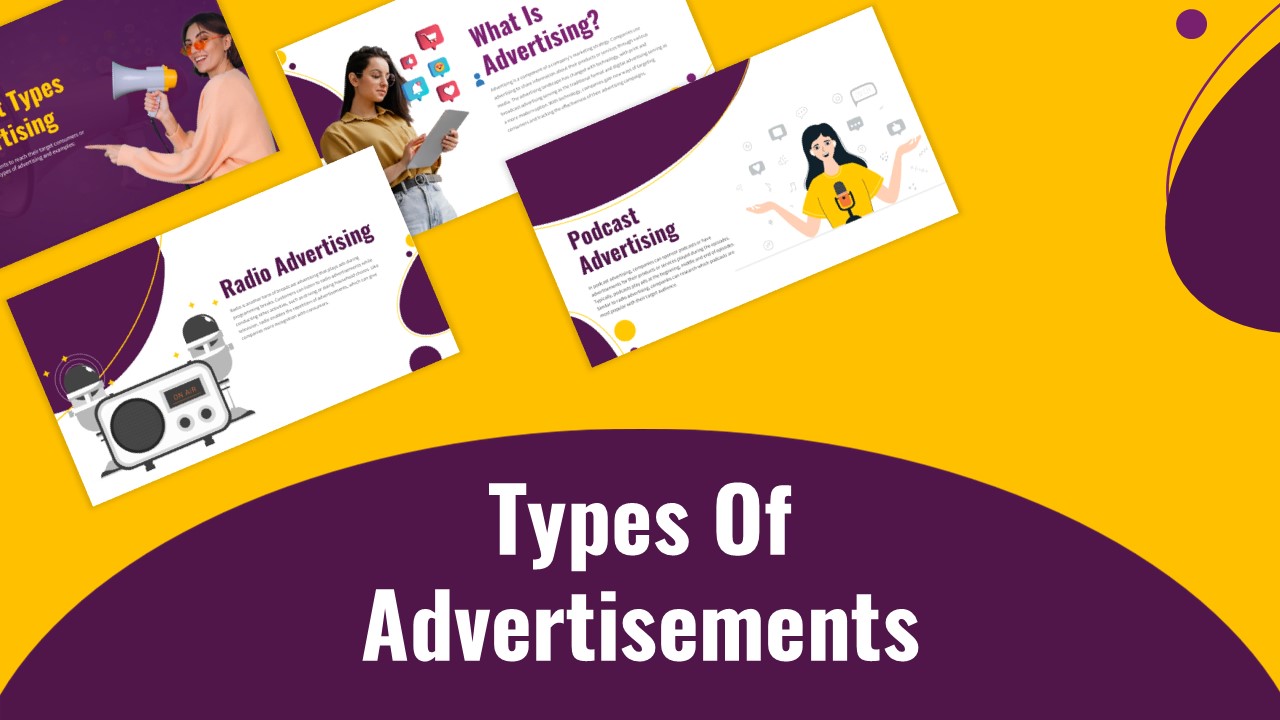
Marketing Advertising Types Overview Template for PowerPoint & Google Slides
Advertising
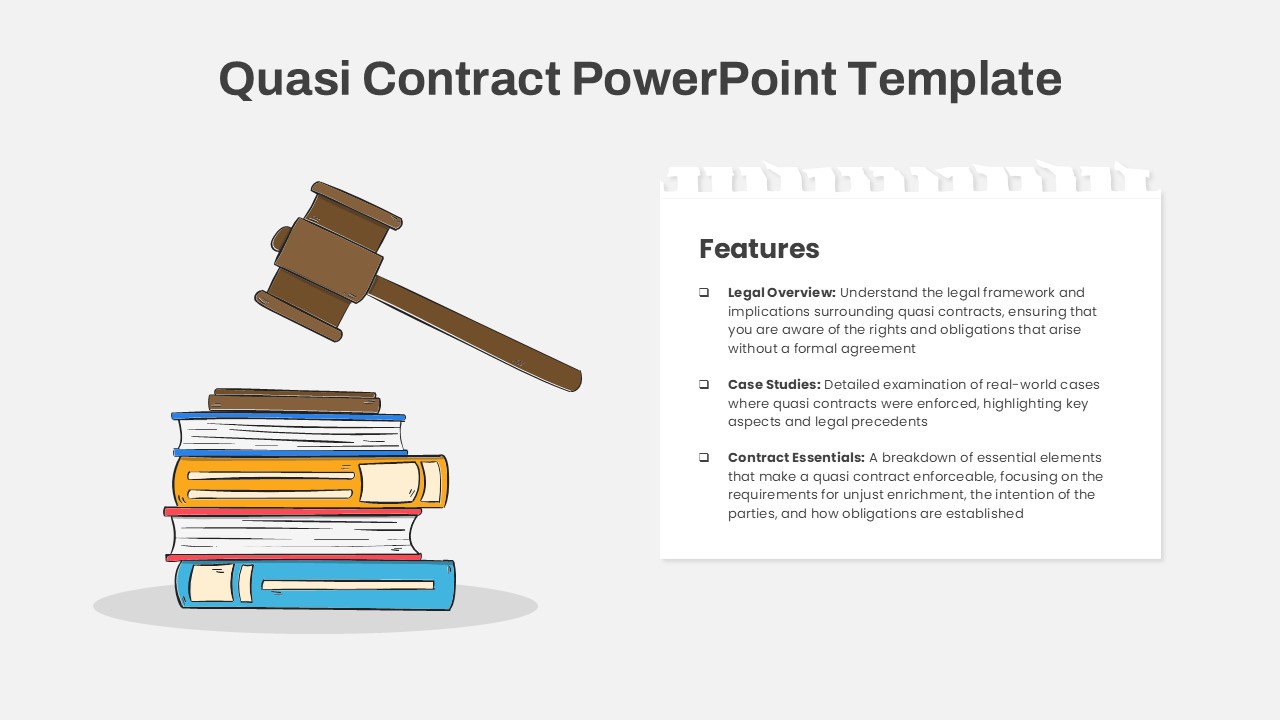
Quasi Contract Gavel & Books Overview Template for PowerPoint & Google Slides
Business Requirements
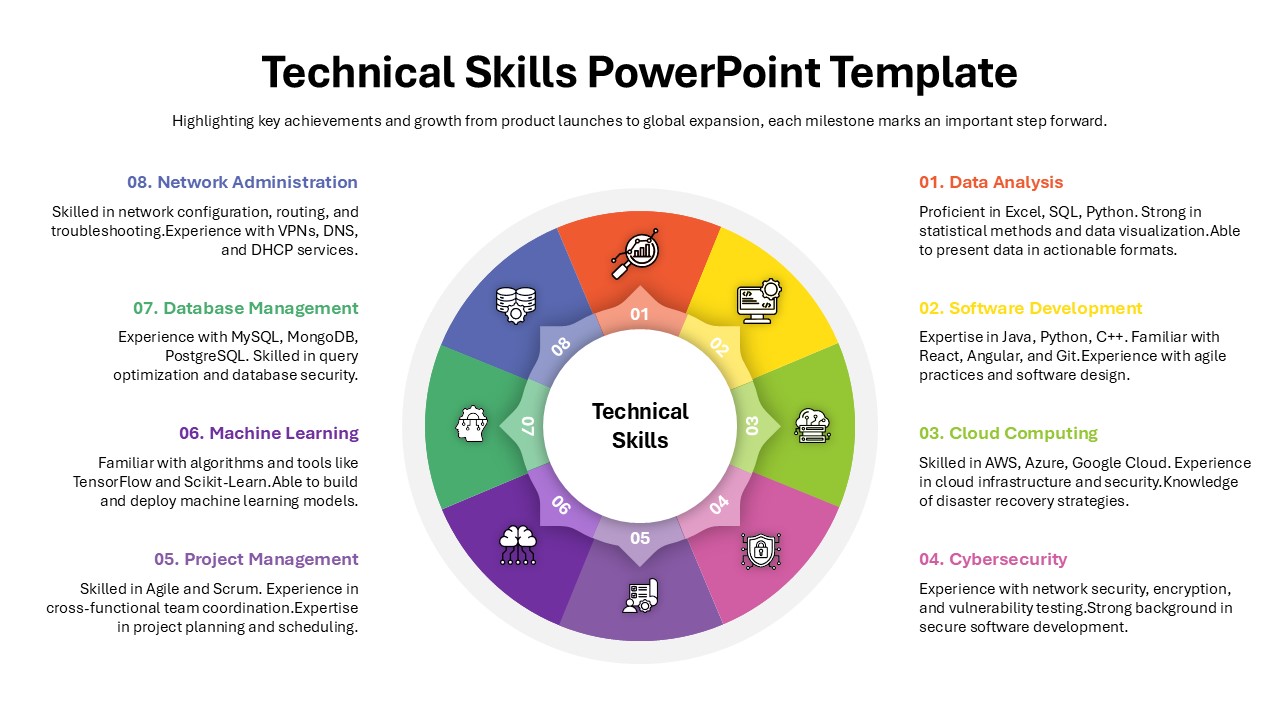
Technical Skills Donut Chart Overview Template
HR
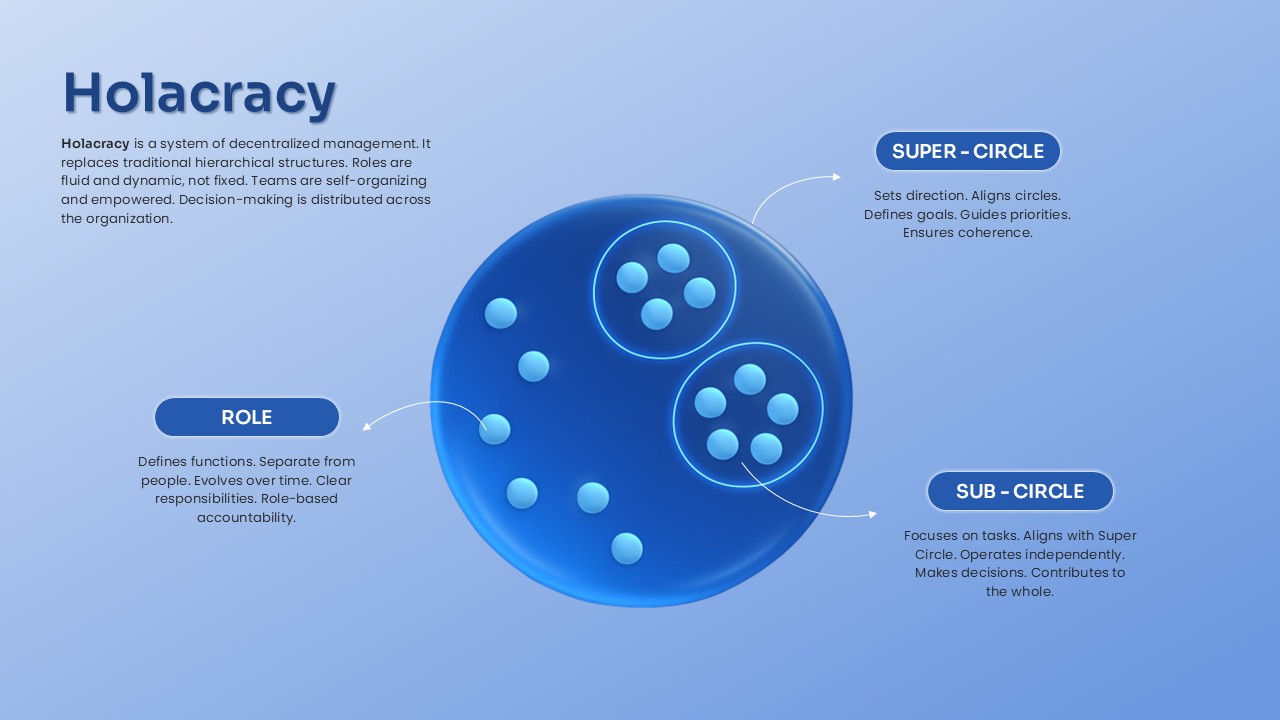
Holacracy System Overview template for PowerPoint & Google Slides
Process
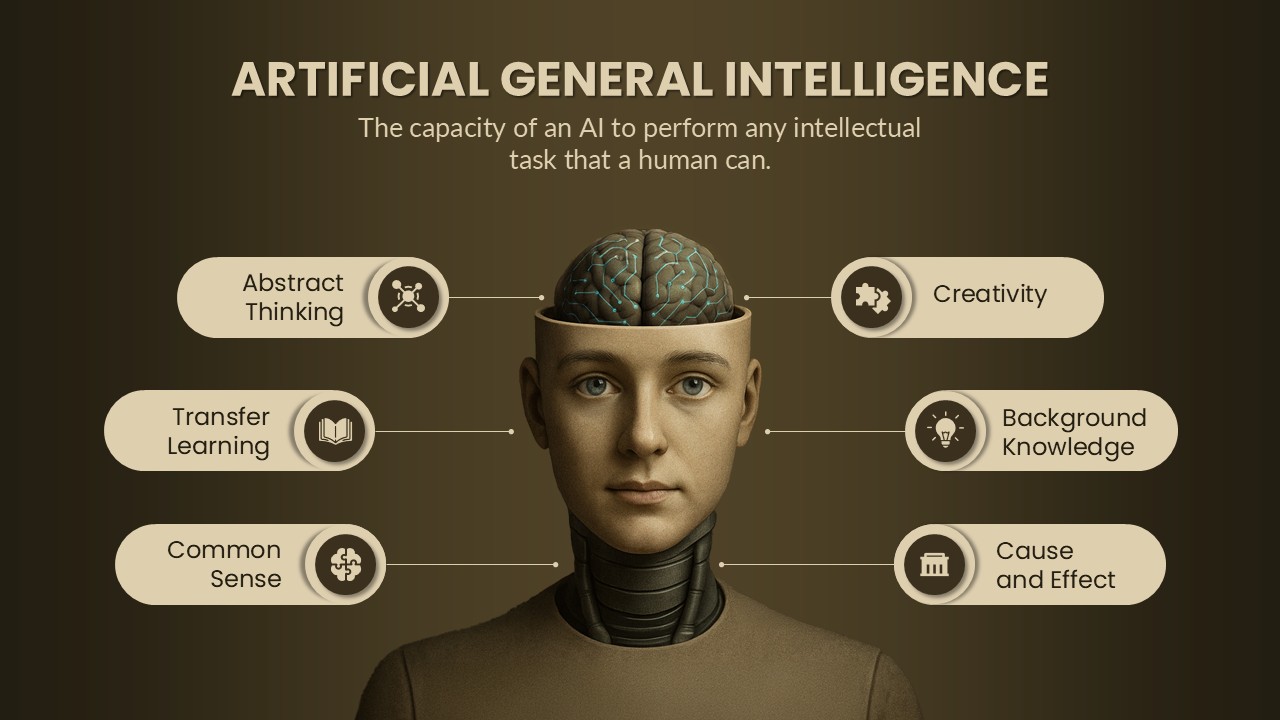
Artificial General Intelligence Overview Template for PowerPoint & Google Slides
AI
Proactive Support template for PPT
Business
Talent Acquisition Framework Overview template for PowerPoint & Google Slides
Business Strategy
AI Talent & Team Building Overview template for PowerPoint & Google Slides
AI
Pediatric Health Service PowerPoint Template
Health
Customer Segmentation Overview template for PowerPoint & Google Slides
Marketing
Static Gantt Chart Overview template for PowerPoint & Google Slides
Project Status
Meeting Cadence Presentation Template
Leadership