Population Infographics template for PowerPoint & Google Slides


Description
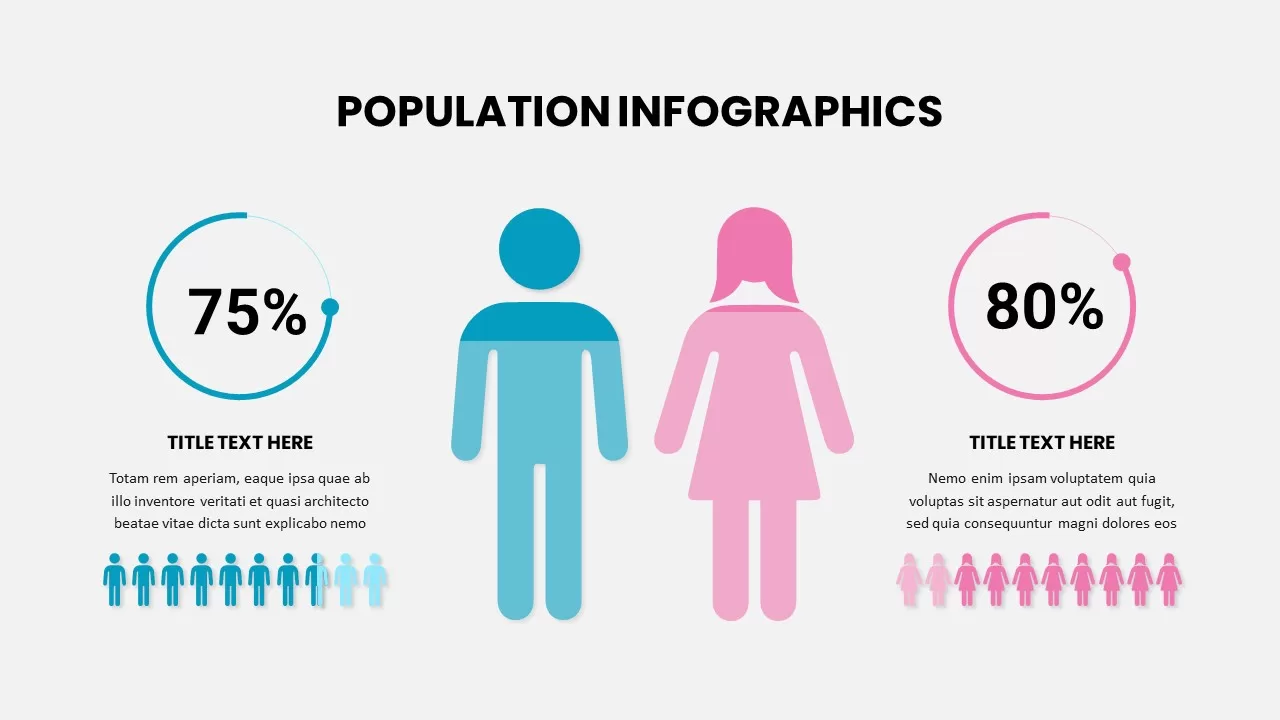
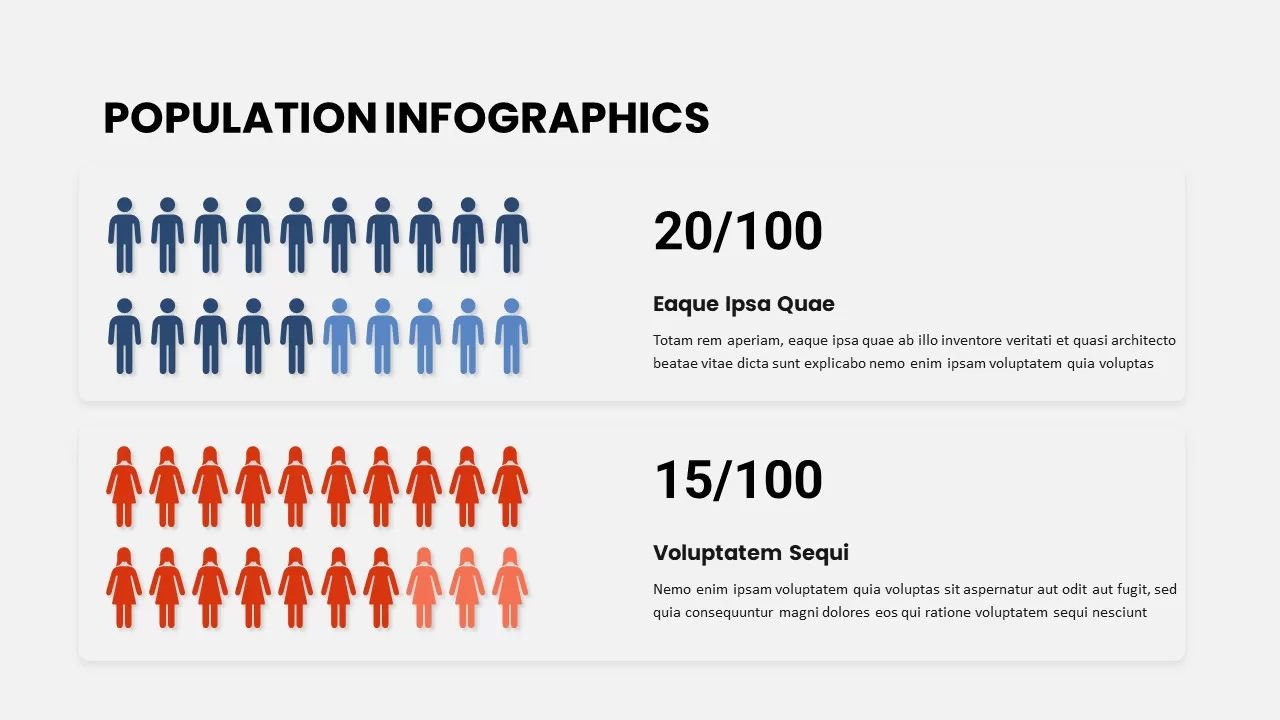
Visually represent demographic data with this engaging Population Infographics slide, designed to display statistics in a clear and effective manner. This slide showcases two groups—one for male and one for female populations—using icon-based representations to make data more relatable and easy to digest. Each group is displayed with visual icons (blue for males, red for females) and includes a percentage-based value (20/100 for males and 15/100 for females) along with accompanying descriptions for context.
The minimalist design ensures your audience can quickly grasp the data, while the use of colorful icons adds visual interest. This slide is ideal for showcasing population studies, gender breakdowns, or any data that requires visual representation of groups. The layout is perfect for use in business presentations, educational settings, or social research reports, providing both clarity and visual appeal.
Compatible with both PowerPoint and Google Slides, this template allows for easy customization, so you can adjust the icons, percentages, and text to suit your specific needs.
Who is it for
This slide is ideal for marketers, researchers, data analysts, and educators who need to present demographic information or population studies. It’s especially useful for teams working on market segmentation, social science projects, or audience analysis, as well as for anyone who needs to illustrate gender breakdowns or other categorical statistics.
Other Uses
Beyond traditional population studies, this template can be adapted to represent different types of data breakdowns, such as customer demographics, survey results, user segmentation, or even voting patterns. Its visual format makes it ideal for presenting any kind of statistical data where group representation is important.
Login to download this file

Item ID
SB02615
Related Templates

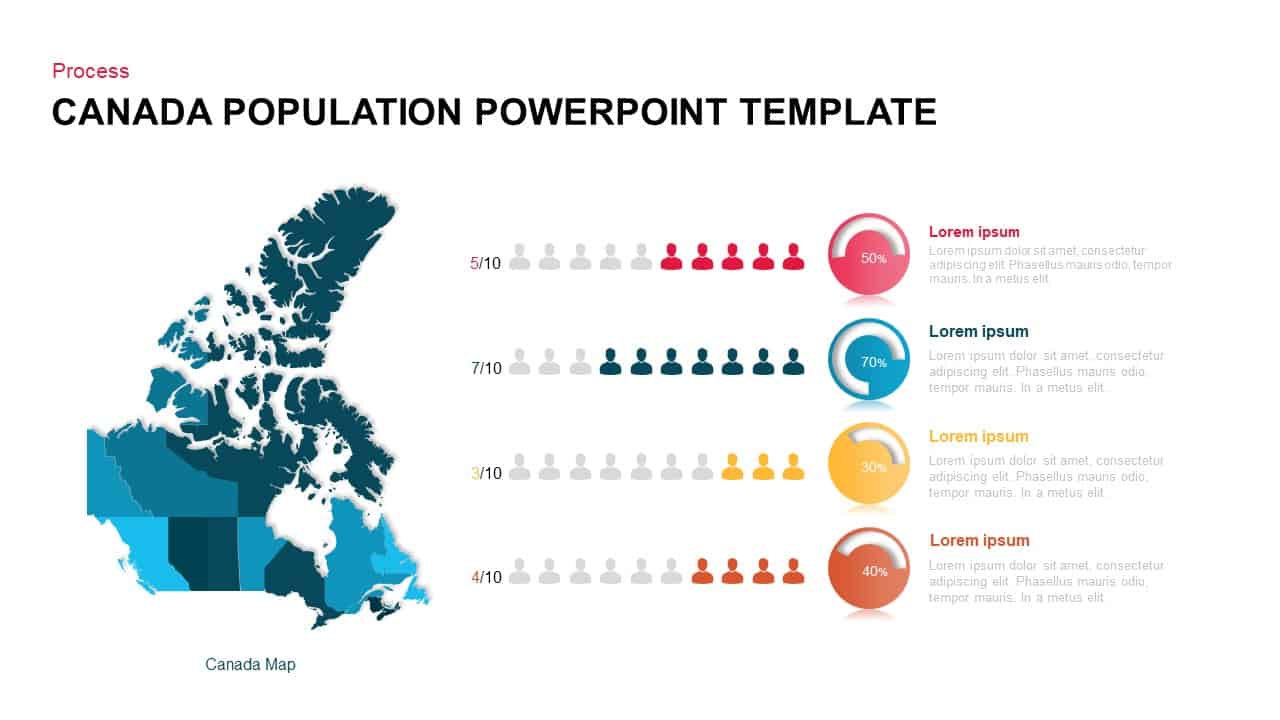
Canada Population Infographics Template for PowerPoint & Google Slides
World Maps
Interactive US Population Data Map Slide Template for PowerPoint & Google Slides
World Maps
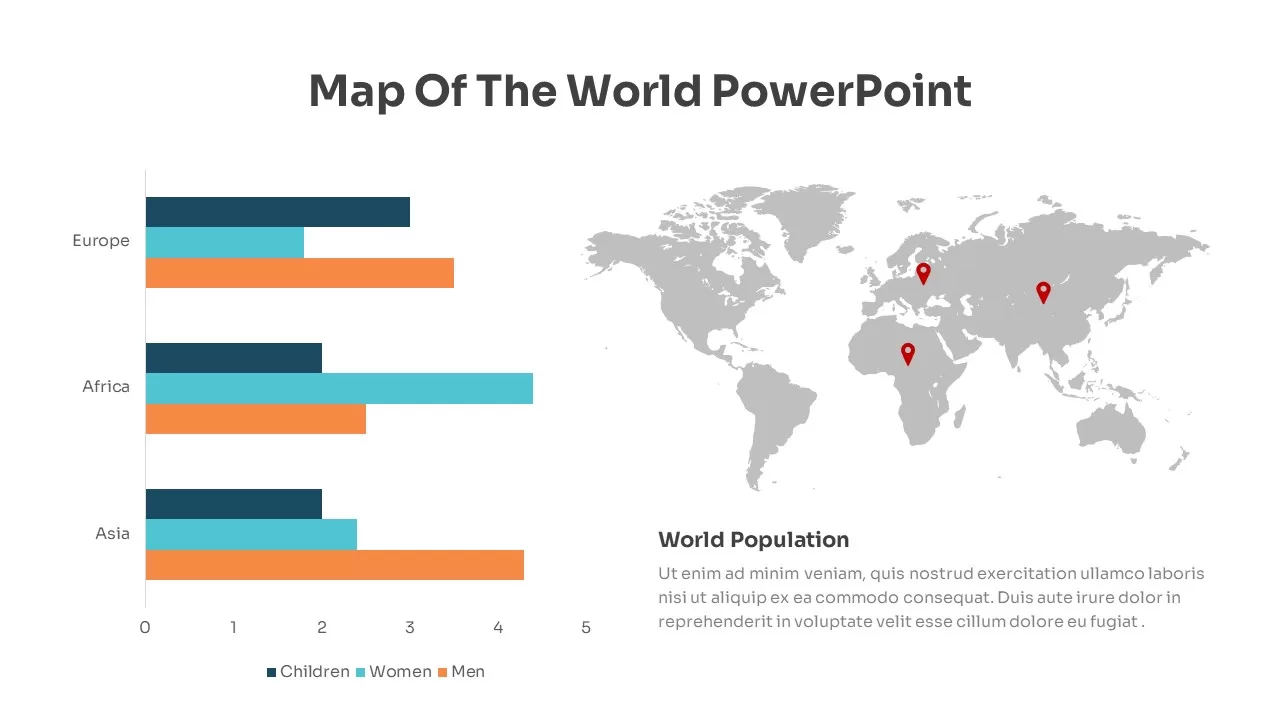
Global Population Demographics & Map Template for PowerPoint & Google Slides
Bar/Column
Population Infographic Template for PowerPoint & Google Slides
Comparison
Population Pyramid Chart Analysis Template for PowerPoint & Google Slides
Bar/Column
Population Age Distribution Pyramid Chart Template for PowerPoint & Google Slides
Pyramid
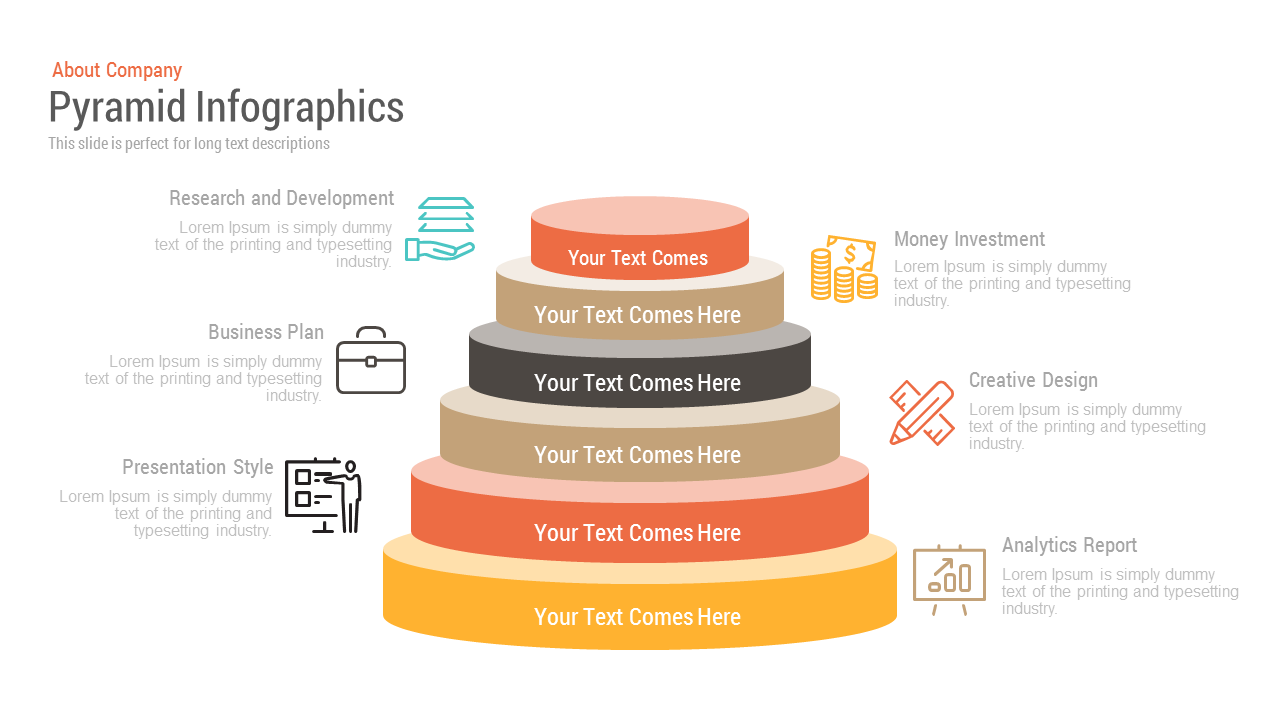
Free Pyramid Infographics template for PowerPoint & Google Slides
Pyramid
Free
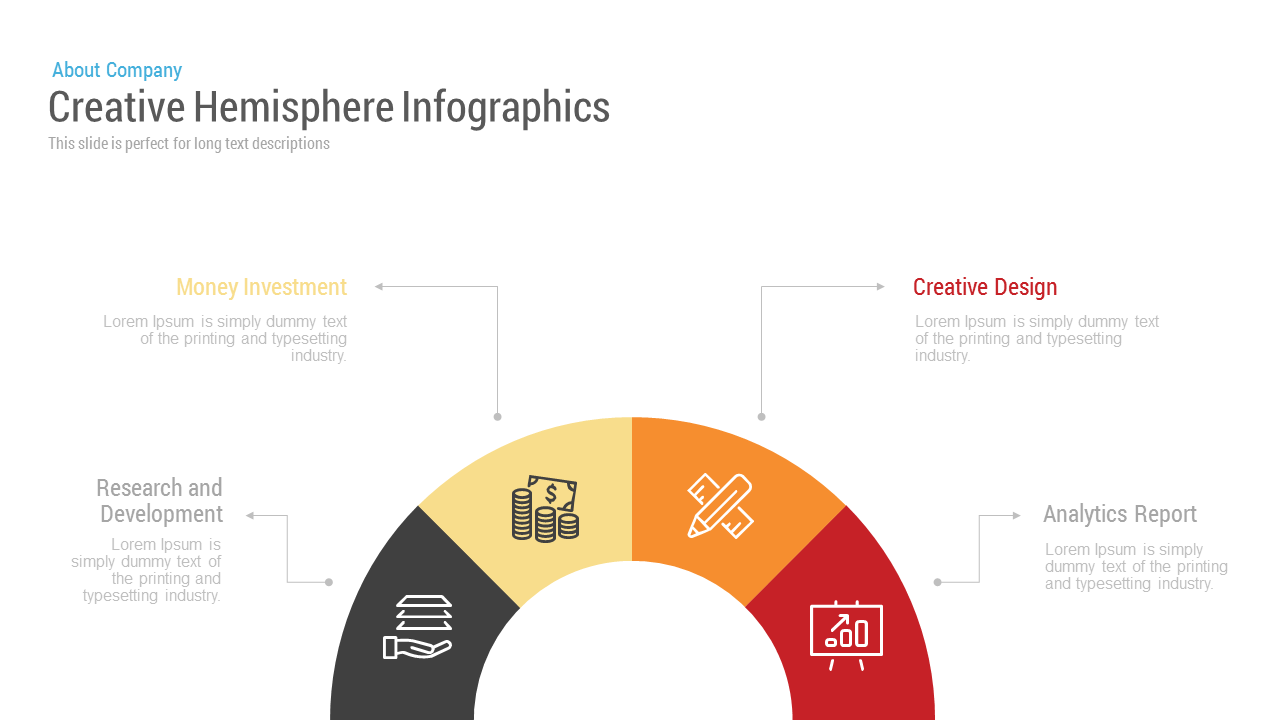
Free Creative Hemisphere Infographics template for PowerPoint & Google Slides
Infographics
Free
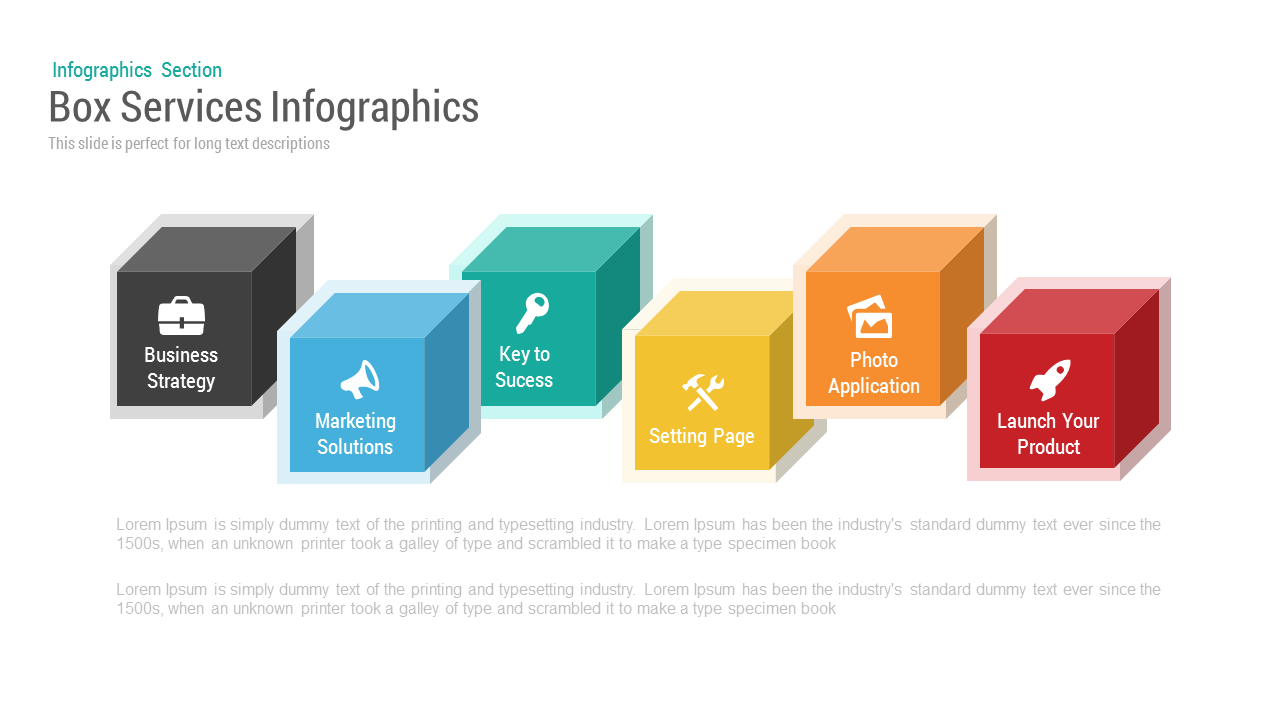
Box Services Infographics template for PowerPoint & Google Slides
Process
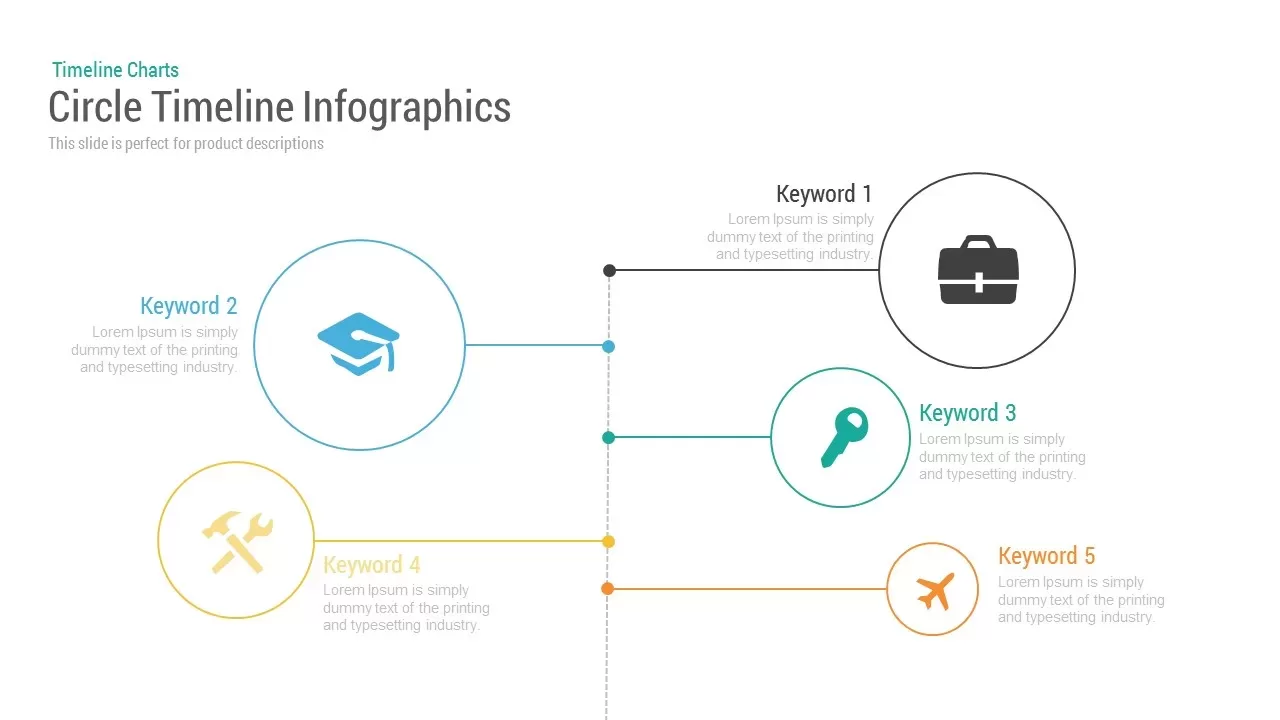
Circle Timeline Infographics template for PowerPoint & Google Slides
Timeline
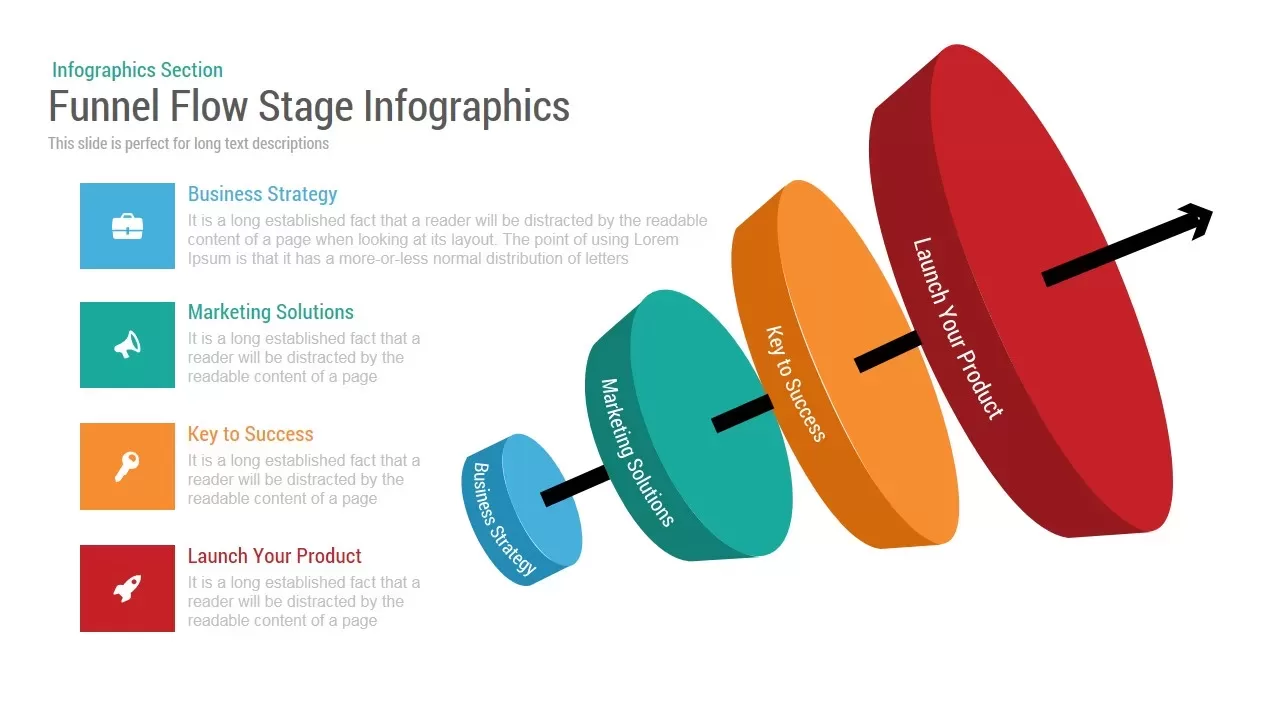
Funnel Flow Stage Infographics template for PowerPoint & Google Slides
Funnel
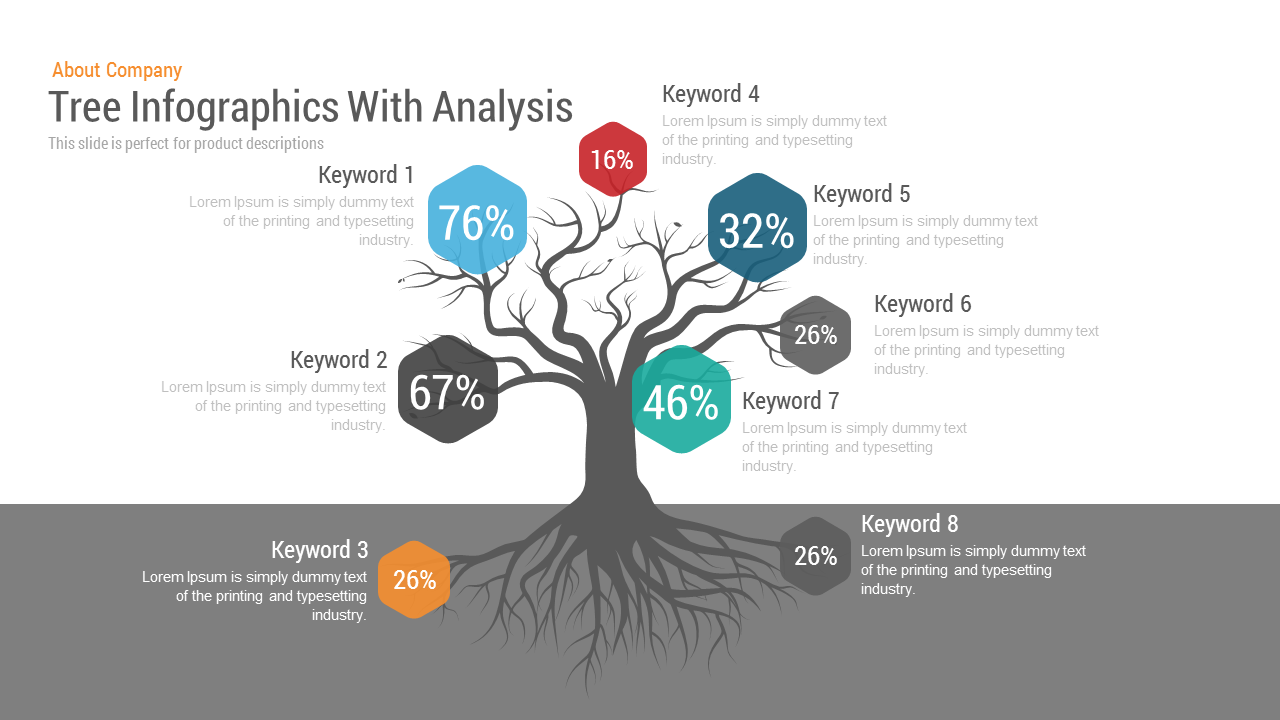
Tree Infographics template for PowerPoint & Google Slides
Decision Tree
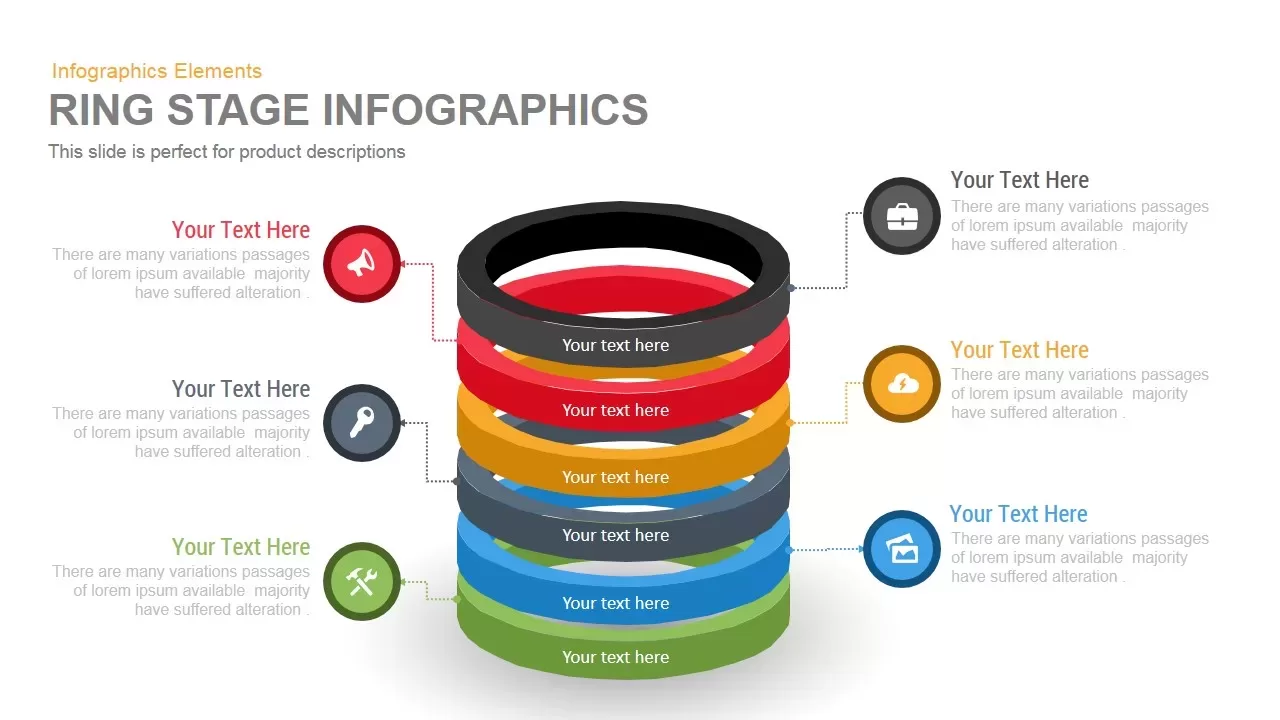
Ring Infographics template for PowerPoint & Google Slides
Circular
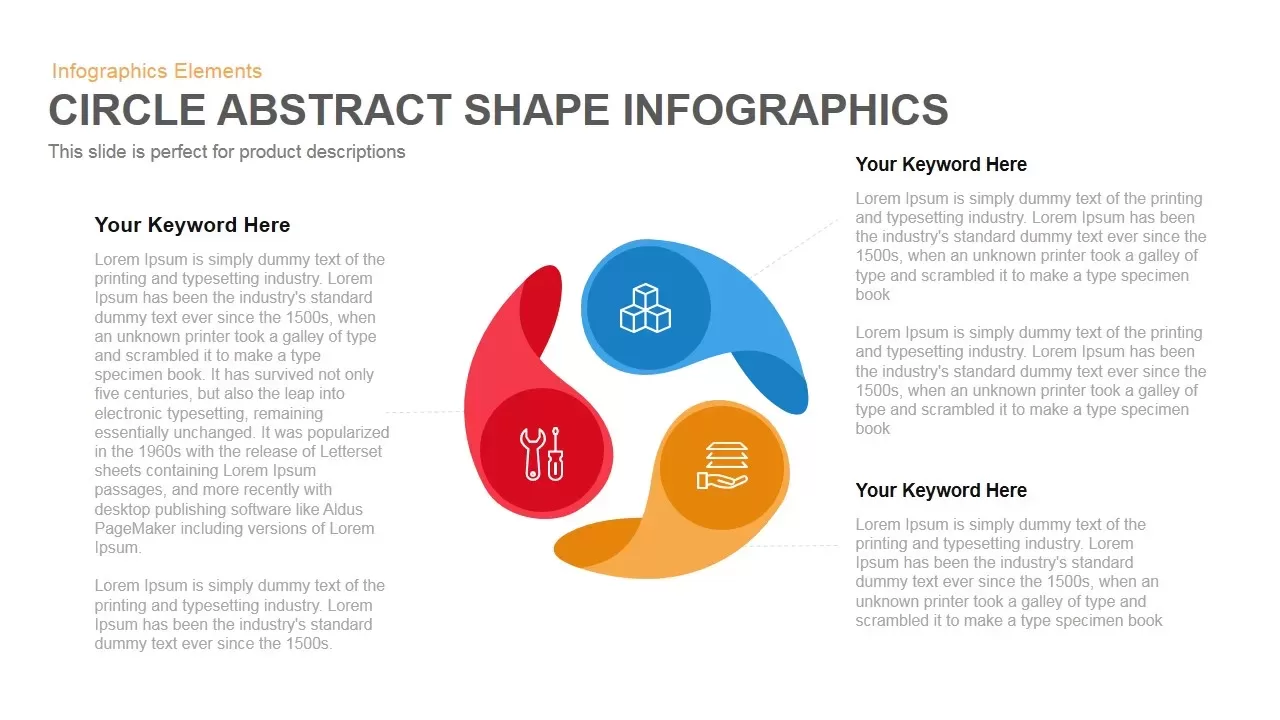
Circle Abstract Shape Infographics Template for PowerPoint & Google Slides
Circular
3D Four Arrow Infographics Diagram Template for PowerPoint & Google Slides
Arrow
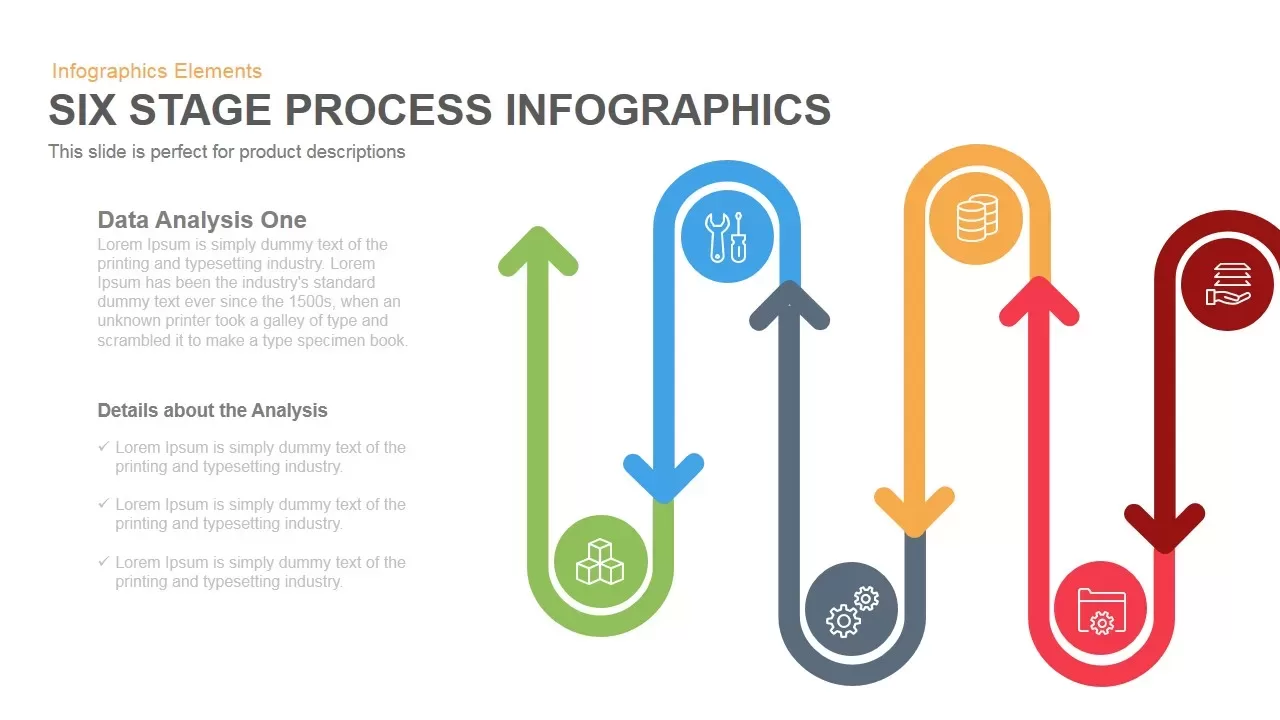
Six-Stage Process Infographics Template for PowerPoint & Google Slides
Process
Dynamic Creative Head Infographics Template for PowerPoint & Google Slides
Circular
Safety Helmet Infographics Template for PowerPoint & Google Slides
Infographics
Four Arrow Square Infographics Template for PowerPoint & Google Slides
Arrow
Brain Gear Hub-and-Spoke Infographics template for PowerPoint & Google Slides
Org Chart
Tree Infographics template for PowerPoint & Google Slides
Infographics
Overcoming Challenges Infographics template for PowerPoint & Google Slides
Opportunities Challenges
Six-Step Infographics Template for PowerPoint & Google Slides
Process
Five-Stage Arrow Infographics Timeline Template for PowerPoint & Google Slides
Arrow
Five-Stage Hexagon Process Infographics template for PowerPoint & Google Slides
Process
Five-Stage Pyramid Infographics Diagram Template for PowerPoint & Google Slides
Pyramid
Business Strategy Infographics Diagram Template for PowerPoint & Google Slides
Business Strategy
Four Segment Infographics Element Template for PowerPoint & Google Slides
Comparison
Six-Stage Time Arrow Infographics Template for PowerPoint & Google Slides
Arrow
Six-Stage Connected Process Infographics Template for PowerPoint & Google Slides
Process
Semicircle Sequential Infographics Template for PowerPoint & Google Slides
Arrow
3D Arrow Infographics template for PowerPoint & Google Slides
Arrow
Layer Infographics template for PowerPoint & Google Slides
Process
Free Layer Infographics template for PowerPoint & Google Slides
Process
Free

Seven-Stage Timeline Infographics Template for PowerPoint & Google Slides
Timeline
Circular Timeline Infographics Template for PowerPoint & Google Slides
Timeline
Free Professional Cloud Infographics Template for PowerPoint & Google Slides
Process
Free
Growth Plant Infographics template for PowerPoint & Google Slides
Process
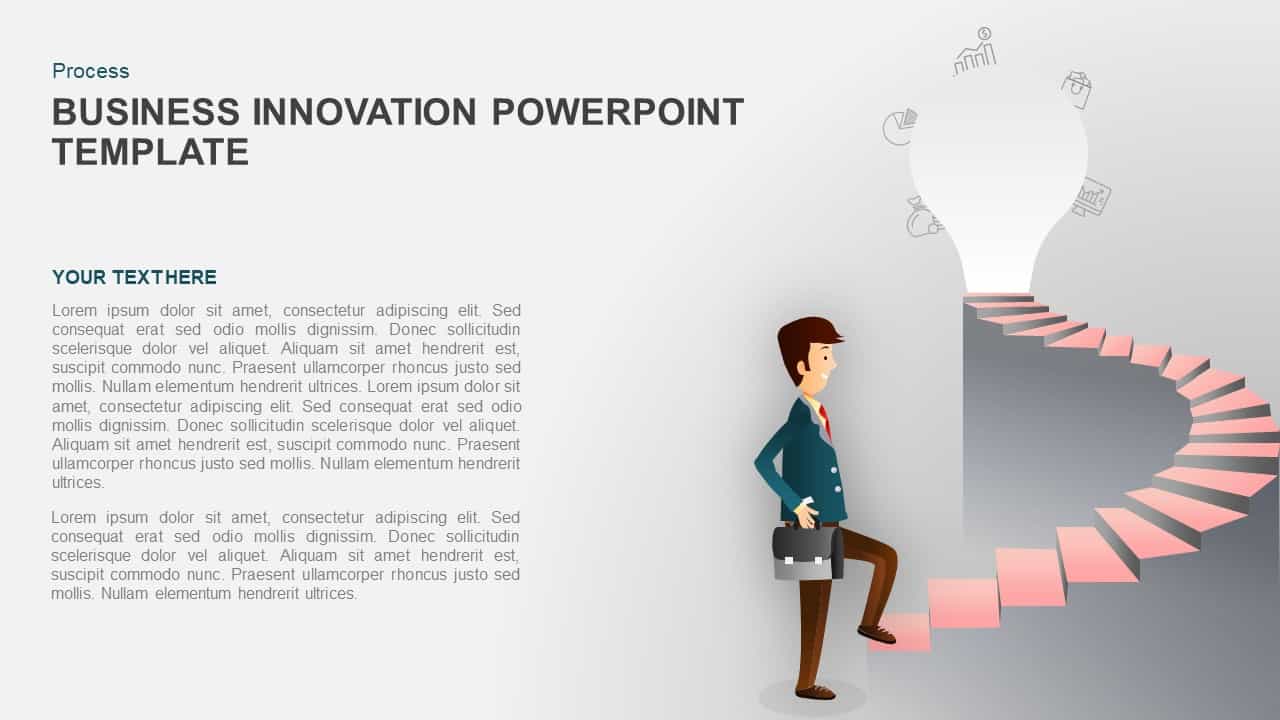
Business Innovation Infographics template for PowerPoint & Google Slides
Process
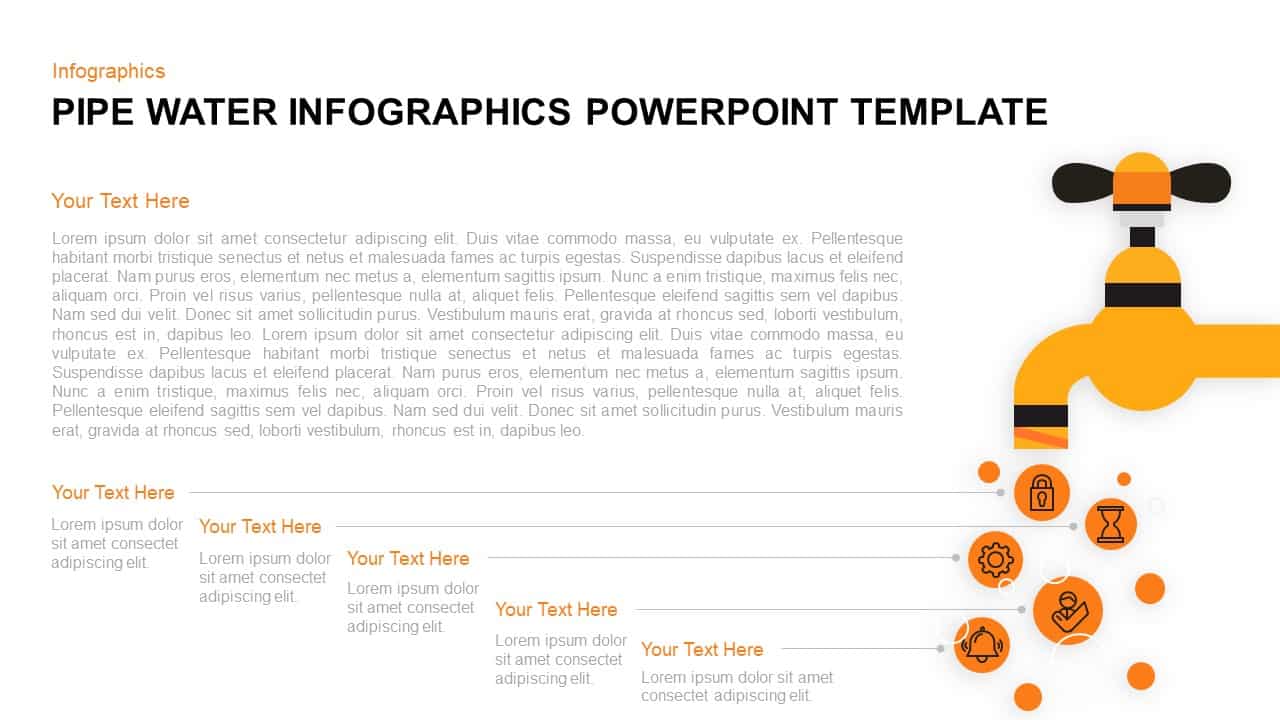
Pipe Water Infographics Flow Diagram Template for PowerPoint & Google Slides
Process
Five-Stage Pyramid Infographics Process Template for PowerPoint & Google Slides
Pyramid
Mobile Infographics Data Visualization Template for PowerPoint & Google Slides
Infographics
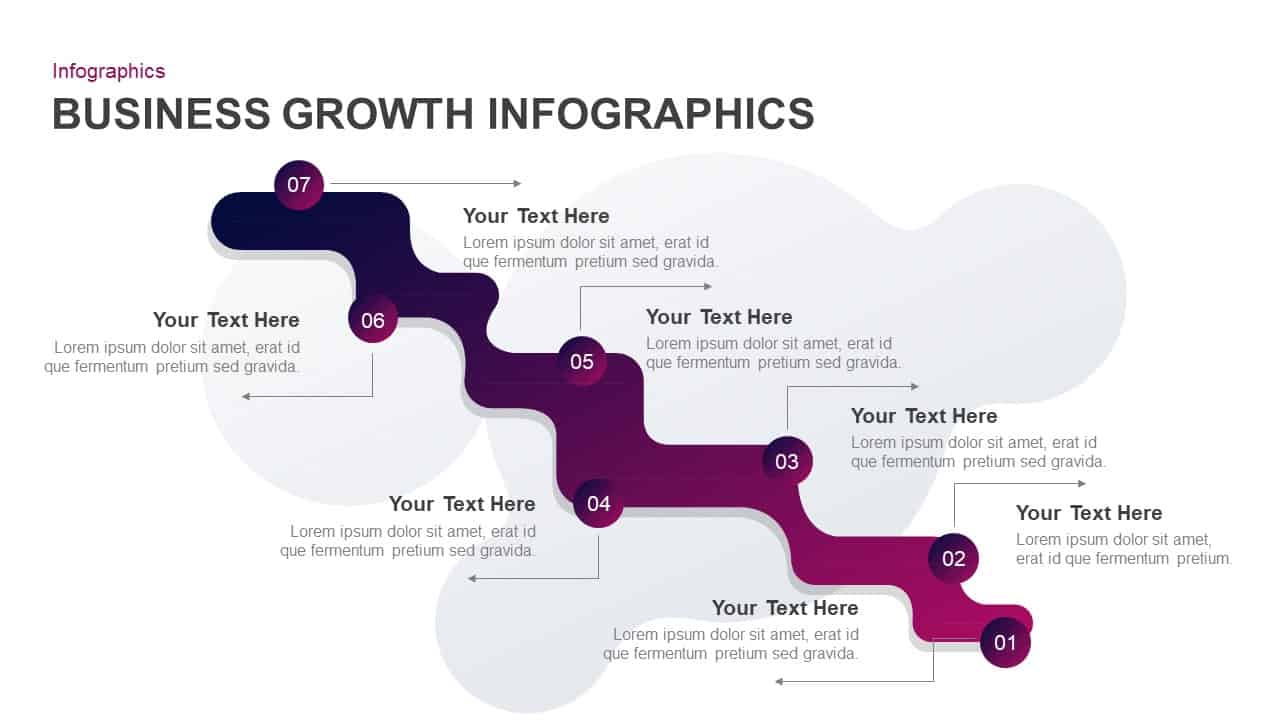
Business Growth Infographics Template for PowerPoint & Google Slides
Roadmap
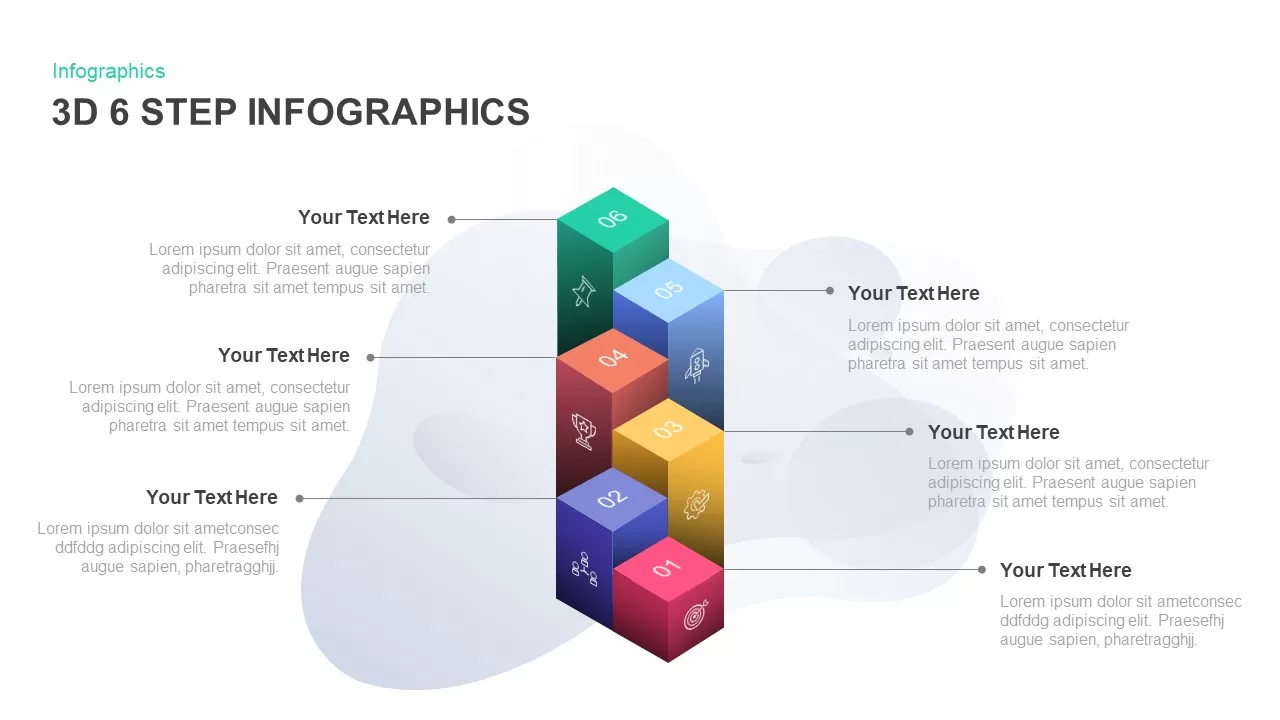
3D 6-Step Infographics Process Diagram Template for PowerPoint & Google Slides
Infographics
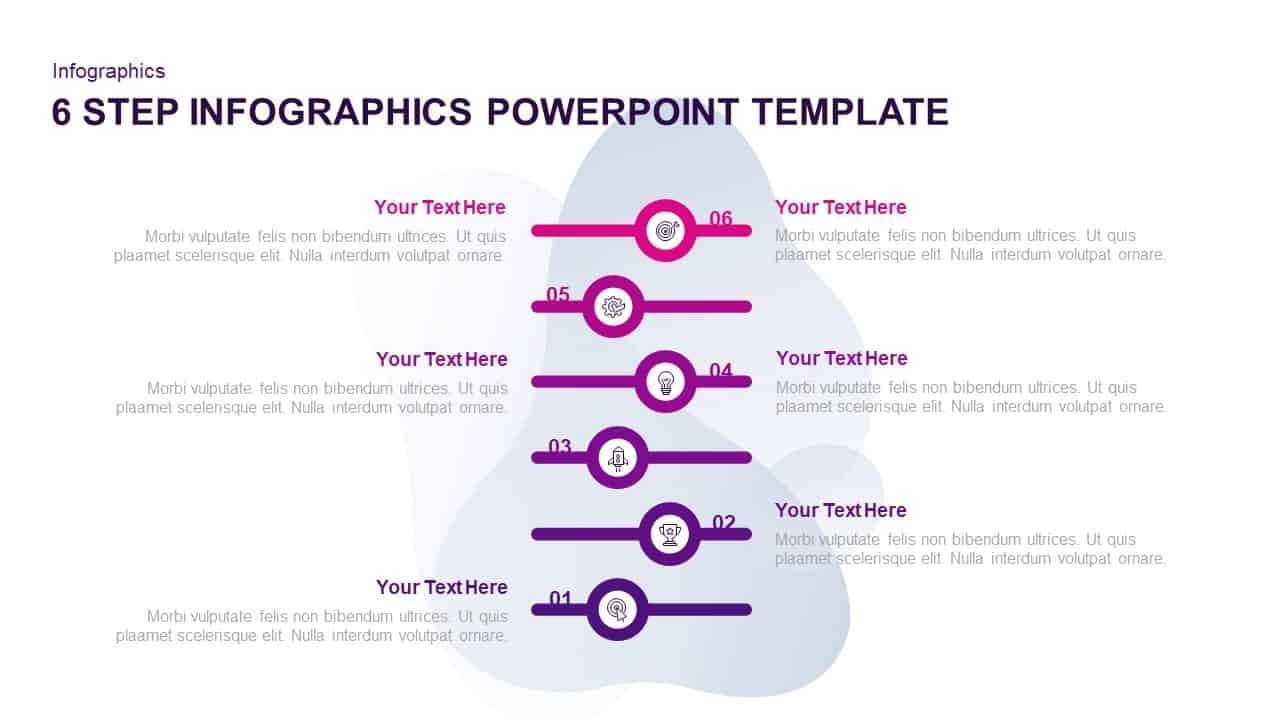
Six-Step Purple Gradient Infographics Template for PowerPoint & Google Slides
Process
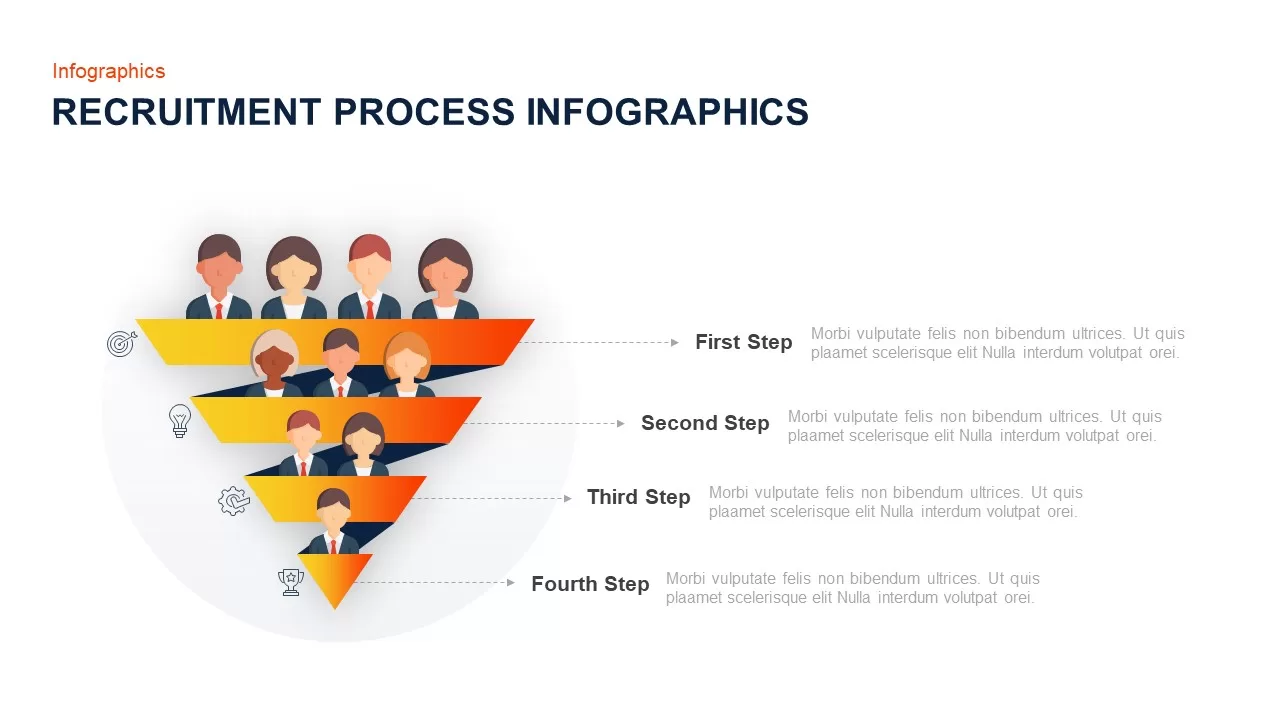
Recruitment Process Funnel Infographics Template for PowerPoint & Google Slides
Recruitment
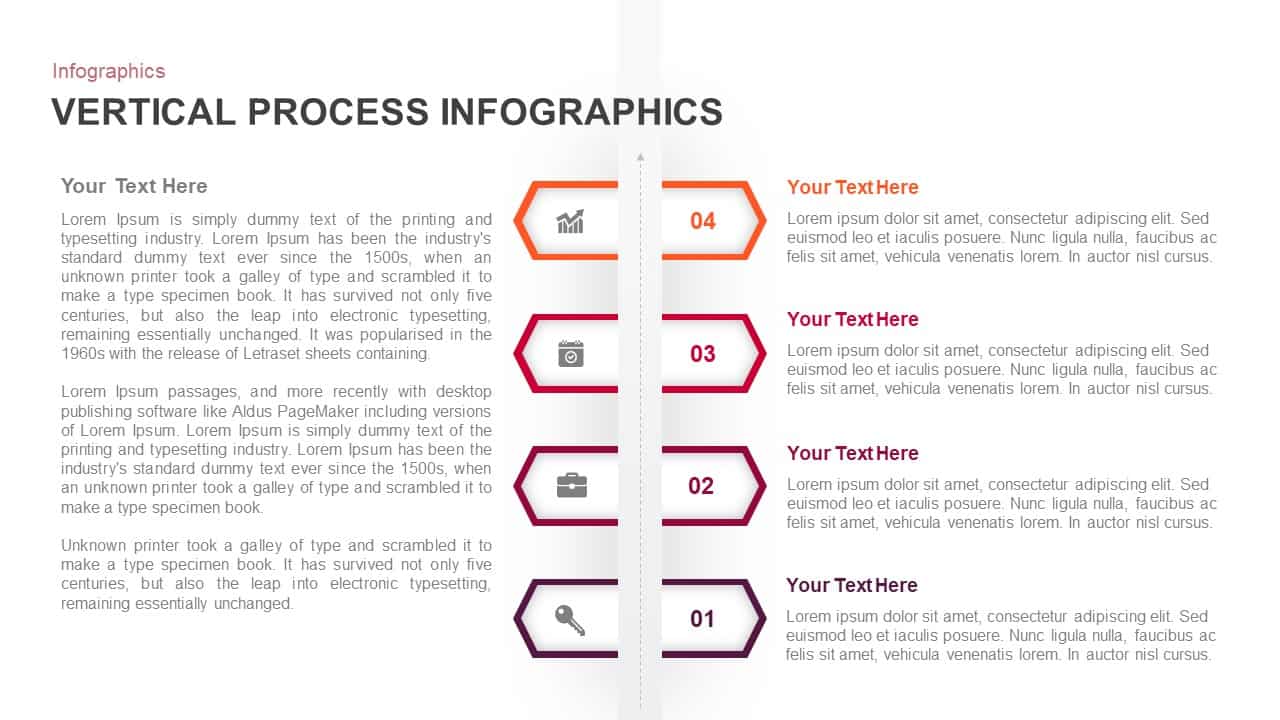
Vertical Process Infographics Template for PowerPoint & Google Slides
Process
Colorful Venn Diagram Infographics Template for PowerPoint & Google Slides
Circular
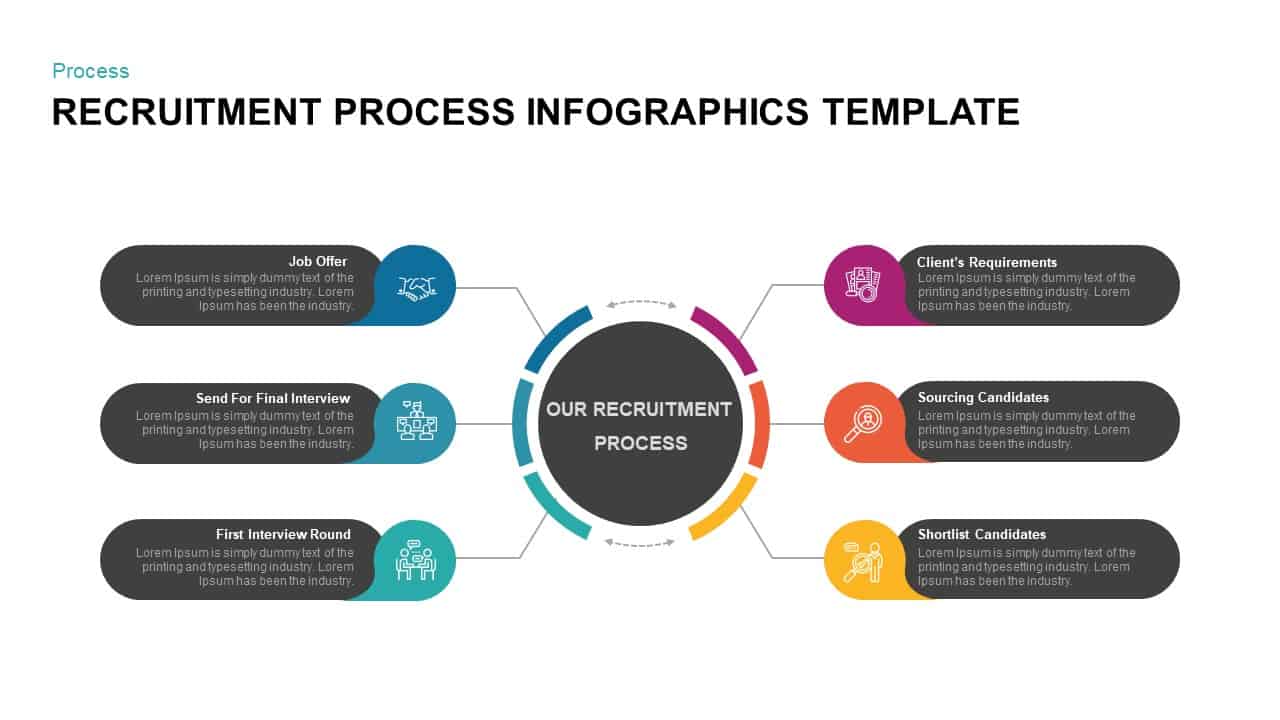
Recruitment Process Infographics Template for PowerPoint & Google Slides
Process
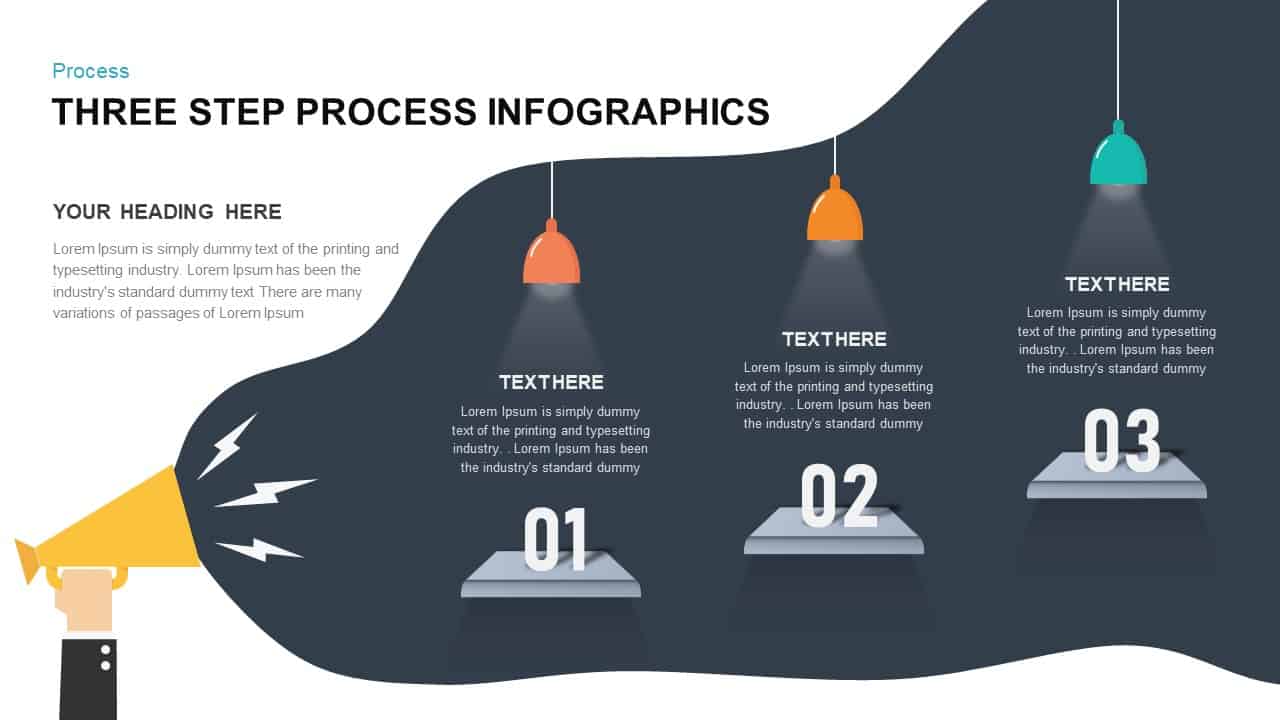
Three-Step Process Infographics Template for PowerPoint & Google Slides
Process
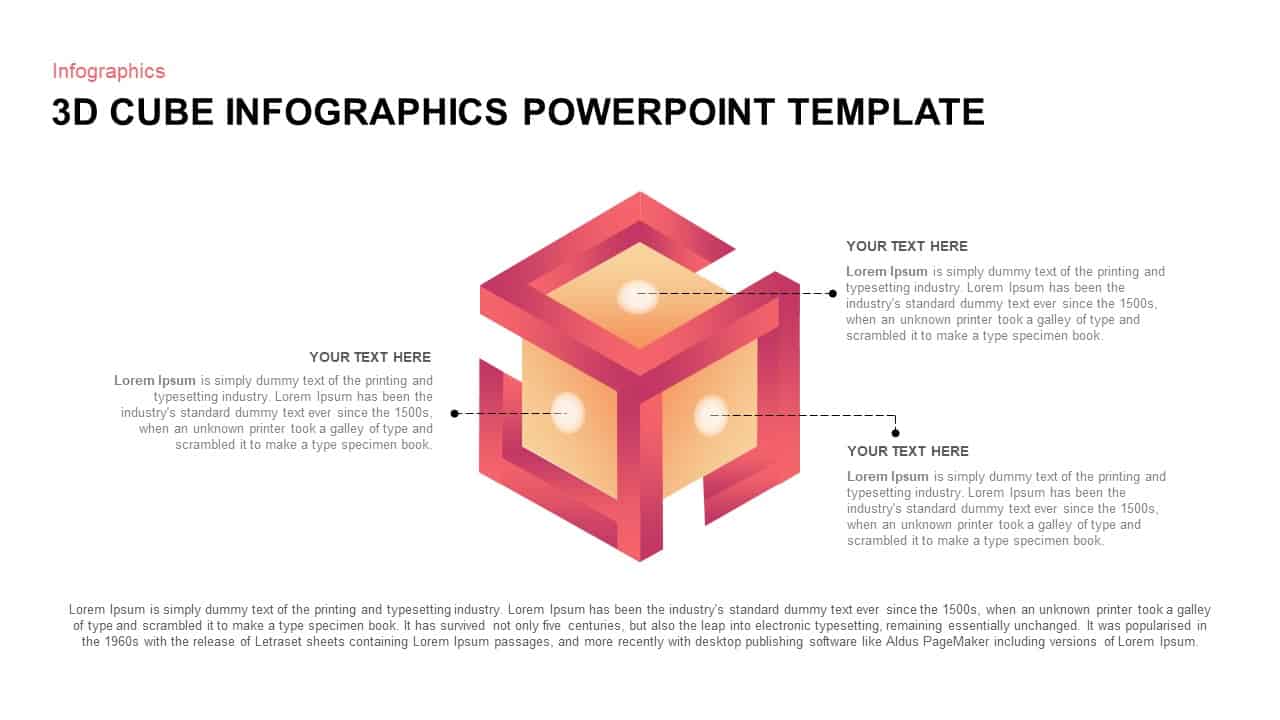
3D Cube Infographics template for PowerPoint & Google Slides
Process
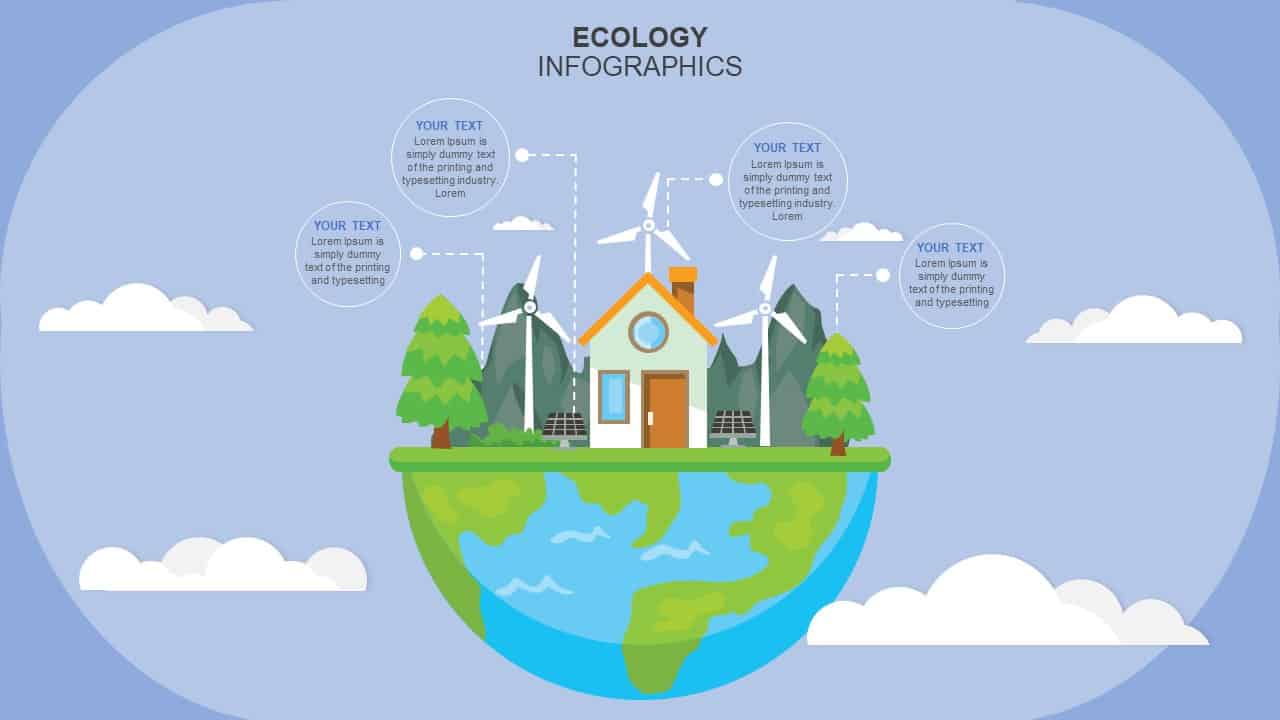
Ecology Infographics Overview template for PowerPoint & Google Slides
Business Proposal
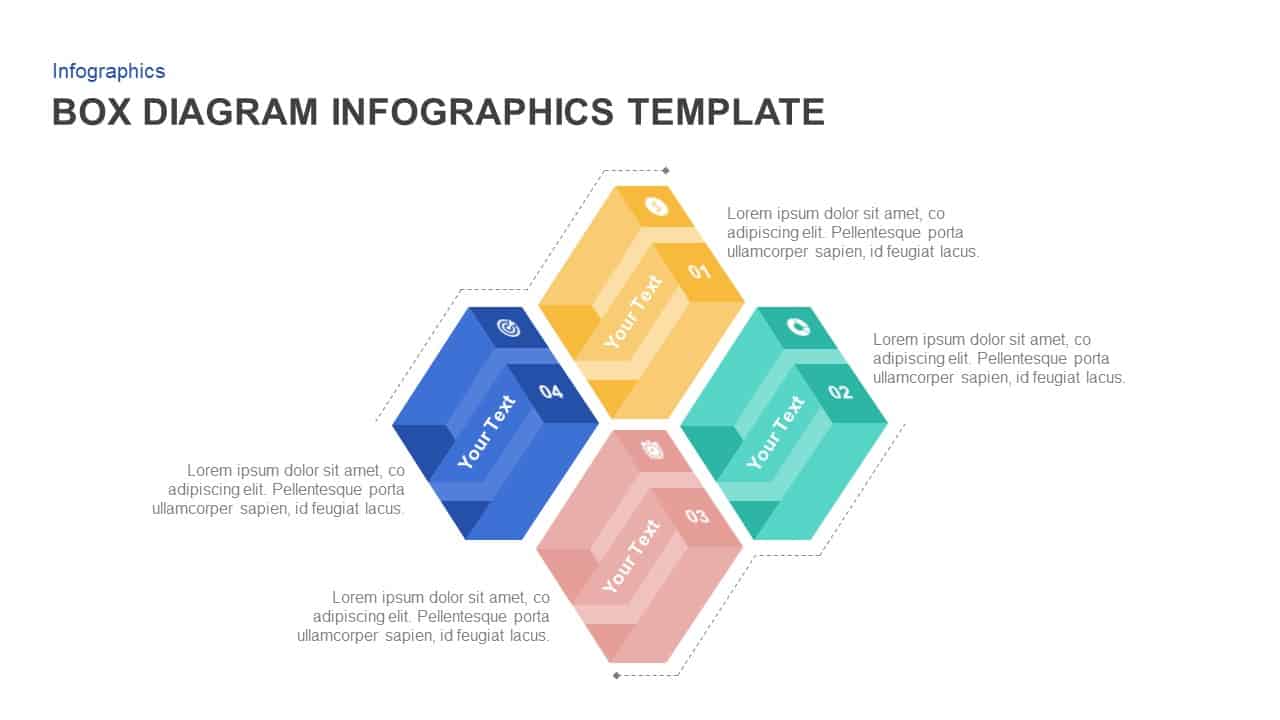
Box Diagram Infographics template for PowerPoint & Google Slides
Business
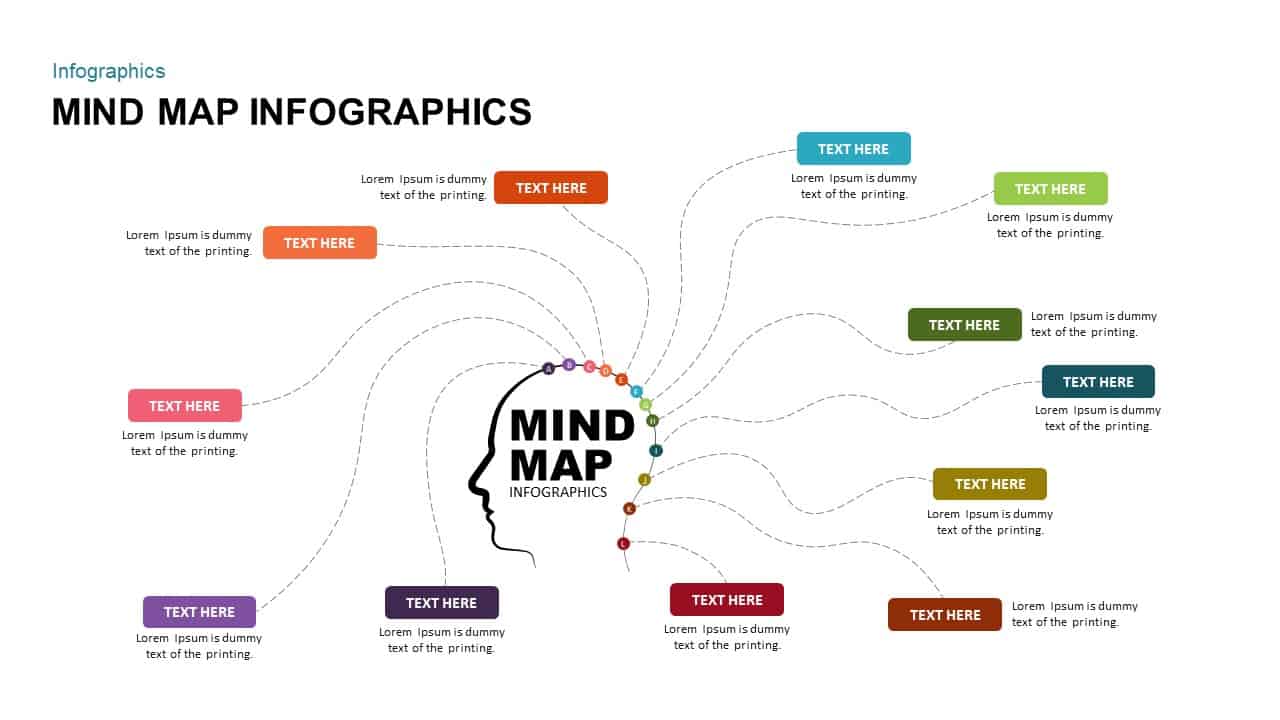
Mind Map Infographics template for PowerPoint & Google Slides
Mind Maps

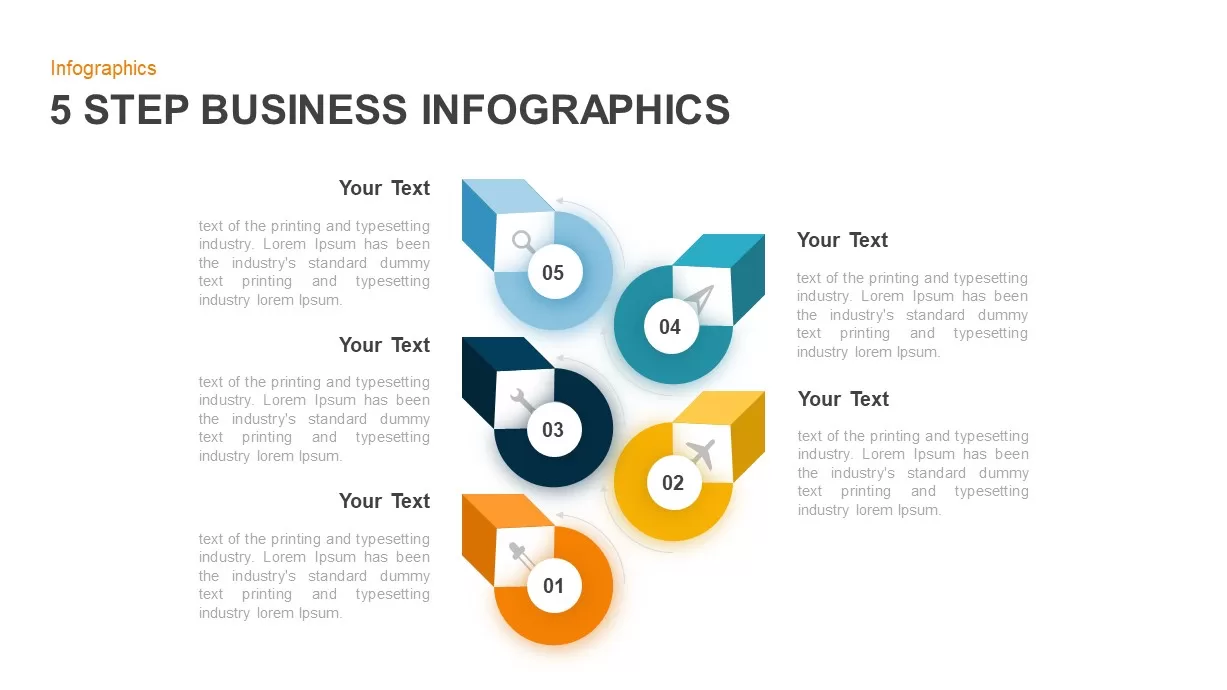
Five-Step Business Infographics Template for PowerPoint & Google Slides
Infographics
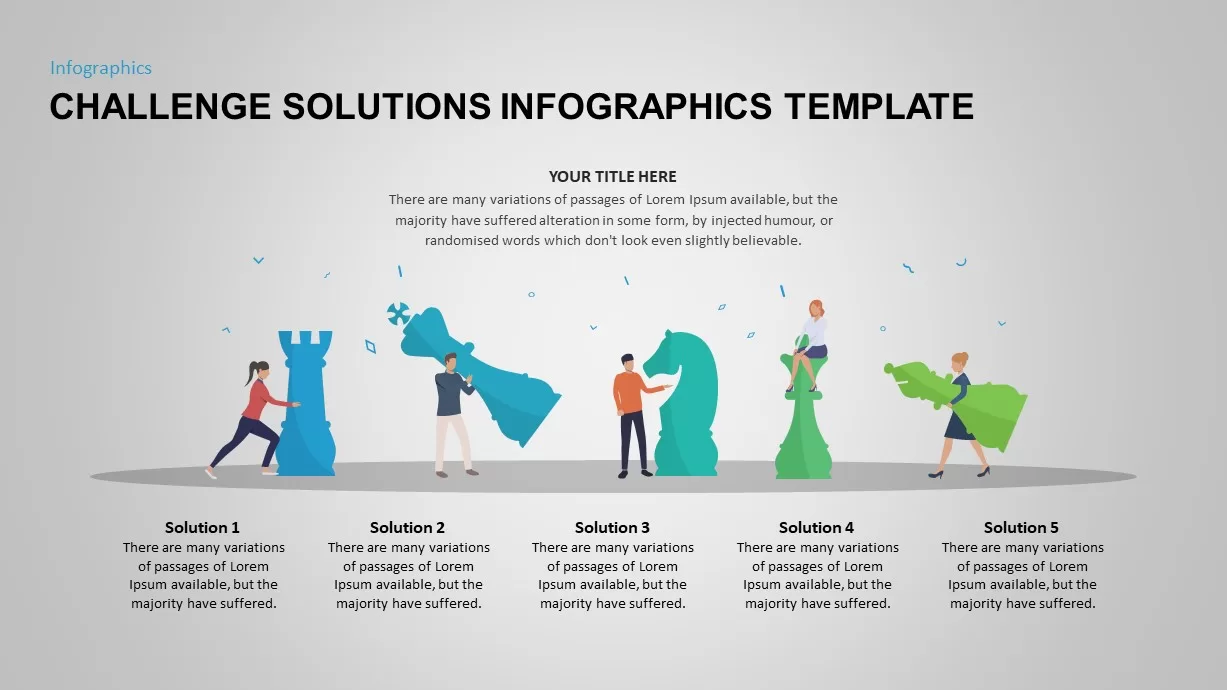
Challenge Solutions Infographics Template for PowerPoint & Google Slides
Opportunities Challenges
Four-Step Circular Process Infographics Template for PowerPoint & Google Slides
Circular
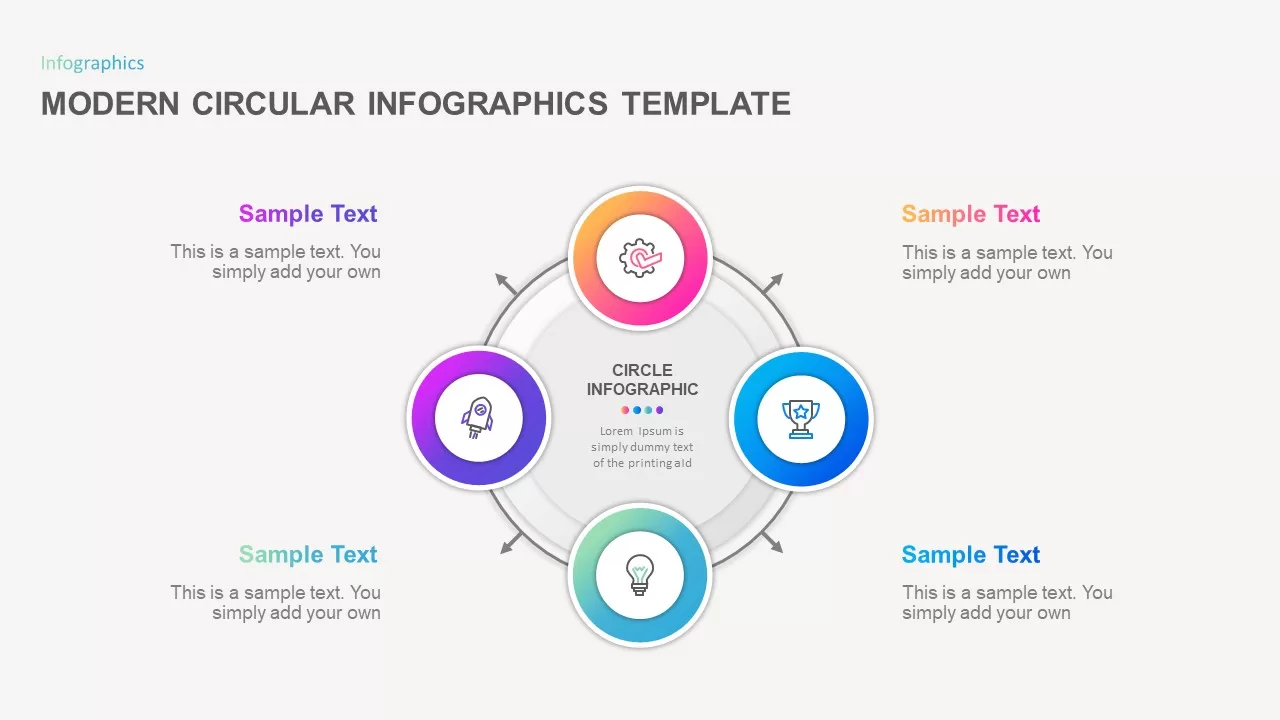
Modern Circular Infographics Template for PowerPoint & Google Slides
Circular
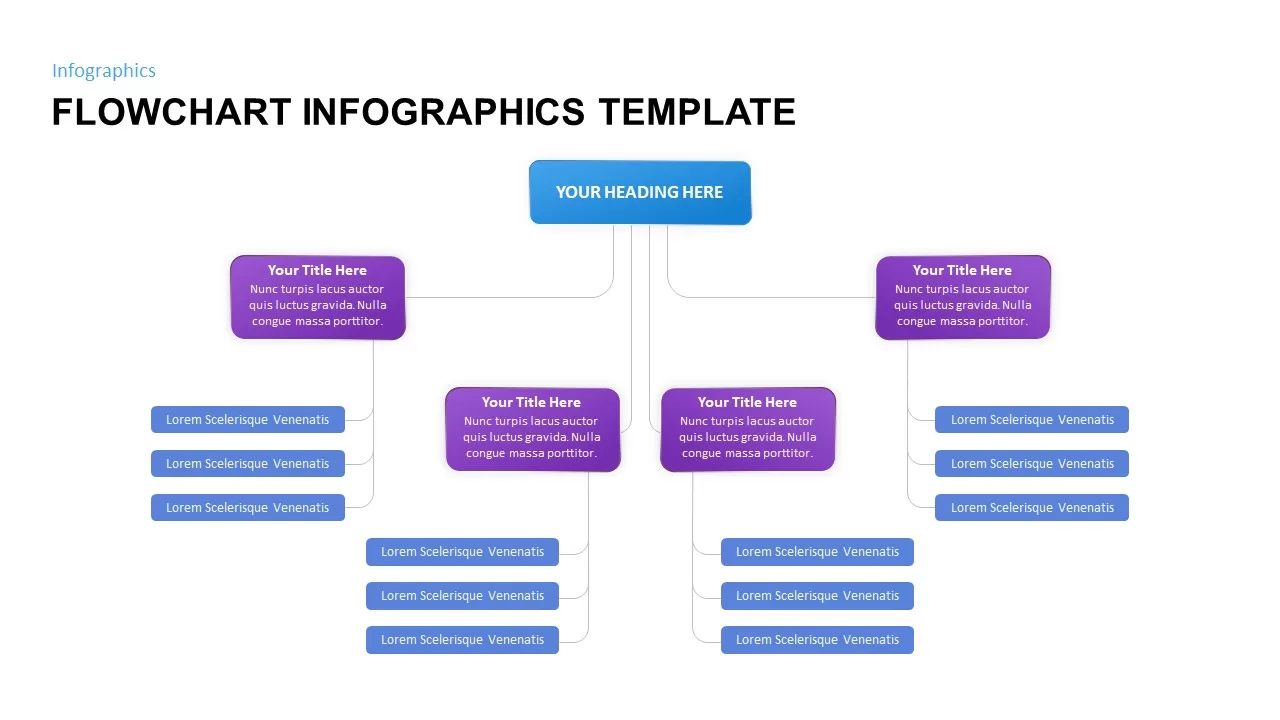
Flowchart Infographics Template for PowerPoint & Google Slides
Infographics
Five-Step Circular Badge Infographics Template for PowerPoint & Google Slides
Circular
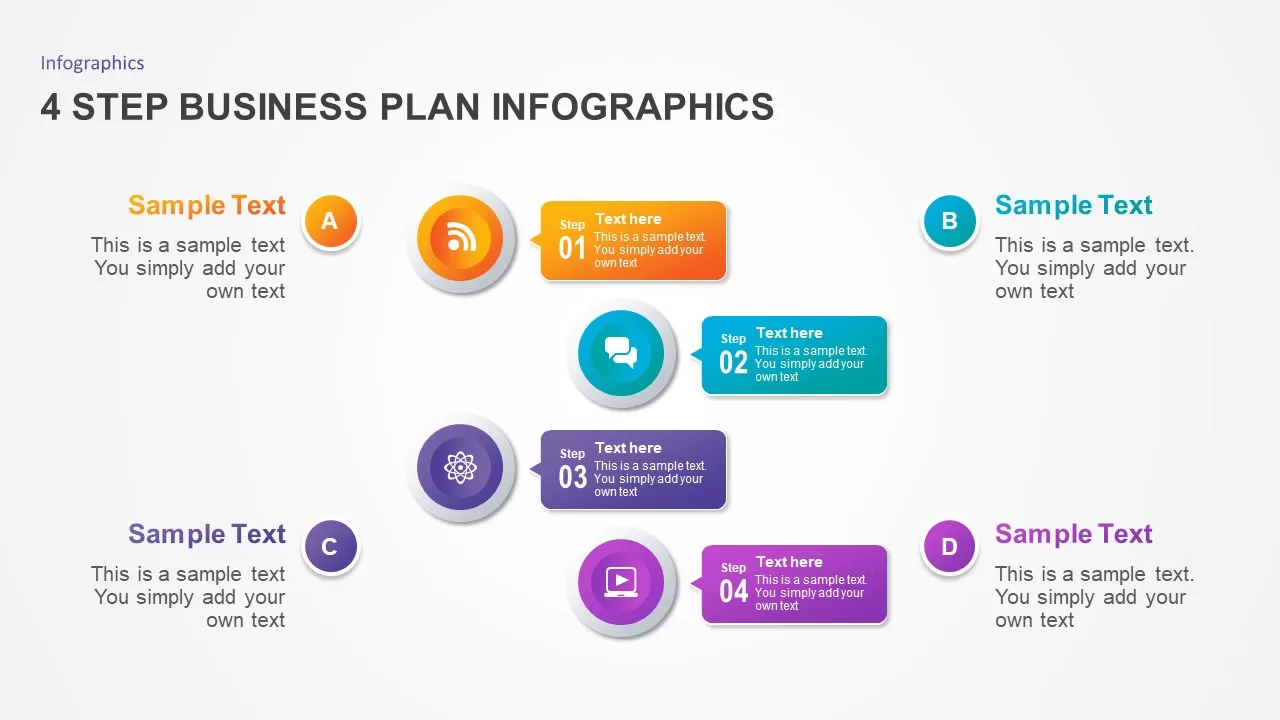
Four-Step Business Plan Infographics Template for PowerPoint & Google Slides
Business Plan
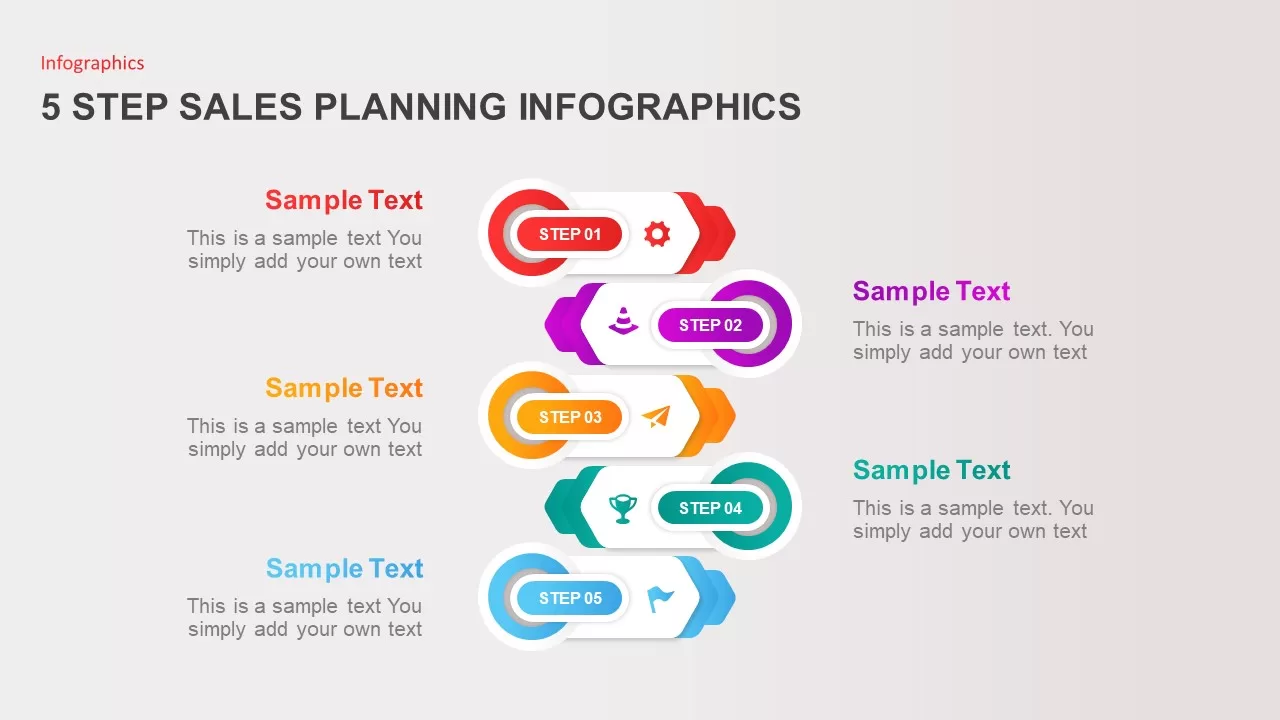
5 Step Sales Planning Infographics Template for PowerPoint & Google Slides
Process
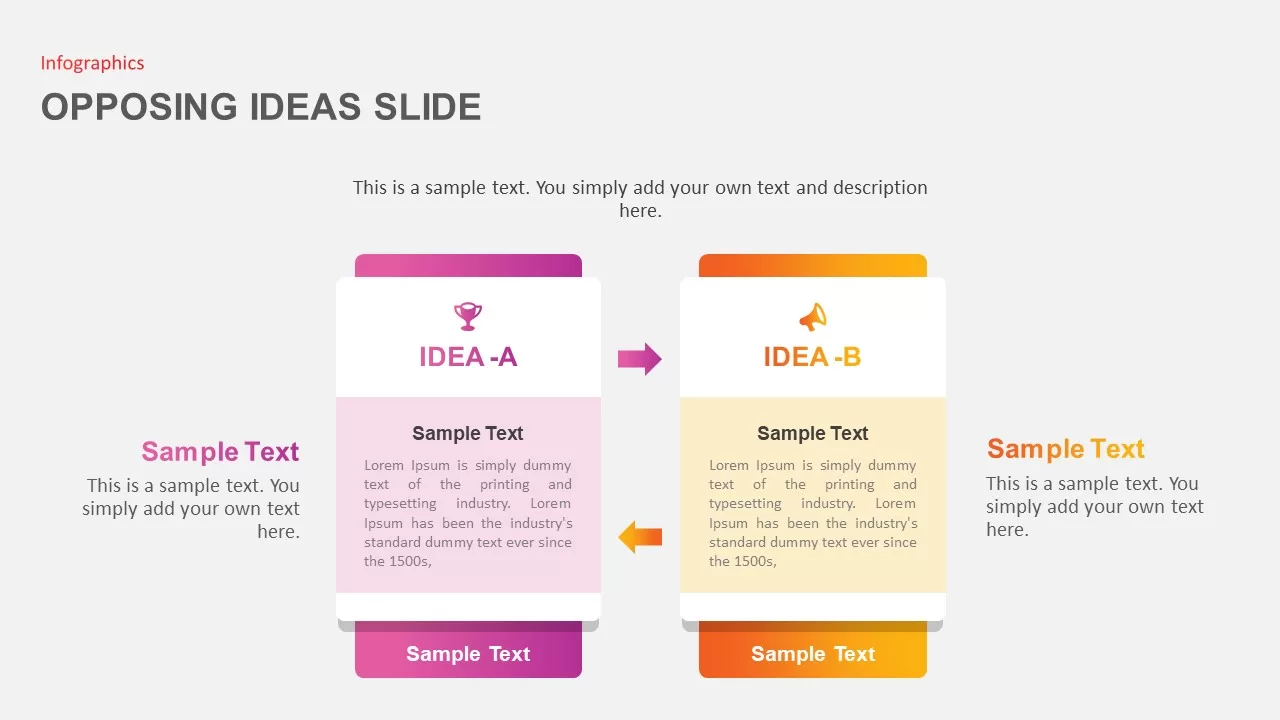
Opposing Ideas Infographics Pack Template for PowerPoint & Google Slides
Comparison
Business Growth Plant Infographics Pack Template for PowerPoint & Google Slides
Process
8-Step Circular Diagram Infographics Template for PowerPoint & Google Slides
Circular
Floating Island Ecosystem Infographics Template for PowerPoint & Google Slides
Graphics
Versatile 3D Modular Shape Infographics Template for PowerPoint & Google Slides
Infographics
6 Stage Timeline Infographics template for PowerPoint & Google Slides
Timeline
Dental Infographics Process template for PowerPoint & Google Slides
Health
Doodle Infographics Template for PowerPoint & Google Slides
Infographics

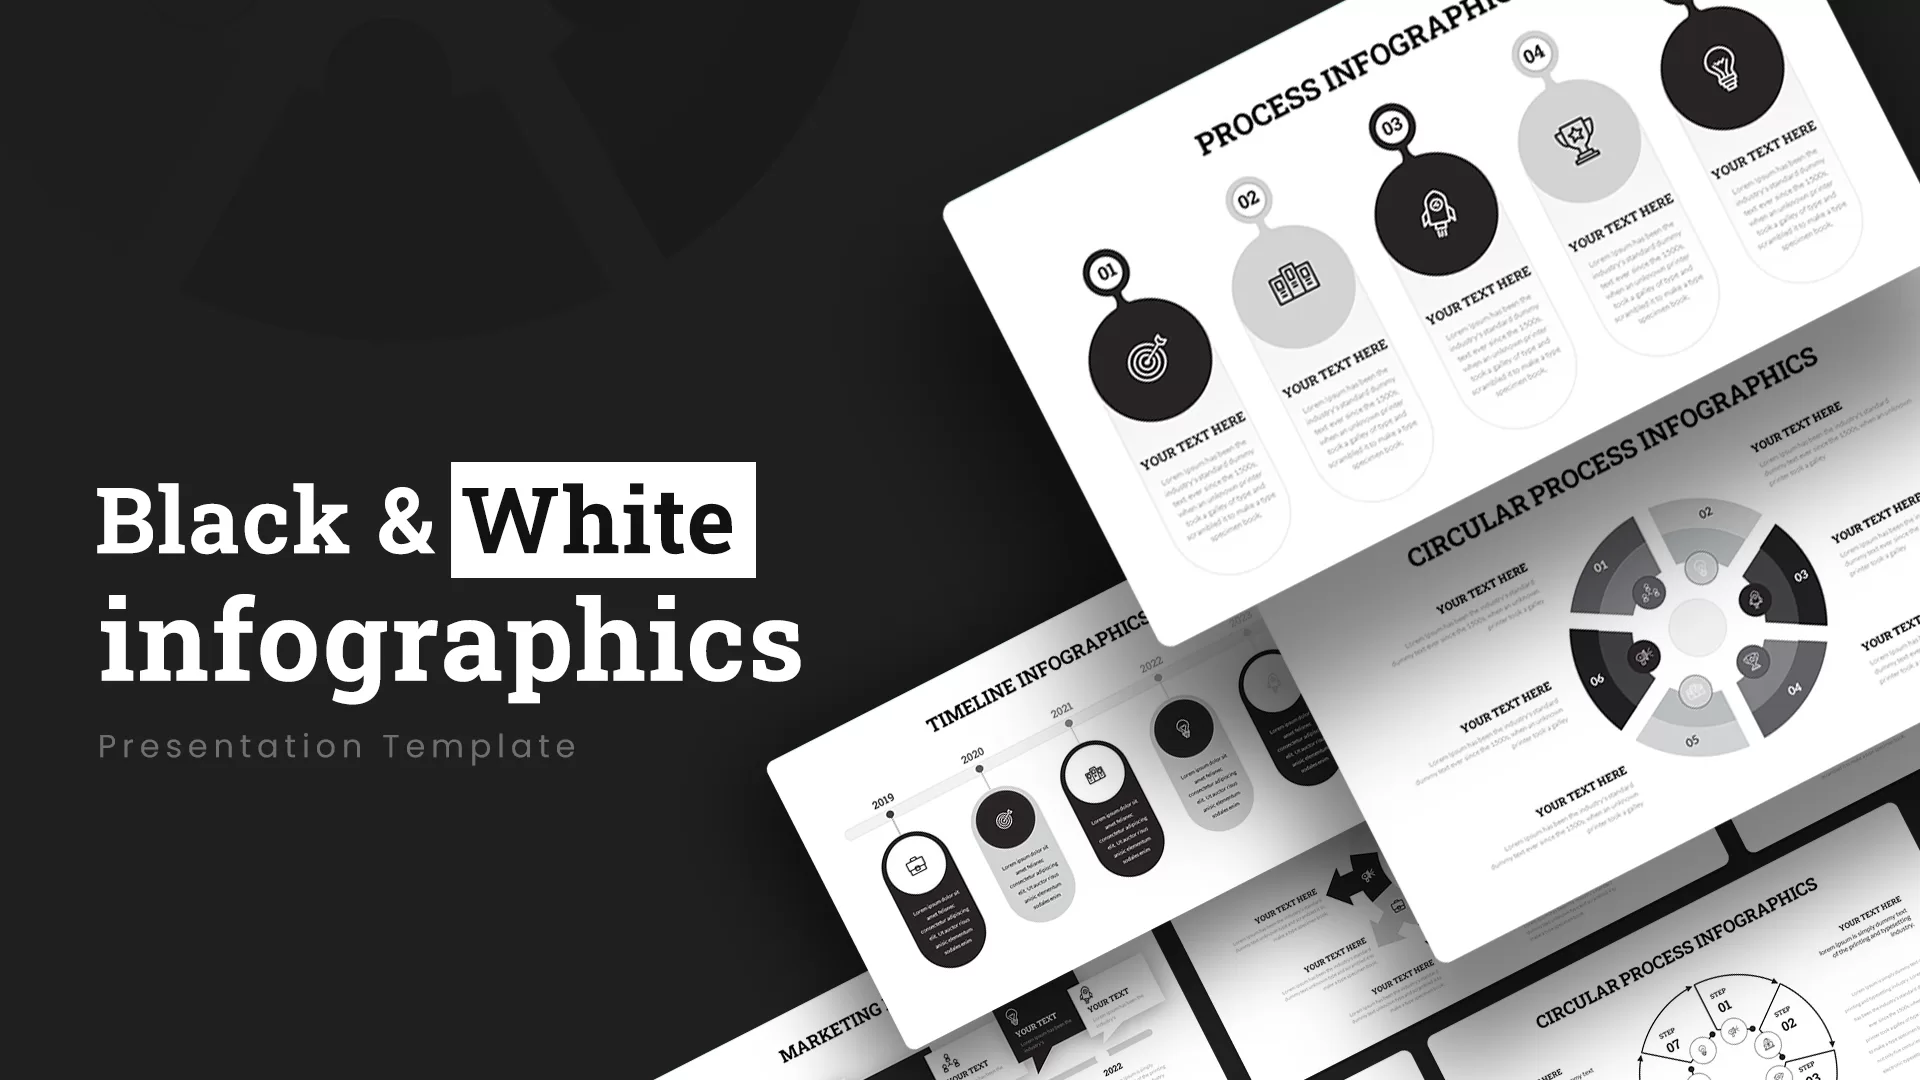
Black and White Infographics template for PowerPoint & Google Slides
Business
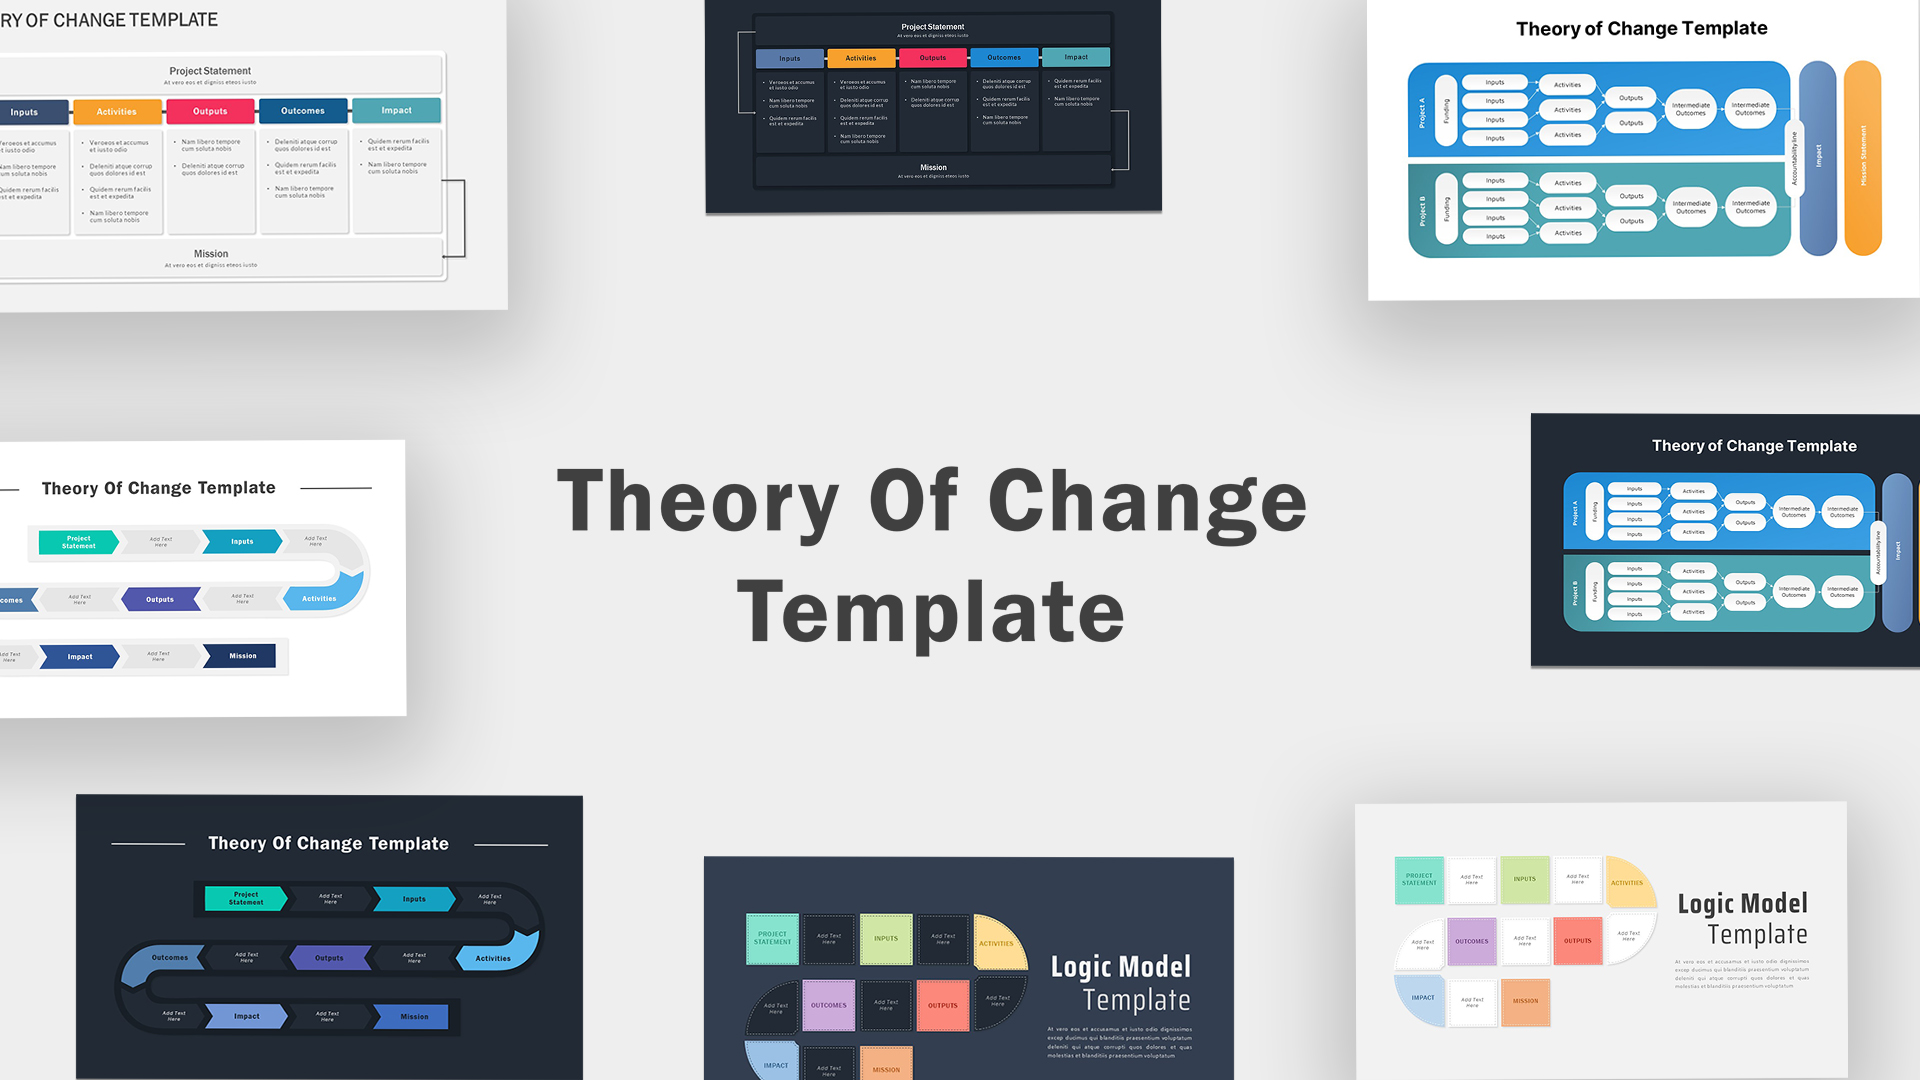
Theory of Change Infographics Pack Template for PowerPoint & Google Slides
Process
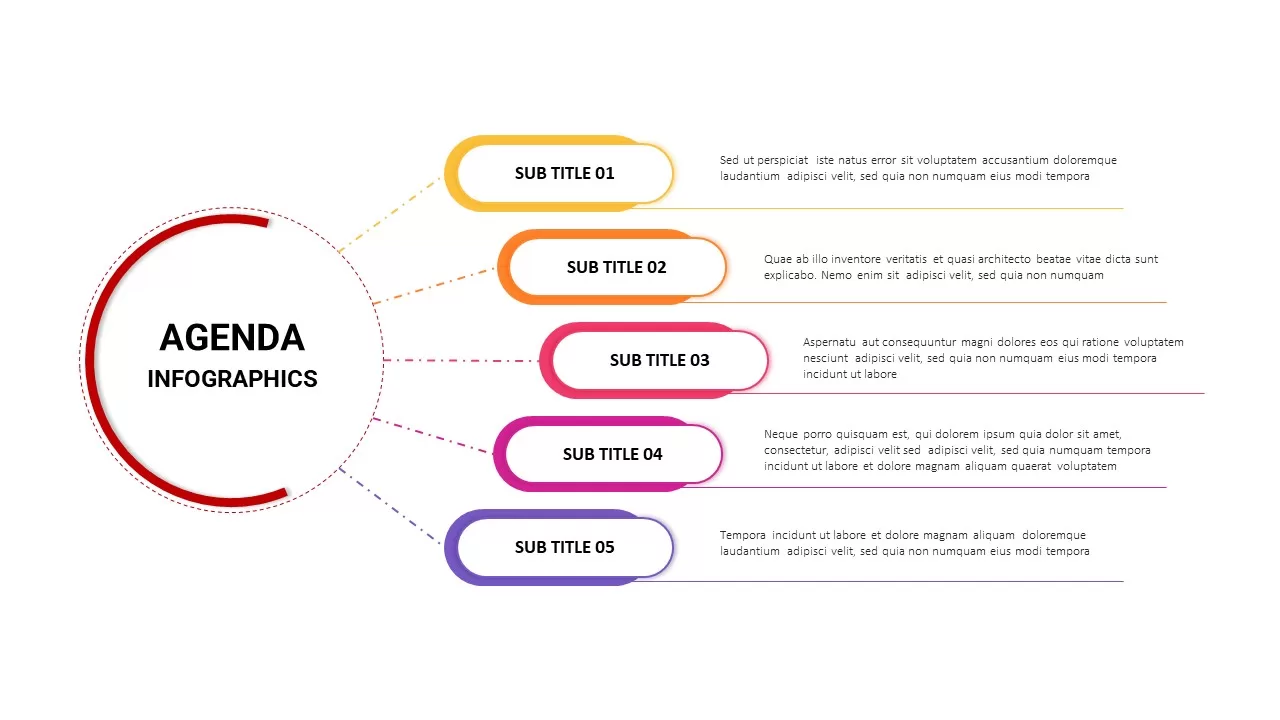
Agenda Infographics Structure template for PowerPoint & Google Slides
Business Plan
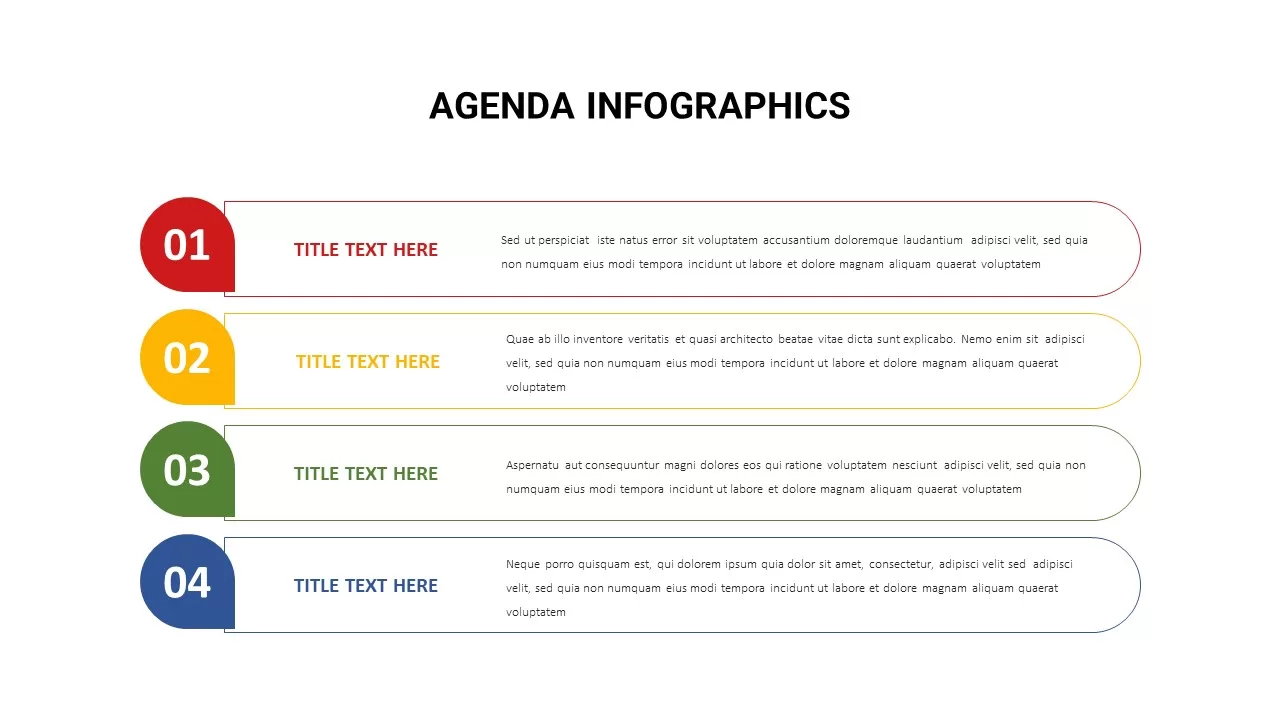
Agenda Infographics List template for PowerPoint & Google Slides
Business Plan
Colorful Process Flow Infographics Template for PowerPoint & Google Slides
Process
Question Mark Infographics template for PowerPoint & Google Slides
Infographics
Animated Timeline Infographics template for PowerPoint & Google Slides
Timeline
Timeline Infographics template for PowerPoint & Google Slides
Timeline
Free Percentage Infographics template for PowerPoint & Google Slides
Comparison
Free
Before and After Comparison Infographics Template for PowerPoint & Google Slides
Comparison
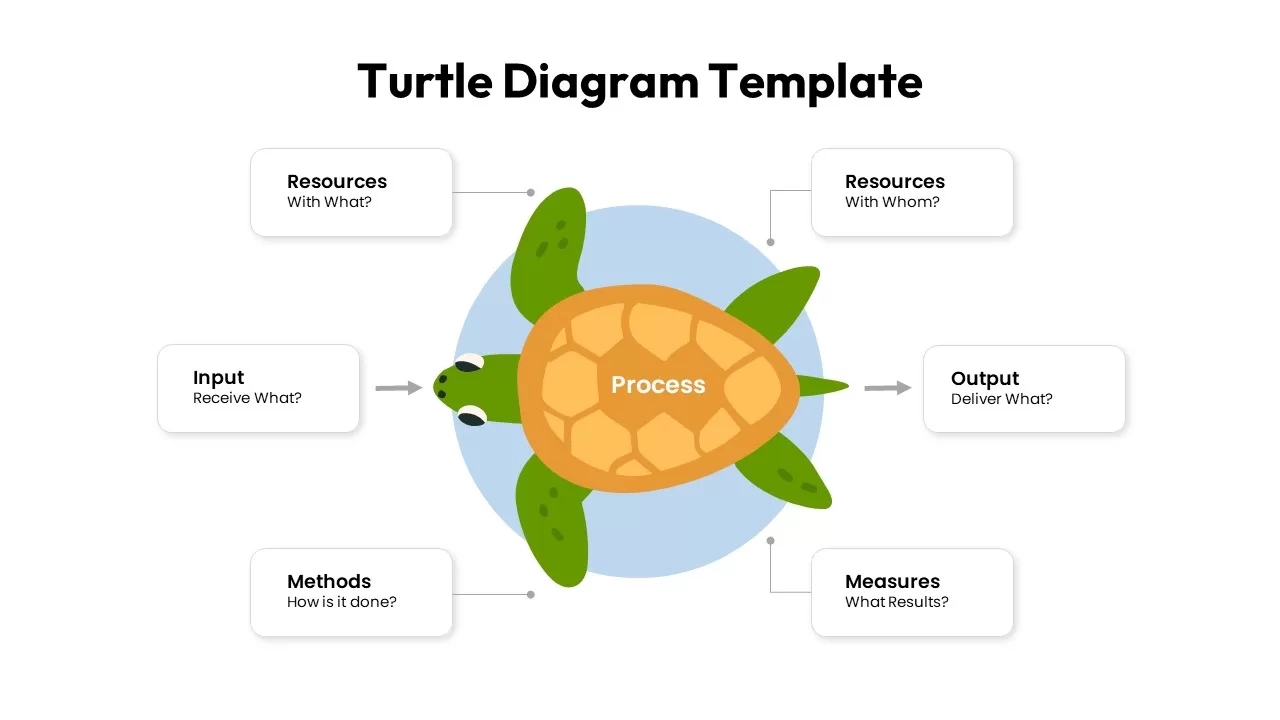
Turtle Diagram Infographics Template for PowerPoint & Google Slides
Process
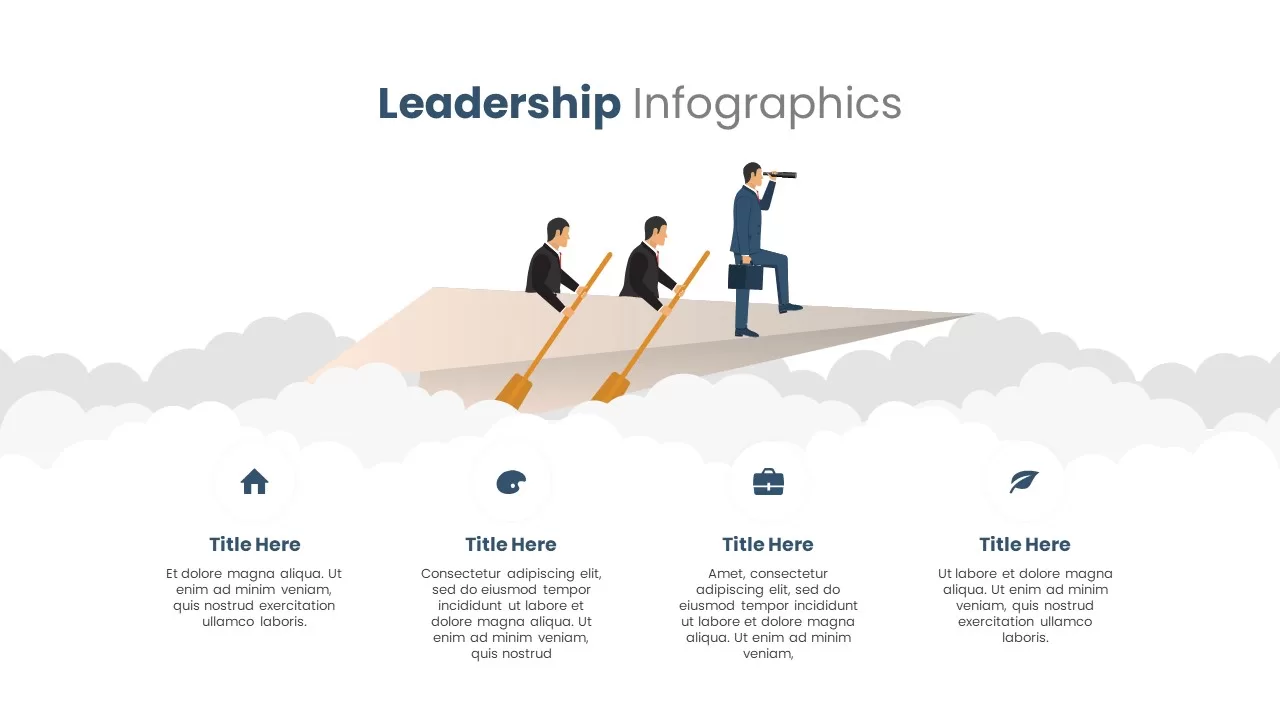
Versatile Leadership Infographics Template for PowerPoint & Google Slides
Infographics
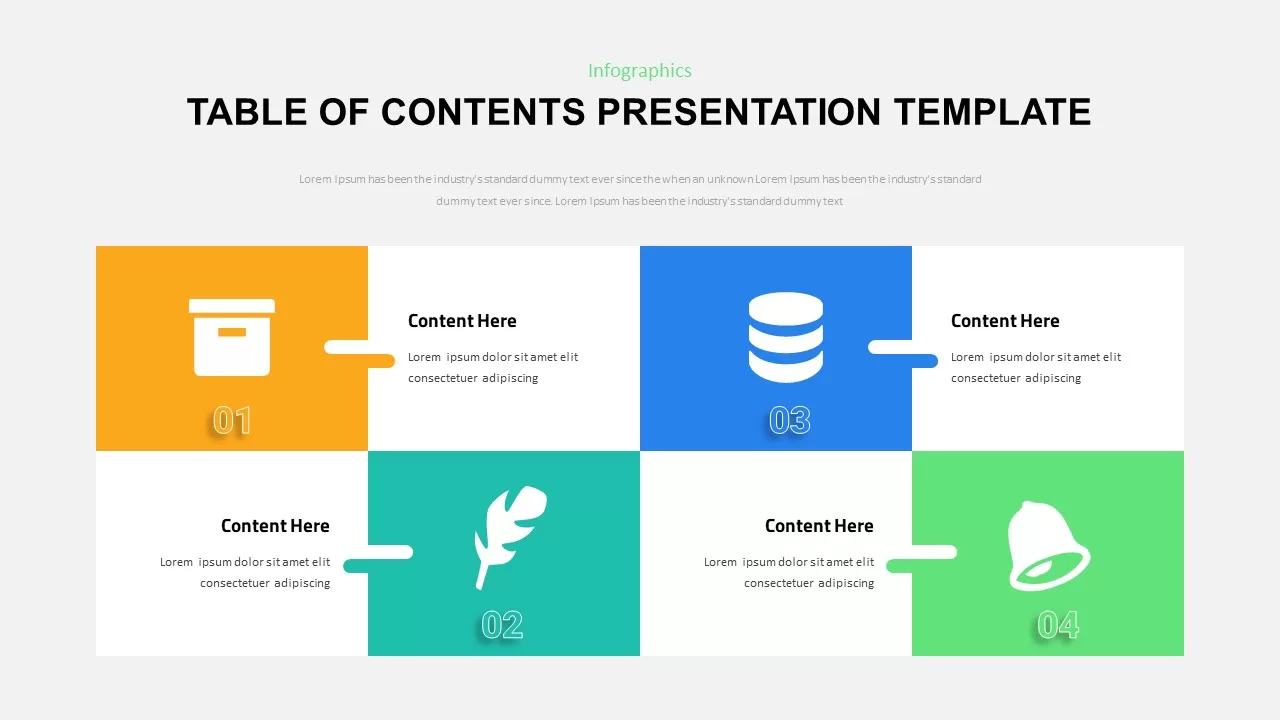
Table of Contents Infographics template for PowerPoint & Google Slides
Company Profile
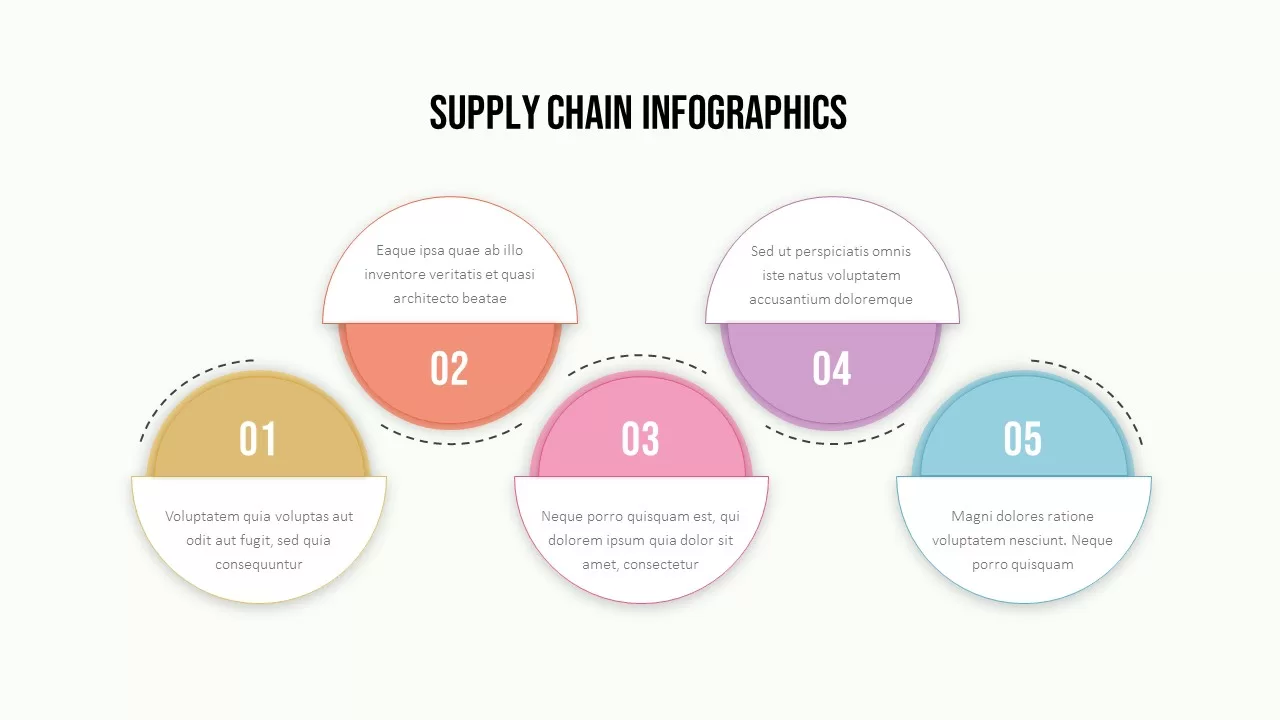
Supply Chain Circular Process Infographics Template for PowerPoint & Google Slides
Business Strategy
Domino Effect Sequential Infographics Template for PowerPoint & Google Slides
Process
Agriculture Infographics Slide with Progress Rings & Metrics Template for PowerPoint & Google Slides
Pie/Donut
Hiring Process Timeline Infographics Template for PowerPoint & Google Slides
Recruitment
5 Layer Concentric Circles Infographics Template for PowerPoint & Google Slides
Circular
Flywheel Infographics Pack Template for PowerPoint & Google Slides
Circular
Flywheel Infographics template for PowerPoint & Google Slides
Business Strategy
Modern Social Media Infographics Template for PowerPoint & Google Slides
Digital Marketing
Conflict Infographics Comparison Template for PowerPoint & Google Slides
Infographics

DevOps Infographics & Process Flow Template for PowerPoint & Google Slides
Information Technology
Pharmacology Infographics Slide Template for PowerPoint & Google Slides
Health
Free Colorful Timeline Infographics Template for PowerPoint & Google Slides
Timeline
Free
Free Law Infographics Slide Pack Collection Template for PowerPoint & Google Slides
Infographics
Free
Free Biology Theme Infographics Deck Template for PowerPoint & Google Slides
Health
Free
5 Styles Key Outcomes Infographics Pack Template for PowerPoint & Google Slides
Infographics
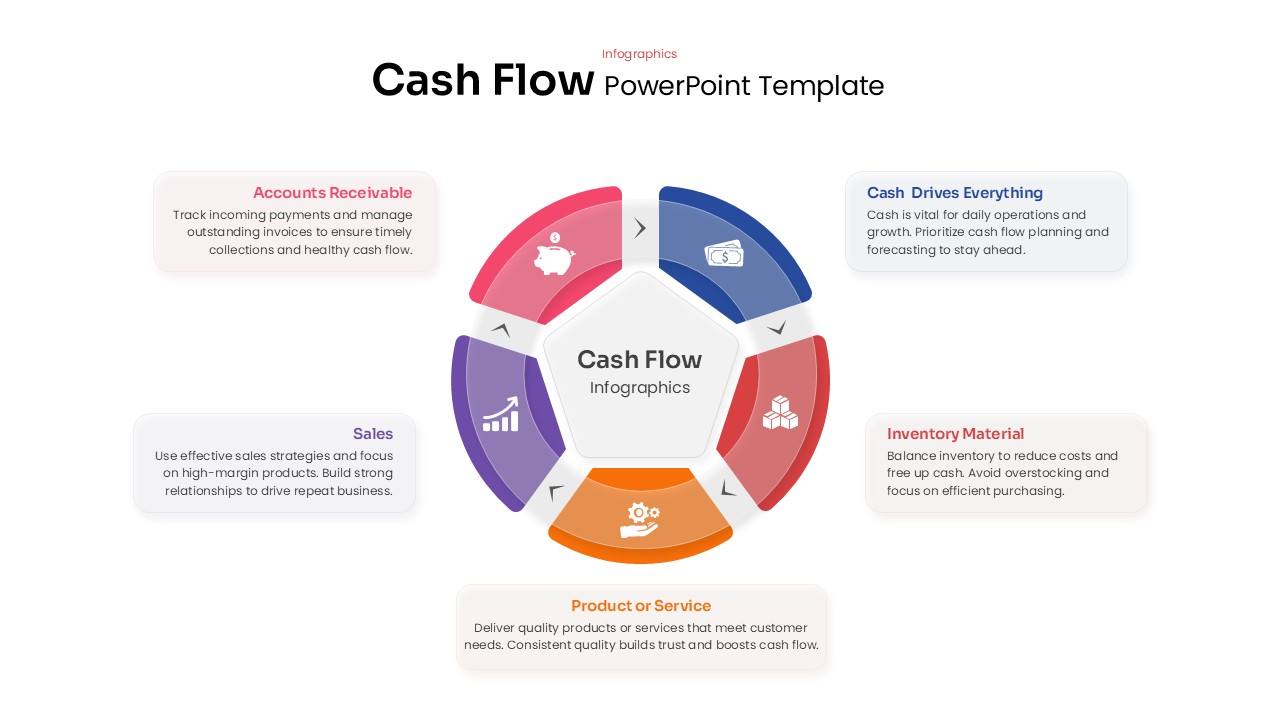
Cash Flow Infographics template for PowerPoint & Google Slides
Business
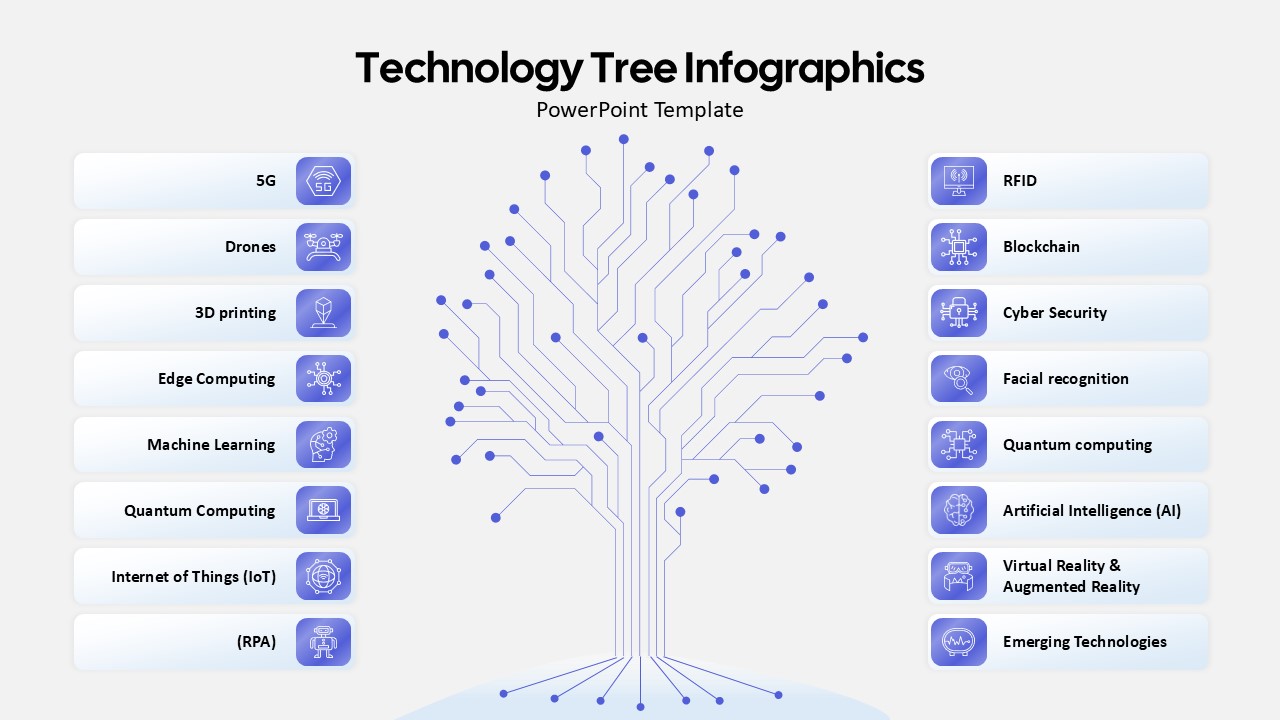
Technology Tree Infographics Template for PowerPoint & Google Slides
AI