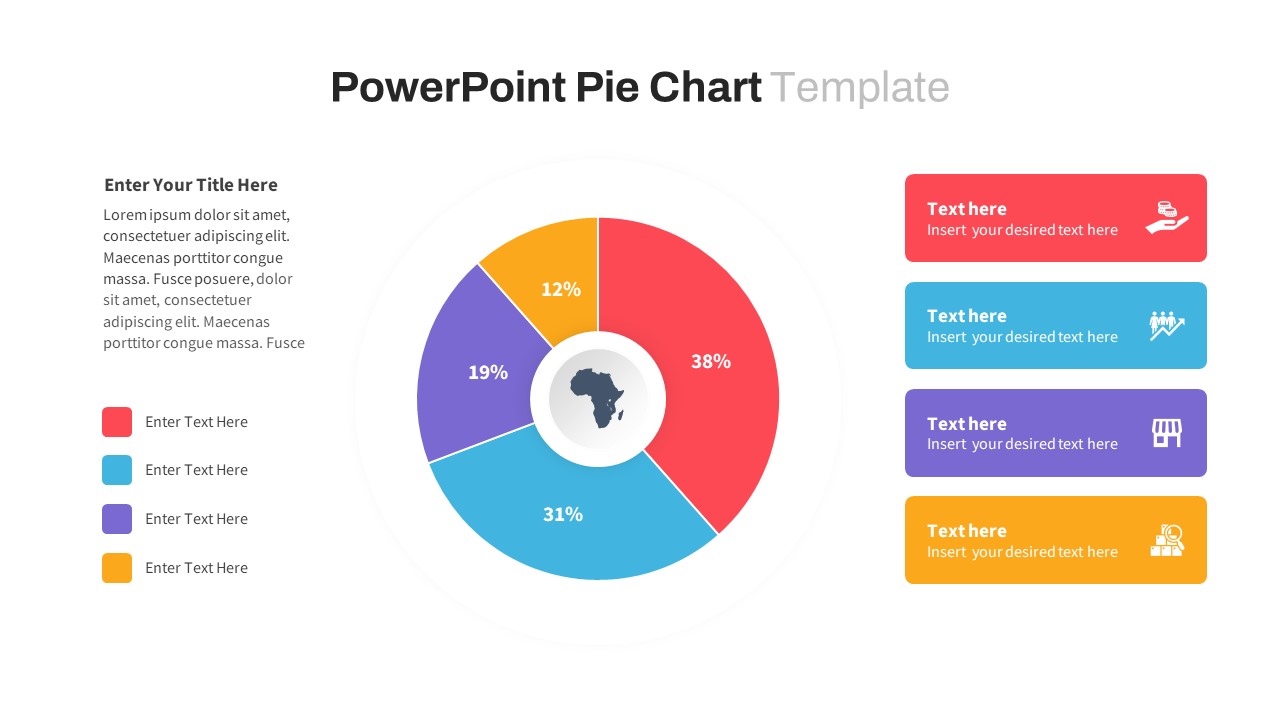
Pie and Donut Chart Templates for PowerPoint and Google Slides
Present data with clarity and style using our Pie and Donut Chart Templates for PowerPoint and Google Slides. These visual formats are perfect for showing proportions, percentages, comparisons, and distributions in an easy-to-understand way. Whether you’re illustrating market share, budget allocation, survey results, or performance metrics, pie and donut charts allow you to highlight key insights at a glance.
These templates are fully editable and compatible with both Microsoft PowerPoint (PPT) and Google Slides, making them ideal for business professionals, educators, marketers, and analysts.
![]() Filter
Filter
Filter
-

Comparison Donut Chart PowerPoint Template and Keynote
Pie/Donut
-

Social Media Market Share Pie Charts Template for PowerPoint & Google Slides
Pie/Donut
-

Gear Pie Diagram Data Visualization Template for PowerPoint & Google Slides
Pie/Donut
-

Eight Section Donut Chart Infographic Template for PowerPoint & Google Slides
Pie/Donut
-

Pie Segment Diagram Four-Step Process Template for PowerPoint & Google Slides
Pie/Donut
-
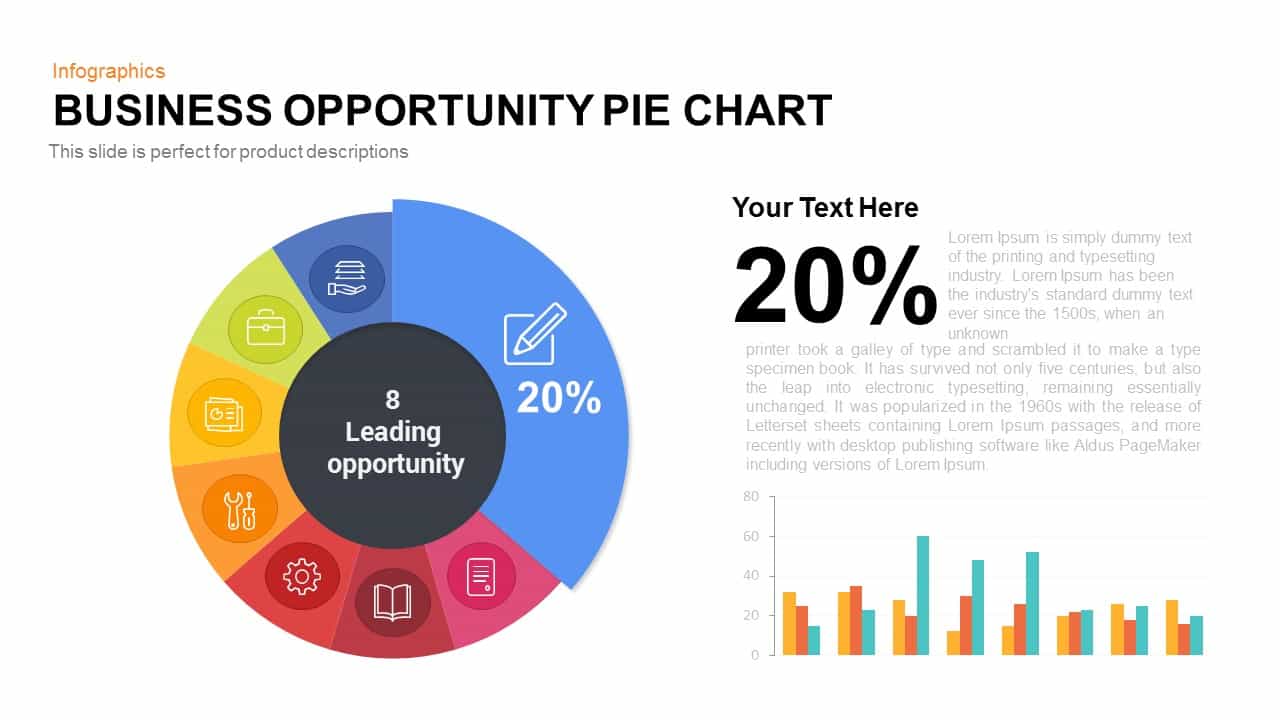
Business Opportunity Pie Chart Template for PowerPoint & Google Slides
Pie/Donut
-

Three Segment Donut Chart KPI Infographic Template for PowerPoint & Google Slides
Pie/Donut
-

Quarterly Comparison Pie Chart Template for PowerPoint & Google Slides
Pie/Donut
-

Marketing Budget Allocation Donut Chart Template for PowerPoint & Google Slides
Marketing
-
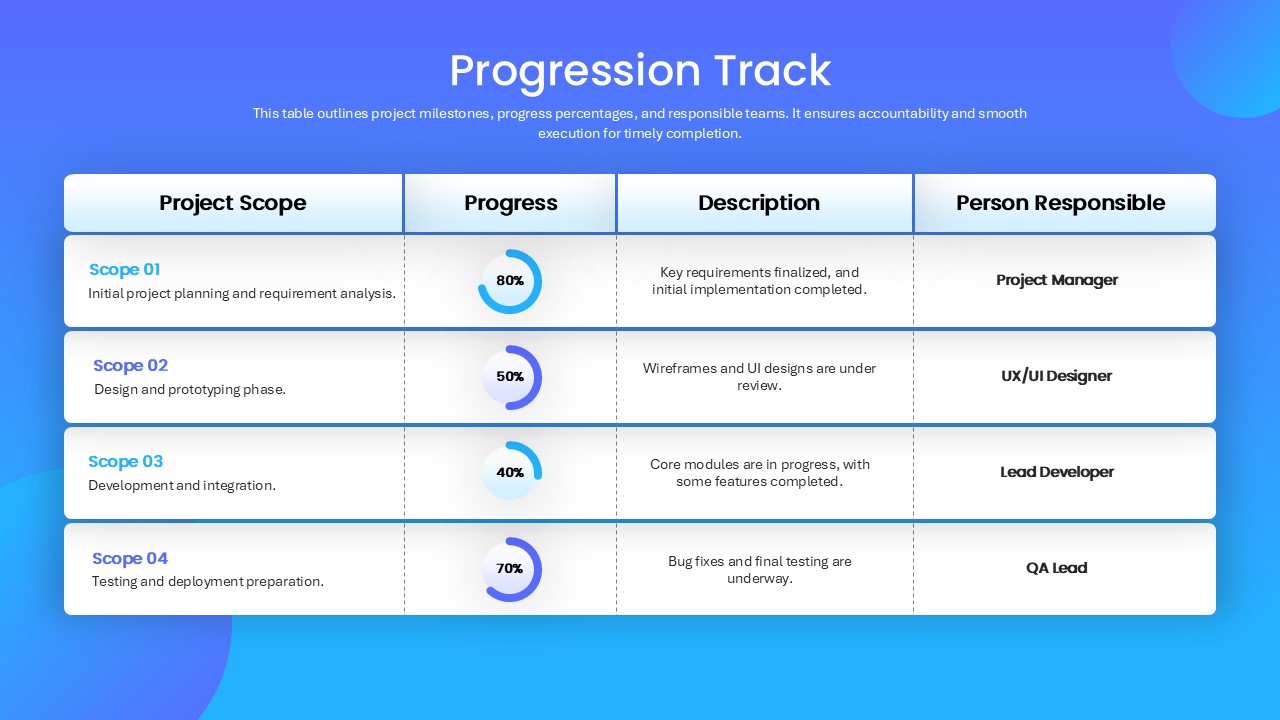
Progression Track Milestone Table Template for PowerPoint & Google Slides
Project Status
-

Budget Forecast Dashboard & Donut Charts Template for PowerPoint & Google Slides
Pie/Donut
-
Monthly Business Review Dashboard Deck Template for PowerPoint & Google Slides
Business Report
-
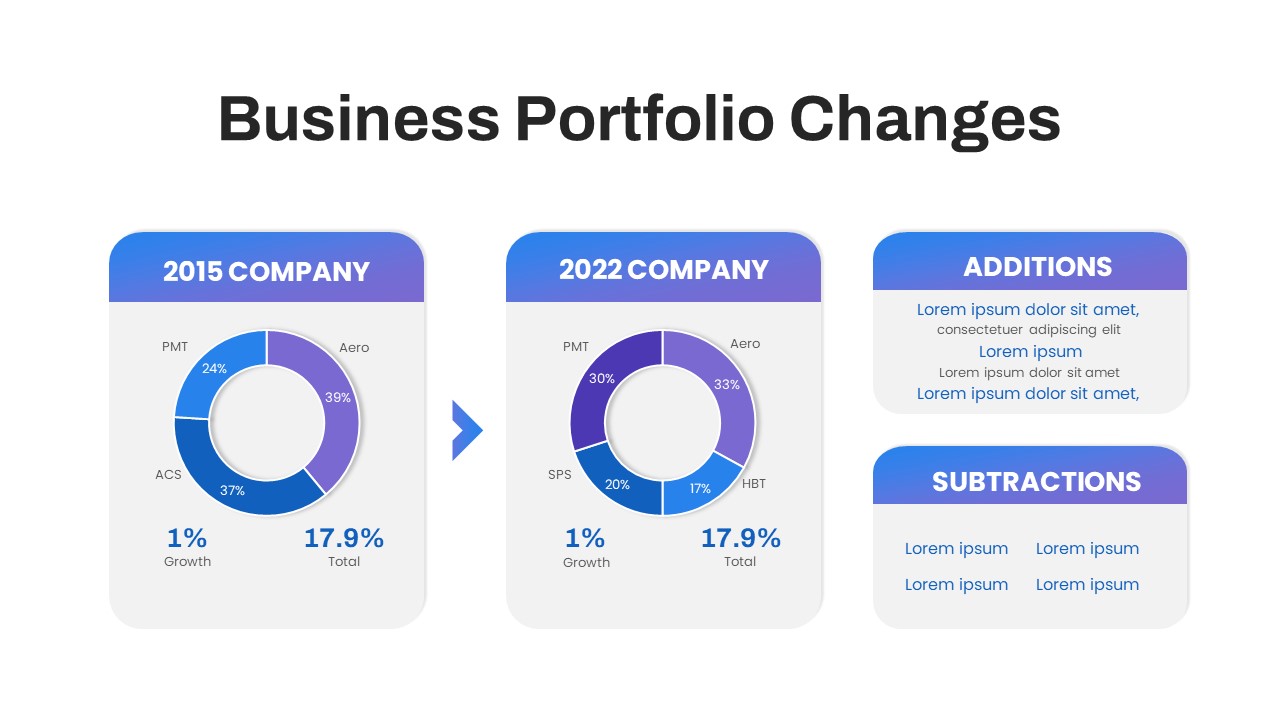
Business Portfolio Changes Donut Chart Template for PowerPoint & Google Slides
Pie/Donut
-
Dynamic Bar-of-Pie Chart Comparison Template for PowerPoint & Google Slides
Pie/Donut
-
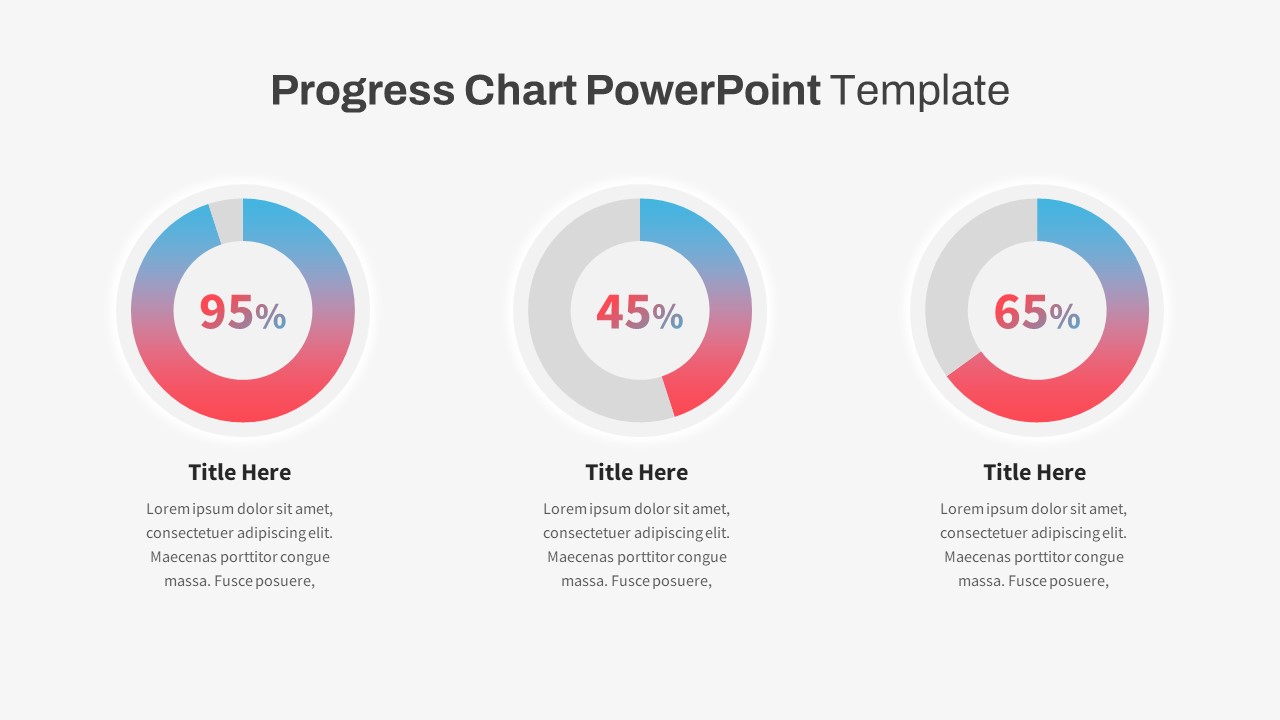
Progress Chart Slide for PowerPoint & Google Slides
Charts
-
Segmented Pie Chart Infographic with Icons for PowerPoint & Google Slides
Pie/Donut
-
Free Infographic Statistics Dashboard Slide for PowerPoint & Google Slides
Bar/Column
Free
-
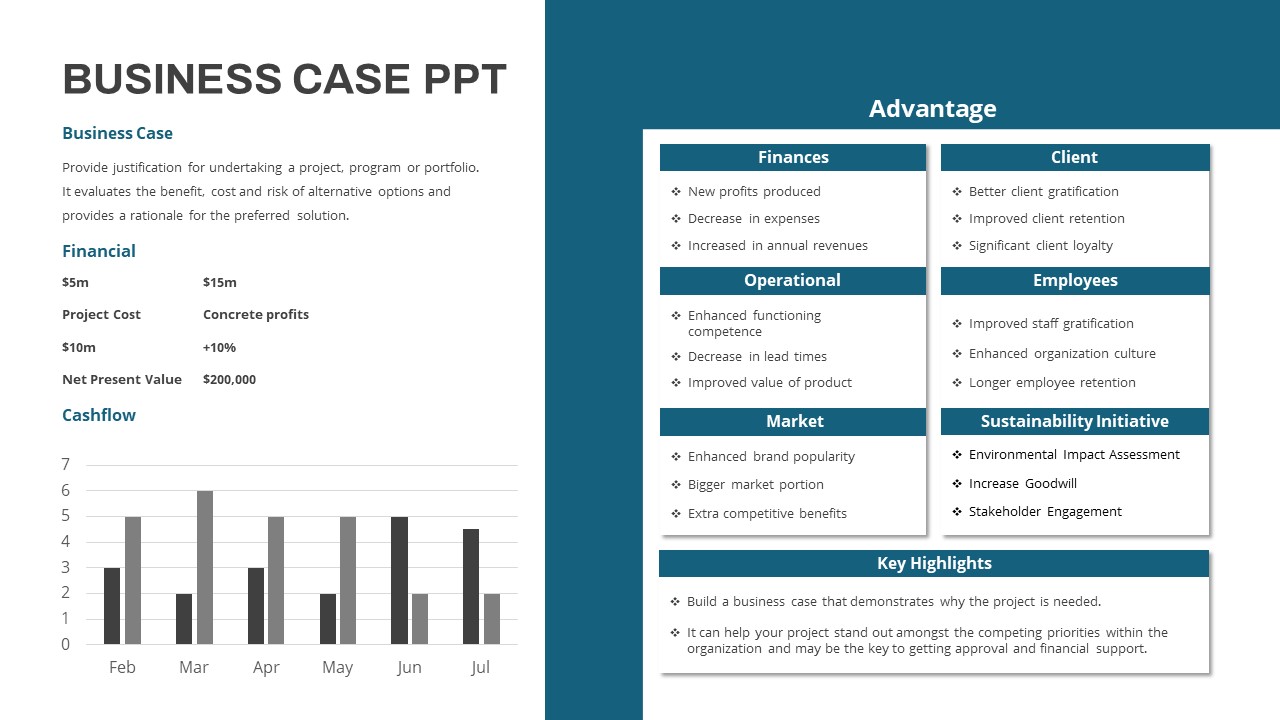
Comprehensive Business Case Presentation Template for PowerPoint & Google Slides
Pie/Donut
-
Cost Cutting Savings Dashboard Template for PowerPoint & Google Slides
Pie/Donut
-
Multi-Level Wheel Chart Diagram template for PowerPoint & Google Slides
Pie/Donut
-

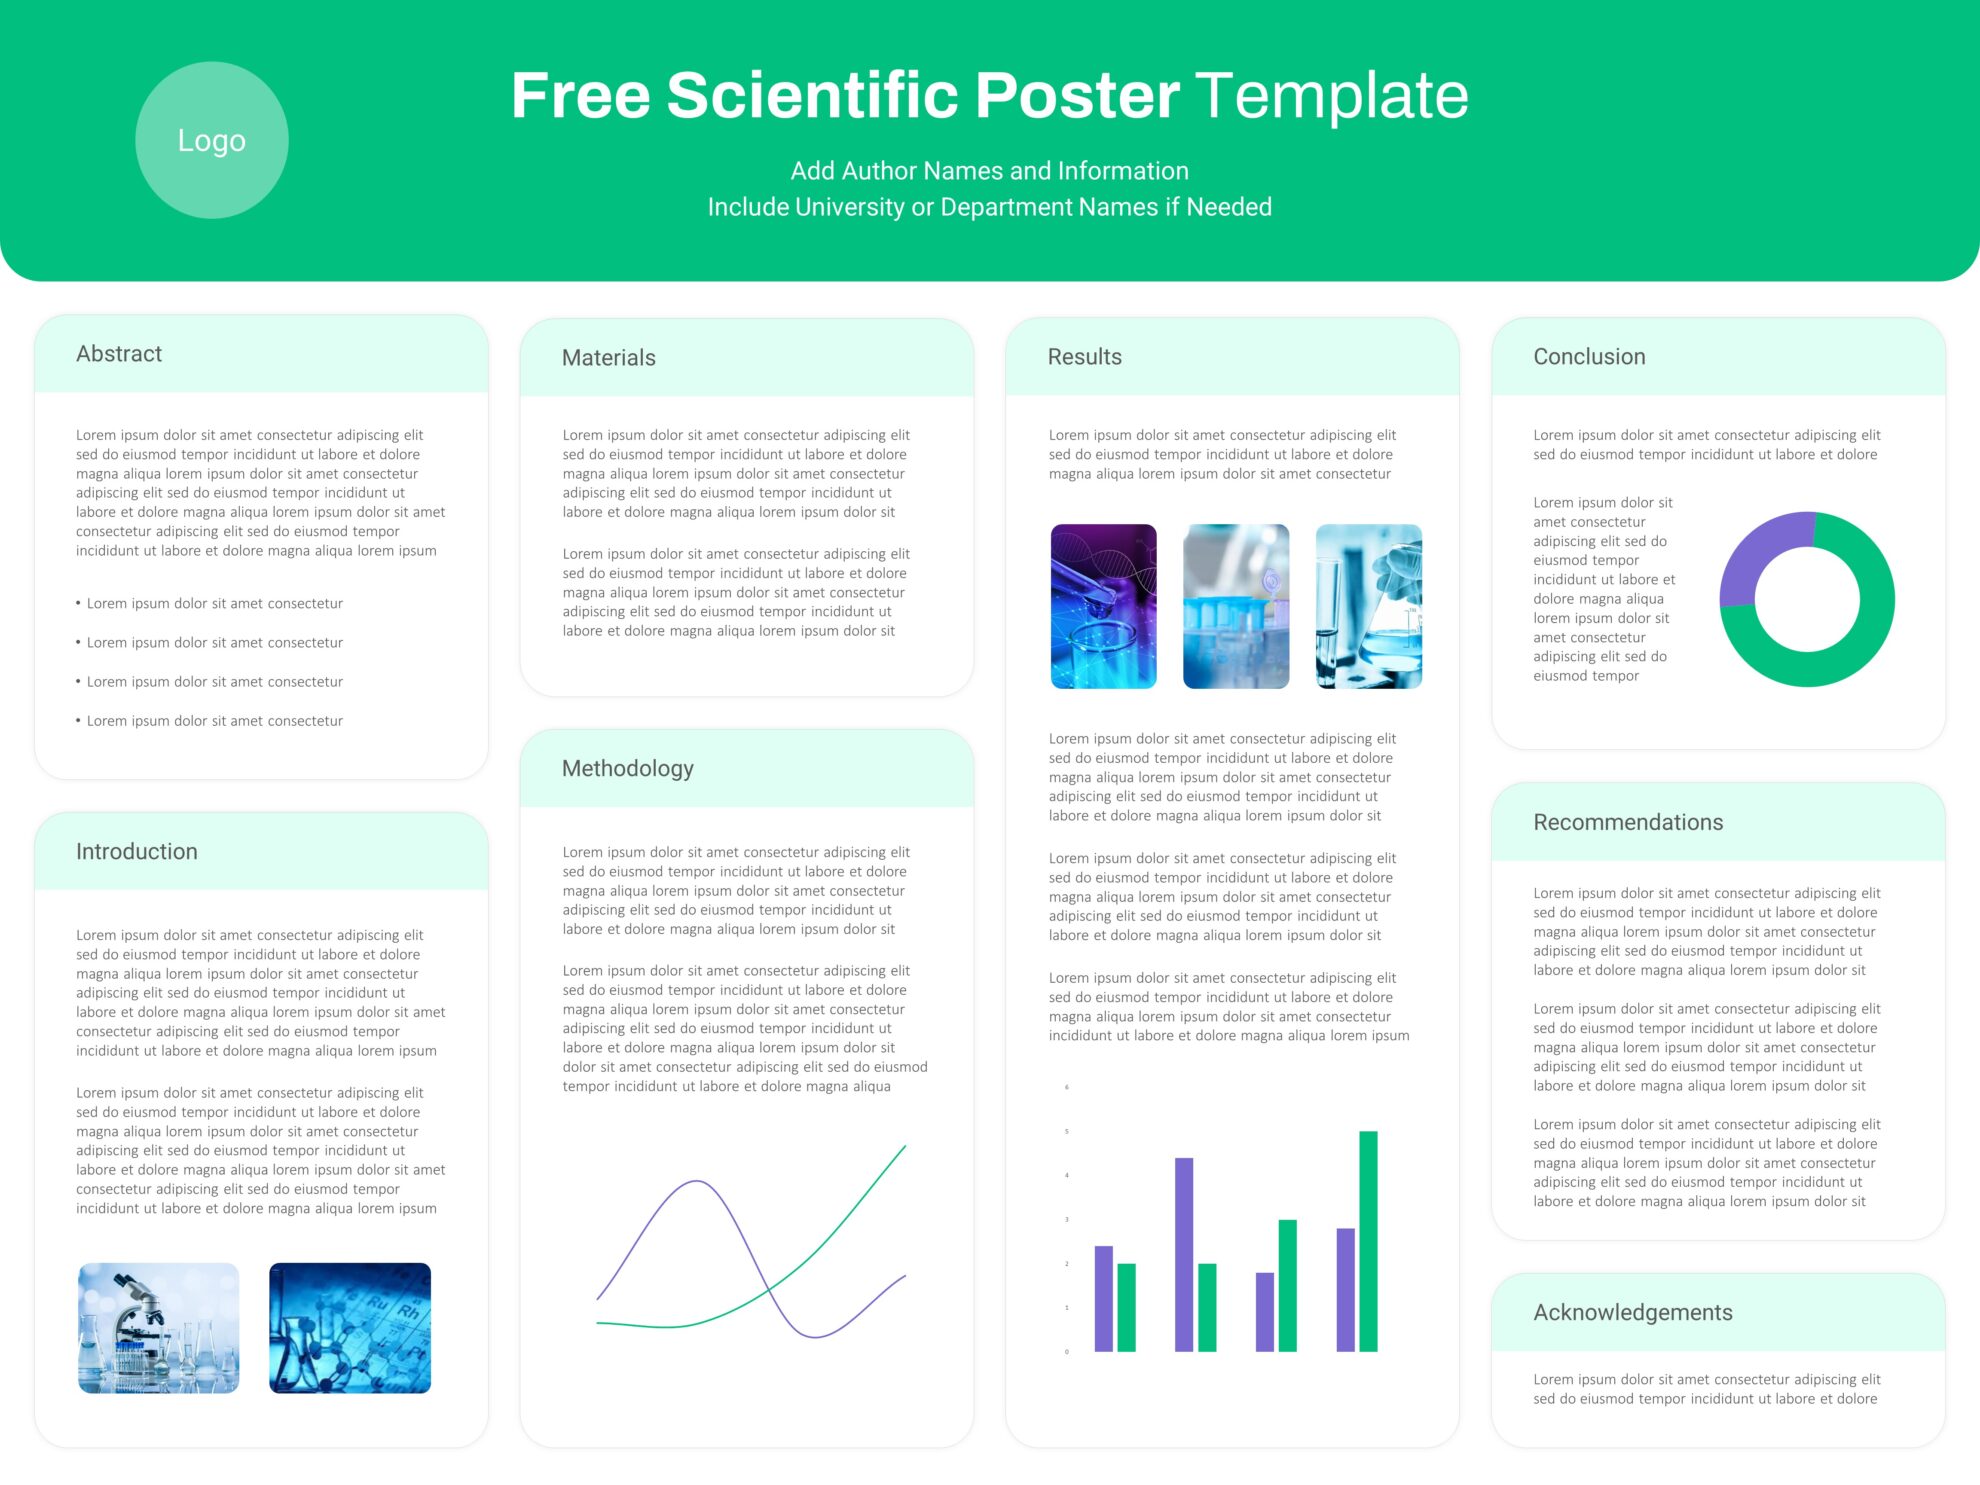
Free Scientific Poster Presentation Template for PowerPoint & Google Slides
Bar/Column
Free
-
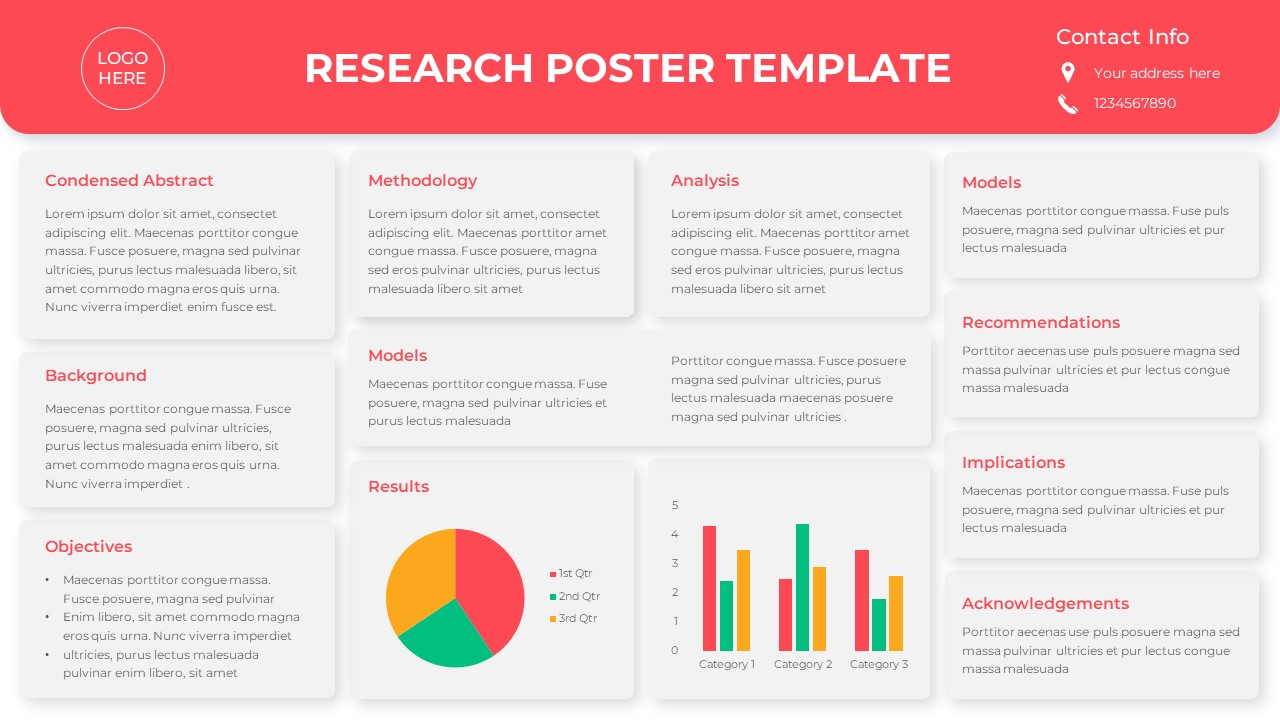
Free Research Poster with Charts Template for PowerPoint & Google Slides
Pie/Donut
Free
-
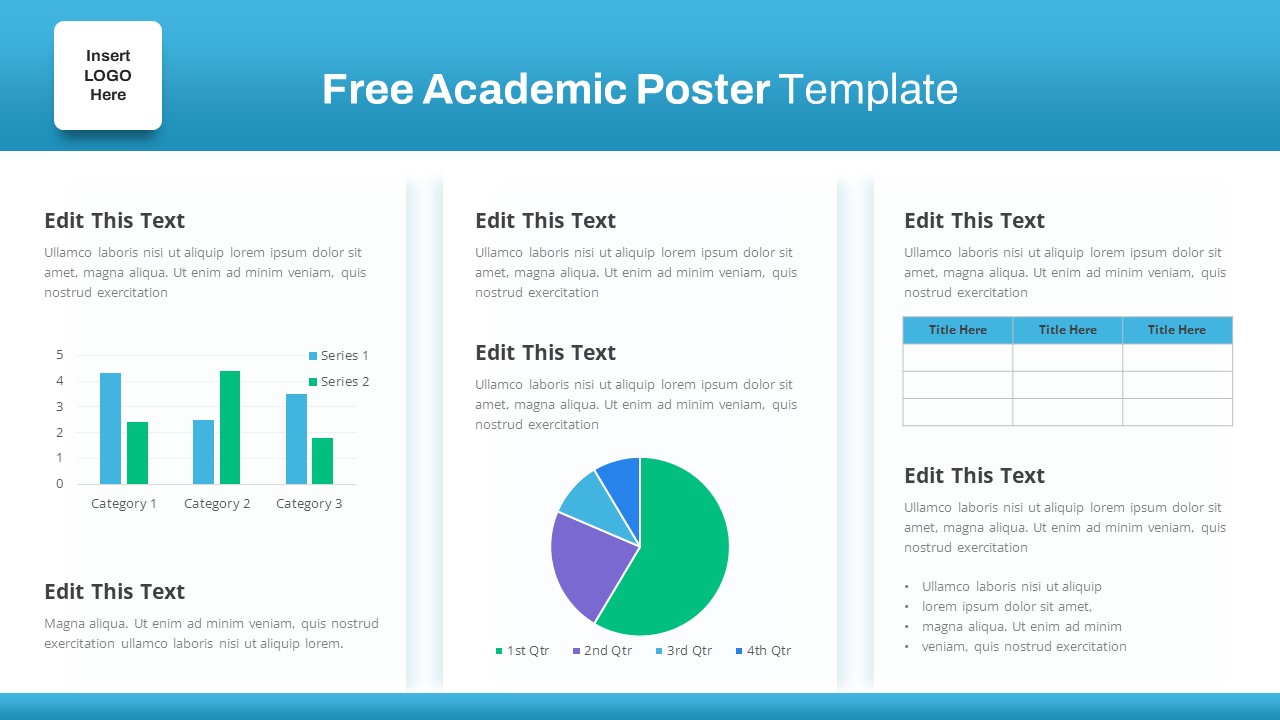
Free Academic Research Poster Design Template for PowerPoint & Google Slides
Bar/Column
Free
-
Freight Logistics Dashboard Infographic Template for PowerPoint & Google Slides
Comparison Chart
-
Professional Quad Chart Layout Template for PowerPoint & Google Slides
Pie/Donut
-
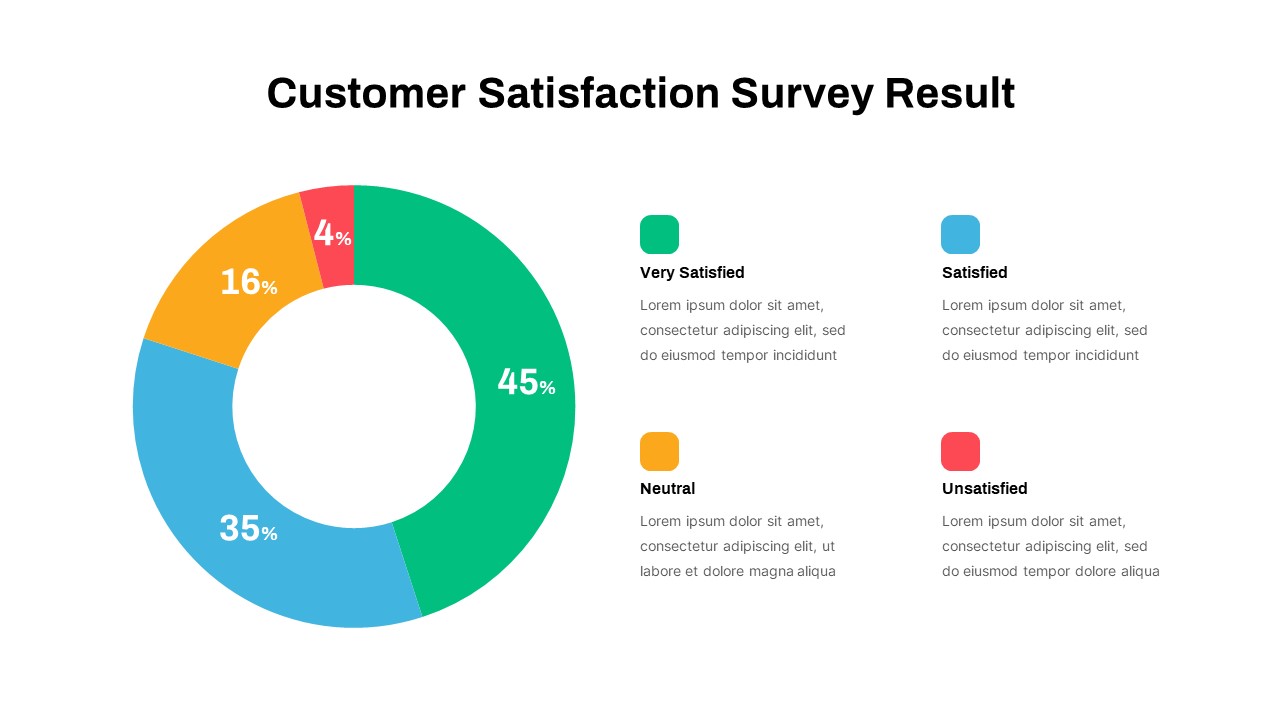
Customer Satisfaction Survey Result Template for PowerPoint & Google Slides
Marketing
-
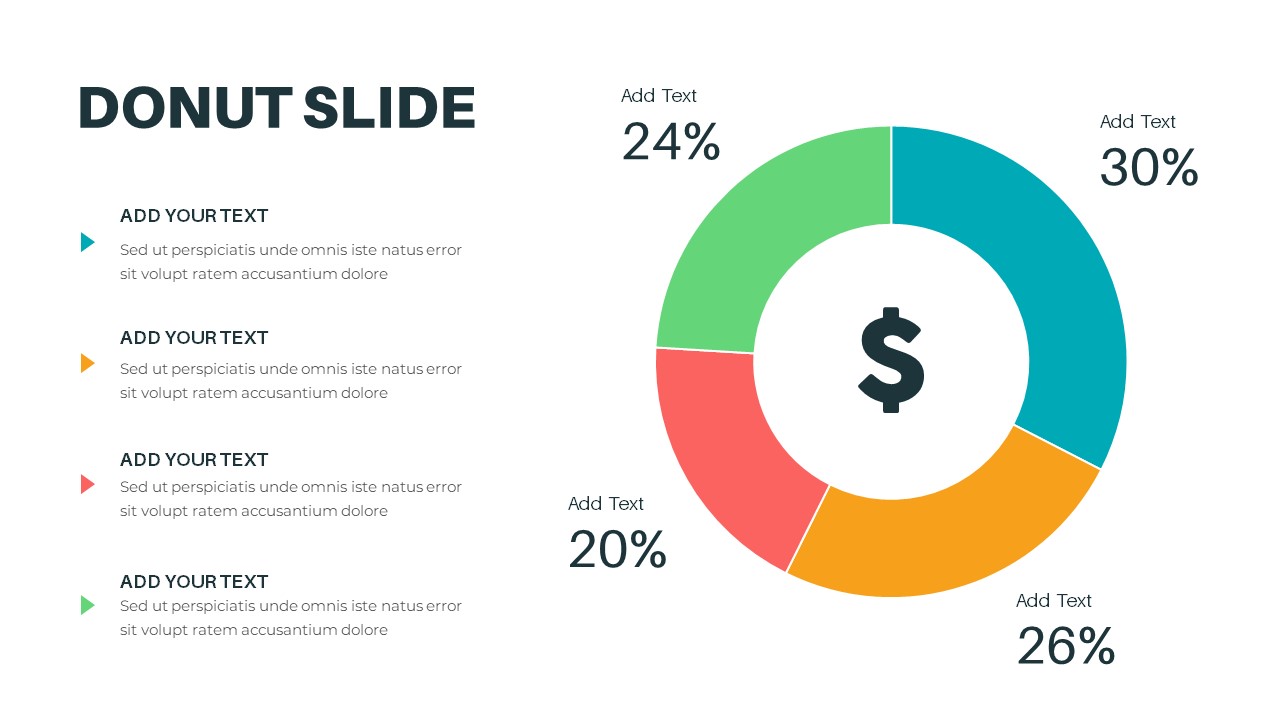
Donut Chart for PowerPoint & Google Slides
Pie/Donut
-
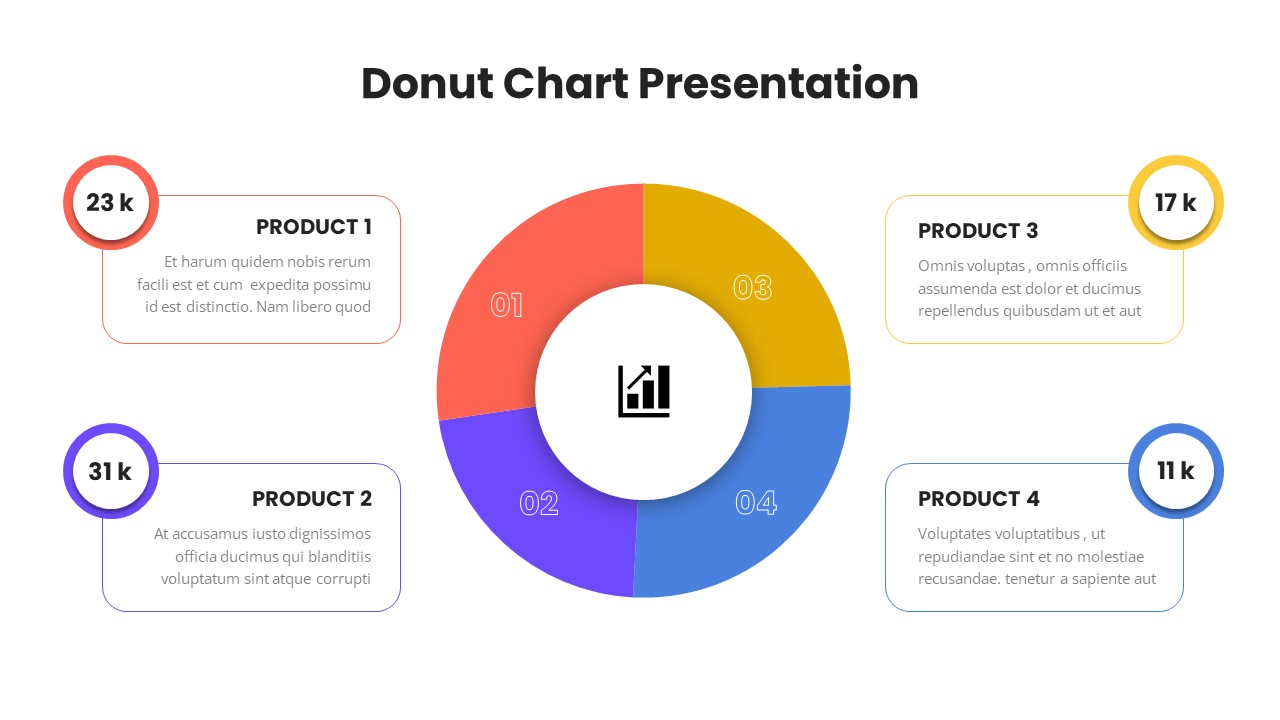
Donut Chart Presentation for PowerPoint & Google Slides
Pie/Donut
-
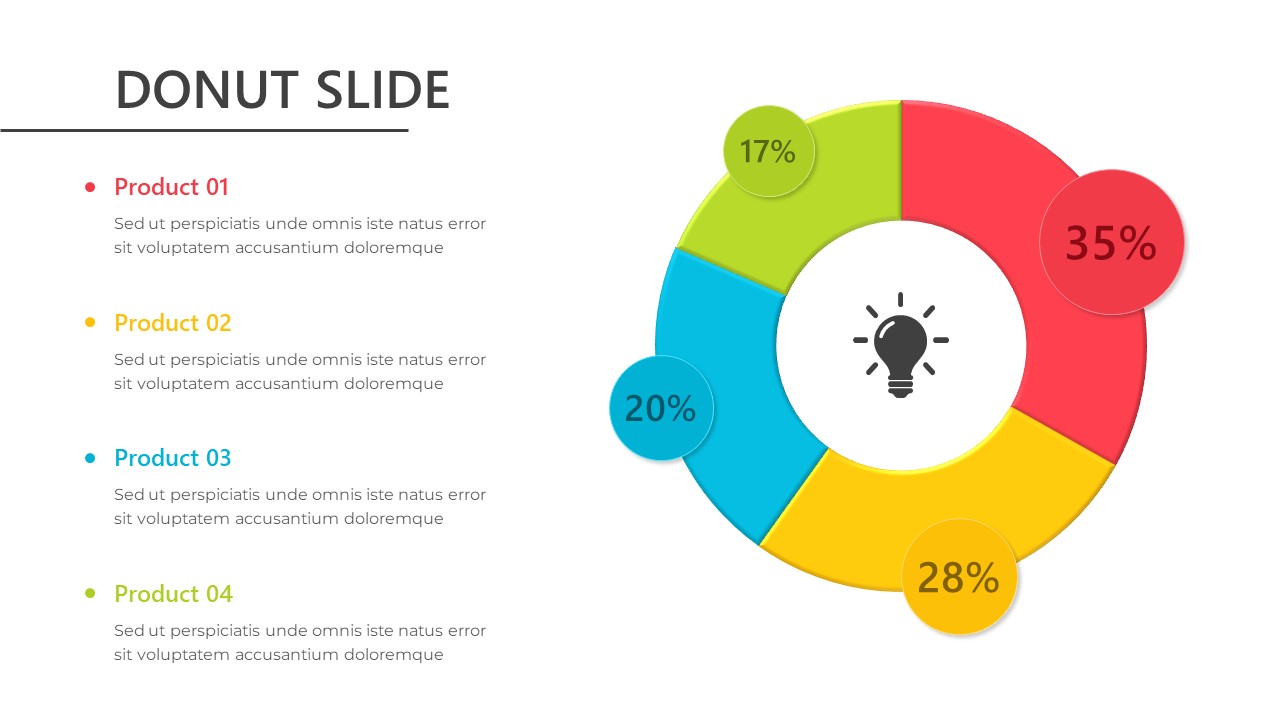
Donut Chart for PowerPoint & Google Slides
Pie/Donut
-
Donut Chart for PowerPoint & Google Slides
Pie/Donut
-
3D pie chart infographic template for PowerPoint & Google Slides
Pie/Donut
-
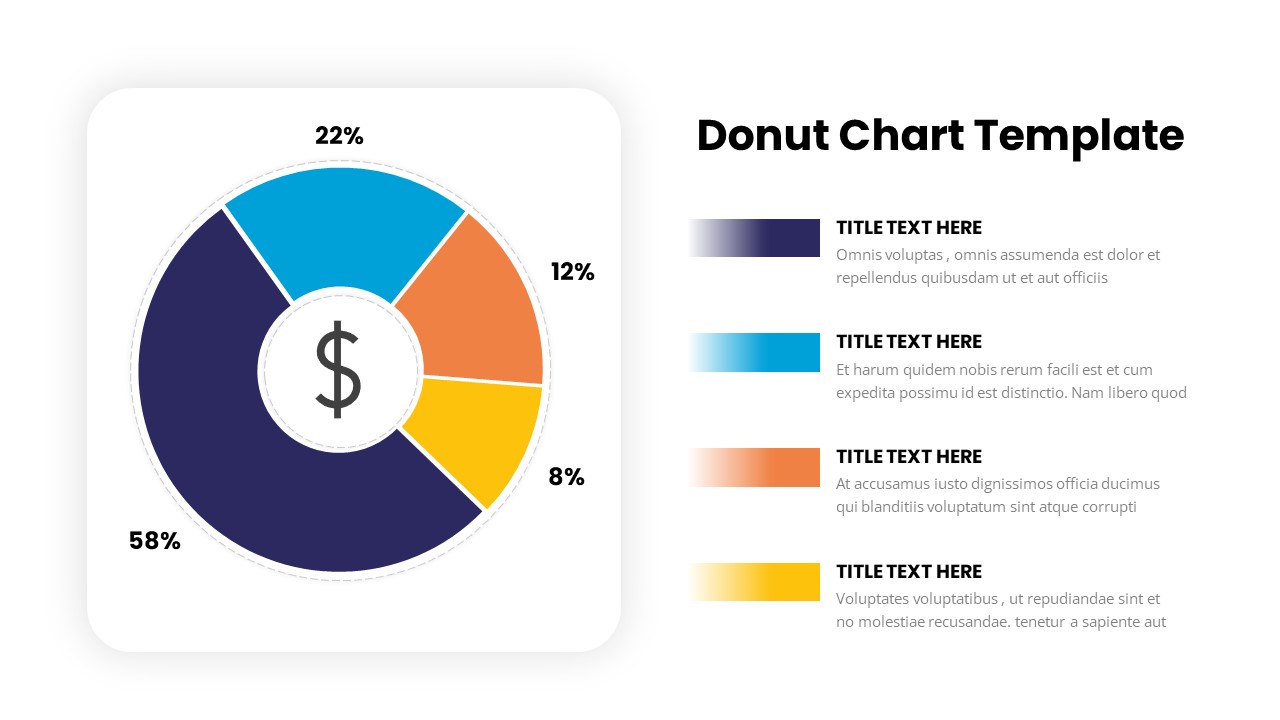
Donut Chart Data Breakdown template for PowerPoint & Google Slides
Pie/Donut
-
Free Metro UI Dashboard Infographic Template for PowerPoint & Google Slides
Business Report
Free
-
Website Performance Monitoring Dashboard Template for PowerPoint & Google Slides
Business Report
-
Dynamic Statistics & Progress Charts Template for PowerPoint & Google Slides
Pie/Donut