Ownership Dilution Overview template for PowerPoint & Google Slides

Description
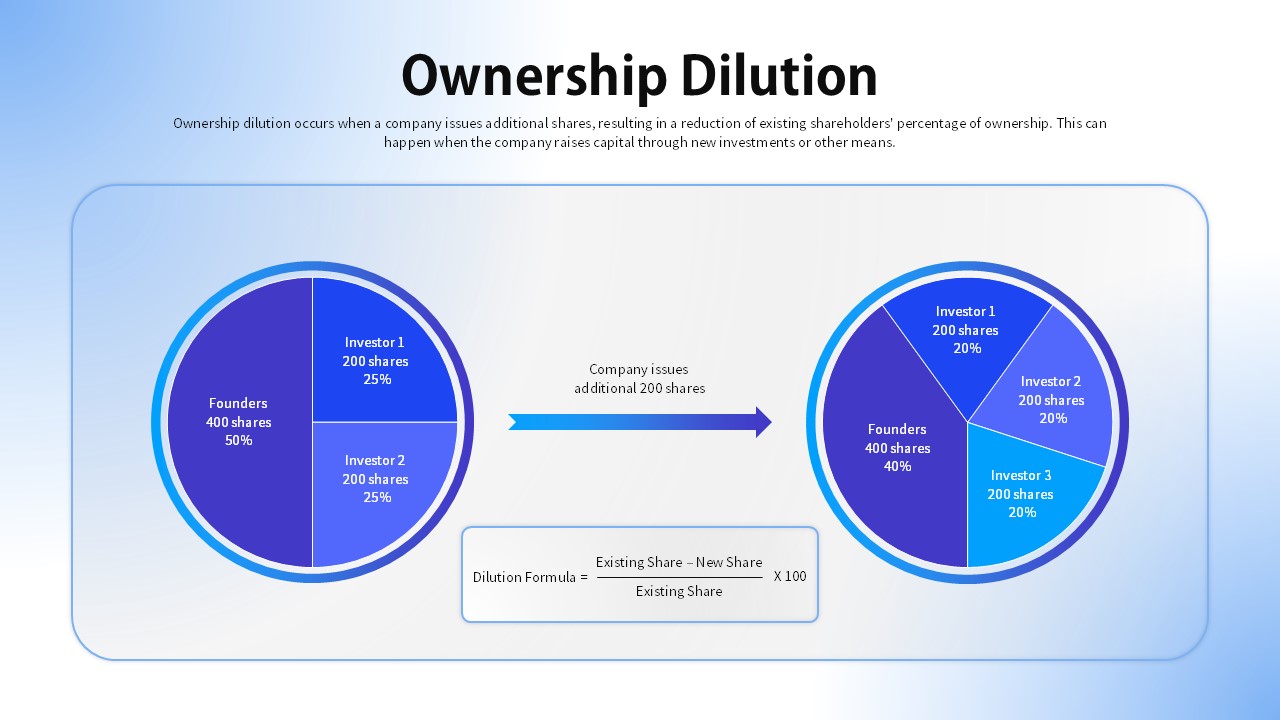
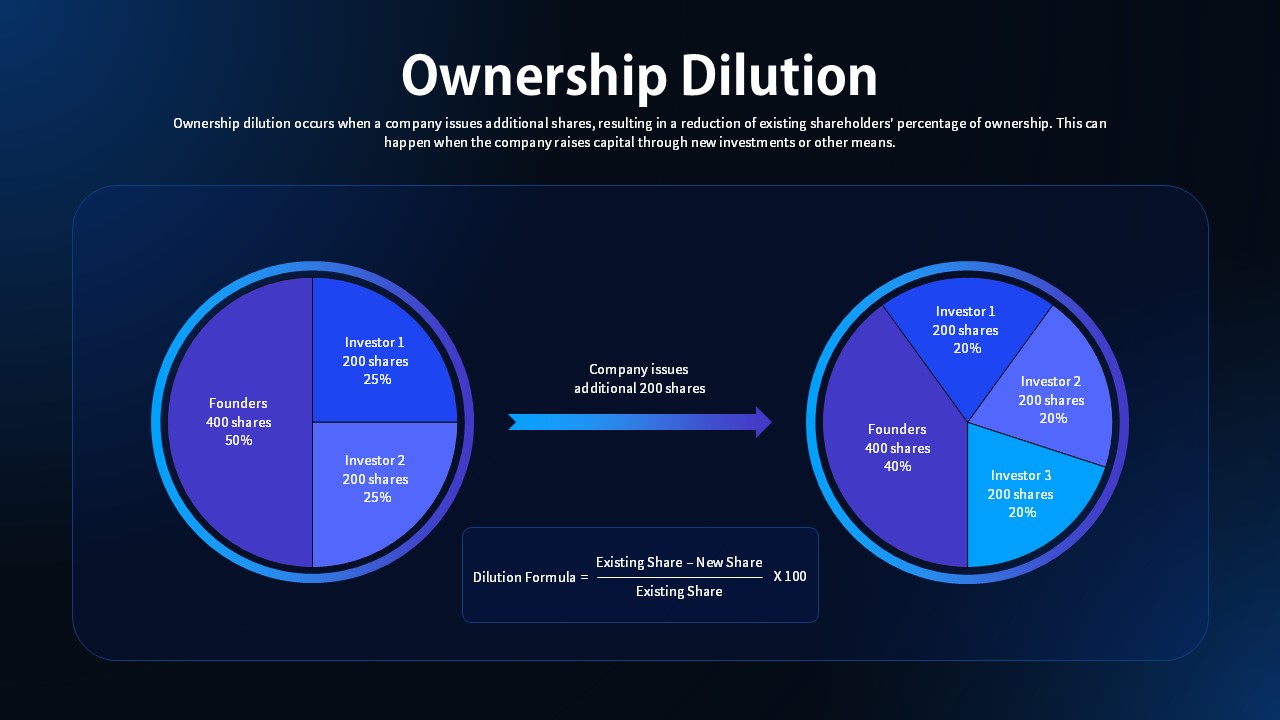
This slide visually represents the process of ownership dilution, demonstrating how the issuance of additional shares by a company reduces the percentage of ownership held by existing shareholders. The design employs two pie charts to show the ownership distribution before and after the company issues new shares. In the initial diagram, the founders hold 50% of the shares, while two investors hold 25% each. After the dilution, the founders’ share decreases to 40%, while the new investor (Investor 3) receives a 20% share, reducing the original investors’ ownership to 20% each.
The template includes a concise description of ownership dilution and an easy-to-understand dilution formula, which is presented at the bottom. This visual layout is simple, clean, and perfect for any corporate or financial presentation where explaining shareholder changes, capital raising, or investment rounds is necessary. You can customize the pie charts, labels, and color scheme to suit your brand and presentation needs.
Who is it for
This template is ideal for startup founders, venture capitalists, business analysts, and finance professionals who need to explain ownership dilution to stakeholders, investors, or team members. It is also beneficial for educators or consultants who want to simplify the concept of dilution for audiences unfamiliar with financial terms.
Other Uses
This slide can be used for other scenarios involving capital raising, stock issuance, or shareholder dynamics. It can be adapted for explaining funding rounds in a startup, stock ownership breakdowns in mergers or acquisitions, or for illustrating the effect of new equity distribution. The pie chart design also works well for representing different segments of a company’s ownership, helping businesses visualize the distribution of shares and equity across different departments or teams.
Login to download this file

Item ID
SB05329
Related Templates

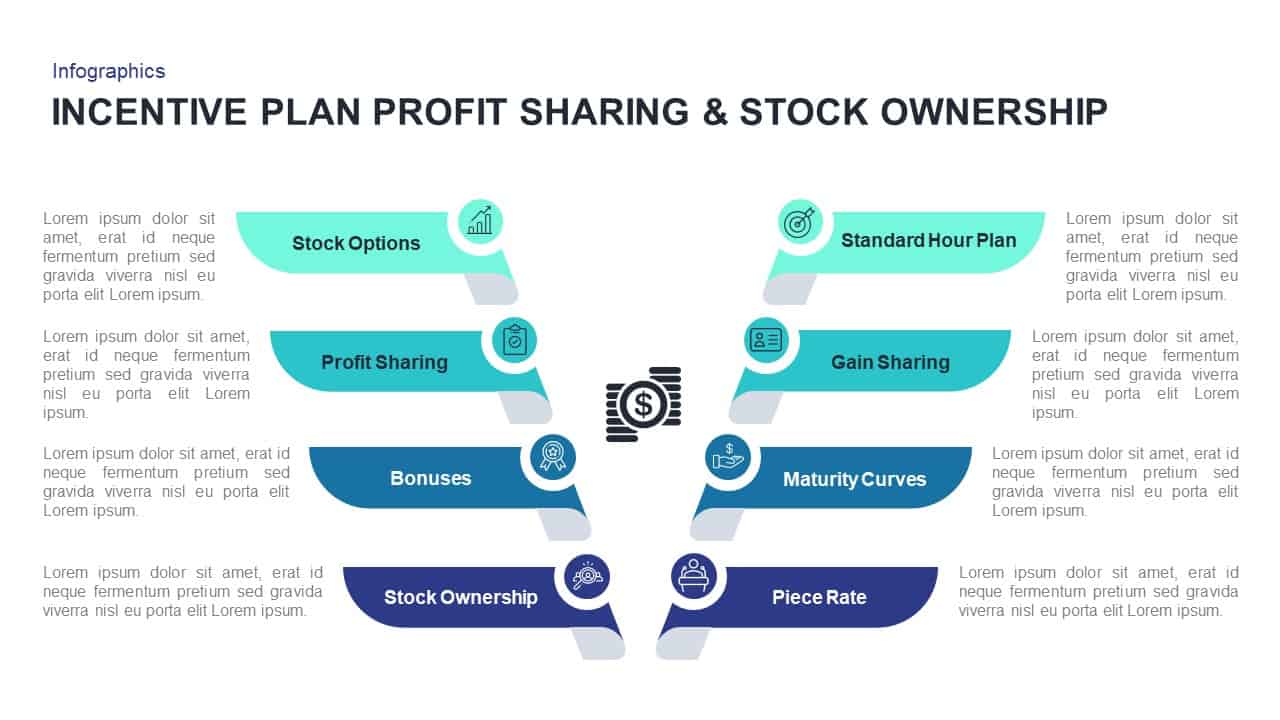
Profit Sharing & Stock Ownership Template for PowerPoint & Google Slides
Process
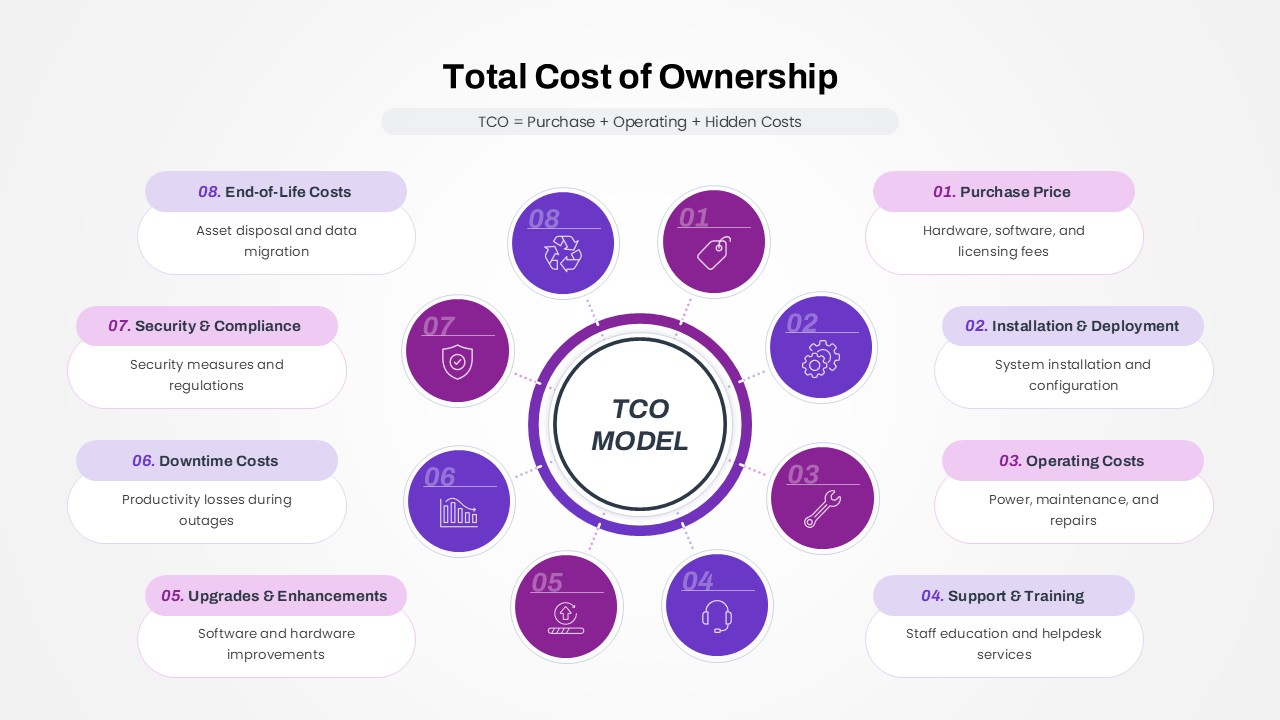
Total Cost of Ownership (TCO) Model template for PowerPoint & Google Slides
Business

Money Metaphor Financial Overview Template for PowerPoint & Google Slides
Finance
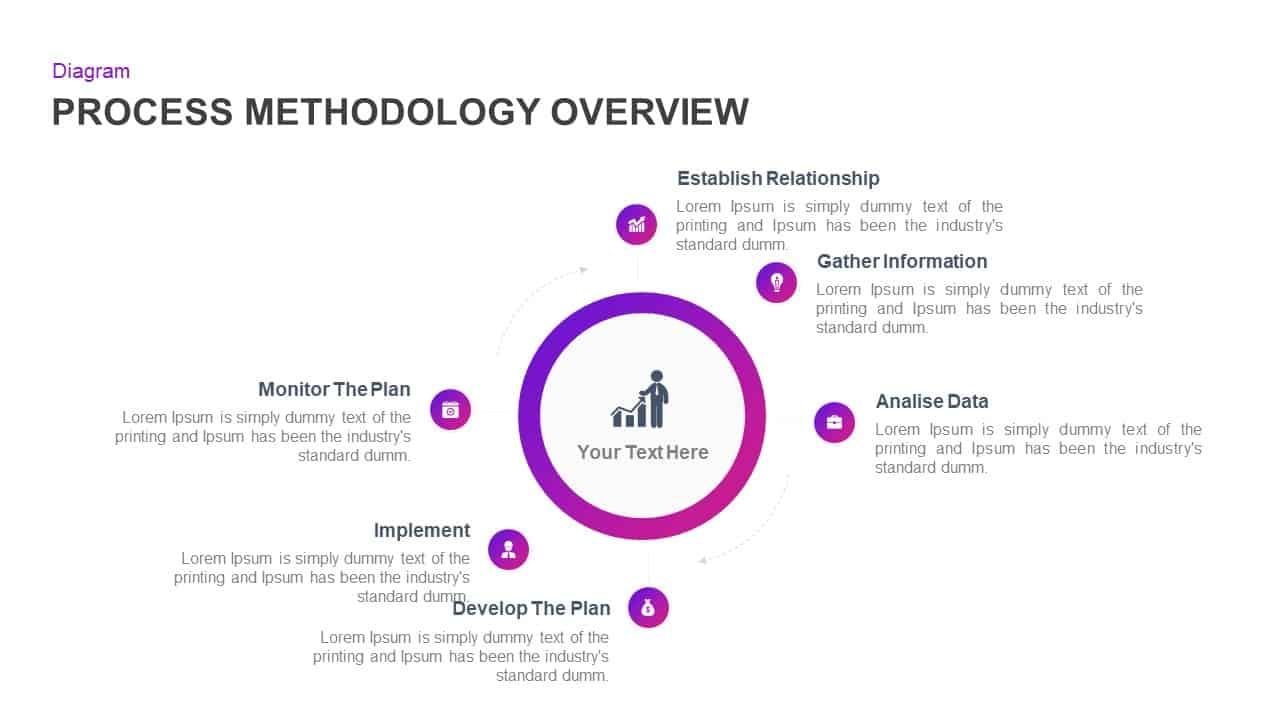
Process Methodology Overview Diagram Template for PowerPoint & Google Slides
Process
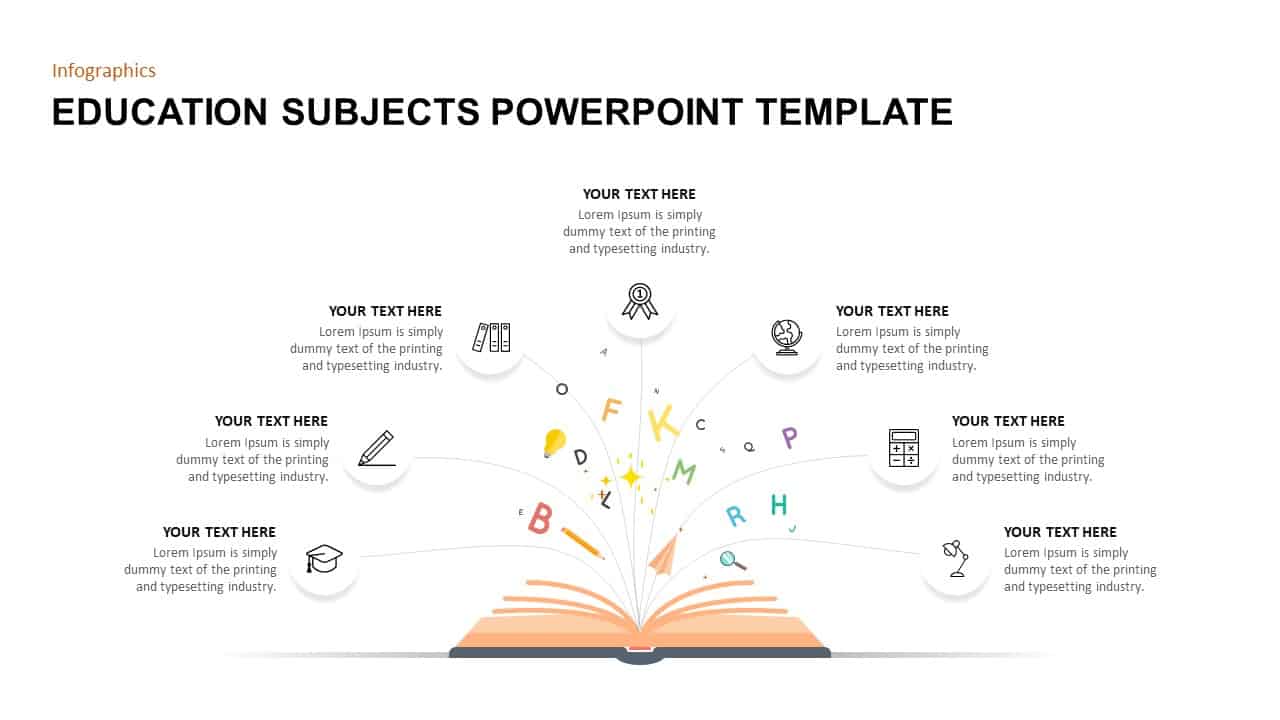
Education Subjects Overview template for PowerPoint & Google Slides
Agenda
Voice of Customer Overview template for PowerPoint & Google Slides
Customer Journey
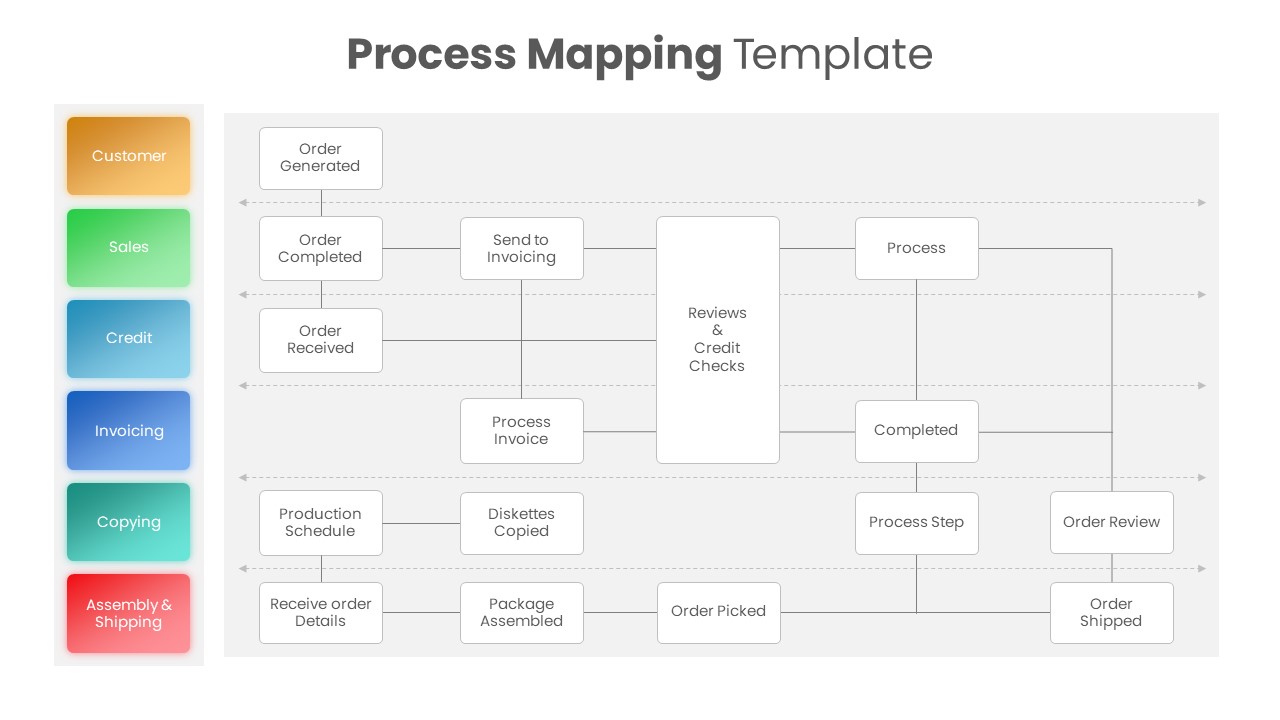
Process Mapping Overview template for PowerPoint & Google Slides
Business Plan
Corporate Deck Overview template for PowerPoint & Google Slides
Pitch Deck
Company Profile Overview template for PowerPoint & Google Slides
Company Profile
Business Proposal Overview template for PowerPoint & Google Slides
Business Proposal
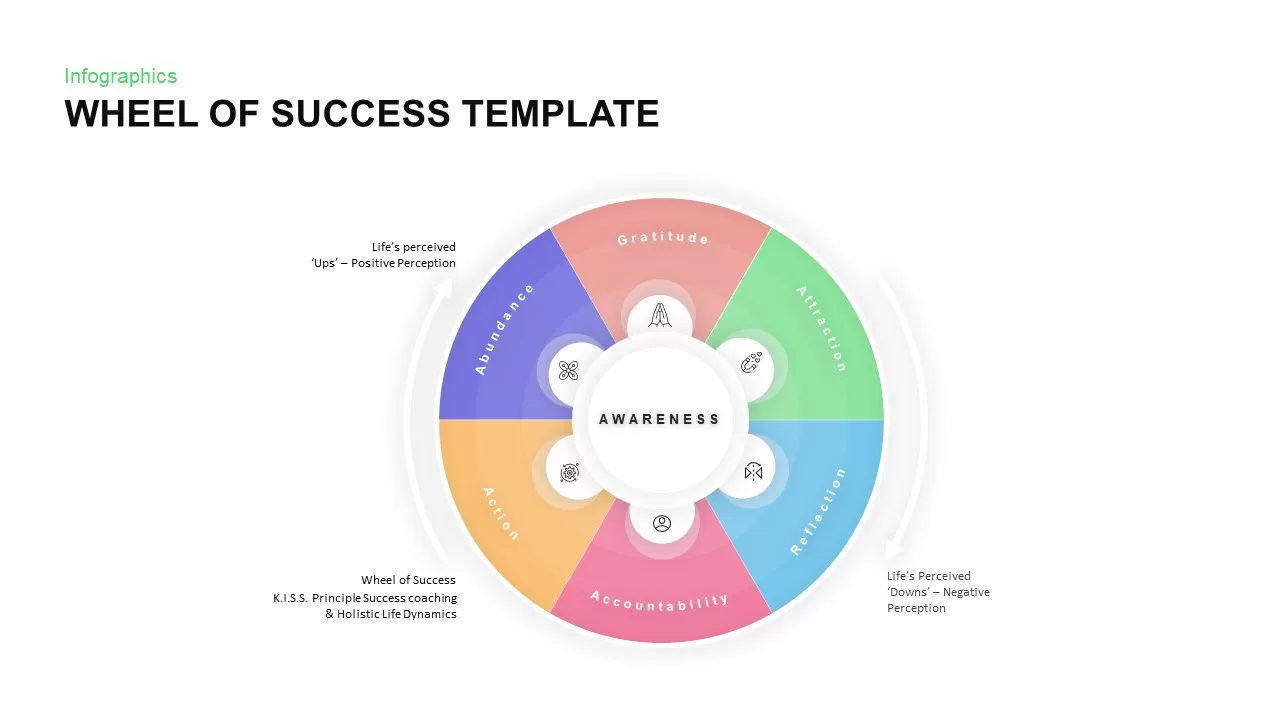
Wheel of Success Overview template for PowerPoint & Google Slides
Business Strategy
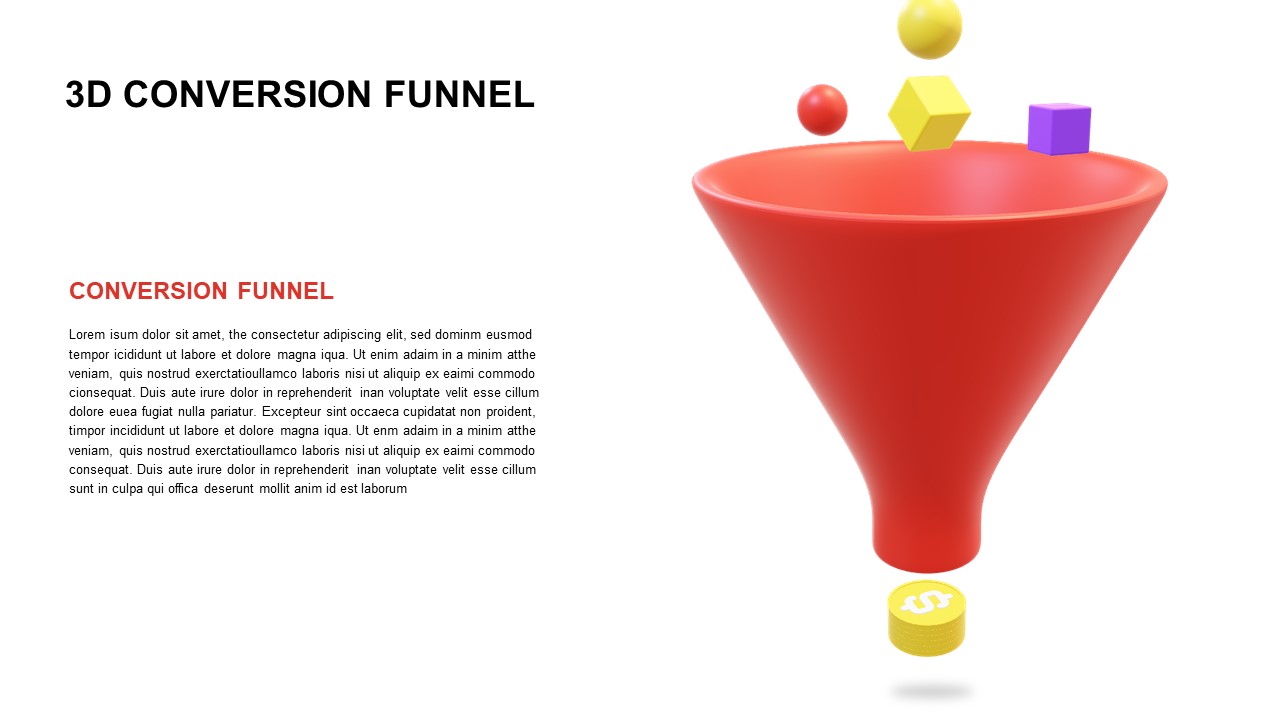
Free 3D Conversion Funnel Overview template for PowerPoint & Google Slides
Funnel
Free
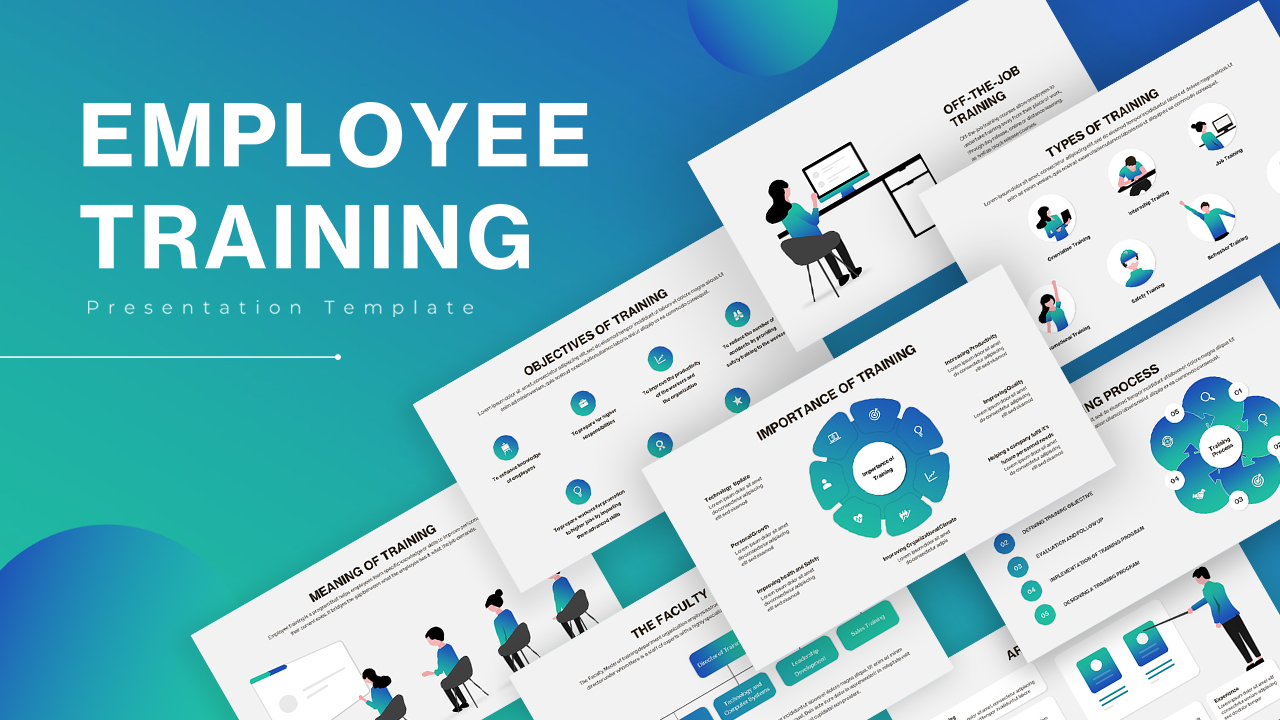
Employee Training Overview template for PowerPoint & Google Slides
Recruitment
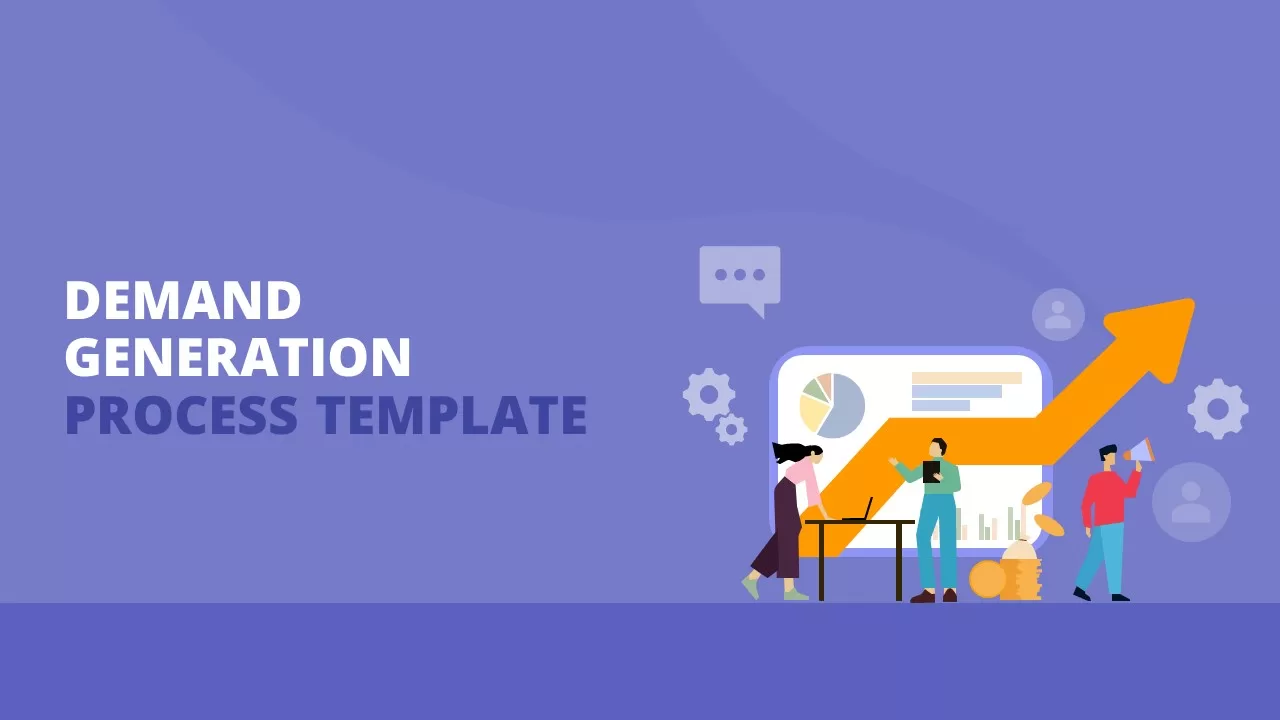
Demand Generation Process Overview Template for PowerPoint & Google Slides
Marketing
Investment Idea Deck Overview Template for PowerPoint & Google Slides
Decks
Annual Report Overview Template for PowerPoint & Google Slides
Decks
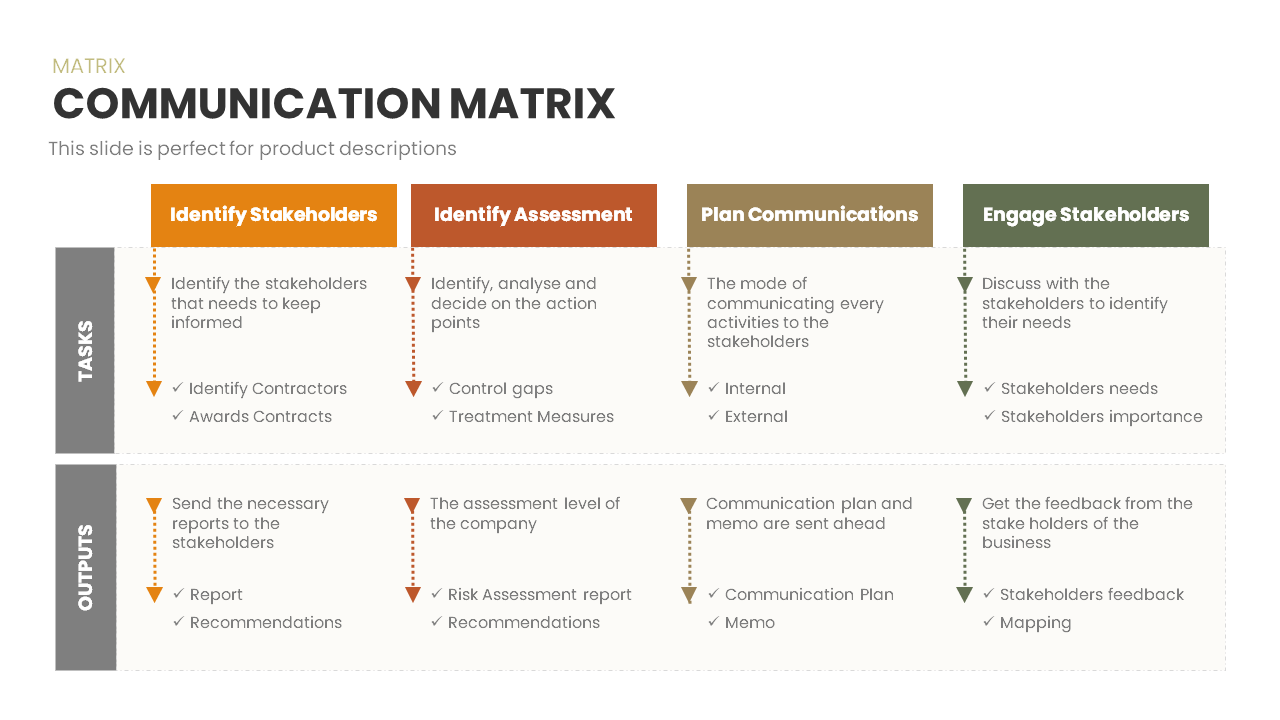
Communication Matrix Overview Template for PowerPoint & Google Slides
Business
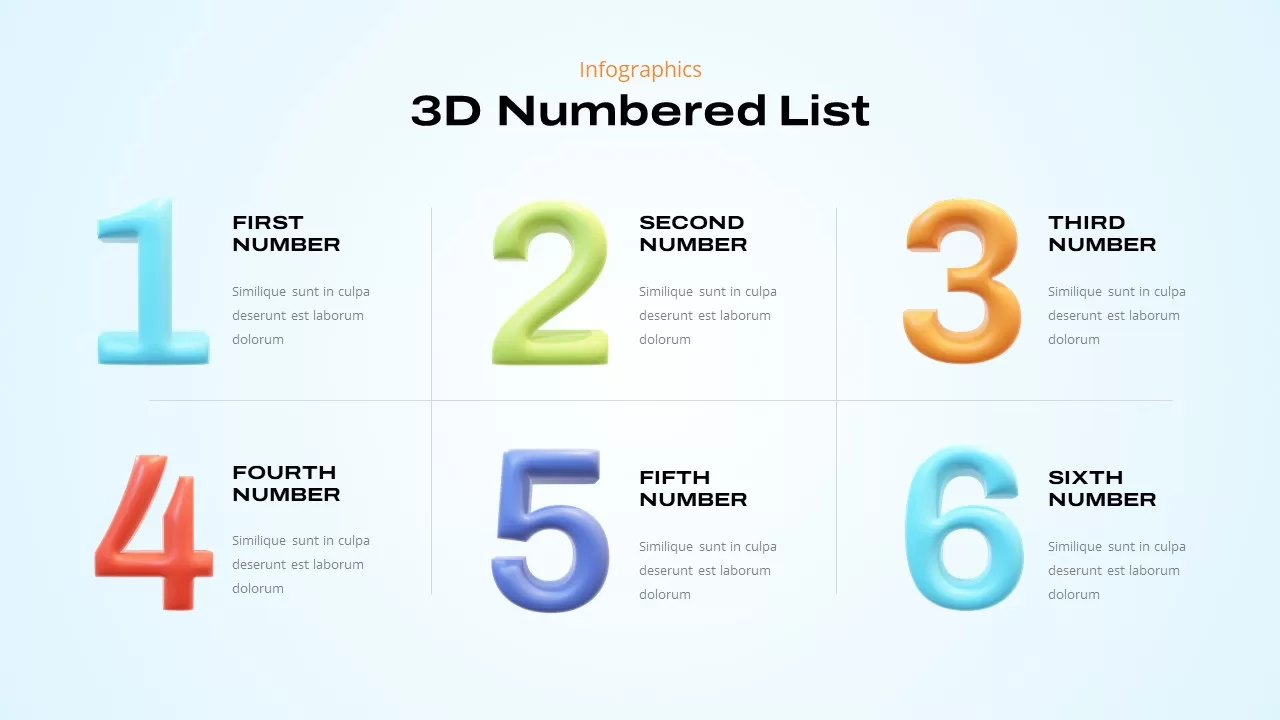
3D Numbered List Overview template for PowerPoint & Google Slides
Infographics
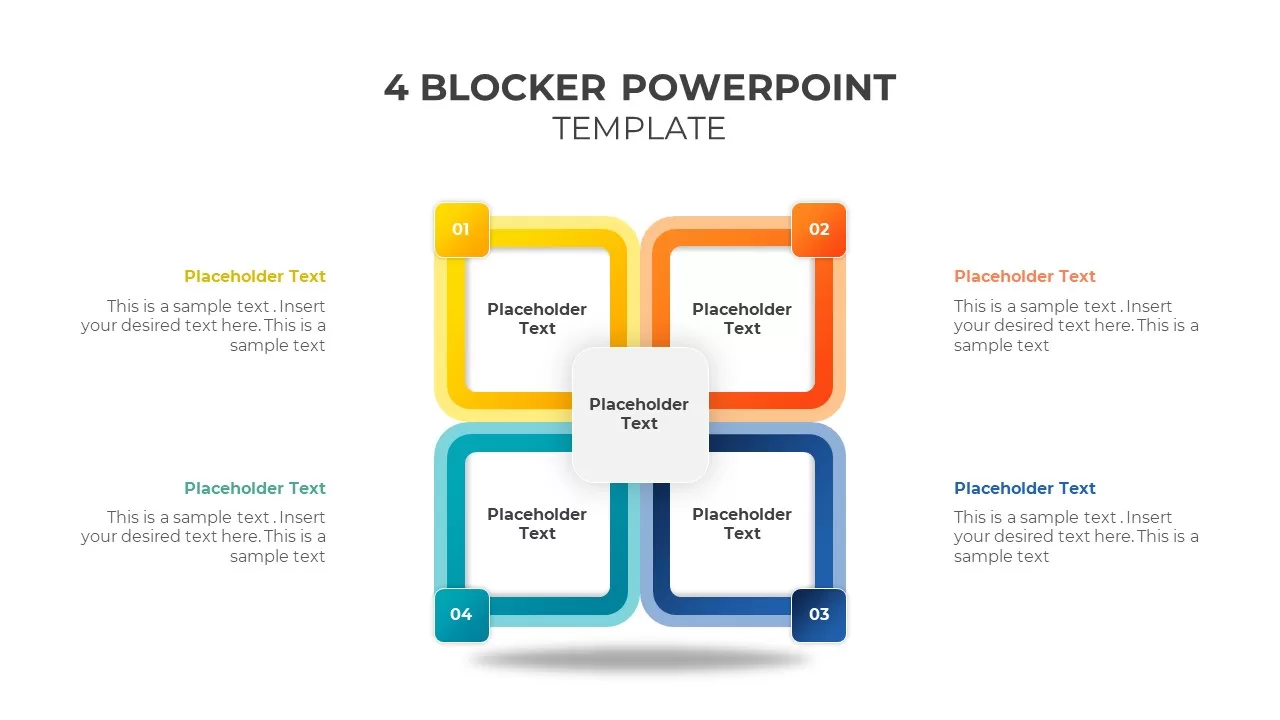
Four Blocker Overview template for PowerPoint & Google Slides
Infographics
FreeBlack History Month Celebration Overview Template for PowerPoint & Google Slides
Pitch Deck
Free
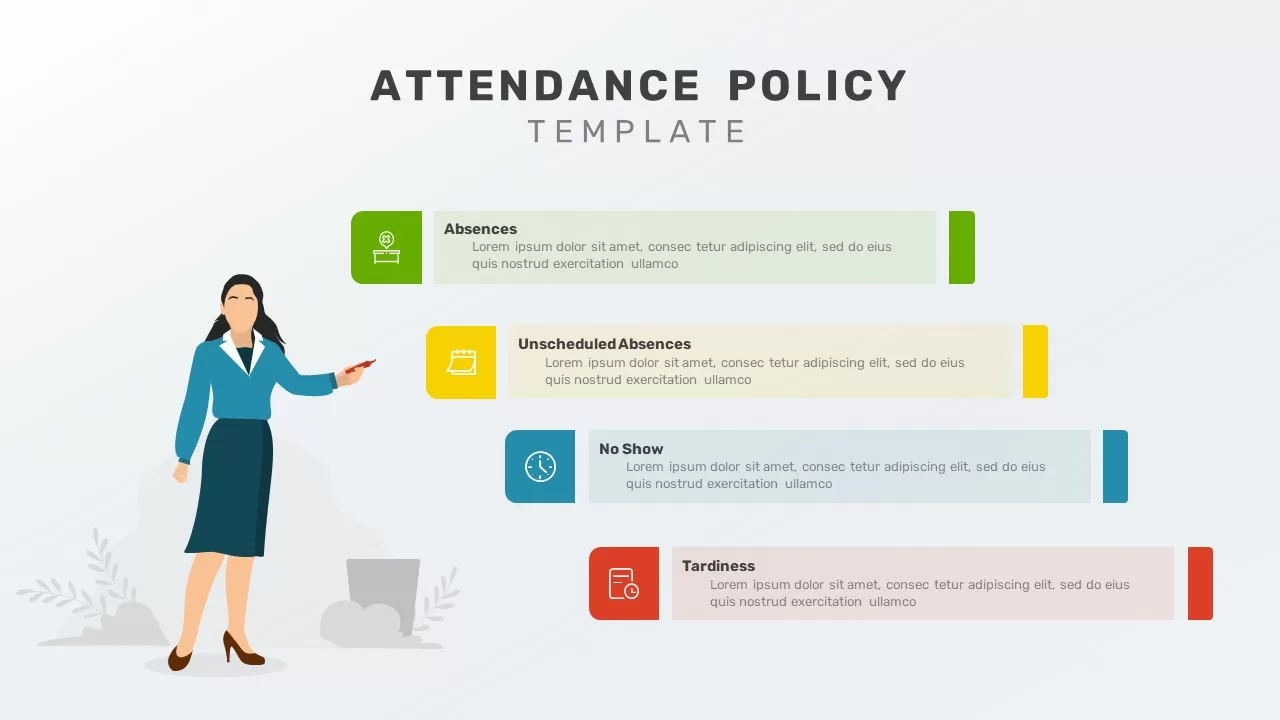
Comprehensive Attendance Policy Overview Template for PowerPoint & Google Slides
Process
Organizational Chart Overview template for PowerPoint & Google Slides
Org Chart
SWOT Analysis Visual Overview template for PowerPoint & Google Slides
Business Strategy
Team Charter Overview template for PowerPoint & Google Slides
Business Plan
Free Simple Venn Diagram Overview template for PowerPoint & Google Slides
Comparison Chart
Free
Free 30 60 90 Day Plan Overview template for PowerPoint & Google Slides
Business Plan
Free
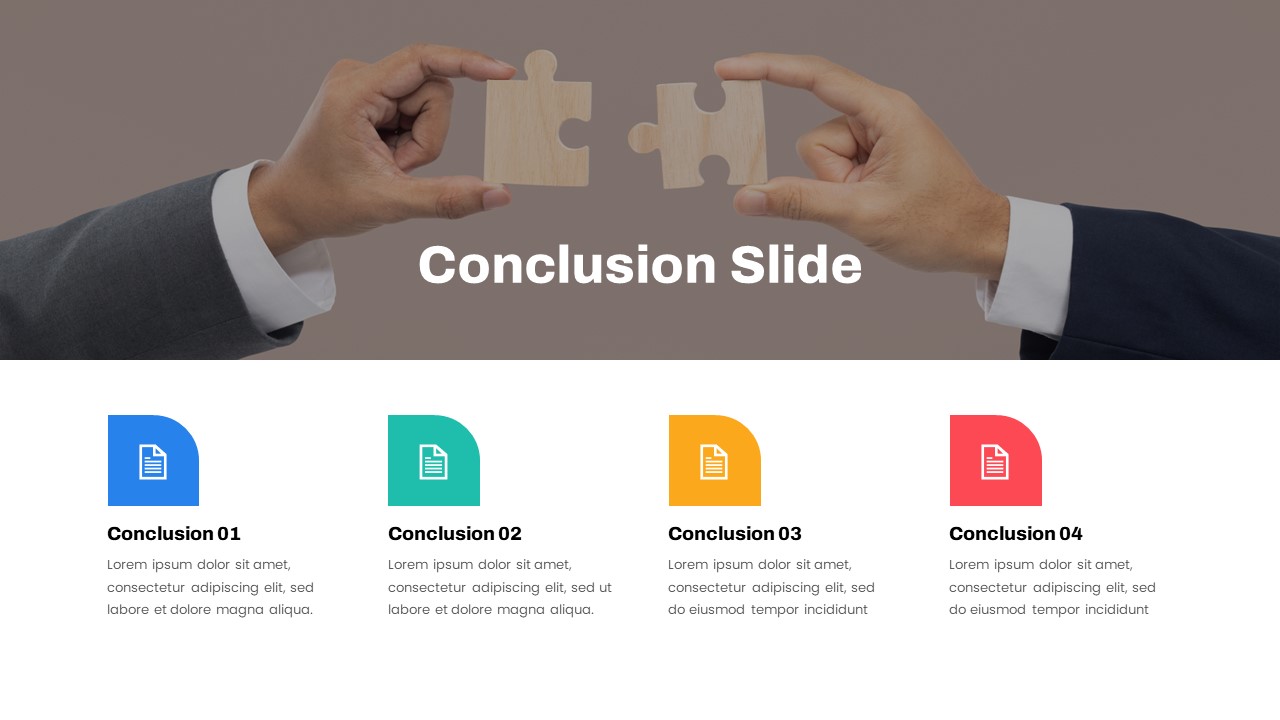
Conclusion Overview template for PowerPoint & Google Slides
Business Report
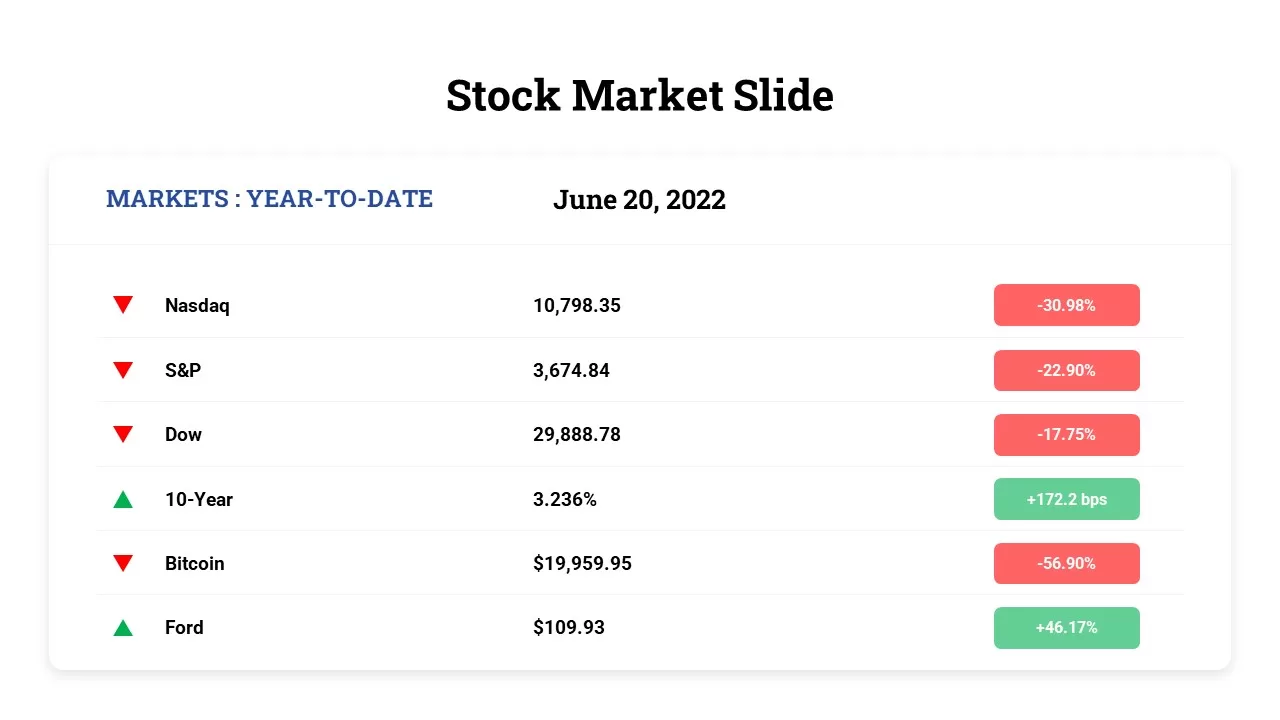
Free Stock Market Performance Overview template for PowerPoint & Google Slides
Finance
Free
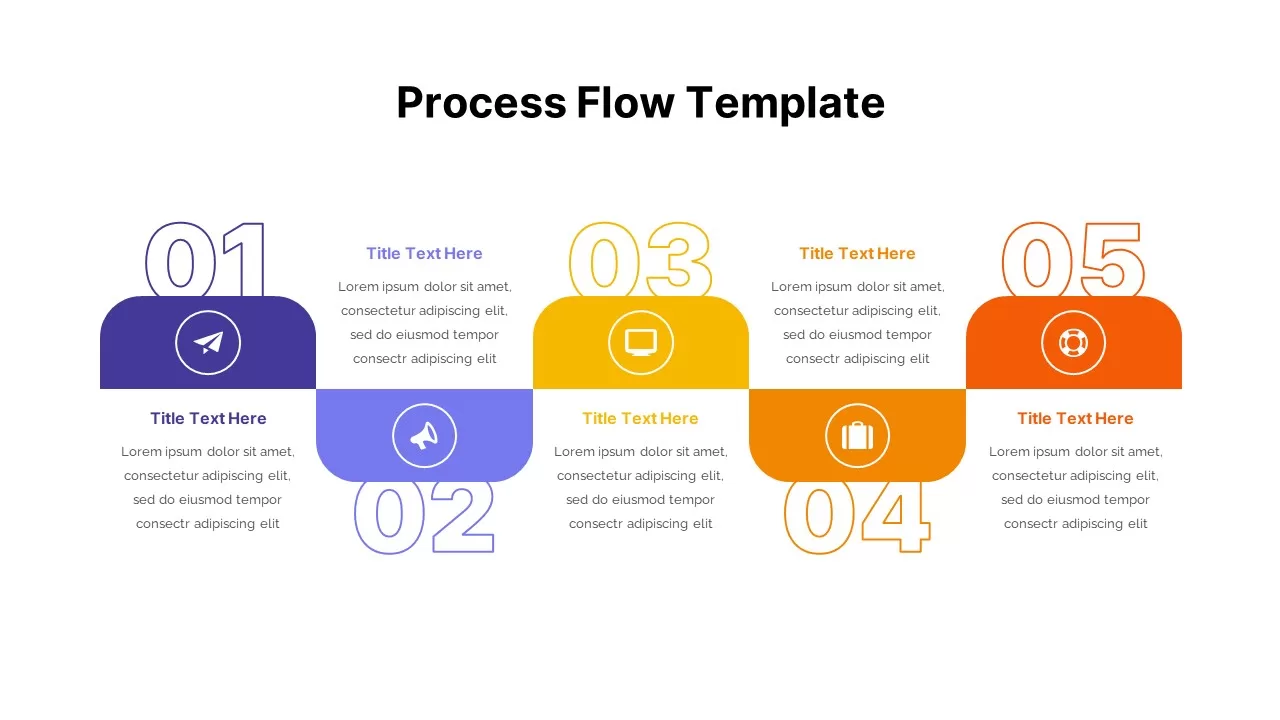
5 Stage Process Flow Overview template for PowerPoint & Google Slides
Process
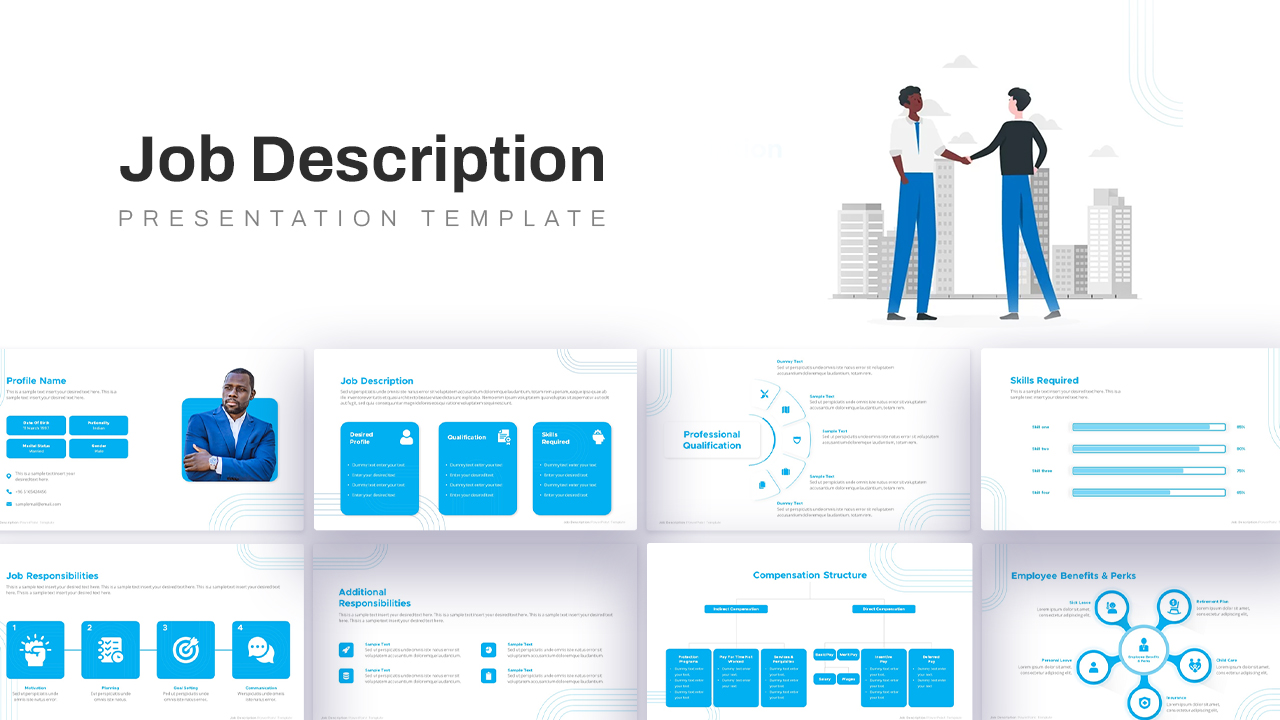
Job Description Overview template for PowerPoint & Google Slides
Recruitment

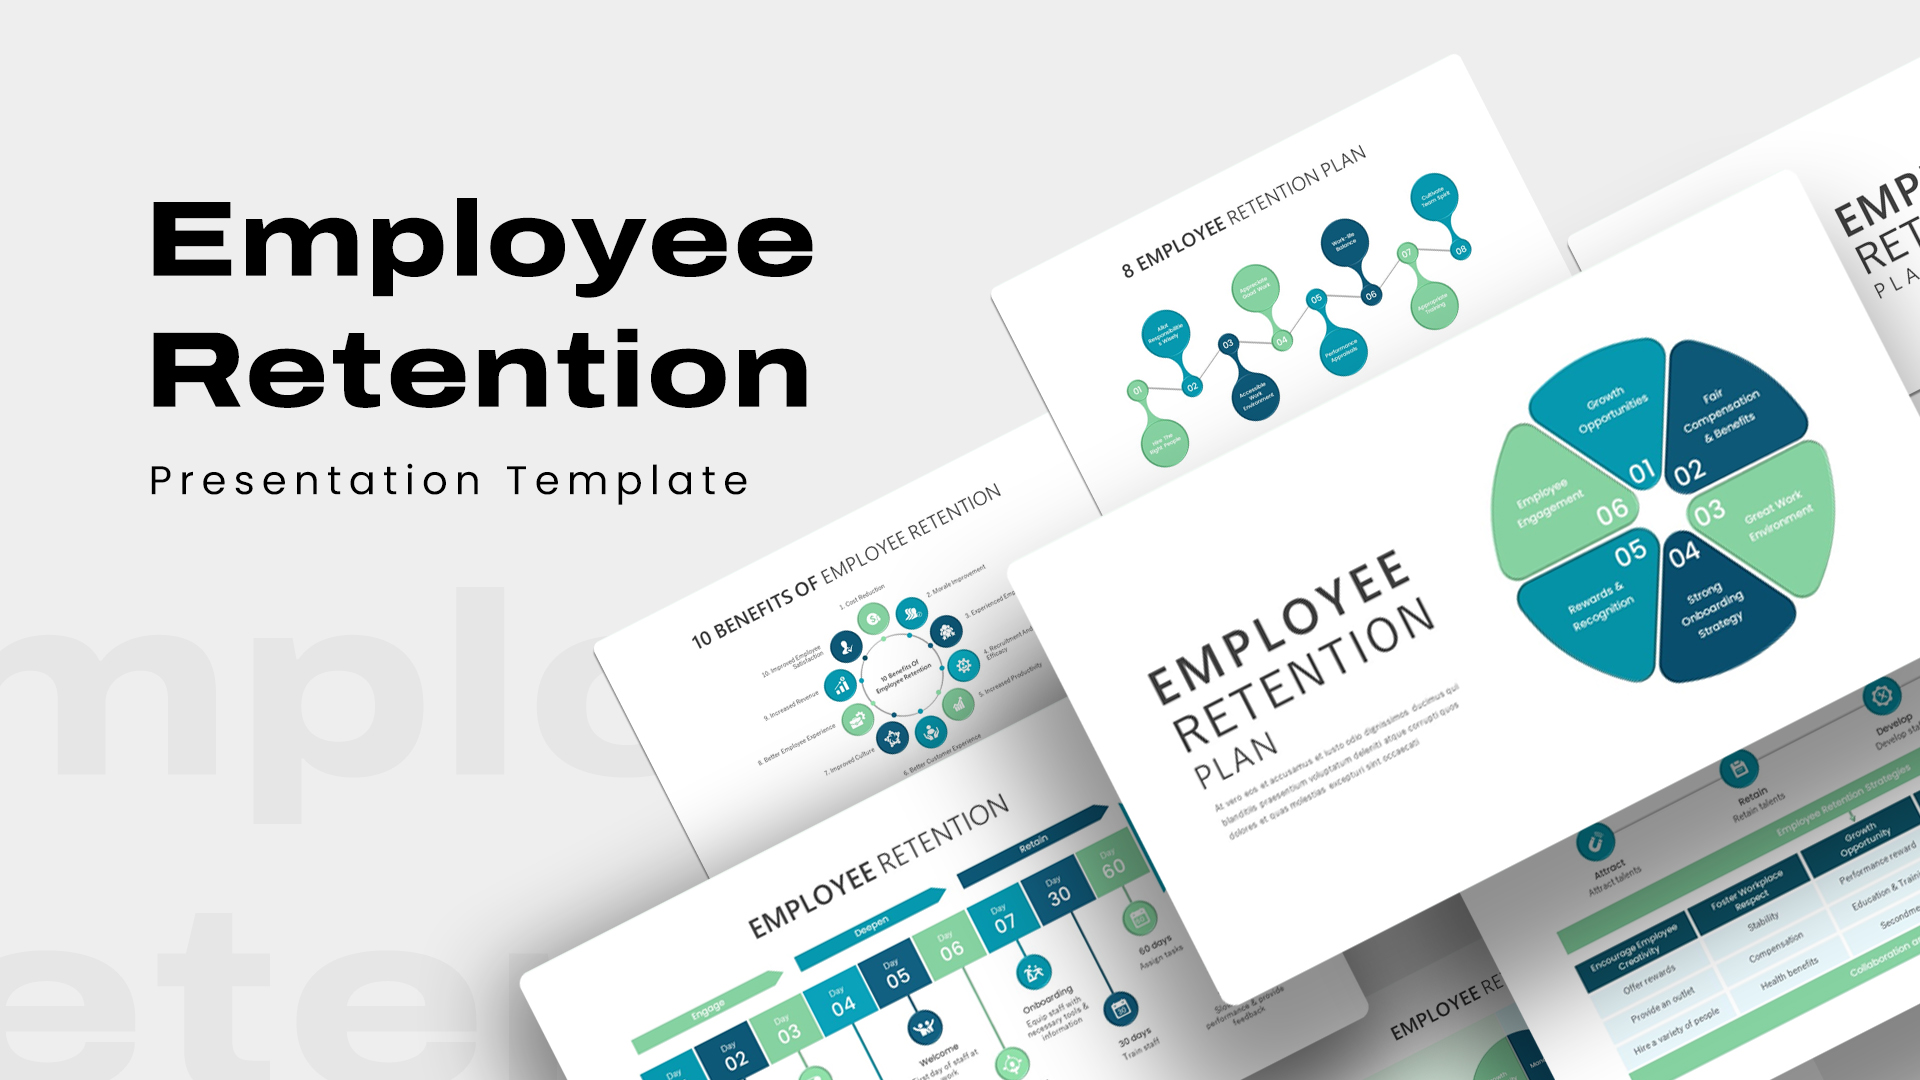
Employee Retention Plan Overview template for PowerPoint & Google Slides
Company Profile
North America Location Pin Map Overview Template for PowerPoint & Google Slides
World Maps
2023 Calendar Monthly Overview template for PowerPoint & Google Slides
Business
Graduation Celebration Overview template for PowerPoint & Google Slides
Pitch Deck
Streaming Service Overview template for PowerPoint & Google Slides
Business Proposal
KPI Dashboard Overview template for PowerPoint & Google Slides
Finance
Comprehensive Income Statement Overview Template for PowerPoint & Google Slides
Business Report
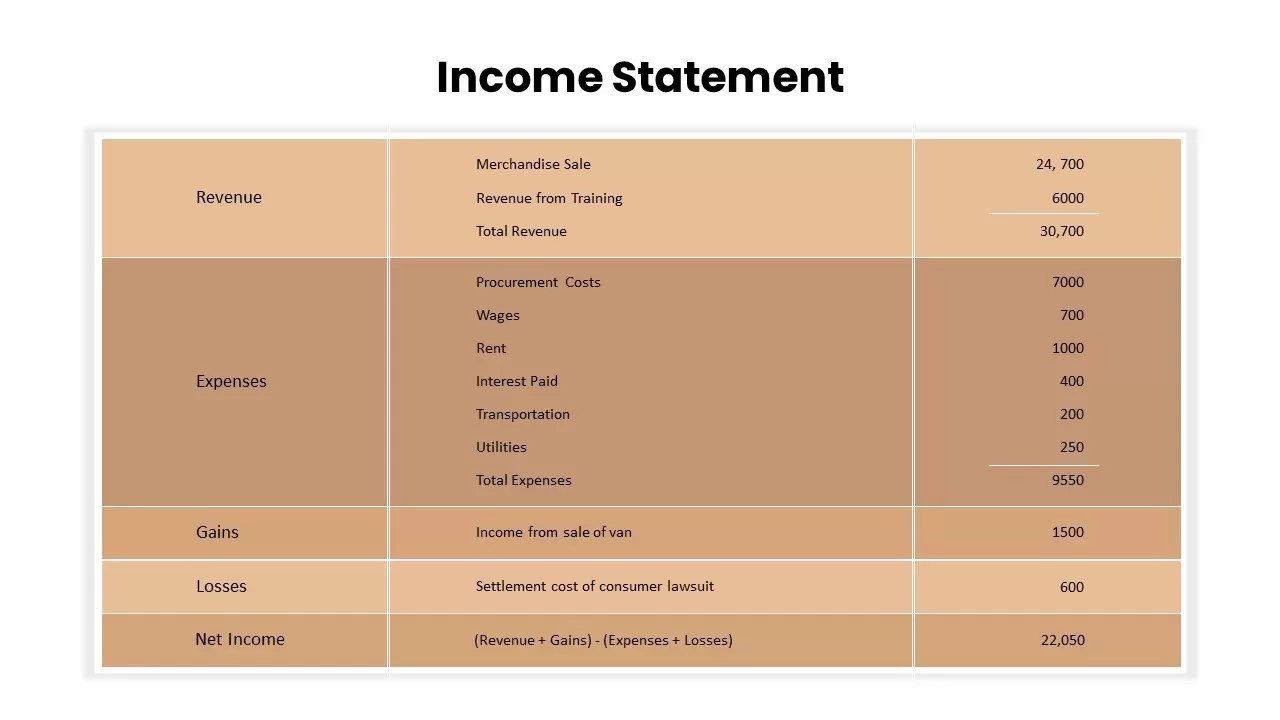
Income Statement Overview Table Template for PowerPoint & Google Slides
Finance
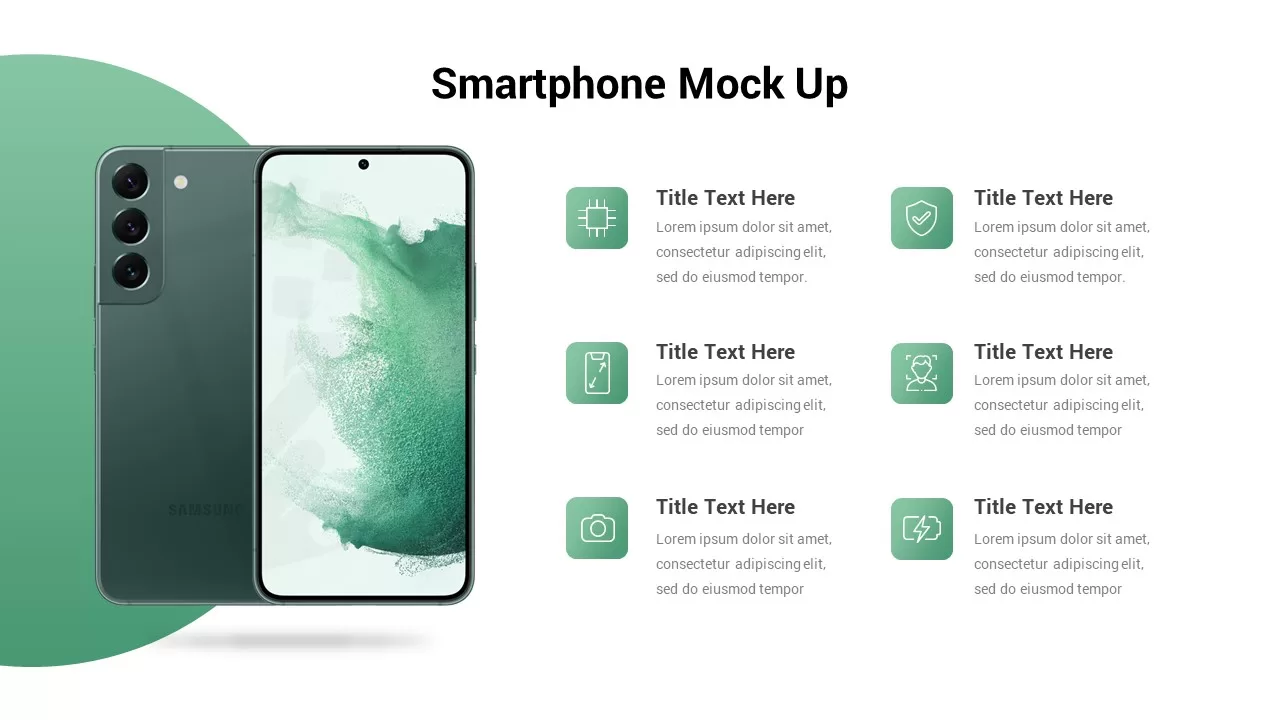
Smartphone Mockup Feature Overview Template for PowerPoint & Google Slides
Graphics
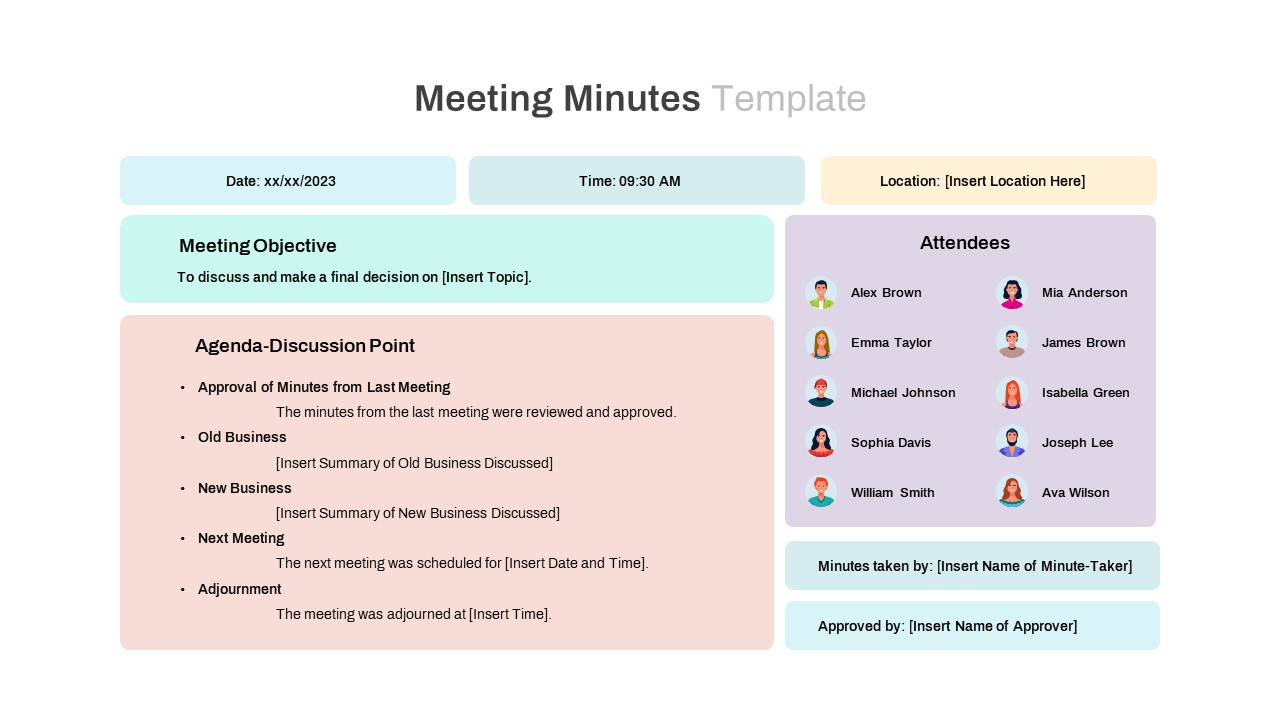
Meeting Minutes and Attendees Overview Template for PowerPoint & Google Slides
Business Report
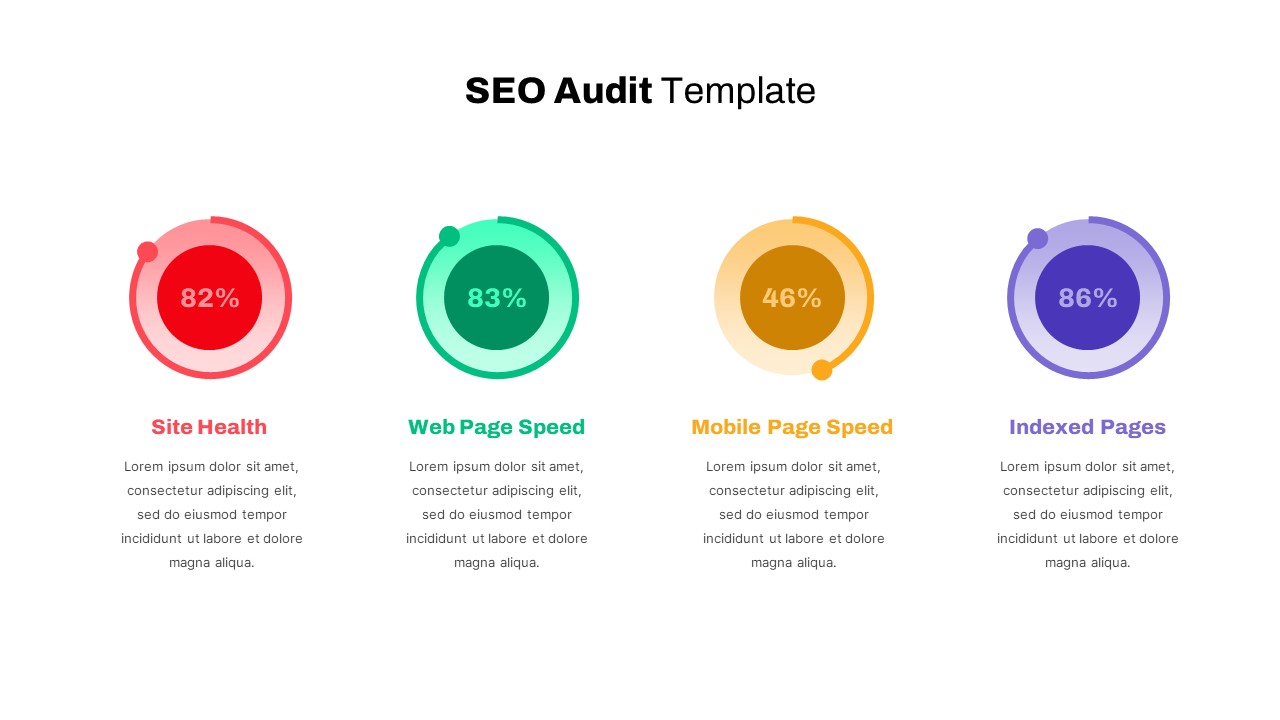
Detailed SEO Audit Metrics Overview Template for PowerPoint & Google Slides
Circular
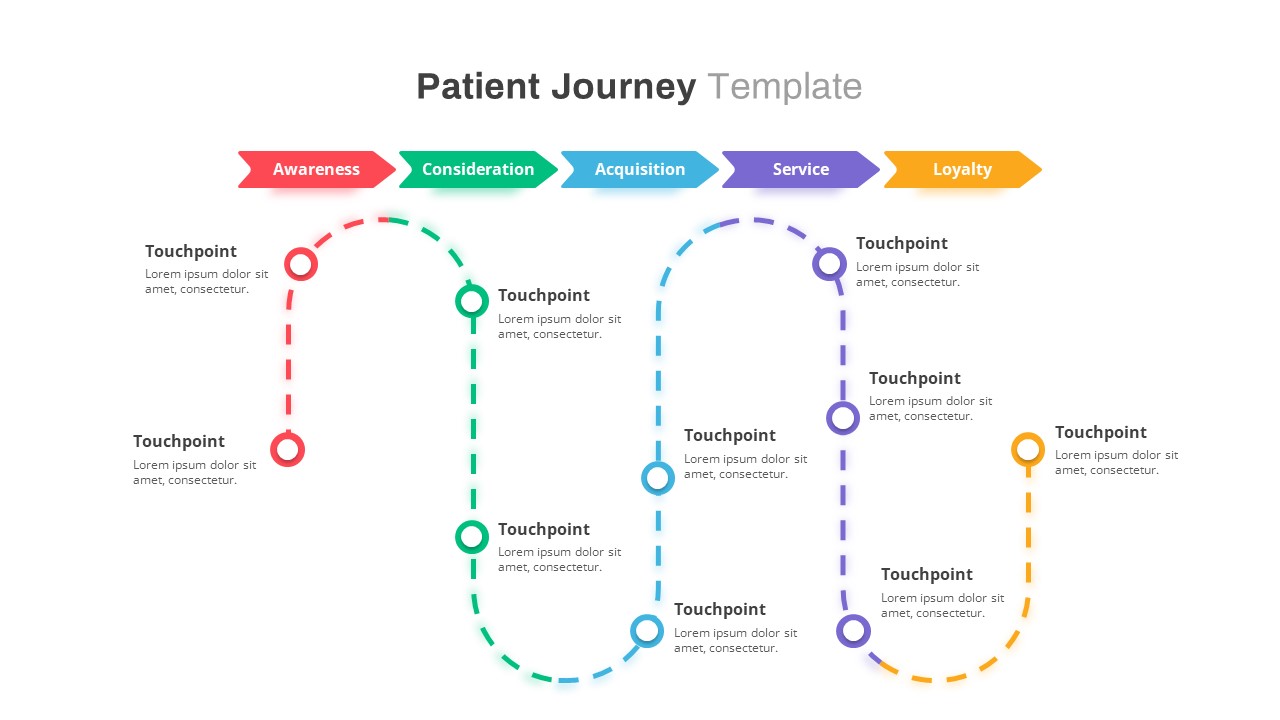
Healthcare Patient Journey Map Overview Template for PowerPoint & Google Slides
Health
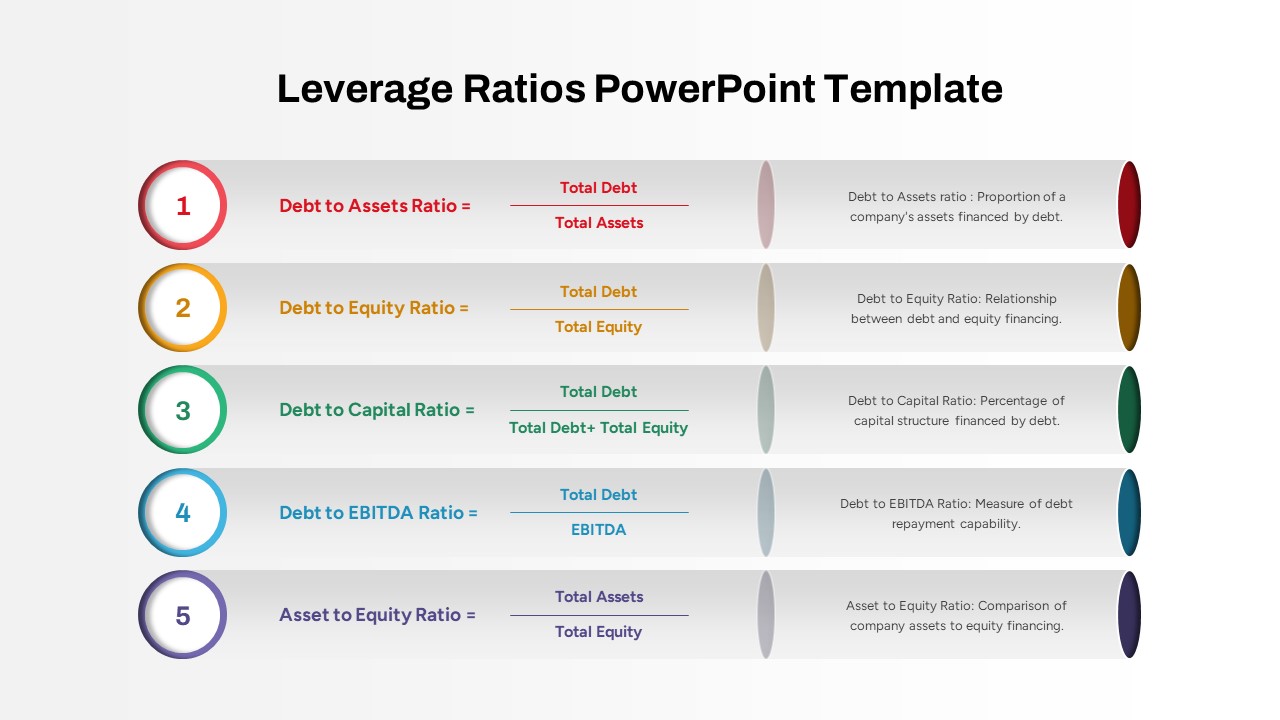
Five Key Leverage Ratios Overview Template for PowerPoint & Google Slides
Finance
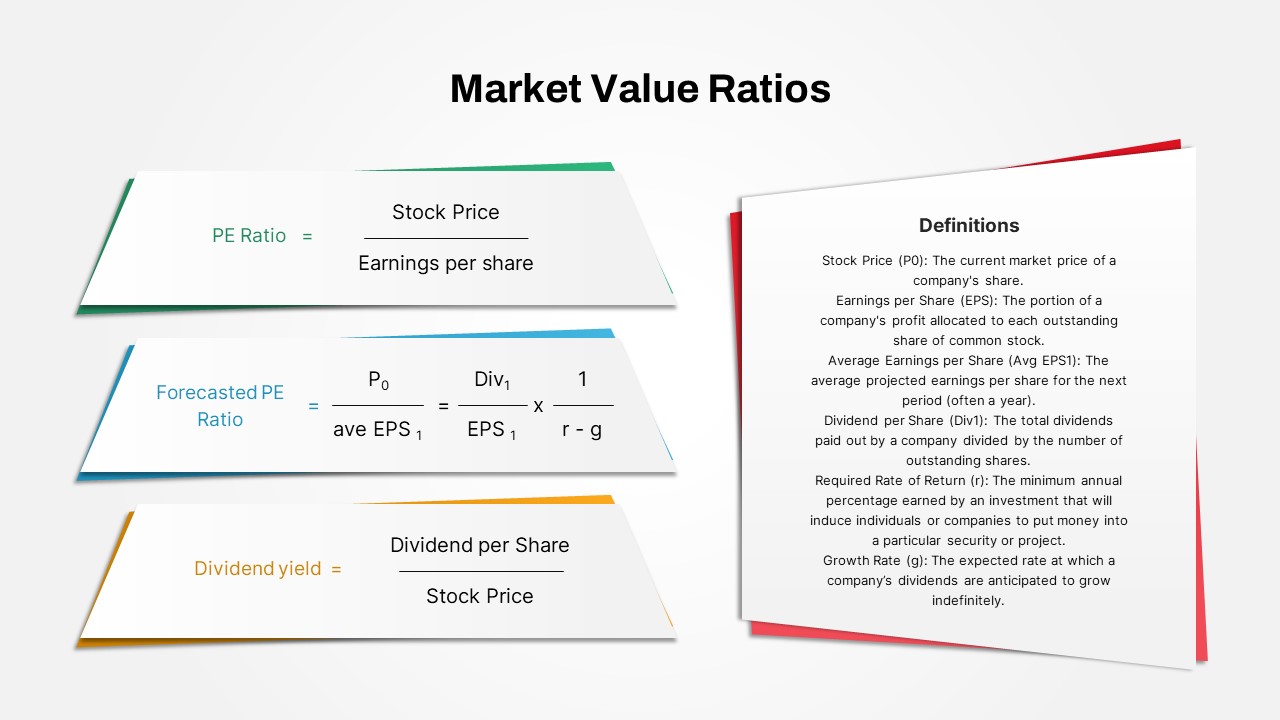
Market Value Ratios Formula Overview Template for PowerPoint & Google Slides
Business Report
Free TikTok Marketing Analytics Overview Template for PowerPoint & Google Slides
Company Profile
Free
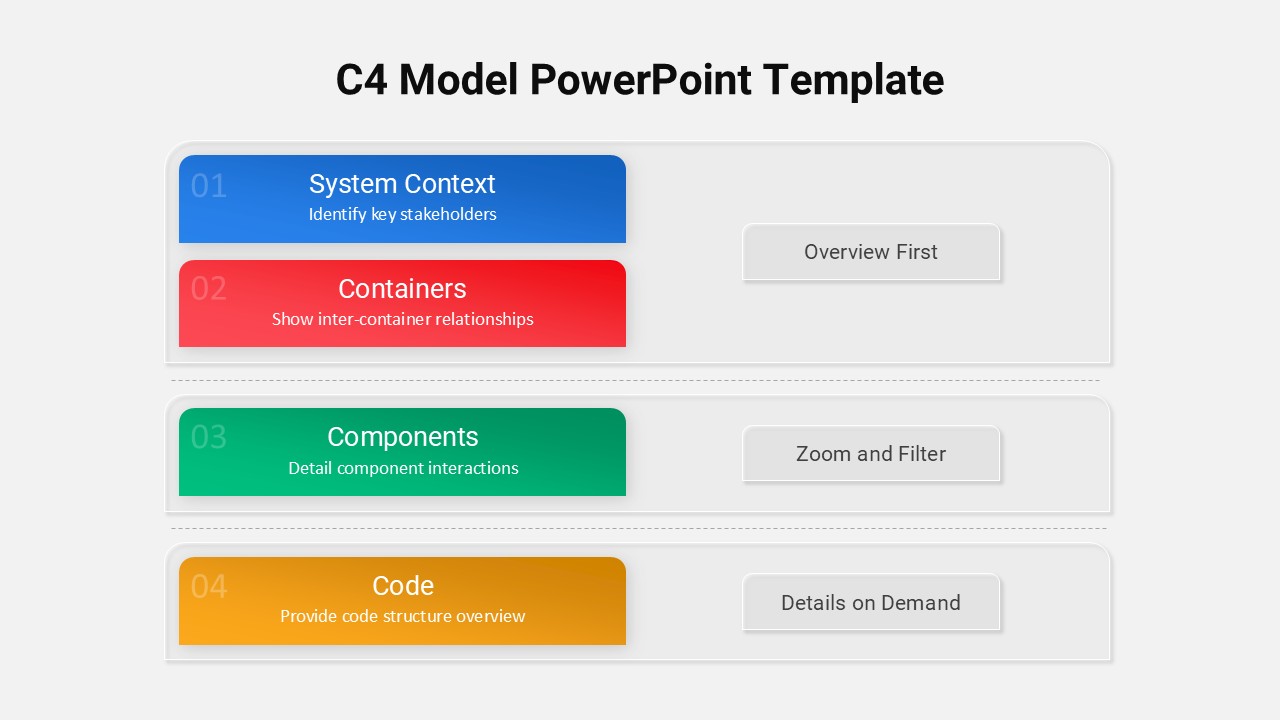
C4 Model Architecture Overview Template for PowerPoint & Google Slides
Software Development
Banking Financial Overview Dashboard Template for PowerPoint & Google Slides
Finance
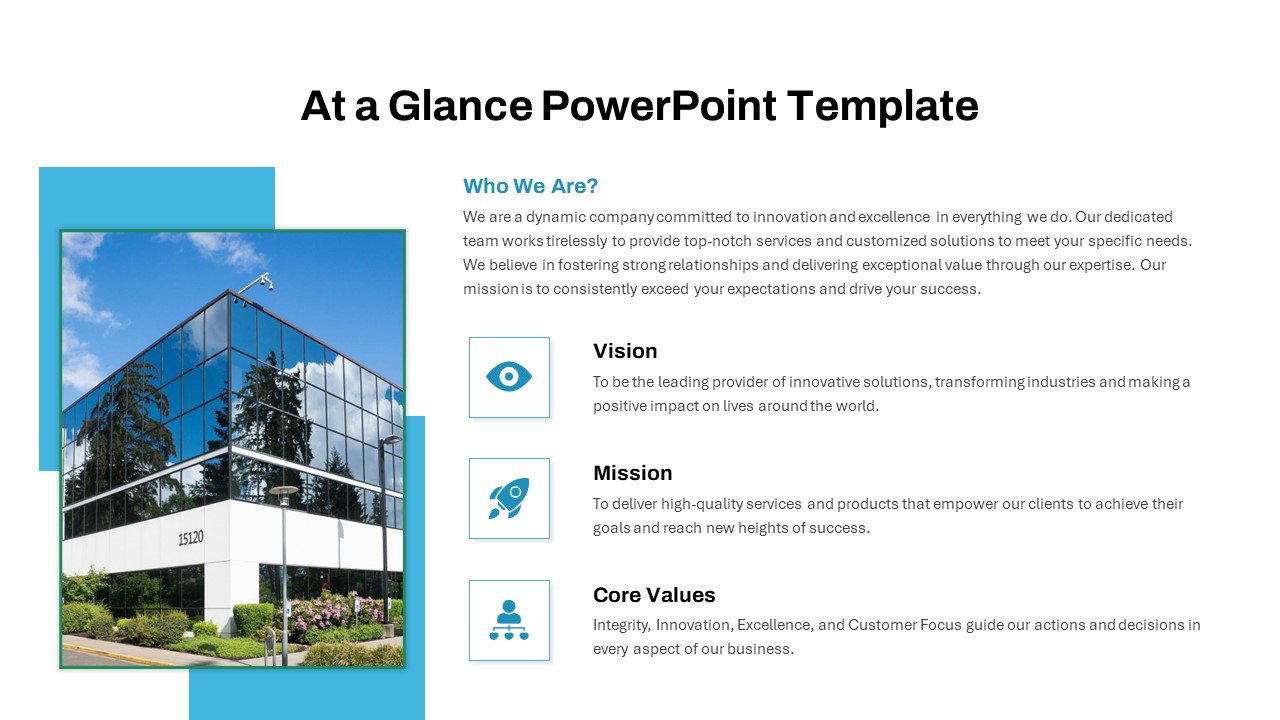
At a Glance Company Profile Overview Template for PowerPoint & Google Slides
Company Profile
Regional Revenue Comparison Overview Template for PowerPoint & Google Slides
Comparison
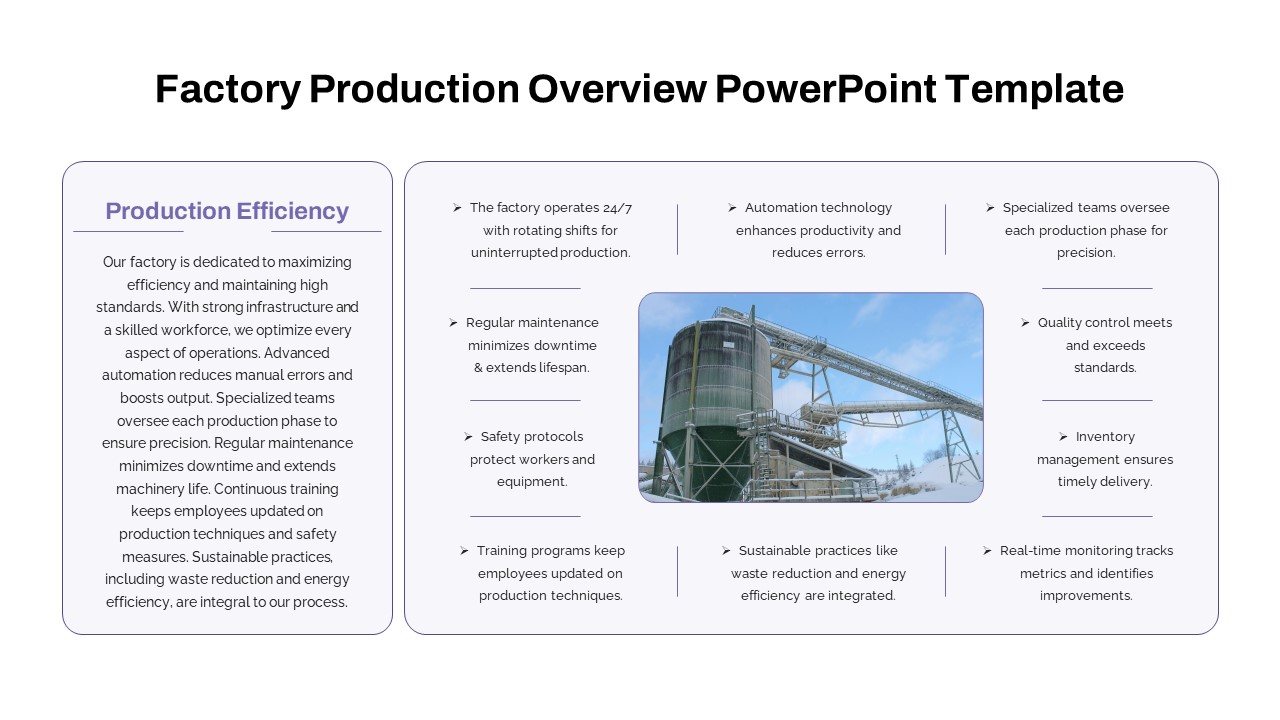
Factory Production Overview Template for PowerPoint & Google Slides
Business Report
Financial Snapshot & Metrics Overview Template for PowerPoint & Google Slides
Finance
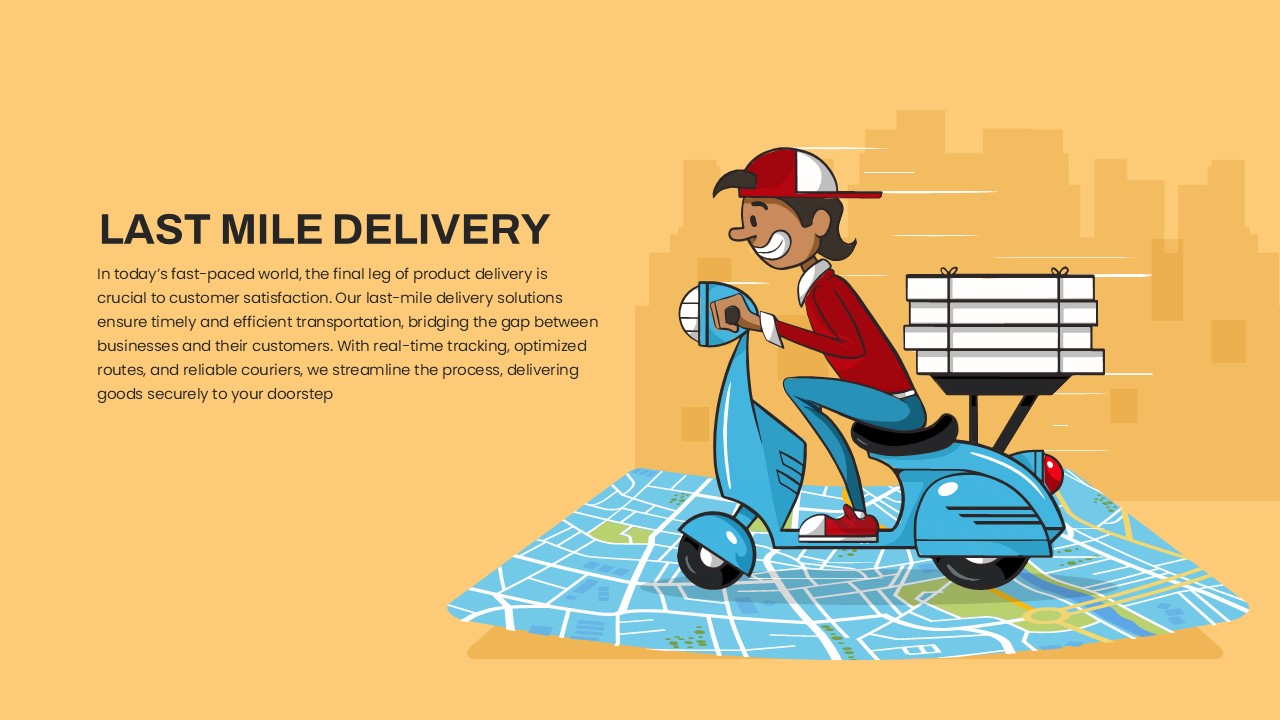
Last Mile Delivery Overview template for PowerPoint & Google Slides
Advertising
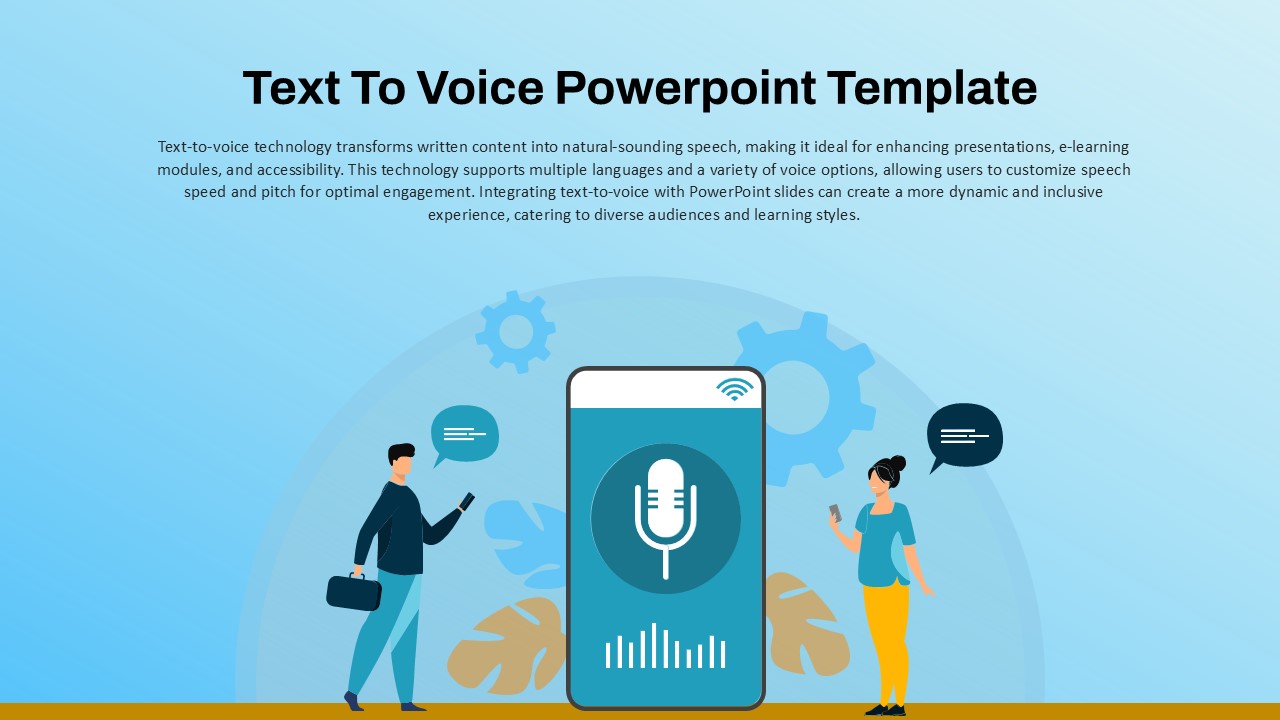
Text to Voice Technology overview template for PowerPoint & Google Slides
Technology
Neo Banking Overview template for PowerPoint & Google Slides
Technology
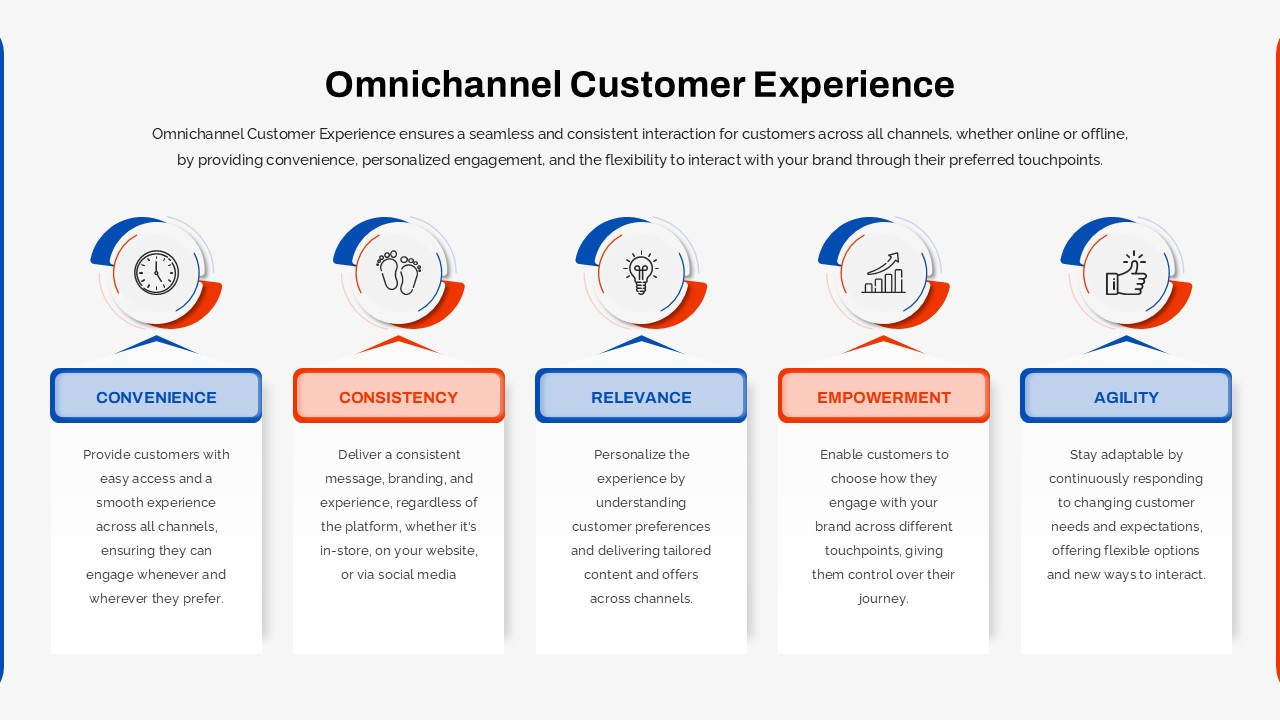
Omnichannel Customer Experience Overview Template for PowerPoint & Google Slides
Customer Journey
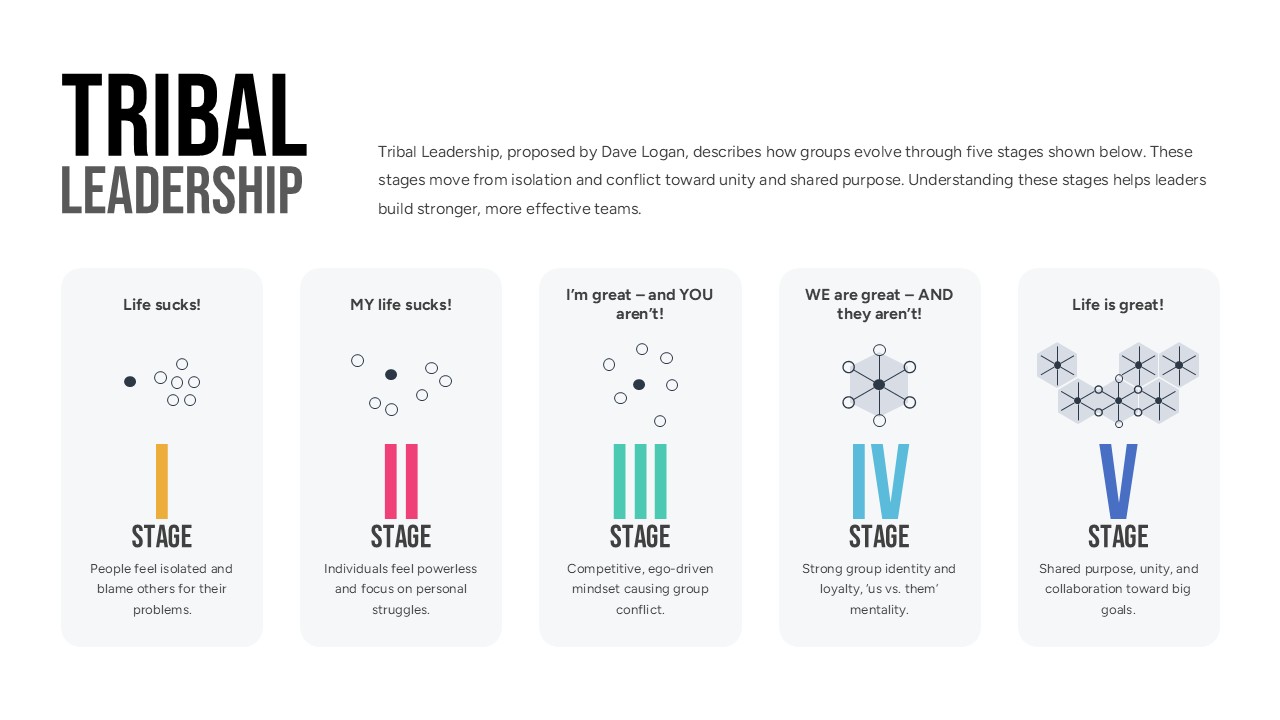
Tribal Leadership Stages Overview template for PowerPoint & Google Slides
Business
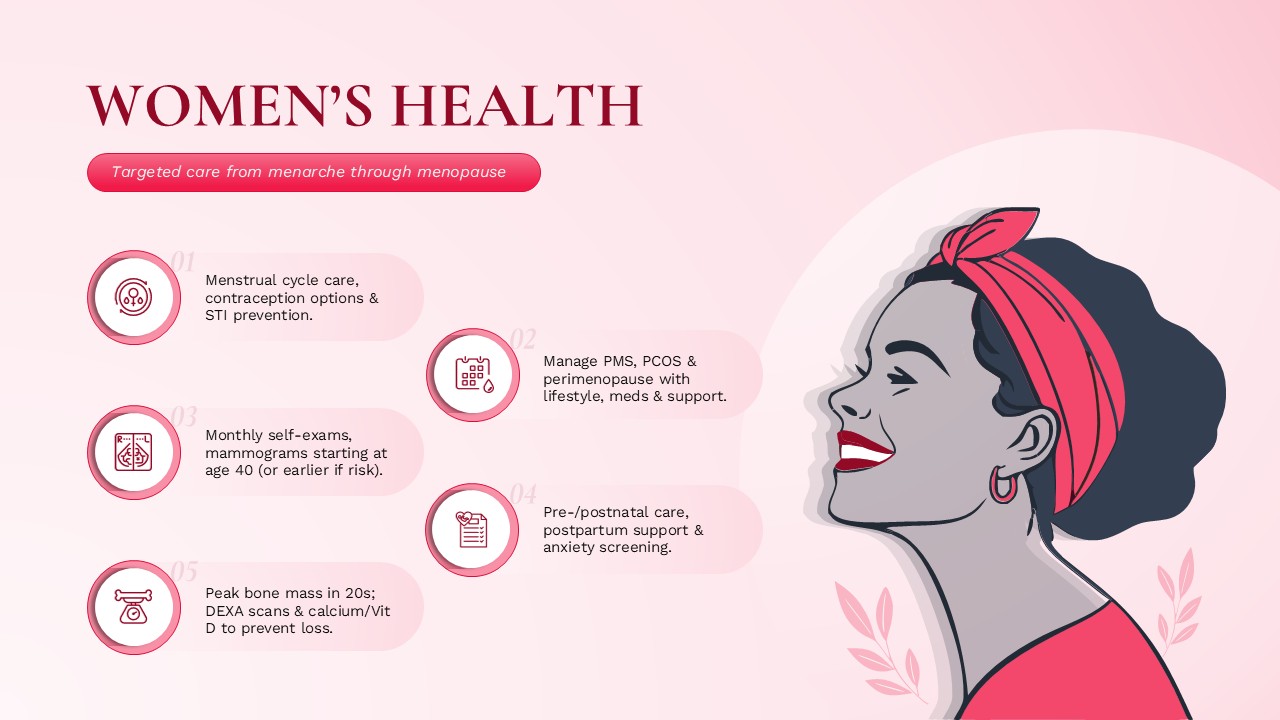
Women’s Health Care Overview template for PowerPoint & Google Slides
Medical
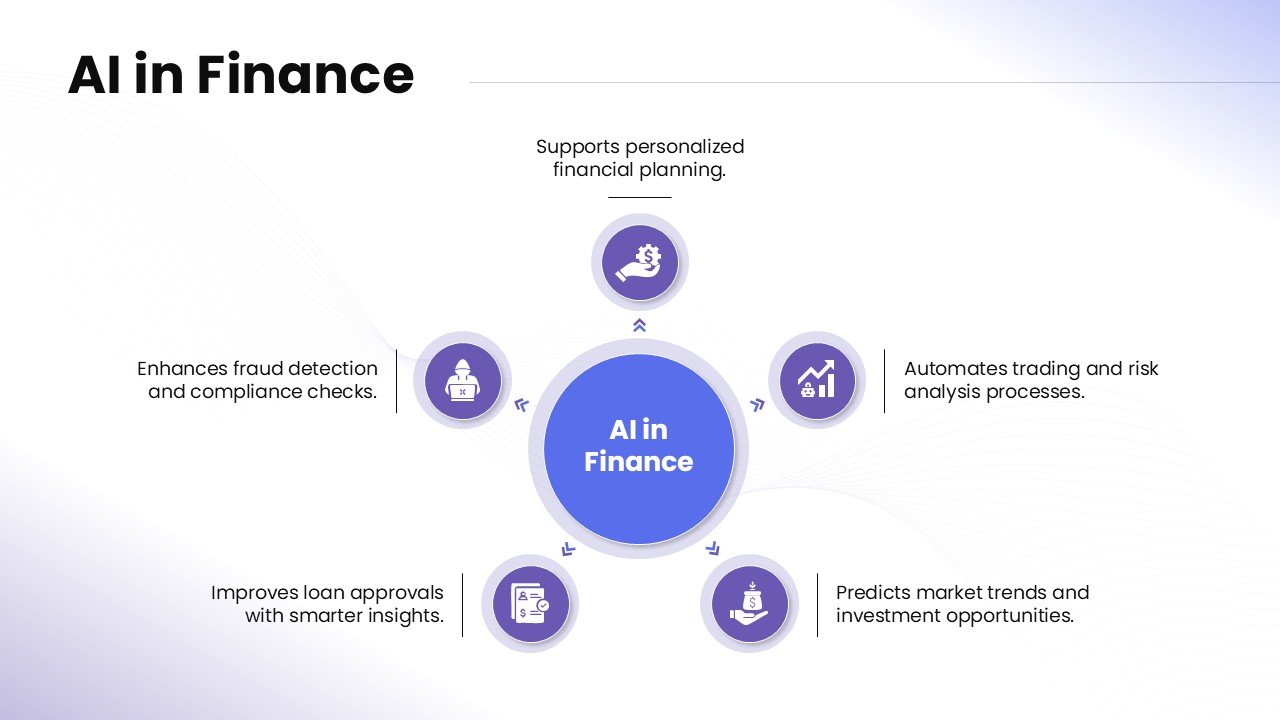
AI in Finance Overview template for PowerPoint & Google Slides
AI
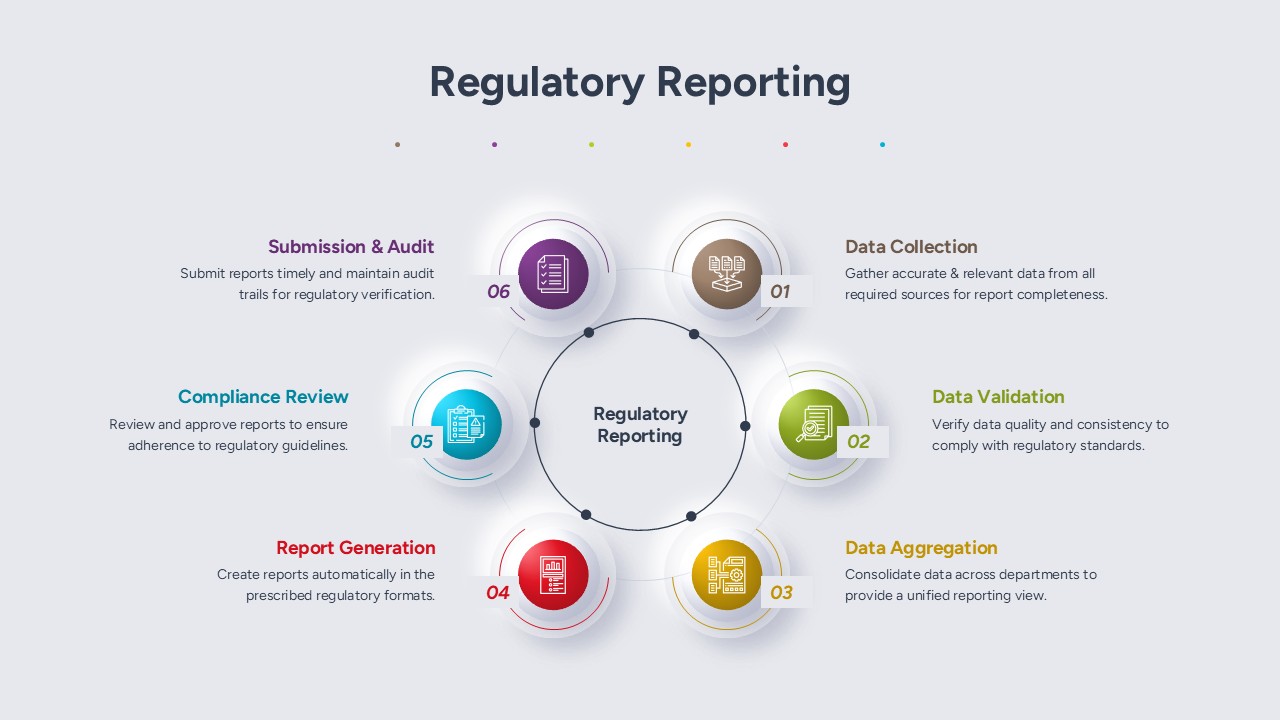
Regulatory Reporting Process Overview template for PowerPoint & Google Slides
Business
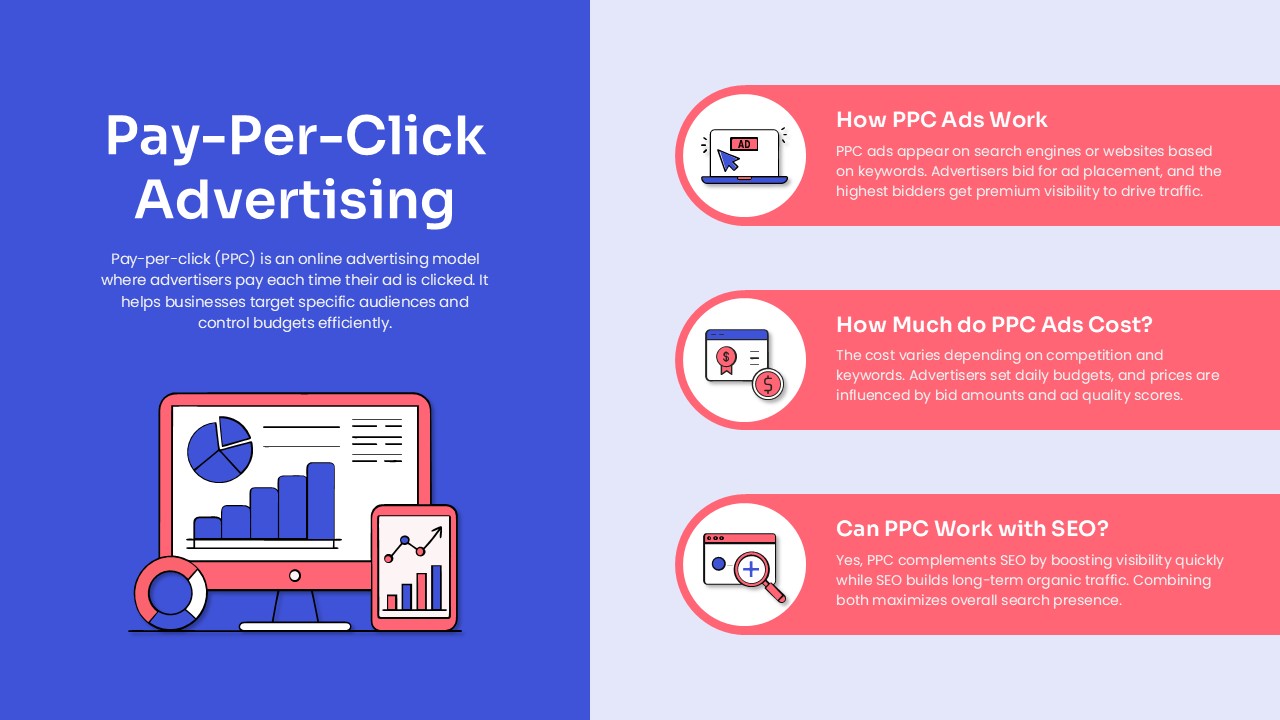
Pay-Per-Click Advertising Overview template for PowerPoint & Google Slides
Business
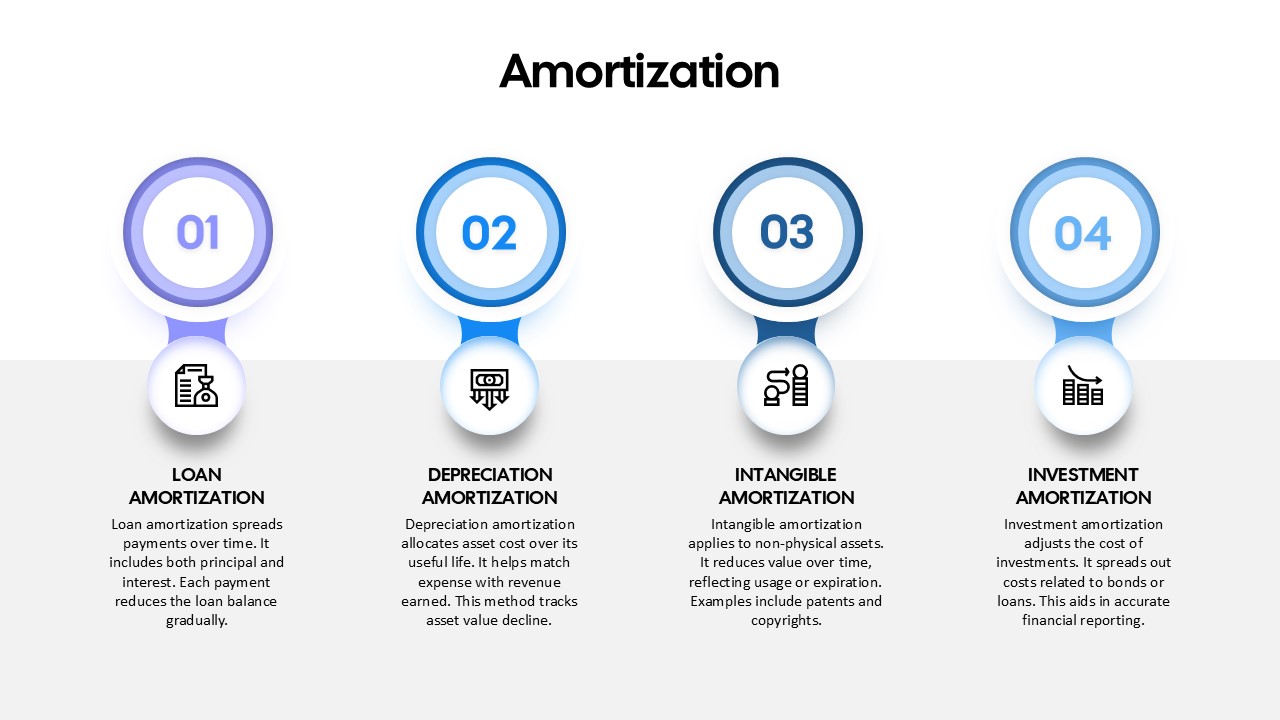
Amortization Breakdown Overview template for PowerPoint & Google Slides
Finance
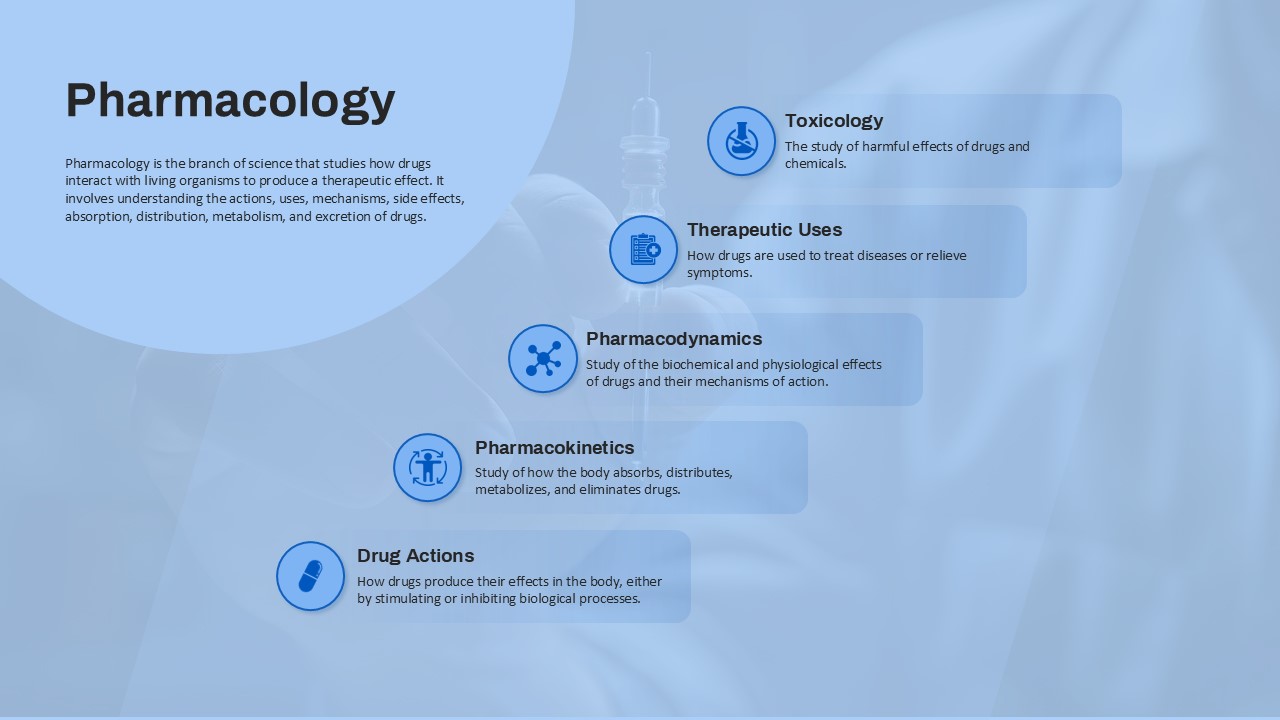
Pharmacology Overview template for PowerPoint & Google Slides
Health
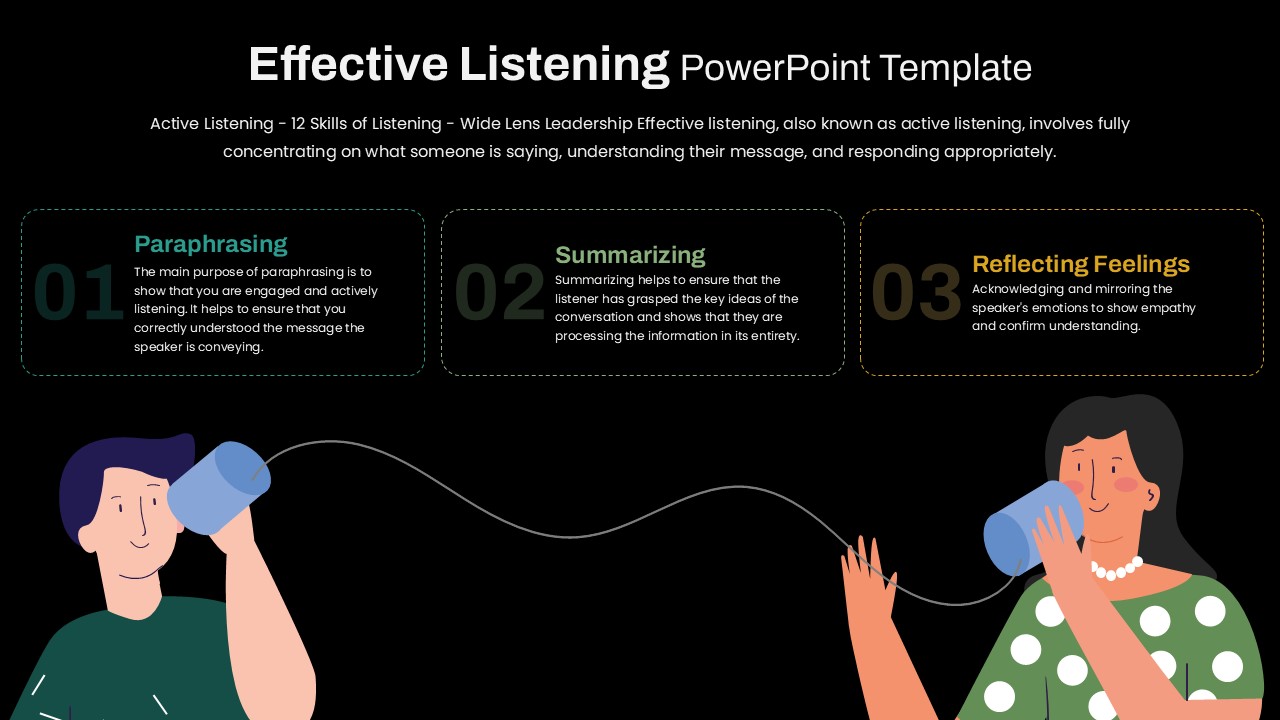
Effective Listening Skills Overview Template for PowerPoint & Google Slides
Process
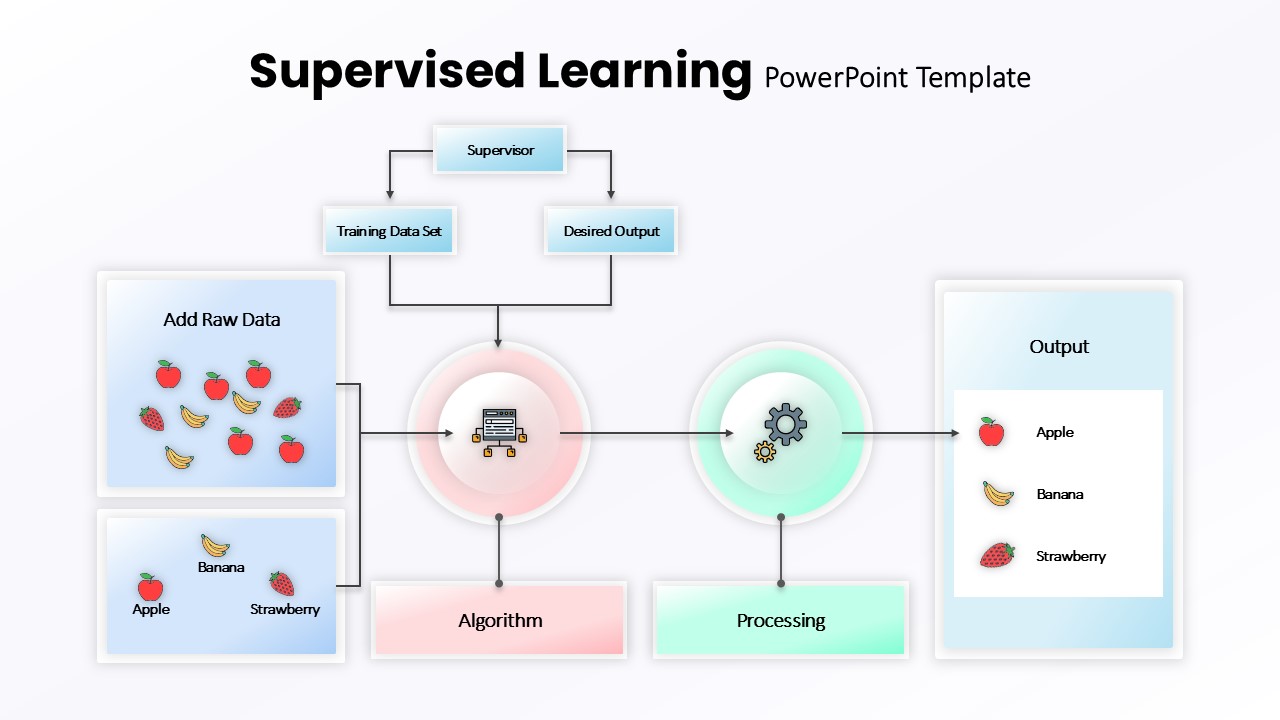
Supervised Learning Overview template for PowerPoint & Google Slides
Technology
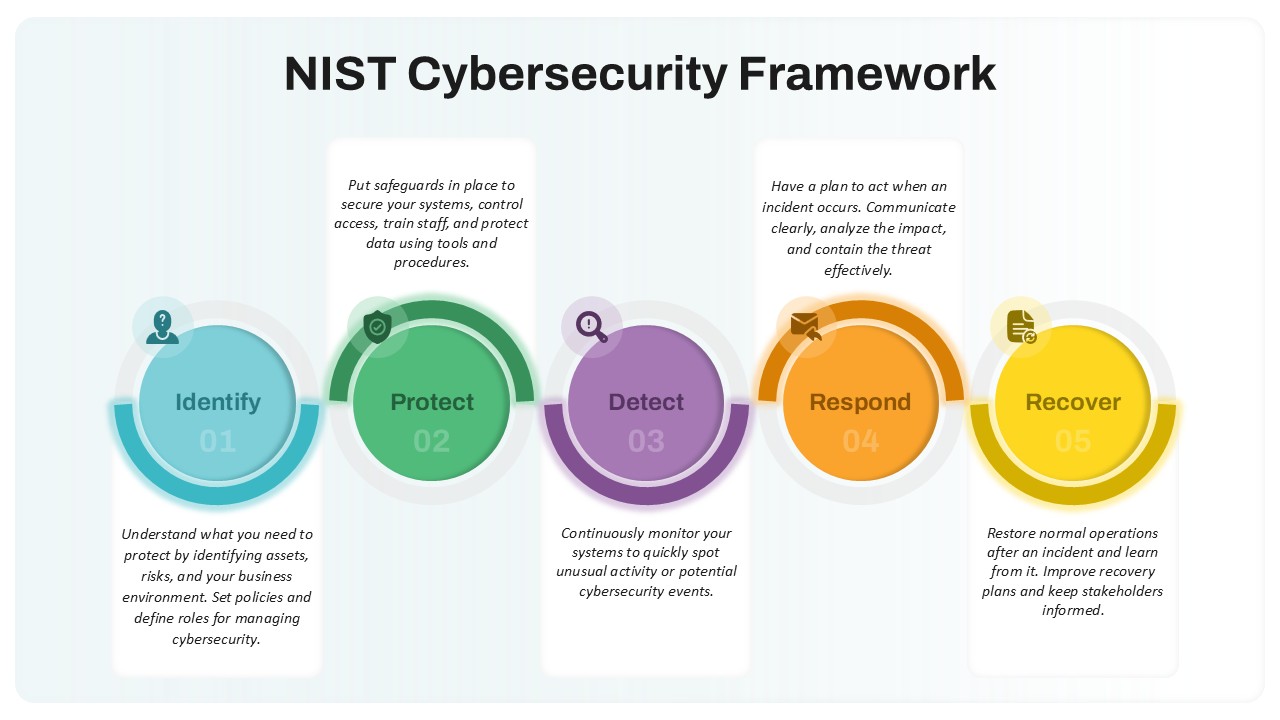
NIST Cybersecurity Framework Overview template for PowerPoint & Google Slides
Technology
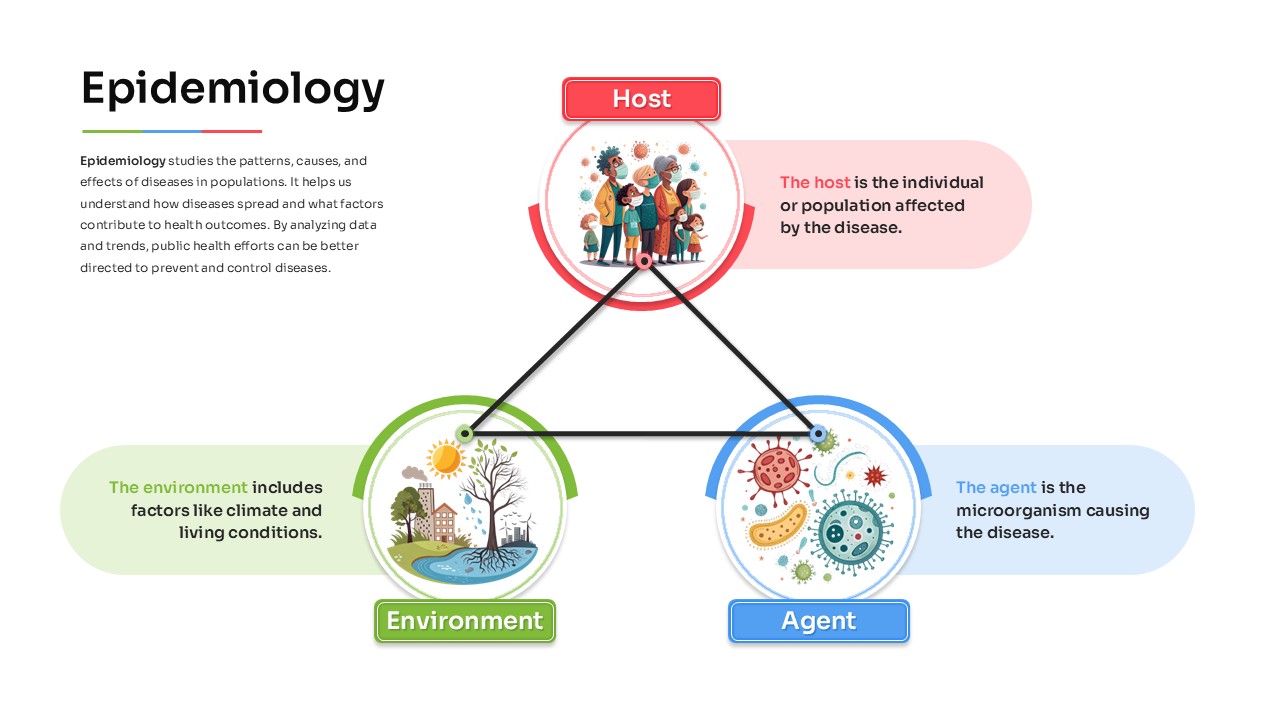
Epidemiology Overview template for PowerPoint & Google Slides
Health
Data Protection & Encryption in the Cloud Overview template for PowerPoint & Google Slides
Cloud Computing
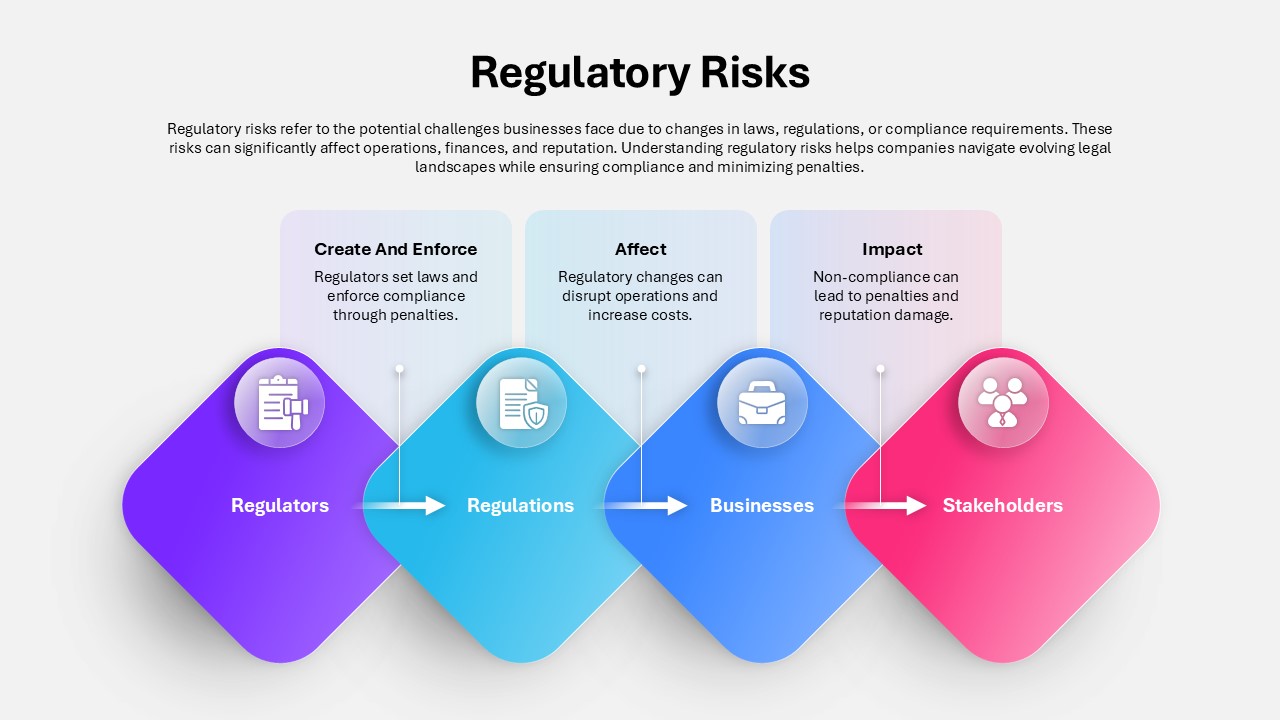
Regulatory Risks Overview template for PowerPoint & Google Slides
Process
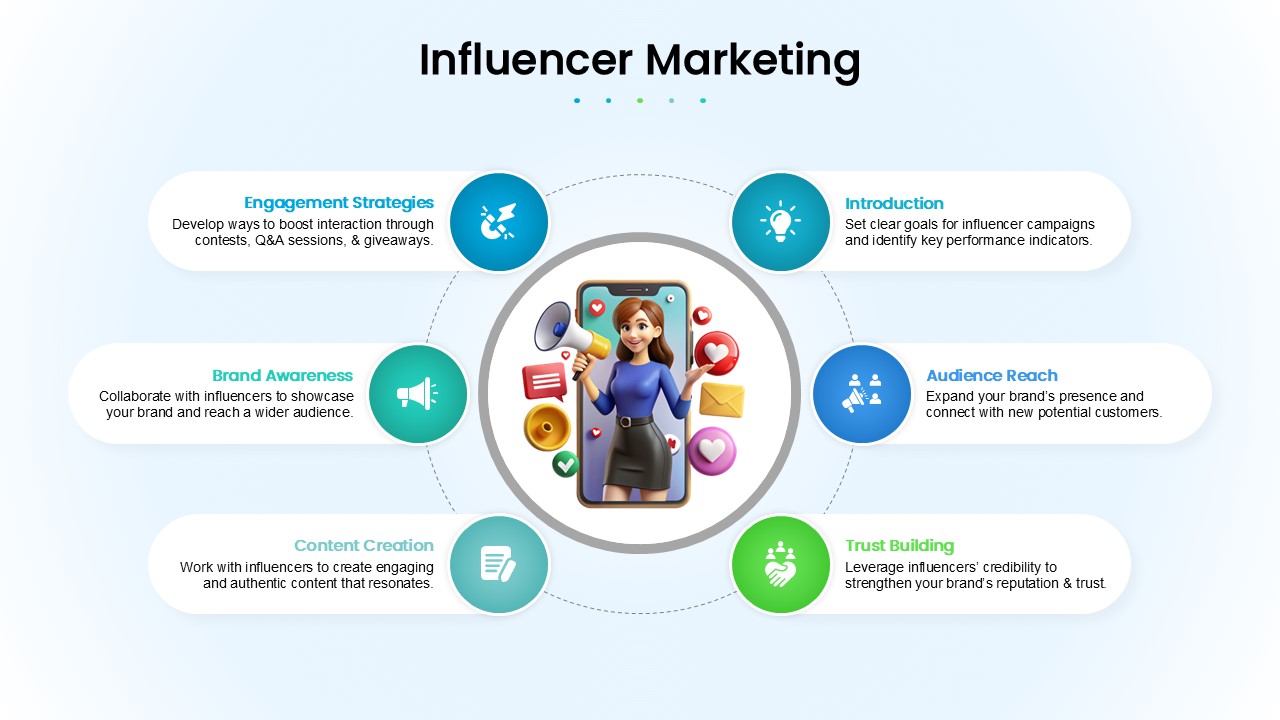
Influencer Marketing Overview template for PowerPoint & Google Slides
Business
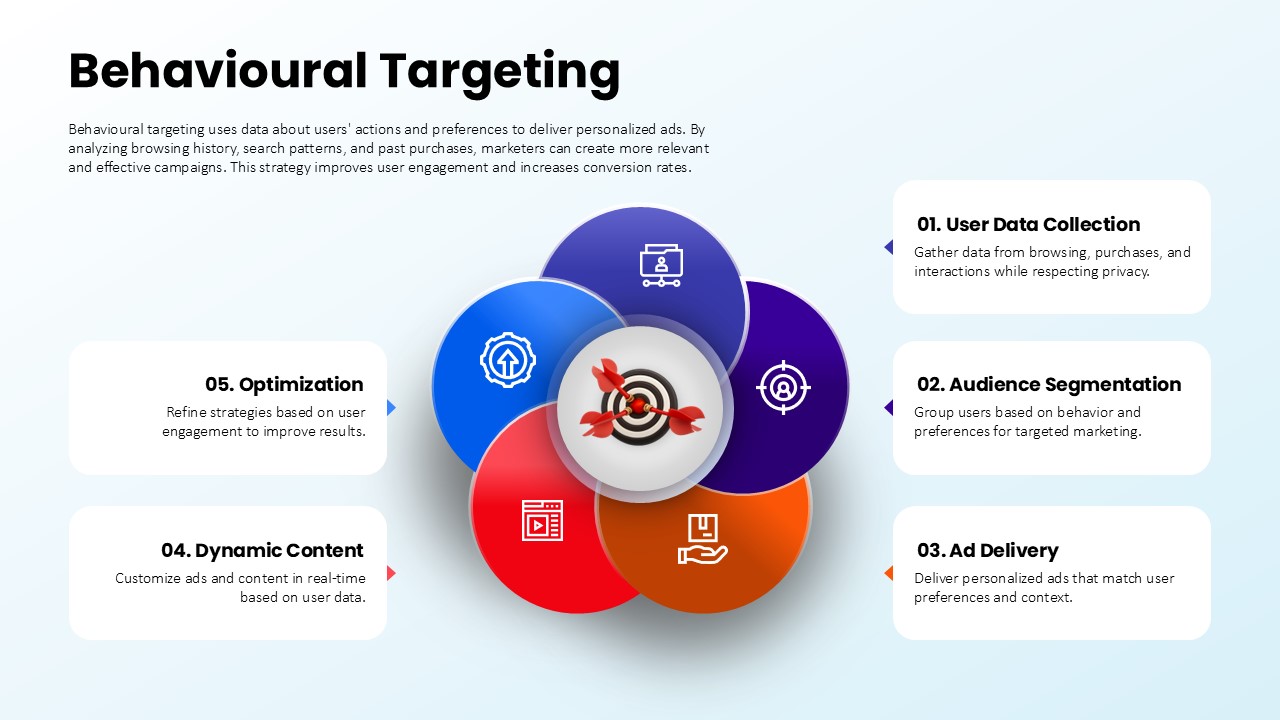
Behavioural Targeting Strategy Overview template for PowerPoint & Google Slides
Process
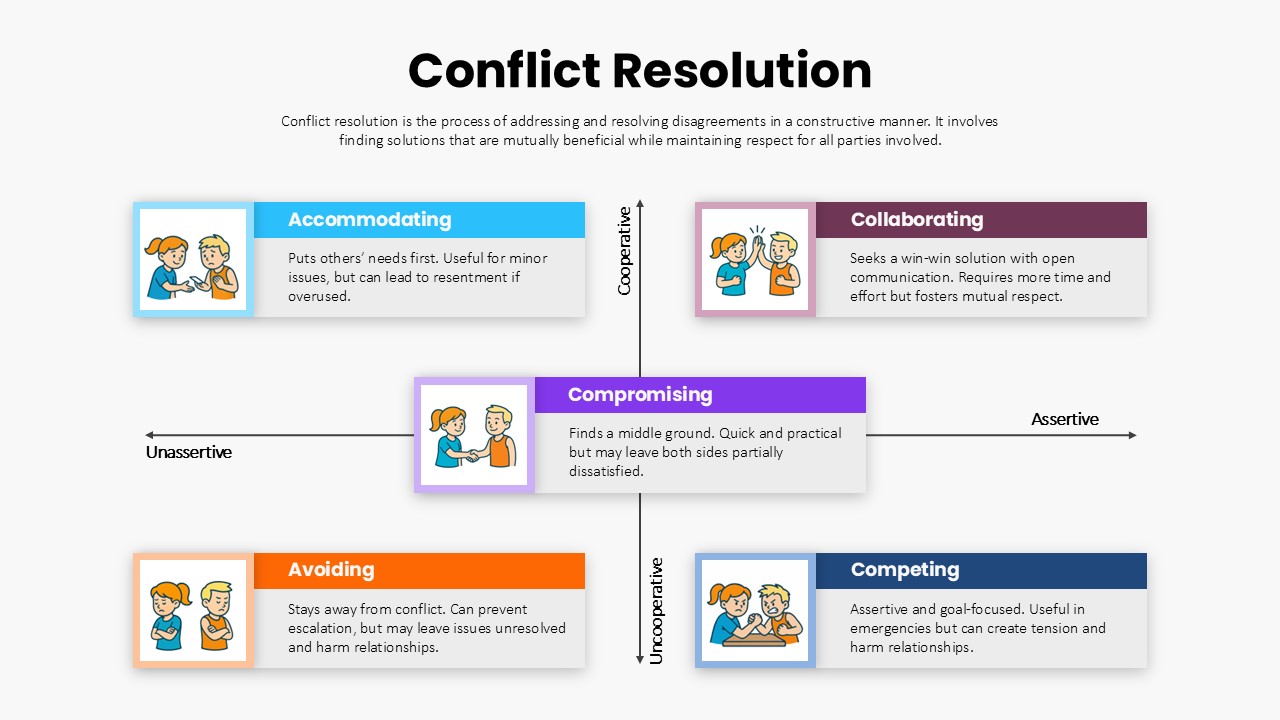
Conflict Resolution Strategies Overview template for PowerPoint & Google Slides
Process
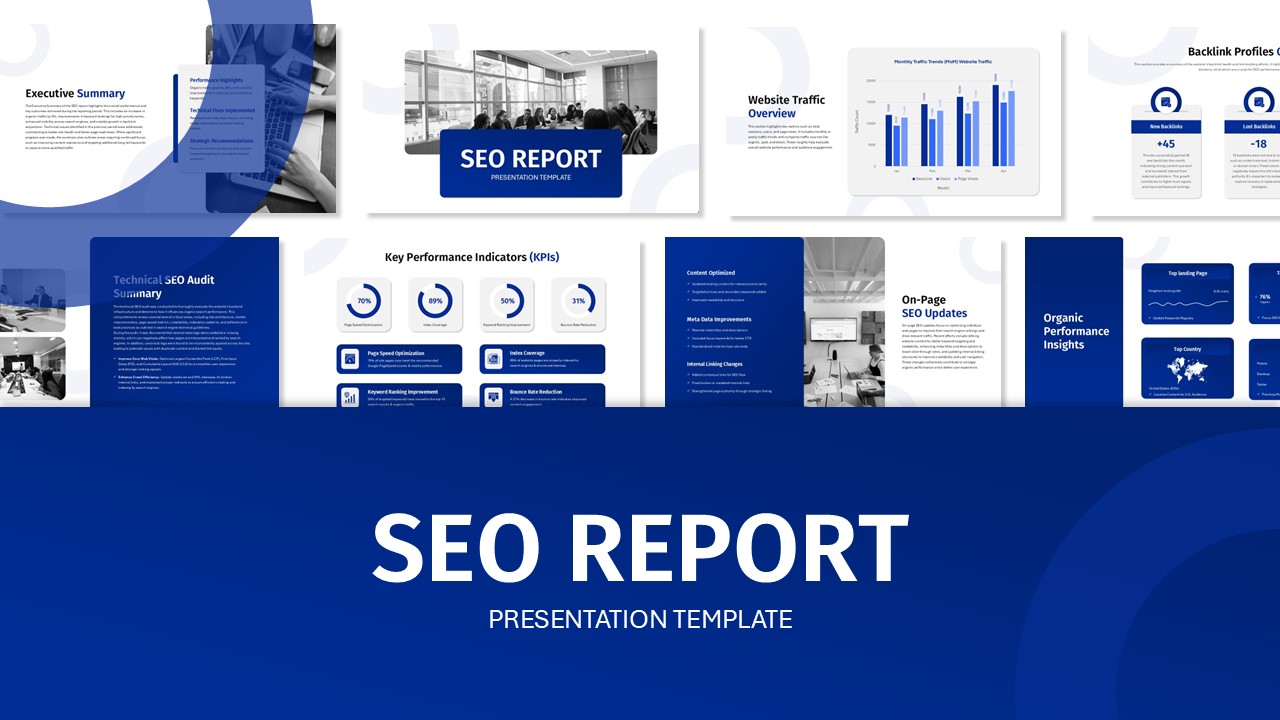
SEO Performance Report Overview template for PowerPoint & Google Slides
Digital Marketing
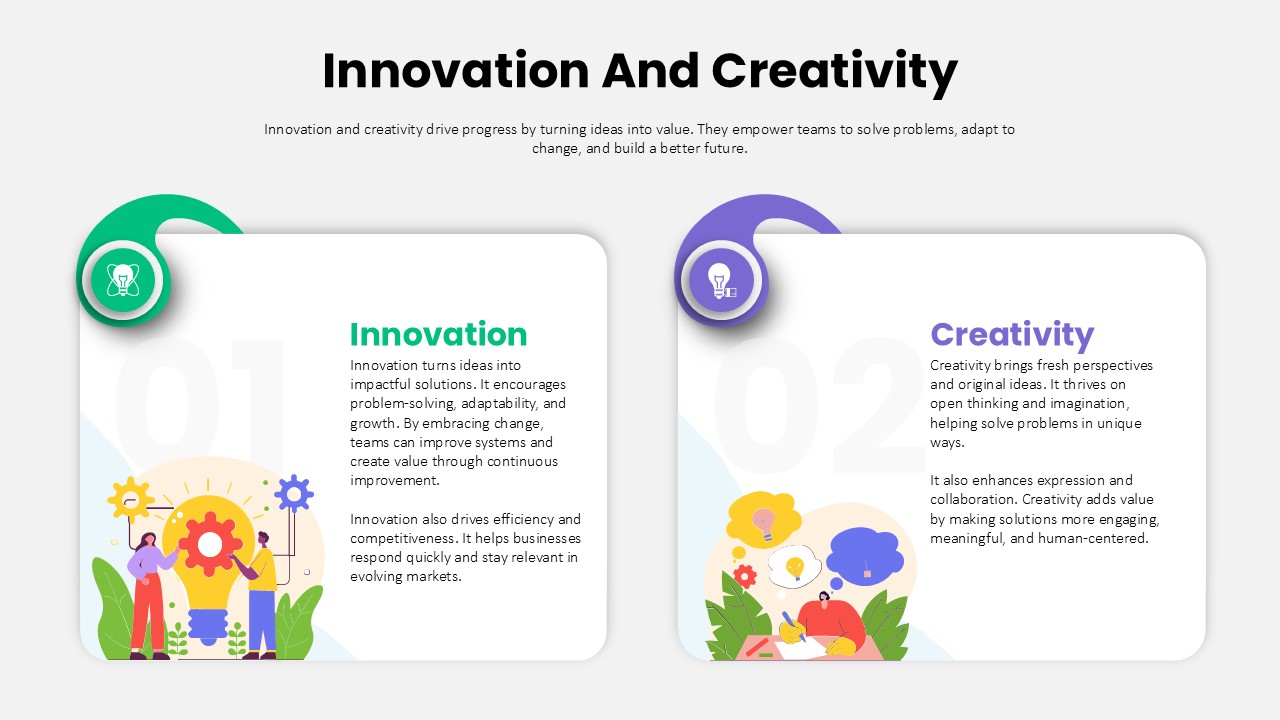
Innovation and Creativity Overview template for PowerPoint & Google Slides
Process
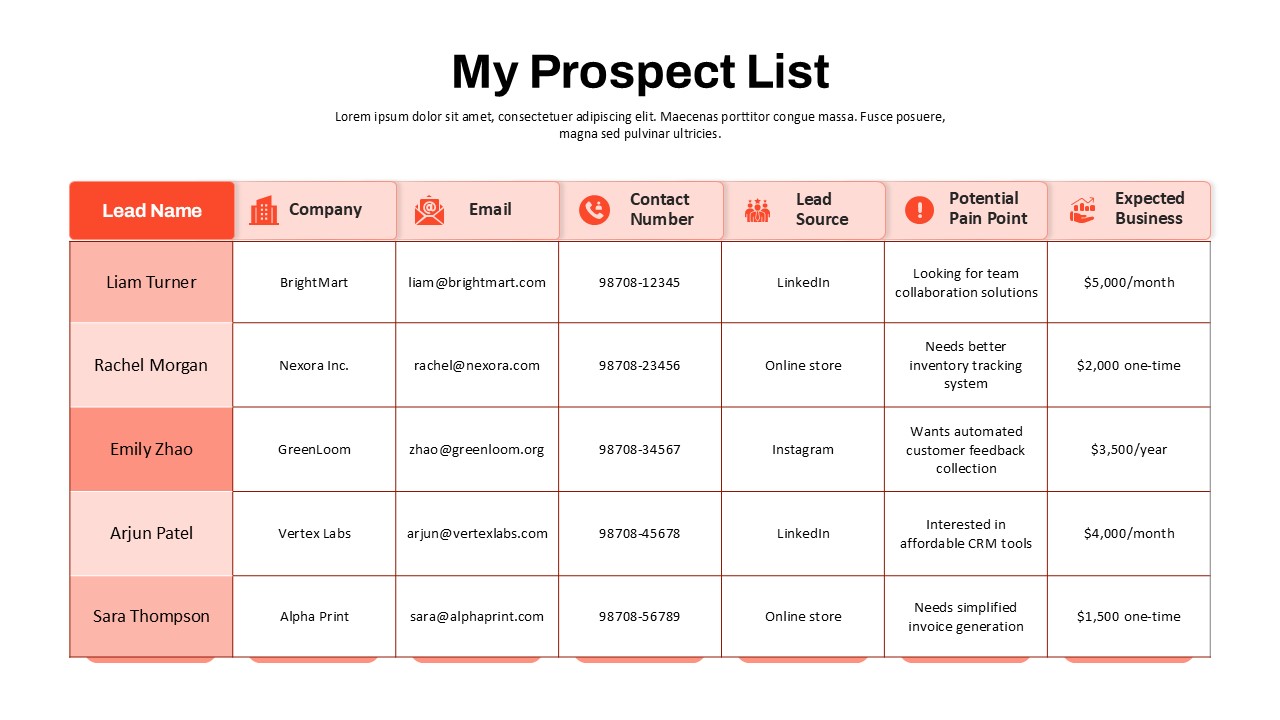
Prospect List Overview Template for PowerPoint & Google Slides
Business Report
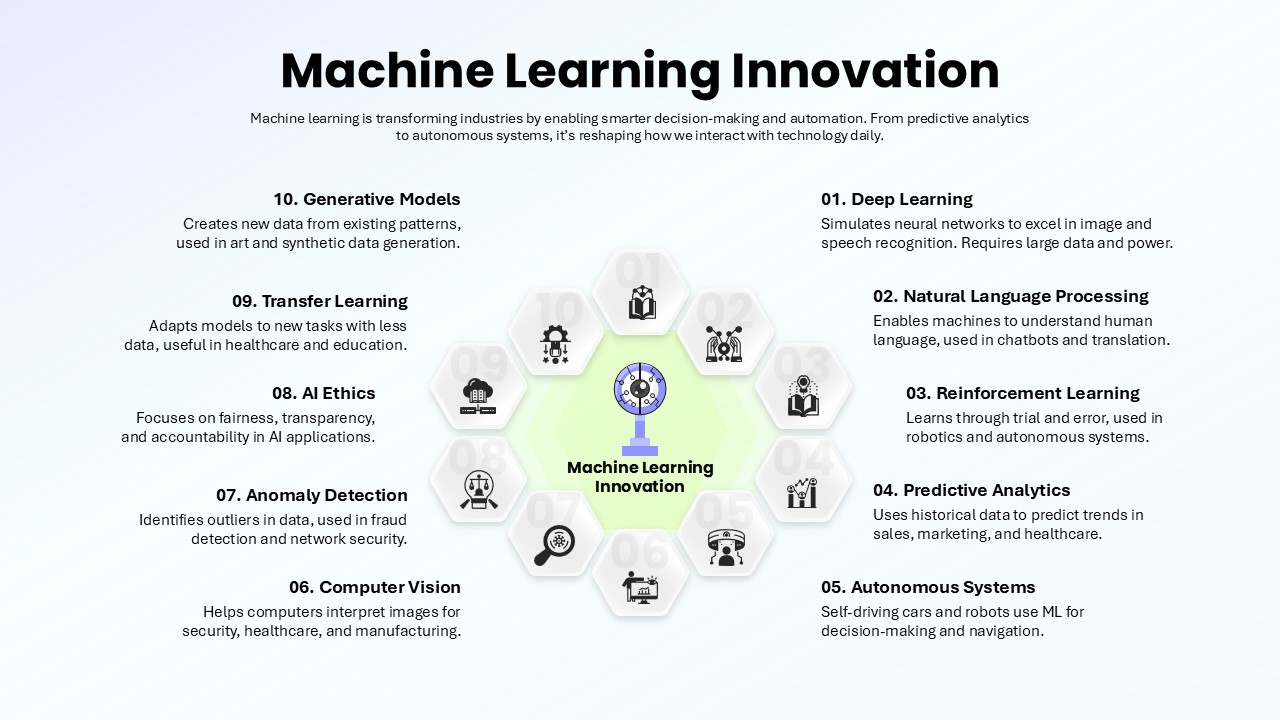
Machine Learning Innovation Overview template for PowerPoint & Google Slides
AI
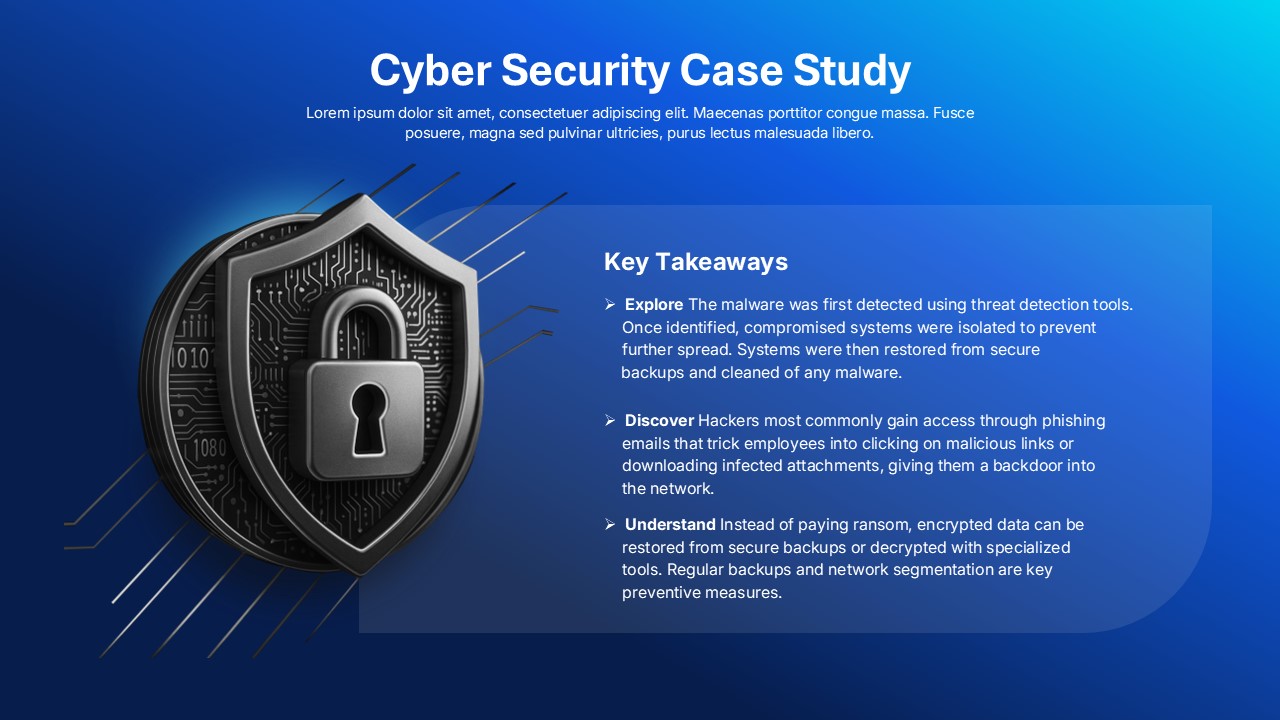
Cyber Security Case Study Overview Template for PowerPoint & Google Slides
Information Technology
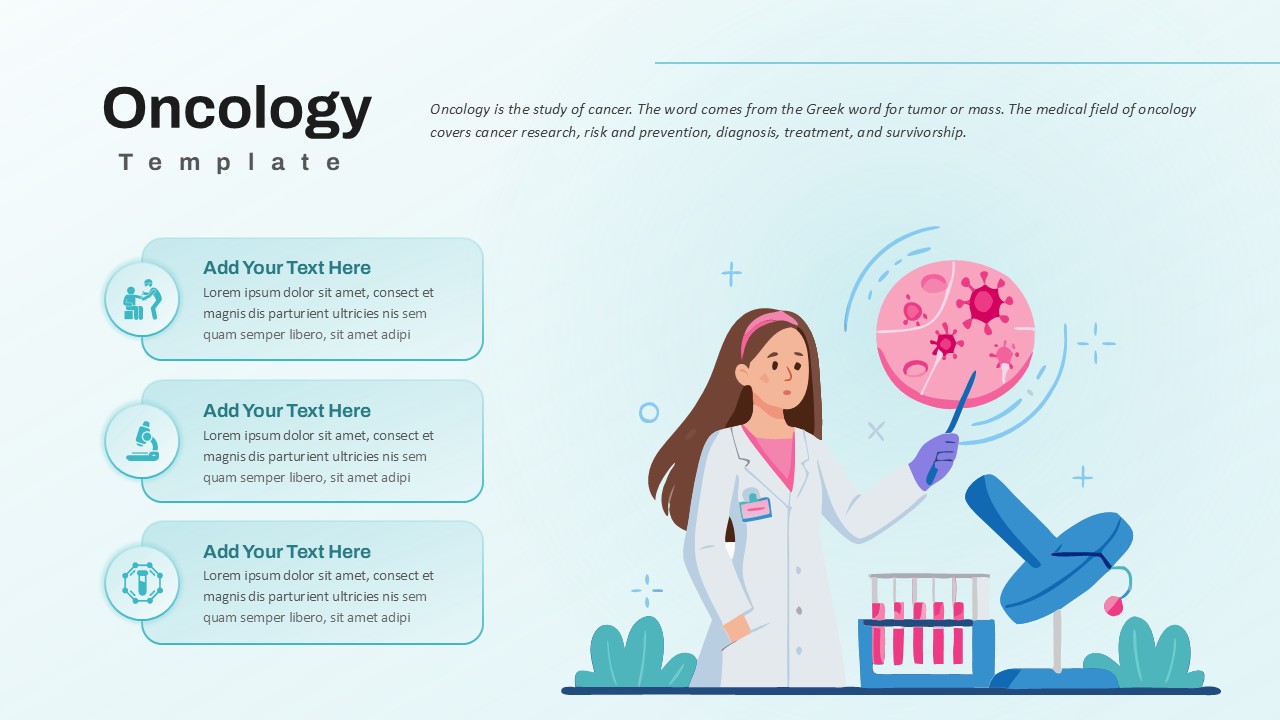
Oncology Overview template for PowerPoint & Google Slides
Health
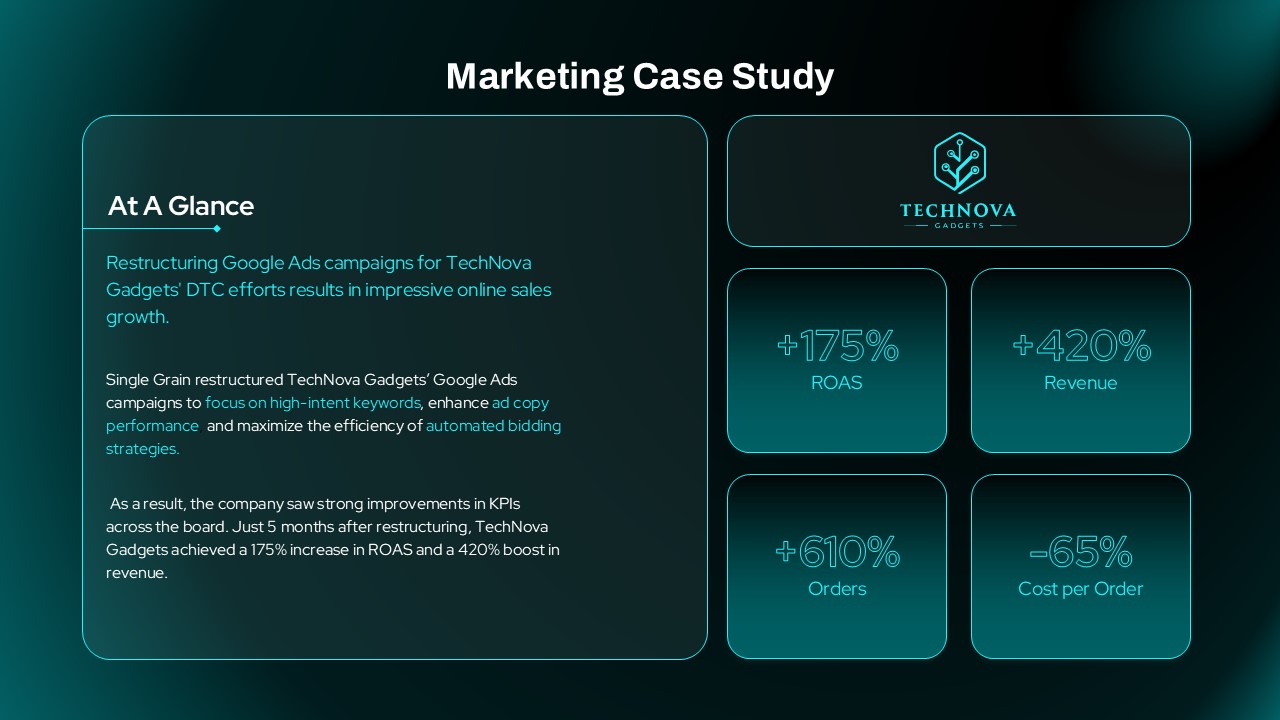
Marketing Case Study Overview template for PowerPoint & Google Slides
Digital Marketing
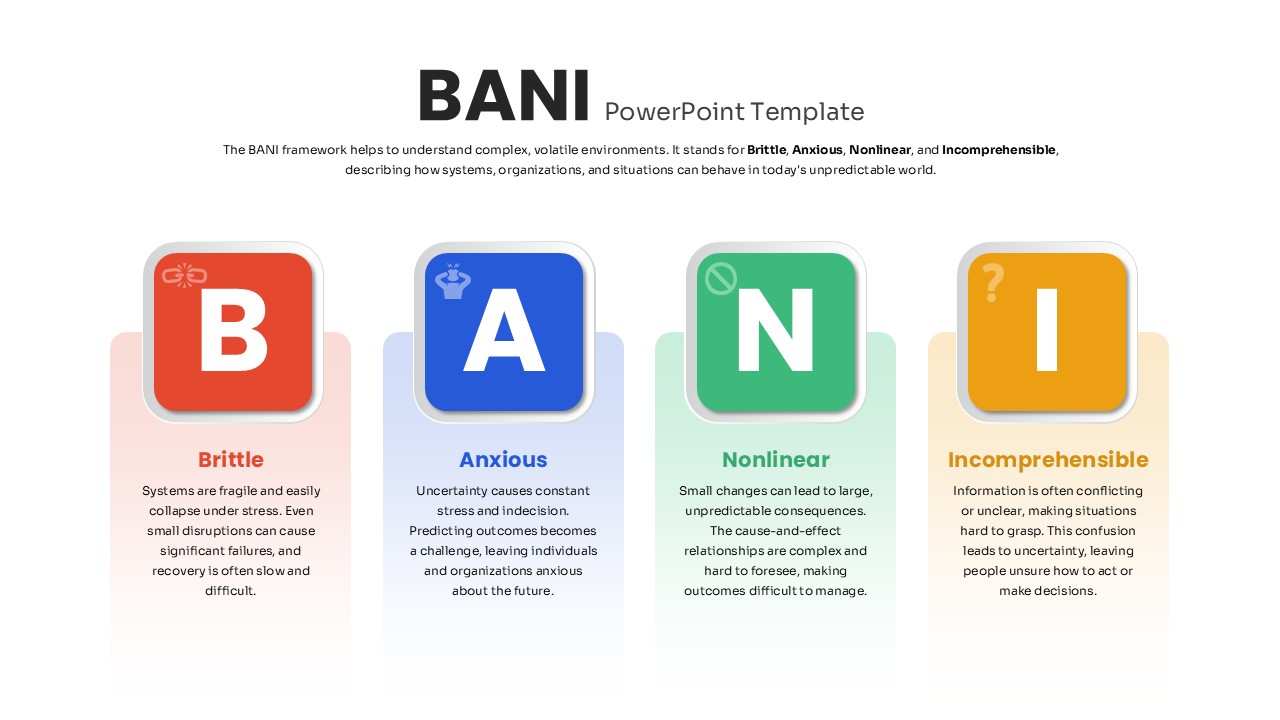
Four-Part BANI Framework Overview Template for PowerPoint & Google Slides
PEST
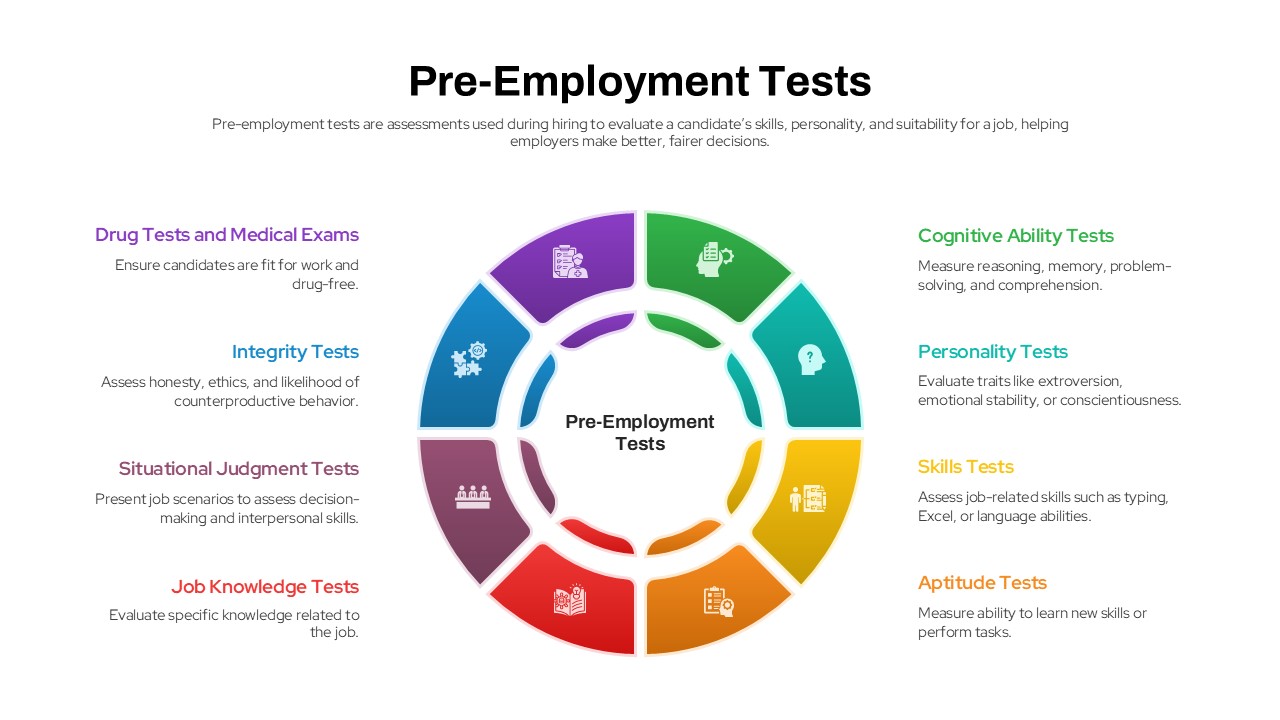
Pre-Employment Tests overview template for PowerPoint & Google Slides
Business
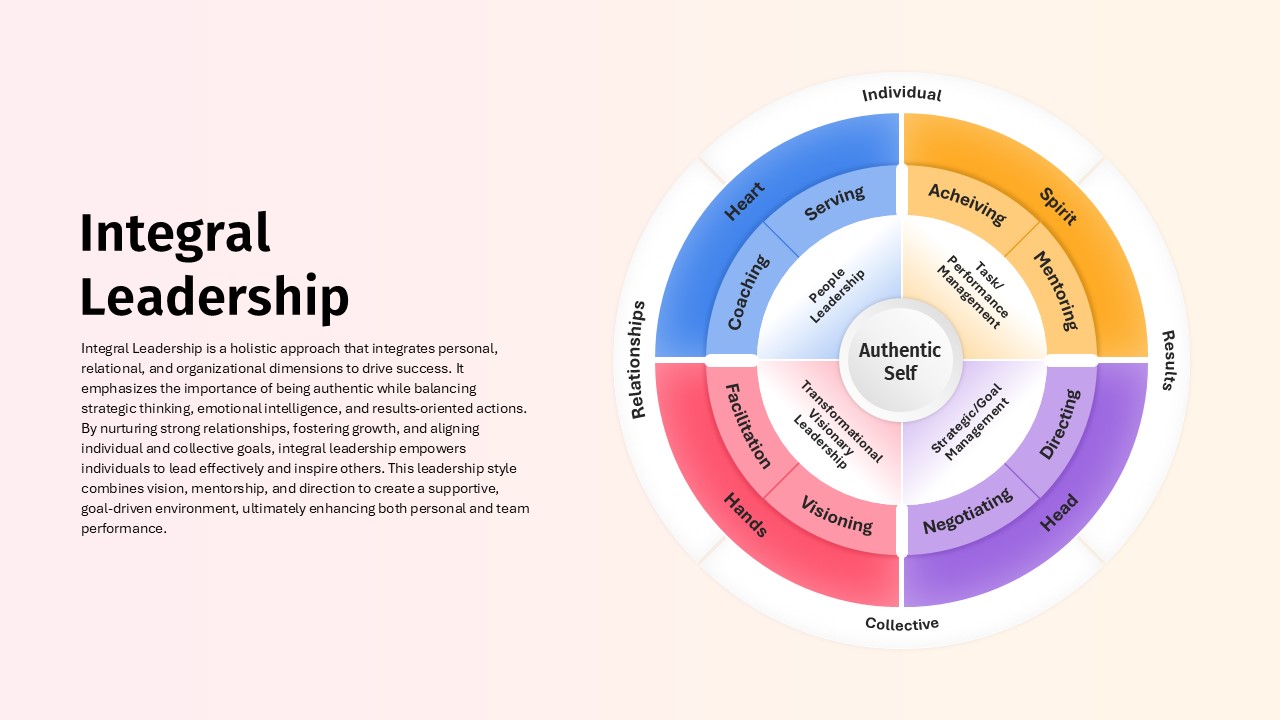
Integral Leadership Model Overview template for PowerPoint & Google Slides
Leadership
AI in Security overview template for PowerPoint & Google Slides
Technology
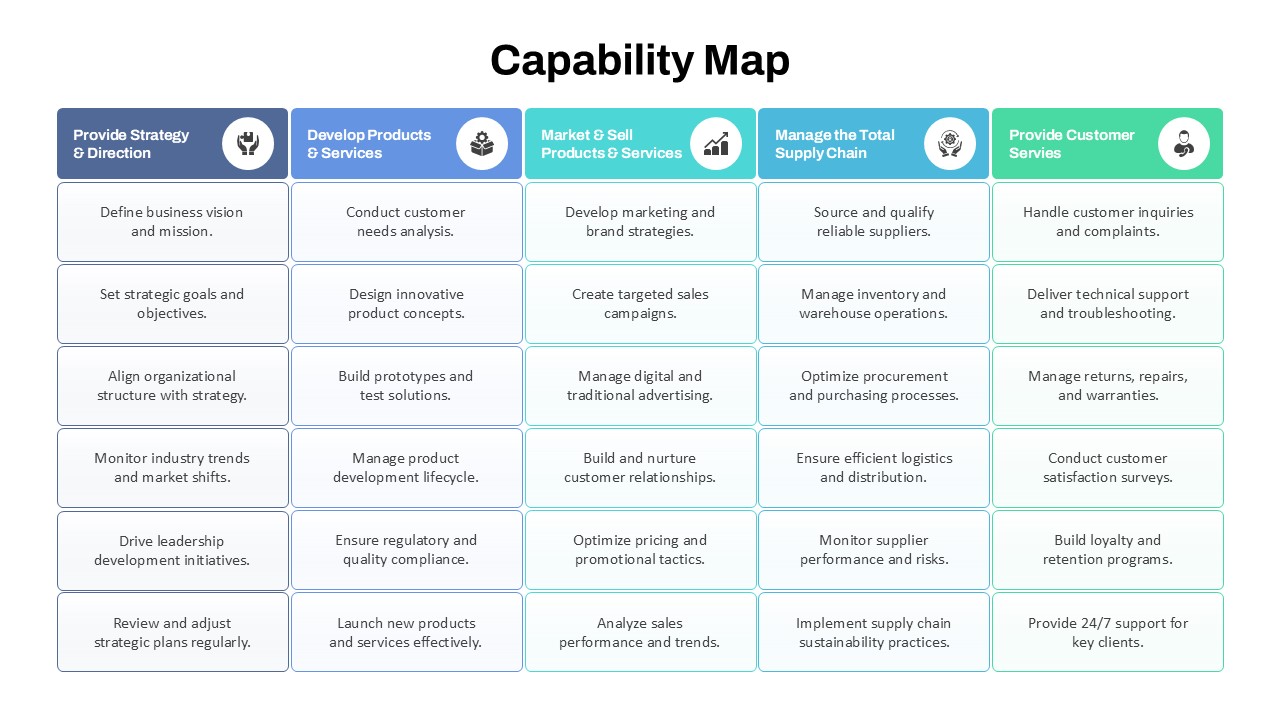
Capability Map Overview Template for PowerPoint & Google Slides
Business Strategy
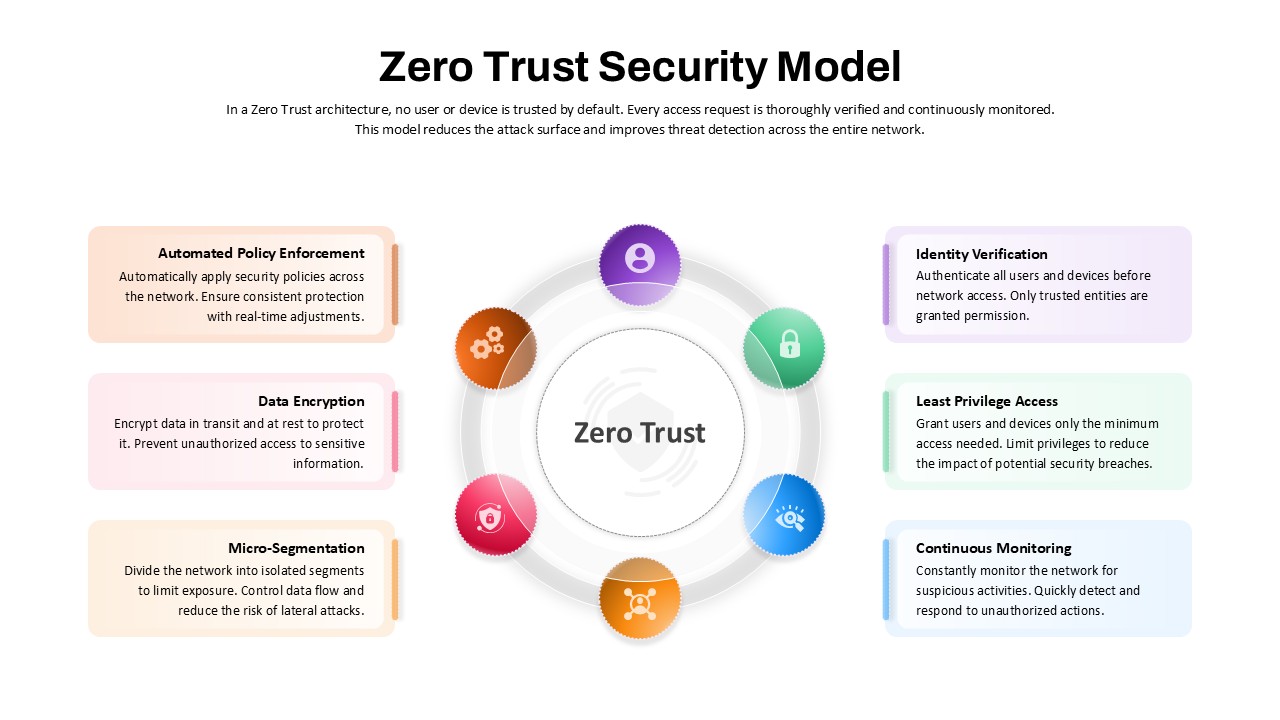
Zero Trust Security Model Overview template for PowerPoint & Google Slides
Risk Management
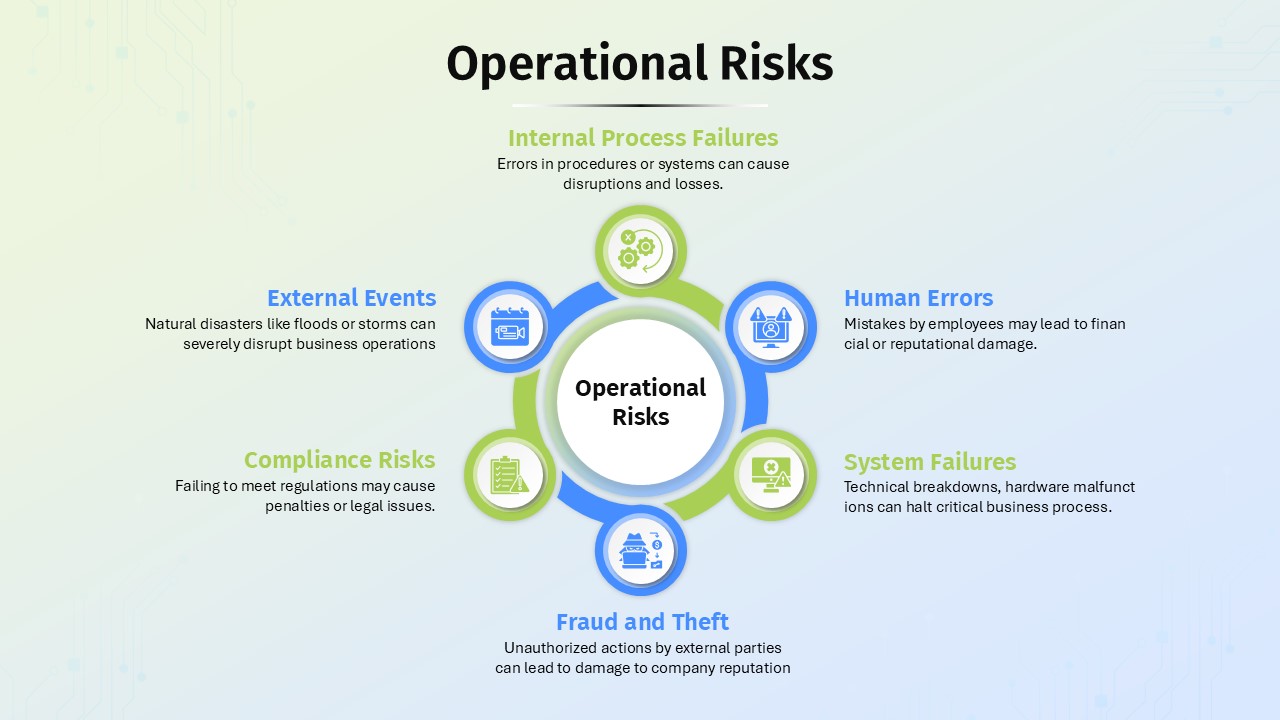
Operational Risks Overview template for PowerPoint & Google Slides
Business
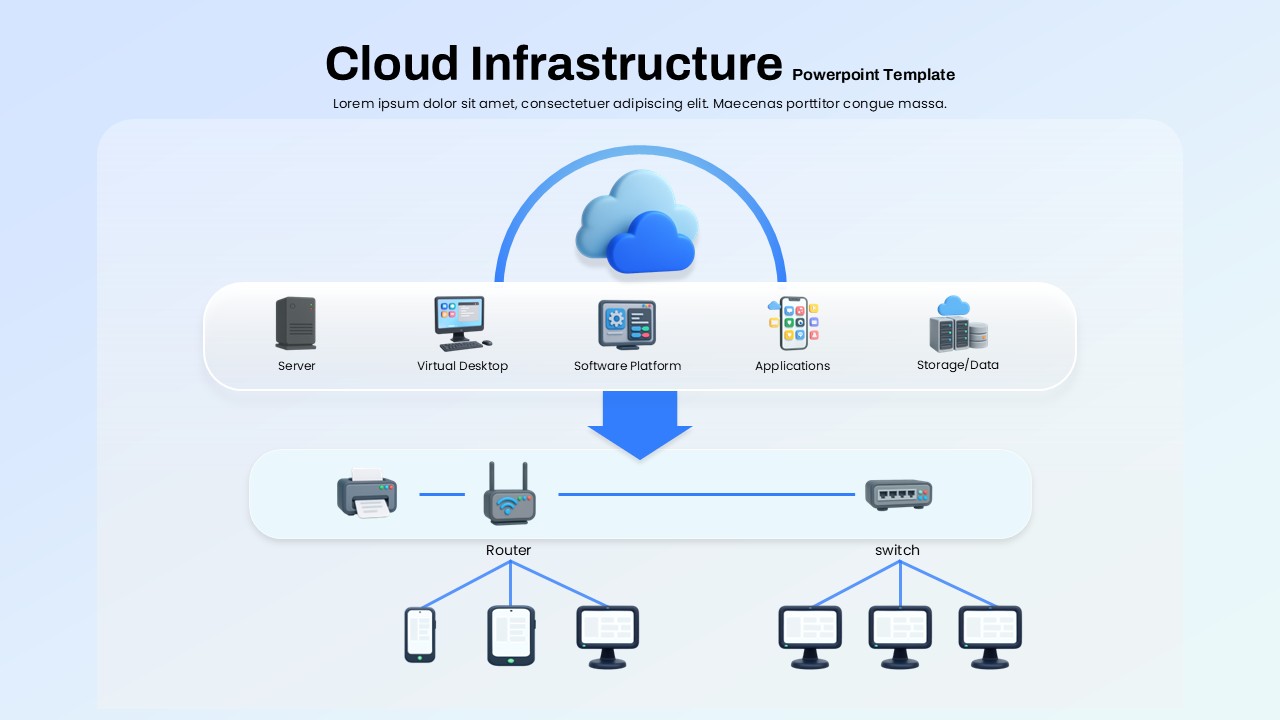
Cloud Infrastructure Overview template for PowerPoint & Google Slides
Information Technology
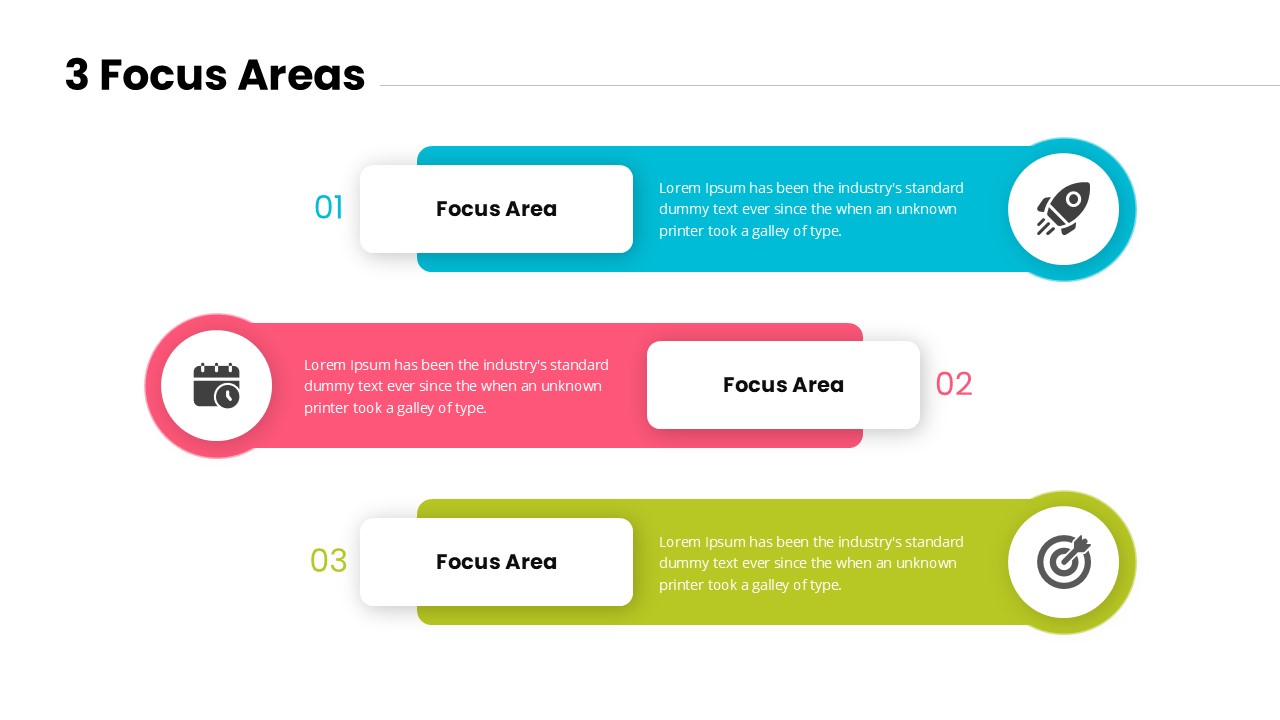
3 Focus Areas Overview Template for PowerPoint & Google Slides
Process
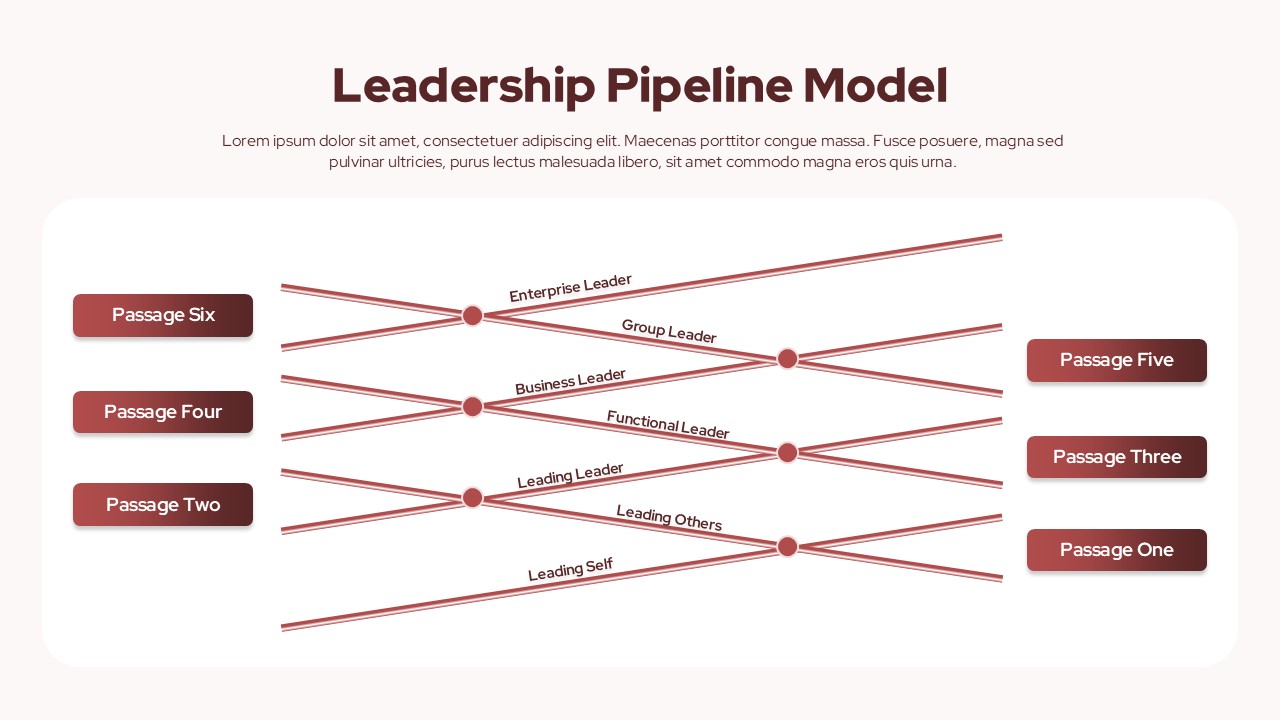
Leadership Pipeline Model Overview template for PowerPoint & Google Slides
Leadership
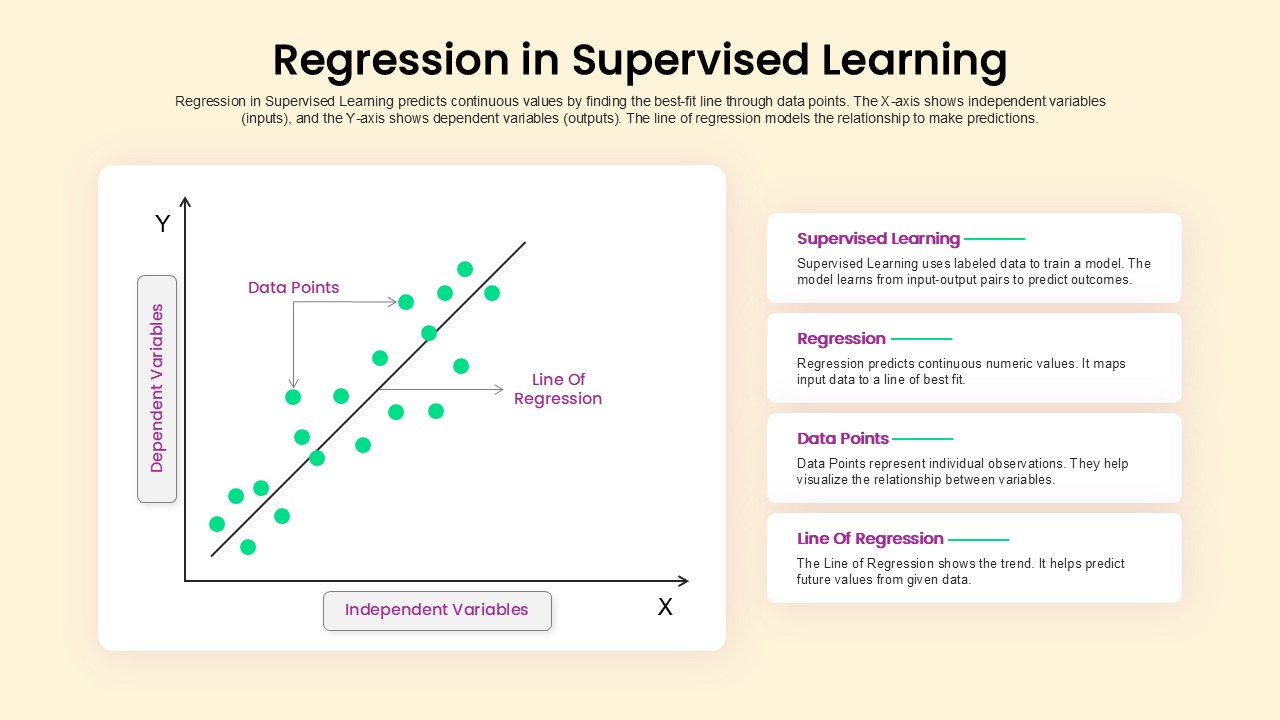
Regression in Supervised Learning Overview template for PowerPoint & Google Slides
Process
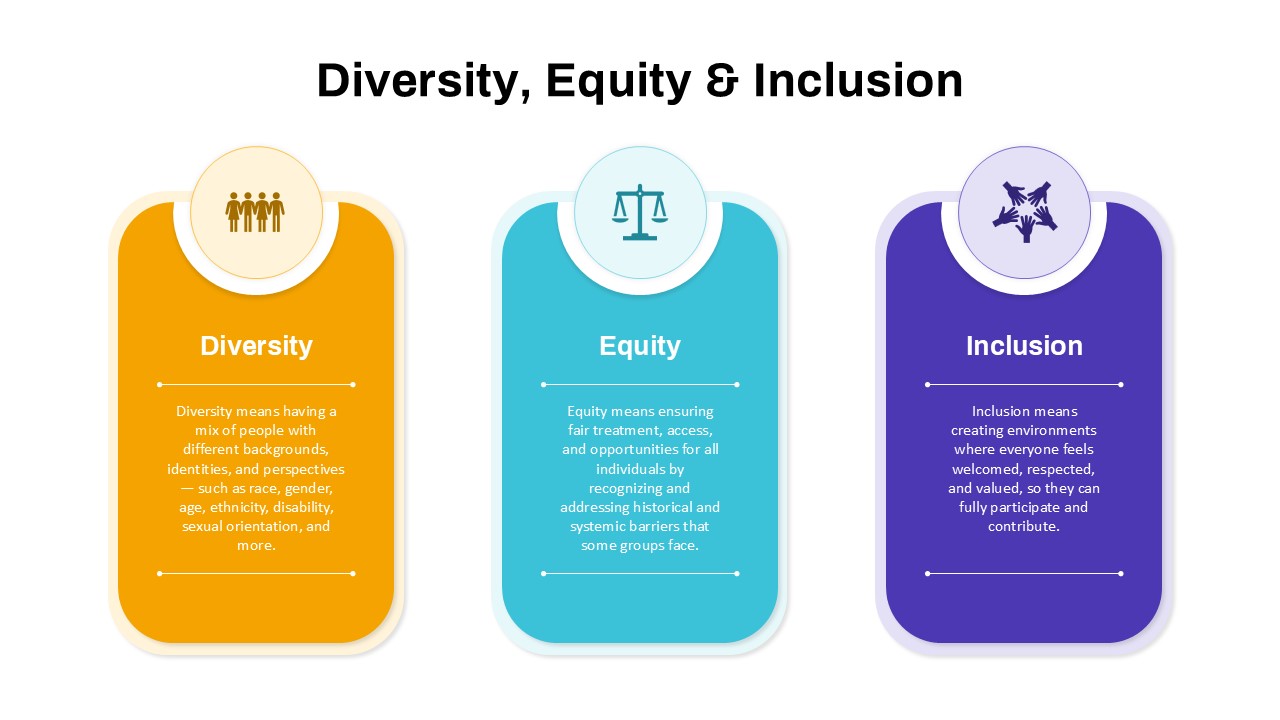
Diversity, Equity & Inclusion Overview template for PowerPoint & Google Slides
Employee Performance
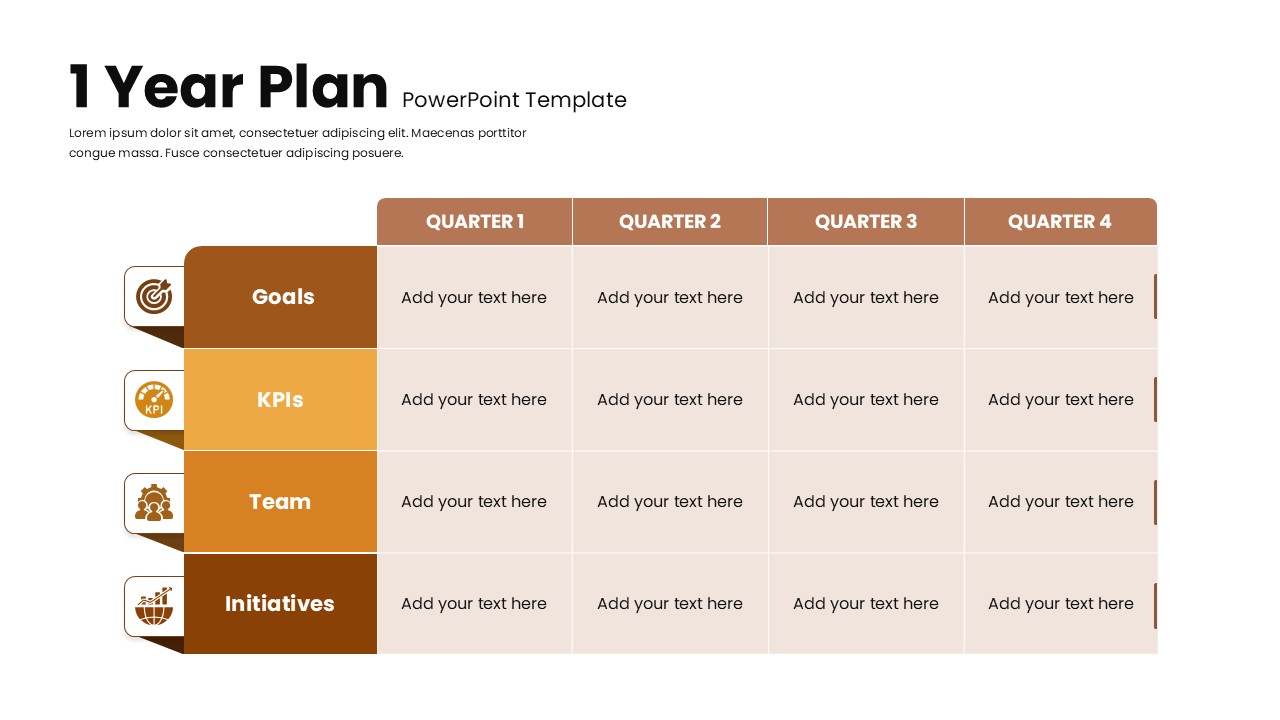
1 Year Plan Overview template for PowerPoint & Google Slides
Business Plan
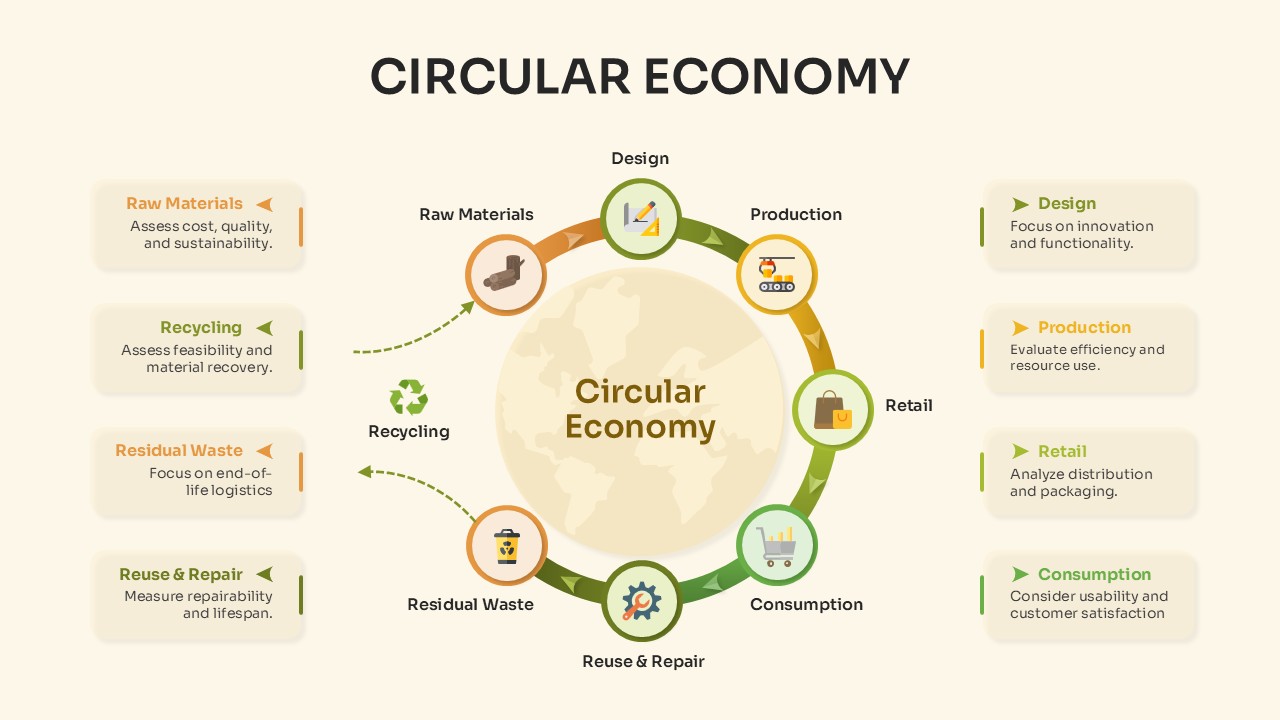
Circular Economy Process Overview Template for PowerPoint & Google Slides
Circular
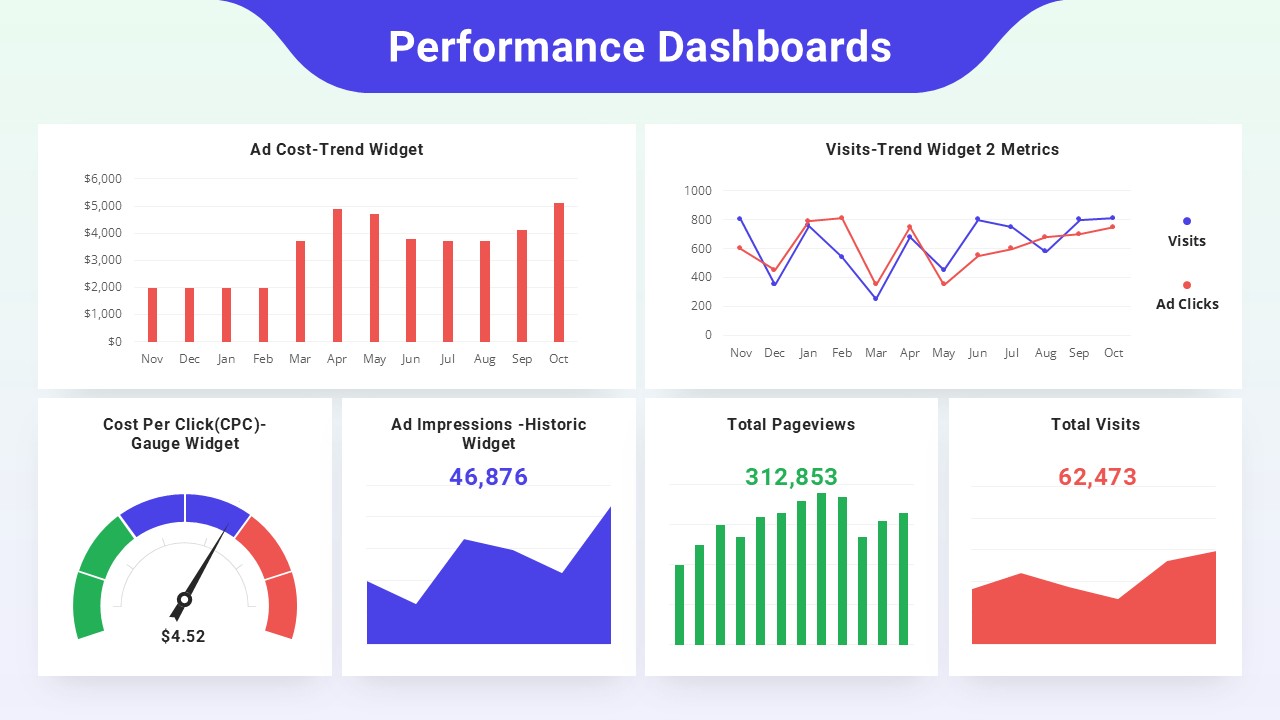
Performance Dashboards Overview Template for PowerPoint & Google Slides
Business Report
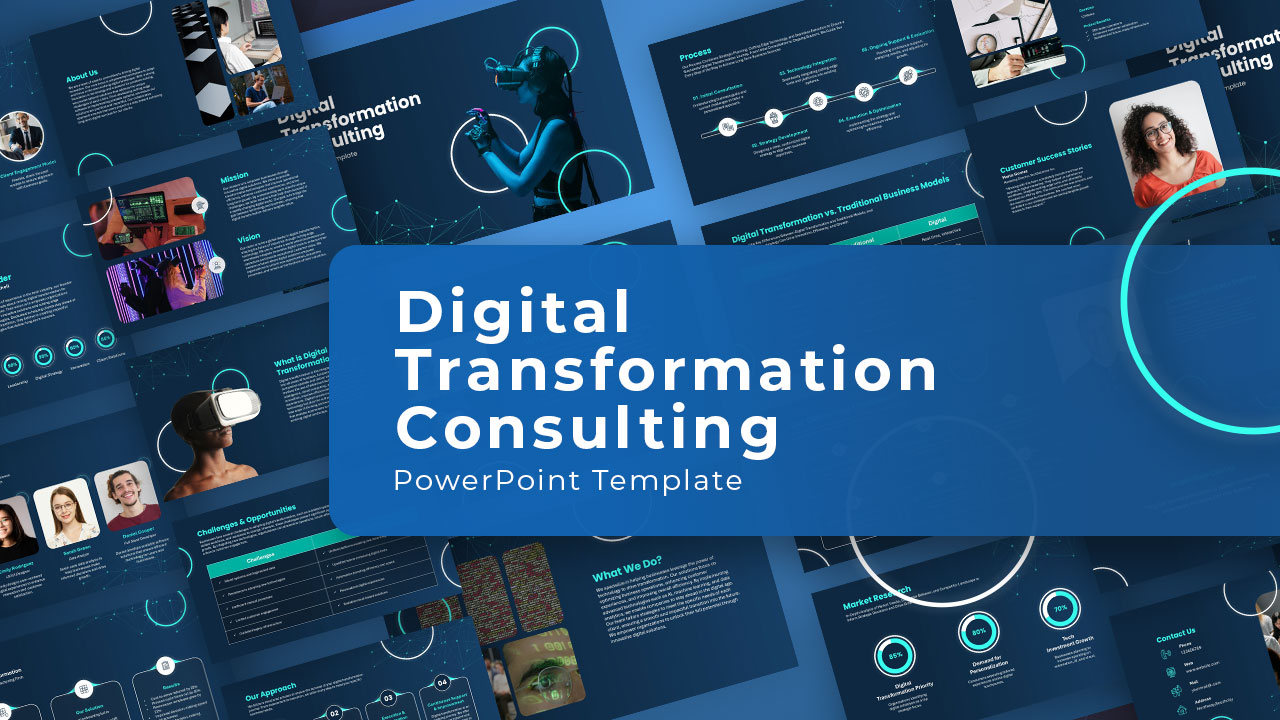
Digital Transformation Consulting Overview Template for PowerPoint & Google Slides
Information Technology
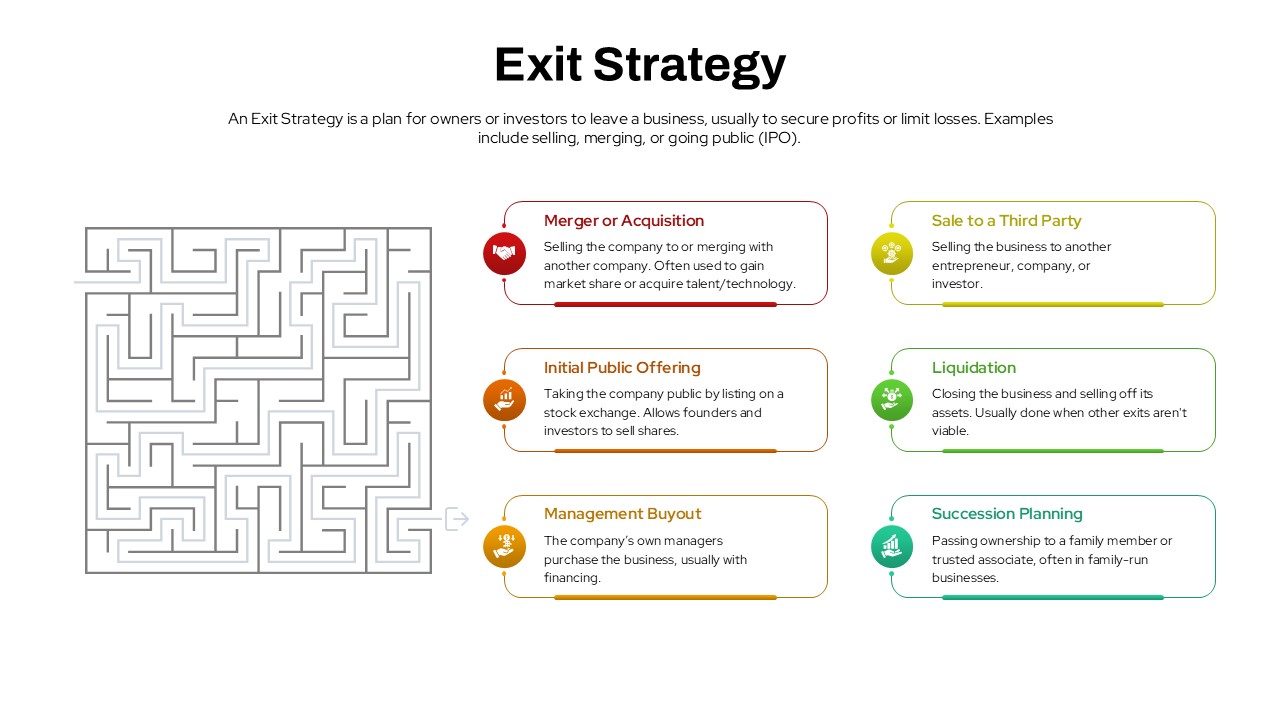
Exit Strategy Options Overview Template for PowerPoint & Google Slides
Business Plan
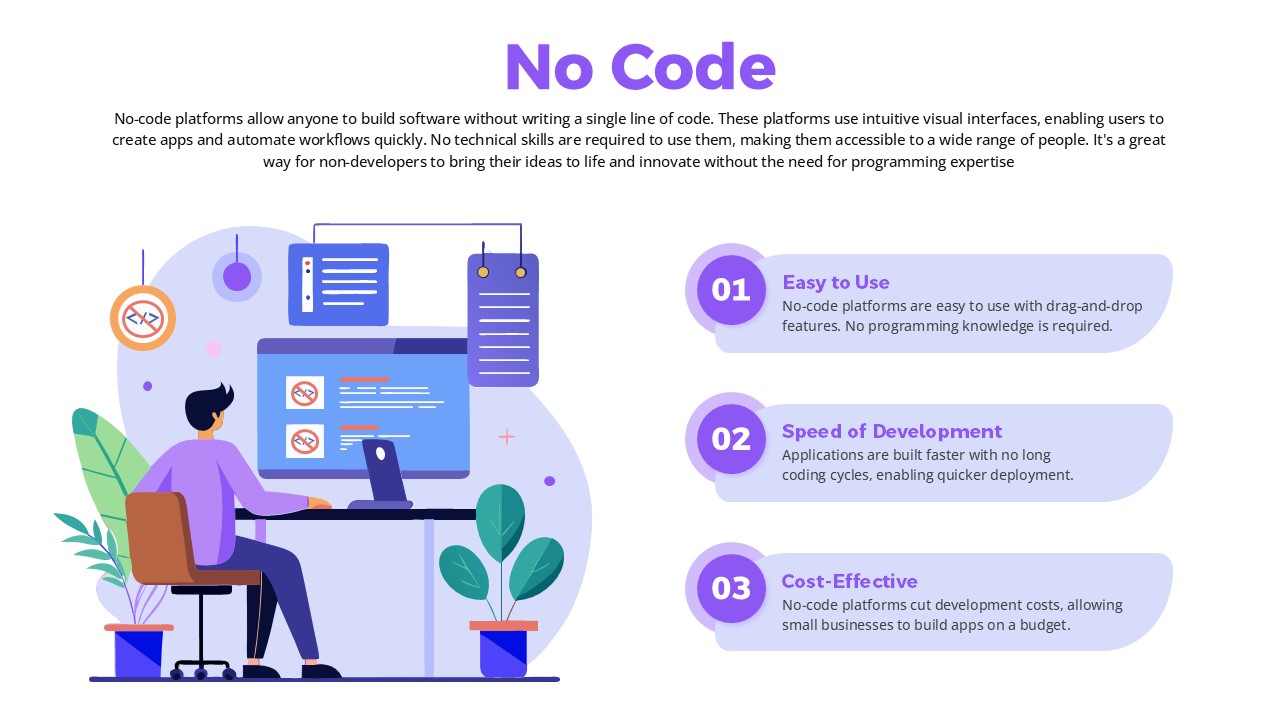
No-Code Overview with 3 Key Benefits Template for PowerPoint & Google Slides
Software Development
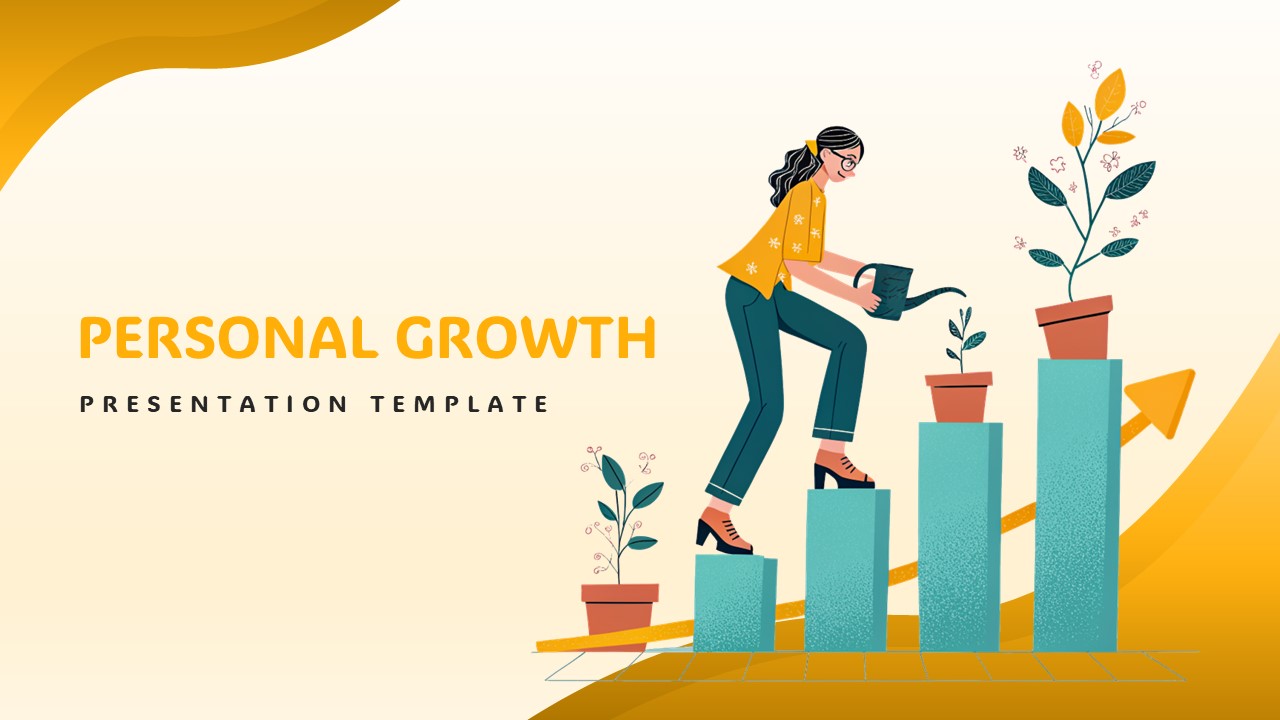
Personal Growth Overview Template for PowerPoint & Google Slides
Business
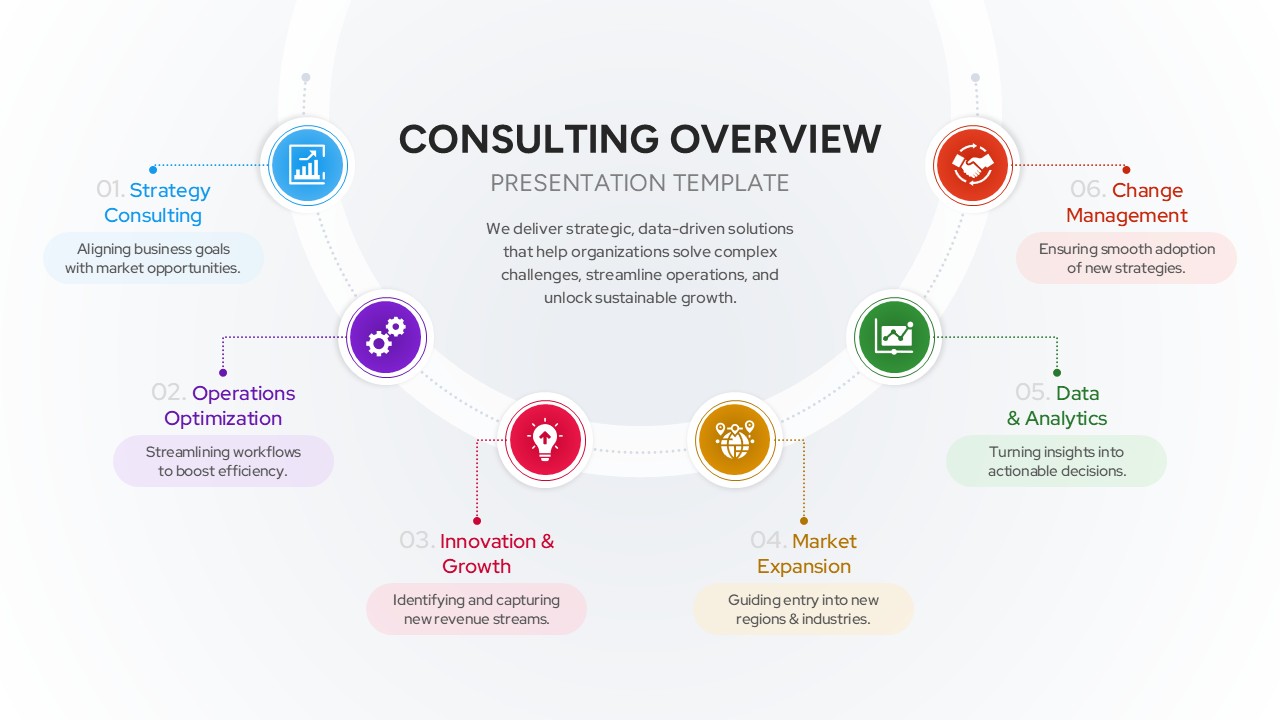
Consulting Overview & Capabilities Template for PowerPoint & Google Slides
Consulting
Civil Engineering Project Overview Deck Template for PowerPoint & Google Slides
Decks
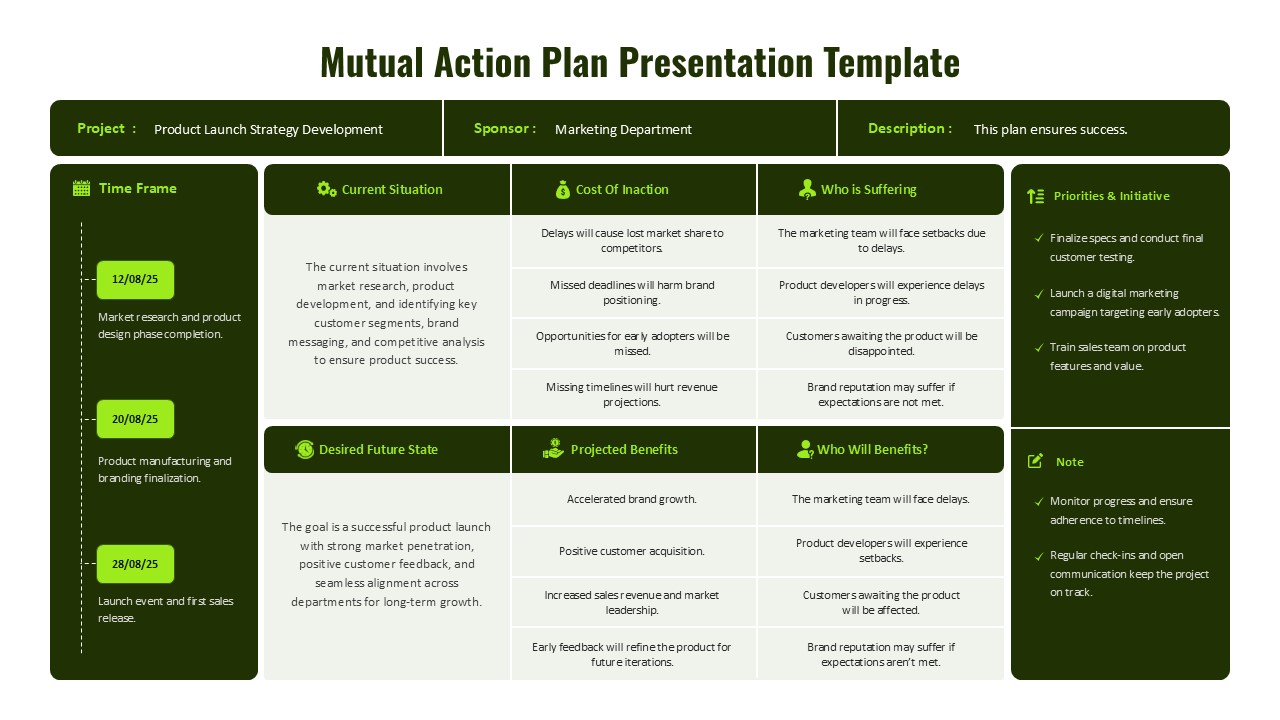
Mutual Action Plan Framework Overview Template for PowerPoint & Google Slides
Project