Modern Step Growth Infographics Template for PowerPoint & Google Slides

Description
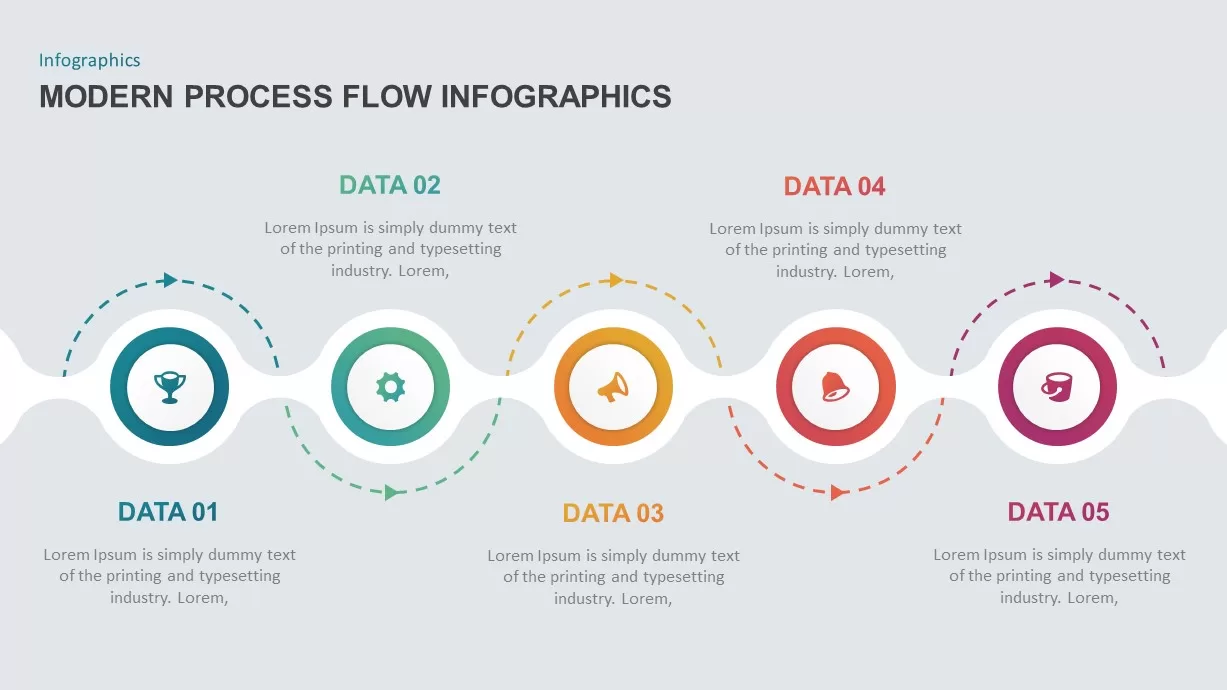
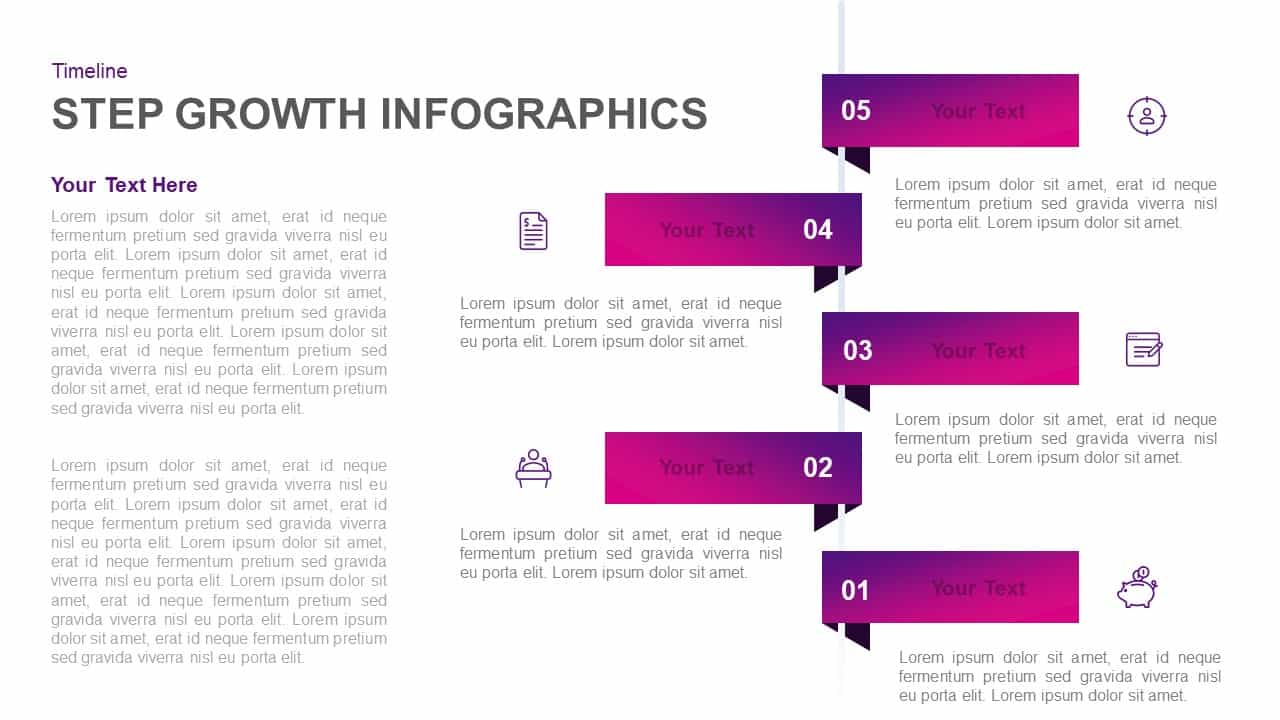
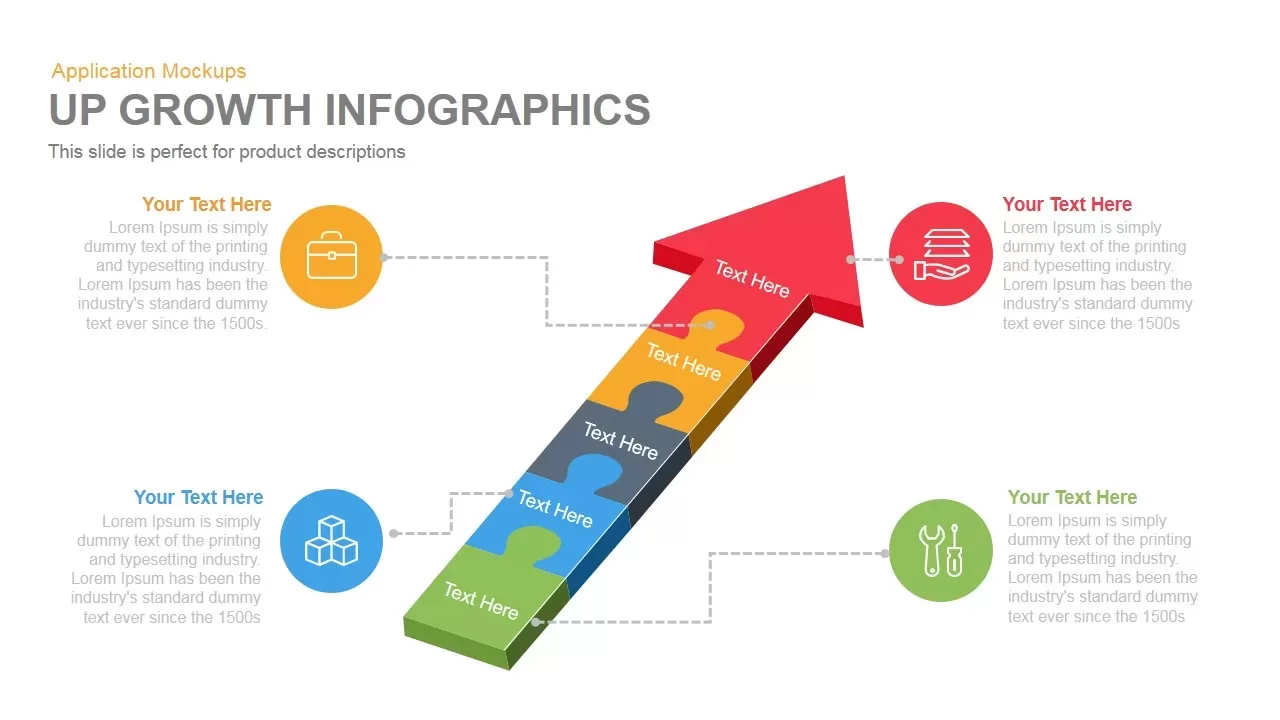
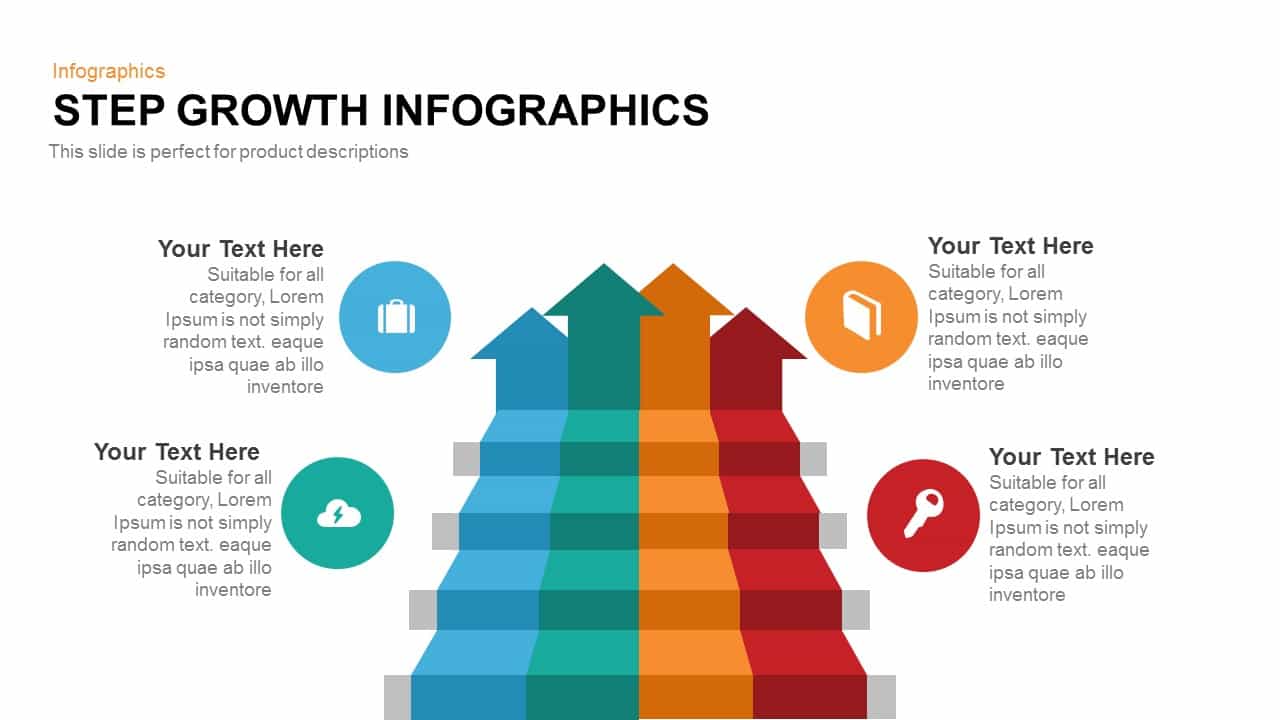
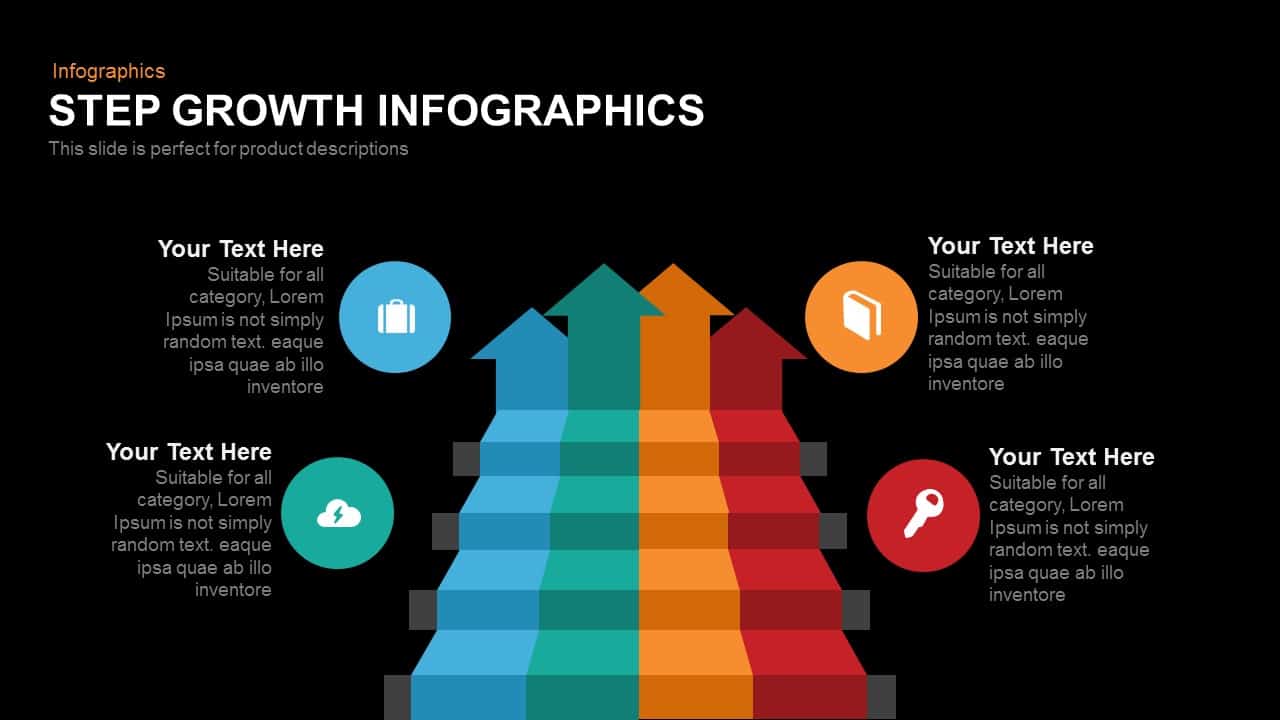
Empower your presentations with this modern step growth infographics slide, designed to visualize four sequential stages using bold, upward-pointing arrows. Each arrow is color-coded—blue, teal, orange, and red—to denote distinct phases such as ideation, development, launch, and optimization. Accompanying each stage is a circular icon placeholder, enabling you to reinforce key concepts like product features, service benefits, market insights, and performance metrics. The balanced layout positions two stages on each side of the centered arrow group, while subtle gray reference lines provide visual anchors for aligned content.
This fully editable slide leverages master layouts, customizable shapes, and intuitive text boxes to let you update colors, icons, and labels in seconds. Whether you’re detailing product roadmaps, outlining marketing strategies, or tracking growth milestones, this infographic adapts seamlessly to your brand guidelines. High-contrast typography ensures readability in diverse lighting conditions, and the clean, flat design maintains a professional aesthetic across devices.
Optimized for both PowerPoint and Google Slides, this asset preserves pixel-perfect quality and responsive alignment, eliminating formatting hassles and version-control issues. Simply drag and drop icons or replace placeholders to tailor the slide to stakeholder presentations, investor pitches, or team workshops. The symmetrical structure supports parallel comparisons of metrics or goals, fostering data-driven discussions and strategic alignment.
Use this versatile slide to communicate project phases, visualize step-by-step processes, or highlight quarterly objectives. With its modern flat style and intuitive design, it helps audiences grasp complex growth frameworks at a glance, driving clarity and engagement in executive briefings, board meetings, or training sessions.
Who is it for
Product managers, marketing strategists, and business analysts will benefit from this infographic when outlining growth stages, visualizing product roadmaps, or presenting performance metrics. Executives, startup founders, and consultants can leverage the clear arrow-based design to communicate strategic plans, stakeholder updates, or investor pitches.
Other Uses
Beyond growth frameworks, repurpose this slide for timeline overviews, process breakdowns, funnel stage comparisons, or team goal tracking. Apply the arrow layout to training modules, quarterly reviews, KPI dashboards, or sales performance reports, making complex information instantly accessible and engaging.
Login to download this file

Item ID
SB00238
Related Templates

Modern Five-Step Growth Diagram Template for PowerPoint & Google Slides
Process

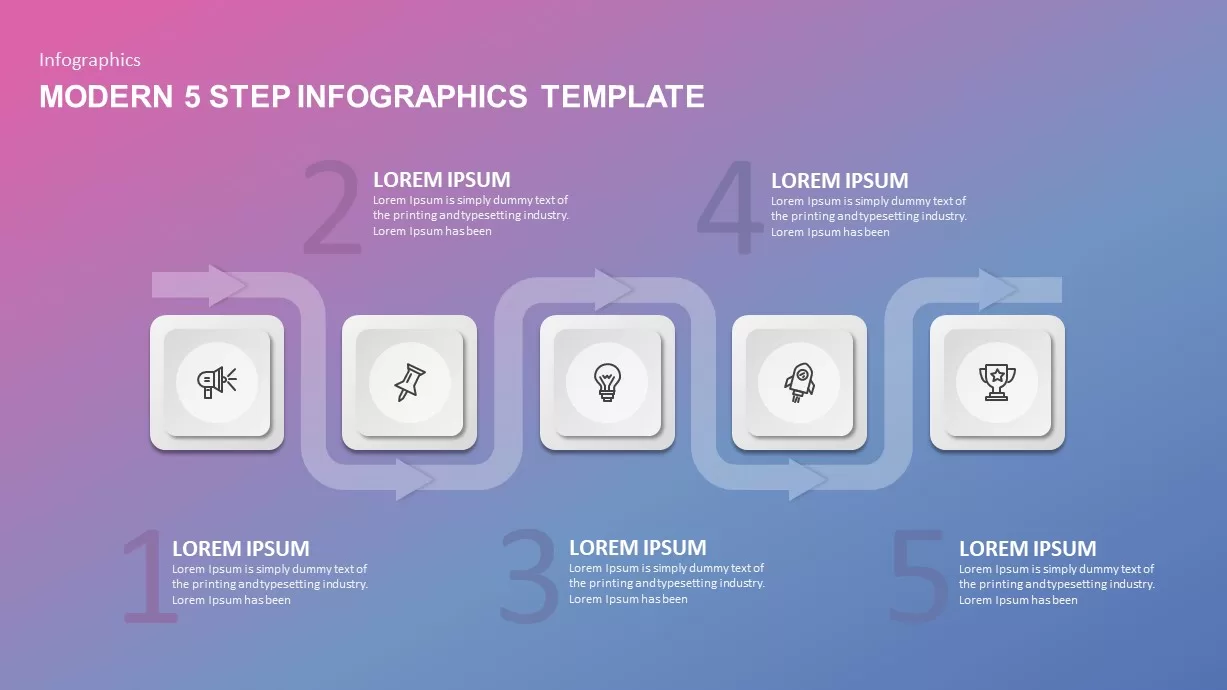
Modern 5-Step Flow Infographics Template for PowerPoint & Google Slides
Process

Modern Growth Hacking Venn Diagram Template for PowerPoint & Google Slides
Circular
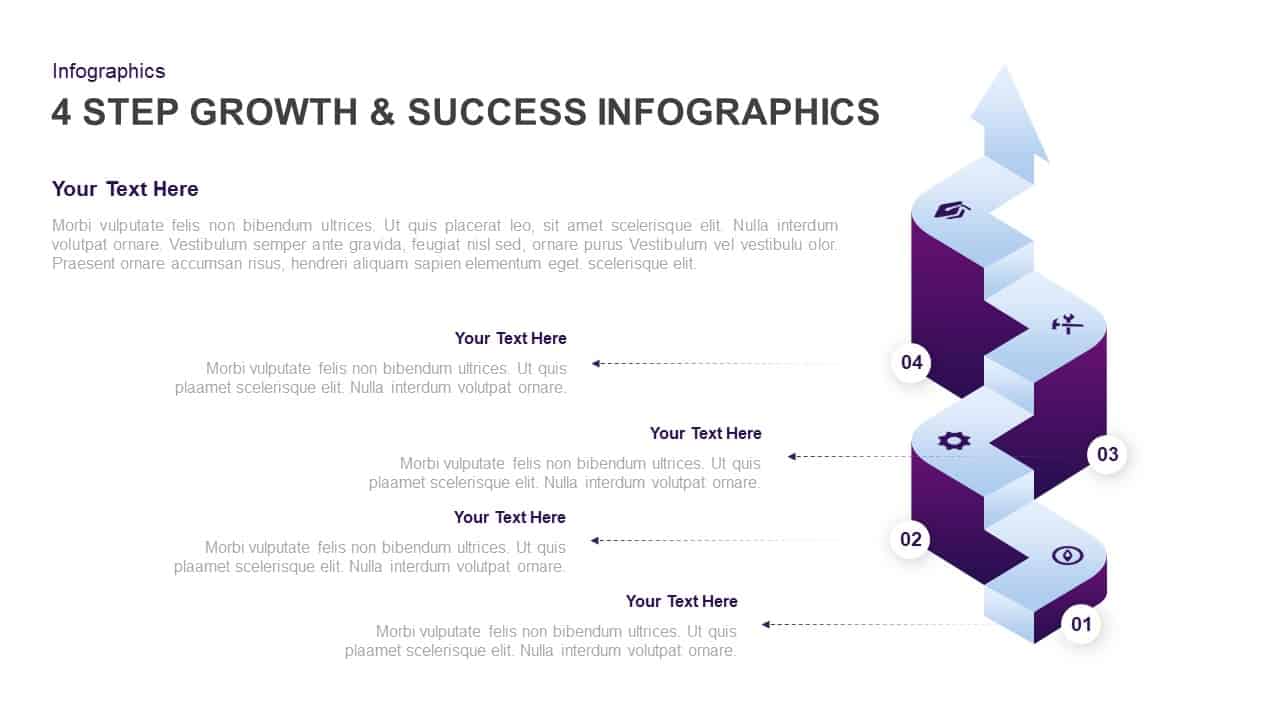
4-Step Growth & Success Infographics Template for PowerPoint & Google Slides
Accomplishment
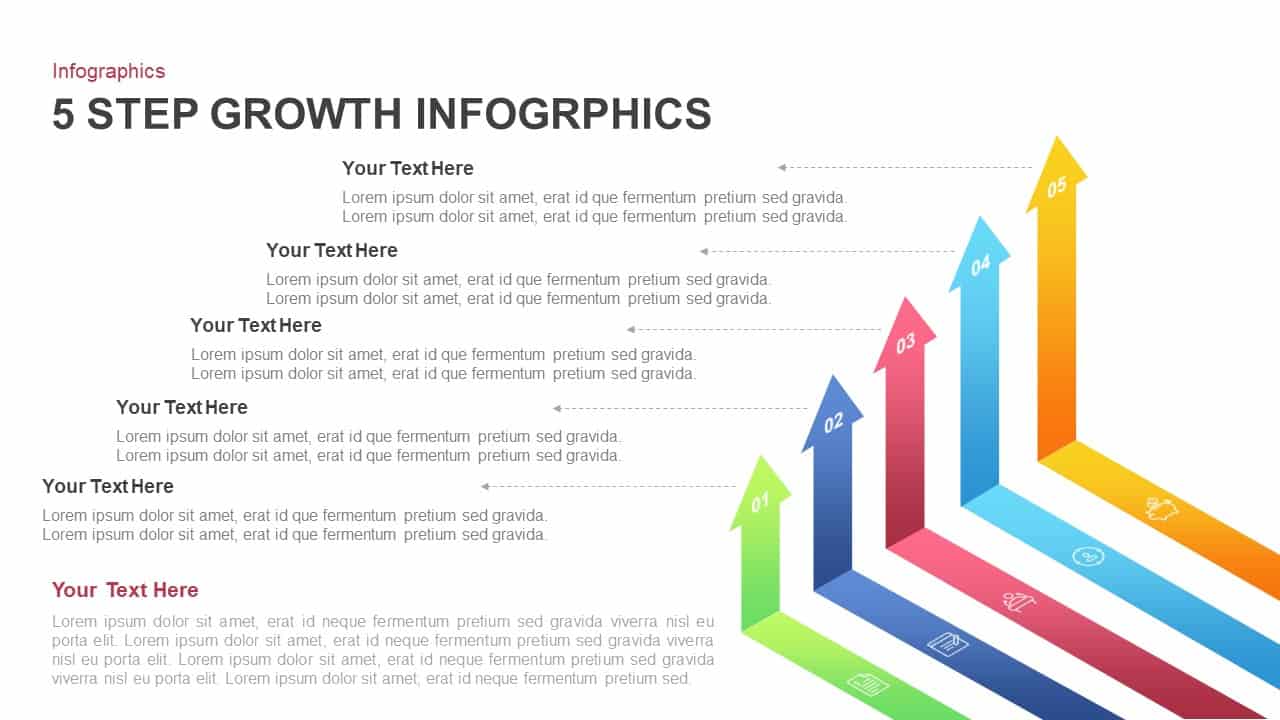
5-Step Growth Arrow Infographics Template for PowerPoint & Google Slides
Arrow

Growth Arrow for Progress & Growth template for PowerPoint & Google Slides
Arrow
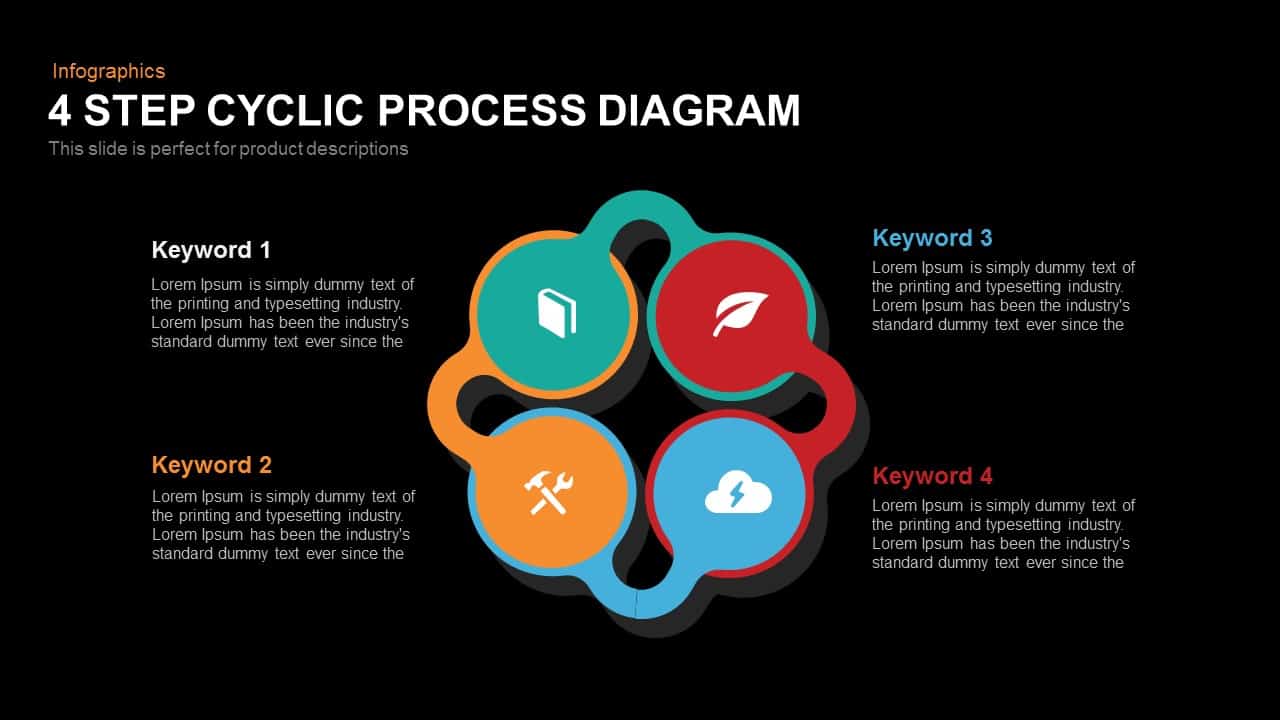
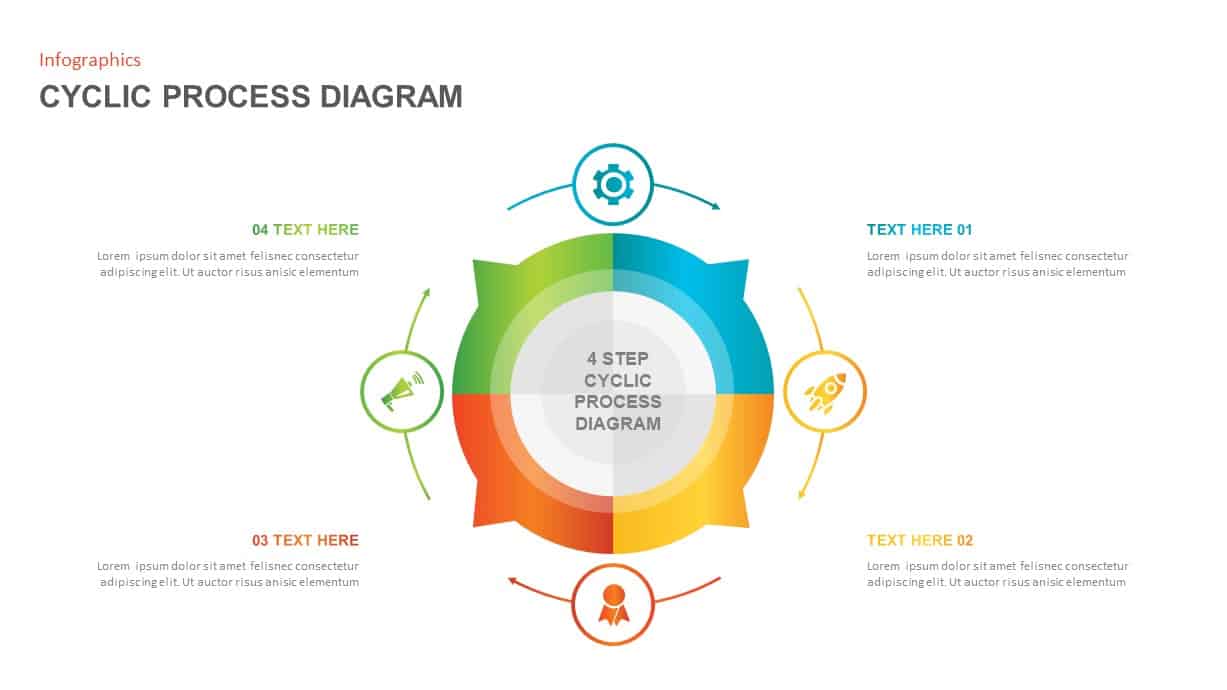
Modern 4-Step Cyclic Process Diagram Template for PowerPoint & Google Slides
Circular

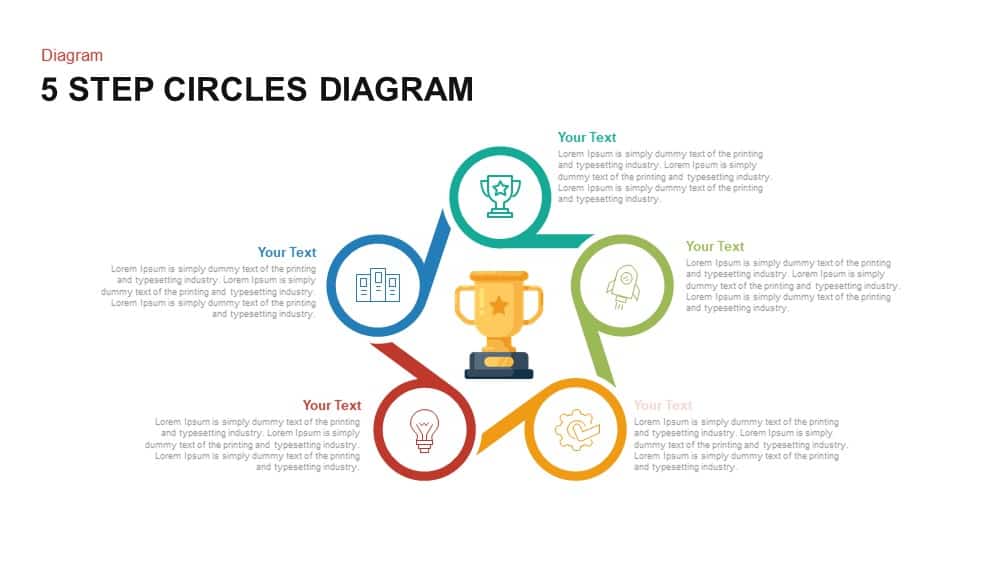
Modern Five-Step Circles Process Diagram Template for PowerPoint & Google Slides
Circular
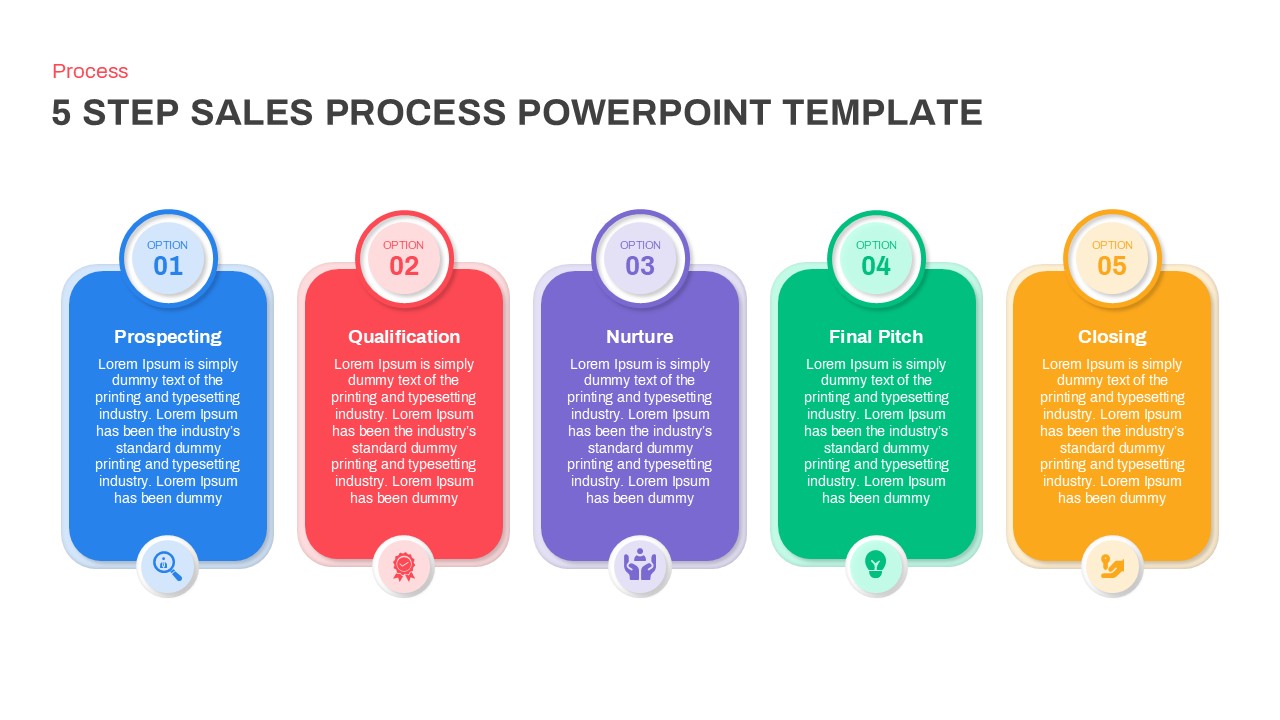
Modern 5-Step Sales Process Diagram Template for PowerPoint & Google Slides
Process
Modern 6-Step Cycle Diagram Slide Deck Template for PowerPoint & Google Slides
Process
Modern 5-Step Process Flow Infographic Template for PowerPoint & Google Slides
Process
Modern 6 Step Infographic Diagram template for PowerPoint & Google Slides
Process
Modern & Dynamic 6-Step Agenda Sequence Template for PowerPoint & Google Slides
Agenda
Modern Four-Step Agenda Slide Layout Template for PowerPoint & Google Slides
Agenda
Modern Ribbon Six-Step Agenda Slide Template for PowerPoint & Google Slides
Agenda
Free Modern Four-Step Agenda Infographic Template for PowerPoint & Google Slides
Agenda
Free
Modern Four-Step Table of Contents Template for PowerPoint & Google Slides
Agenda
Modern Seven-Step 3D Prism Diagram Template for PowerPoint & Google Slides
Process
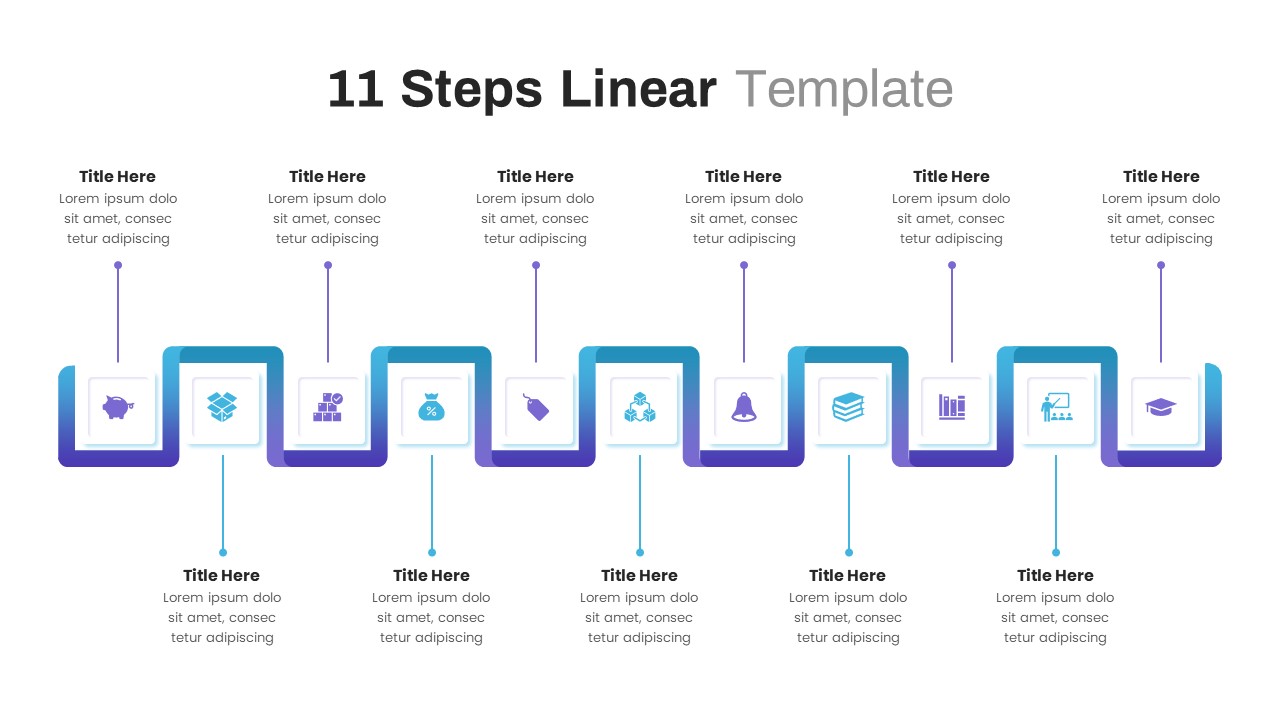
Modern 11-Step Linear Timeline Template for PowerPoint & Google Slides
Timeline
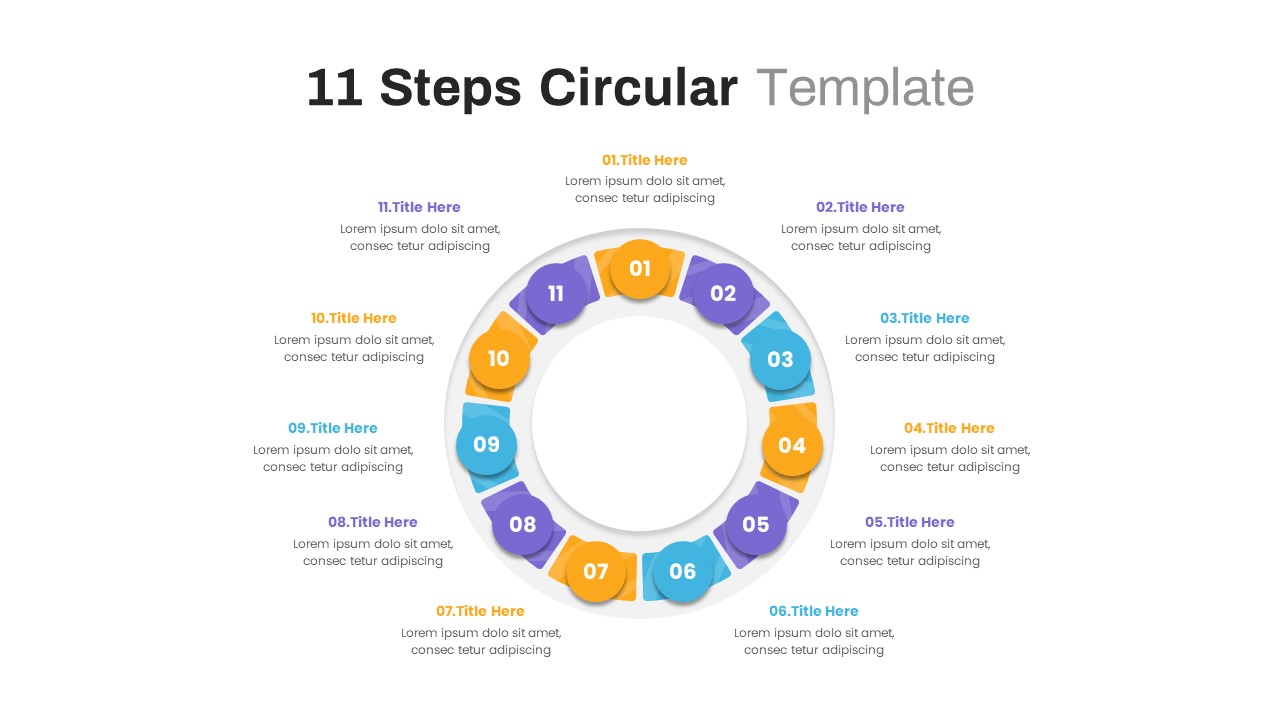
Modern 11-Step Circular Timeline Template for PowerPoint & Google Slides
Timeline
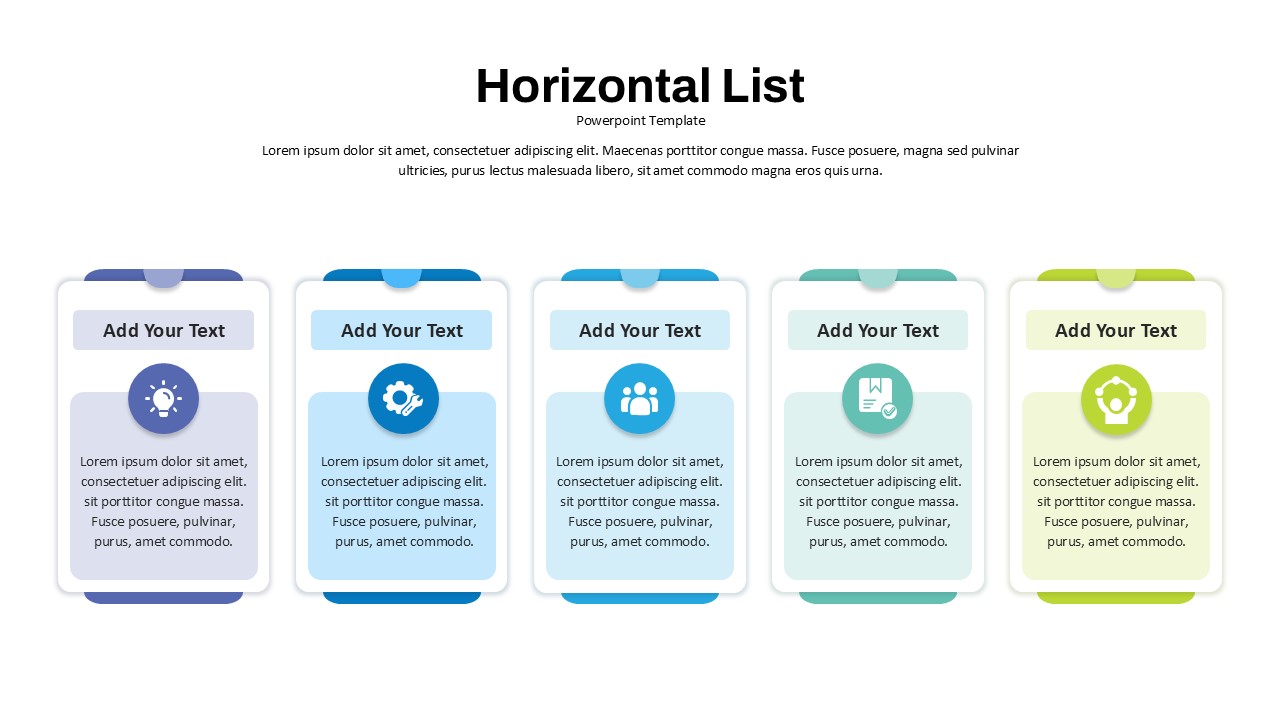
Modern Four-Step Horizontal List Template for PowerPoint & Google Slides
Process
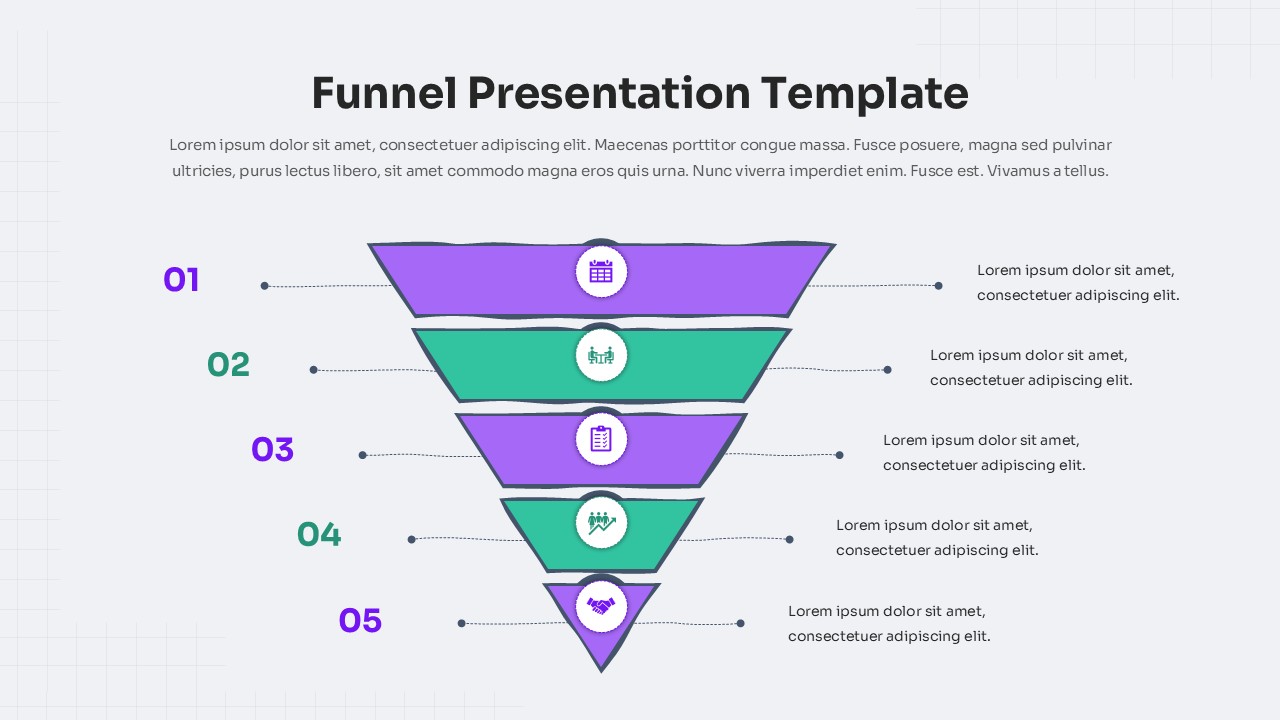
Five-Step Modern Funnel Diagram Template for PowerPoint & Google Slides
Funnel
Ribbon Infographics Step-by-Step Process Template for PowerPoint & Google Slides
Process
Modern 9-Section Circle Infographics Template for PowerPoint & Google Slides
Circular
Modern Circular Infographics Template for PowerPoint & Google Slides
Circular
Modern Social Media Infographics Template for PowerPoint & Google Slides
Digital Marketing
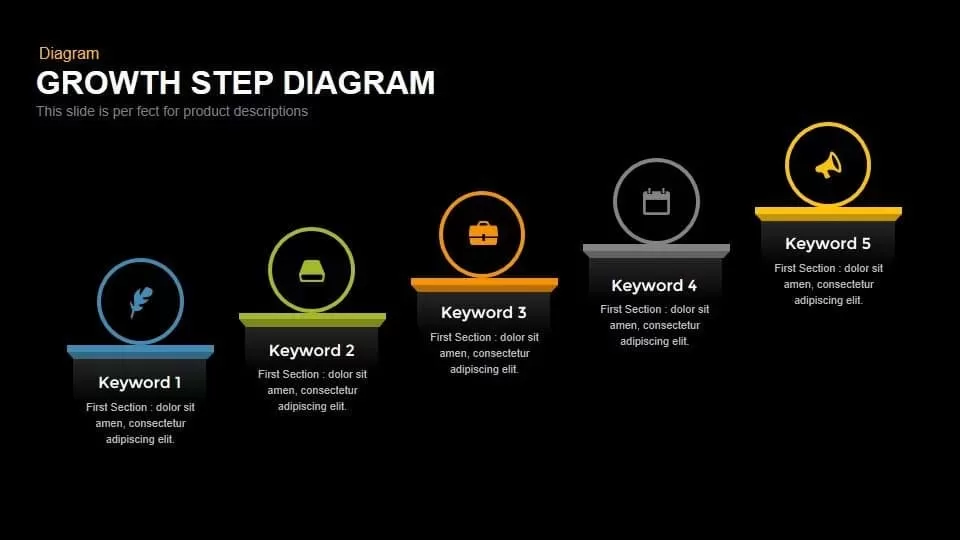
Growth Step Diagram template for PowerPoint & Google Slides
Infographics
5-Step Growth Staircase Infographic Template for PowerPoint & Google Slides
Process
Five-Step Growth Stage Staircase Diagram Template for PowerPoint & Google Slides
Process
4 Step Revenue Growth Flow Diagram Template for PowerPoint & Google Slides
Process
Dynamic Growth Arrow Step Infographic Template for PowerPoint & Google Slides
Process
Five-Step Growth Infographic Slide Template for PowerPoint & Google Slides
Process
Five-Step Growth Timeline Infographic Template for PowerPoint & Google Slides
Timeline
Growth Infographics template for PowerPoint & Google Slides
Arrow
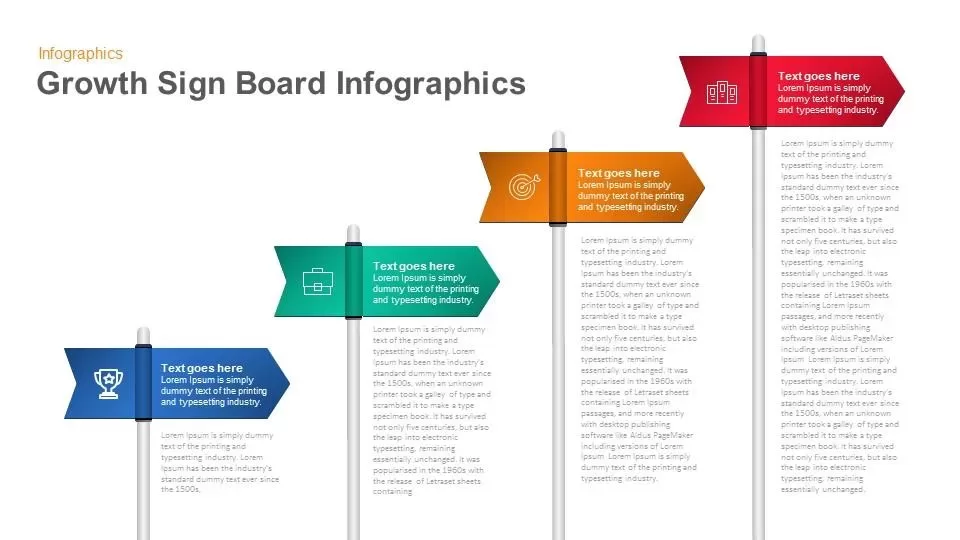
Growth Sign Board Infographics template for PowerPoint & Google Slides
Timeline
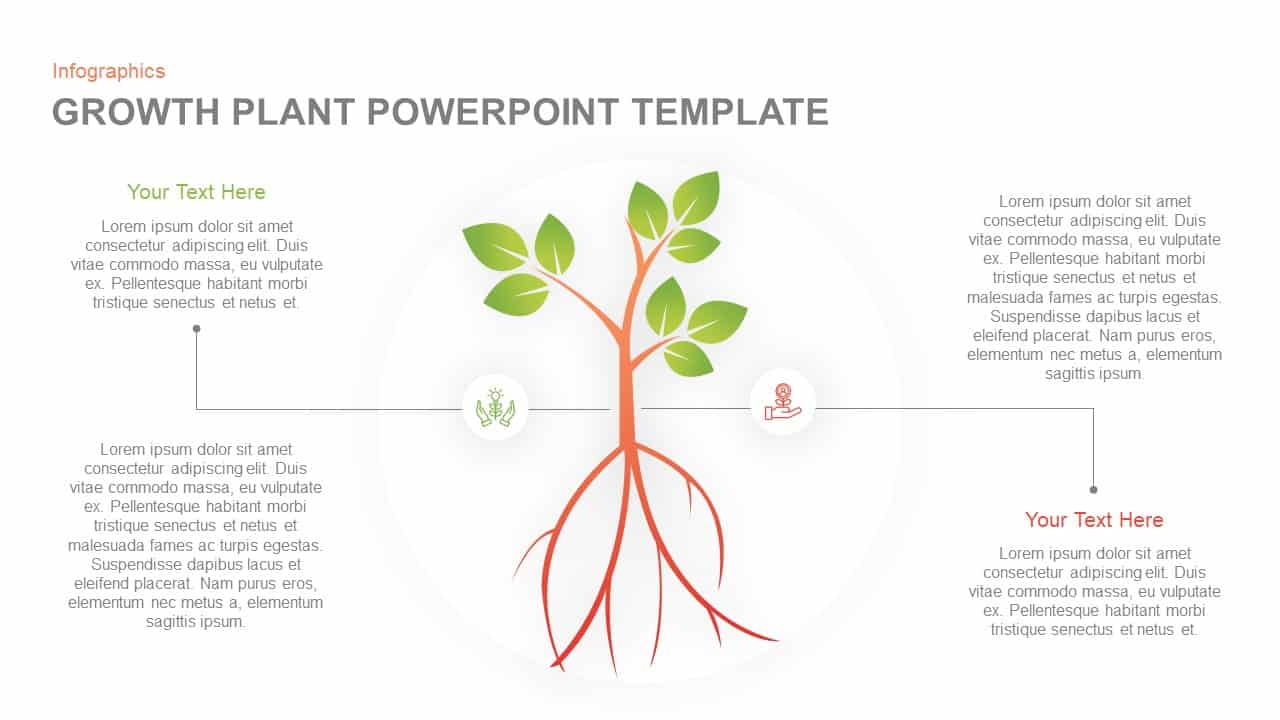
Growth Plant Infographics template for PowerPoint & Google Slides
Process
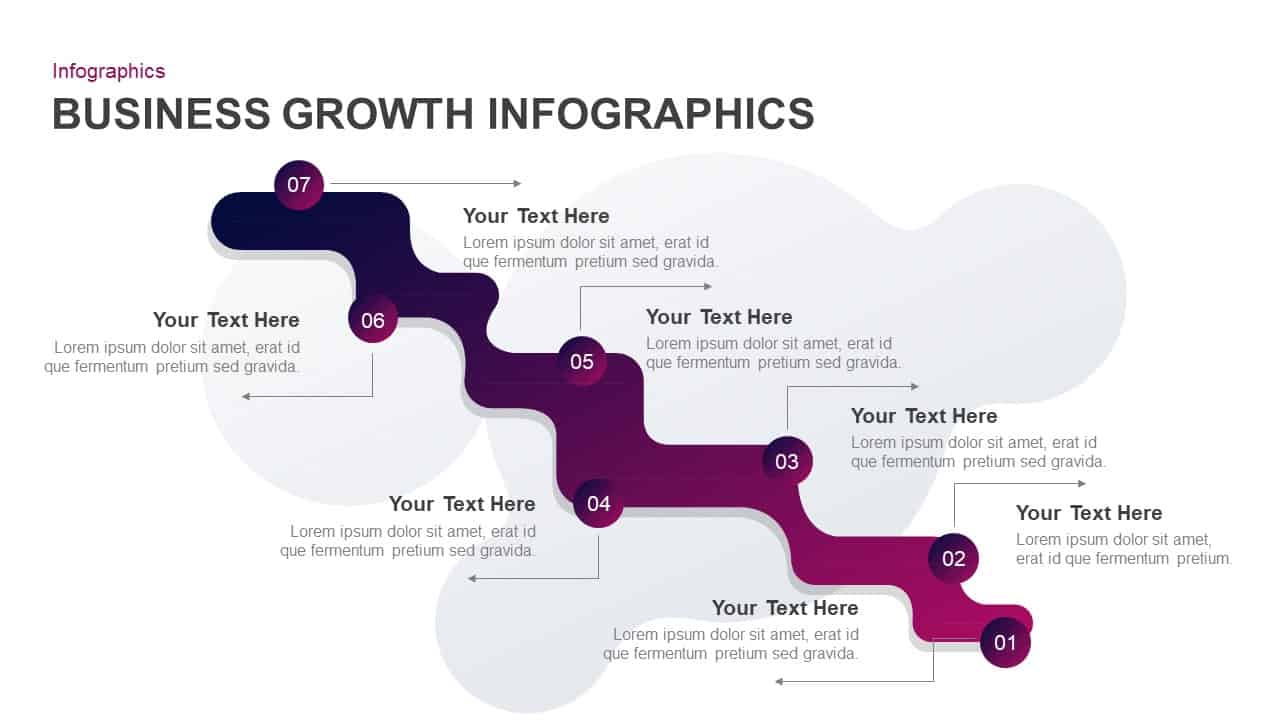
Business Growth Infographics Template for PowerPoint & Google Slides
Roadmap
Business Growth Plant Infographics Pack Template for PowerPoint & Google Slides
Process
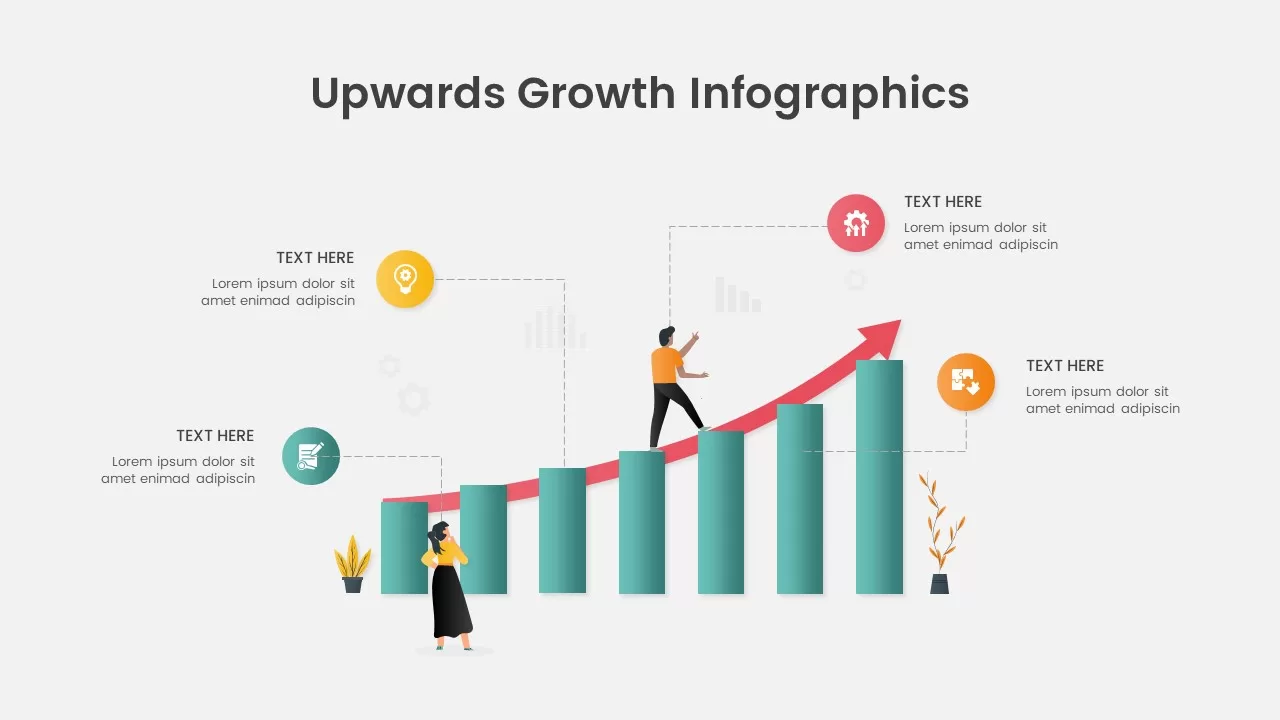
Upwards Growth Infographics for PowerPoint & Google Slides
Infographics

Free Modern Gradient Wave Welcome Slides Template for PowerPoint & Google Slides
Free
Free
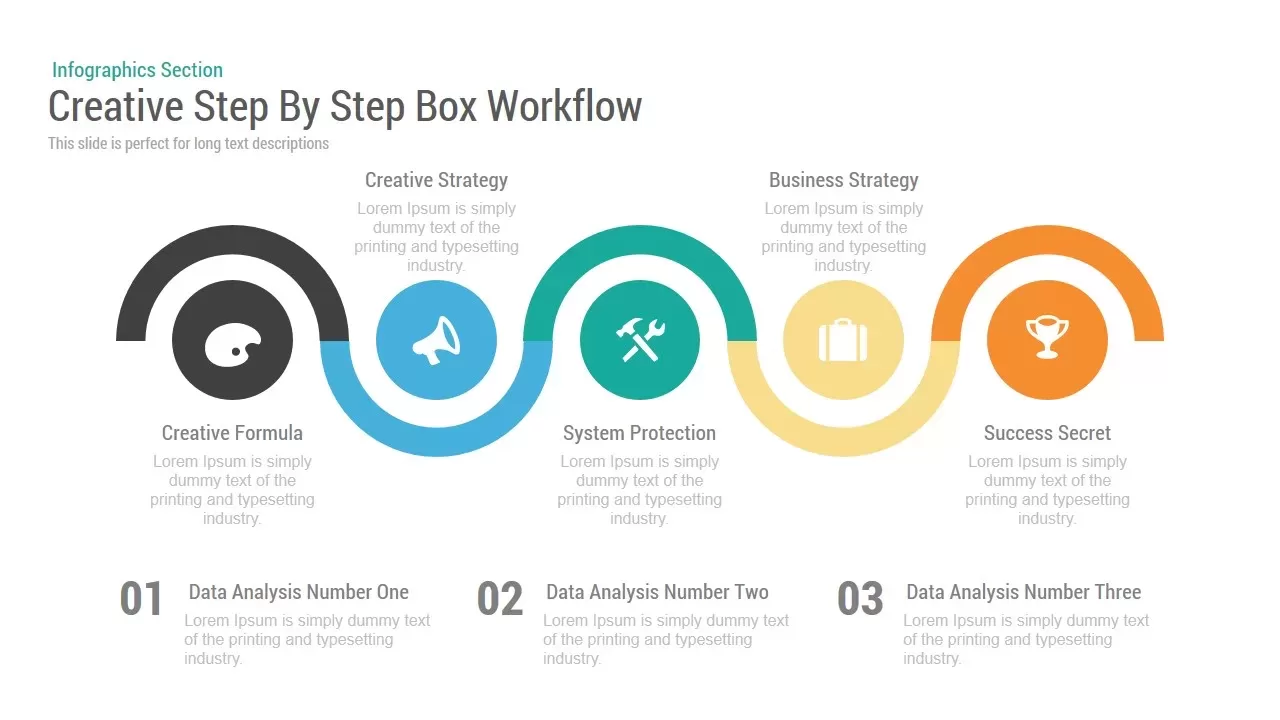
Creative Step By Step Workflow template for PowerPoint & Google Slides
Process
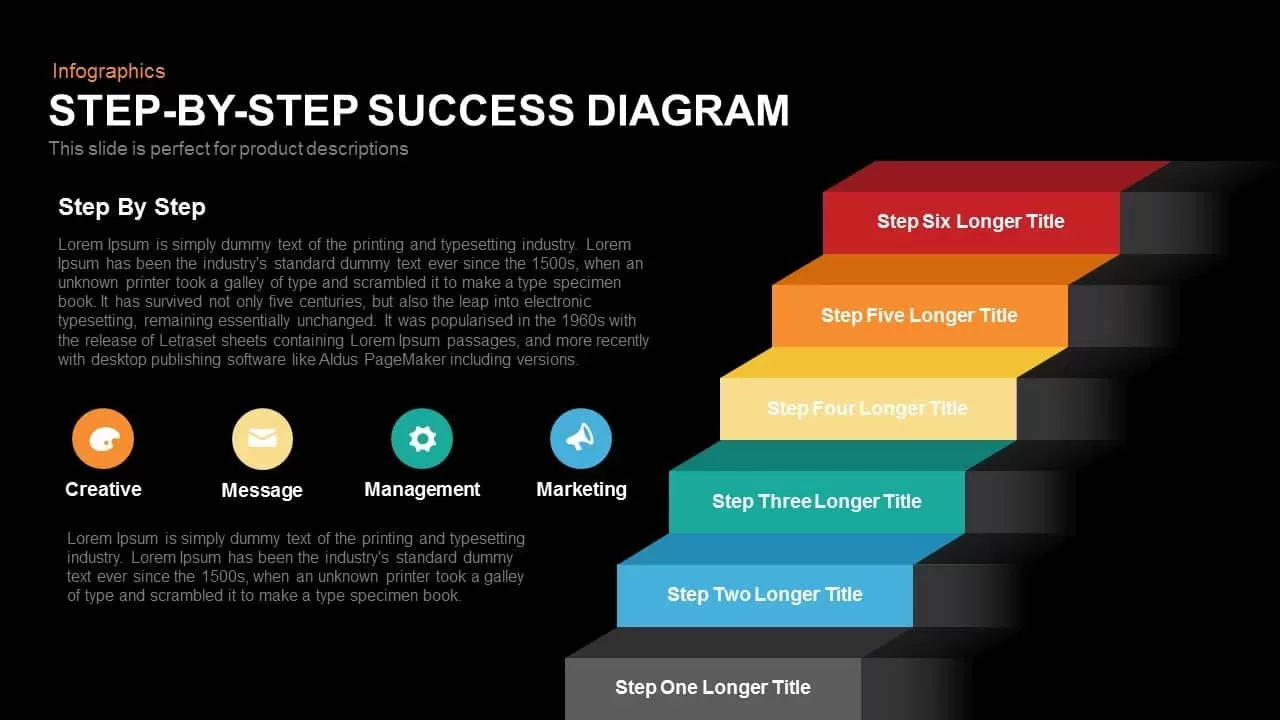
Step-by-Step Success Staircase Diagram template for PowerPoint & Google Slides
Process
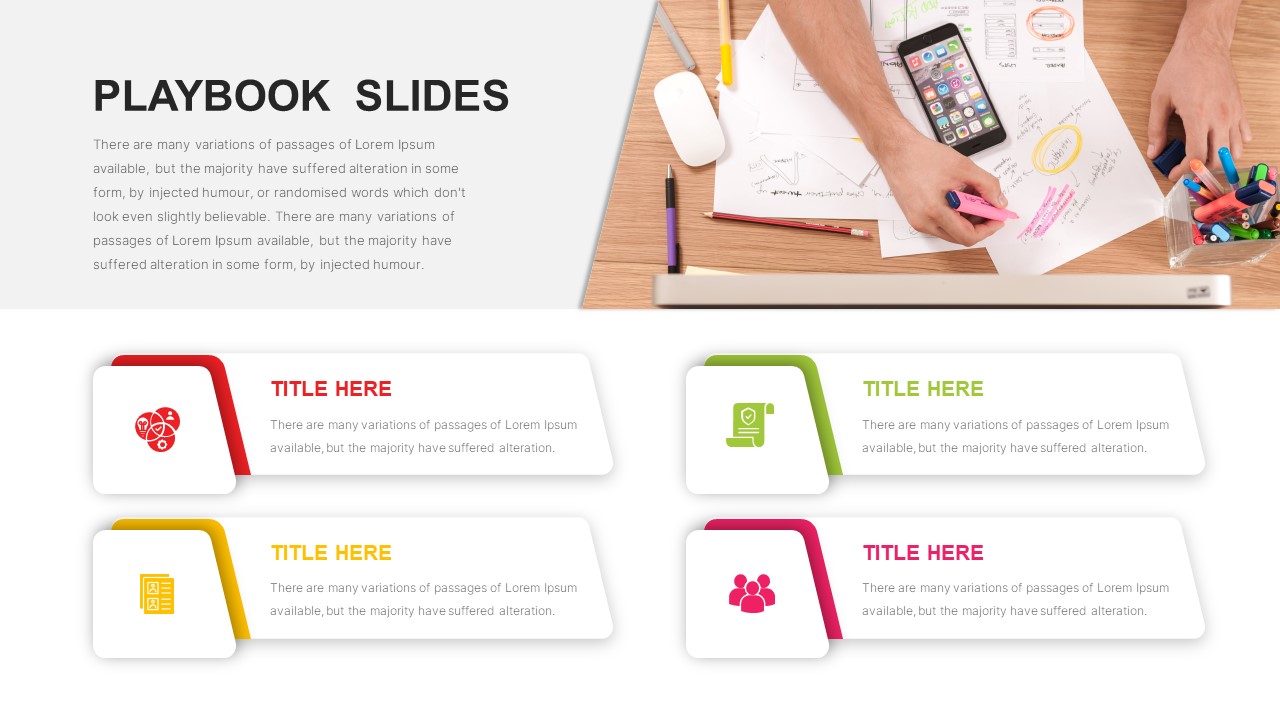
Sales Playbook Step-by-Step Process Template for PowerPoint & Google Slides
Process
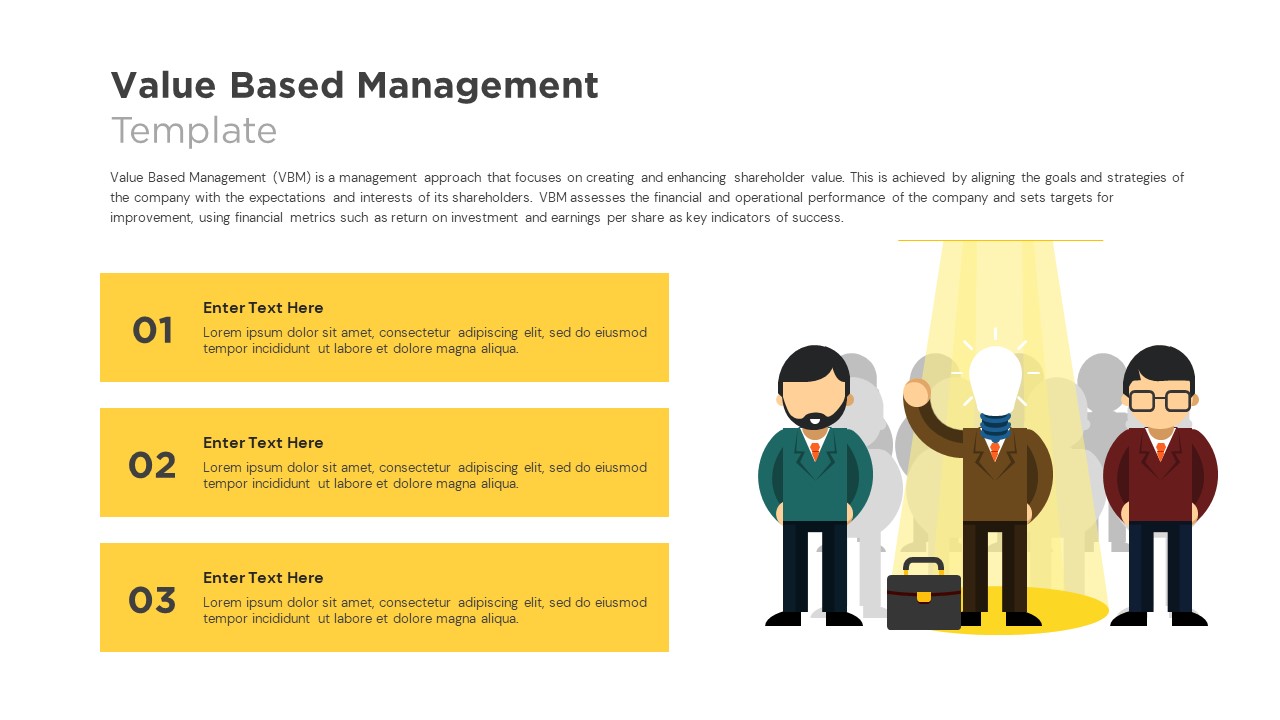
Value Based Management Step-by-Step Template for PowerPoint & Google Slides
Business Strategy
Top 10 Step-by-Step Image & Text Layouts Template for PowerPoint & Google Slides
Graphics
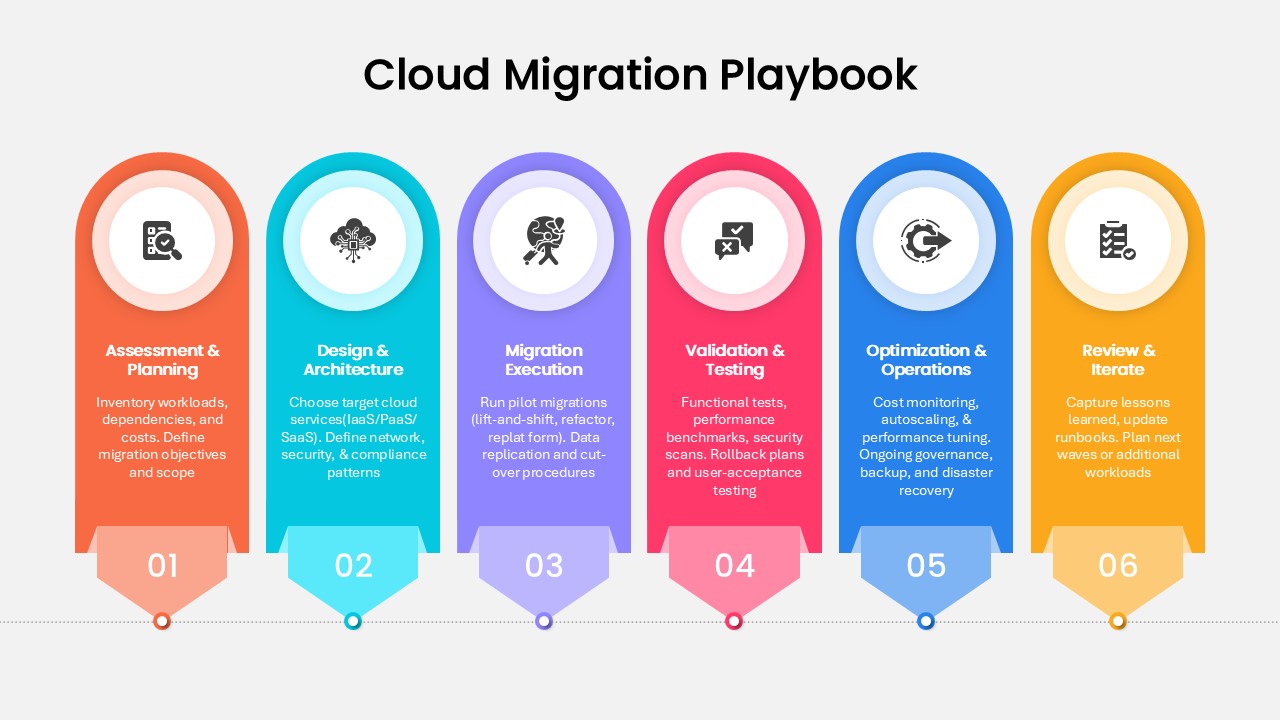
Step-by-Step Cloud Migration Playbook Template for PowerPoint & Google Slides
Cloud Computing

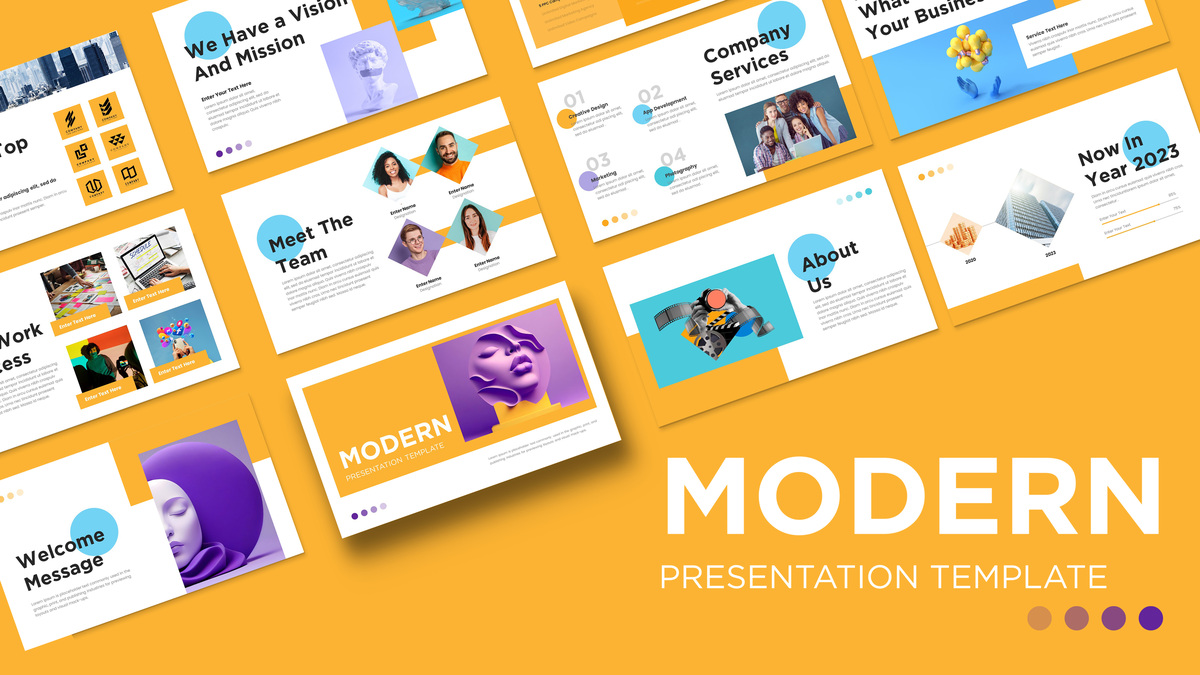
Modern Business Agency PowerPoint Template for PowerPoint & Google Slides
Company Profile
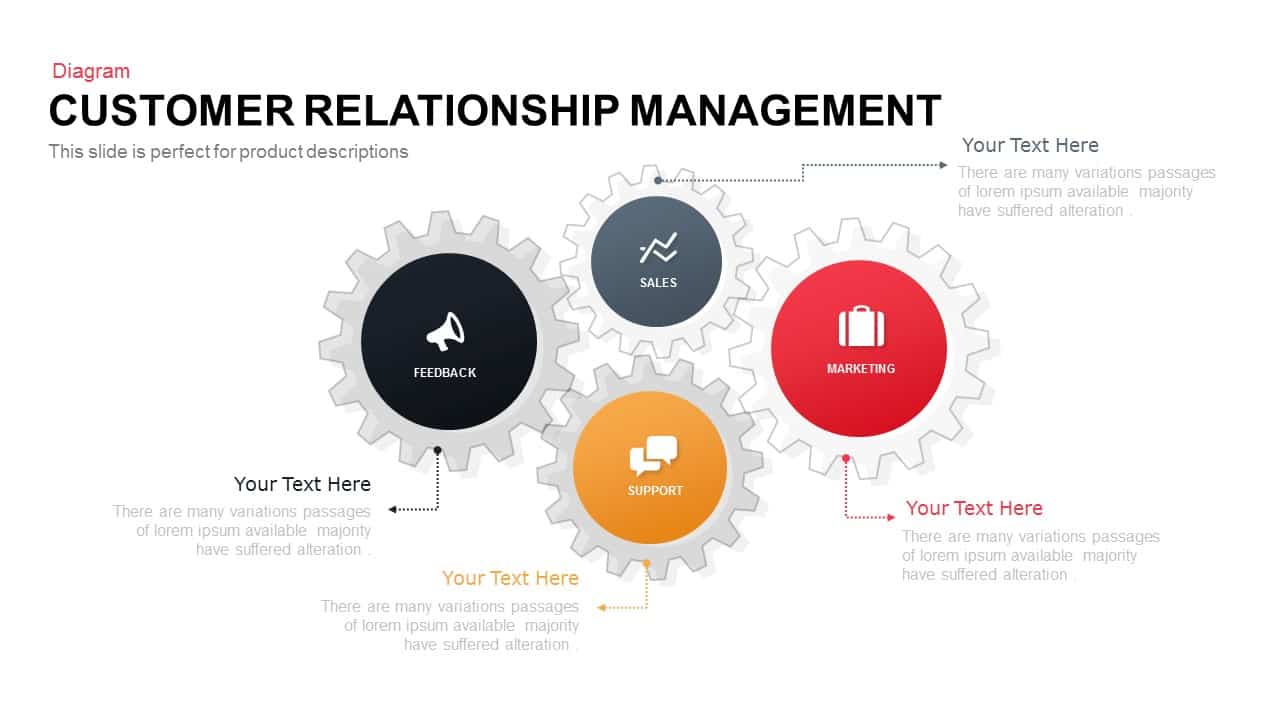
Colorful Modern CRM Gear Diagram Template for PowerPoint & Google Slides
Customer Experience
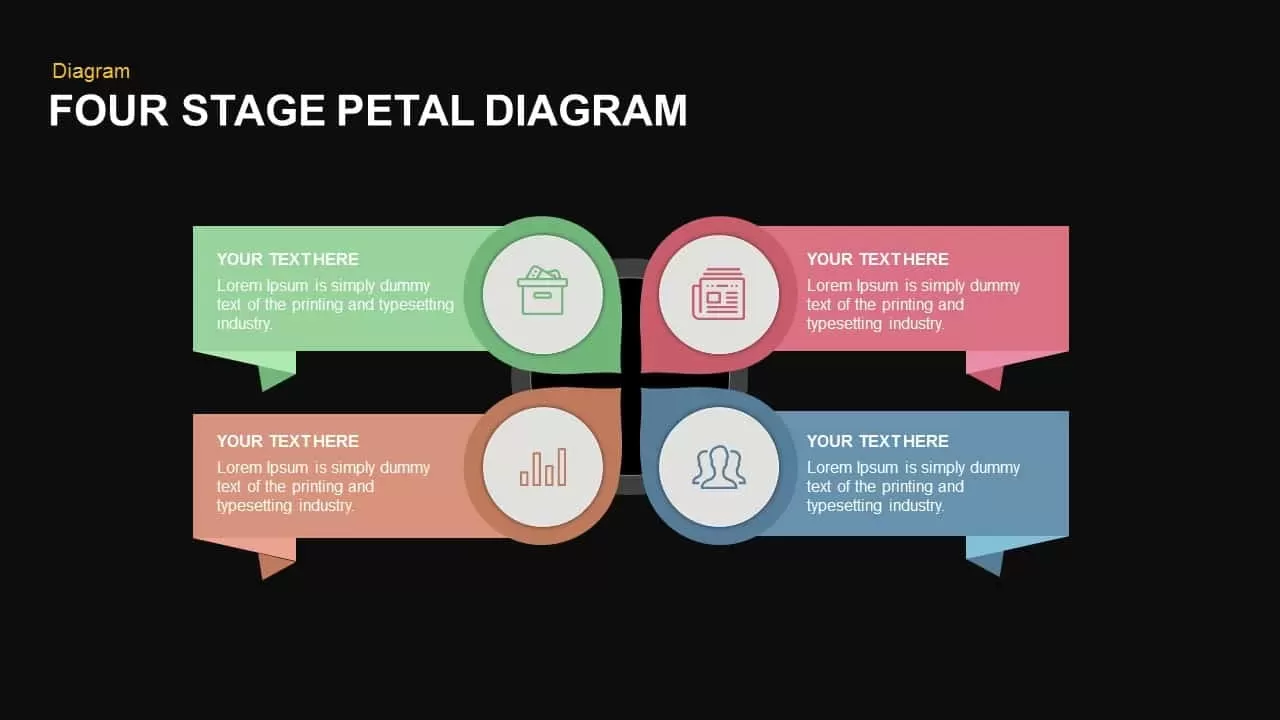
Modern Four-Stage Petal Diagram Template for PowerPoint & Google Slides
Circular
Modern Orange Business Plan Design Theme Template for PowerPoint & Google Slides
Company Profile
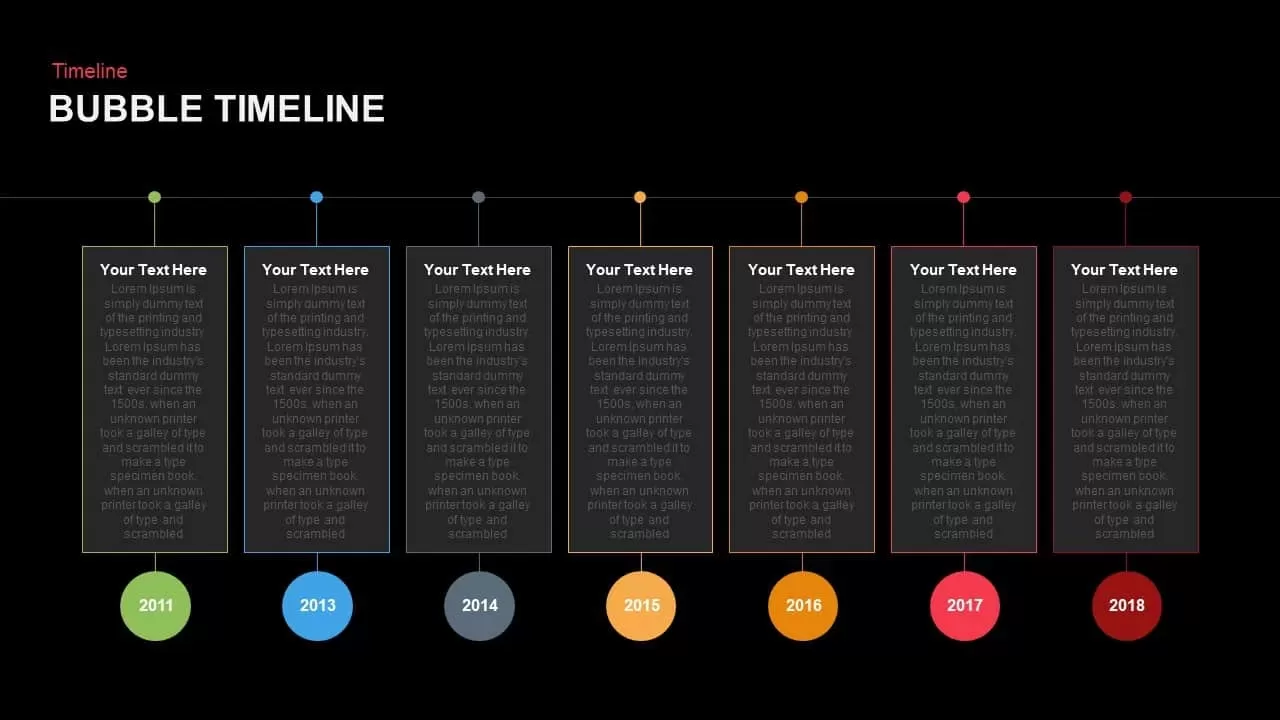
Modern Bubble Timeline Infographic Template for PowerPoint & Google Slides
Timeline
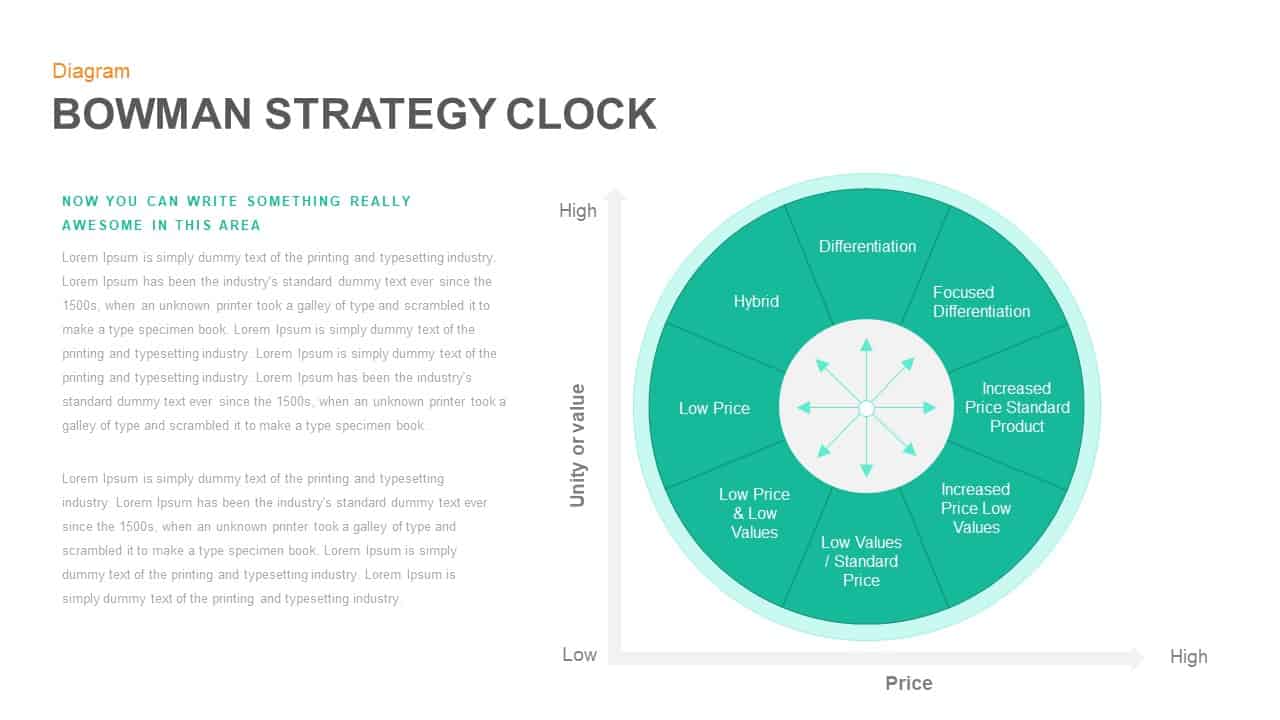
Modern Bowman Strategy Clock Diagram Slide Template for PowerPoint & Google Slides
Competitor Analysis
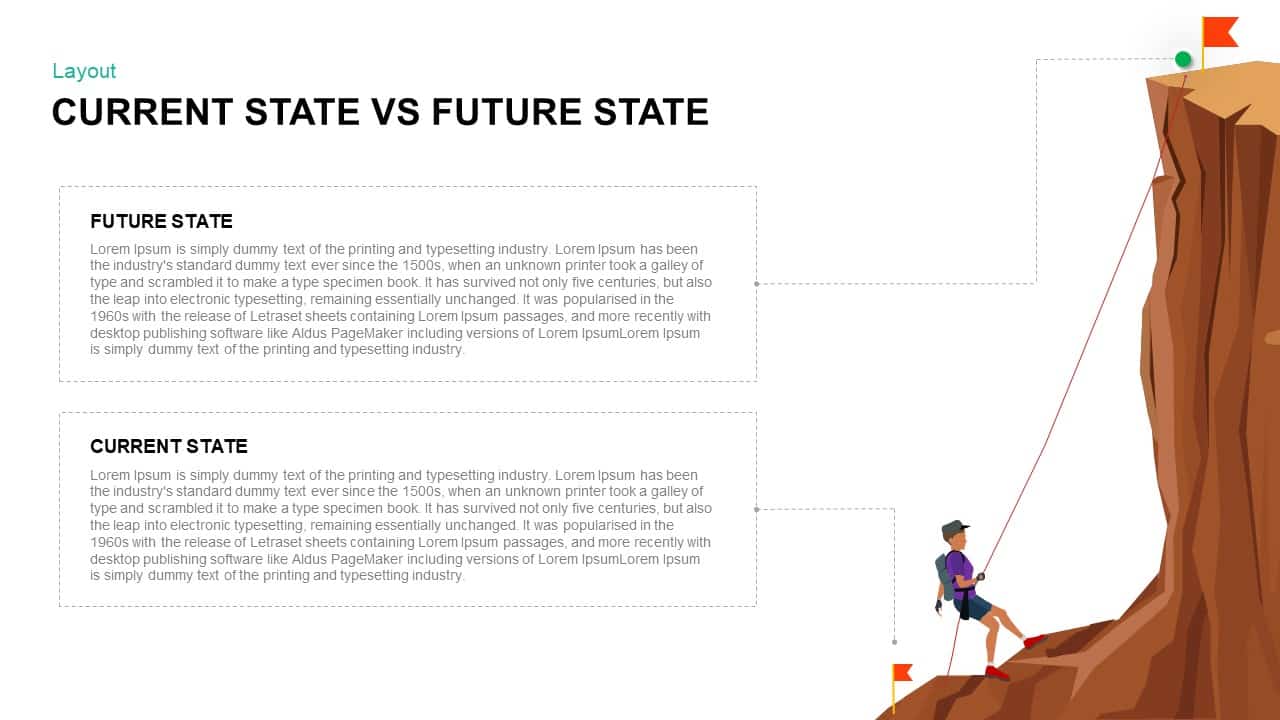
Modern Current vs Future State Template for PowerPoint & Google Slides
Comparison

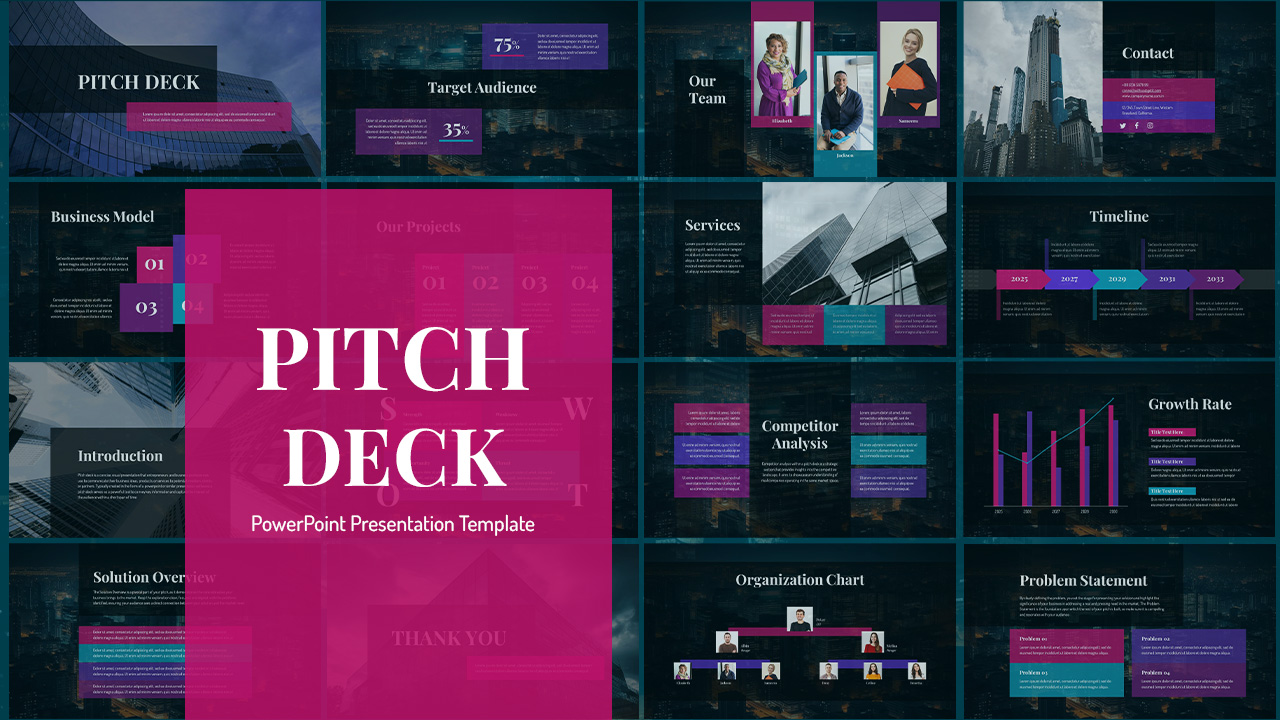
Free Modern Pitch Deck Presentation Template for PowerPoint & Google Slides
Pitch Deck
Free
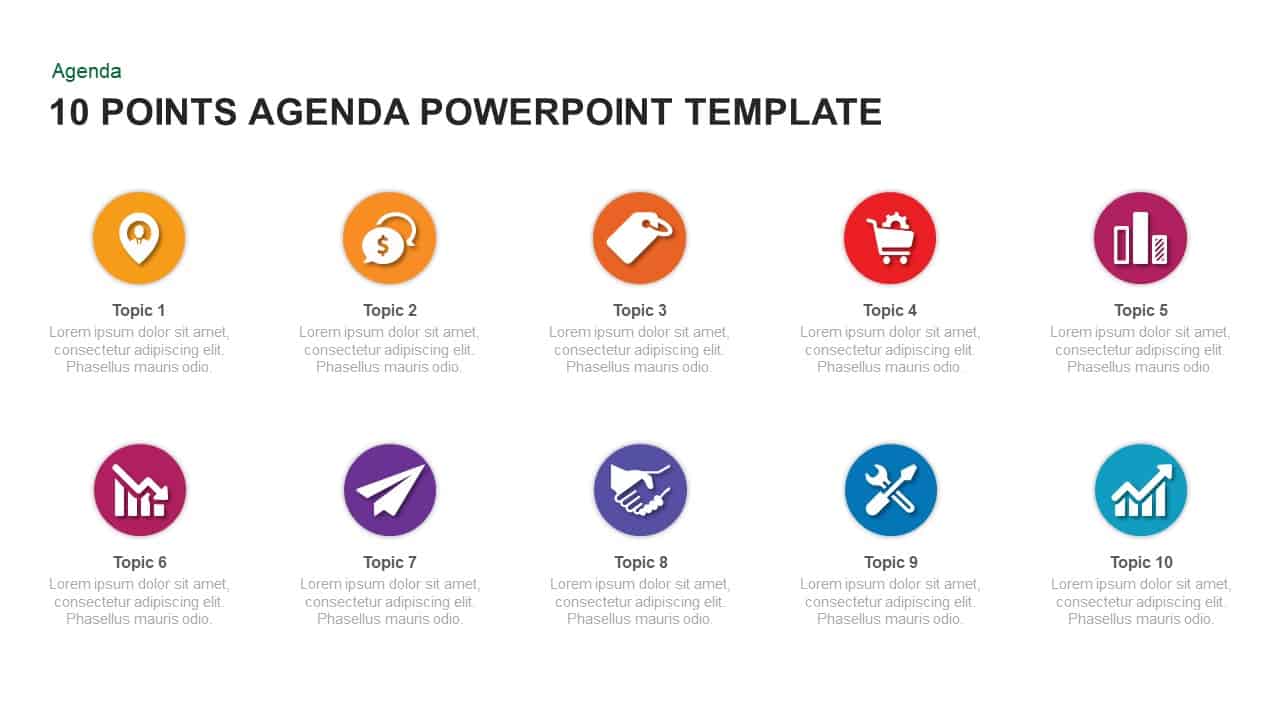
Modern 10-Point Agenda Infographic Template for PowerPoint & Google Slides
Agenda
Modern Digital Marketing Strategy Template for PowerPoint & Google Slides
Pitch Deck
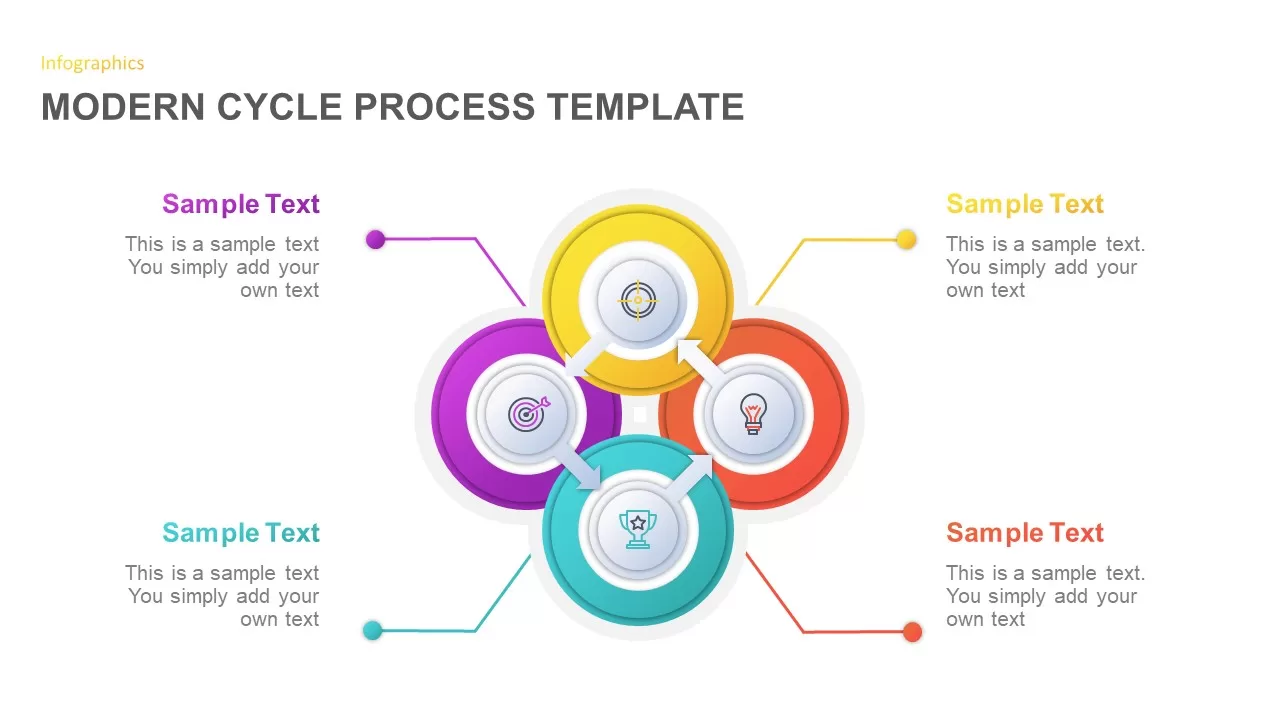
Modern Cycle Process Template for PowerPoint & Google Slides
Business Proposal
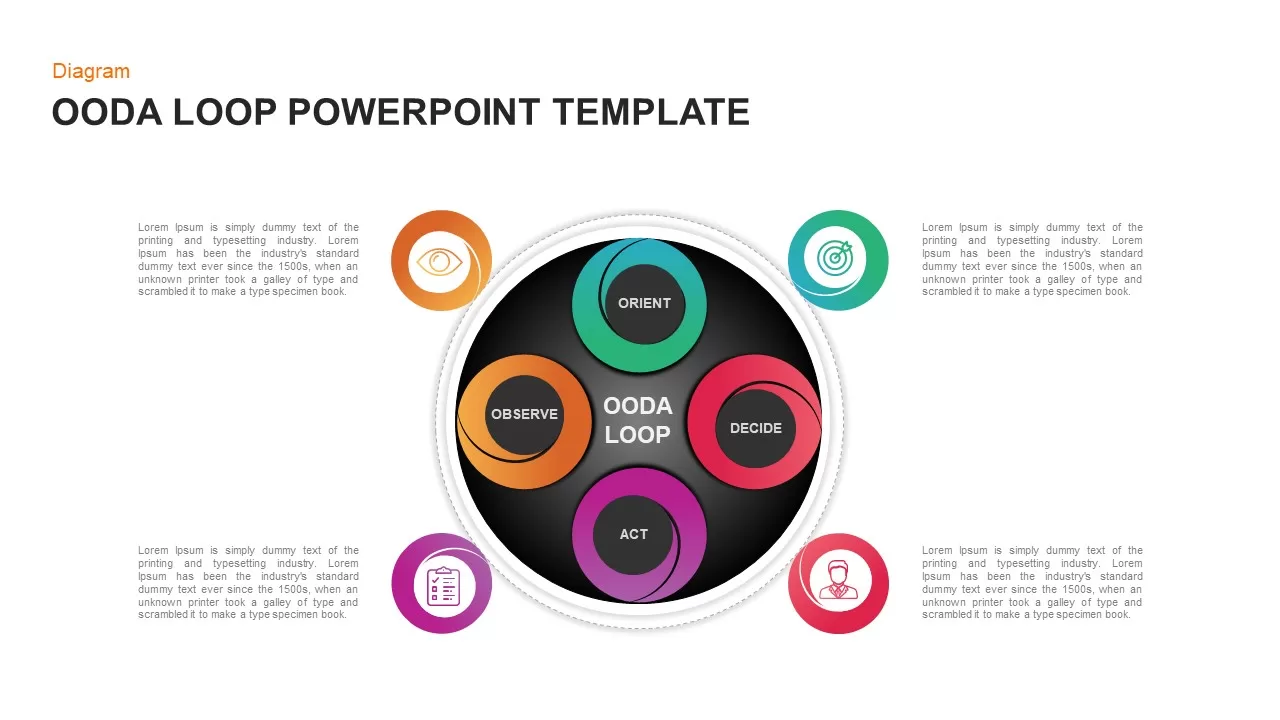
Modern Circular OODA Loop Infographic Template for PowerPoint & Google Slides
Circular
Modern Video Game Pitch Deck Template for PowerPoint & Google Slides
Pitch Deck
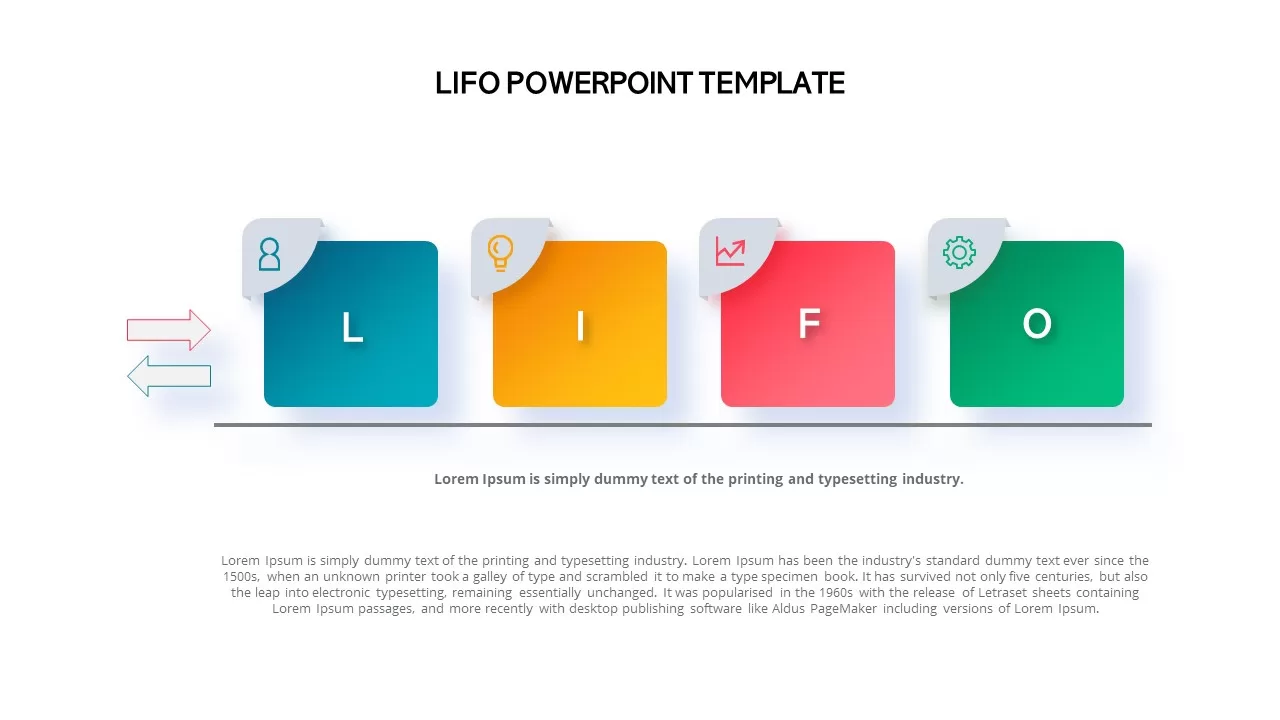
Modern LIFO Template for PowerPoint & Google Slides
Accounting
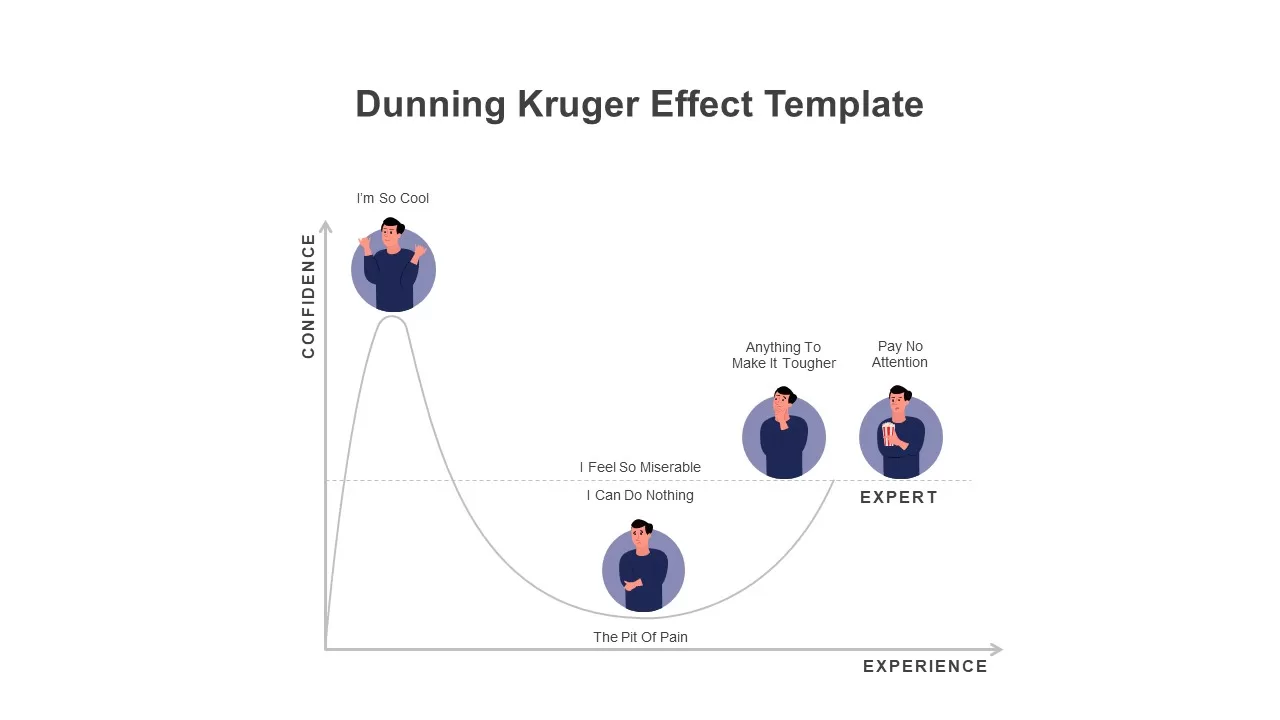
Modern Dunning Kruger Effect Diagram Template for PowerPoint & Google Slides
Business
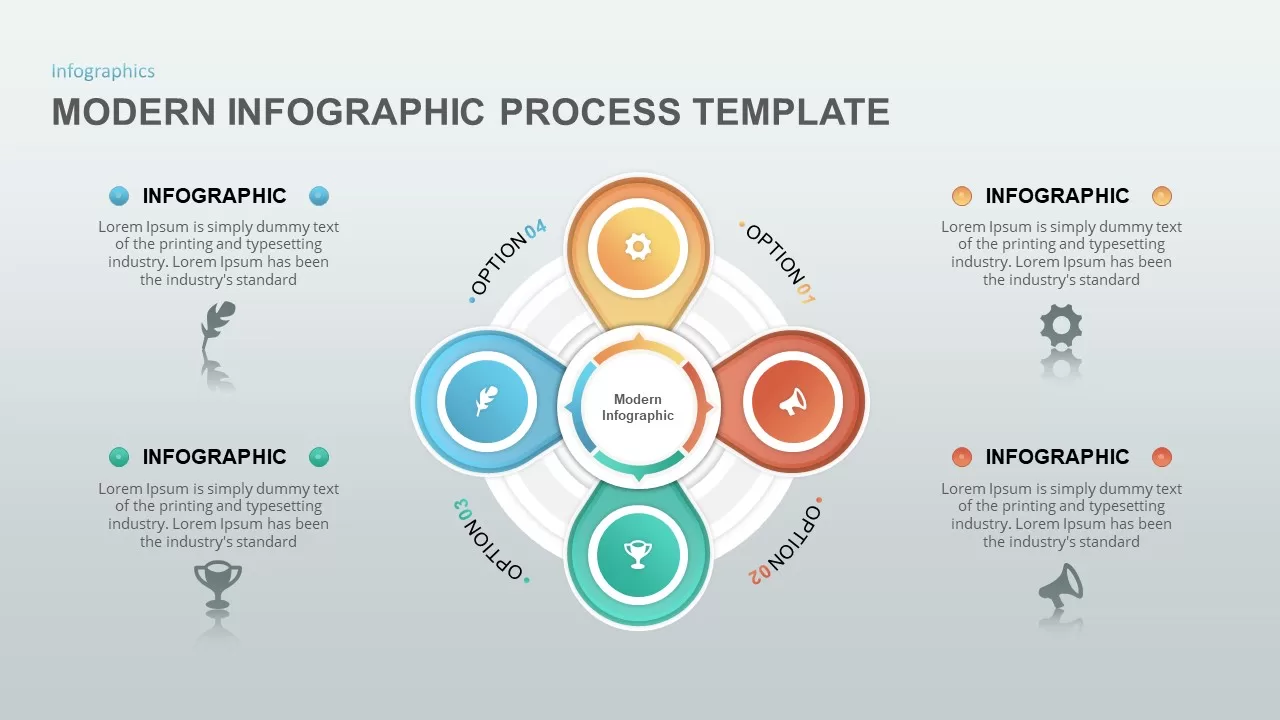
Modern Infographic Process template for PowerPoint & Google Slides
Infographics
Modern Photo-Based Organizational Chart Template for PowerPoint & Google Slides
Org Chart
Modern Green Timeline Infographic Template for PowerPoint & Google Slides
Timeline
Modern Project Status Report Dashboard Template for PowerPoint & Google Slides
Project Status
Modern Organizational Hierarchy Diagram Template for PowerPoint & Google Slides
Org Chart
Modern Technology Solutions Overview template for PowerPoint & Google Slides
Information Technology
Modern Accomplishment Slide with Icons Template for PowerPoint & Google Slides
Business
Clean Modern Business Pitch Deck Template for PowerPoint & Google Slides
Business Plan
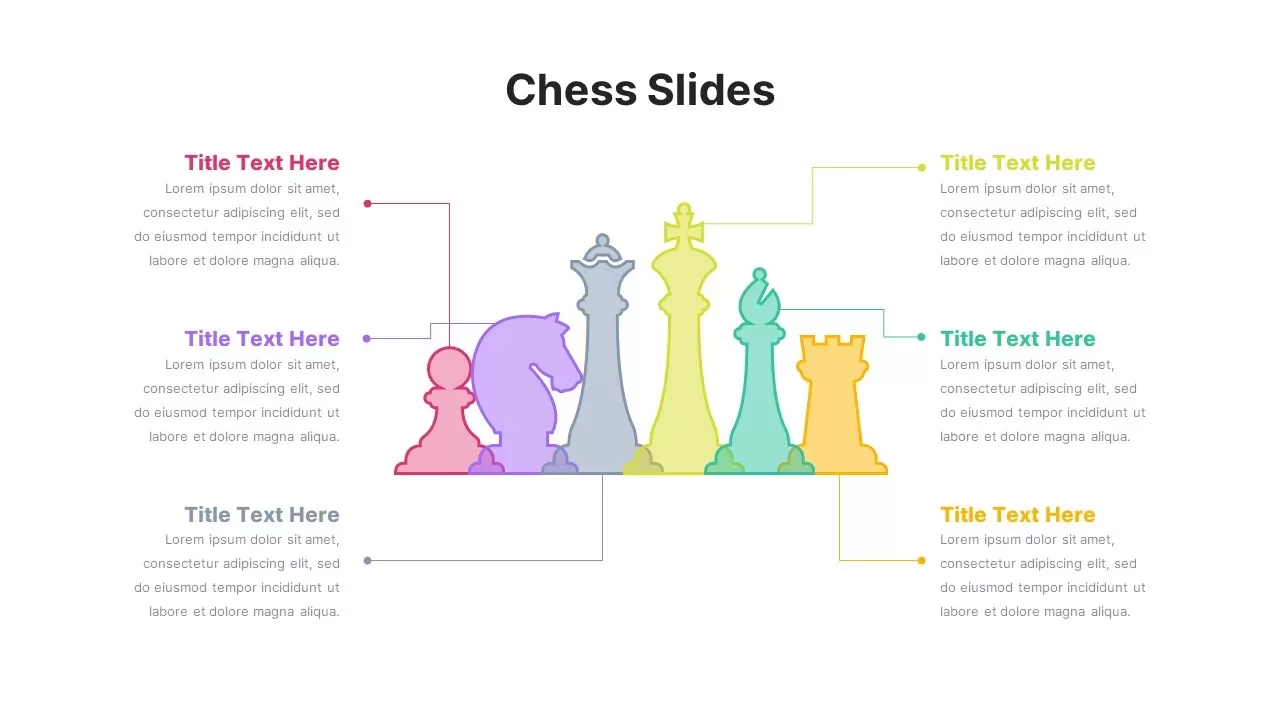
Modern Chess Infographic Diagram Template for PowerPoint & Google Slides
Comparison
Modern Company Profile About Us Slide Template for PowerPoint & Google Slides
Company Profile
Modern Company About Us Slide Template for PowerPoint & Google Slides
Marketing
Modern Mosaic Photo Grid Layout Template for PowerPoint & Google Slides
Graphics
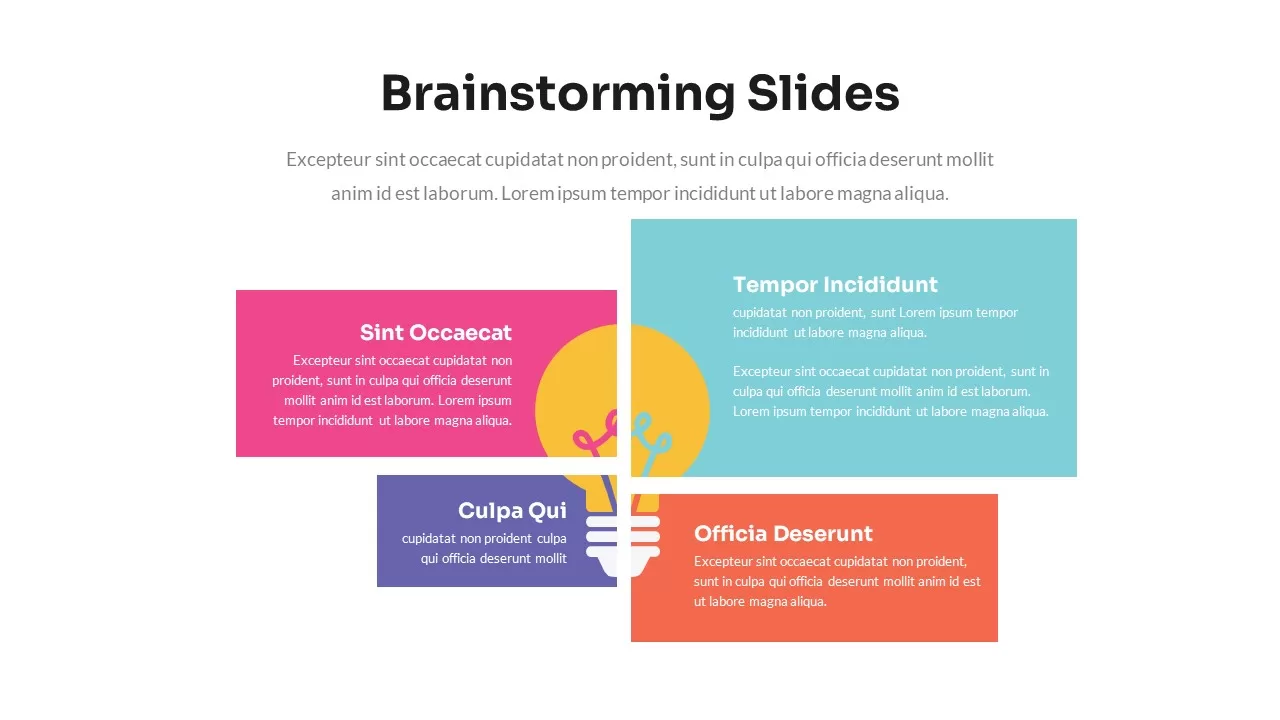
Modern Brainstorming Quadrant Slide Template for PowerPoint & Google Slides
Business Strategy
Modern Clean Reference List Slide Template for PowerPoint & Google Slides
Arrow

Modern Creative Business Pitch Deck Template for PowerPoint & Google Slides
Pitch Deck
Modern Marathon Race Presentation Template for PowerPoint & Google Slides
Graphics
Modern Teal Product Demo Pitch Deck Template for PowerPoint & Google Slides
Business
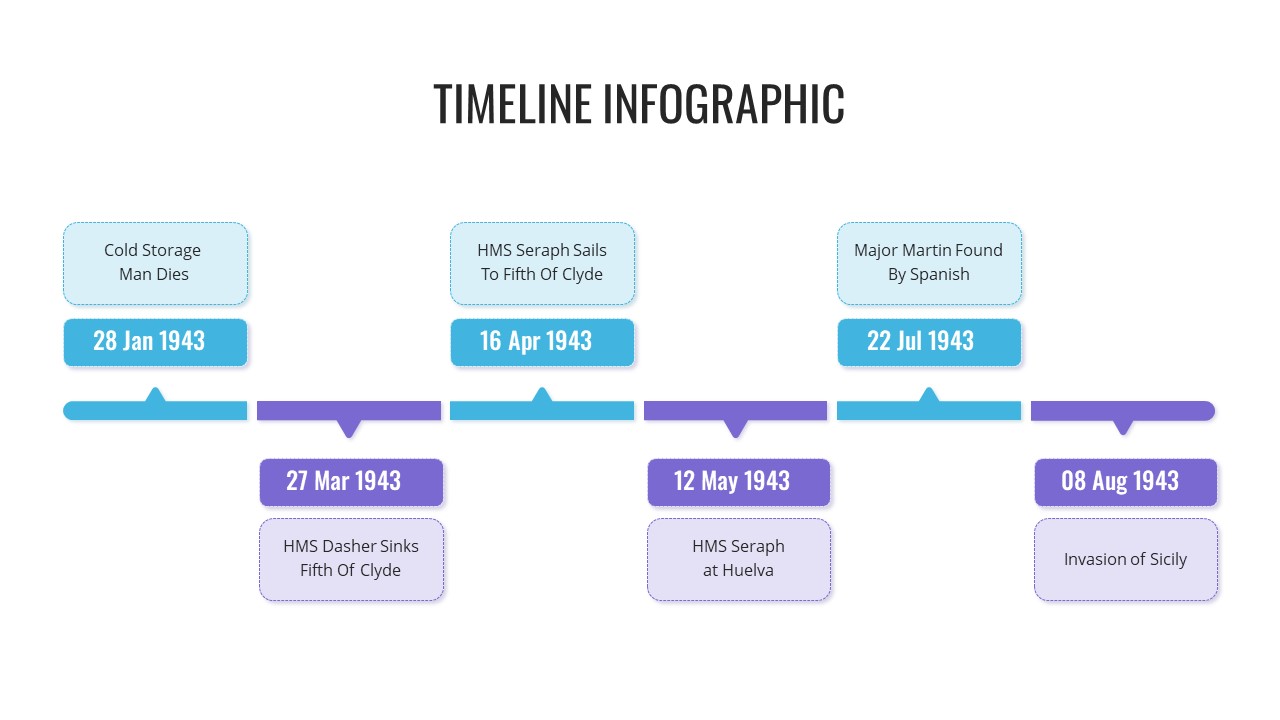
Modern Six-Point Timeline Infographic Template for PowerPoint & Google Slides
Timeline
Free Modern Multipurpose Pitch Deck Template for PowerPoint & Google Slides
Pitch Deck
Free
Free Modern Dark Pitch Deck Presentation Template for PowerPoint & Google Slides
Pitch Deck
Free
Modern Multi-Color Polar Chart Diagram Template for PowerPoint & Google Slides
Charts
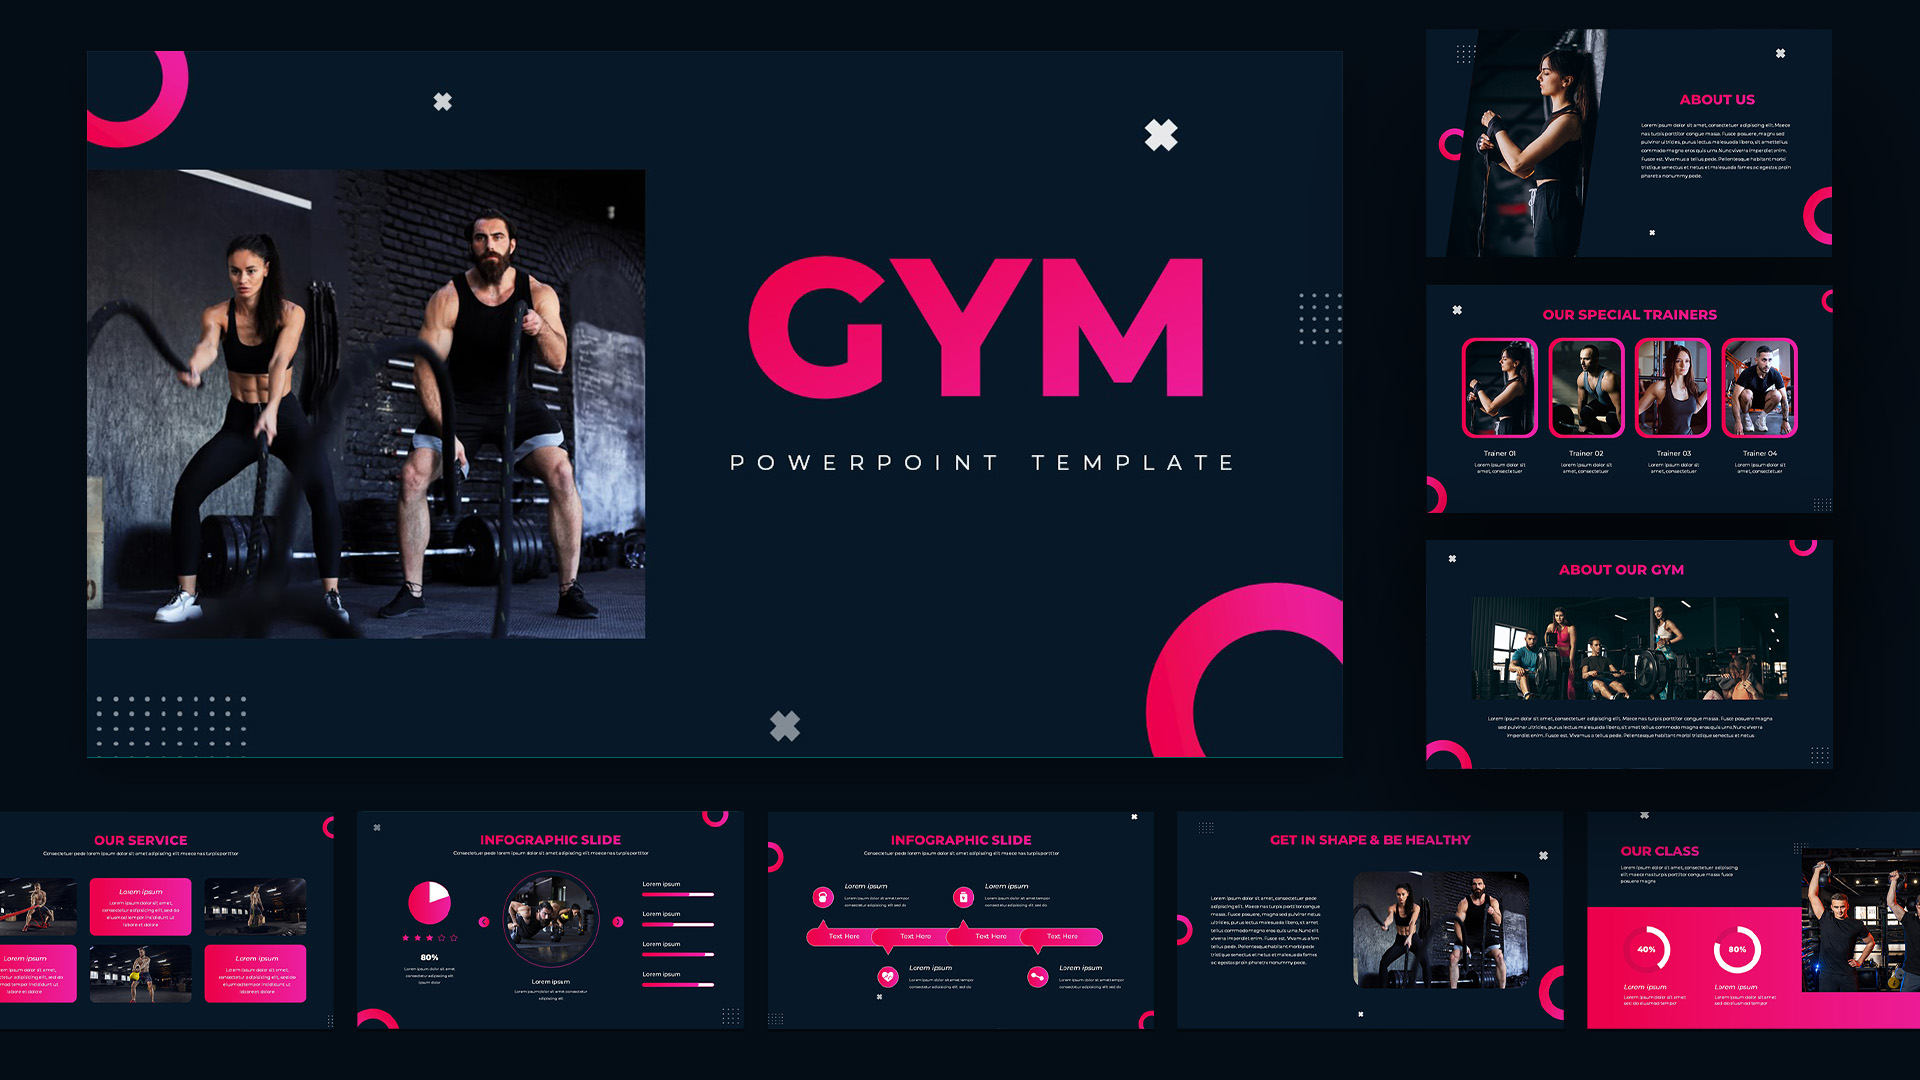
Modern Dark Gym & Fitness Presentation Template for PowerPoint & Google Slides
Pitch Deck
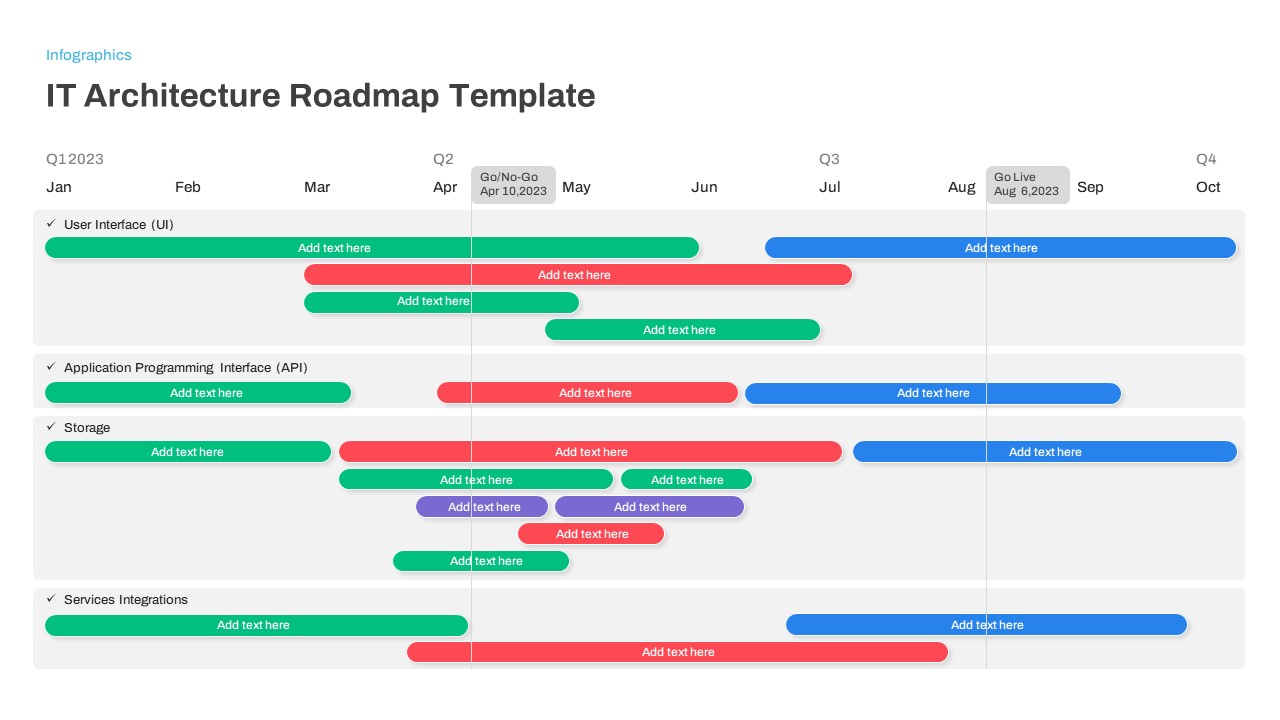
Modern IT Architecture Roadmap Template for PowerPoint & Google Slides
Roadmap
Modern AI Theme Robot Presentation Template for PowerPoint & Google Slides
Pitch Deck
Modern Dark Digital Marketing Theme Template for PowerPoint & Google Slides
Digital Marketing
Modern Corporate Consulting Theme Template for PowerPoint & Google Slides
Company Profile
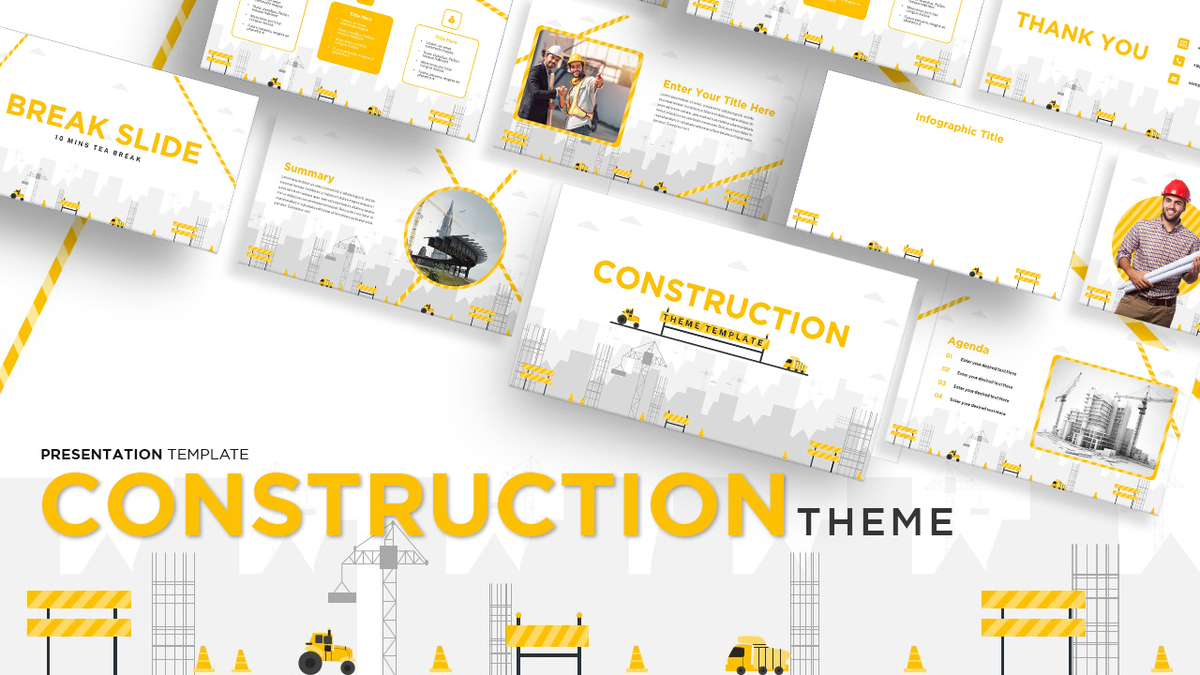
Modern Construction Project Overview Template for PowerPoint & Google Slides
Pitch Deck
Modern Food Theme Presentation Template for PowerPoint & Google Slides
Pitch Deck
Modern Tier List Template for PowerPoint & Google Slides
Comparison
Modern Custom Eight-Branch Mind Map Template for PowerPoint & Google Slides
Mind Maps
Modern Professional Medical Service Template for PowerPoint & Google Slides
Health
Free Advanced Modern Robotics Presentation Template for PowerPoint & Google Slides
Company Profile
Free
Modern Business Snapshot Overview Template for PowerPoint & Google Slides
Business Report
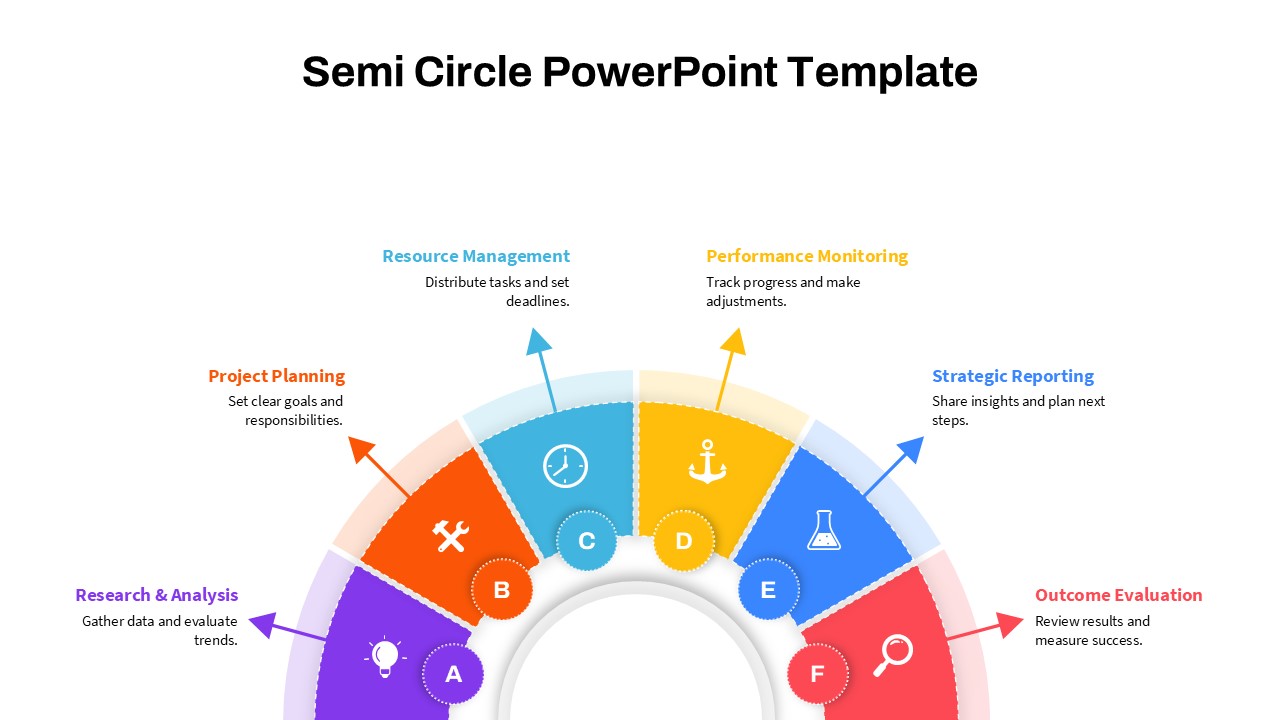
Modern Semi Circle Infographic Template for PowerPoint & Google Slides
Circular
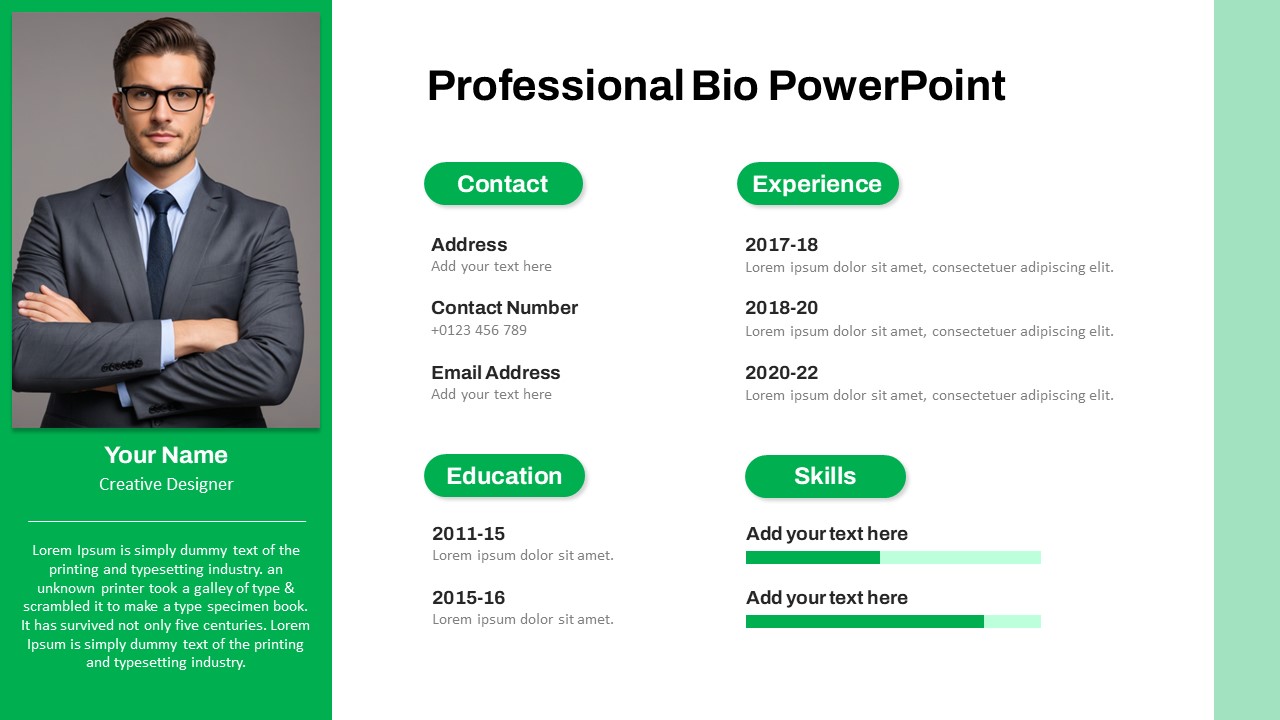
Modern Professional Bio Resume Slide Template for PowerPoint & Google Slides
Recruitment
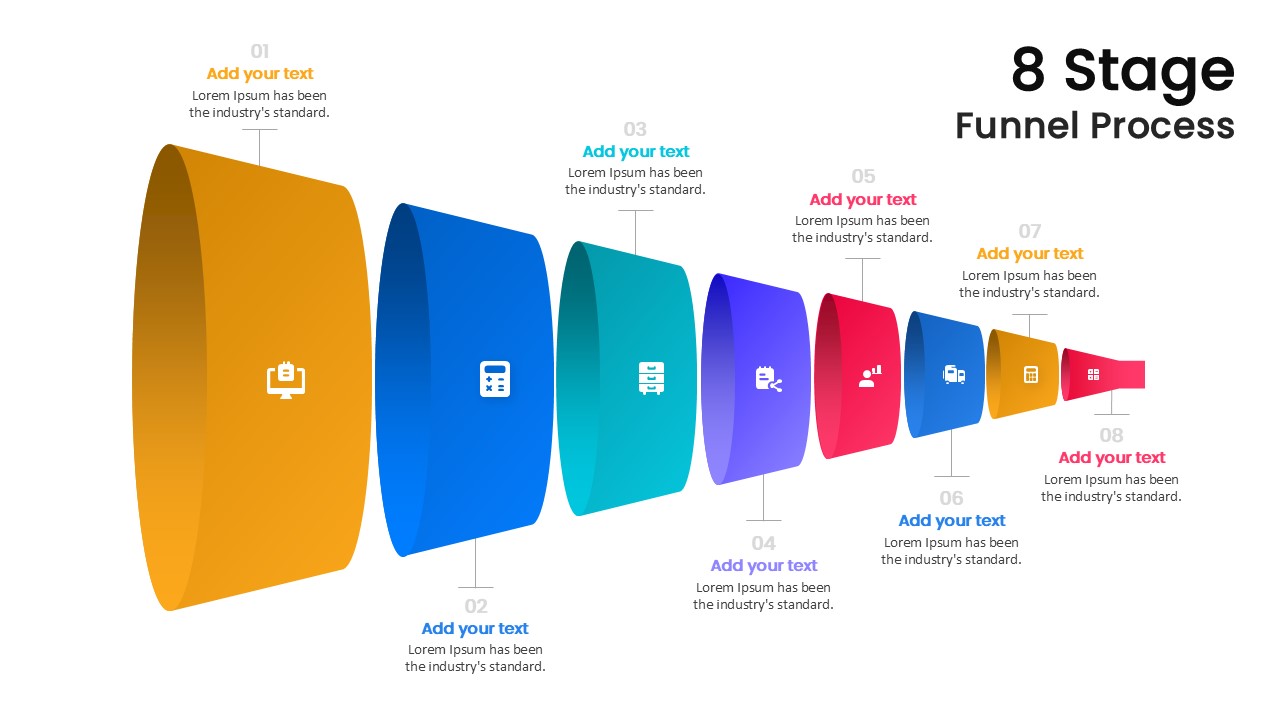
Modern 8-Stage Funnel Process Diagram Template for PowerPoint & Google Slides
Funnel
Modern Team Profile Template for PowerPoint & Google Slides
Our Team
Modern Blue Our Team Introduction Template for PowerPoint & Google Slides
Business
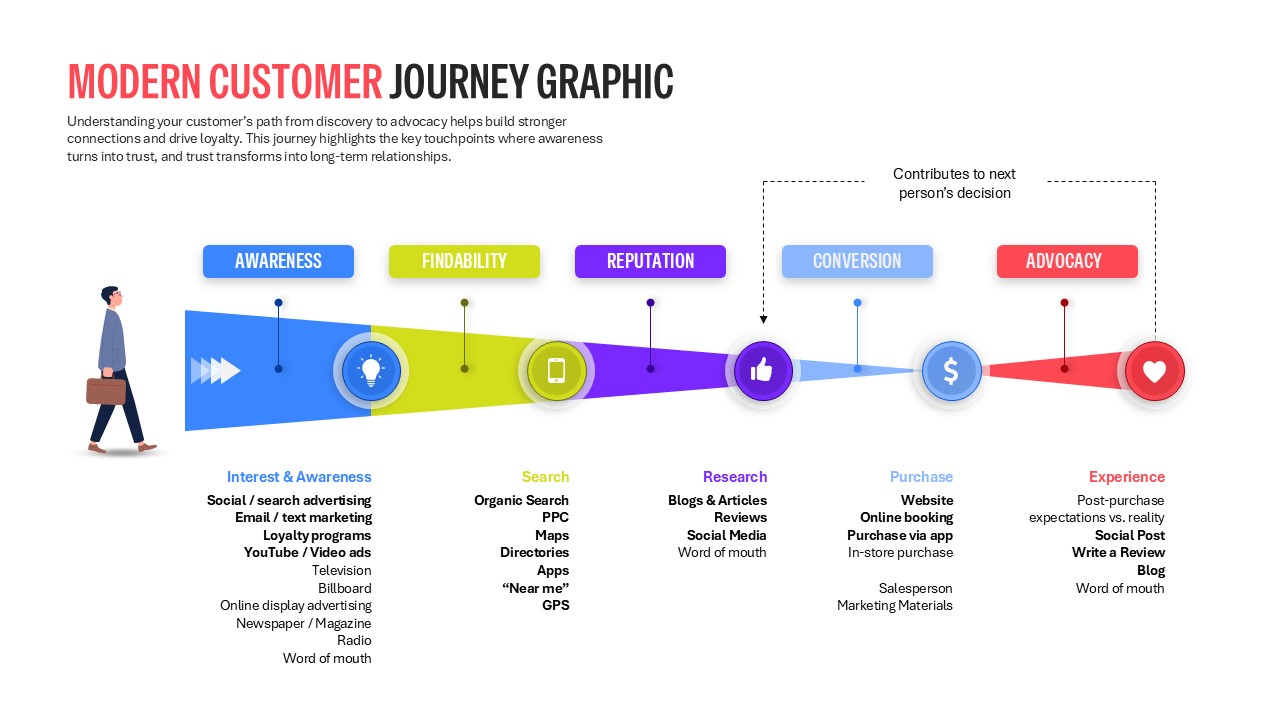
Modern Customer Journey Graphic Funnel Template for PowerPoint & Google Slides
Customer Journey