Liebig’s Law Barrel Diagram Template for PowerPoint & Google Slides
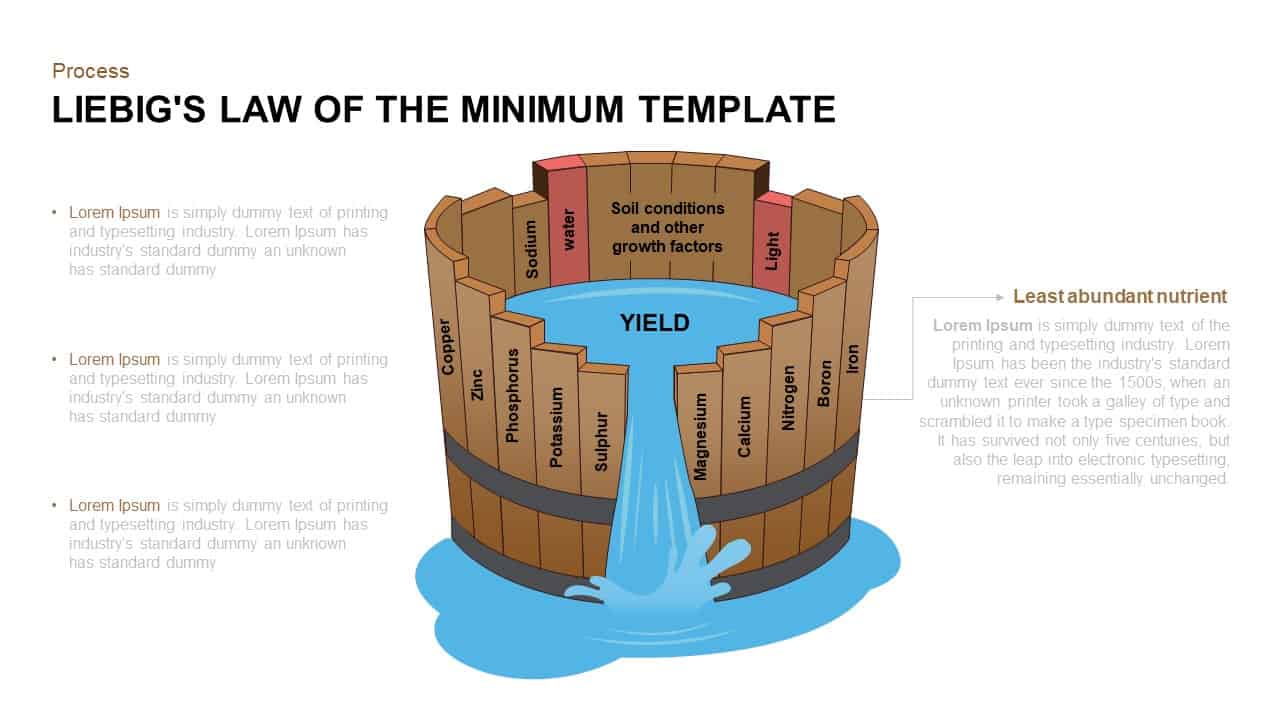
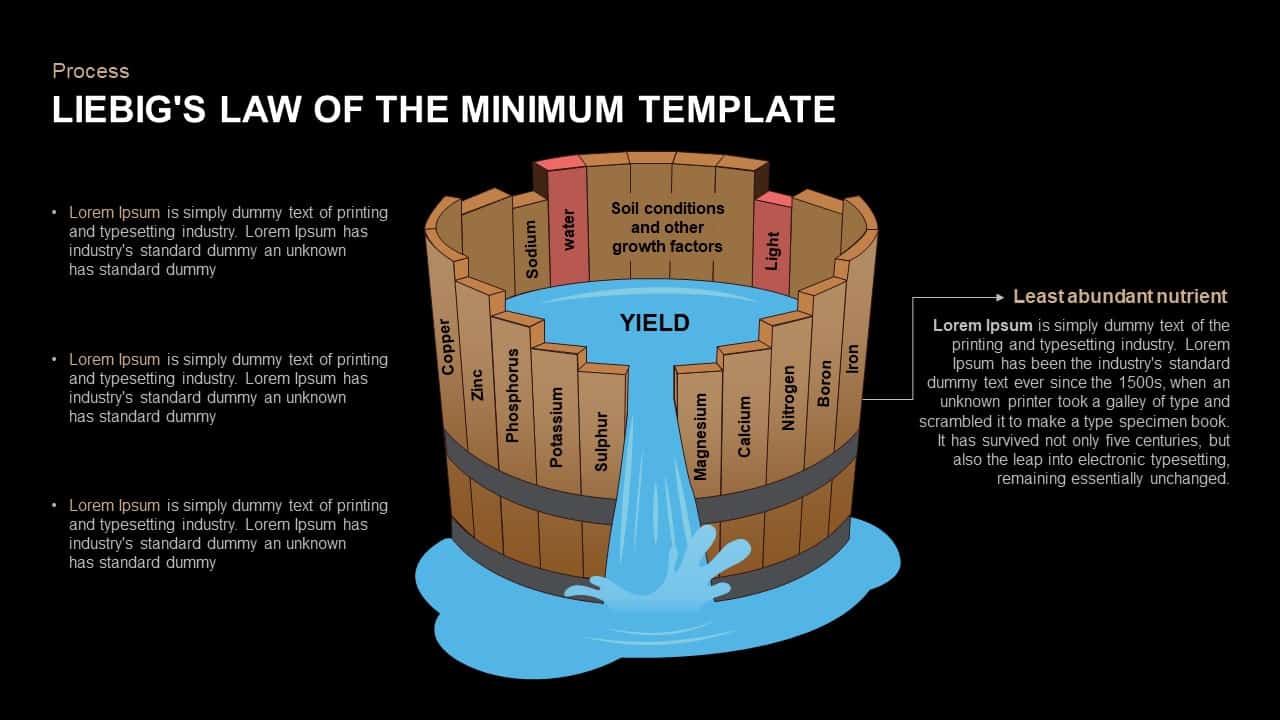


Use this engaging Liebig’s Law barrel diagram to illustrate the principle of limiting nutrients in a visually intuitive format. A realistic wooden barrel sits at the center, composed of vertical staves each labeled with critical growth factors—Nitrogen, Phosphorus, Potassium, Calcium, Magnesium, Sulphur, Zinc, Copper, Boron, Iron, Sodium, Water, Light, and a general “Soil conditions and other growth factors” stave. The water fill inside the barrel reaches the height of the shortest stave and spills outward, symbolizing how the least abundant nutrient limits overall yield. A dedicated callout marker draws attention to the primary limiting nutrient, guiding audiences to the core takeaway instantly.
Designed on a clean white canvas, the slide balances realistic wood textures and subtle drop shadows with neutral gray typography, delivering a professional, modern aesthetic. Each stave, label, and callout is crafted as an editable vector graphic on master slides, enabling seamless customization: resize or recolor individual staves, swap labels or icons, adjust the water level, and reposition the callout without disrupting the layout. Color gradients can be modified to align with corporate branding, while smart placeholders preserve consistent spacing and alignment across both PowerPoint and Google Slides. Prebuilt animations allow sequential unveiling of each stave and the water spill, supporting dynamic storytelling and step-by-step concept reinforcement.
Whether you’re presenting agronomic research, environmental impact assessments, or education modules, this barrel infographic transforms complex data into a clear, memorable visual narrative. Download this asset to simplify concept communication, drive stakeholder engagement, and reinforce the critical importance of balanced nutrient management.
Who is it for
Agronomists, environmental consultants, and educators will rely on this slide to explain nutrient-limitation concepts and data-driven yield analysis. Researchers, facility managers, and sustainability teams can leverage the visual metaphor to communicate critical resource constraints to stakeholders.
Other Uses
Beyond agricultural contexts, repurpose this design for supply-chain risk analysis, performance-bottleneck illustrations, or process-limitation frameworks. Simply replace stave labels and callouts to adapt for manufacturing capacities, project-management constraints, or operational workflows.
Login to download this file

Item ID
SB01141
Related Templates

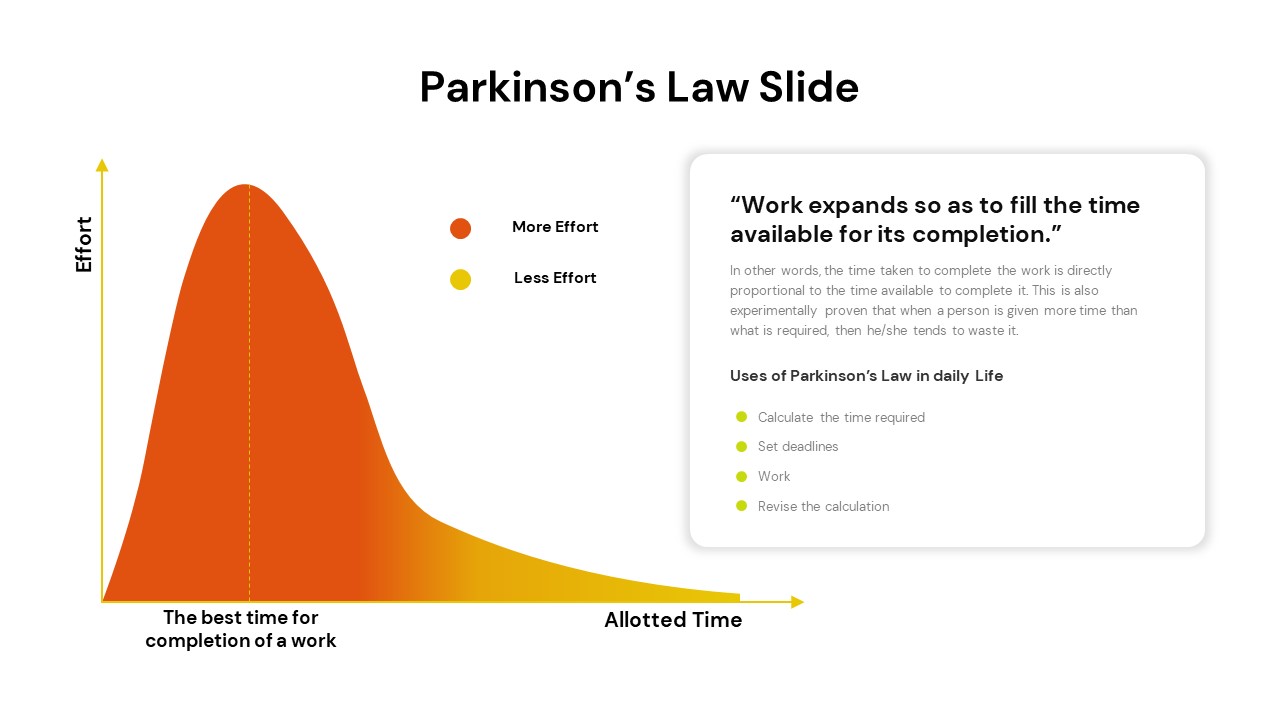
Parkinson’s Law slide template for PowerPoint & Google Slides
Leadership
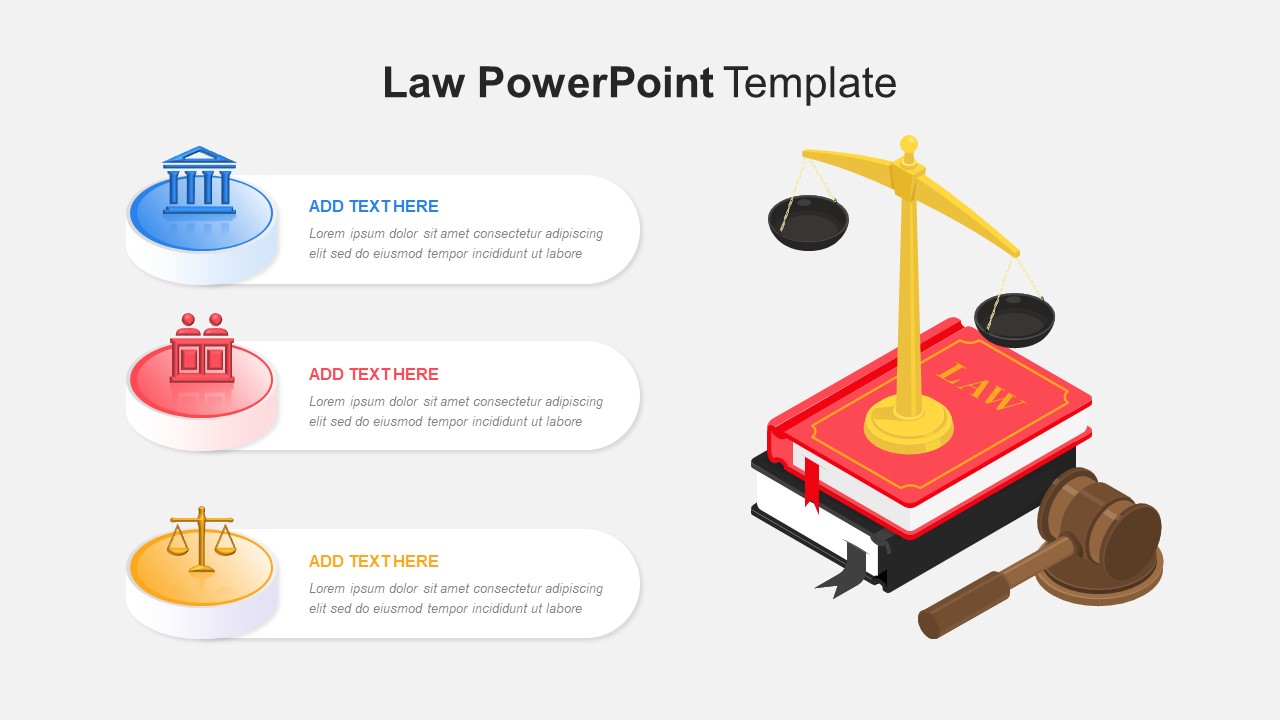
Professional Law & Justice Presentation Template for PowerPoint & Google Slides
Company Profile
Free Law Infographics Slide Pack Collection Template for PowerPoint & Google Slides
Infographics
Free
Elegant Law Consultancy Presentation Template for PowerPoint & Google Slides
Company Profile
Law School Presentation Template for PowerPoint & Google Slides
Company Profile
Snake Diagram Pack of 8 Slides template for PowerPoint & Google Slides
Process
Gear Process Diagram PowerPoint Template for PowerPoint & Google Slides
Process
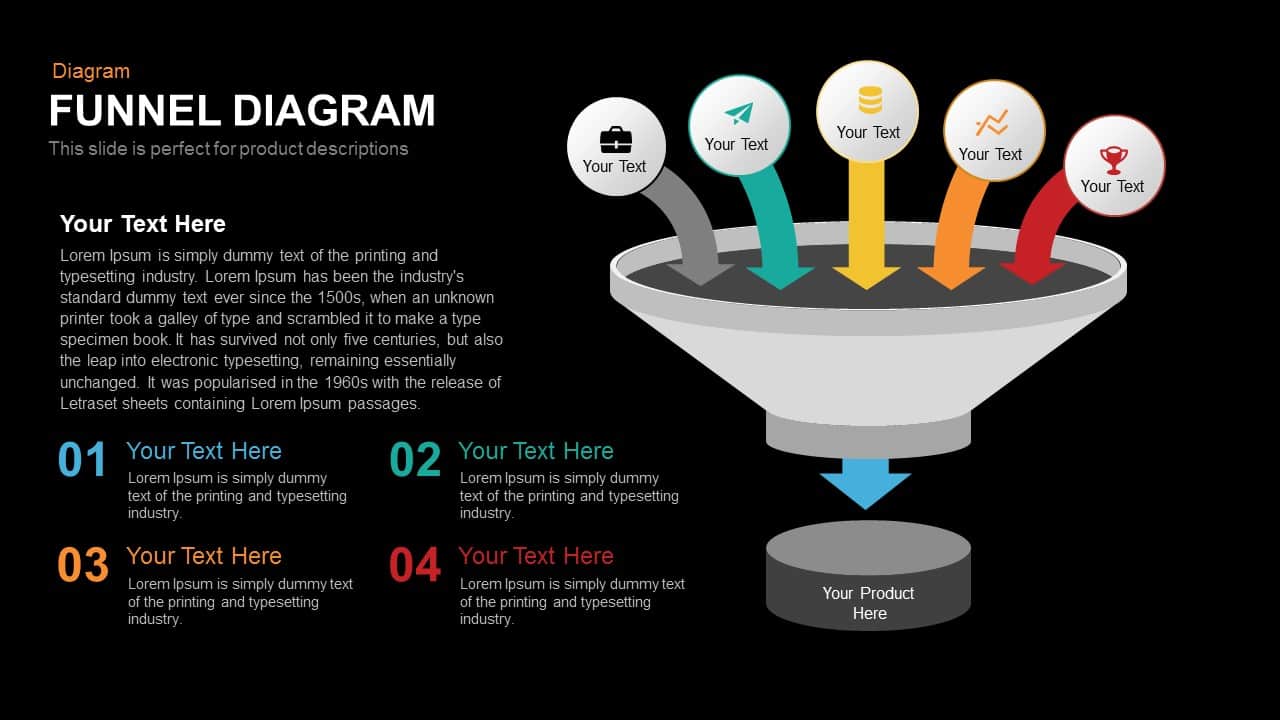
Sales Process Workflow Funnel Diagram PowerPoint Template for PowerPoint & Google Slides
Funnel
Puzzle Diagram PowerPoint Template for PowerPoint & Google Slides
Process
Transportation Logistics PowerPoint Diagram template for PowerPoint & Google Slides
Process
Emoji Scale PowerPoint Diagram for PowerPoint & Google Slides
Infographics
4 Step Problem Solving PowerPoint Diagram for PowerPoint & Google Slides
Process
Business Funnel Diagram template for PowerPoint & Google Slides
Funnel
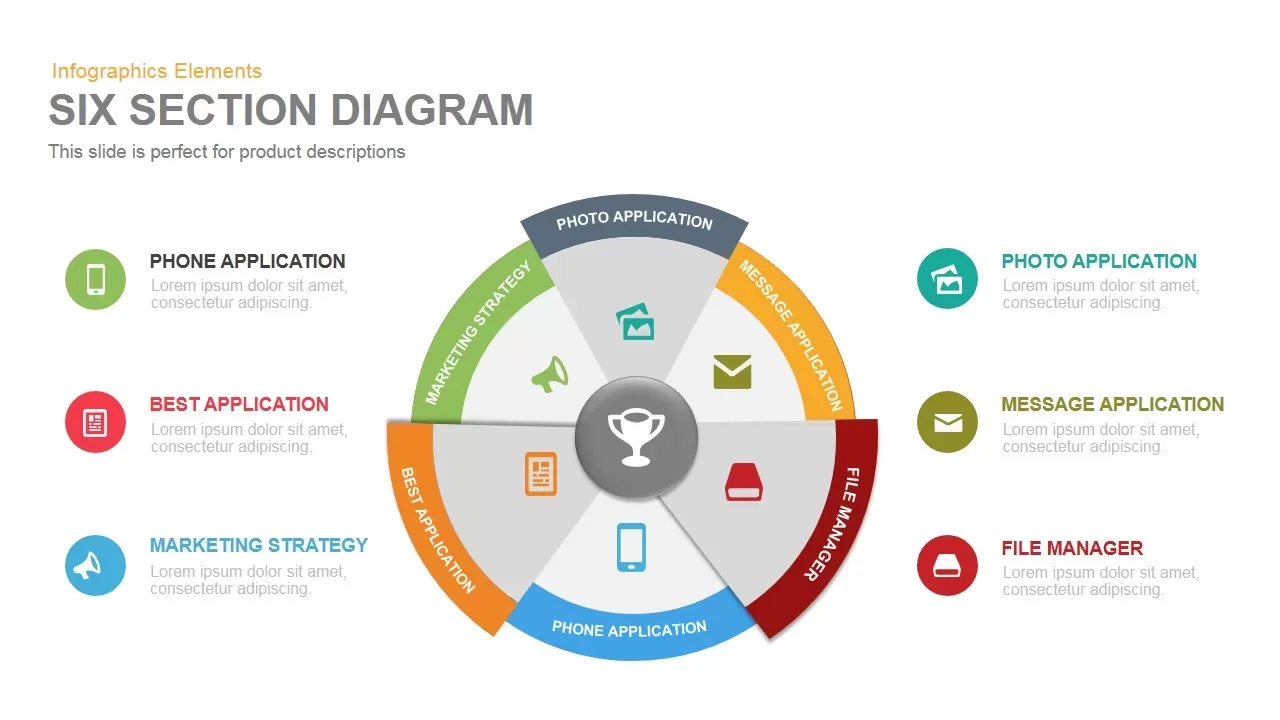
Six Section Diagram template for PowerPoint & Google Slides
Circular
4 Step Creative Process Diagram Template for PowerPoint & Google Slides
Infographics
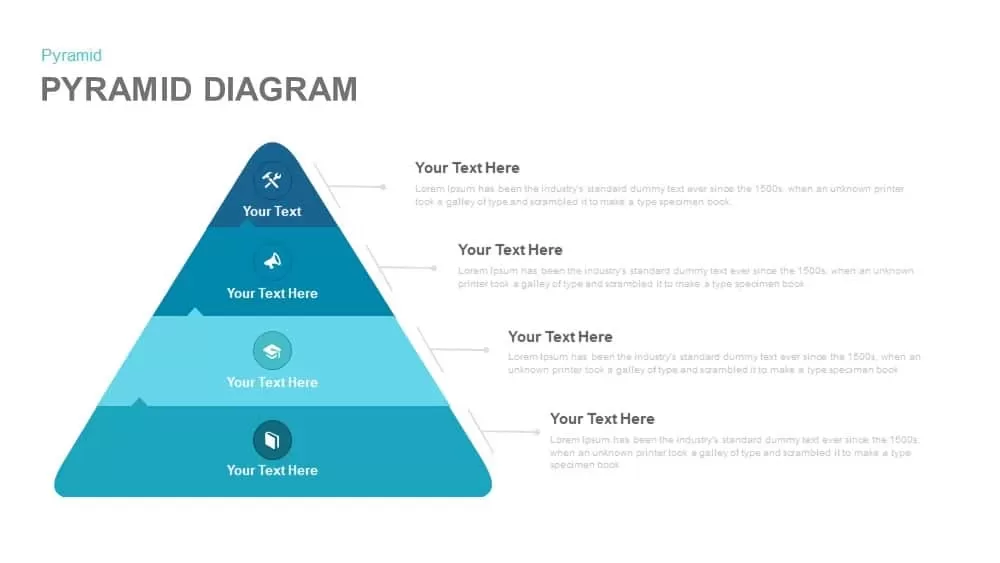
7-Level 3D Pyramid Infographic Diagram Template for PowerPoint & Google Slides
Pyramid
Six Arrow Radial Process Diagram template for PowerPoint & Google Slides
Infographics
4 Step 3D Circular Process Diagram template for PowerPoint & Google Slides
Process
Three-Section Fishbone Process Diagram template for PowerPoint & Google Slides
Process
5 Arrow Diagram template for PowerPoint & Google Slides
Arrow
Multi-Segment Circle Split Diagram template for PowerPoint & Google Slides
Circular
Eight-Section Circular Diagram template for PowerPoint & Google Slides
Circular

15-Step Process Flow Diagram Template for PowerPoint & Google Slides
Process
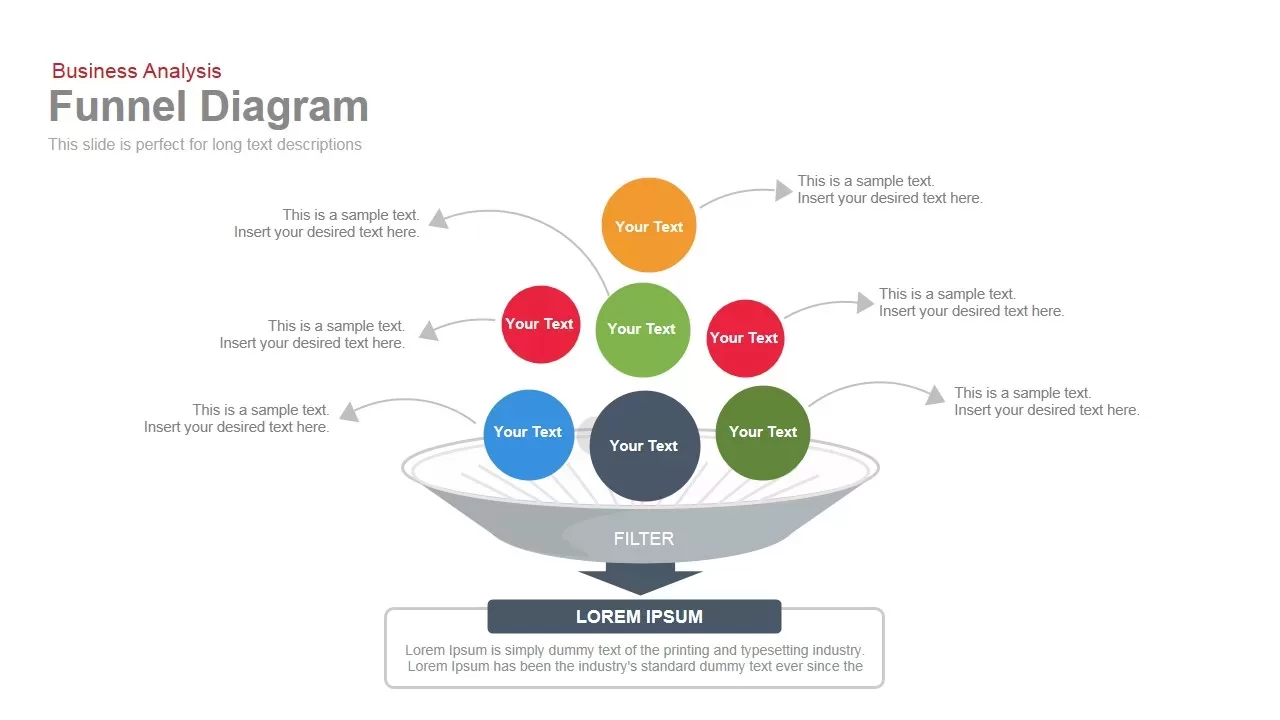
Funnel Diagram template for PowerPoint & Google Slides
Funnel
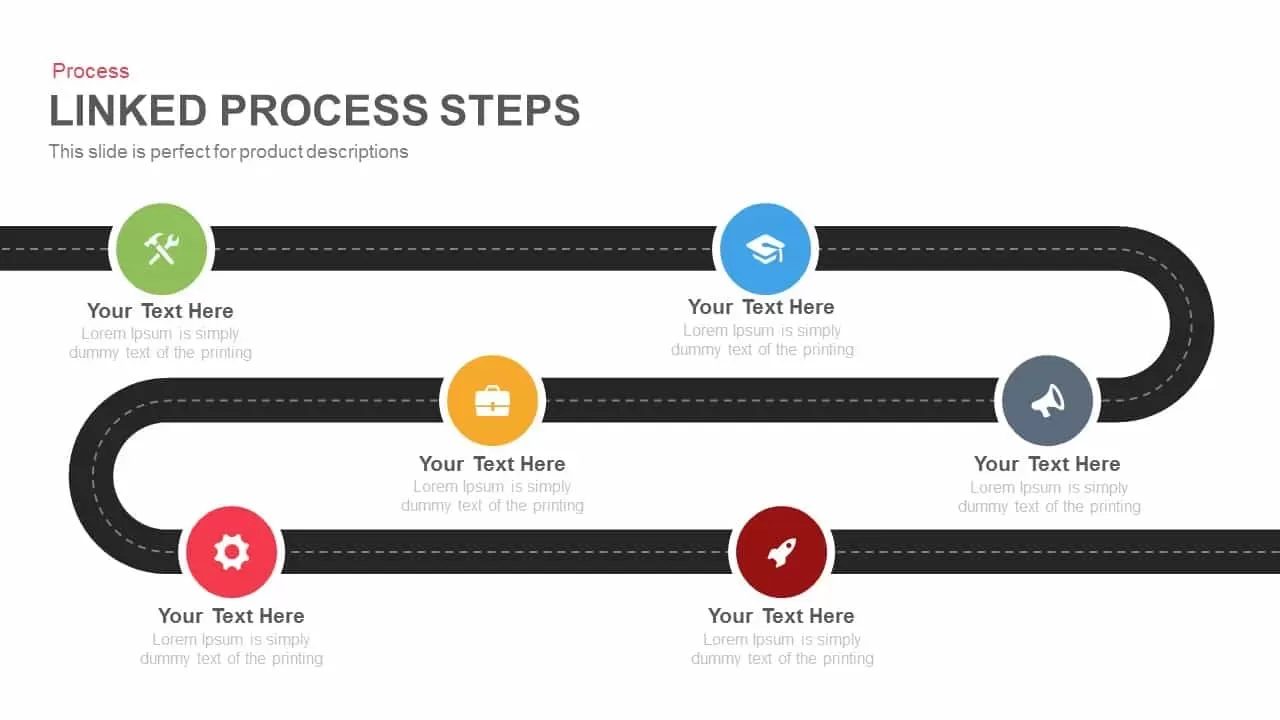
Roadmap Six-Step Process Diagram Template for PowerPoint & Google Slides
Roadmap

Four-Circle Venn Process Diagram template for PowerPoint & Google Slides
Process

Light Bulb Idea Circular Diagram Template for PowerPoint & Google Slides
Infographics
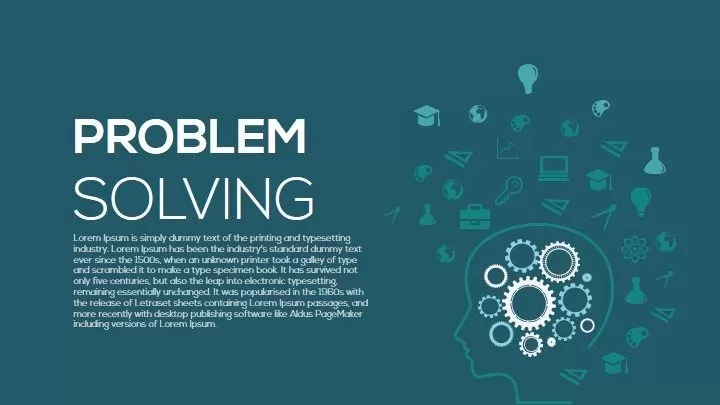
Problem Solving Concept Diagram Template for PowerPoint & Google Slides
Infographics
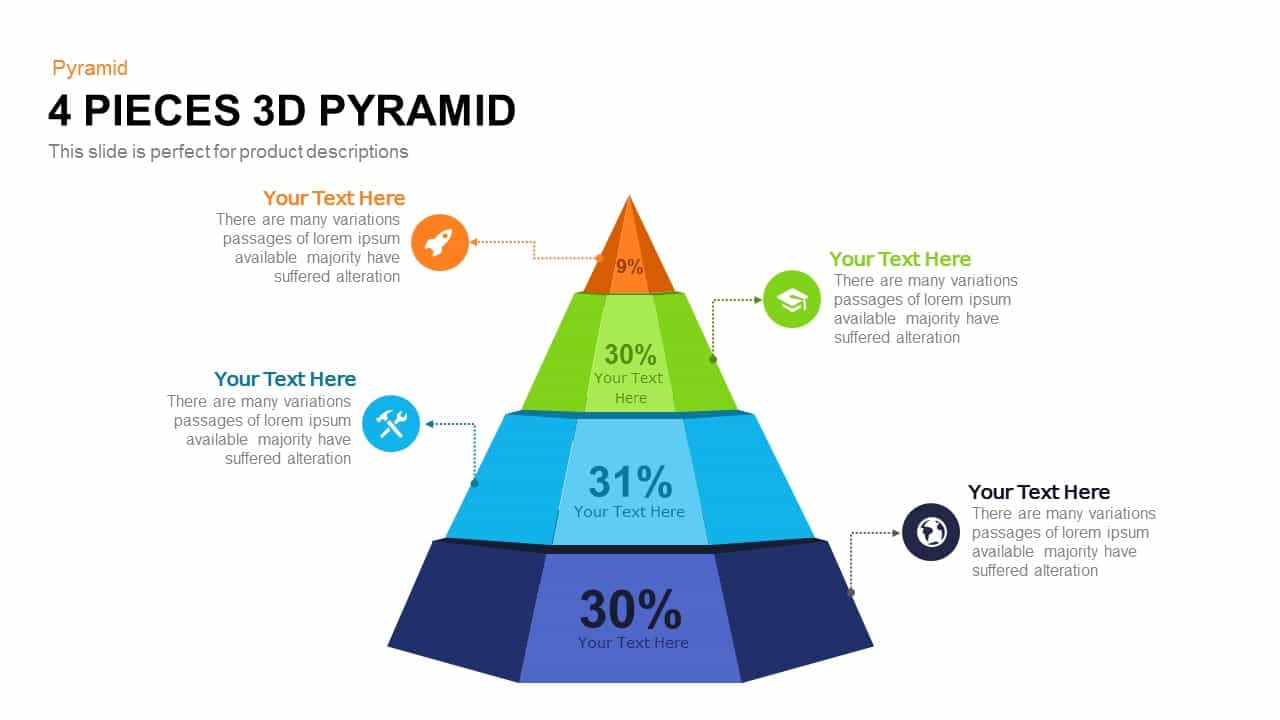
Professional 4-Piece 3D Pyramid Diagram Template for PowerPoint & Google Slides
Pyramid
Process Improvement Metaphor Diagram Template for PowerPoint & Google Slides
Process
Five-Stage Pyramid Infographics Diagram Template for PowerPoint & Google Slides
Pyramid
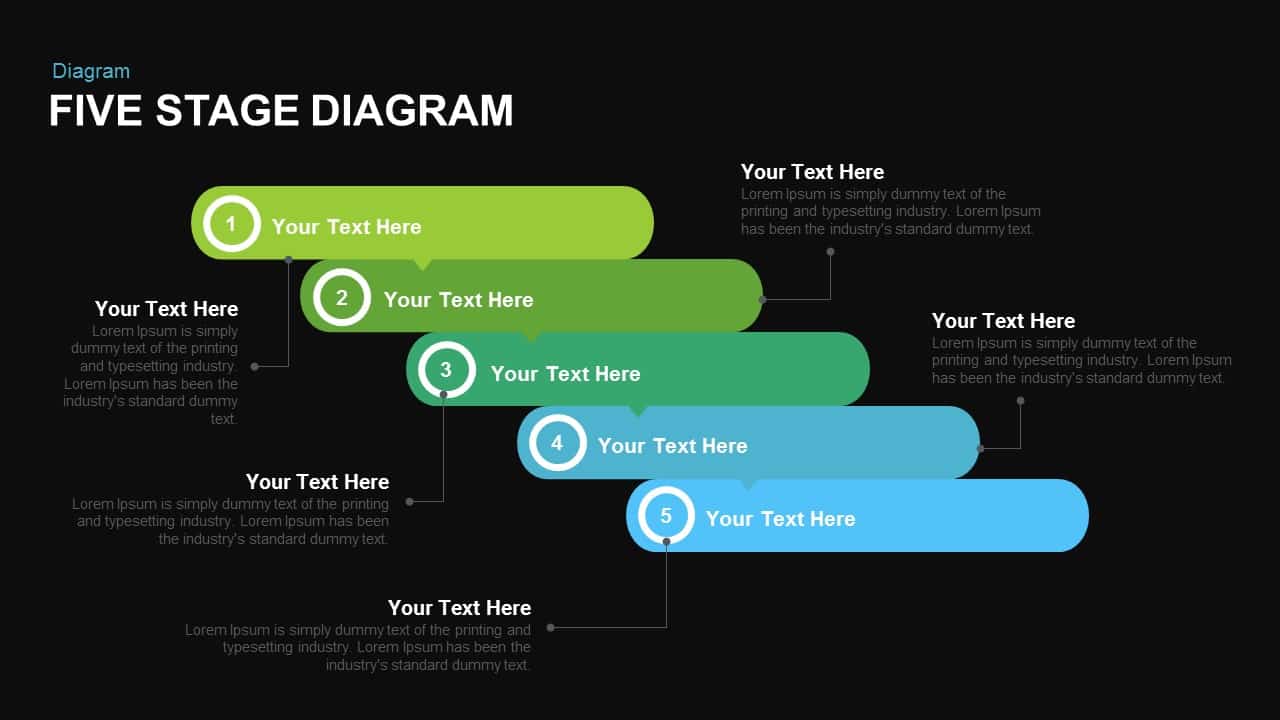
Engaging Five-Stage Process Diagram Template for PowerPoint & Google Slides
Process
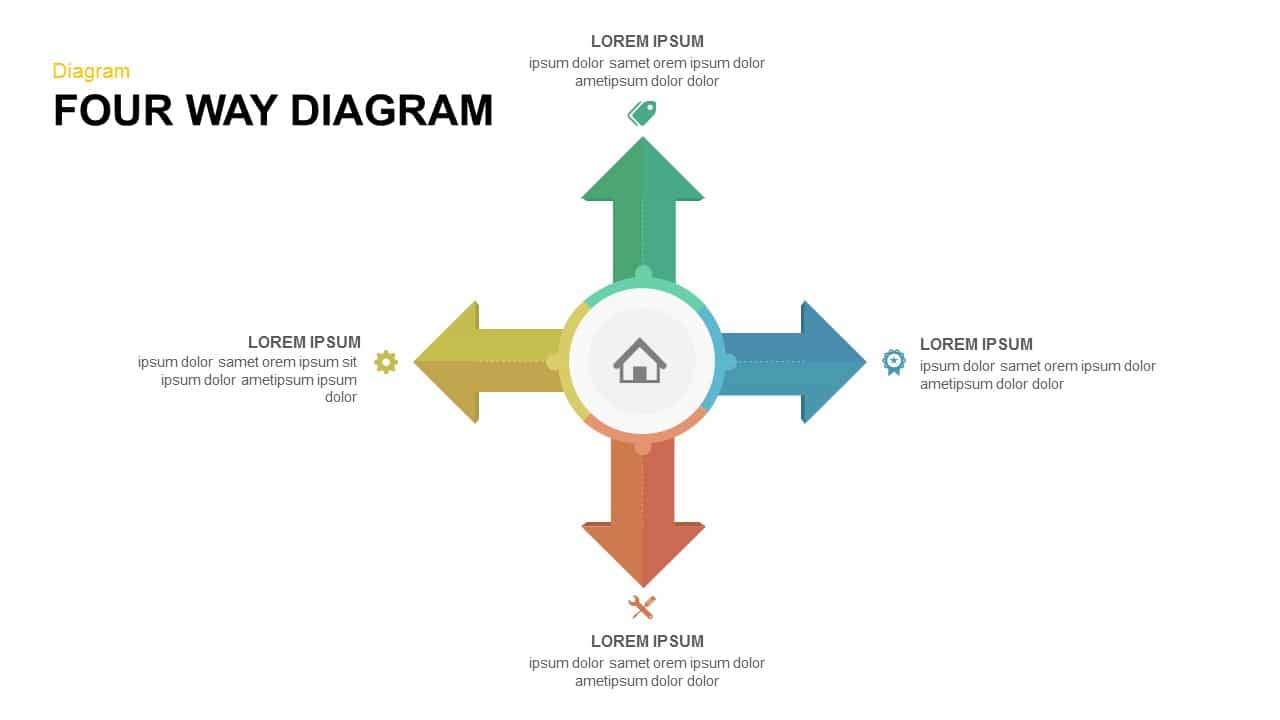
Four-Way Directional Arrow Diagram Template for PowerPoint & Google Slides
Arrow
Three-Circle Diagram Infographic Template for PowerPoint & Google Slides
Circular
Six-Staged Gear Diagram Framework Template for PowerPoint & Google Slides
Process
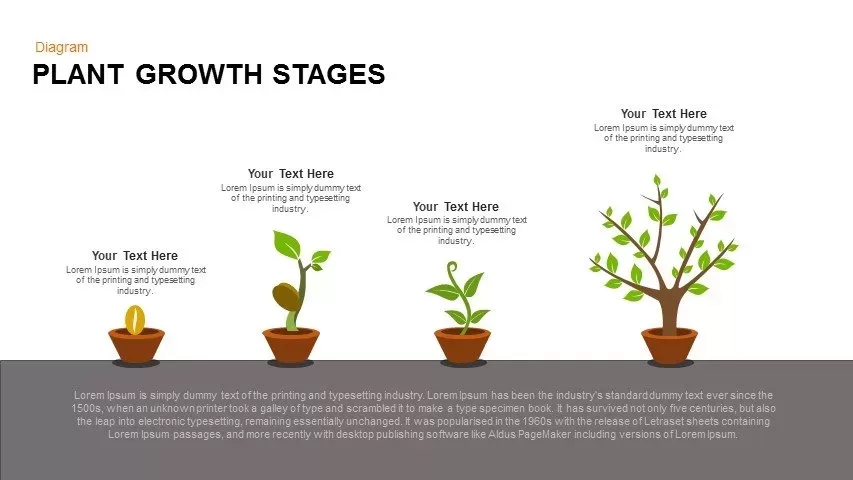
Editable Plant Growth Stages Diagram Template for PowerPoint & Google Slides
Process
8 Steps Arrow Process Diagram template for PowerPoint & Google Slides
Process

Four-Level Business Pyramid Diagram Template for PowerPoint & Google Slides
Pyramid
Five-Stage Cyclic Process Arrow Diagram Template for PowerPoint & Google Slides
Process
Modern Four Stage Gear Diagram Template for PowerPoint & Google Slides
Process
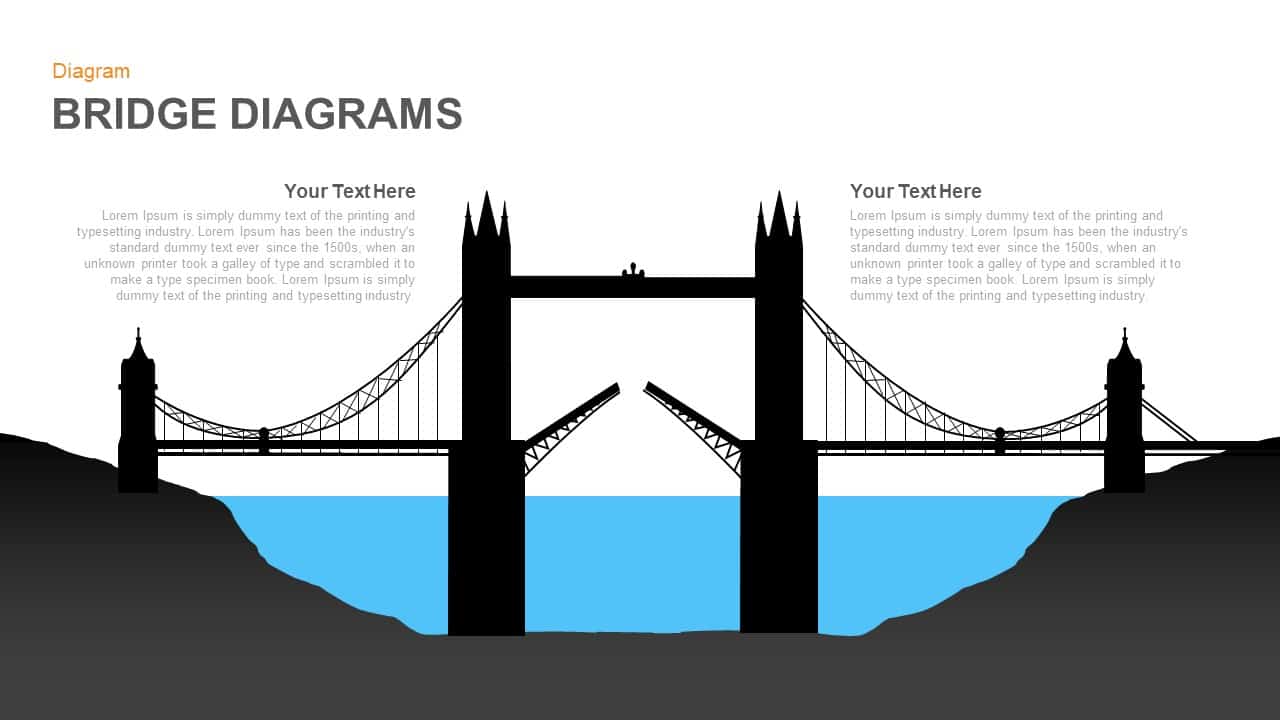
Modern Bridge Diagram Slide Design Template for PowerPoint & Google Slides
Process
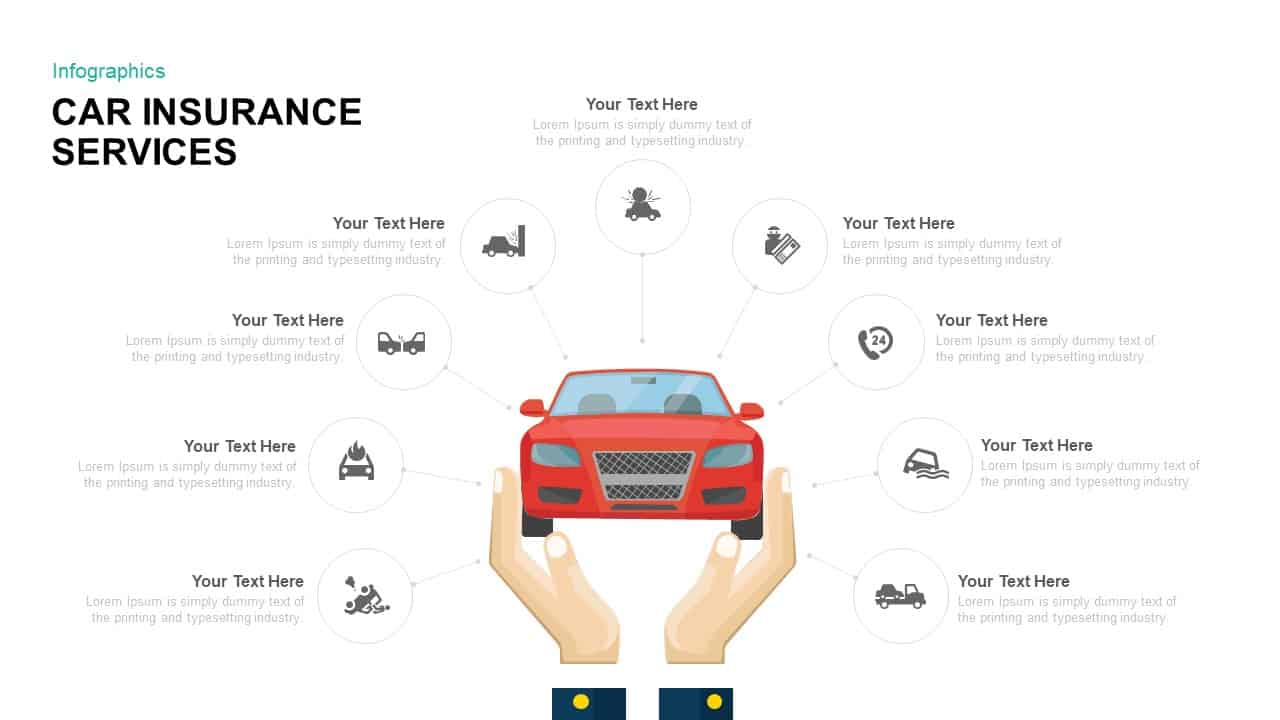
Comprehensive Car Insurance Services Diagram Template for PowerPoint & Google Slides
Business
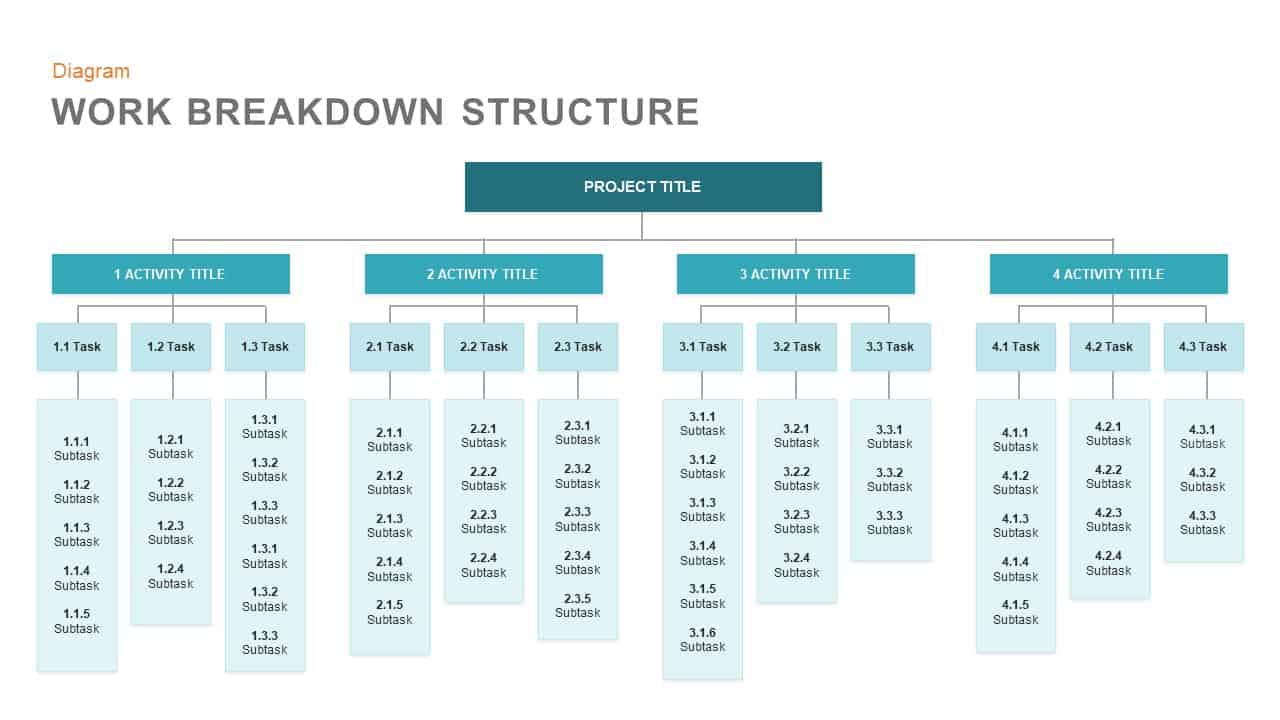
Work Breakdown Structure Diagram Template for PowerPoint & Google Slides
Diagrams
Five-Stage Process Diagram Template for PowerPoint & Google Slides
Process
Change Kaleidoscope Process Diagram Template for PowerPoint & Google Slides
Circular
10-Point Gradient Agenda Flow Diagram Template for PowerPoint & Google Slides
Agenda
Four-Quadrant SWOT Analysis Diagram Template for PowerPoint & Google Slides
SWOT
Six-Stage Clockwise Circular Diagram Template for PowerPoint & Google Slides
Circular
Circular Three-Step Infographic Diagram Template for PowerPoint & Google Slides
Circular
Puzzle Diagram for Goal Achievement Template for PowerPoint & Google Slides
Circular
Organizational Structure Diagram Template for PowerPoint & Google Slides
Org Chart
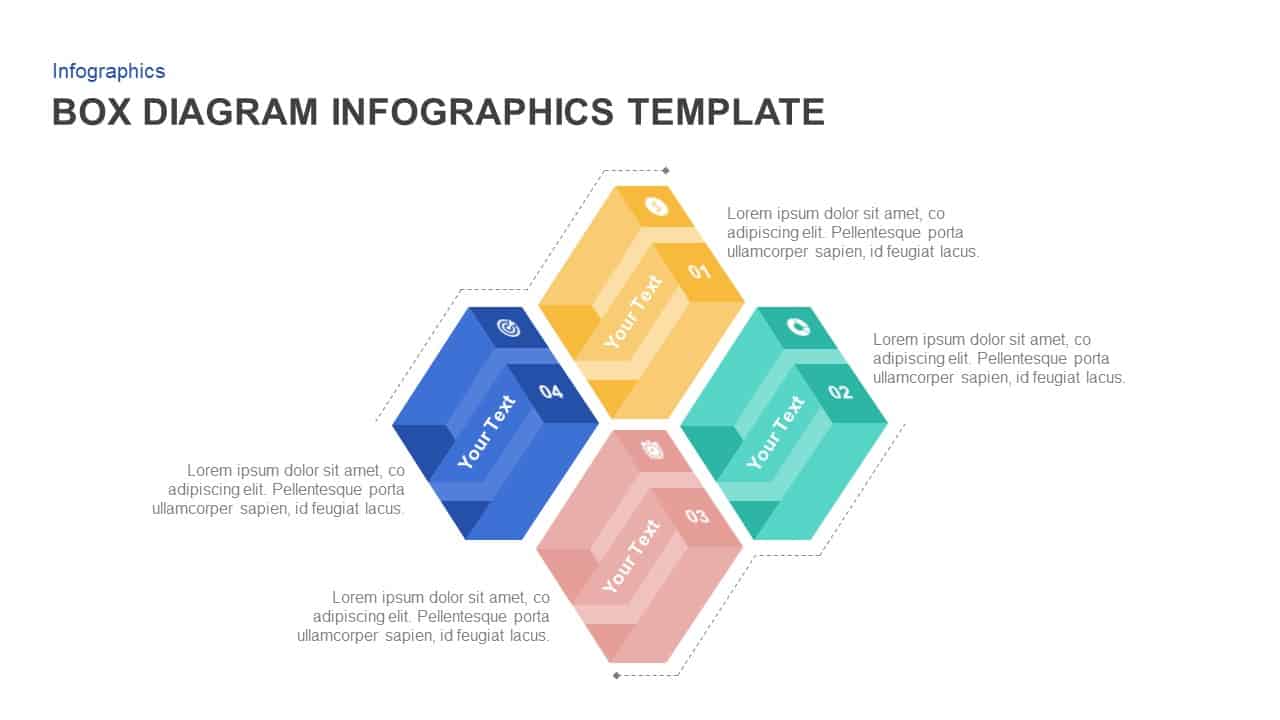
Box Diagram Infographics template for PowerPoint & Google Slides
Business

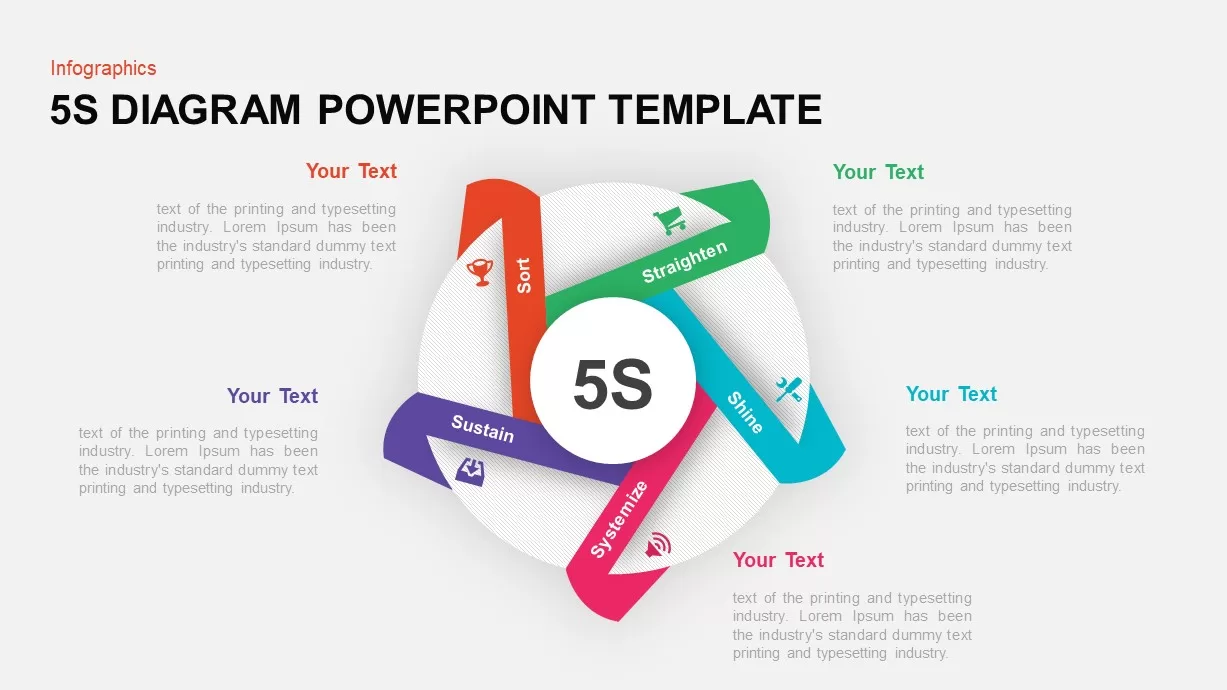
5S Lean Methodology Circular Diagram Template for PowerPoint & Google Slides
Process
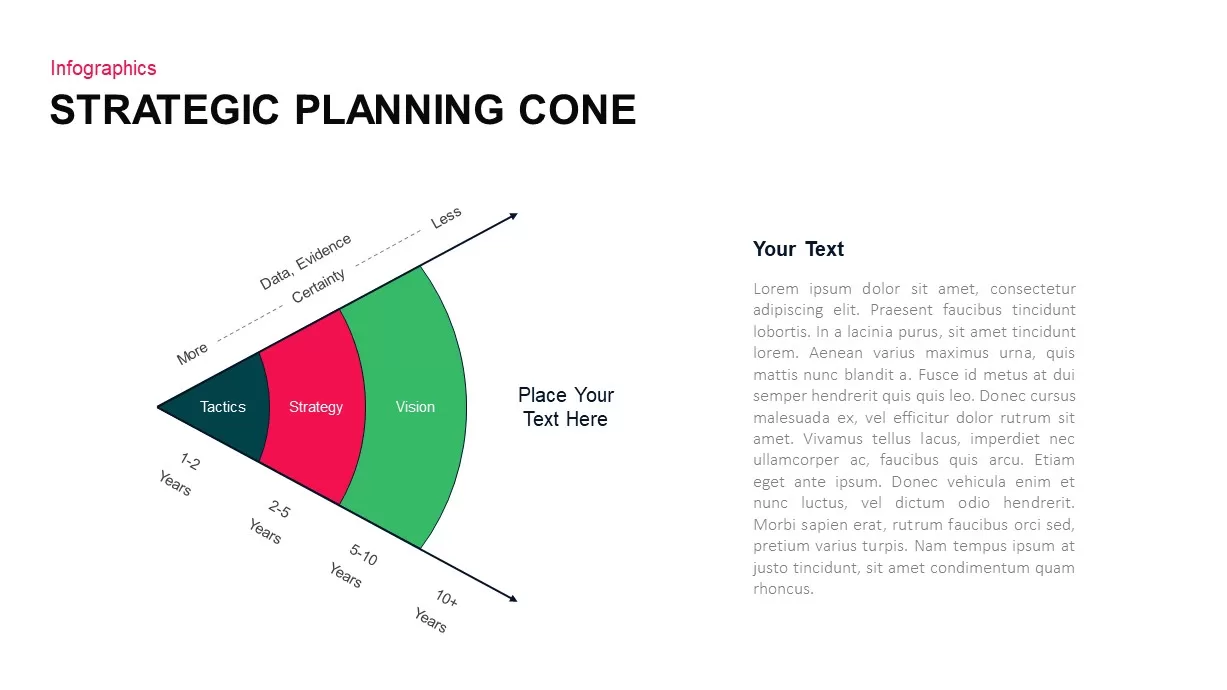
3-Part Strategic Planning Cone Diagram Template for PowerPoint & Google Slides
Process
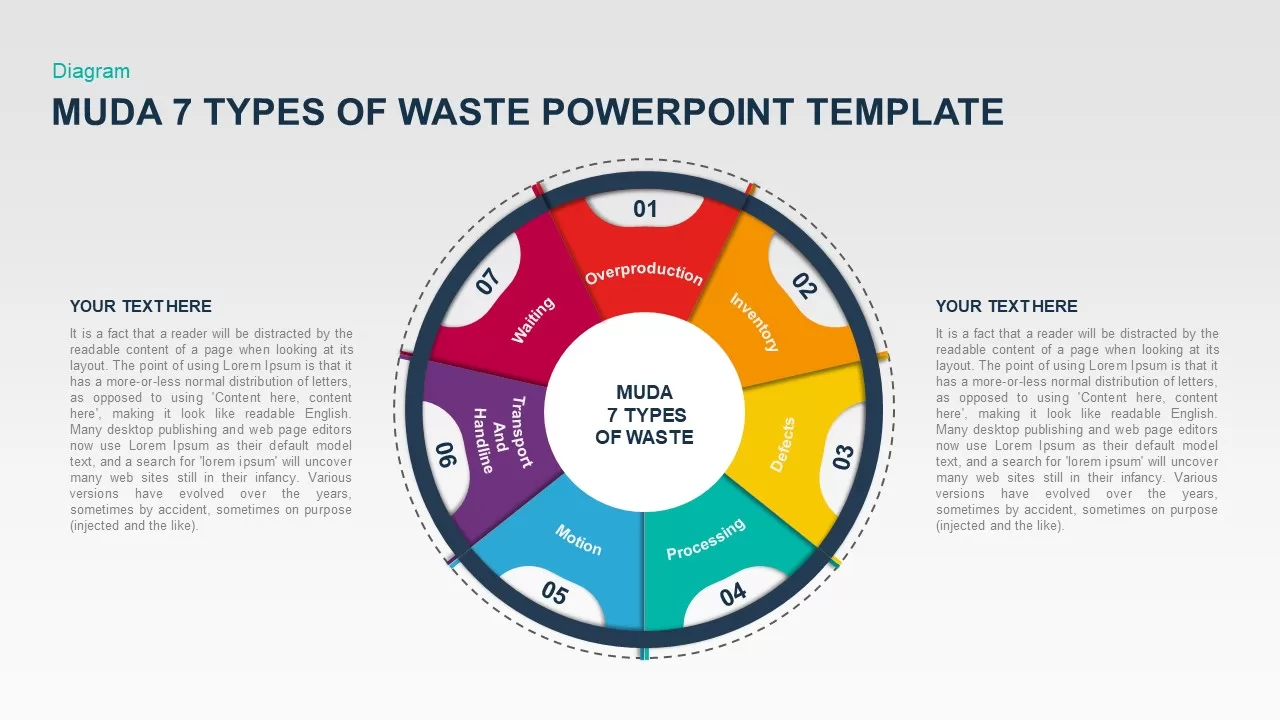
MUDA Seven Types of Waste Diagram Template for PowerPoint & Google Slides
Circular
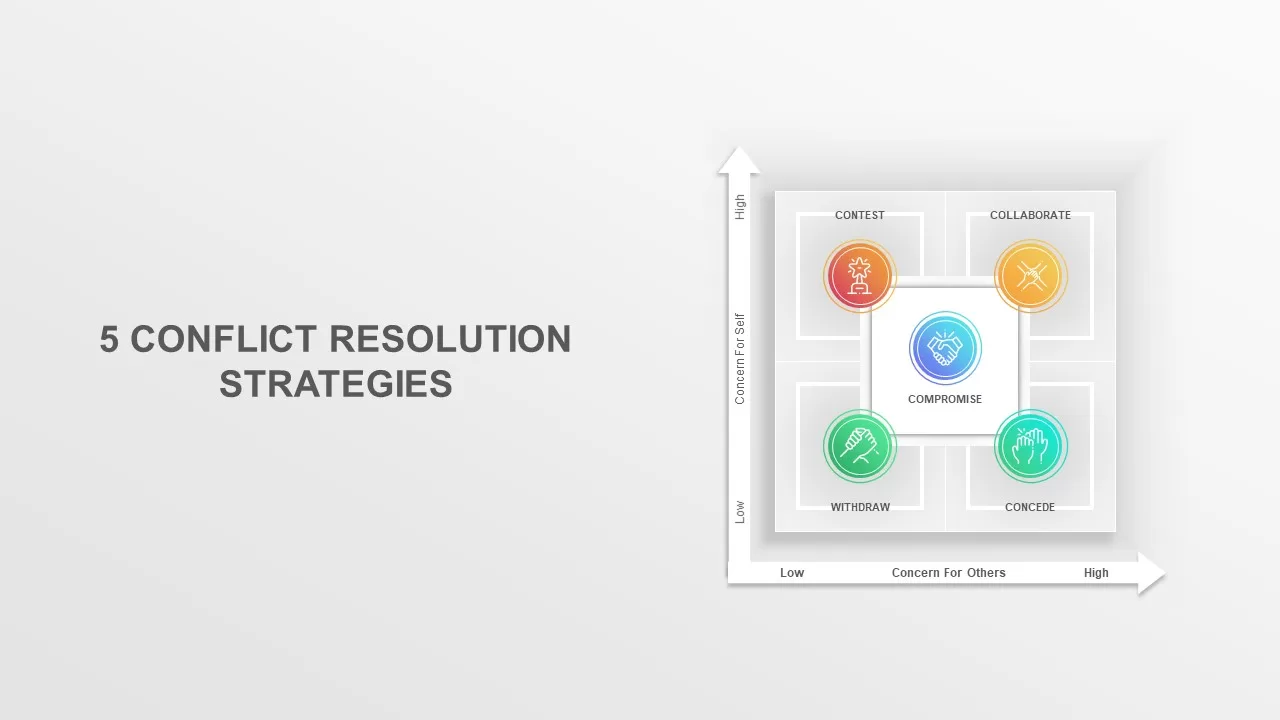
Conflict Resolution Strategies Diagram Template for PowerPoint & Google Slides
Infographics
Underwater Fishbone Cause-Effect Diagram Template for PowerPoint & Google Slides
Process
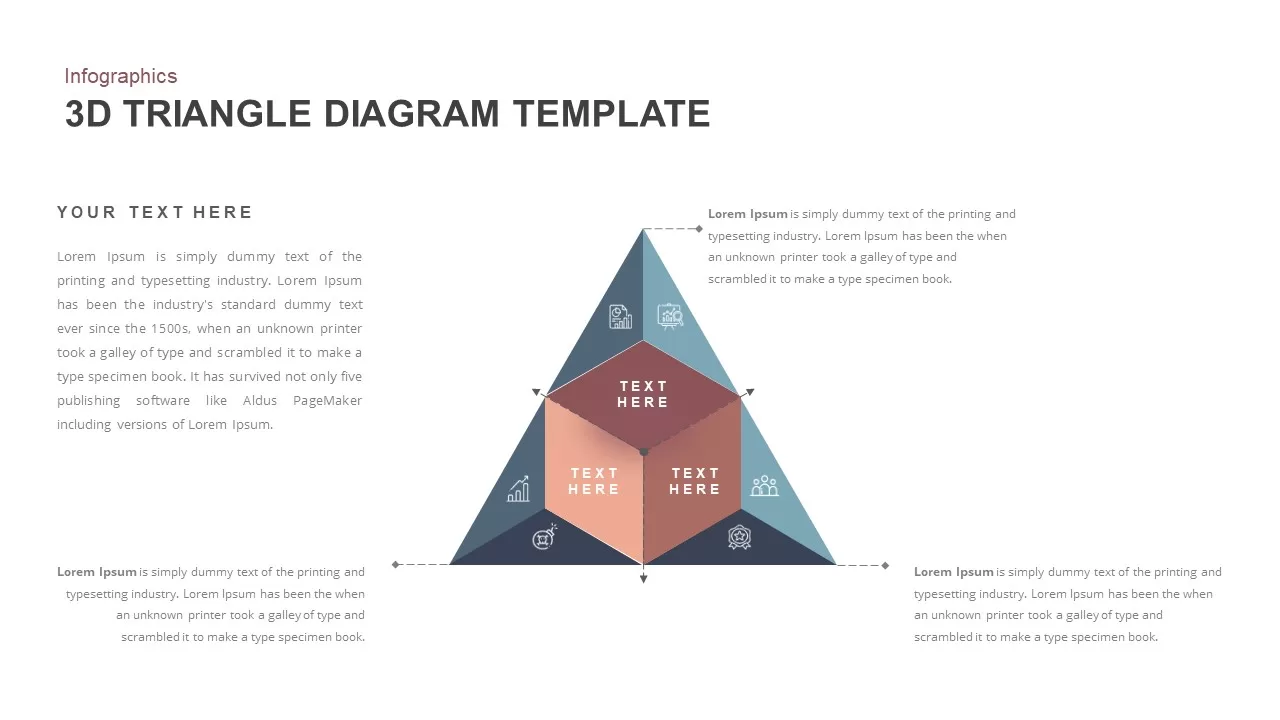
3D Triangle Diagram Infographic Template for PowerPoint & Google Slides
Pyramid
Fishbone Process Diagram template for PowerPoint & Google Slides
Infographics
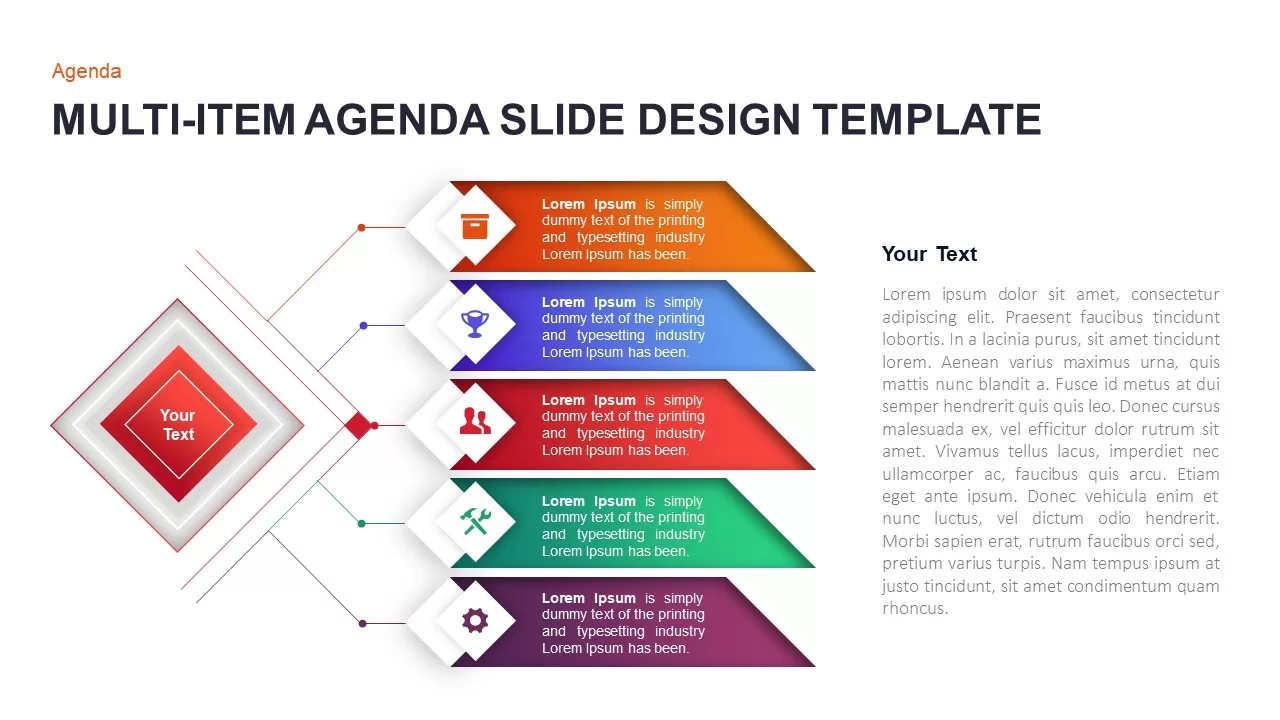
Multi-Item Agenda Hub-and-Spoke Diagram Template for PowerPoint & Google Slides
Agenda
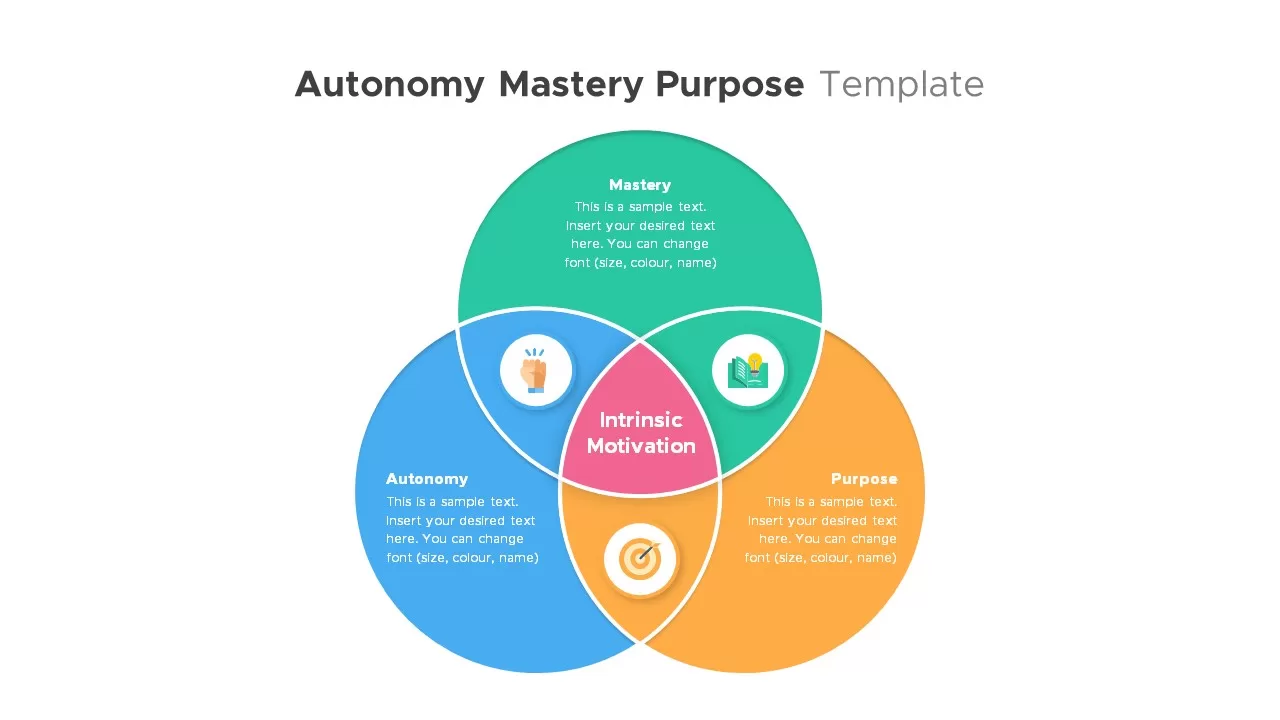
Autonomy, Mastery & Purpose Venn Diagram Template for PowerPoint & Google Slides
Circular
Colorful Eight-Piece Puzzle Diagram Template for PowerPoint & Google Slides
Process
3D Five-Step Roadmap Diagram Slide Layout Template for PowerPoint & Google Slides
Roadmap
Thermometer Measurement Timeline Diagram Template for PowerPoint & Google Slides
Timeline
Circular Arrow Process Diagram Template for PowerPoint & Google Slides
Circular
Online Shopping Use Case Diagram Template for PowerPoint & Google Slides
Software Development
Four-Point Hub and Spoke Diagram Template for PowerPoint & Google Slides
Business Strategy
Chain Link Process Infographic Diagram Template for PowerPoint & Google Slides
Process
10-Step Circular Process Diagram Template for PowerPoint & Google Slides
Process
Incentive Theory of Motivation Diagram Template for PowerPoint & Google Slides
Employee Performance
Creative Brainstorming Process Diagram Template for PowerPoint & Google Slides
Process
Six-Step Colorful Flywheel Diagram Template for PowerPoint & Google Slides
Circular
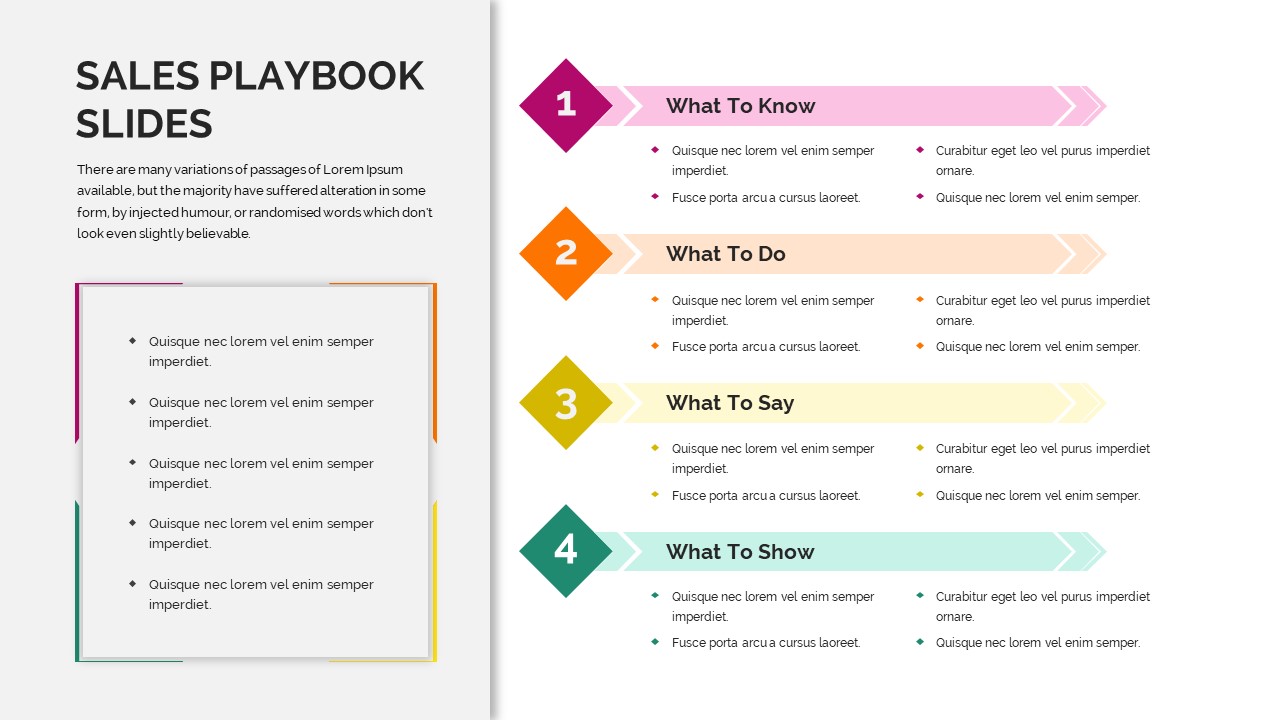
Sales Playbook Process Steps Diagram Template for PowerPoint & Google Slides
Marketing
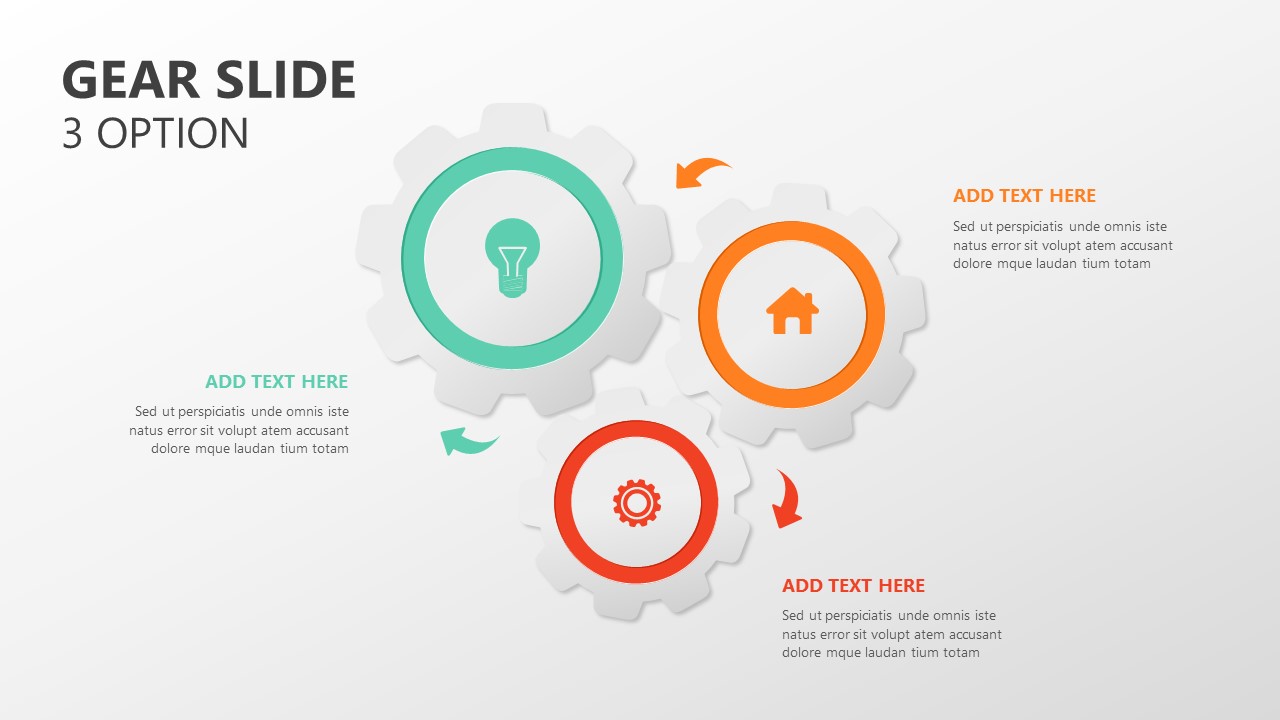
Gear Process Diagram Template for PowerPoint & Google Slides
Process
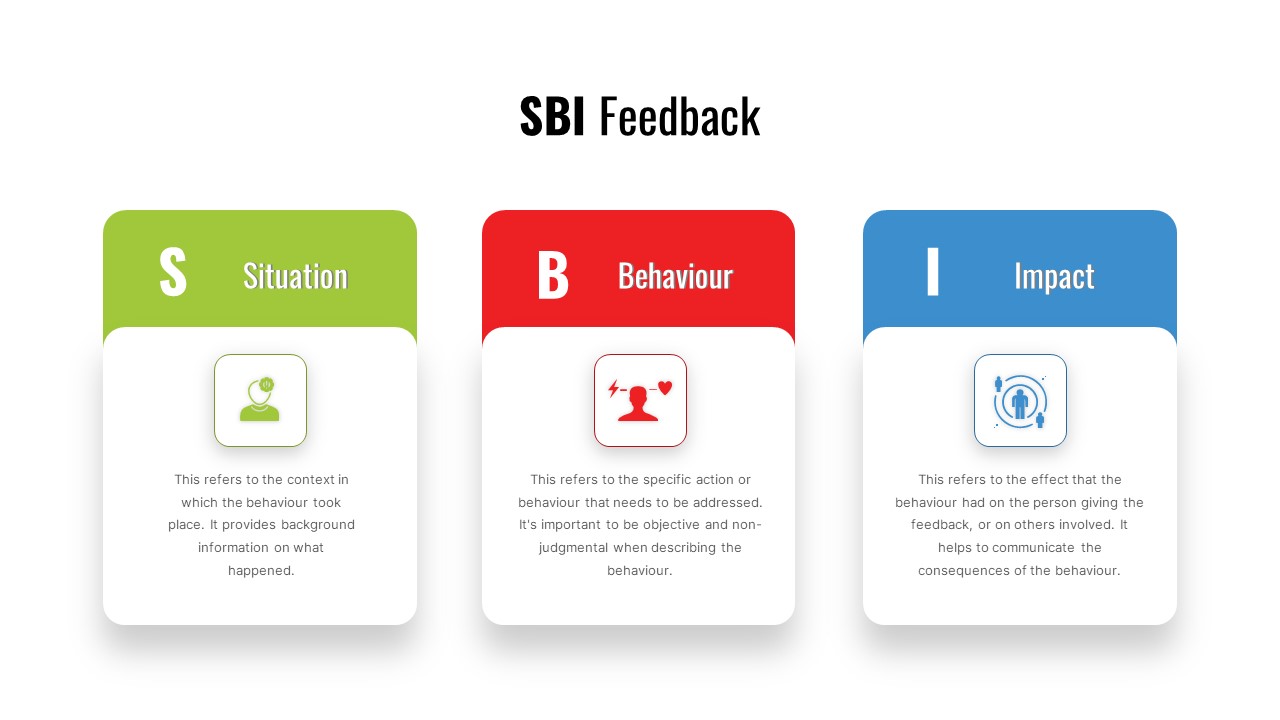
SBI Feedback Model Process Diagram Template for PowerPoint & Google Slides
Process
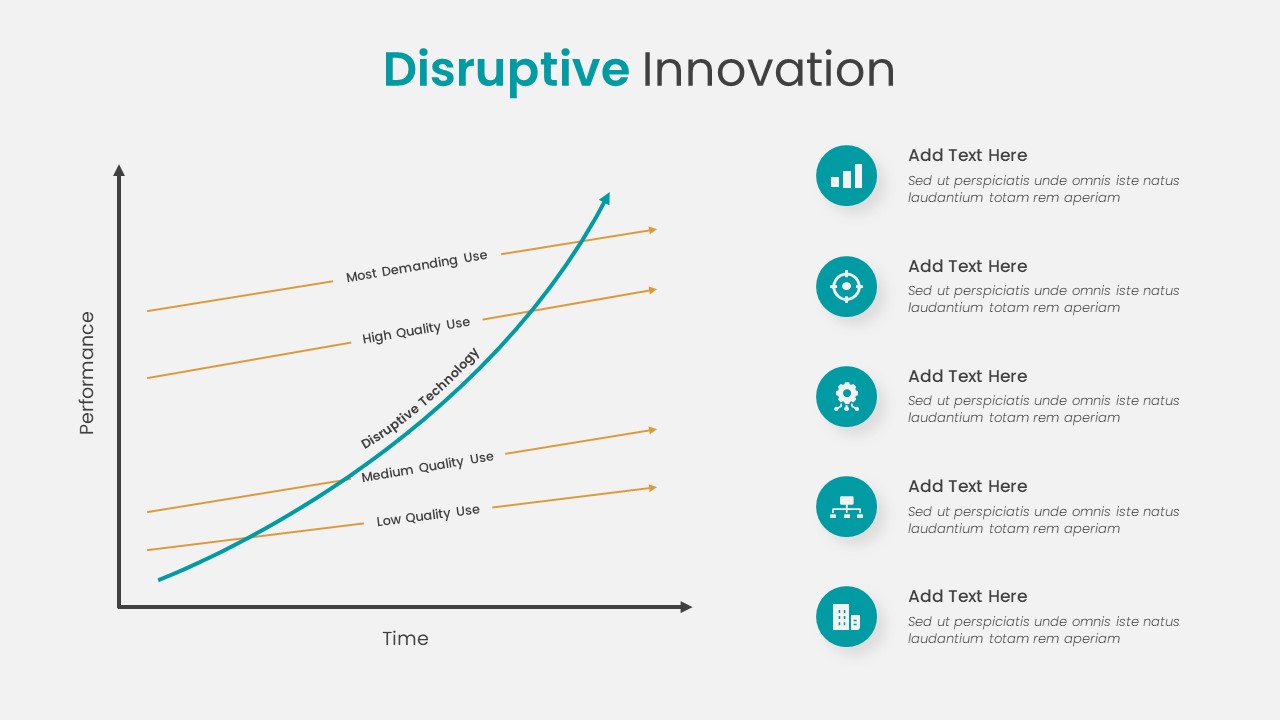
Disruptive Innovation Framework Diagram Template for PowerPoint & Google Slides
Comparison Chart
Simple Flowchart Process Diagram Template for PowerPoint & Google Slides
Flow Charts
Release Management Cycle Circular Diagram Template for PowerPoint & Google Slides
Software Development
Colorful Snake Process Diagram Template for PowerPoint & Google Slides
Process
Upside-Down Organizational Chart Diagram Template for PowerPoint & Google Slides
Org Chart
Split Framework Hexagon Diagram Slide Template for PowerPoint & Google Slides
Process
Cost-Volume-Profit Analysis Diagram Template for PowerPoint & Google Slides
Finance
VTDF Business Model Framework Diagram Template for PowerPoint & Google Slides
Business Models
Linking Business HR Strategy Circular Diagram Template for PowerPoint & Google Slides
Business Strategy
ETL Data Pipeline Workflow Diagram Template for PowerPoint & Google Slides
Process
ML Development Life Cycle Diagram Template for PowerPoint & Google Slides
Machine Learning
Emergent Strategy Diagram Framework Template for PowerPoint & Google Slides
Process
Engineering Efficiency Diagram Template for PowerPoint & Google Slides
Process
Free
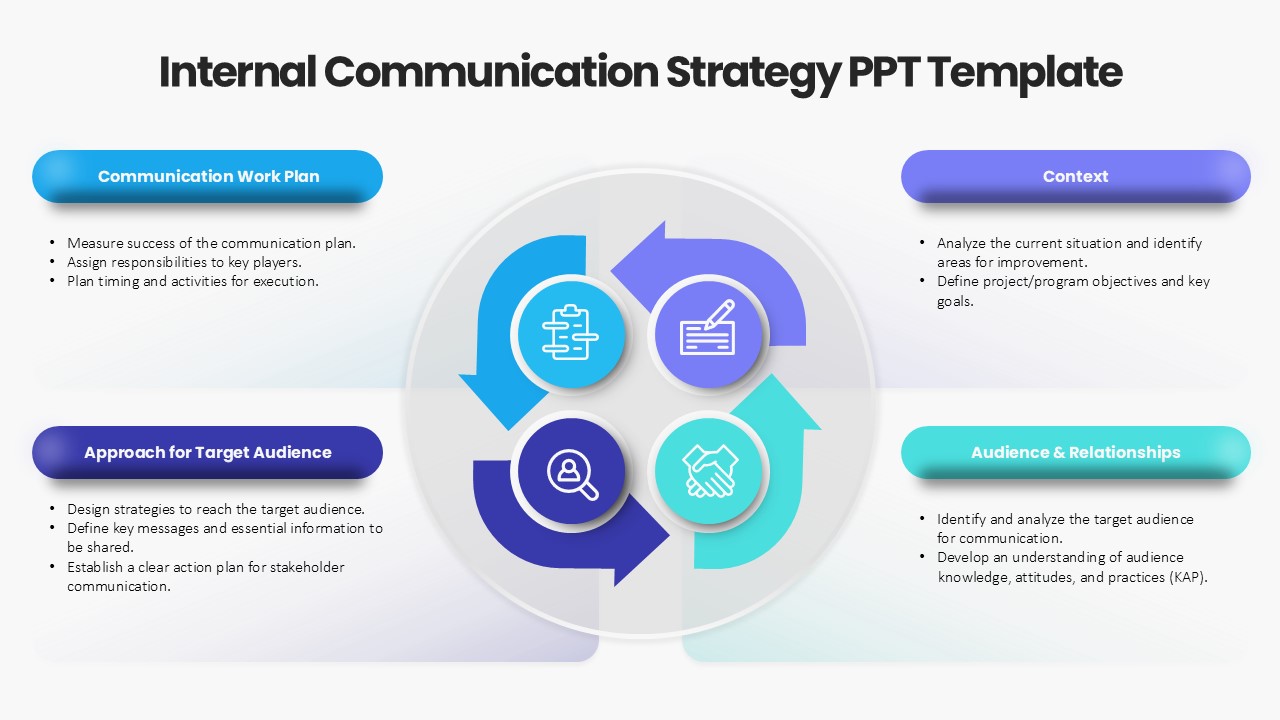
Internal Communication Strategy Diagram Template for PowerPoint & Google Slides
Process
Integrative Thinking Comparison Diagram Template for PowerPoint & Google Slides
Comparison
Market Share Comparison Diagram Template for PowerPoint & Google Slides
Comparison Chart
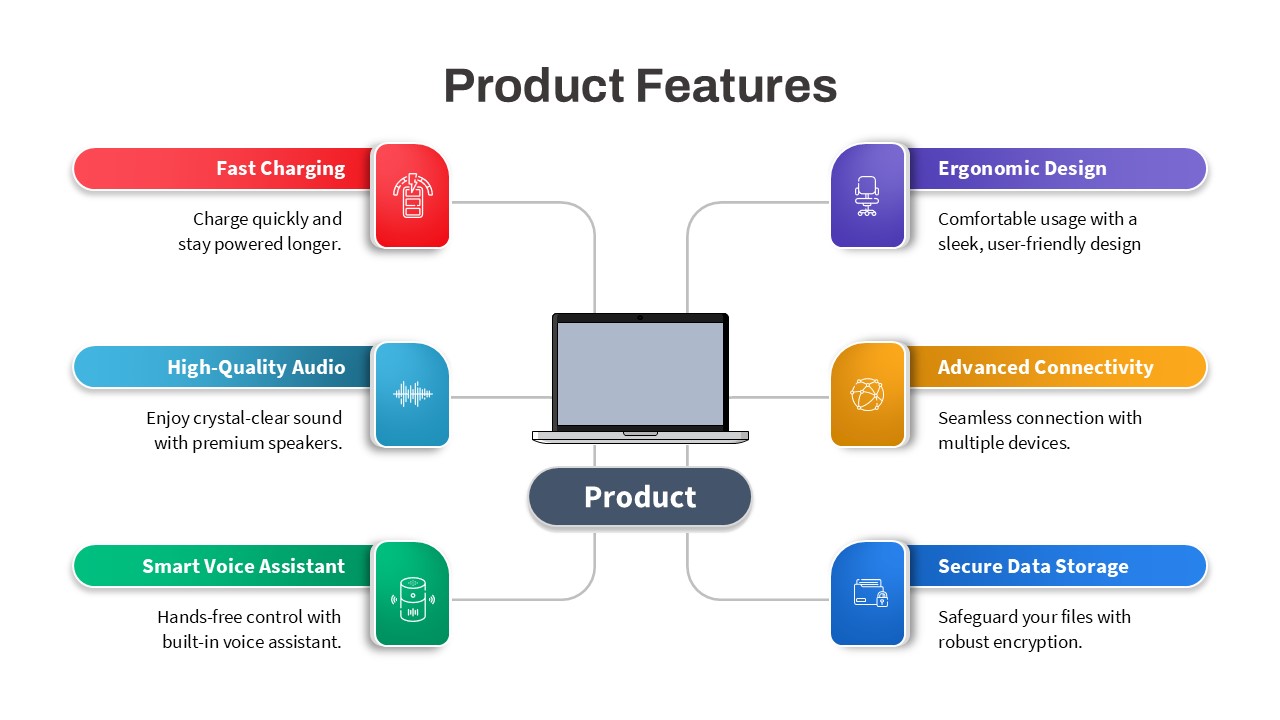
Product Features Diagram Template for PowerPoint & Google Slides
Process
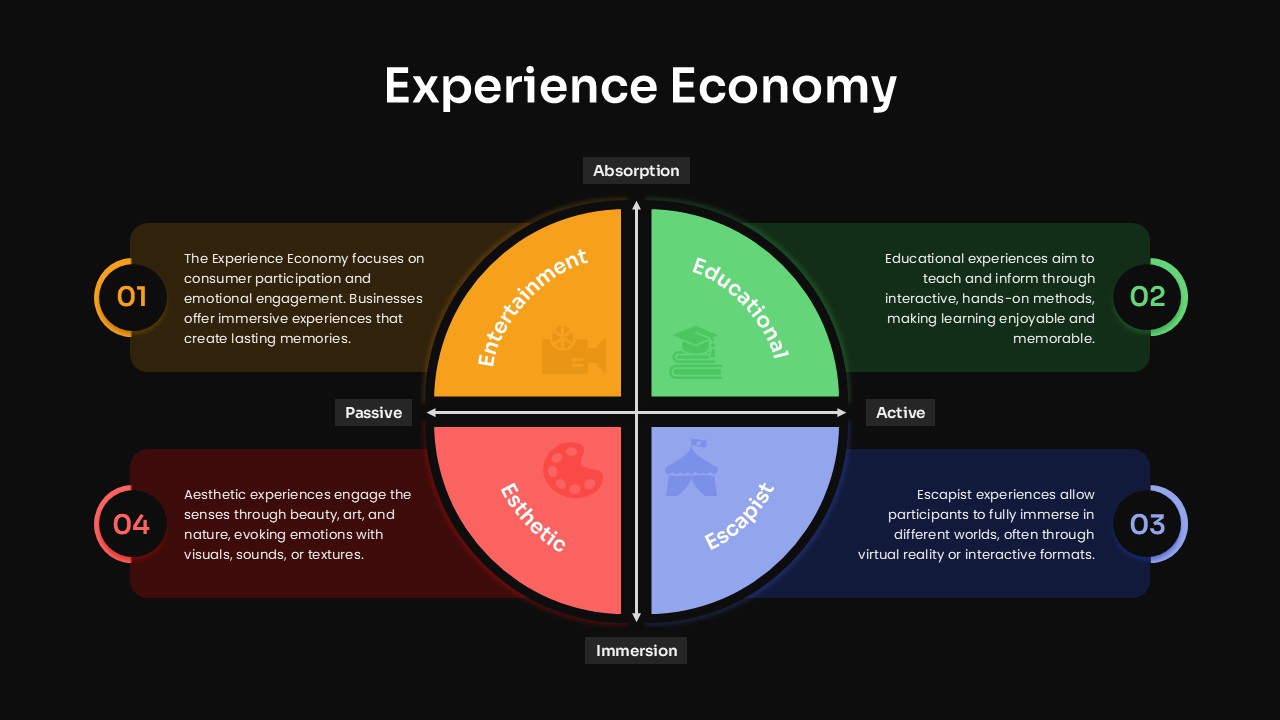
Experience Economy Quadrant Diagram Template for PowerPoint & Google Slides
Circular
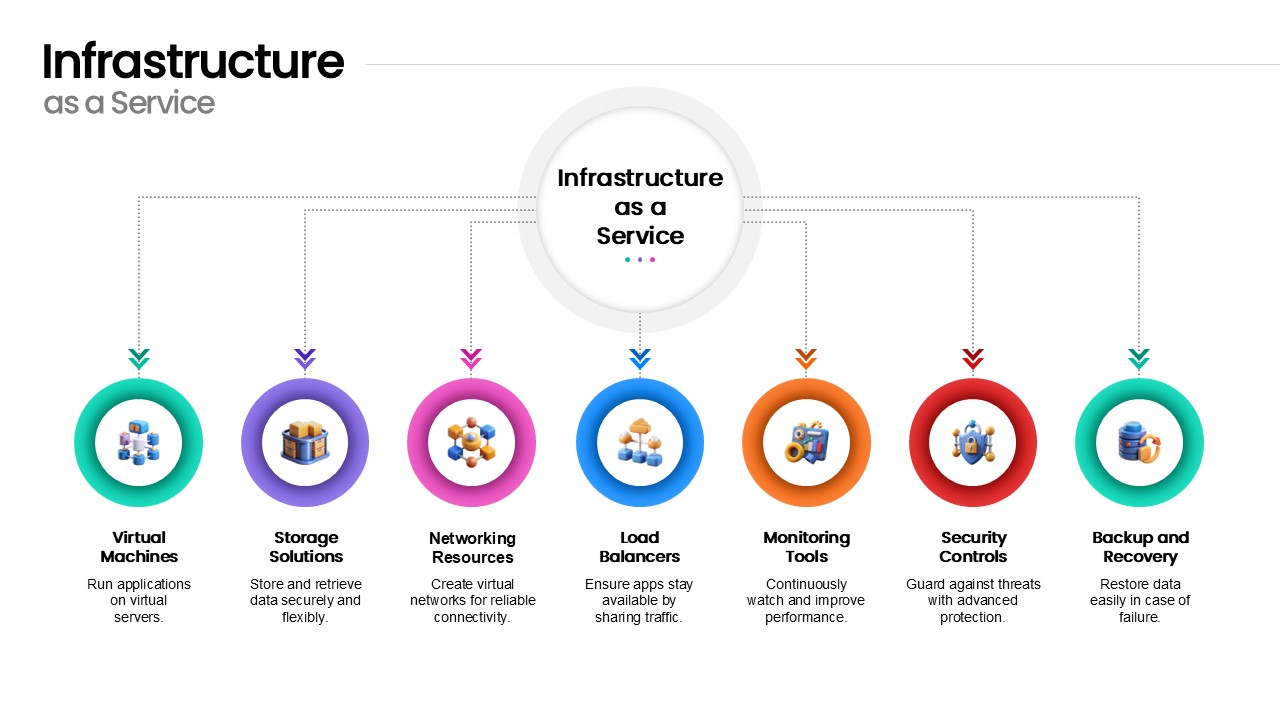
Infrastructure as a Service Diagram Template for PowerPoint & Google Slides
Cloud Computing
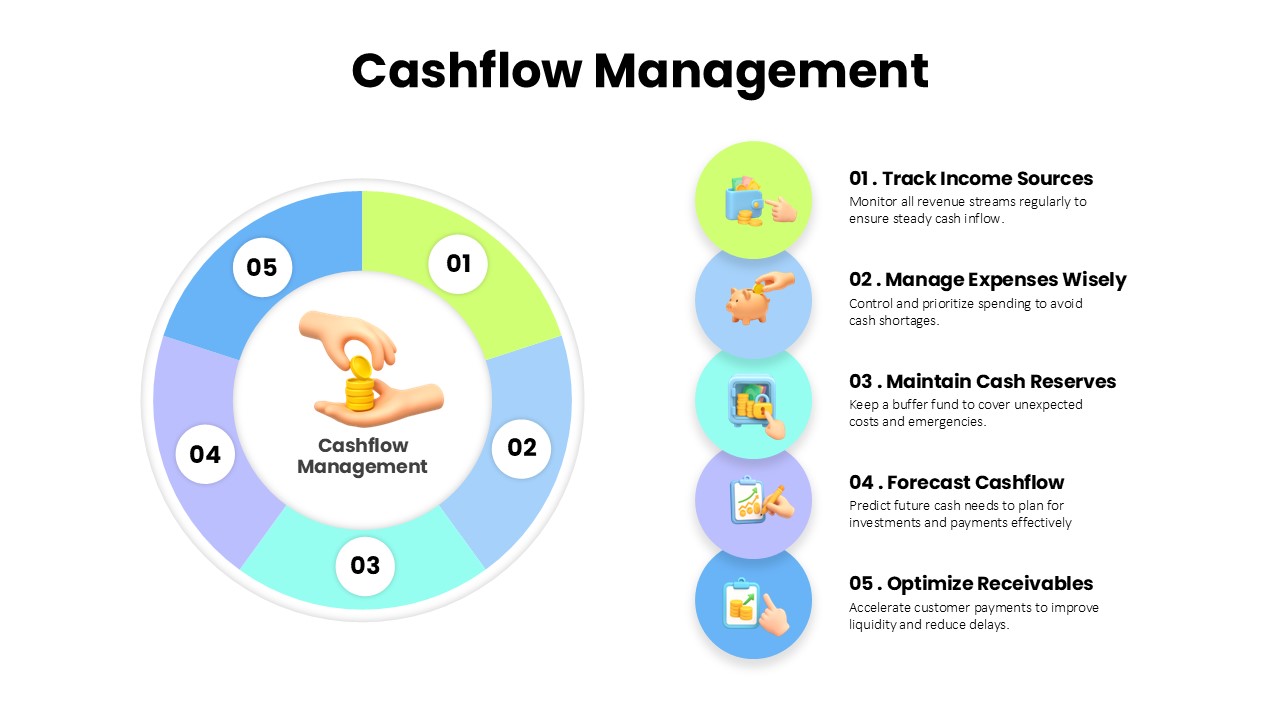
Cashflow Management Cycle Diagram Template for PowerPoint & Google Slides
Finance
Resume Screening Process Flow Diagram Template for PowerPoint & Google Slides
Process
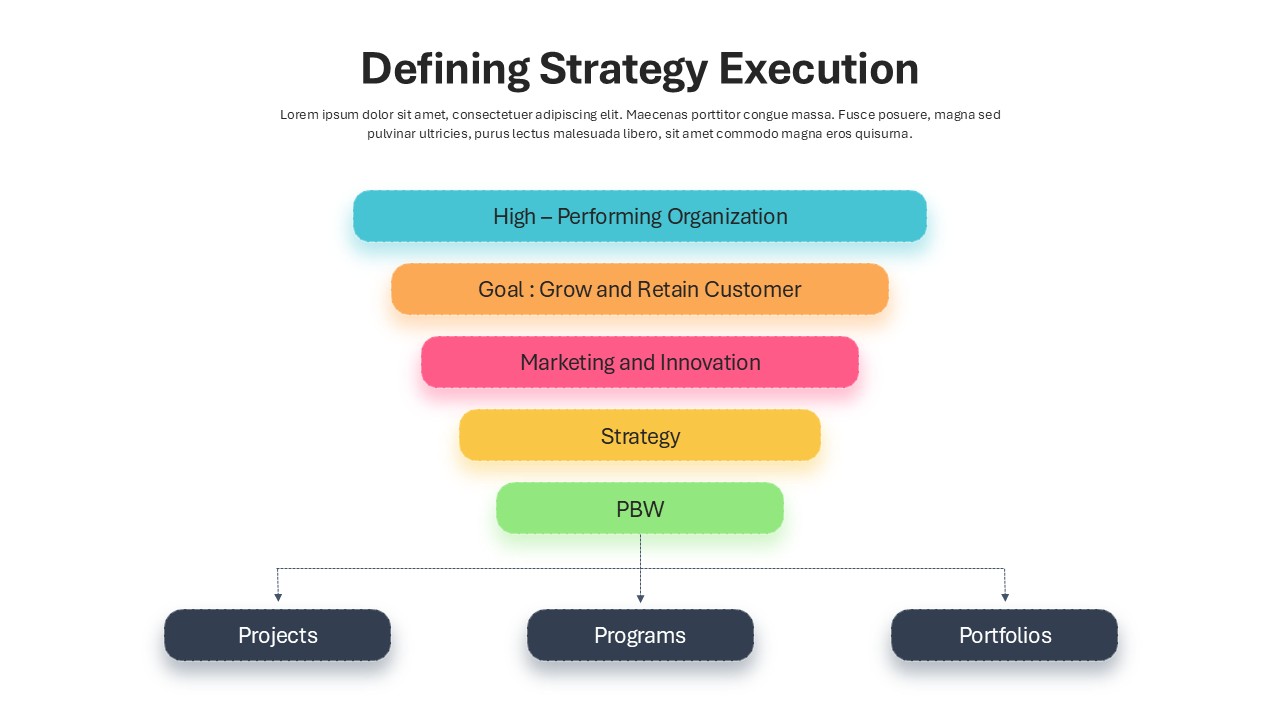
Defining Strategy Execution Diagram Template for PowerPoint & Google Slides
Funnel
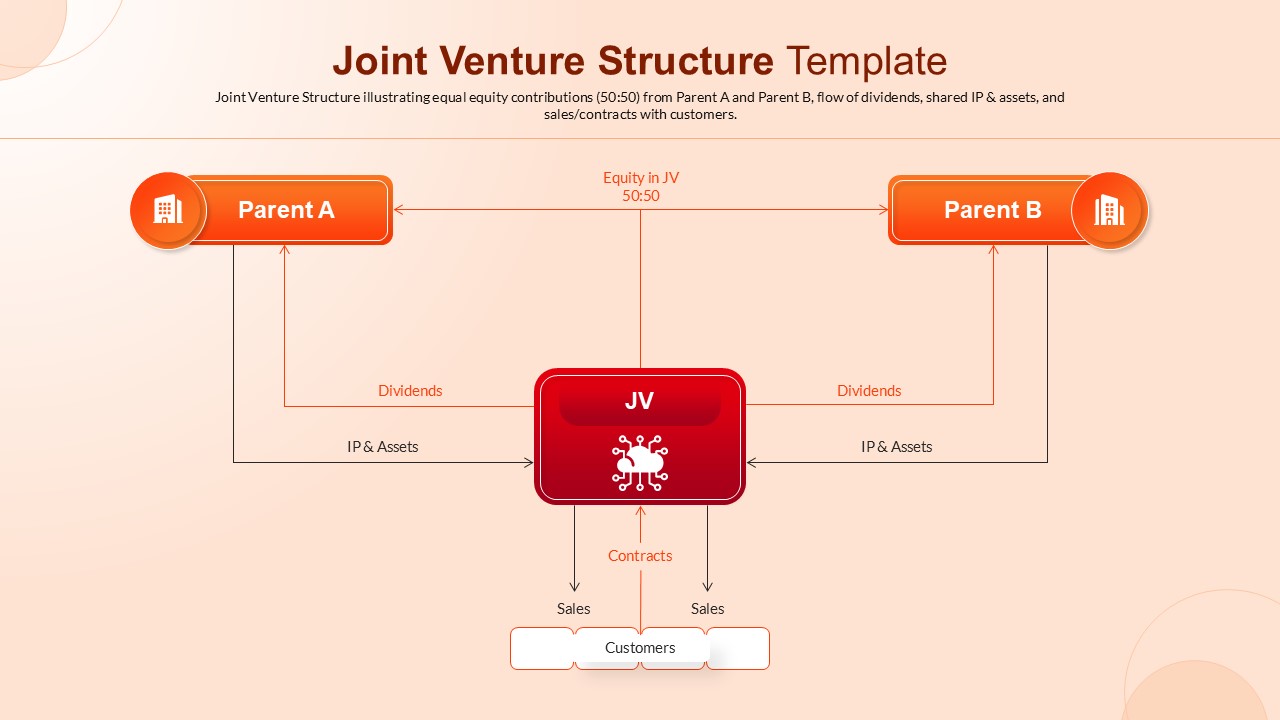
Joint Venture Structure Diagram Template for PowerPoint & Google Slides
Flow Charts
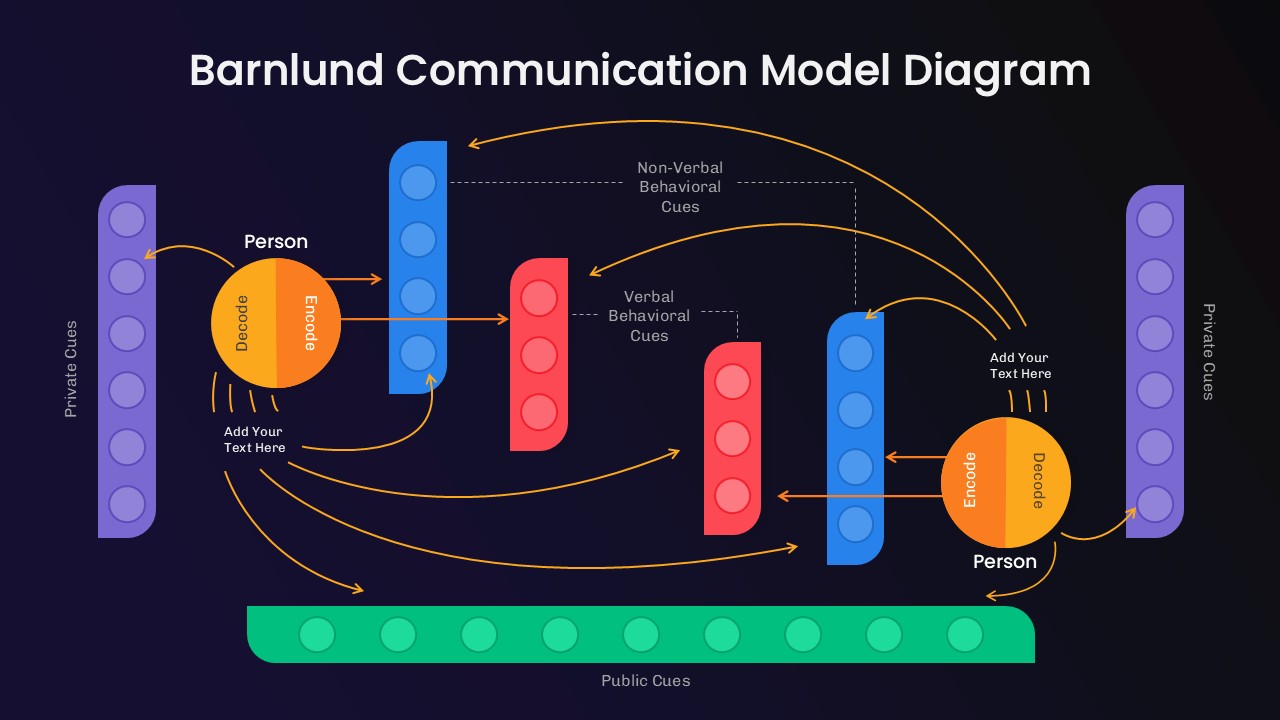
Barnlund Communication Model Diagram Template for PowerPoint & Google Slides
Process
Materiality Assessment Matrix Diagram Template for PowerPoint & Google Slides
Risk Management