Learning Curve Performance Growth Chart Template for PowerPoint & Google Slides


Description
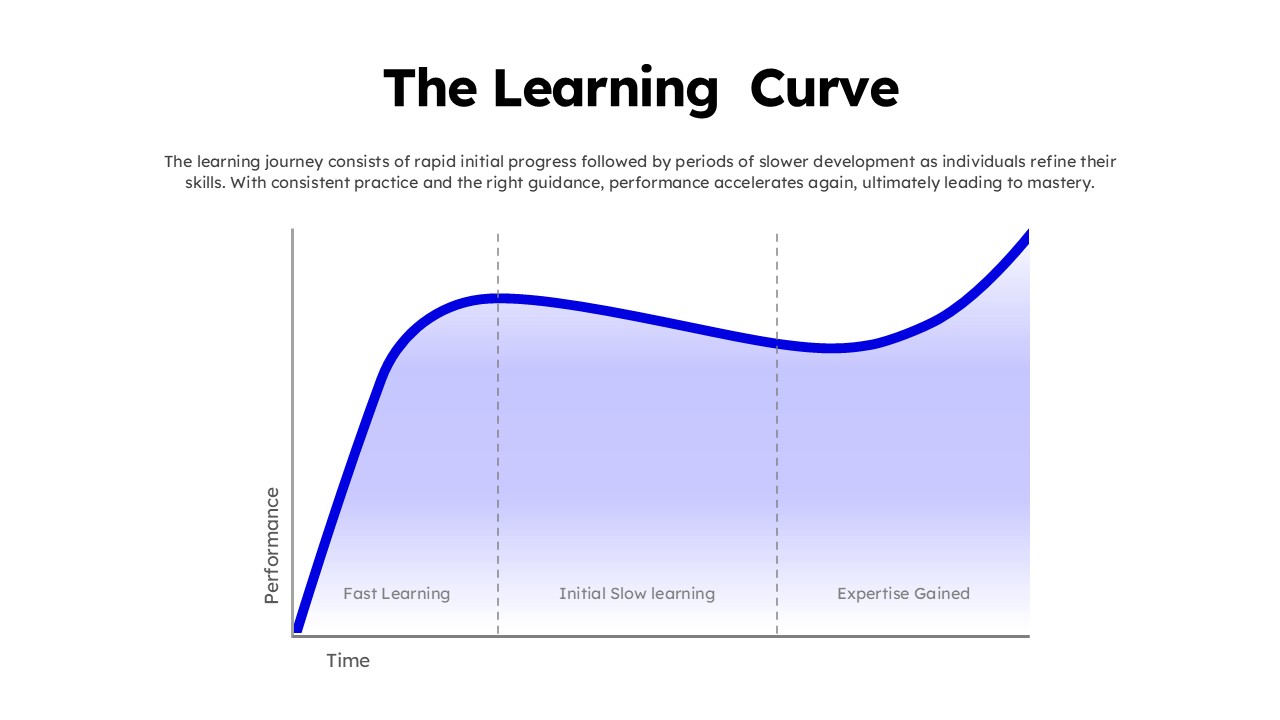
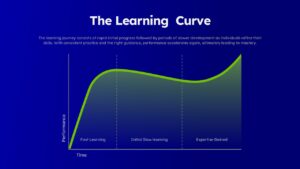
Visualize skill development and performance progression with this professionally designed Learning Curve slide. Featuring a smooth, upward-trending curve set against a bold dark blue background, this template clearly illustrates the stages of growth over time—from fast initial learning to slower refinement and eventual expertise. The layout includes clearly marked phases such as “Fast Learning,” “Initial Slow Learning,” and “Expertise Gained,” separated by subtle vertical dividers for enhanced clarity and storytelling.
The clean axis labels for Time and Performance make the chart intuitive and presentation-ready, while the vibrant green curve draws attention to progress and improvement. The gradient fill beneath the curve adds depth and visual interest without overwhelming the message. Fully editable shapes, text placeholders, and colors allow you to tailor the slide to training sessions, performance reviews, or strategic discussions. Optimized for both PowerPoint and Google Slides, this template maintains design integrity across devices and screen sizes.
Who is it for
This slide is ideal for trainers, educators, HR professionals, and team leaders explaining employee development or skill acquisition. Business consultants, startup founders, and project managers can use it to demonstrate growth trajectories, onboarding progress, or capability building initiatives.
Other Uses
Beyond learning and development, repurpose this slide to showcase business growth phases, product adoption cycles, change management progress, or performance improvement plans. It can also support academic lectures, coaching programs, and personal development workshops where gradual mastery and long-term progress need to be clearly communicated.
Login to download this file

Item ID
SB05743Designed By
Naseeba
Related Templates

Growth Curve Line Chart Visualization Template for PowerPoint & Google Slides
Charts
Greiner’s Growth Model Curve template for PowerPoint & Google Slides
Infographics
Three-Stage S Curve Growth Diagram Template for PowerPoint & Google Slides
Process
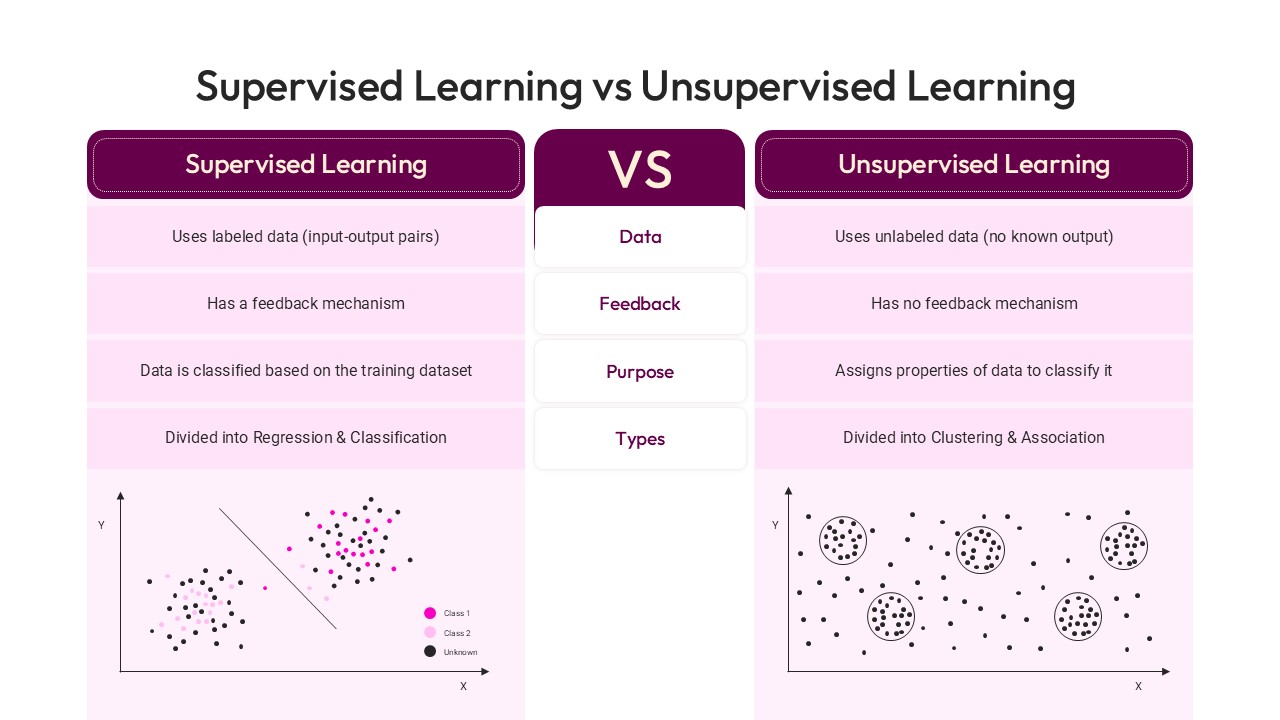
Supervised Learning vs Unsupervised Learning template for PowerPoint & Google Slides
Technology

Growth Arrow for Progress & Growth template for PowerPoint & Google Slides
Arrow
Profit Performance Trend Chart Template for PowerPoint & Google Slides
Finance
Sales vs Budget Performance Chart Template for PowerPoint & Google Slides
Bar/Column
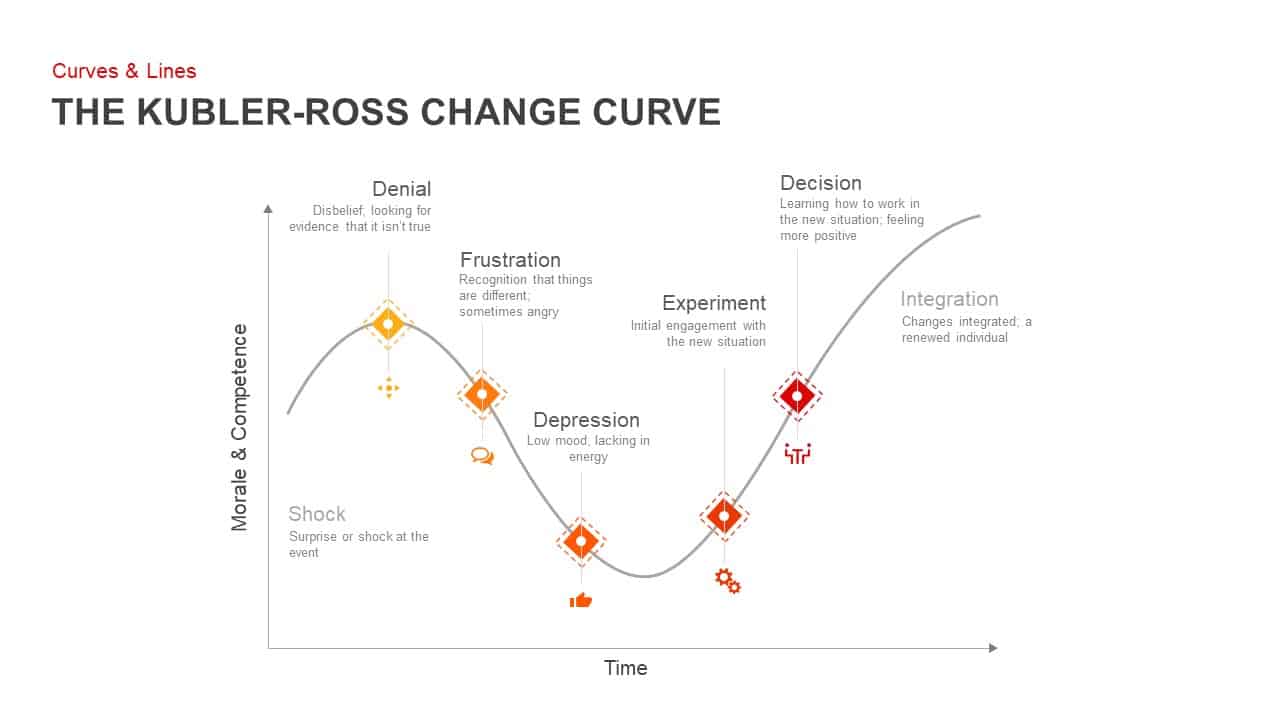
Kubler-Ross Change Curve Diagram Template for PowerPoint & Google Slides
Timeline
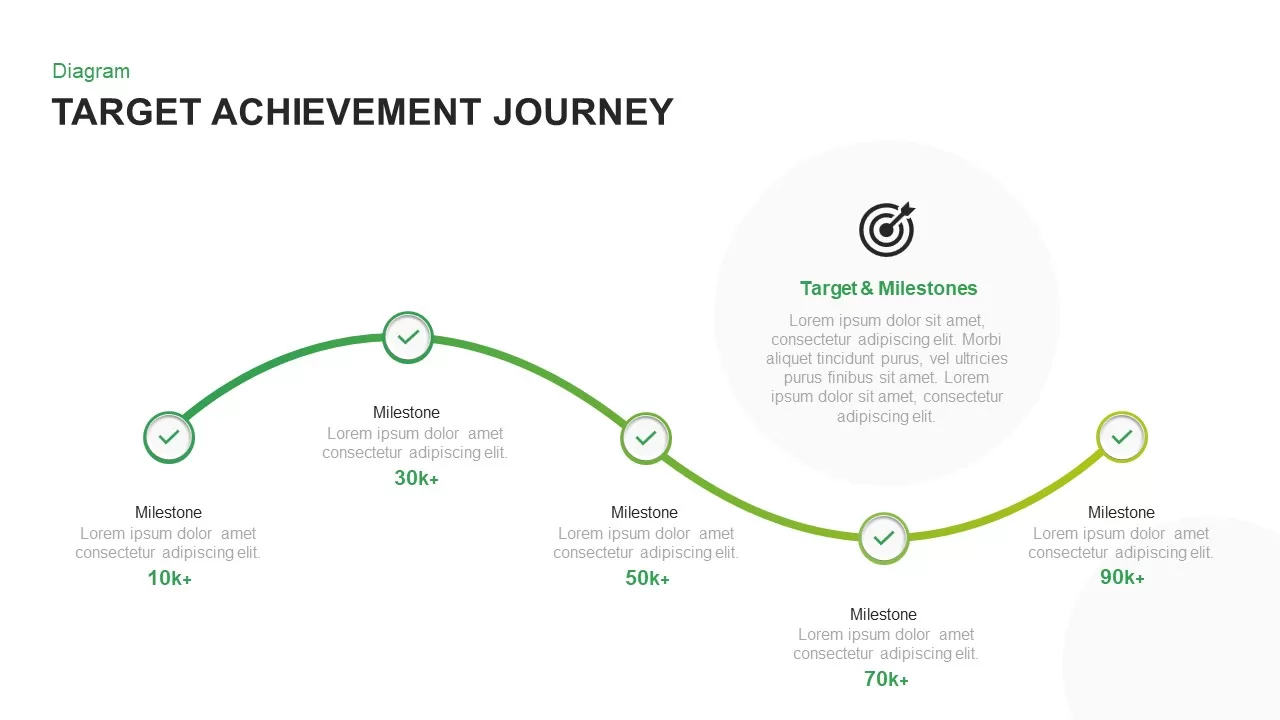
Target Achievement Milestone Curve Template for PowerPoint & Google Slides
Roadmap

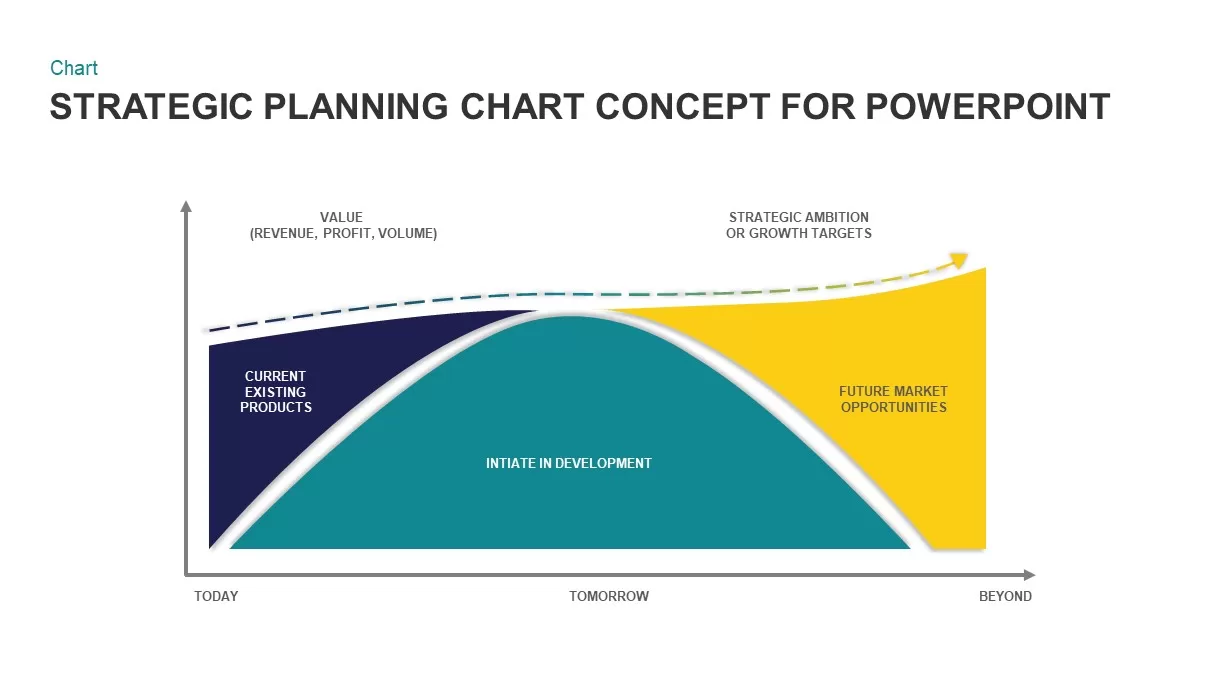
Strategic Planning Curve Diagram Template for PowerPoint & Google Slides
Charts
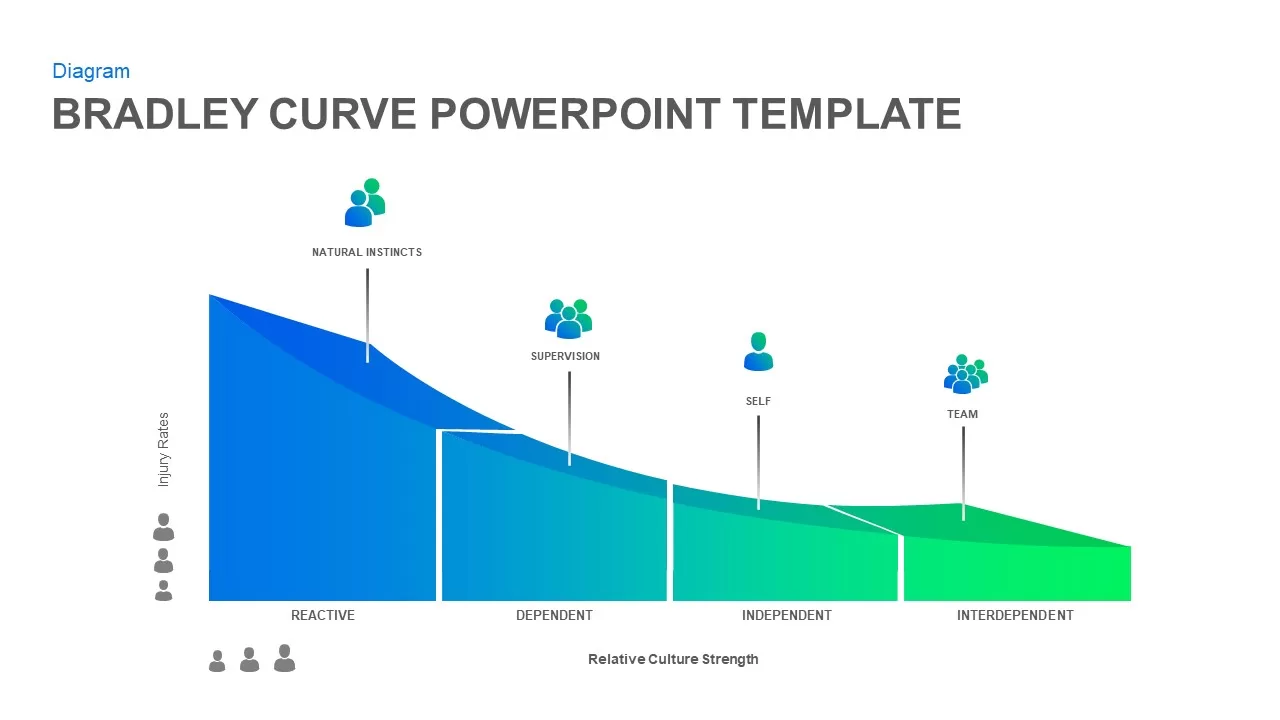
Bradley Curve Infographic Template for PowerPoint & Google Slides
Infographics
Snake Shaped Curve Diagram template for PowerPoint & Google Slides
Business
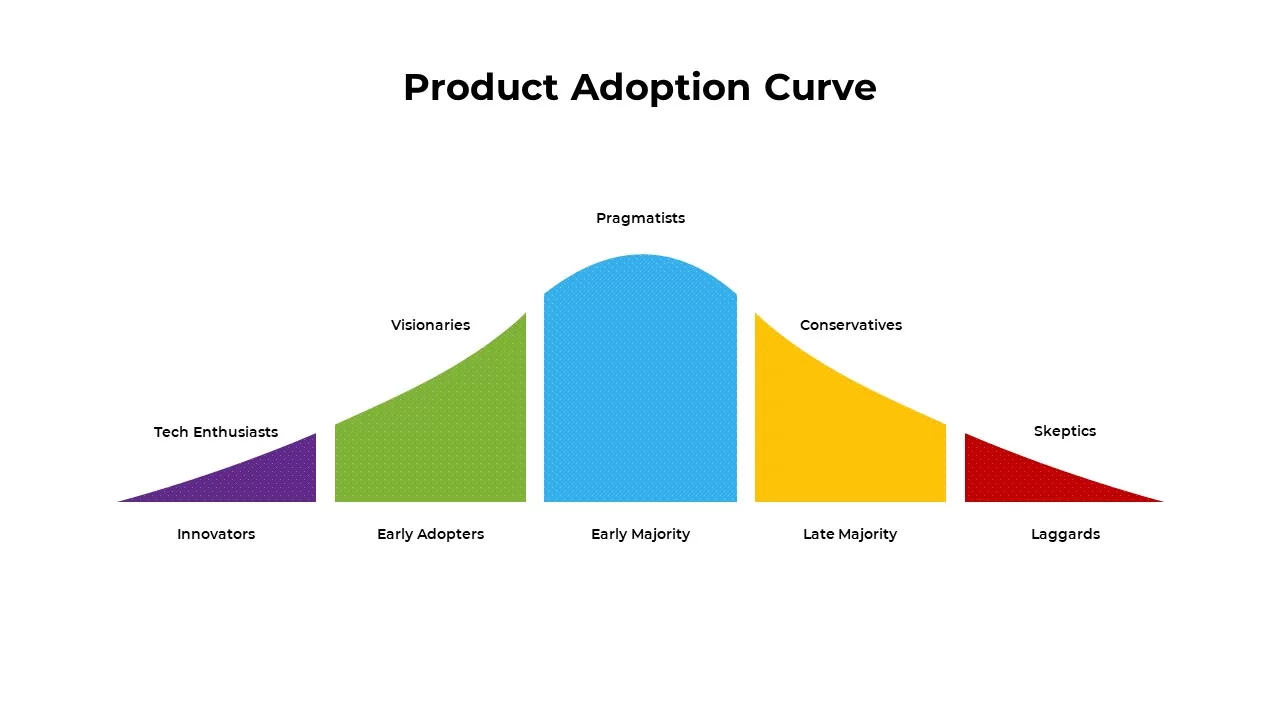
Product Adoption Curve Template for PowerPoint & Google Slides
Process
8-Bell Curve Infographic Slide Template for PowerPoint & Google Slides
Comparison Chart
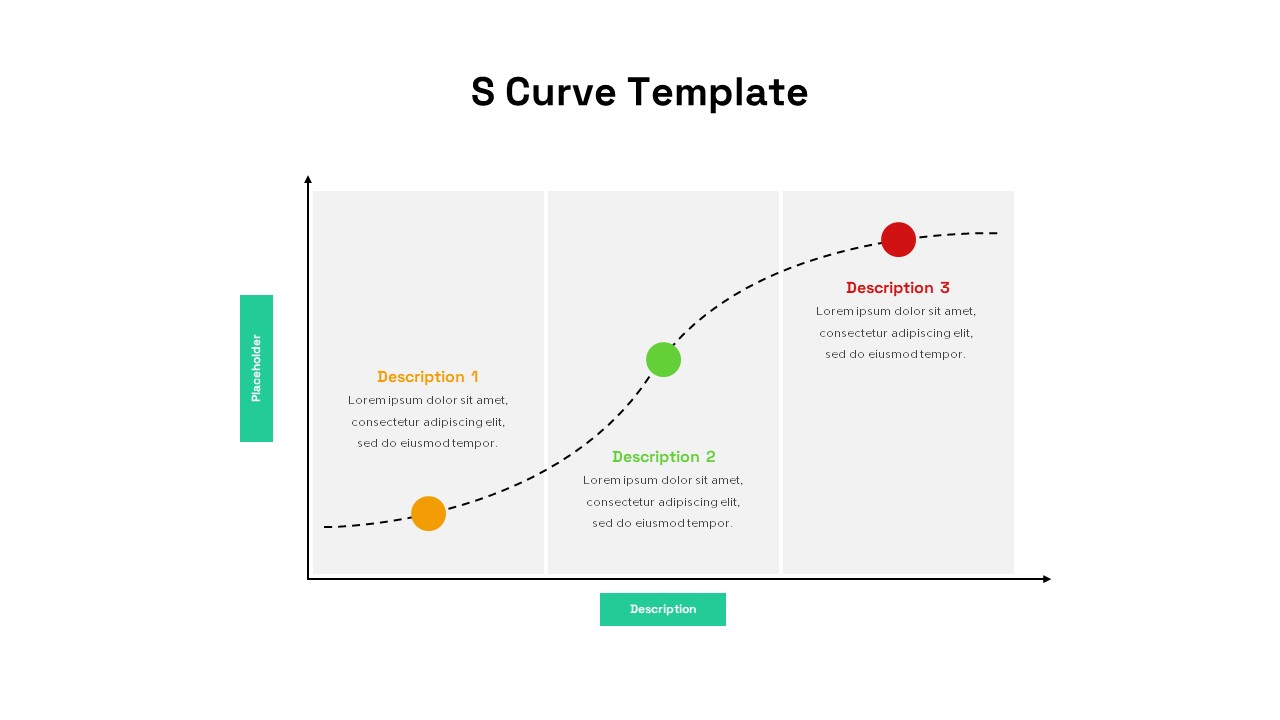
S-Curve Progression Framework Diagram Template for PowerPoint & Google Slides
Charts
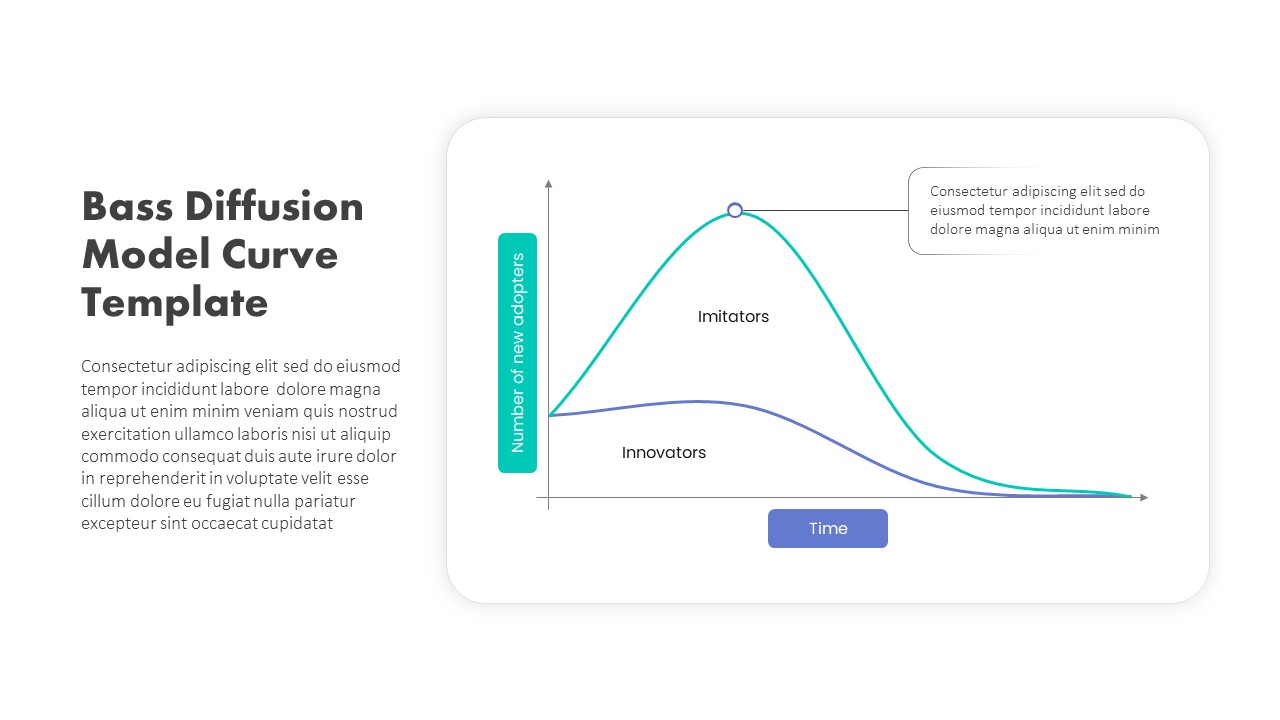
Bass Diffusion Model Curve for Adoption Template for PowerPoint & Google Slides
Comparison Chart
Experience Curve Analysis Diagram Template for PowerPoint & Google Slides
Business Strategy
Economies of Scale Cost Curve Comparison Template for PowerPoint & Google Slides
Comparison Chart
Gartner Hype Cycle Adoption Curve Diagram Template for PowerPoint & Google Slides
Infographics
Free Learning Retention Pyramid Chart Template for PowerPoint & Google Slides
Pyramid
Free
Google Ads Optimization & Performance Infographic Template for PowerPoint & Google Slides
Digital Marketing
Business Growth Metaphor Chart Template for PowerPoint & Google Slides
Business
Annual Growth Trend Analysis Chart template for PowerPoint & Google Slides
Business Report
Sales Growth Comparison Chart & Table Template for PowerPoint & Google Slides
Bar/Column

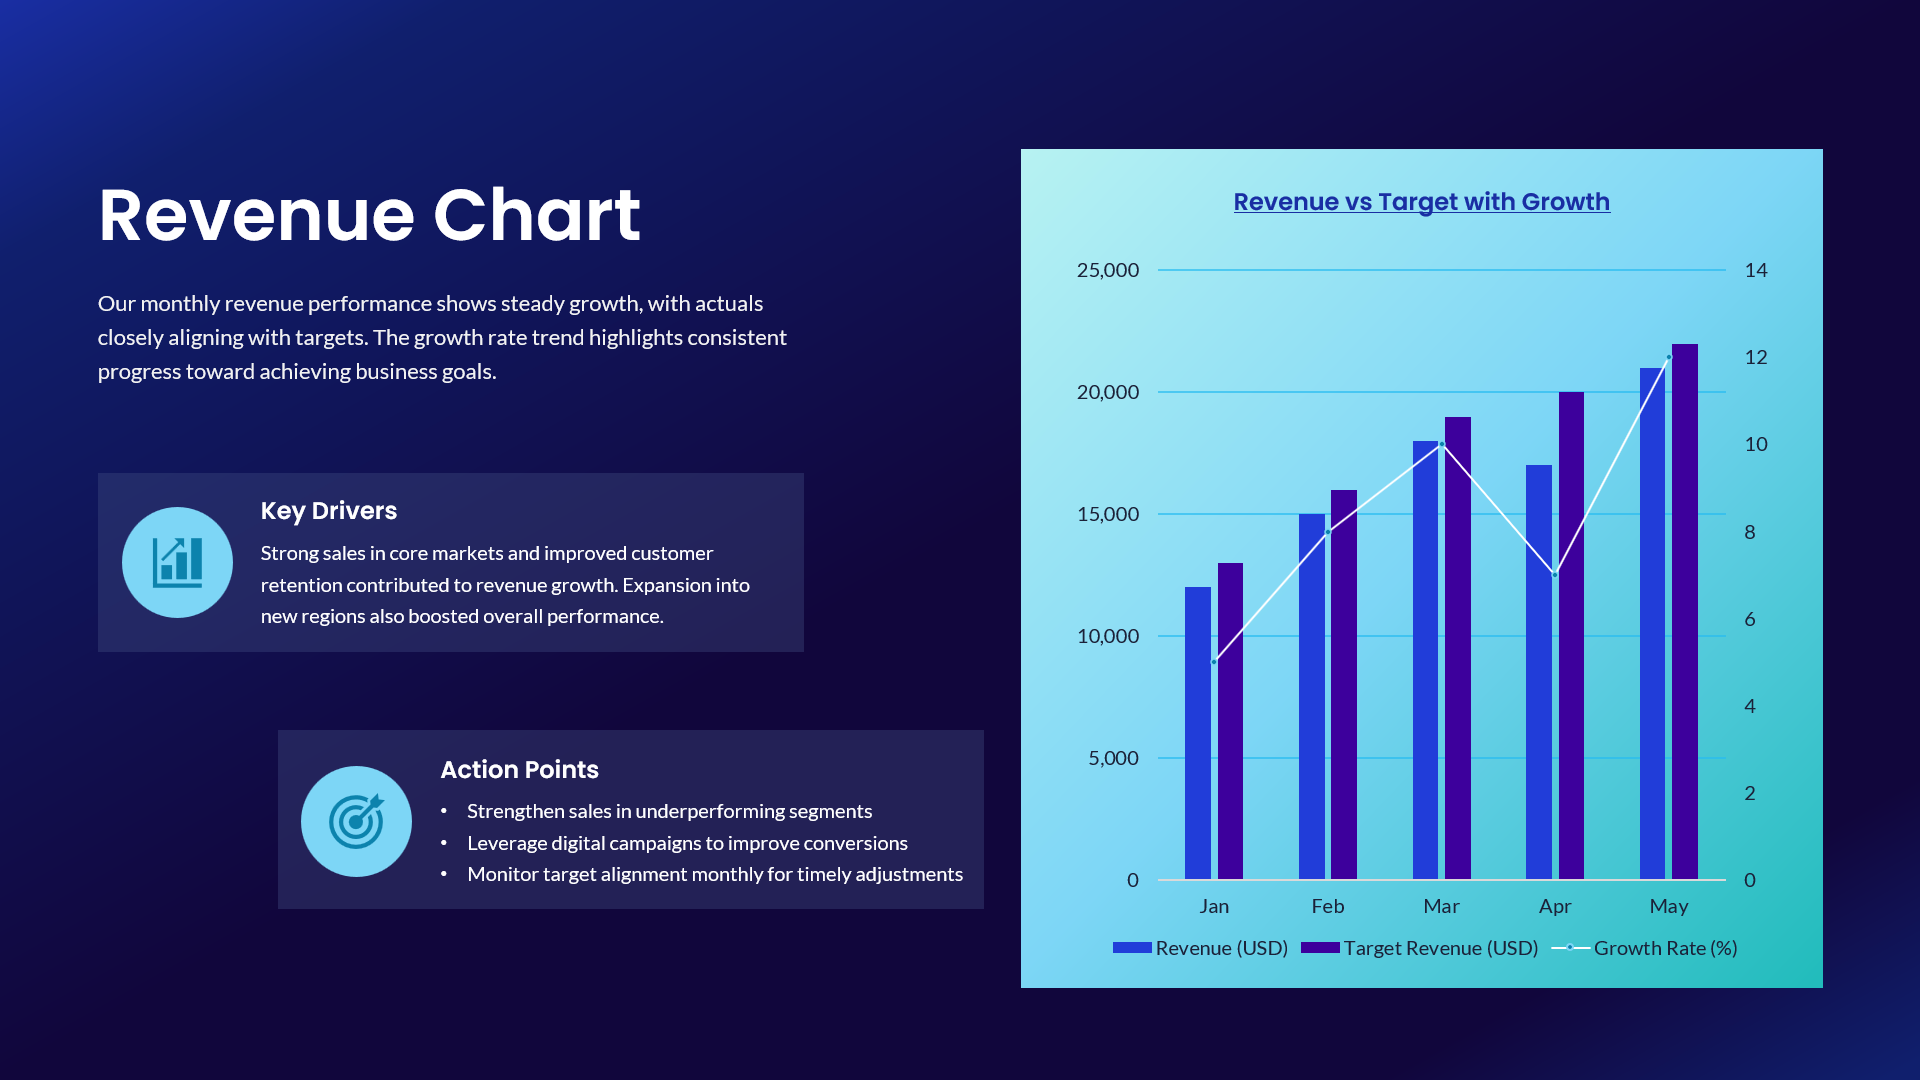
Revenue vs Target Growth Chart Template for PowerPoint & Google Slides
Revenue

Website Performance Dashboard template for PowerPoint & Google Slides
Charts
Sales Performance Dashboard template for PowerPoint & Google Slides
Business Report
Performance Review Process Management Cycle template for PowerPoint & Google Slides
Employee Performance
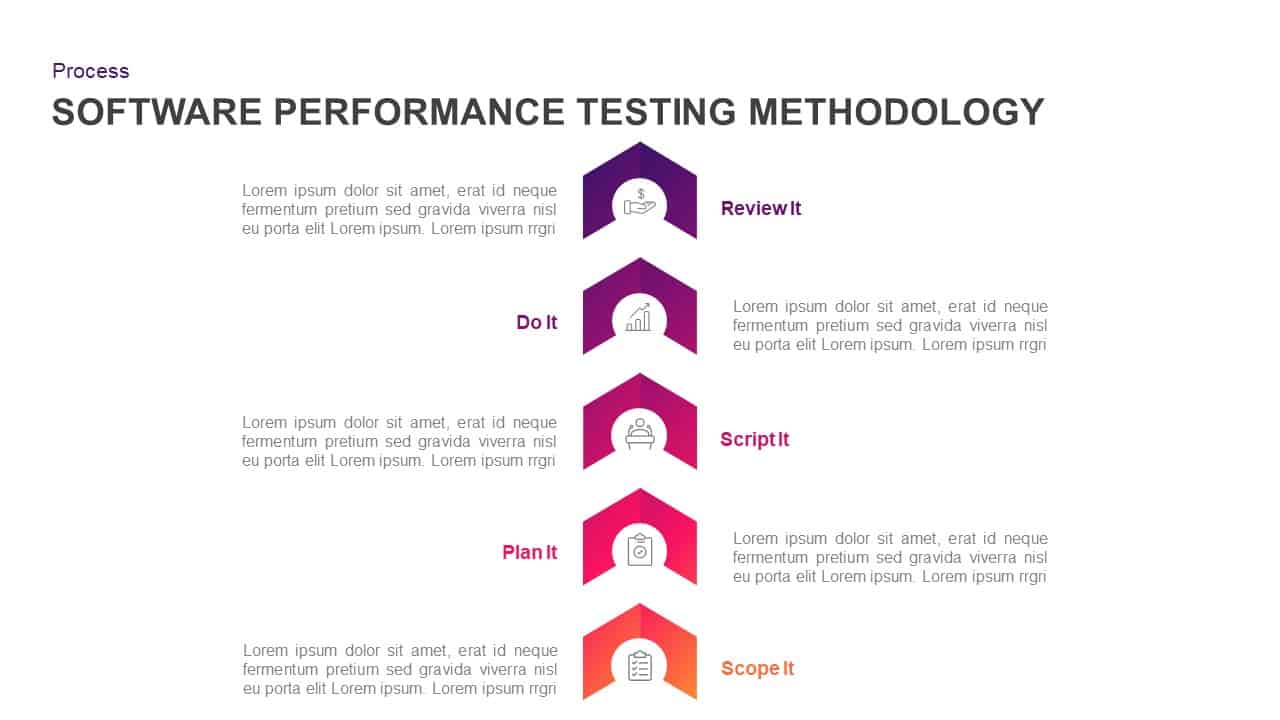
Software Performance Testing Methodology Template for PowerPoint & Google Slides
Process
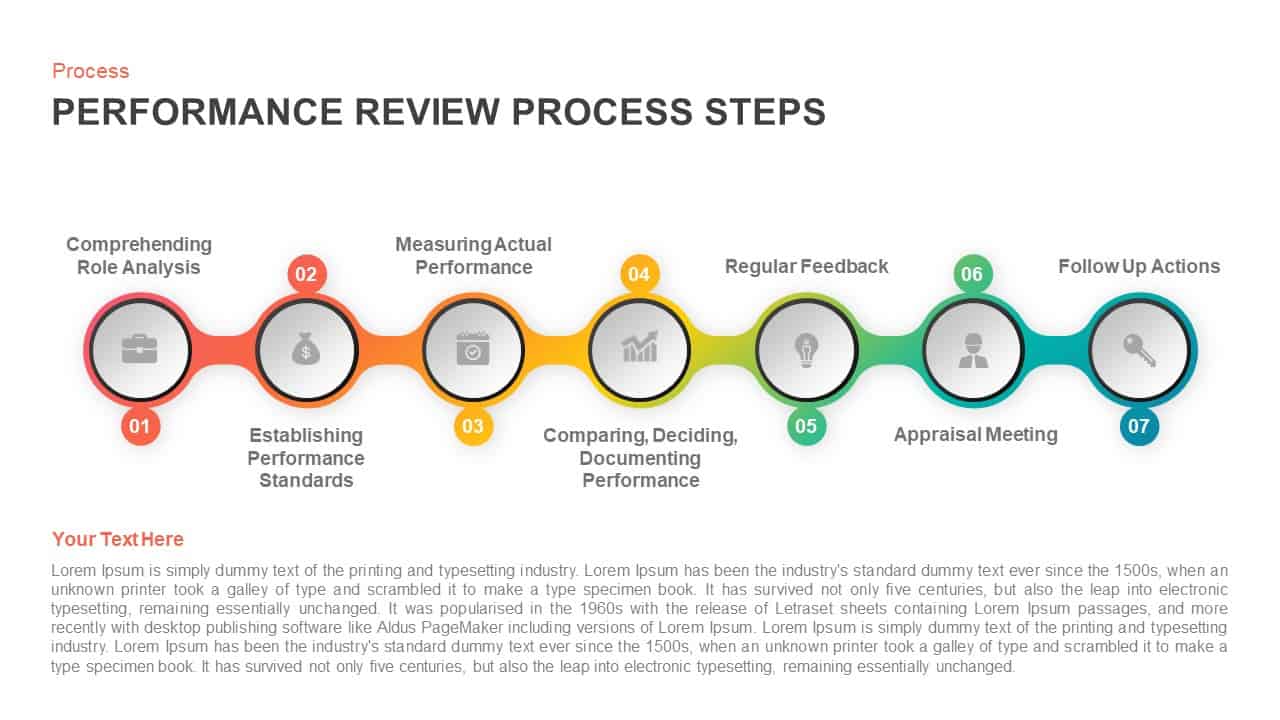
Performance Review Process Steps Template for PowerPoint & Google Slides
Employee Performance
Social Media Performance Dashboard Template for PowerPoint & Google Slides
Bar/Column
Professional Sales Performance Report Template for PowerPoint & Google Slides
Business Report
Performance Review Progress Management Template for PowerPoint & Google Slides
Process
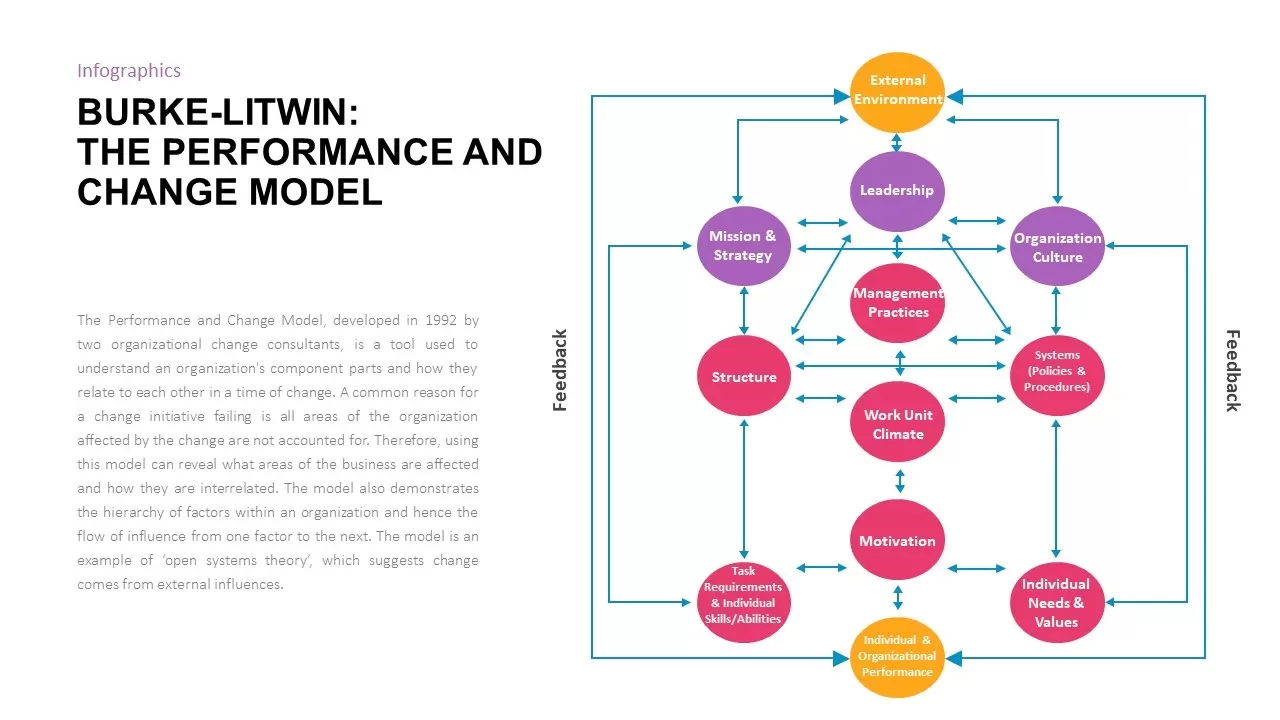
Burke-Litwin Performance and Change Model template for PowerPoint & Google Slides
Infographics
Corporate Performance Management Template for PowerPoint & Google Slides
Pitch Deck
Performance KPI Dashboard Slide Template for PowerPoint & Google Slides
Business Report
Free Stock Market Performance Overview template for PowerPoint & Google Slides
Finance
Free
9-Box Matrix for Performance & Potential Template for PowerPoint & Google Slides
Employee Performance
Benchmarking Performance Score Template for PowerPoint & Google Slides
Comparison Chart
Website Performance Monitoring Dashboard Template for PowerPoint & Google Slides
Business Report
AMO Performance Model Feedback Diagram Template for PowerPoint & Google Slides
Employee Performance
Hits and Misses Performance Comparison Template for PowerPoint & Google Slides
Comparison
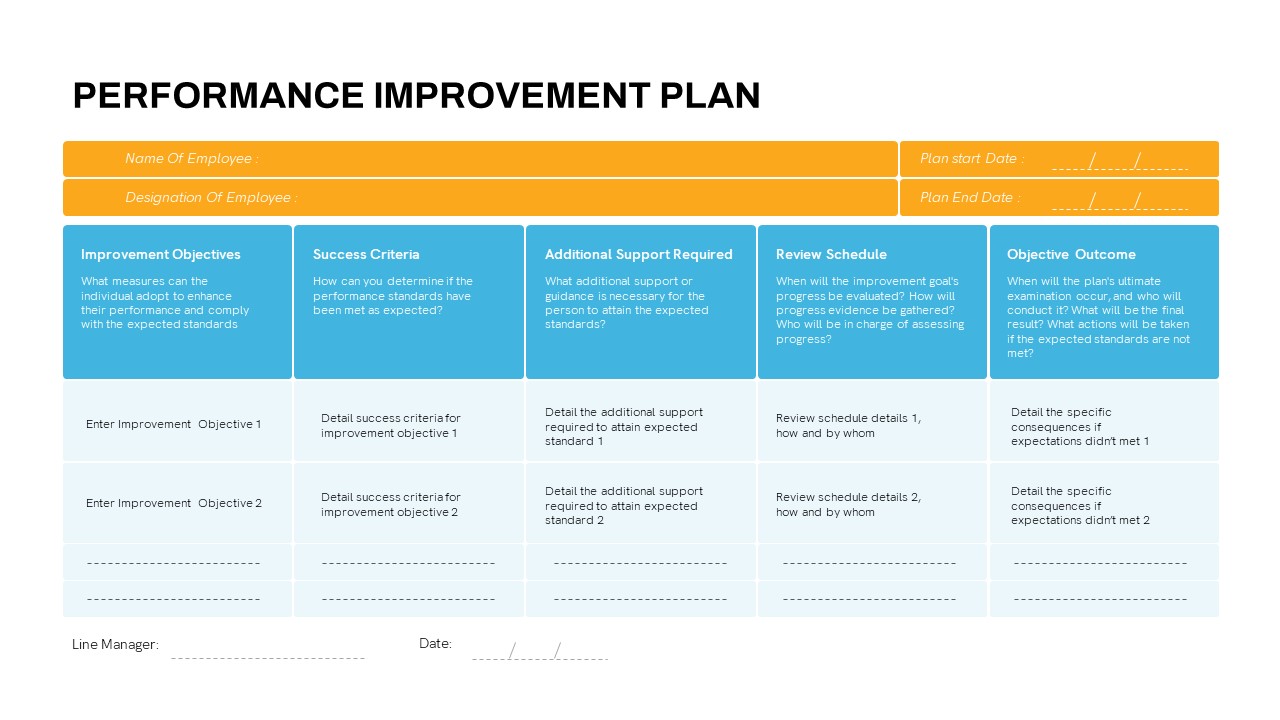
Detailed Performance Improvement Plan Template for PowerPoint & Google Slides
Employee Performance
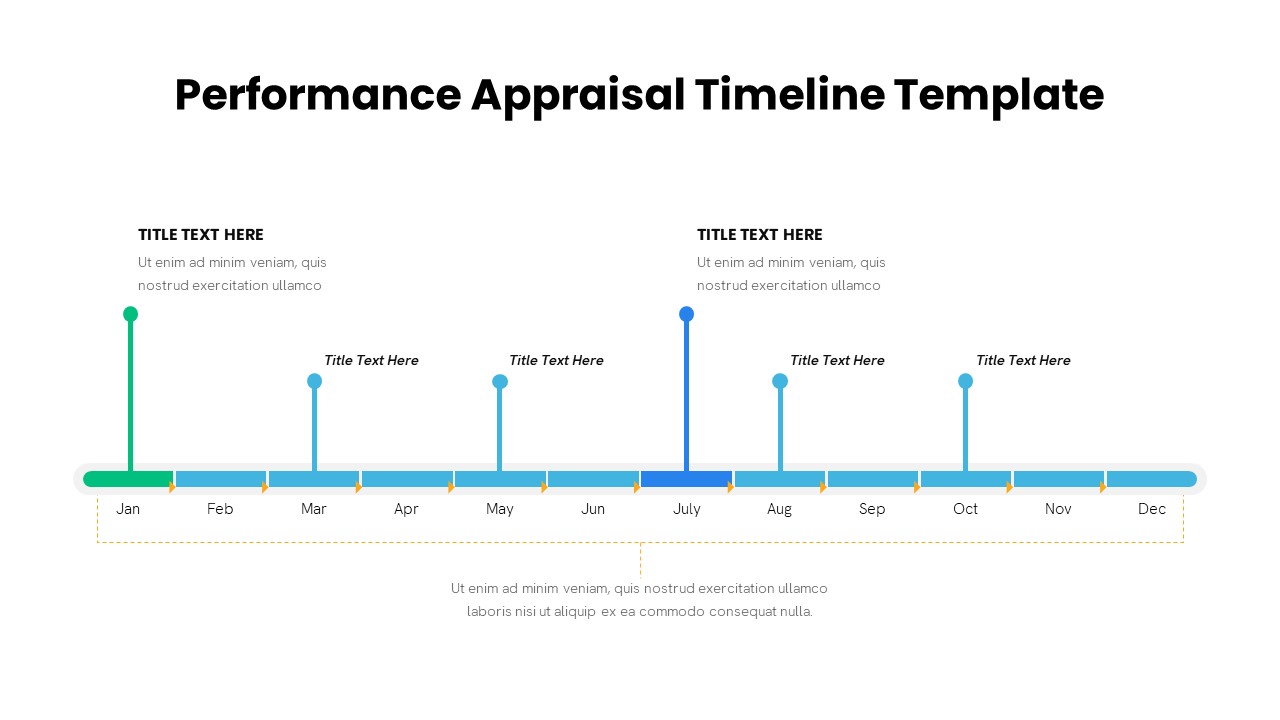
Performance Appraisal Timeline Diagram Template for PowerPoint & Google Slides
Timeline
DevOps KPI Dashboard Performance Metrics Template for PowerPoint & Google Slides
Software Development
Monthly Sales Performance Dashboard Template for PowerPoint & Google Slides
Charts
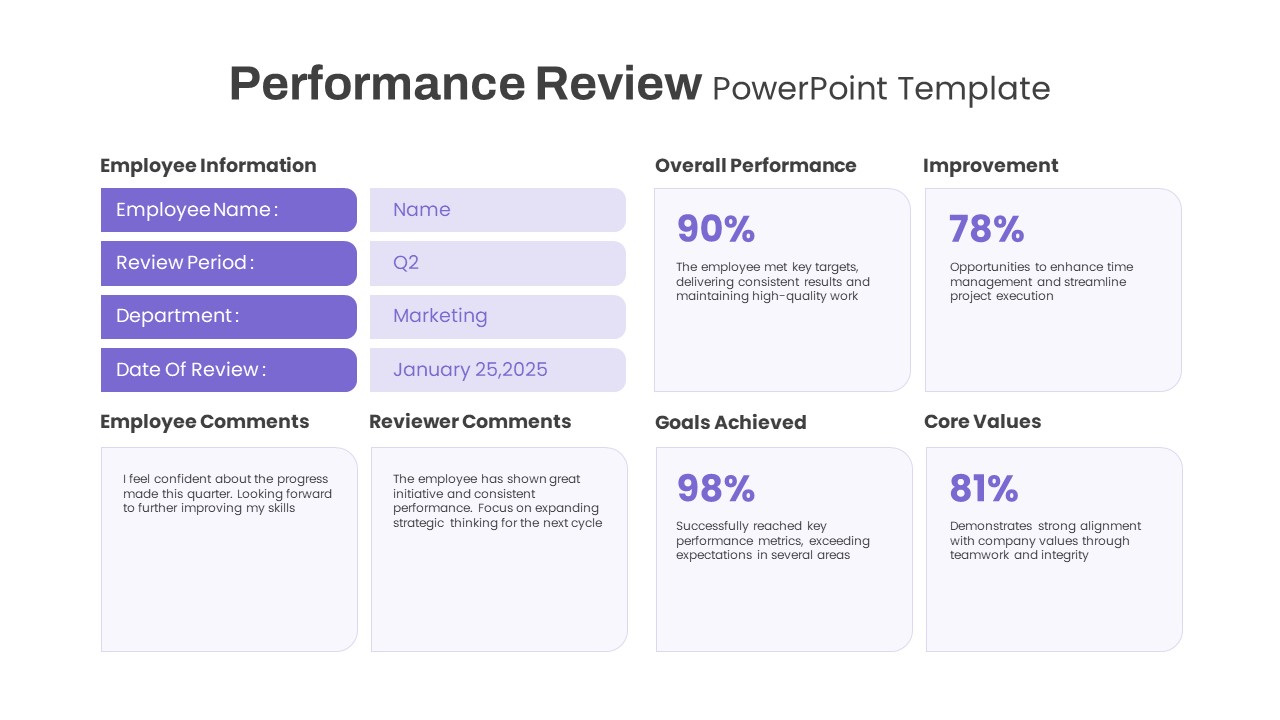
Performance Review template for PowerPoint & Google Slides
Employee Performance
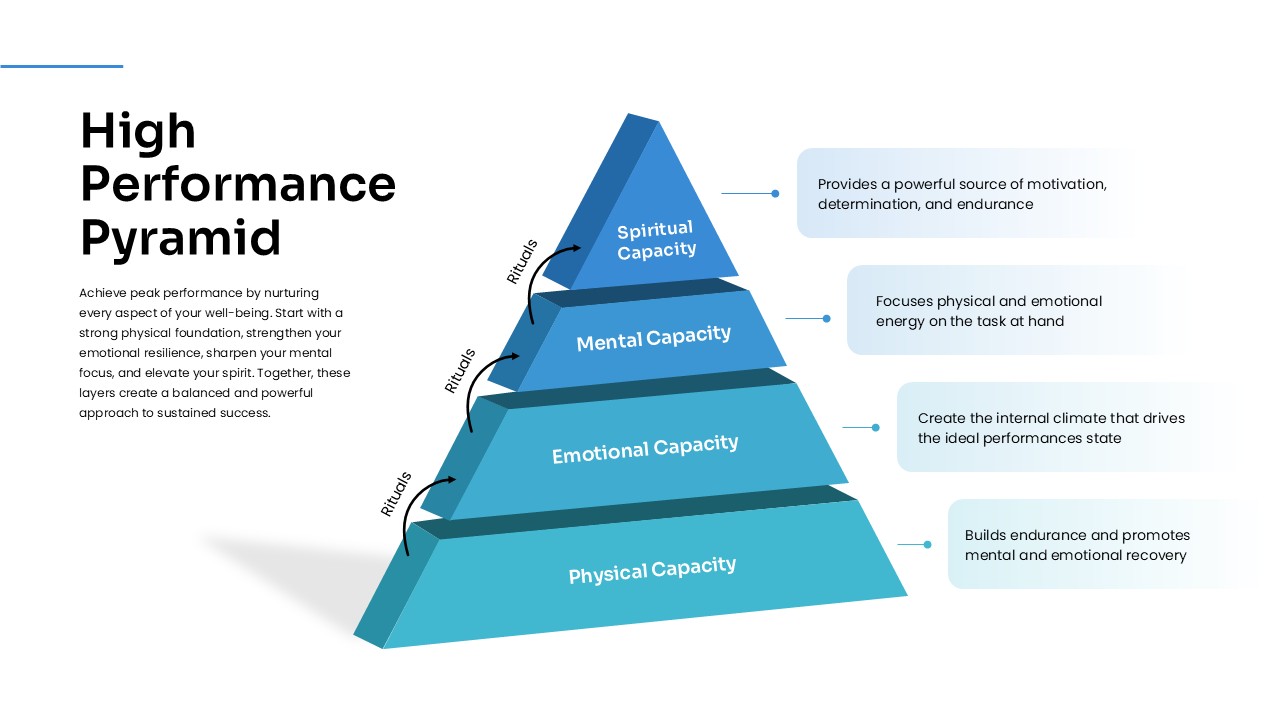
High Performance Pyramid Diagram Template for PowerPoint & Google Slides
Pyramid
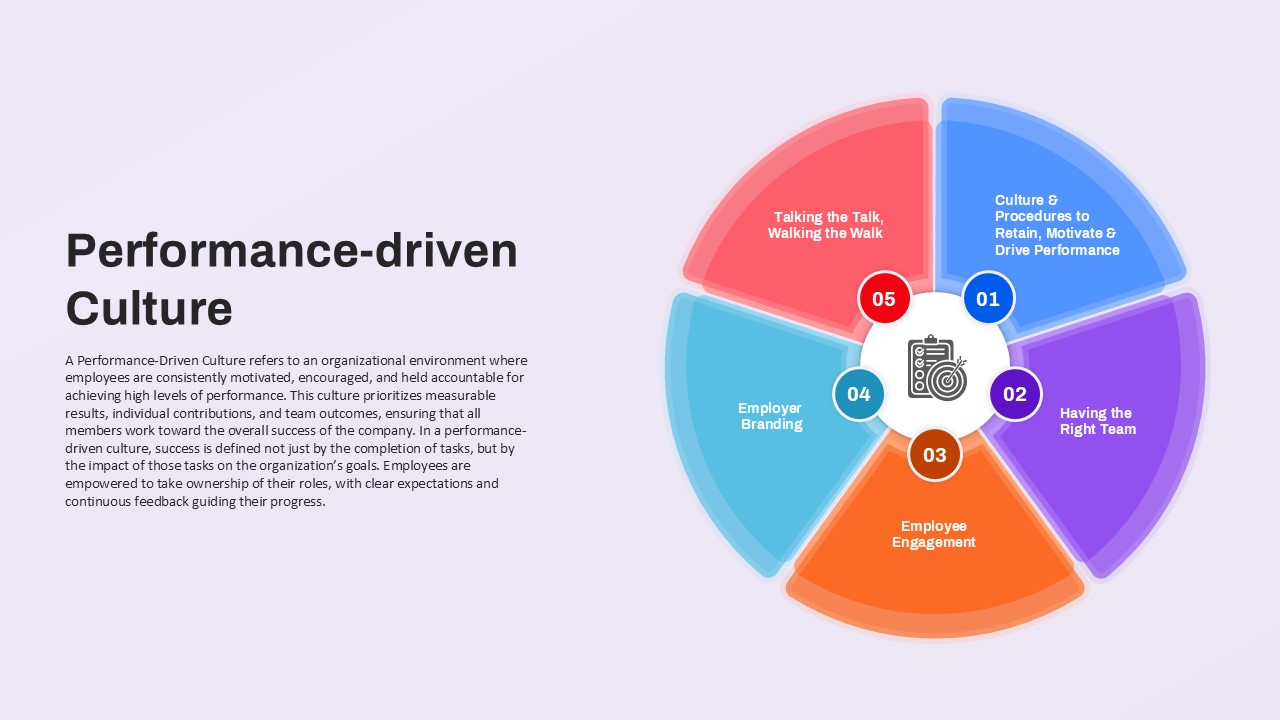
Performance-driven Culture framework template for PowerPoint & Google Slides
Leadership
Employee Performance Metrics Dashboard Template for PowerPoint & Google Slides
Employee Performance
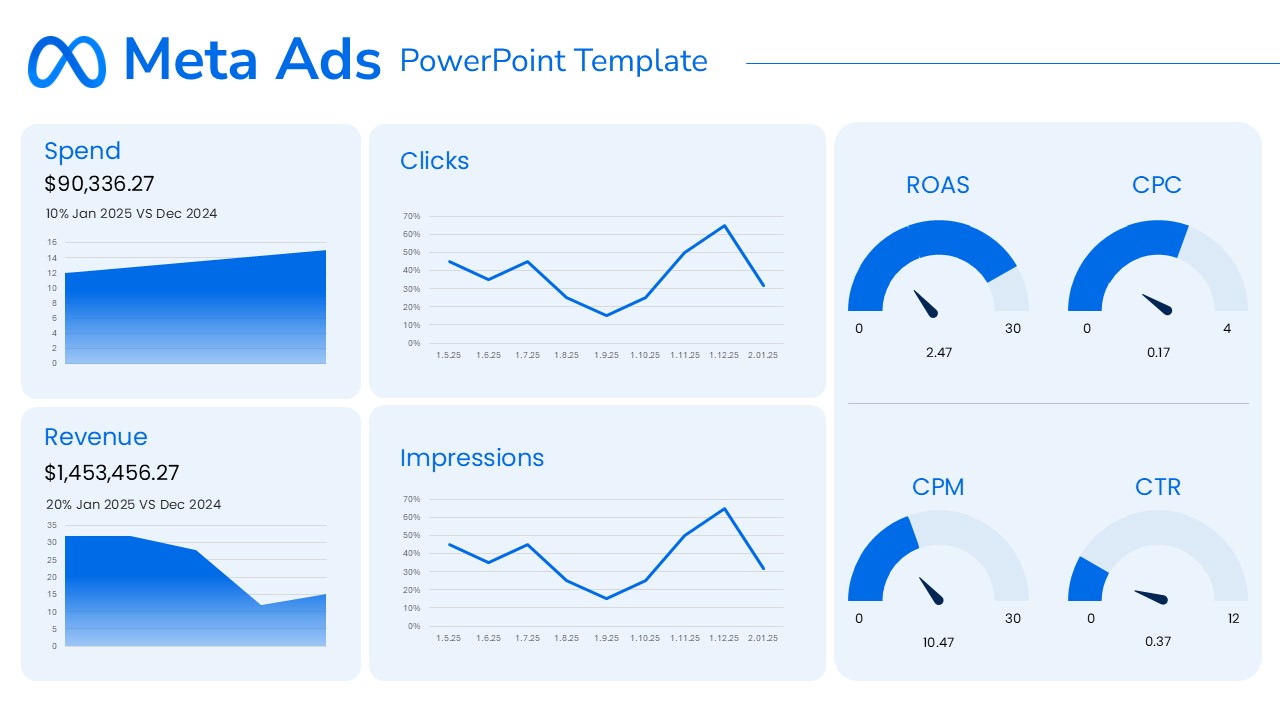
Meta Ads Performance Overview template for PowerPoint & Google Slides
Advertising
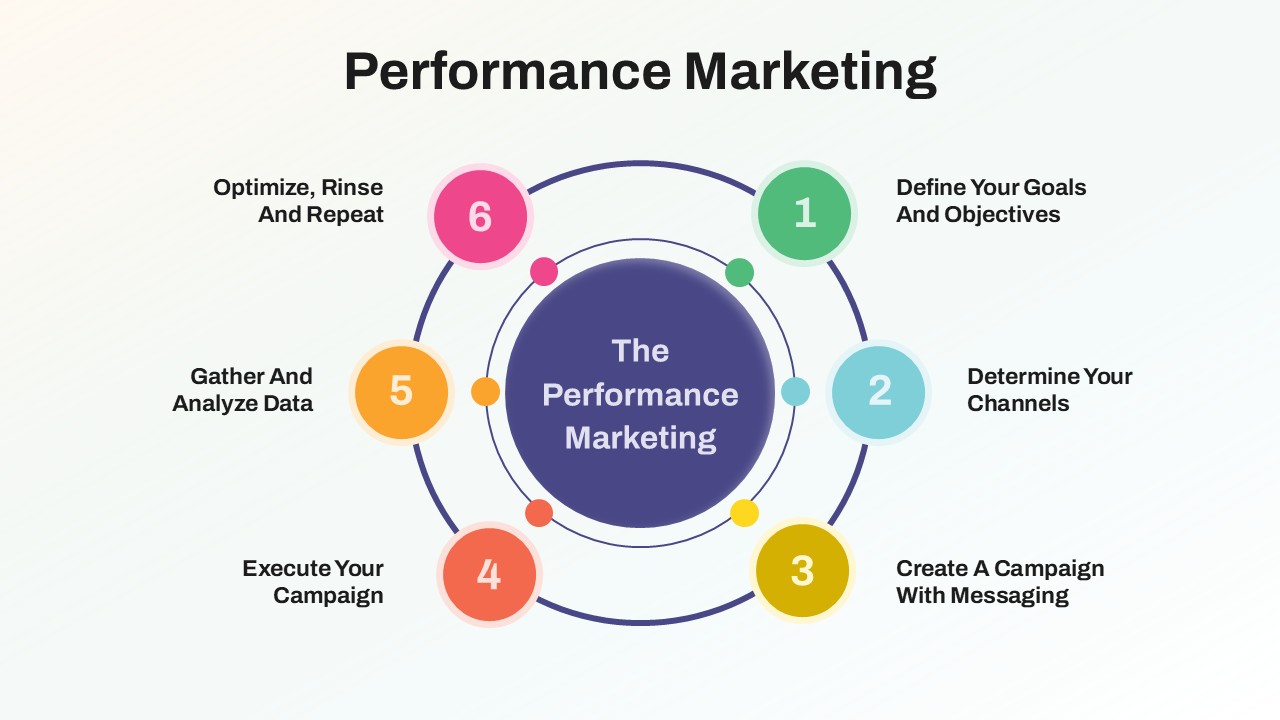
Performance Marketing Strategy template for PowerPoint & Google Slides
Digital Marketing
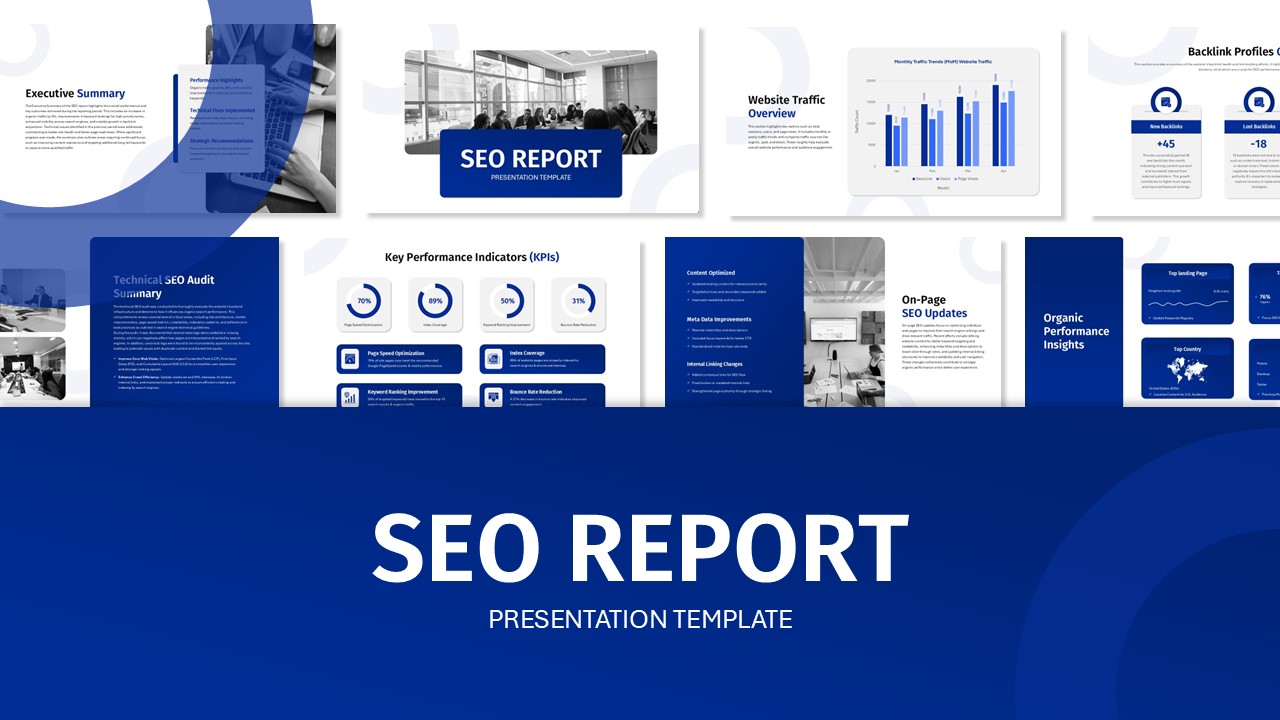
SEO Performance Report Overview template for PowerPoint & Google Slides
Digital Marketing
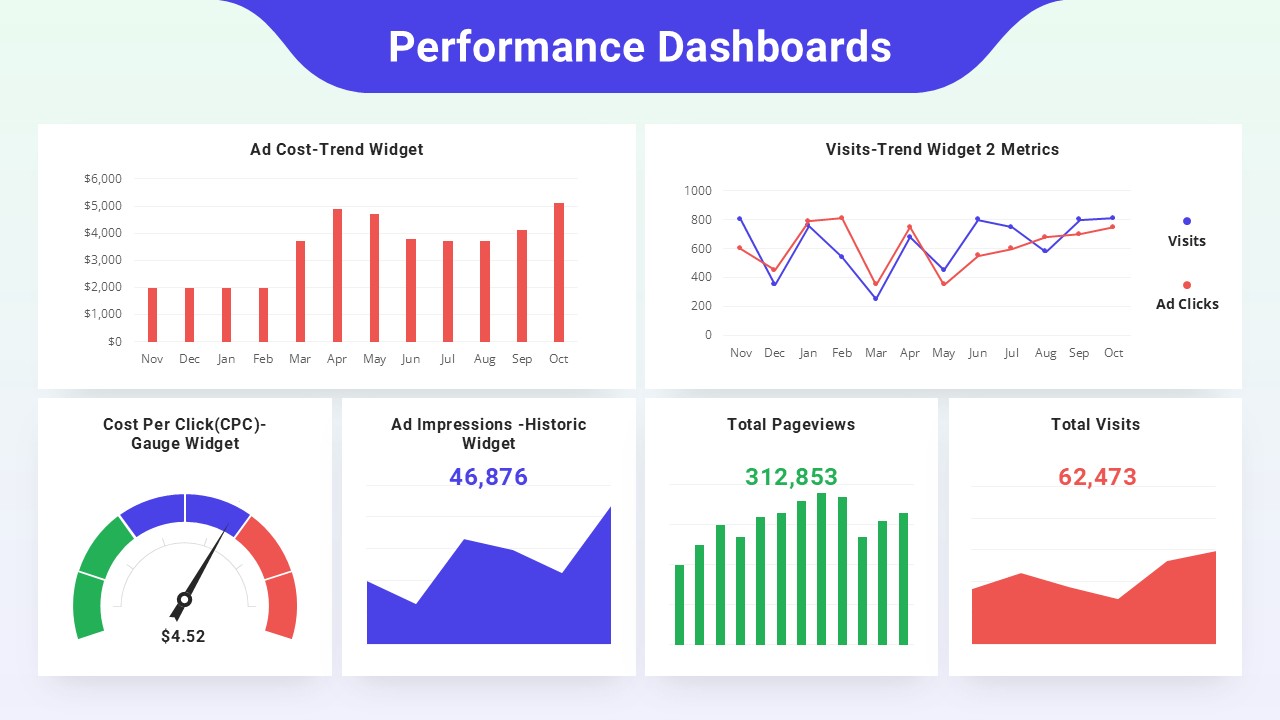
Performance Dashboards Overview Template for PowerPoint & Google Slides
Business Report
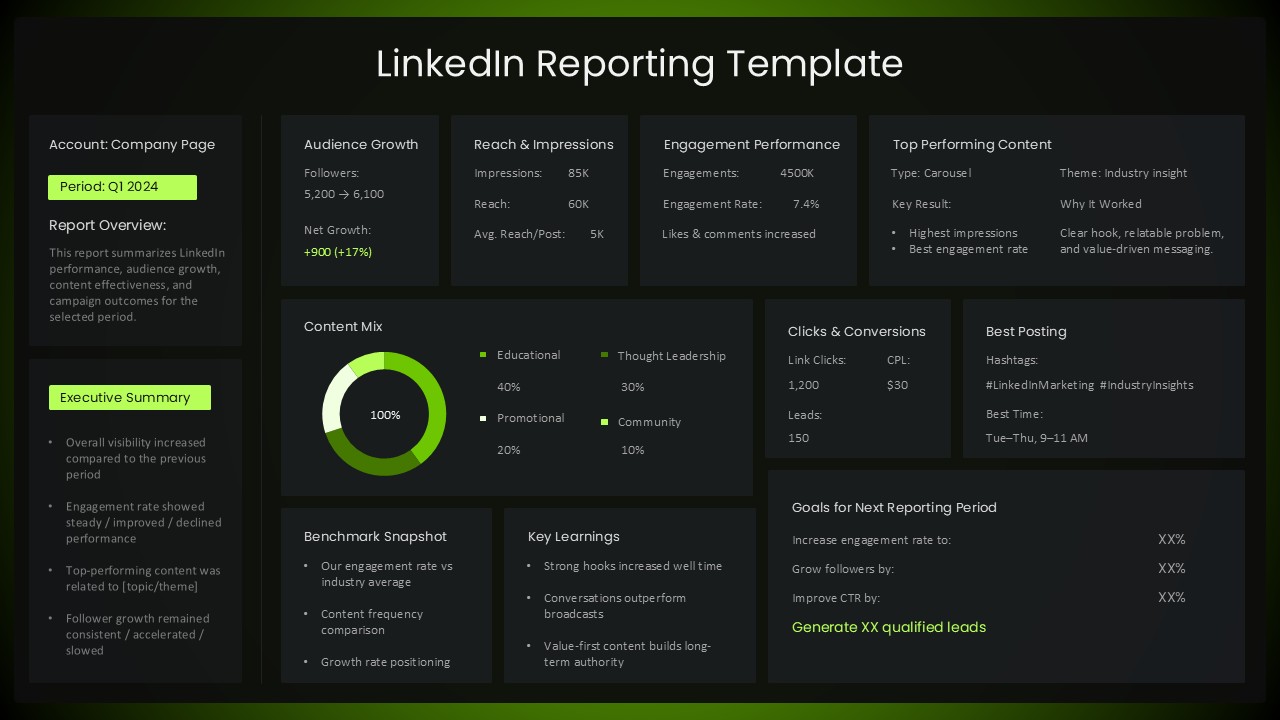
LinkedIn Performance Reporting Dashboard Template for PowerPoint & Google Slides
Digital Marketing
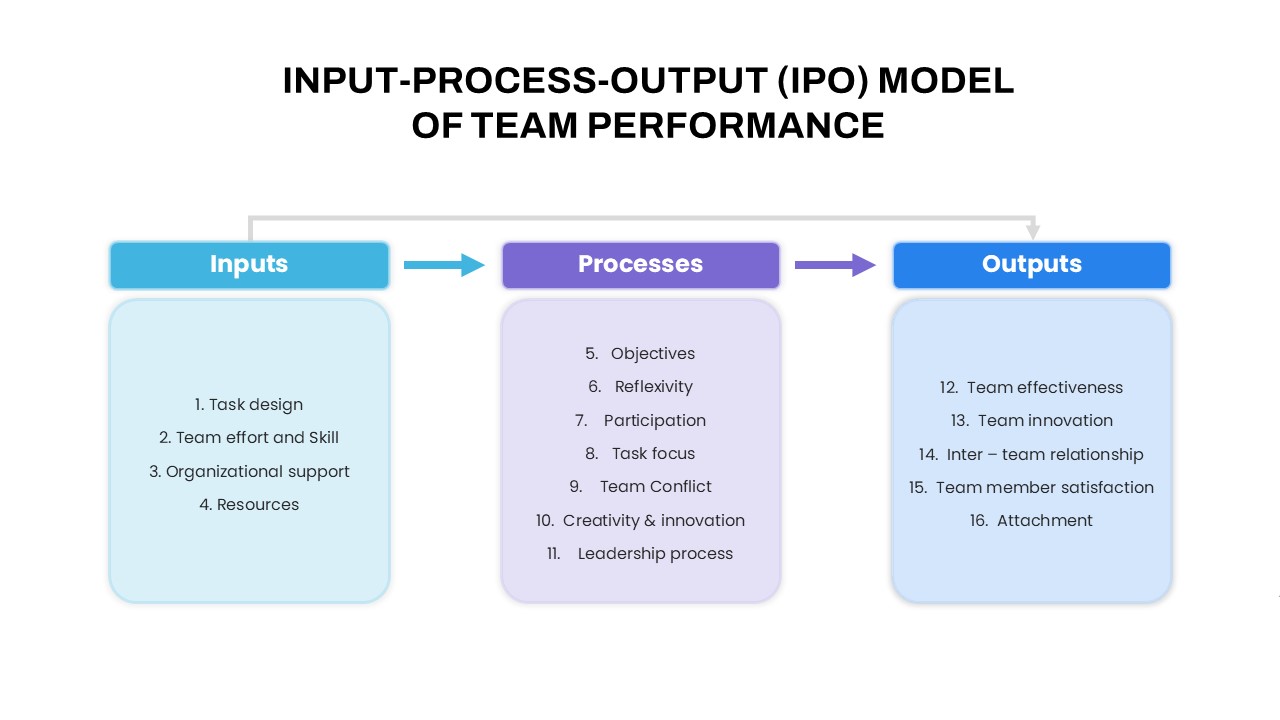
IPO Model of Team Performance for PowerPoint & Google Slides
Process
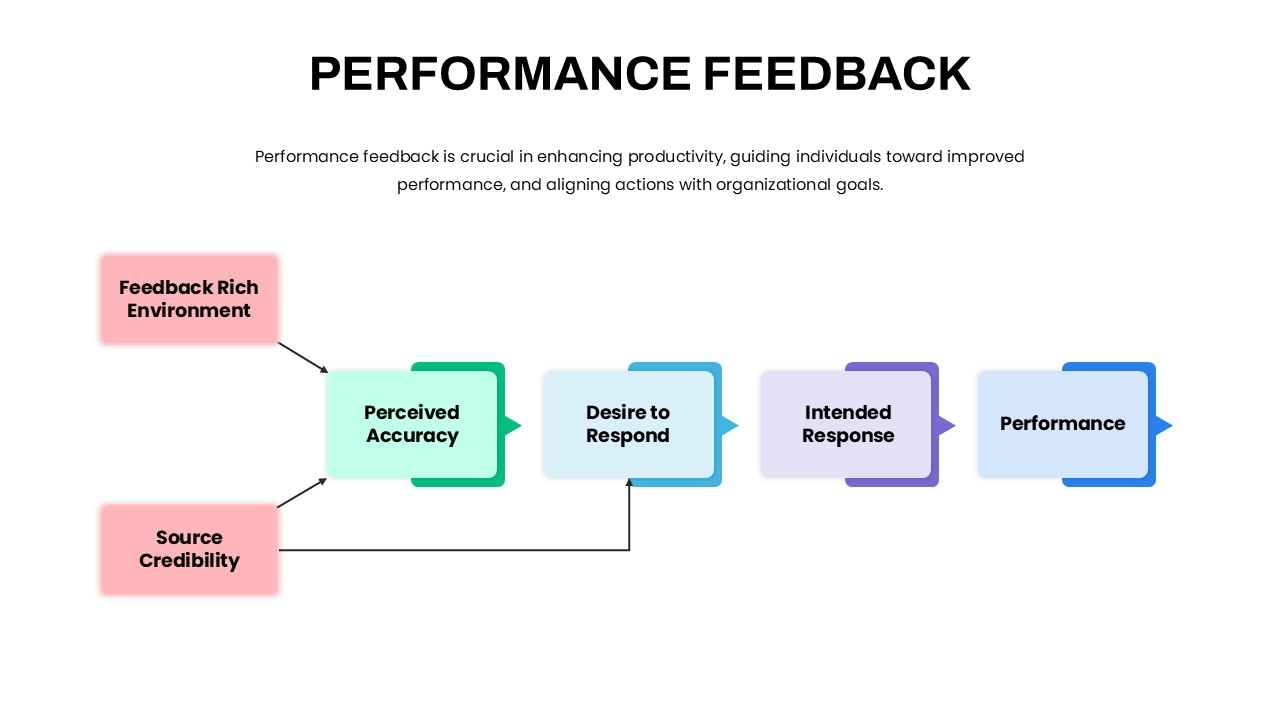
Performance Feedback Model for PowerPoint & Google Slides
Employee Performance
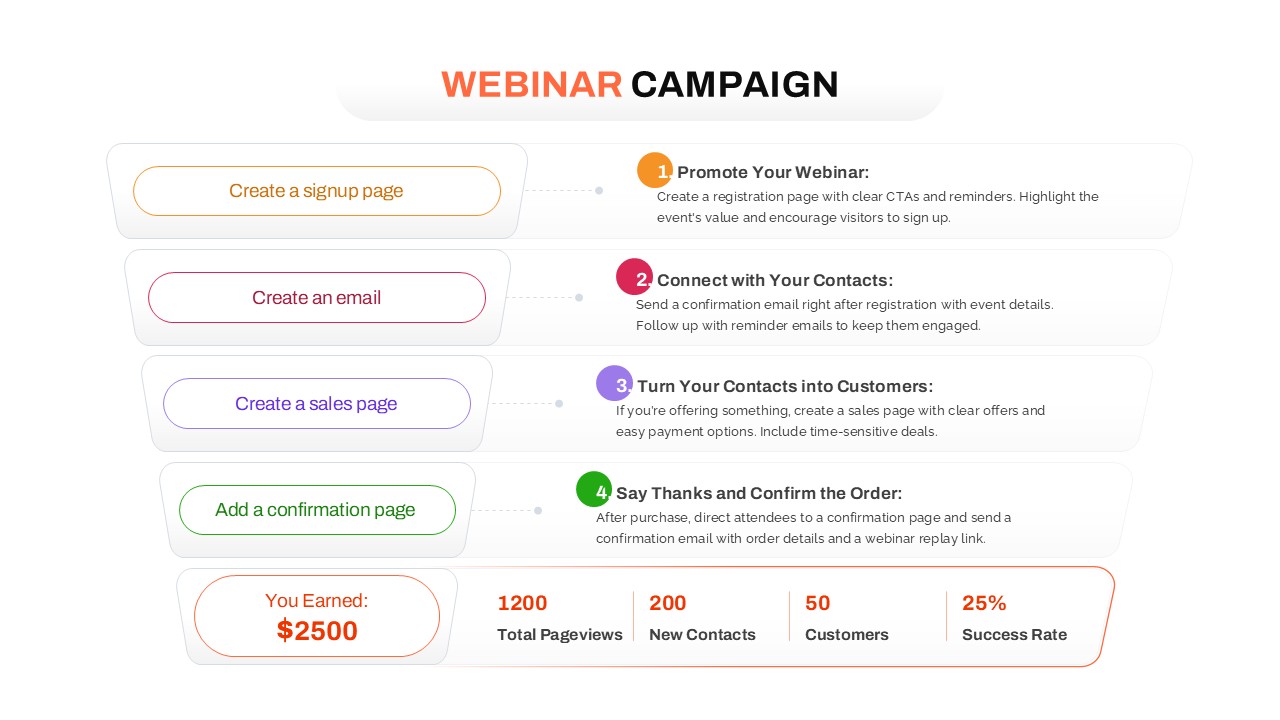
Webinar Campaign Steps and Performance for PowerPoint & Google Slides
Advertising
Online Learning PowerPoint Template for PowerPoint & Google Slides
Customer Journey
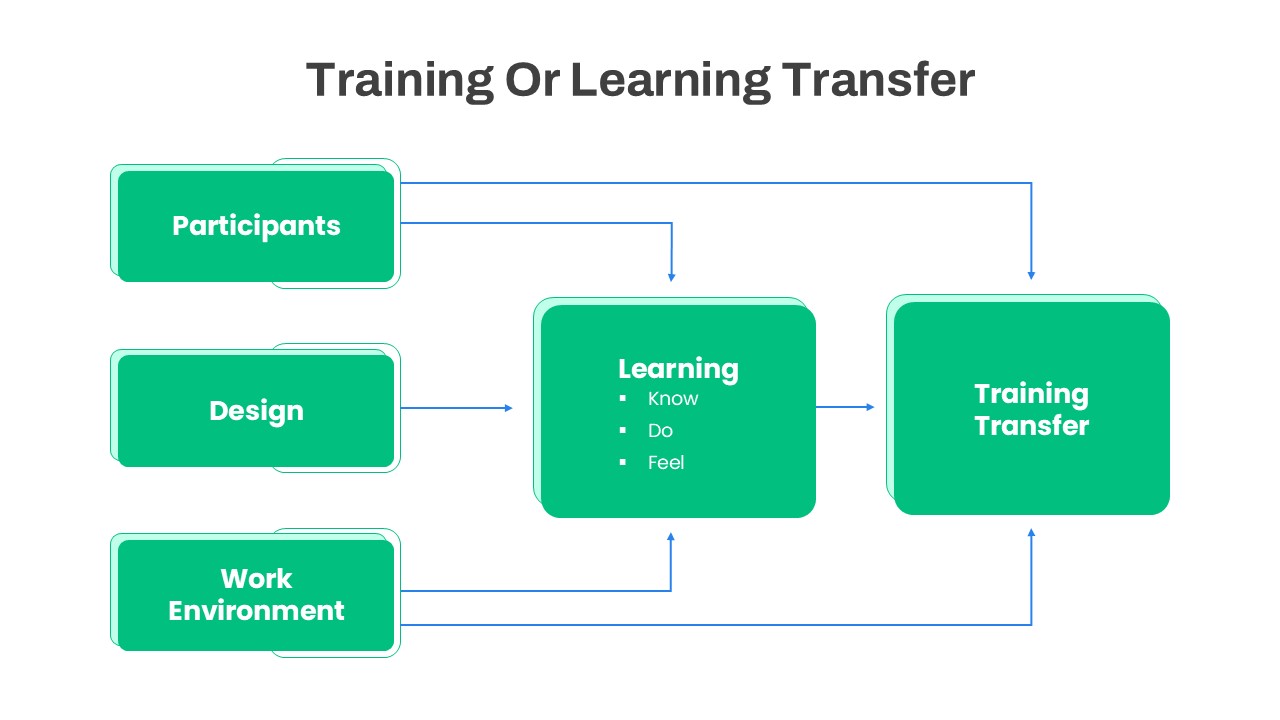
Training or Learning Transfer PowerPoint Template for PowerPoint & Google Slides
Business Proposal
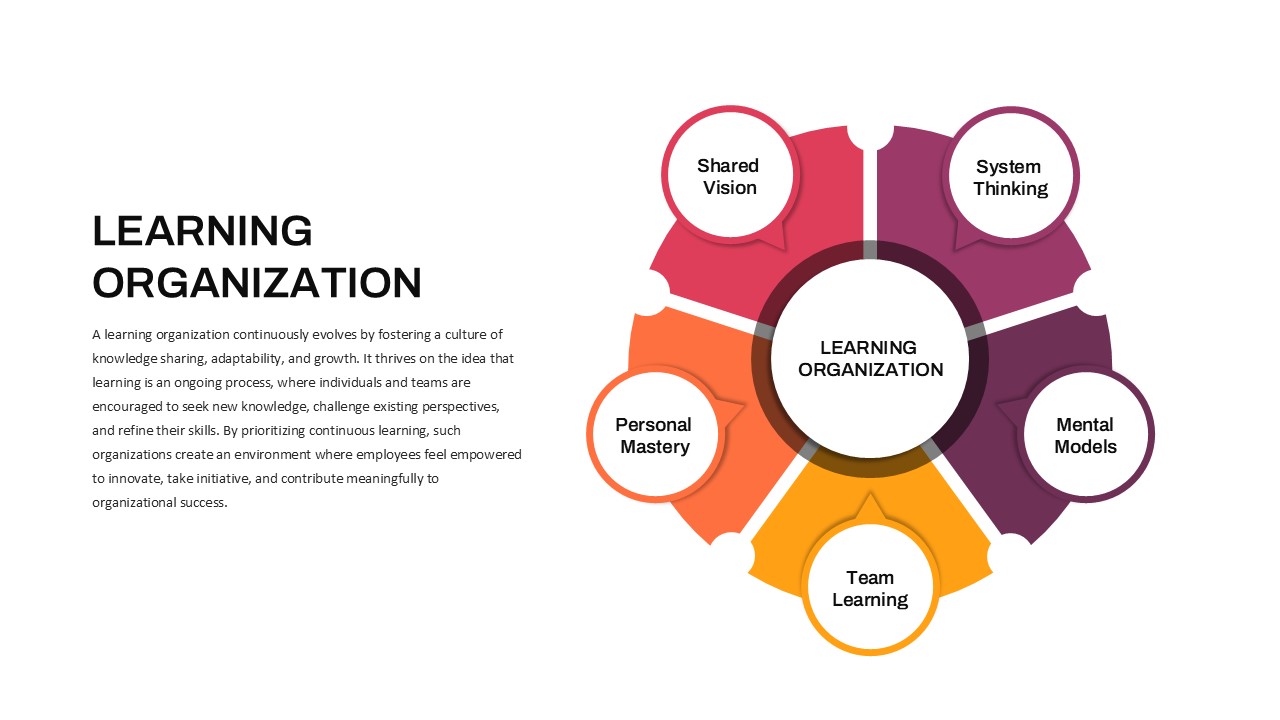
Learning Organization PowerPoint Template for PowerPoint & Google Slides
Business Strategy
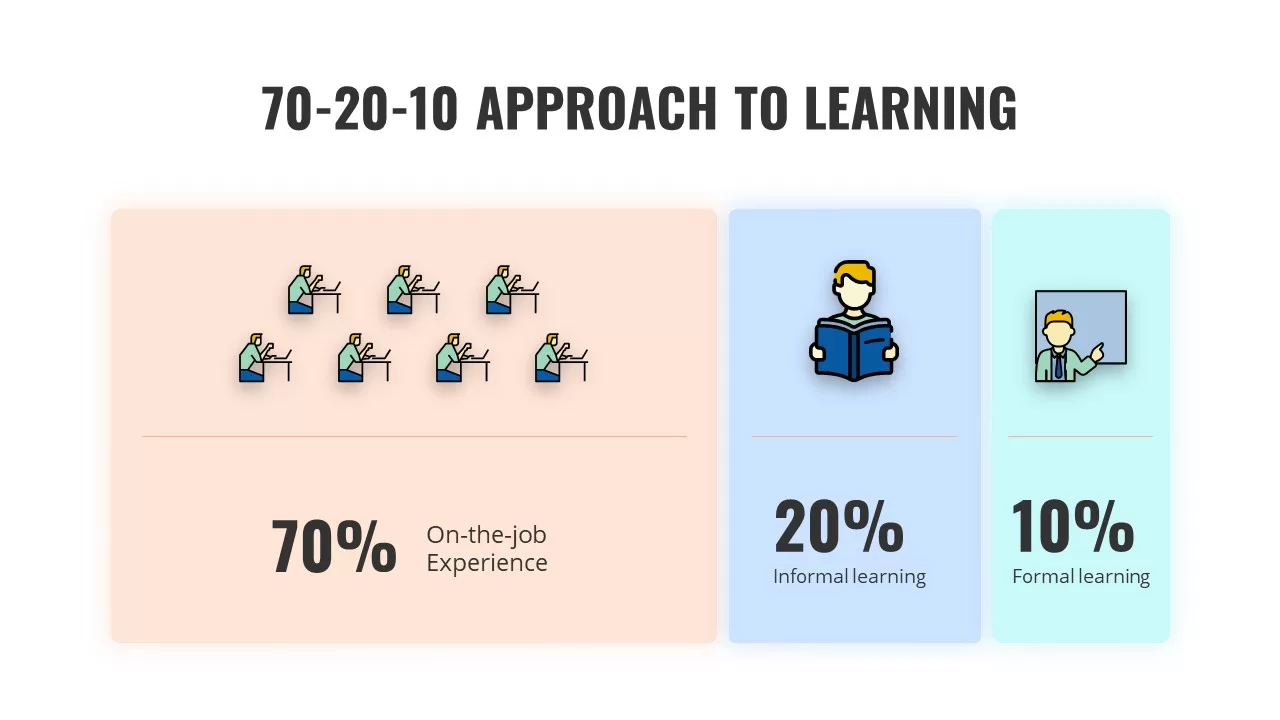
70-20-10 Learning Approach Infographic Template for PowerPoint & Google Slides
Process
4MAT Learning Cycle Circular Diagram Template for PowerPoint & Google Slides
Circular
Free Stylish E-Learning Presentation Template for PowerPoint & Google Slides
Pitch Deck
Free
E-Learning Education Presentation Deck Template for PowerPoint & Google Slides
Decks
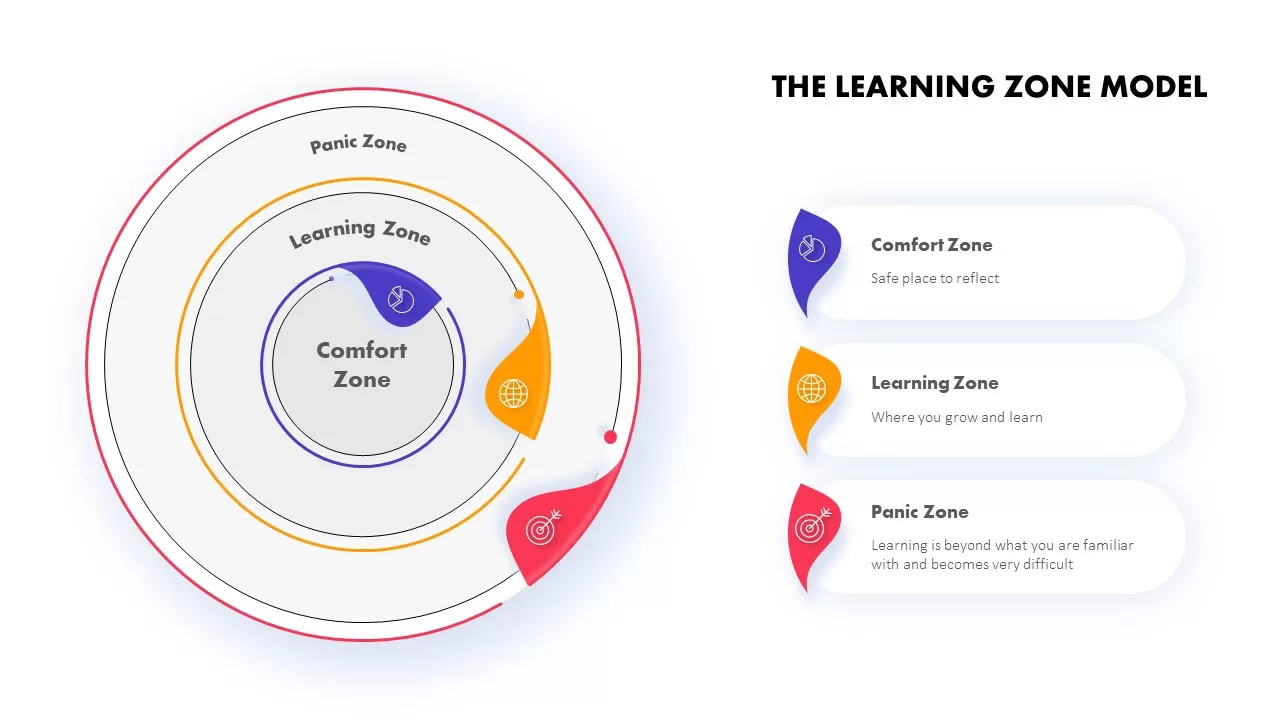
The Learning Zone Model Template for PowerPoint & Google Slides
Process
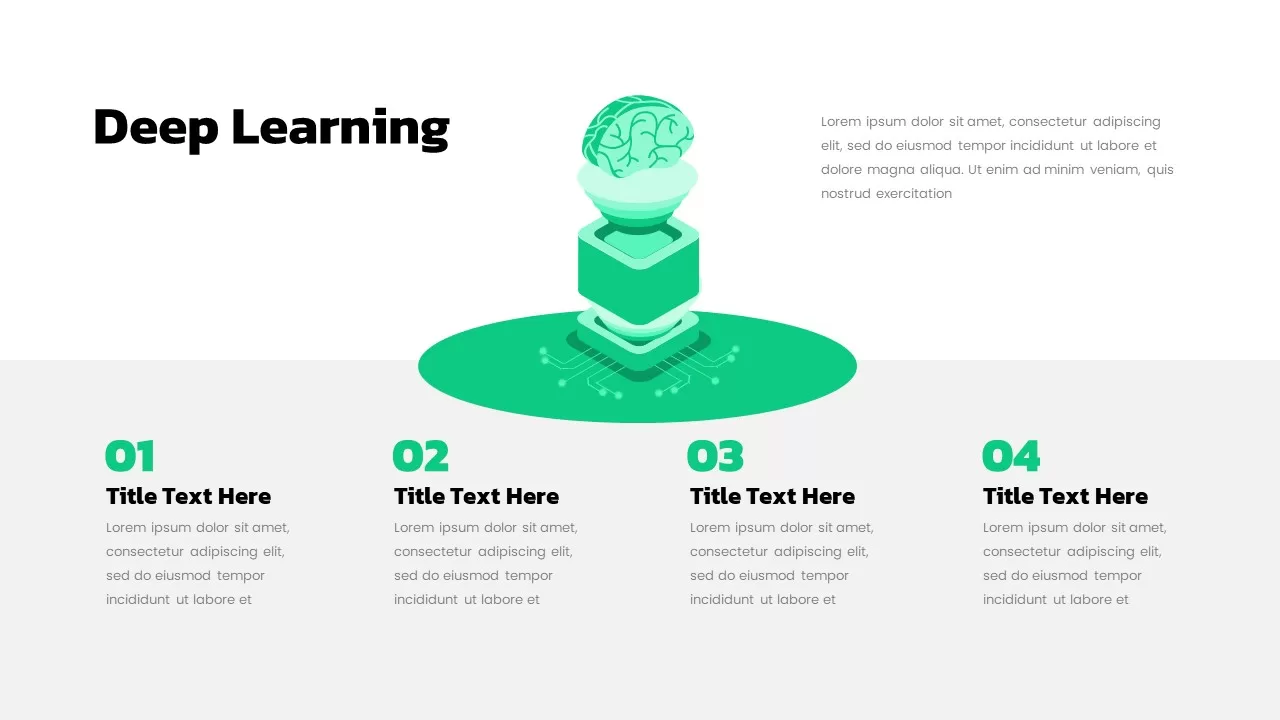
Deep Learning Concept Illustration Template for PowerPoint & Google Slides
Machine Learning
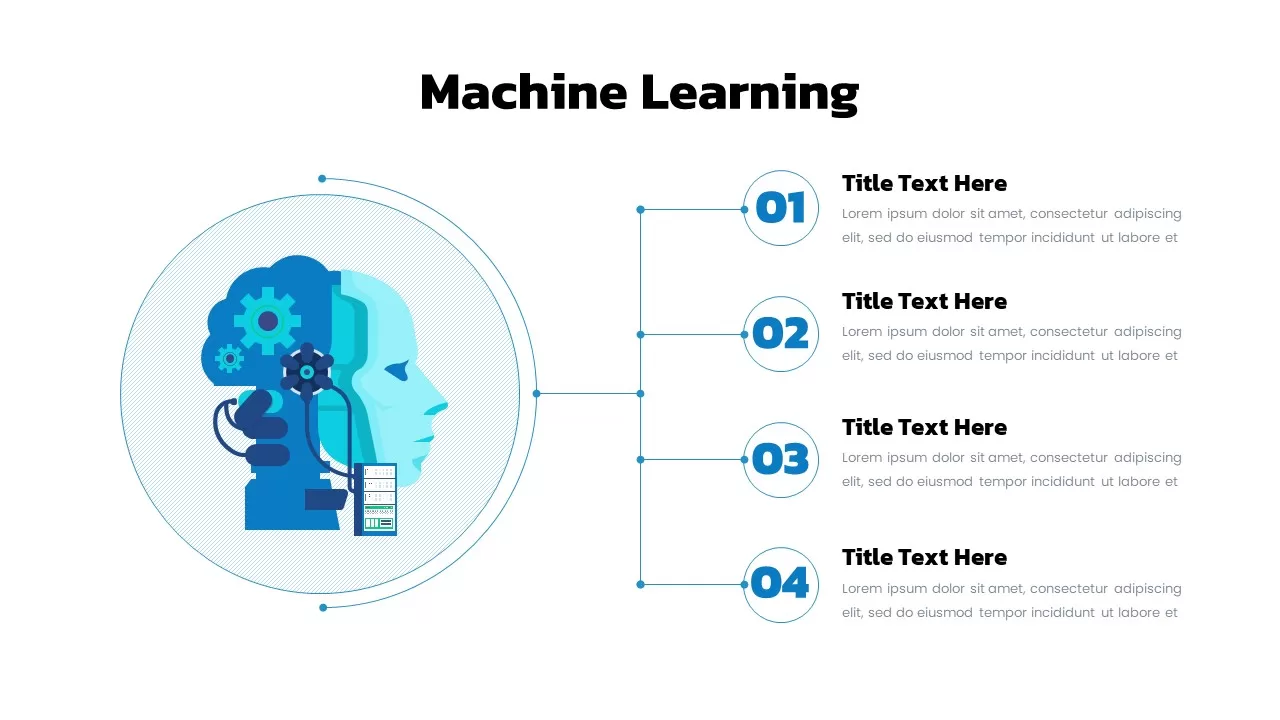
Machine Learning Diagram Template for PowerPoint & Google Slides
Process
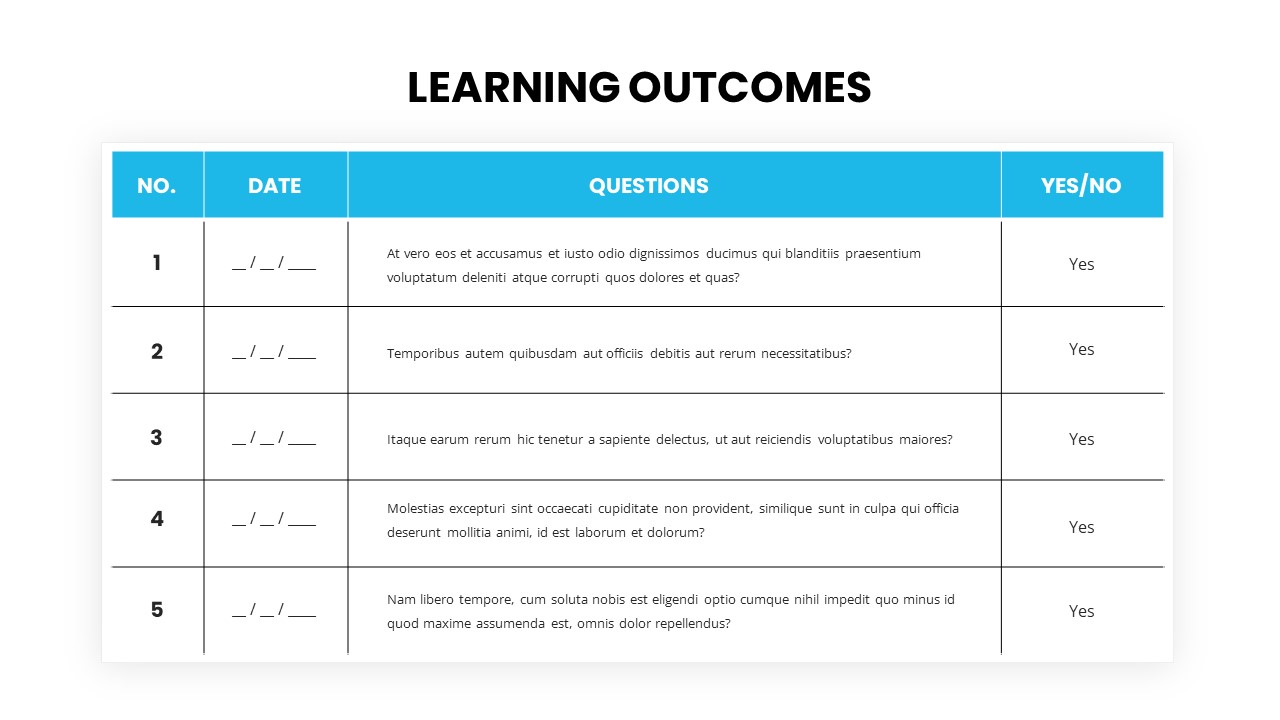
Learning Outcomes table template for PowerPoint & Google Slides
Charts

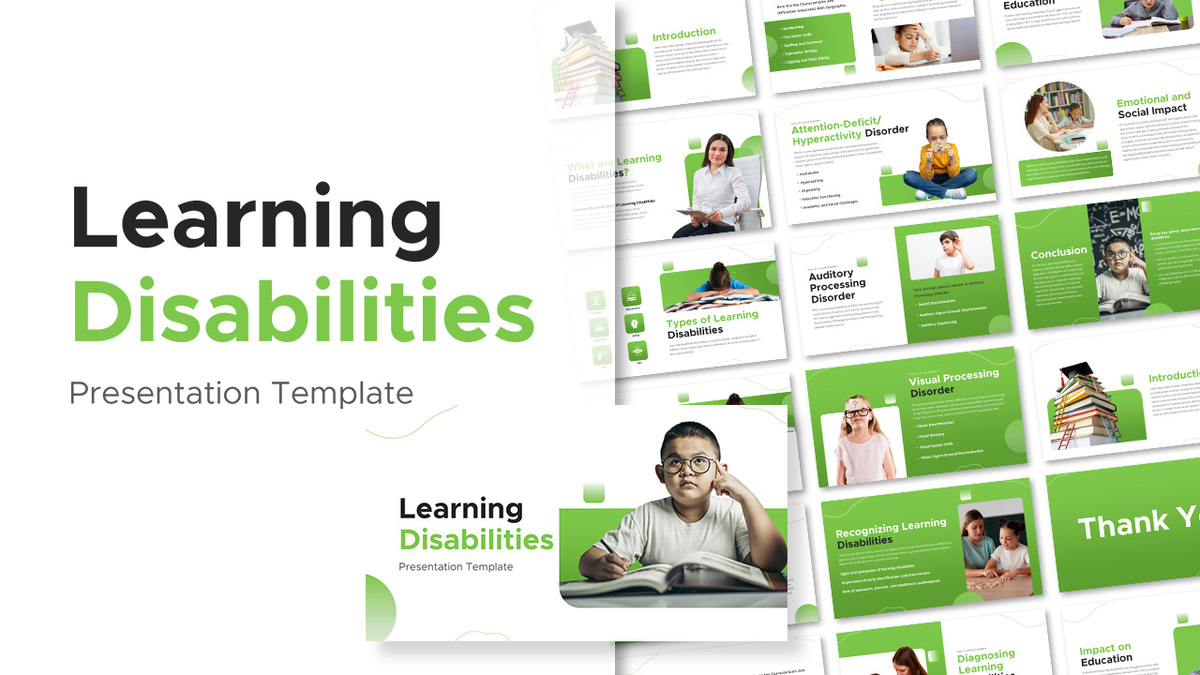
Learning Disabilities Presentation Template for PowerPoint & Google Slides
Company Profile
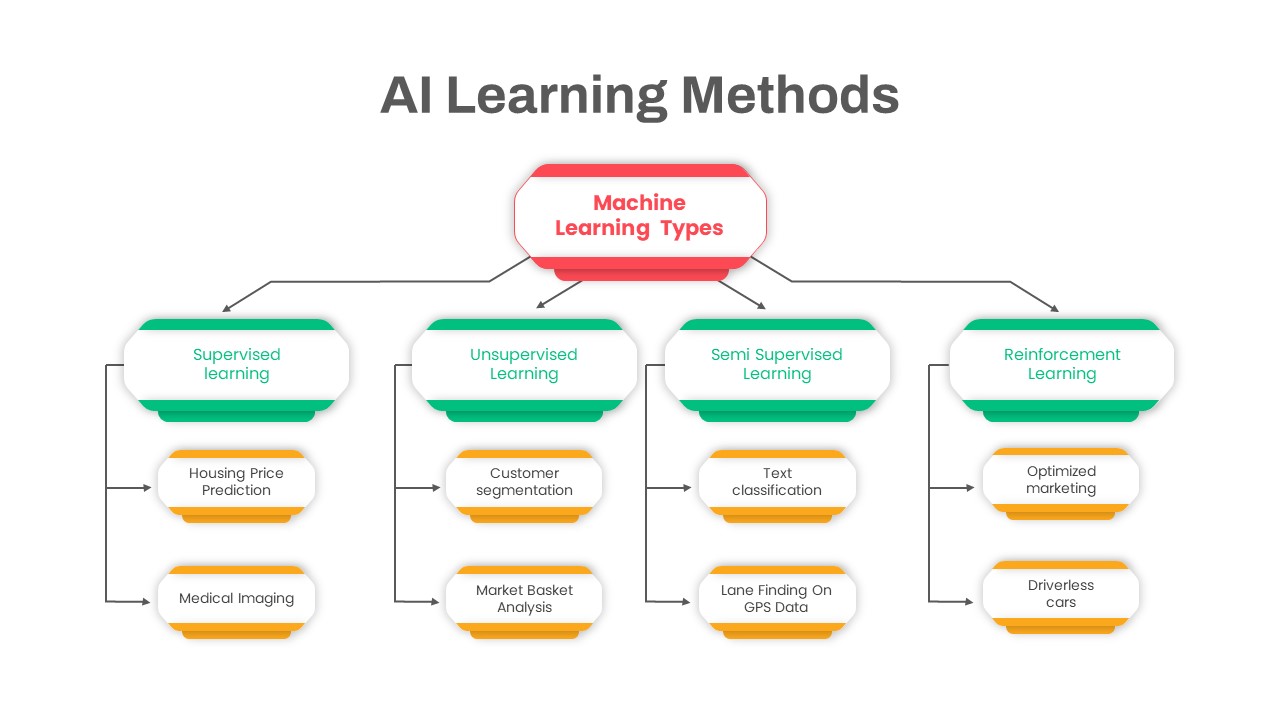
AI Learning Methods Flowchart Diagram Template for PowerPoint & Google Slides
Flow Charts
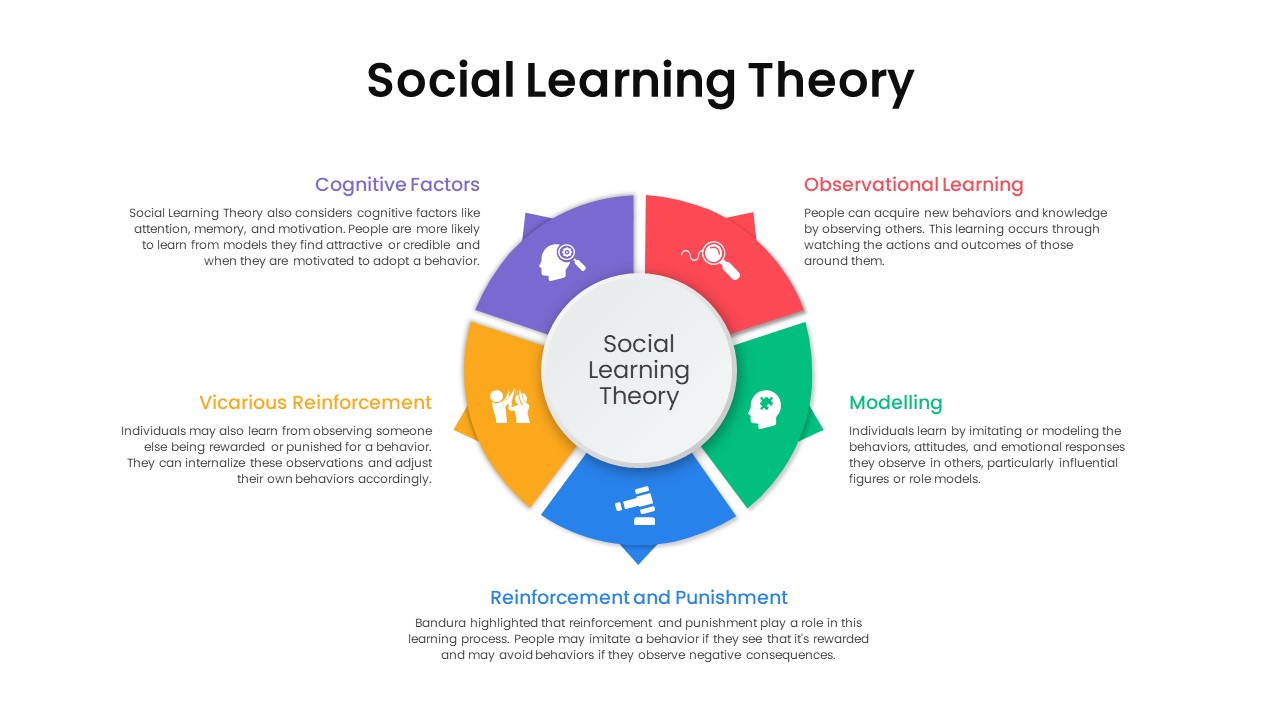
Social Learning Theory Infographic Template for PowerPoint & Google Slides
Circular
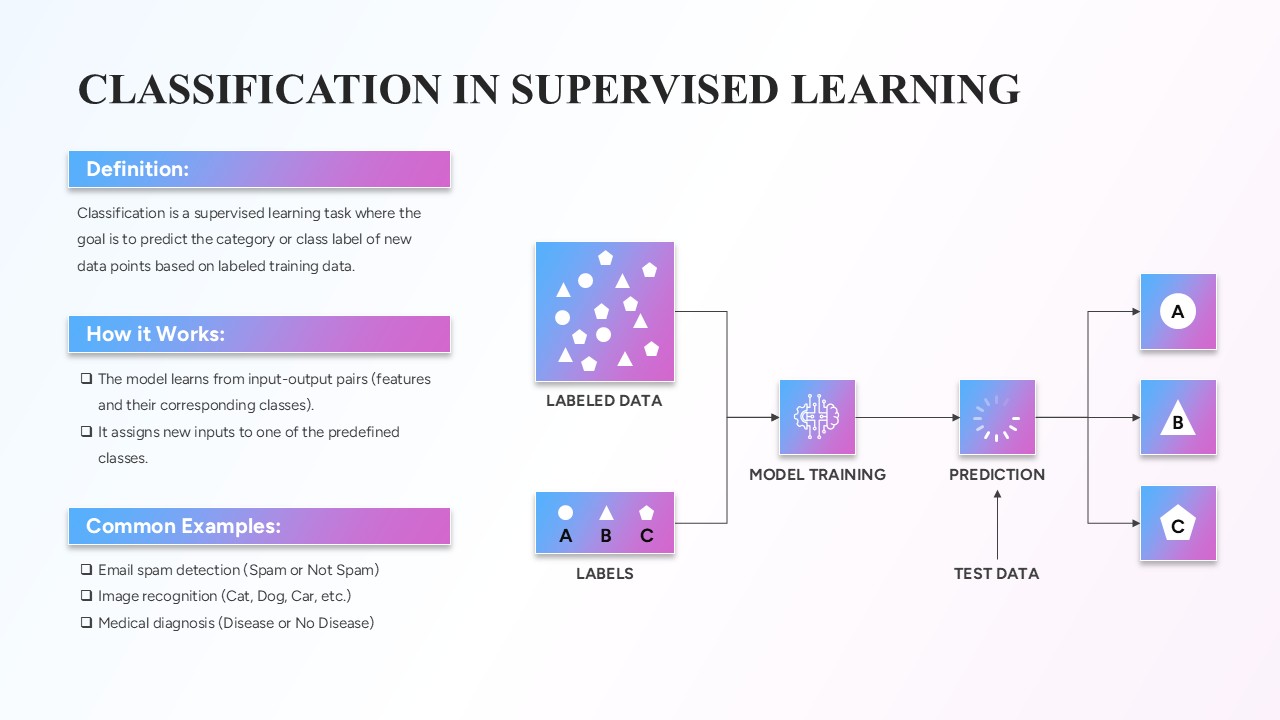
Classification in Supervised Learning template for PowerPoint & Google Slides
Infographics
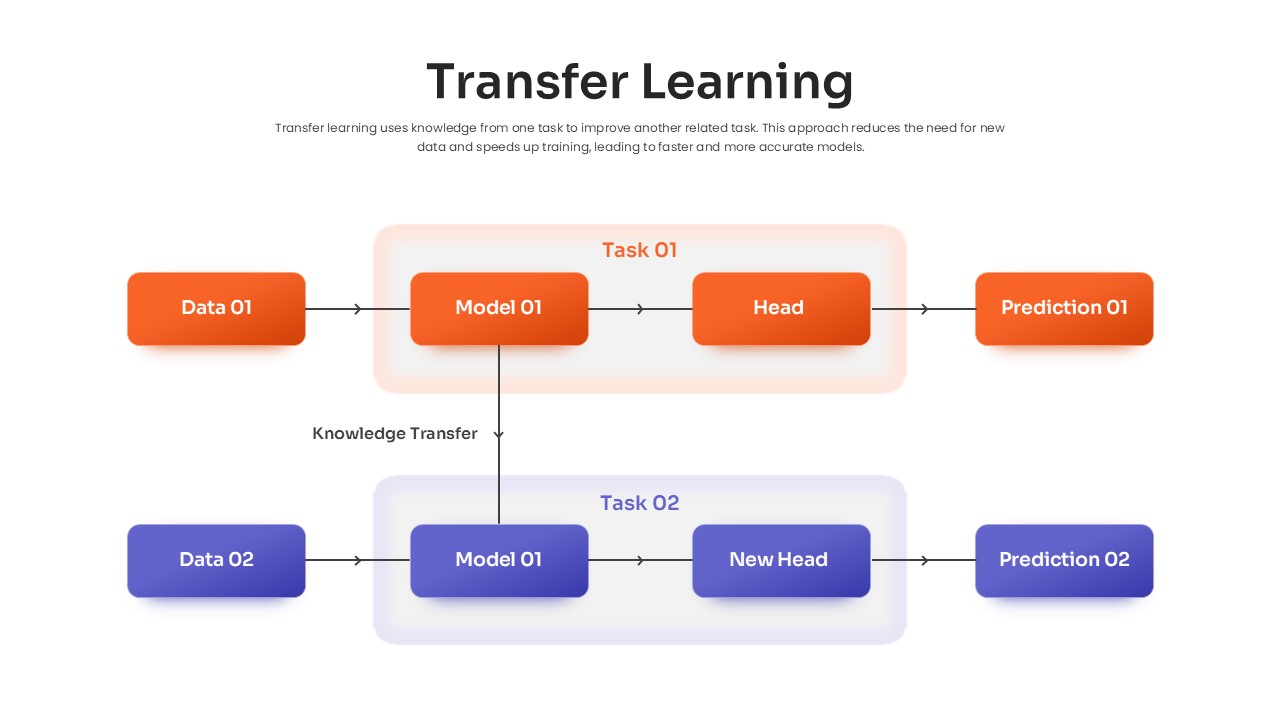
Transfer Learning Process template for PowerPoint & Google Slides
Technology
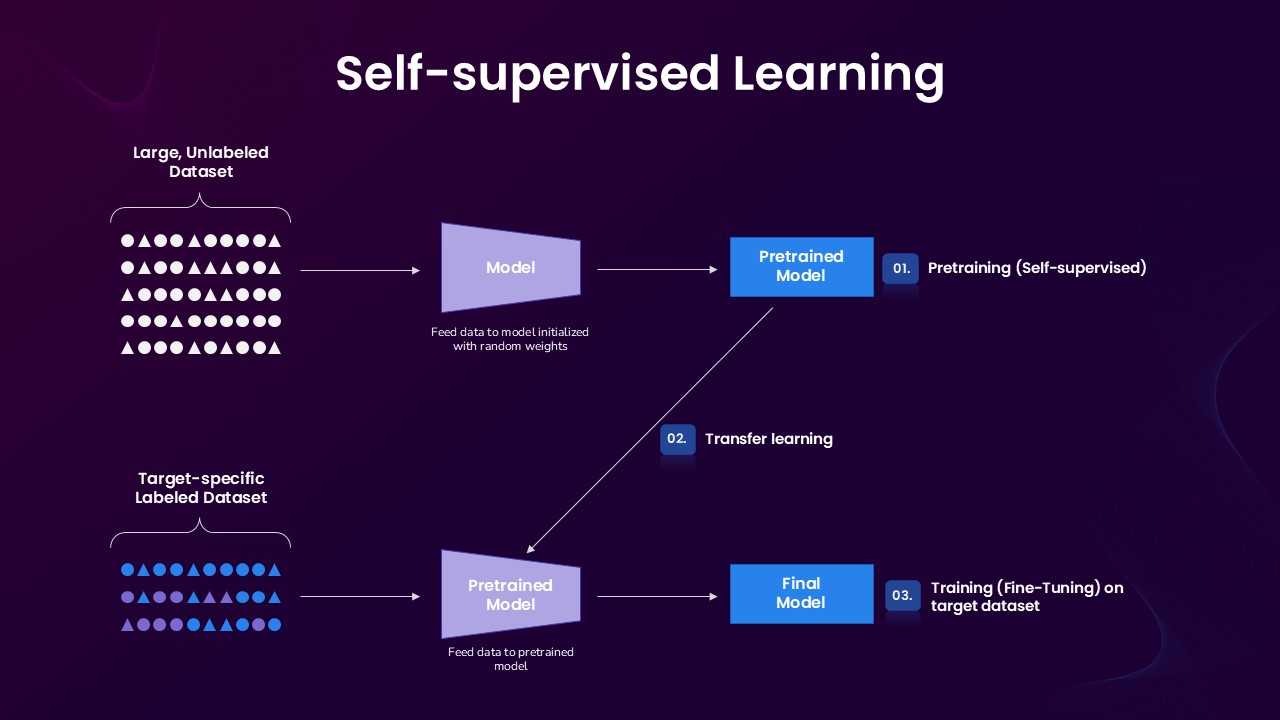
Self-supervised Learning Process template for PowerPoint & Google Slides
Technology
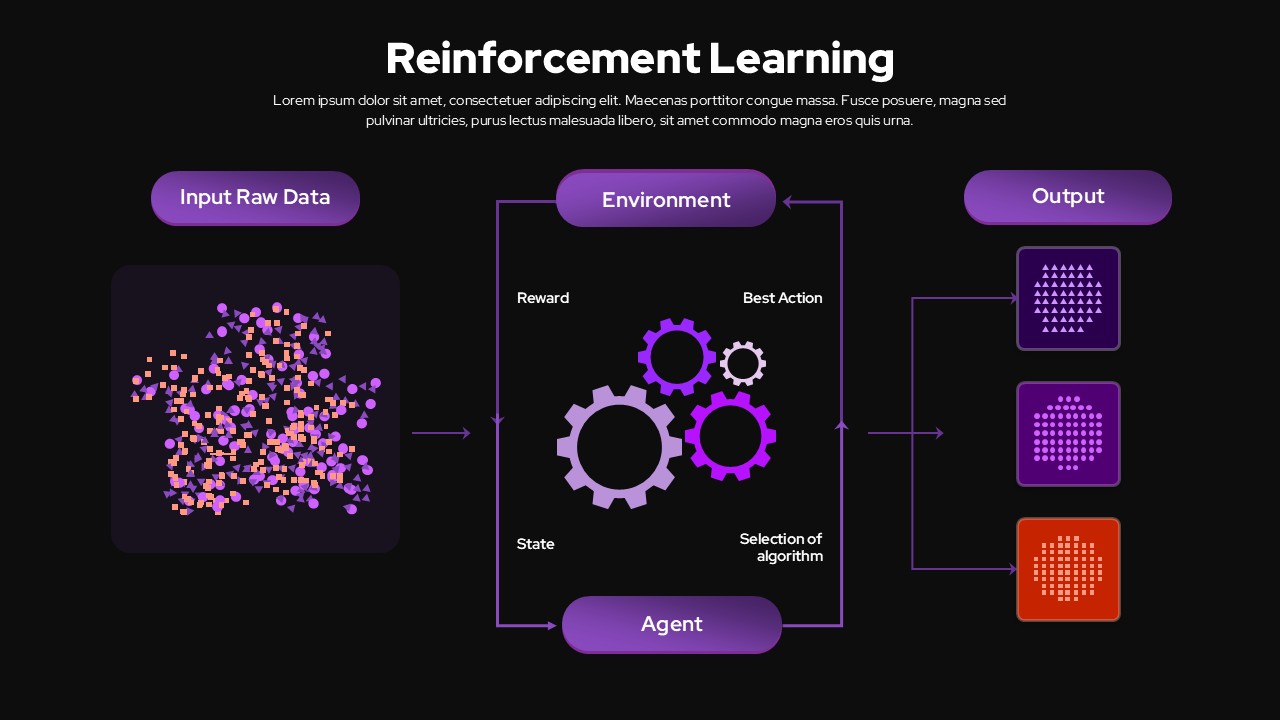
Reinforcement Learning Diagram Dark Template for PowerPoint & Google Slides
Machine Learning
Learning Agility template for PowerPoint & Google Slides
Business
Machine Learning Pipeline Framework Template for PowerPoint & Google Slides
Charts
Machine Learning Innovation Overview template for PowerPoint & Google Slides
AI
Machine Learning Types template for PowerPoint & Google Slides
Technology
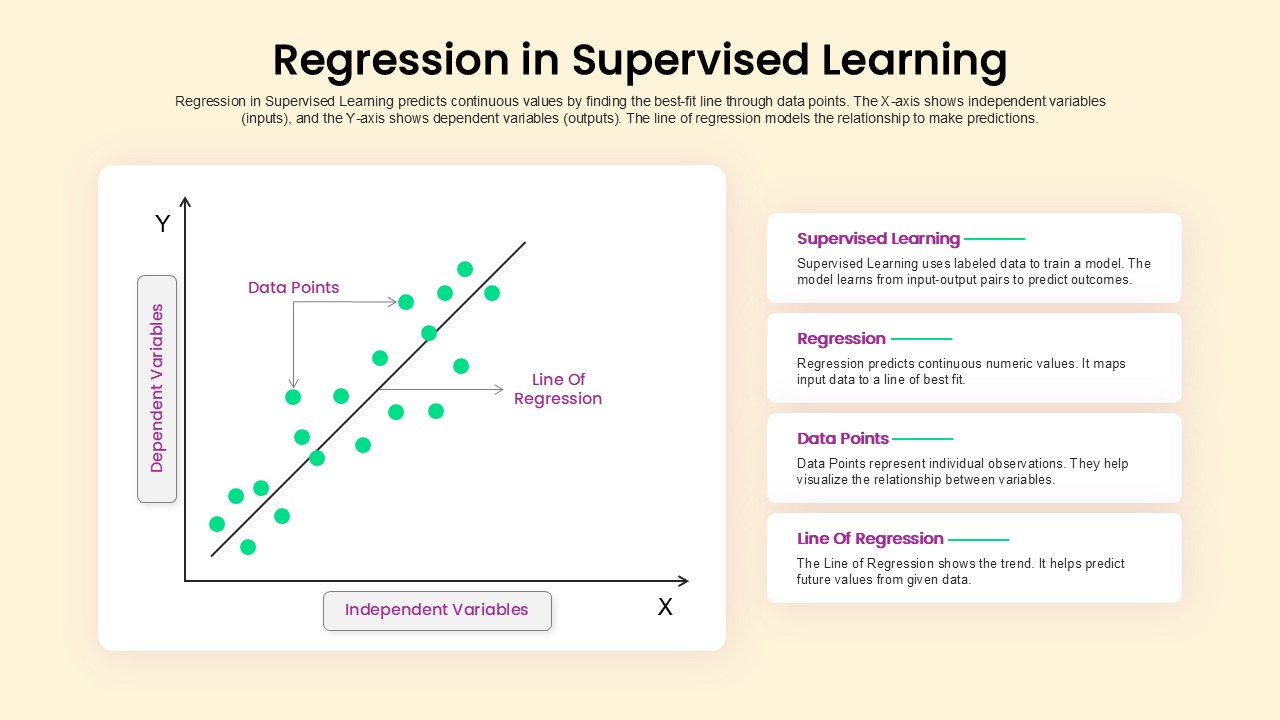
Regression in Supervised Learning Overview template for PowerPoint & Google Slides
Process
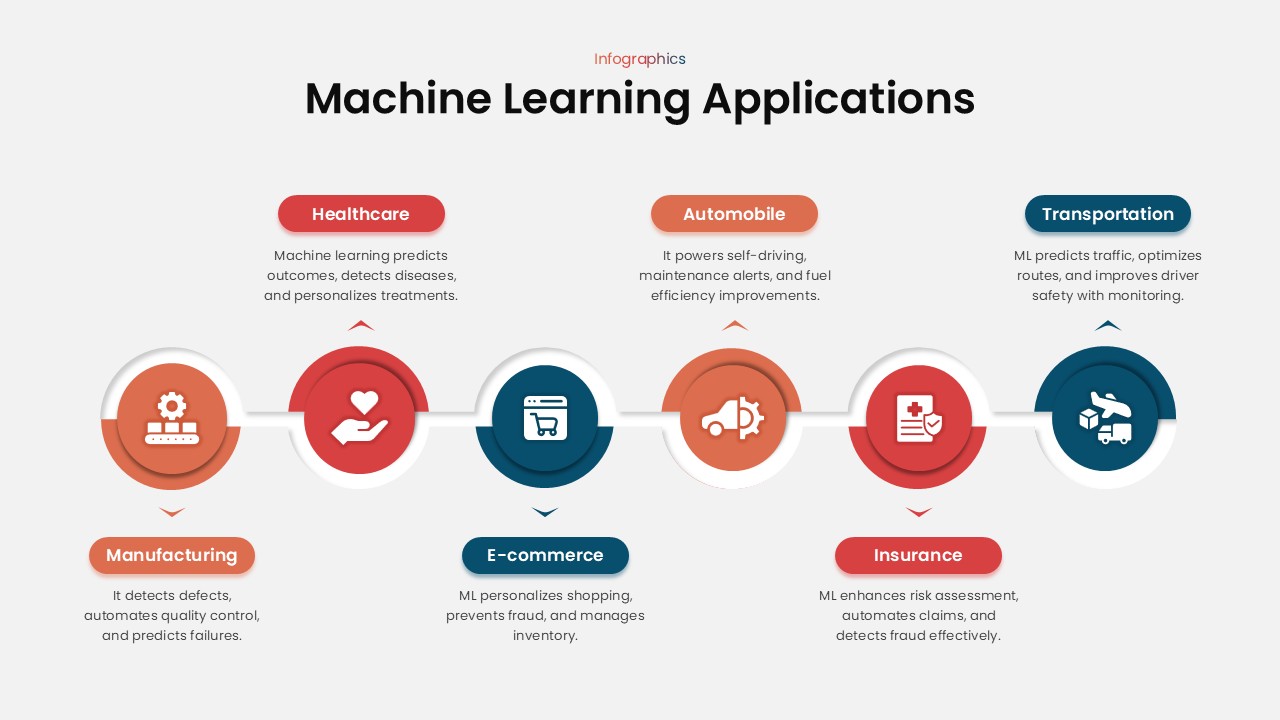
Machine Learning Applications template for PowerPoint & Google Slides
Technology
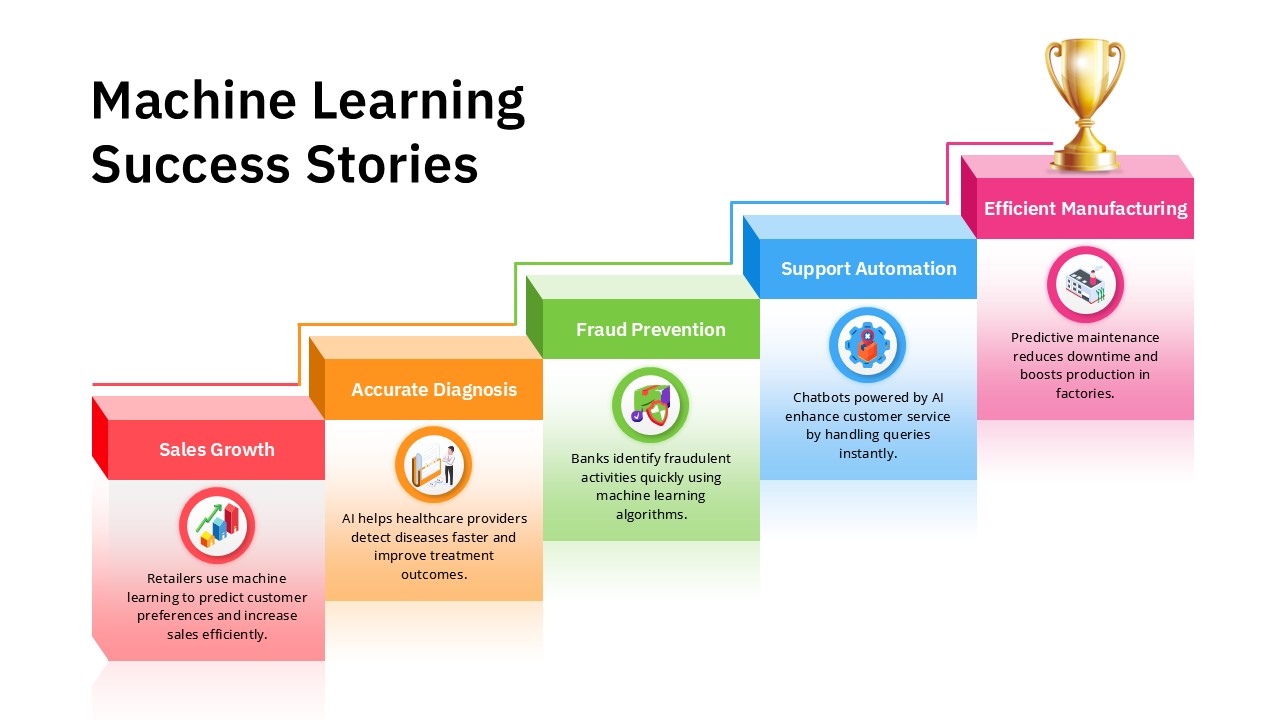
Machine Learning Success Stories Infographic Template for PowerPoint & Google Slides
Process
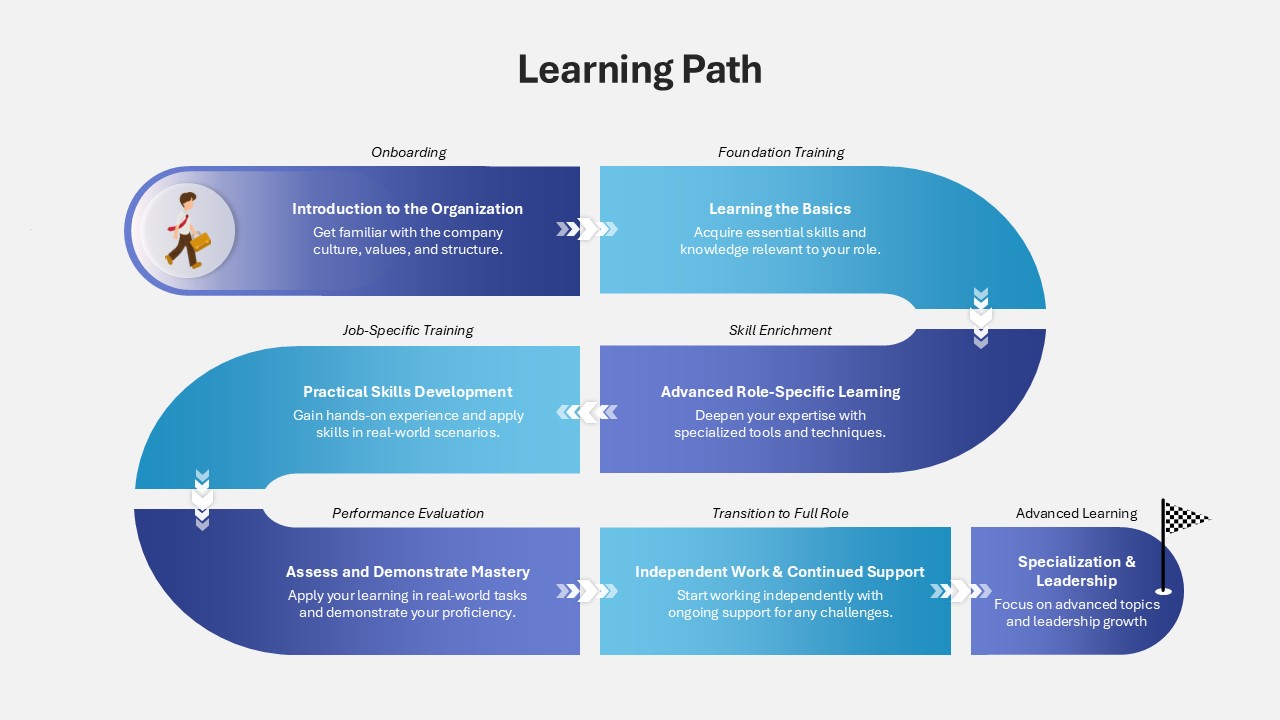
Learning Path Infographic Template for PowerPoint & Google Slides
Process
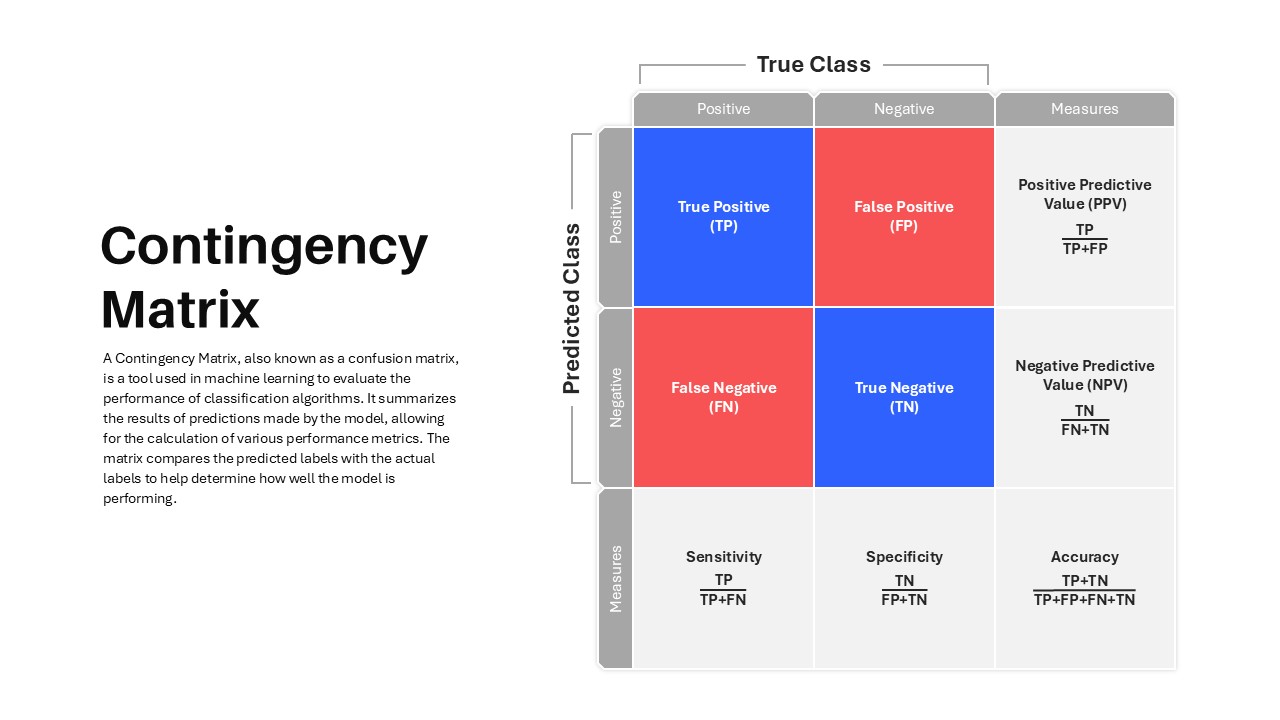
Contingency Matrix in Machine Learning template for PowerPoint & Google Slides
Technology
Q-Learning Process Flow Diagram Template for PowerPoint & Google Slides
Process
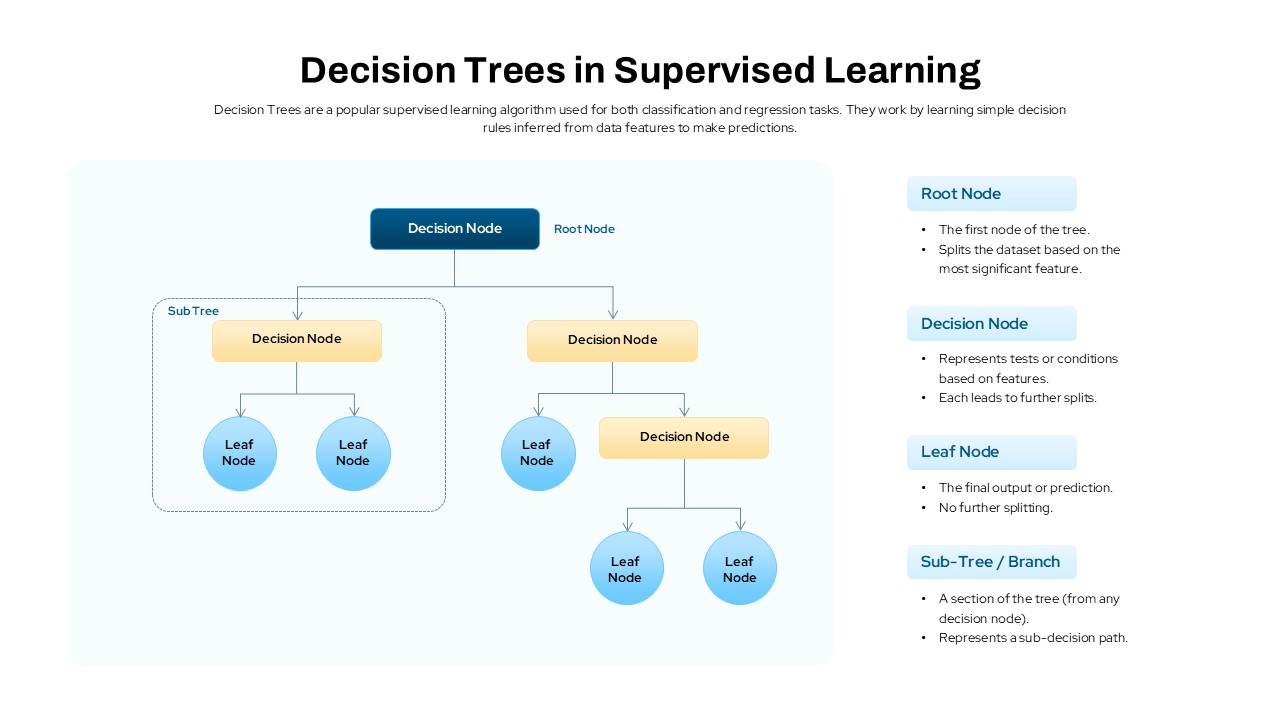
Decision Trees in Supervised Learning Template for PowerPoint & Google Slides
Machine Learning
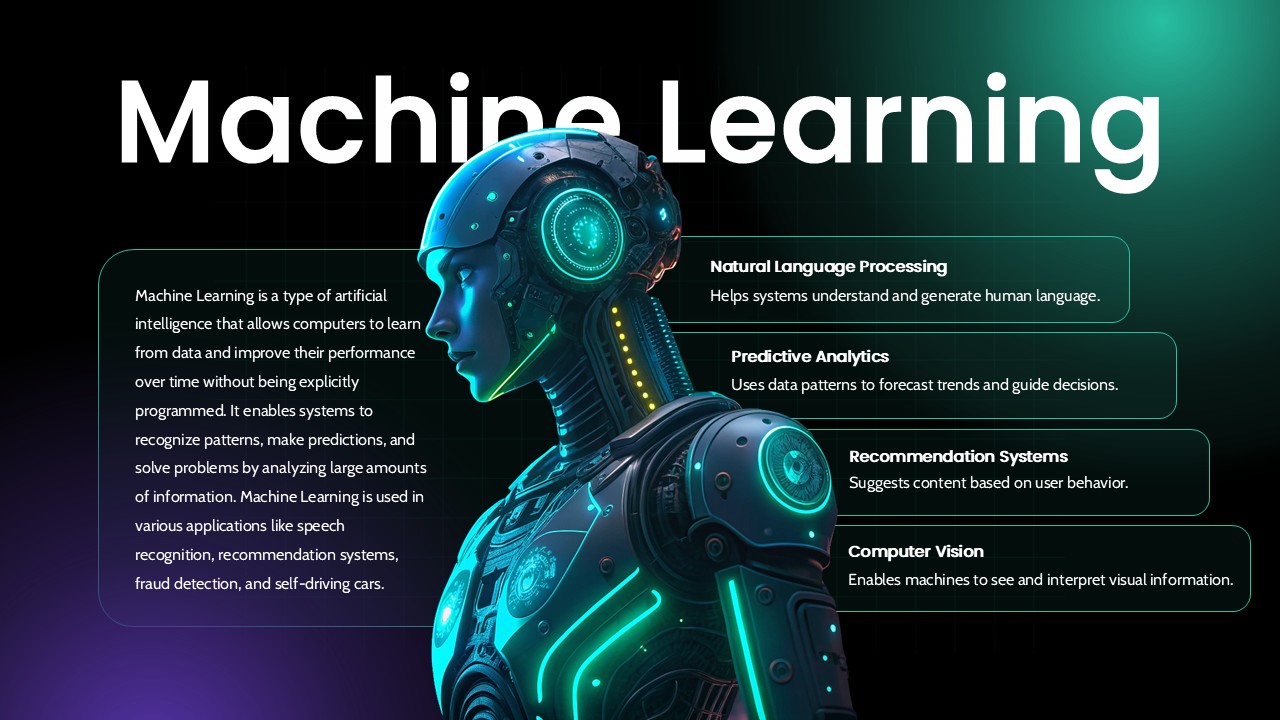
Machine Learning Overview Slide Template for PowerPoint & Google Slides
Machine Learning
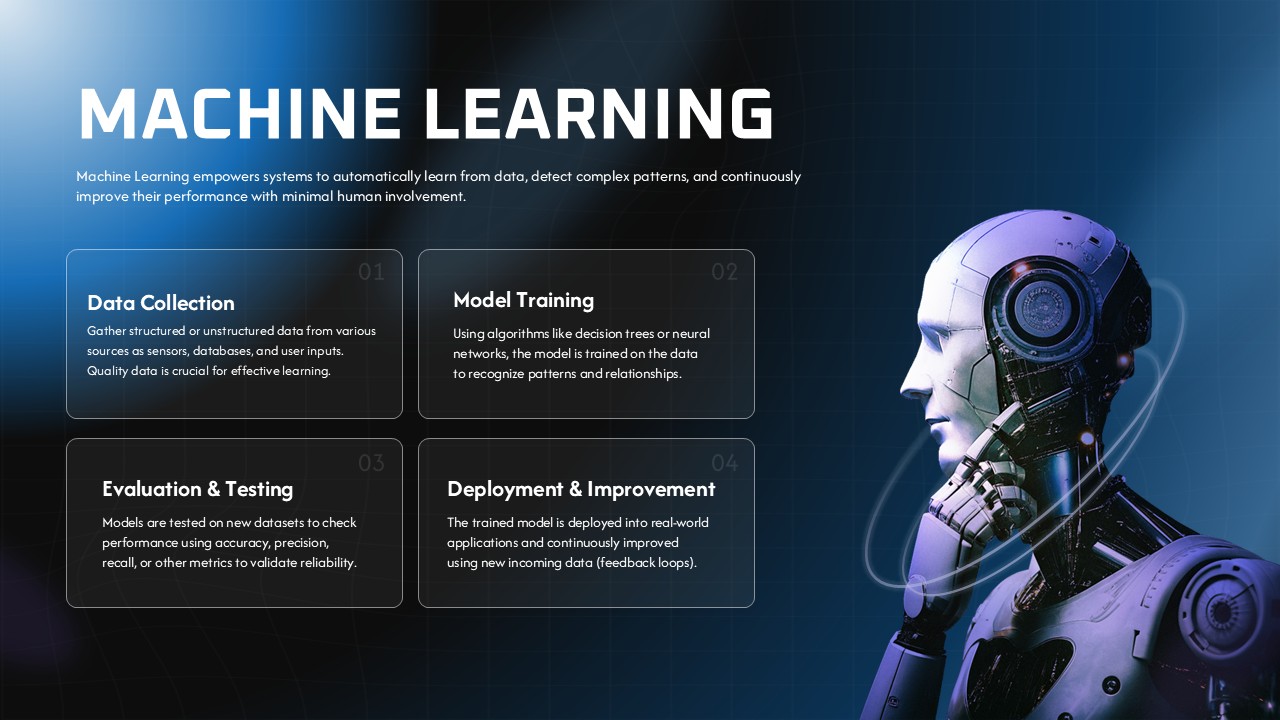
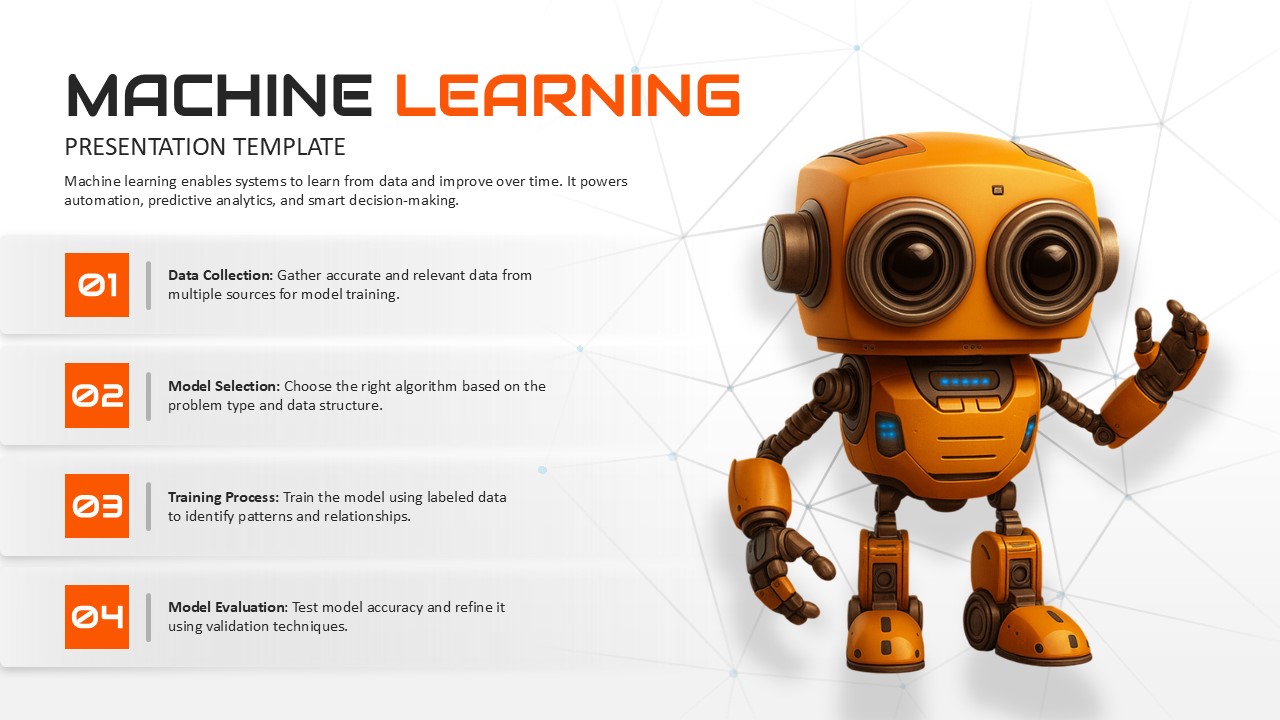
Machine Learning Four-Step Process Template for PowerPoint & Google Slides
Machine Learning
Machine Learning Three-Step Process Template for PowerPoint & Google Slides
Machine Learning
Free Machine Learning Concept Slide Template for PowerPoint & Google Slides
Machine Learning
Free
Futuristic Machine Learning Types Overview Template for PowerPoint & Google Slides
AI
Machine Learning Pipeline Overview Template for PowerPoint & Google Slides
Machine Learning
Machine Learning Presentation Use Cases Template for PowerPoint & Google Slides
Machine Learning
Machine Learning 4-Step Workflow Template for PowerPoint & Google Slides
Machine Learning
Machine Learning Model Management Template for PowerPoint & Google Slides
Machine Learning
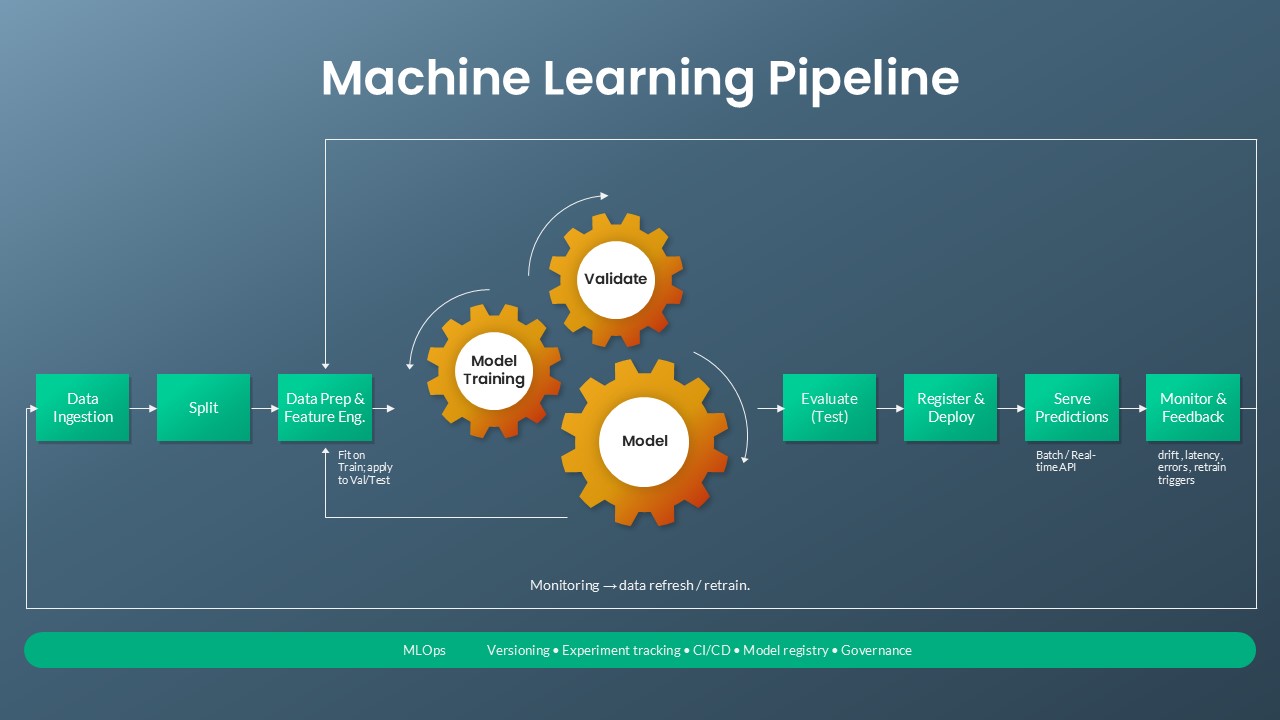
Machine Learning Pipeline & MLOps Flow Template for PowerPoint & Google Slides
Machine Learning
Machine Learning Process Template for PowerPoint & Google Slides
Machine Learning
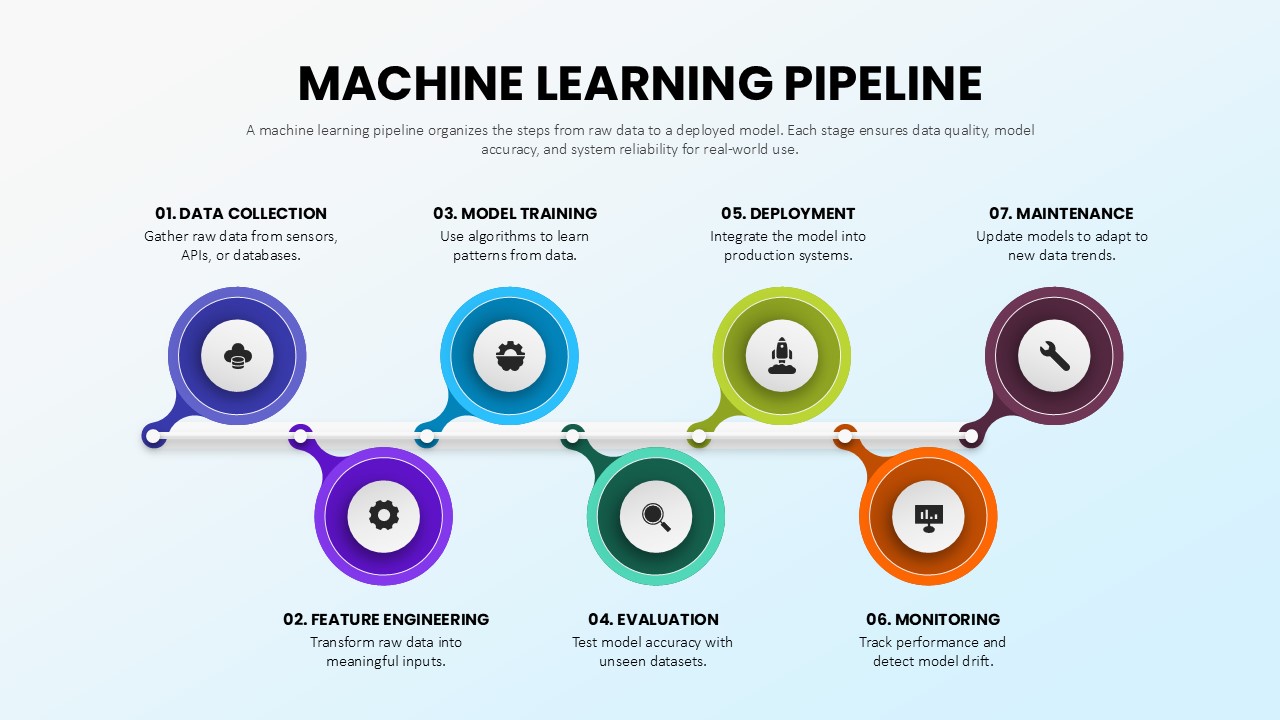
Seven Stage Machine Learning Pipeline Template for PowerPoint & Google Slides
Machine Learning
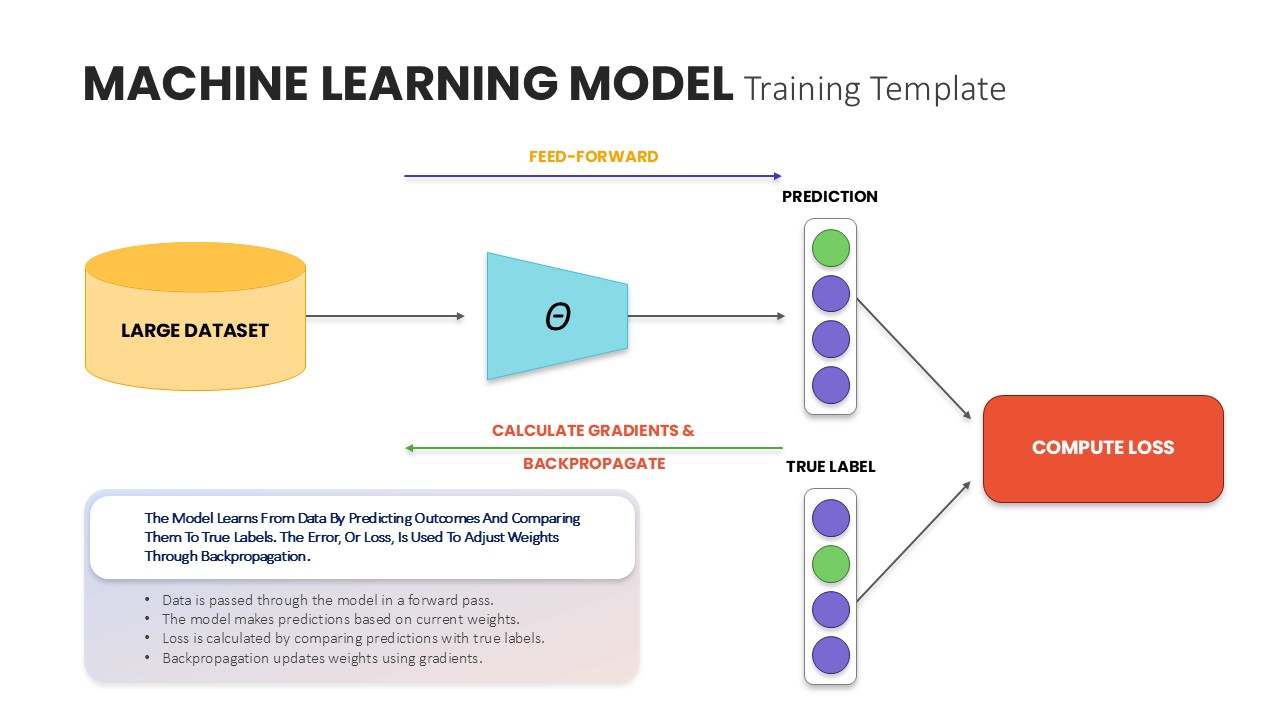
Machine Learning Model Training Template for PowerPoint & Google Slides
Machine Learning