IT Maturity Model with Five Stages Template for PowerPoint & Google Slides


Description
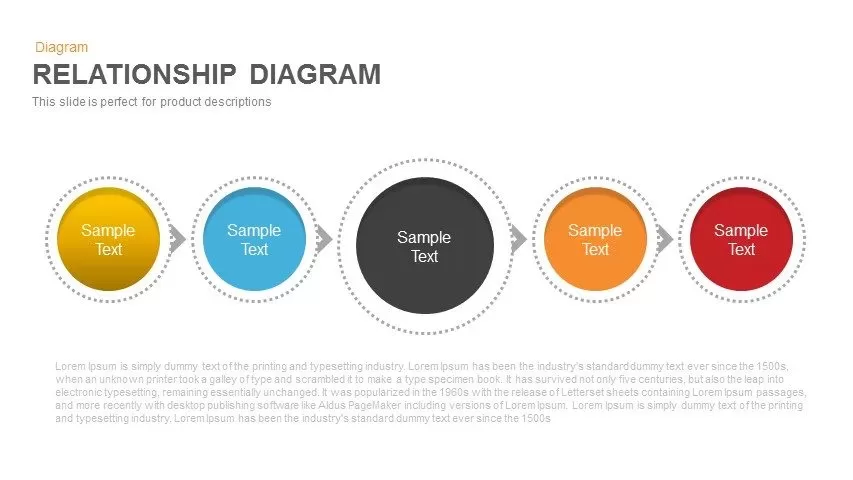
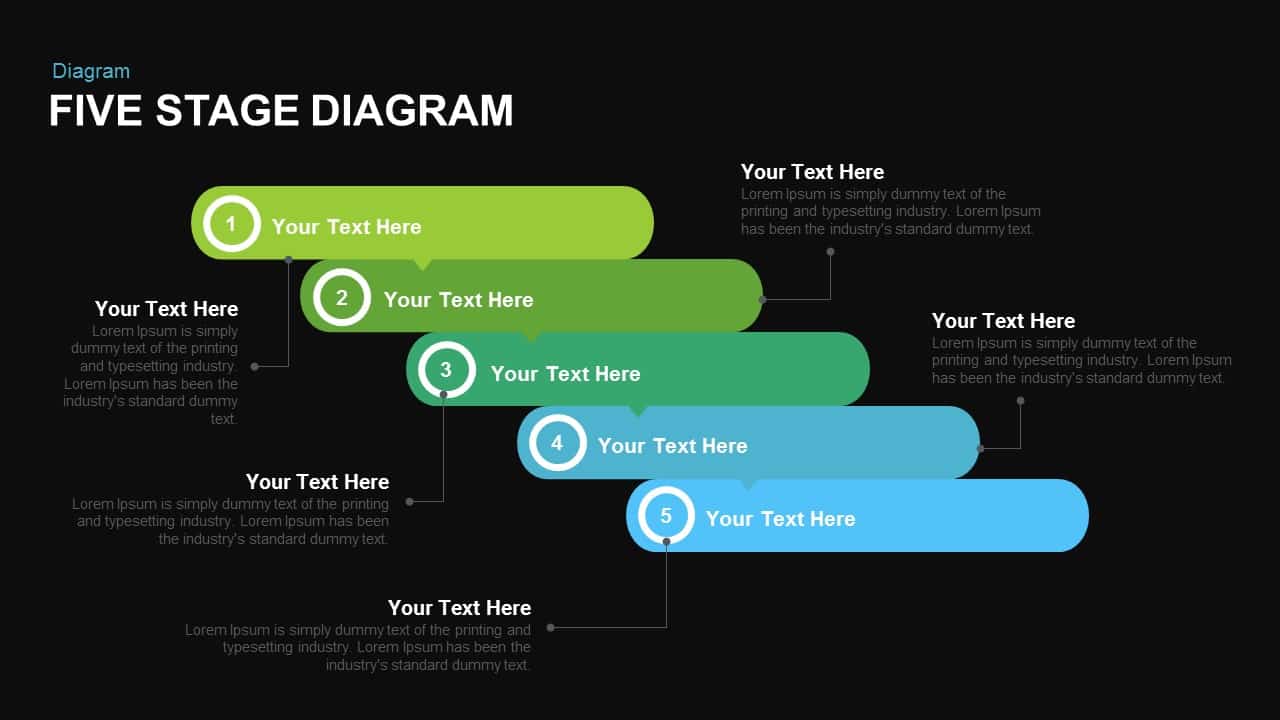
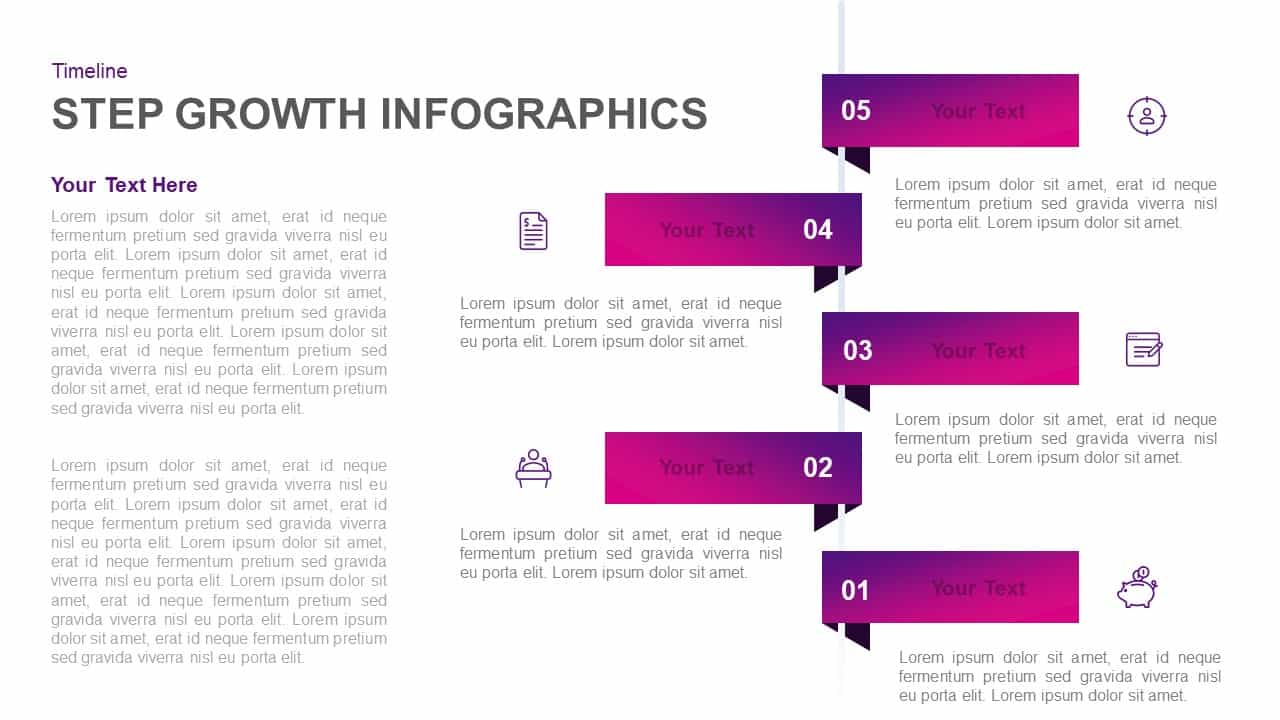
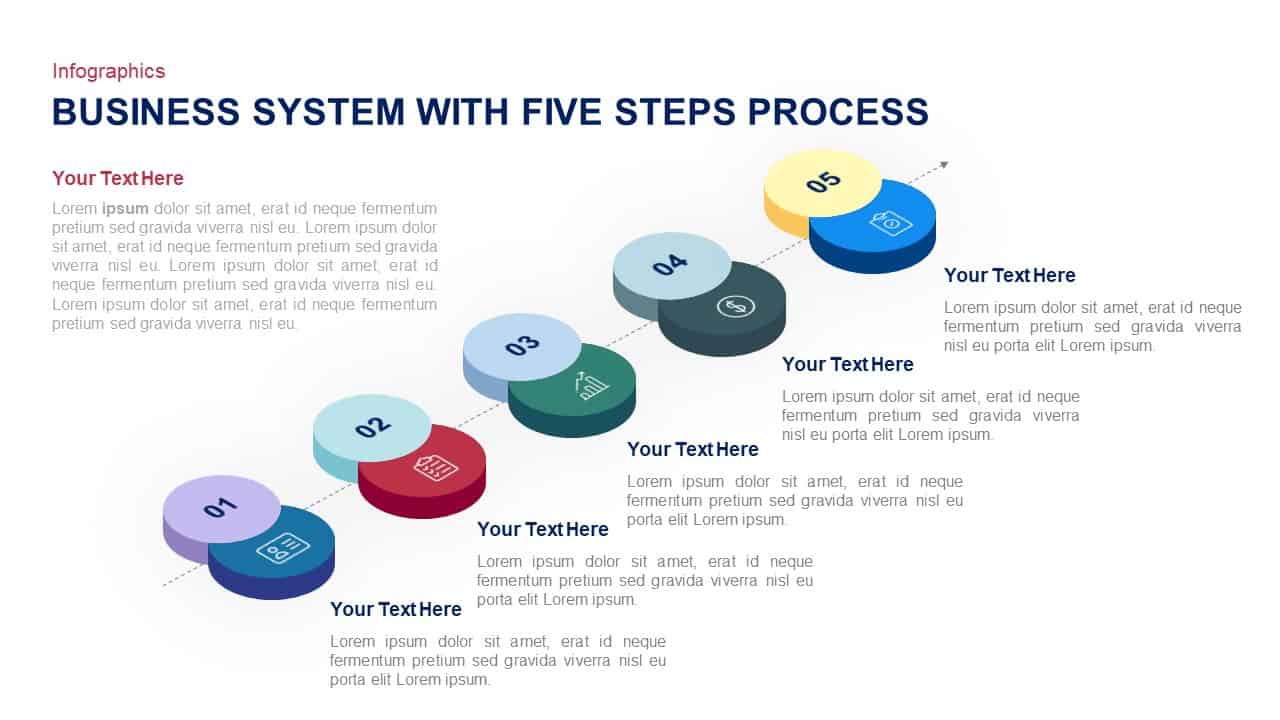
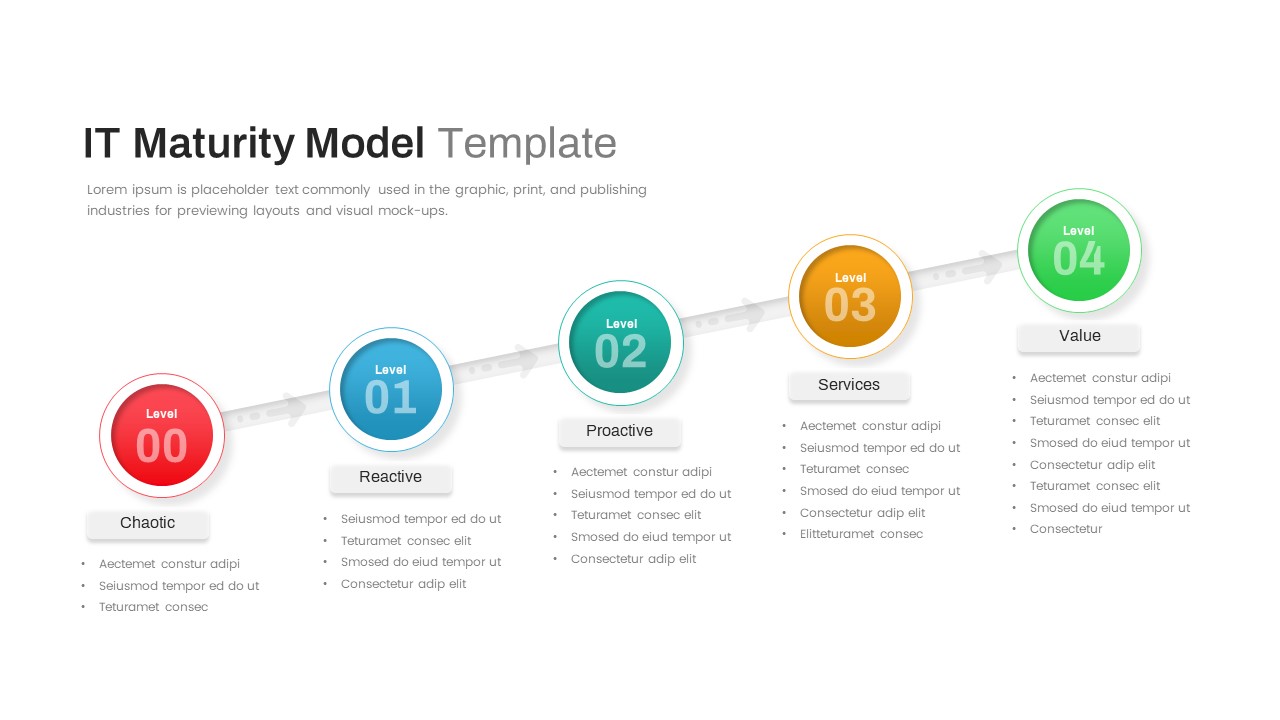
This IT Maturity Model slide visually charts five progressive stages of organizational IT capability, from the initial Chaotic state through Reactive and Proactive phases to Services optimization and full Value delivery. Each stage is represented by a bold, color-coded circular marker—red, blue, teal, orange, and green—aligned along an ascending arrow. Underneath each marker, clear text placeholders and bullet-style callouts let you annotate key characteristics, milestones, or action items specific to each maturity level.
Designed for maximum clarity and professional polish, the slide features clean typography, subtle drop shadows, and ample white space against a neutral background. All shapes are vector-based and fully editable in both PowerPoint and Google Slides: swap colors, resize circles, adjust the arrow connector, or replace icons in seconds. Leveraging master slide configurations and intuitive layout guides, you can maintain brand consistency across your deck while accelerating content updates.
The balanced linear flow simplifies complex IT assessments and strategic roadmaps, making it easy for stakeholders to grasp progression pathways at a glance. Pre-configured color themes and one-click style swaps ensure seamless integration with existing corporate templates. Because it’s optimized for widescreen formats, this slide preserves crisp resolution on any device, eliminating formatting headaches and ensuring professional-grade presentations every time.
Who is it for
IT leaders, CIOs, digital transformation teams, and technology consultants will benefit from this maturity model when assessing current capabilities, planning roadmap initiatives, or presenting readiness evaluations to executives and cross-functional stakeholders.
Other Uses
Beyond IT, repurpose this framework for process improvement roadmaps, organizational capability assessments, security maturity evaluations, vendor management workflows, or any multi-stage lifecycle visualization requiring clear, color-coded progression.
Login to download this file

Item ID
SB03496
Related Templates

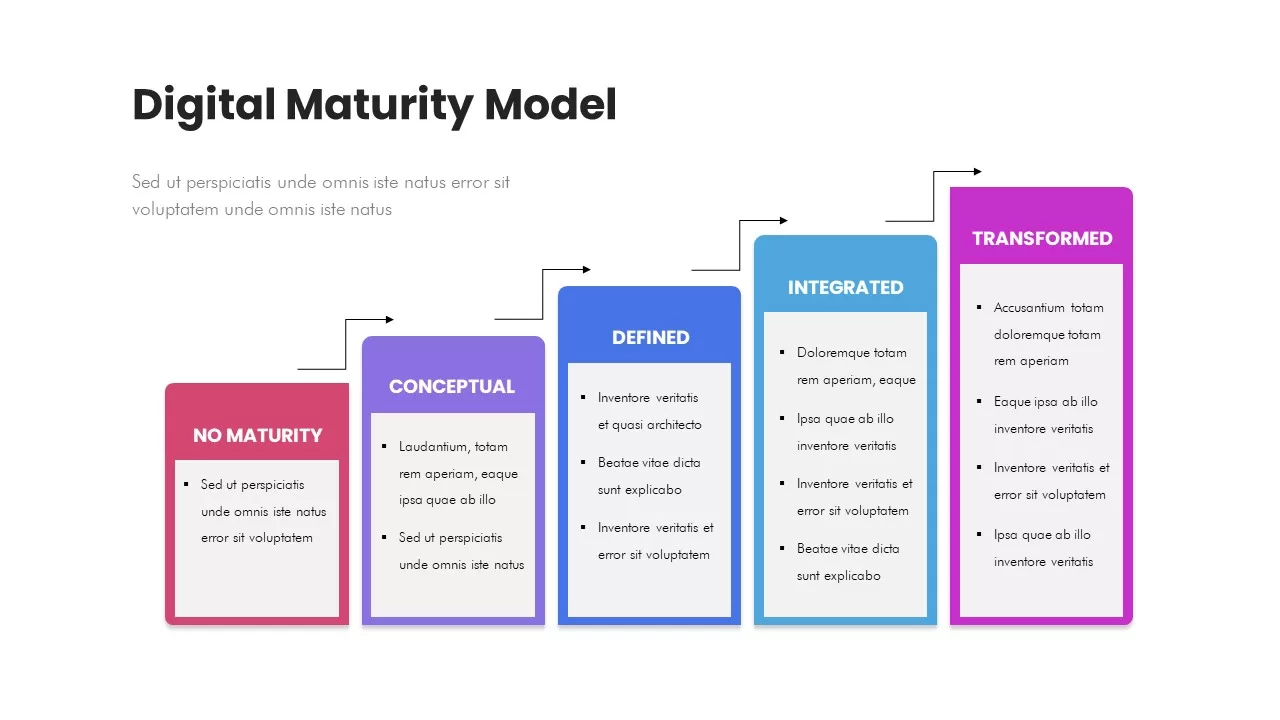
Digital Maturity Model Stages Diagram Template for PowerPoint & Google Slides
Process
Five-Stage Digital Maturity Model Diagram Template for PowerPoint & Google Slides
Process

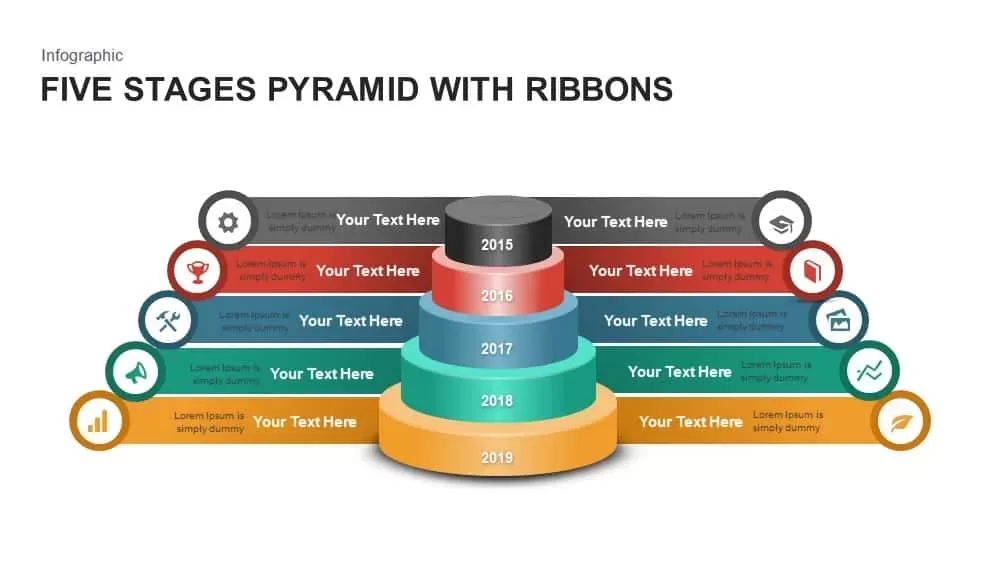
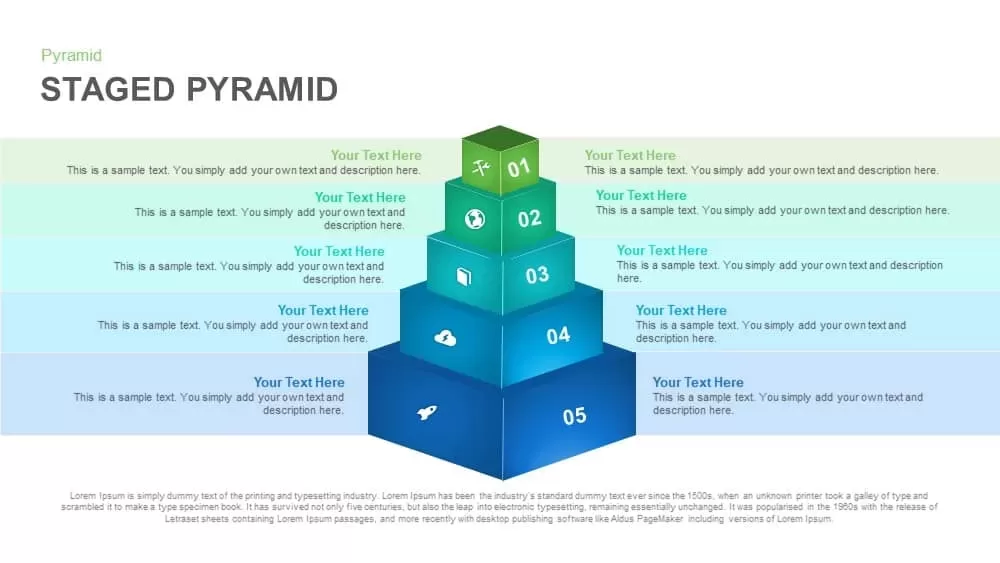
Five Stages Pyramid with Ribbons Diagram Template for PowerPoint & Google Slides
Pyramid

Four-Phase Maturity Model Diagram Template for PowerPoint & Google Slides
Process
Organizational Maturity Model Diagram Template for PowerPoint & Google Slides
Process
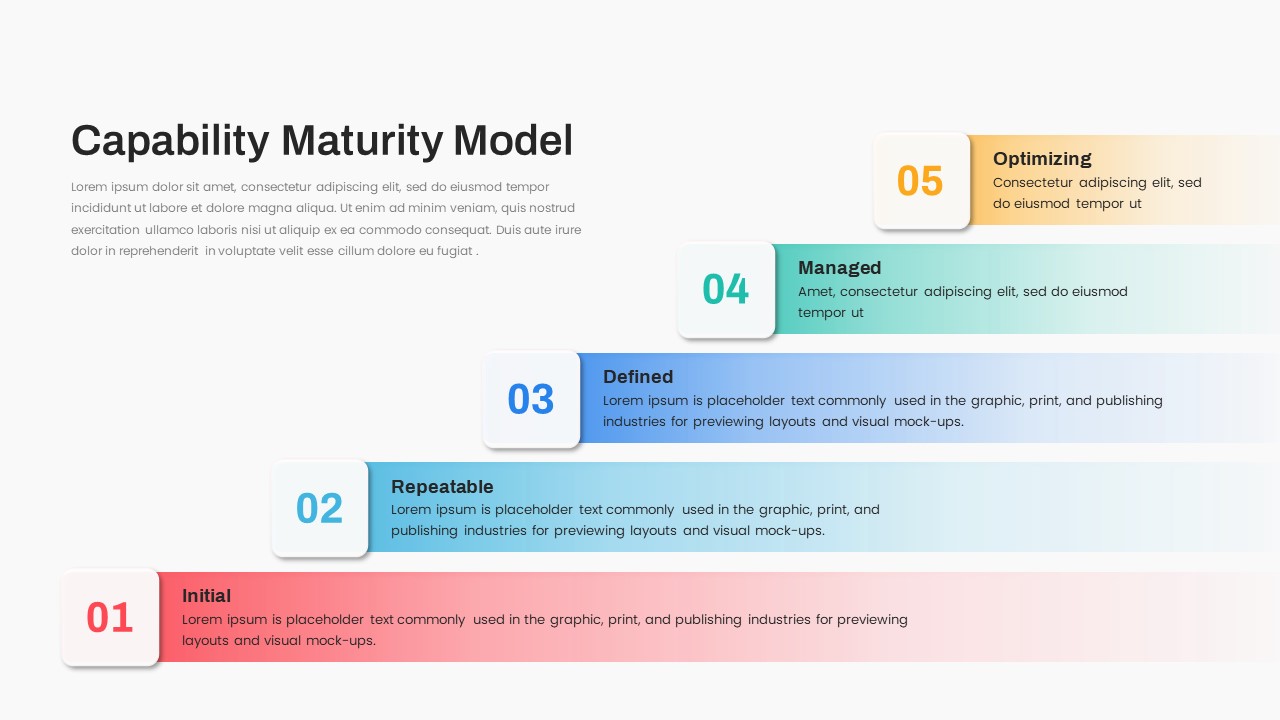
Capability Maturity Model Infographic Template for PowerPoint & Google Slides
Software Development
Layered Data Governance Maturity Model Template for PowerPoint & Google Slides
Process
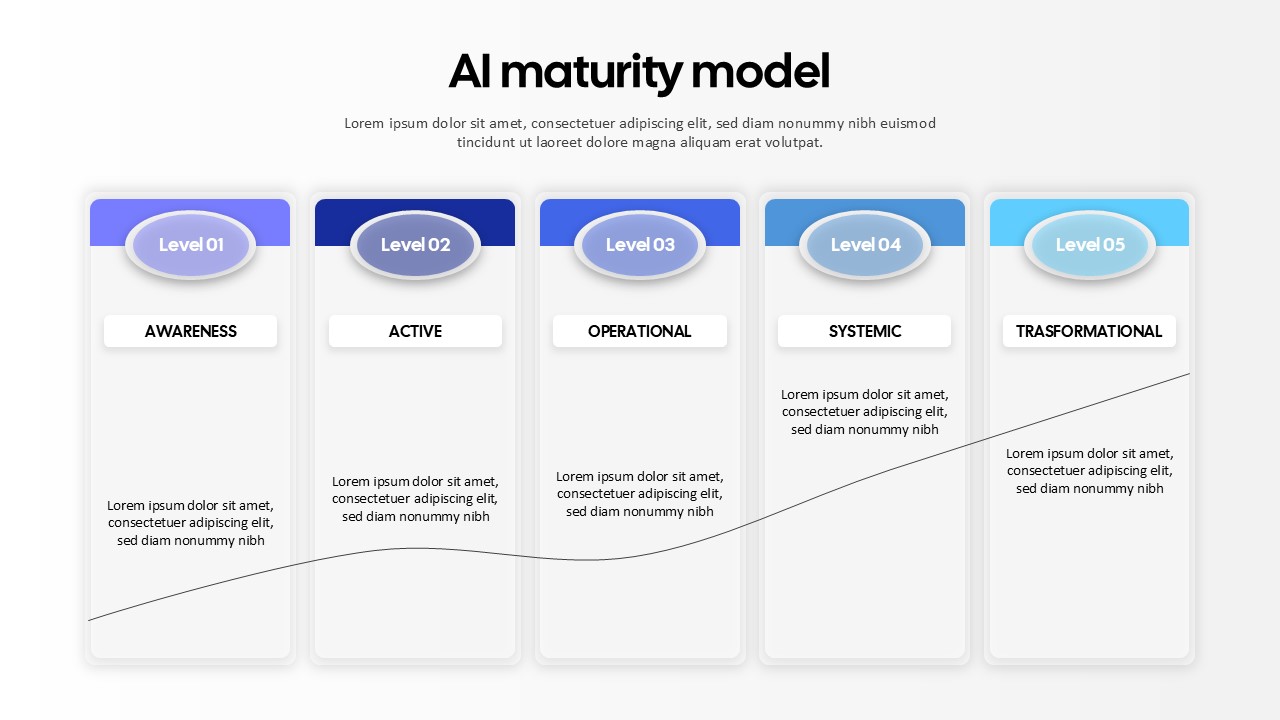
AI Maturity Model Levels template for PowerPoint & Google Slides
Technology
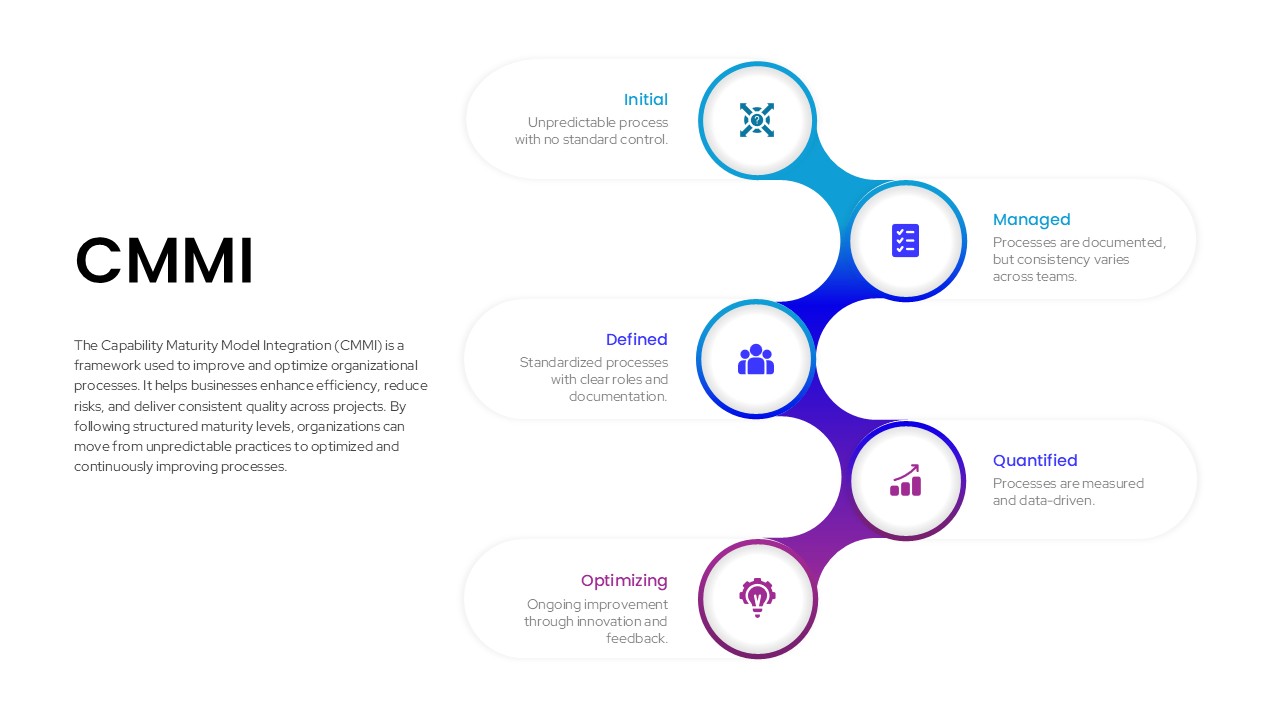
CMMI Process Maturity Model Infographic Template for PowerPoint & Google Slides
Process
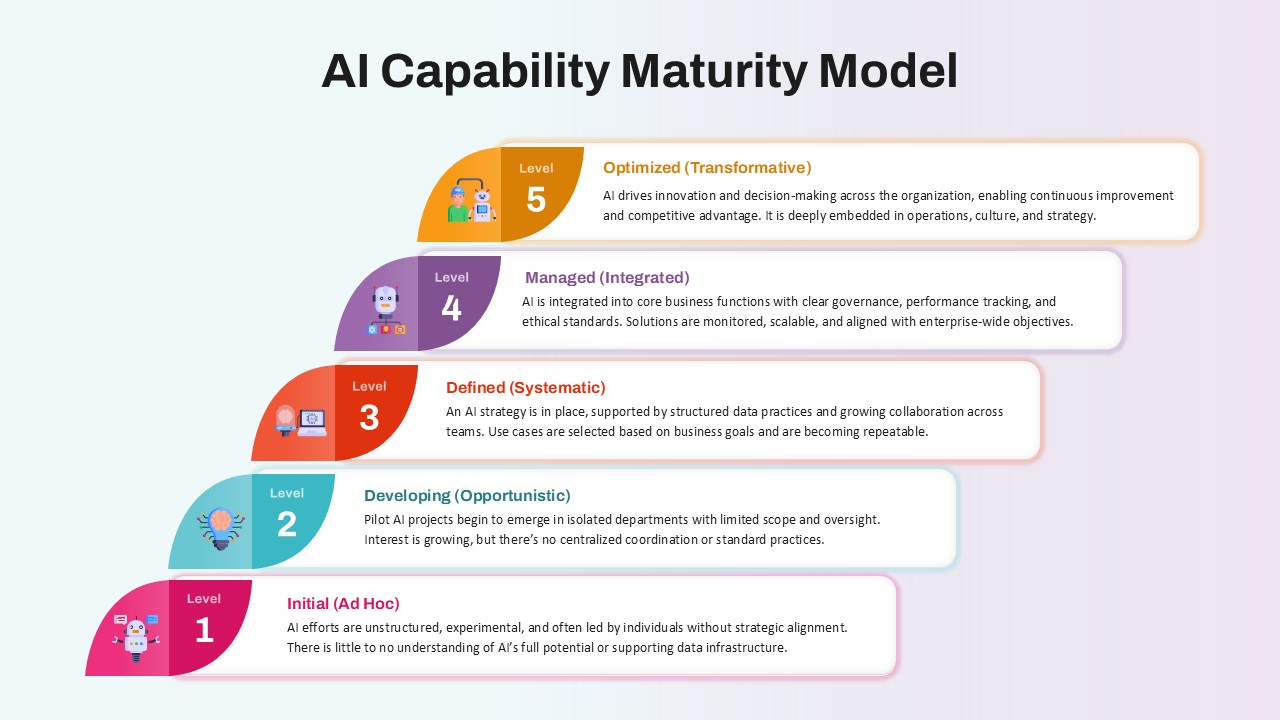
AI Capability Maturity Model Overview for PowerPoint & Google Slides
Technology
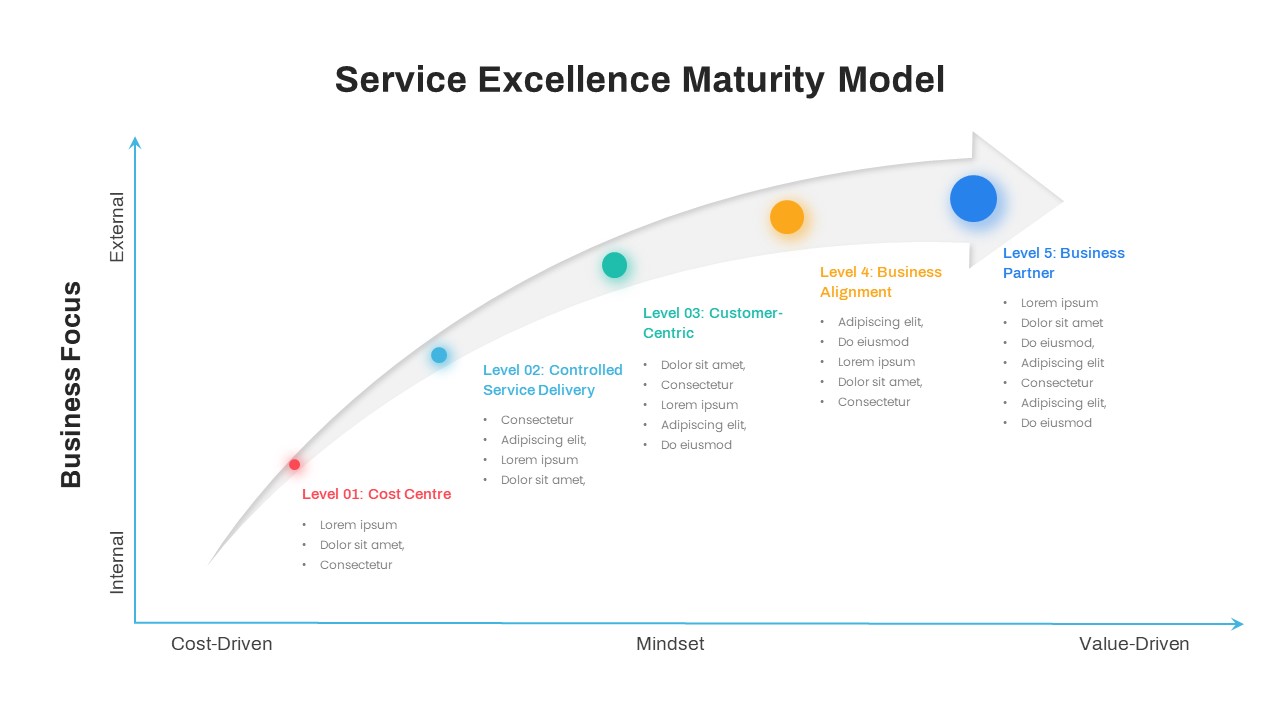
Service Excellence Maturity 5-Stage Template for PowerPoint & Google Slides
Process
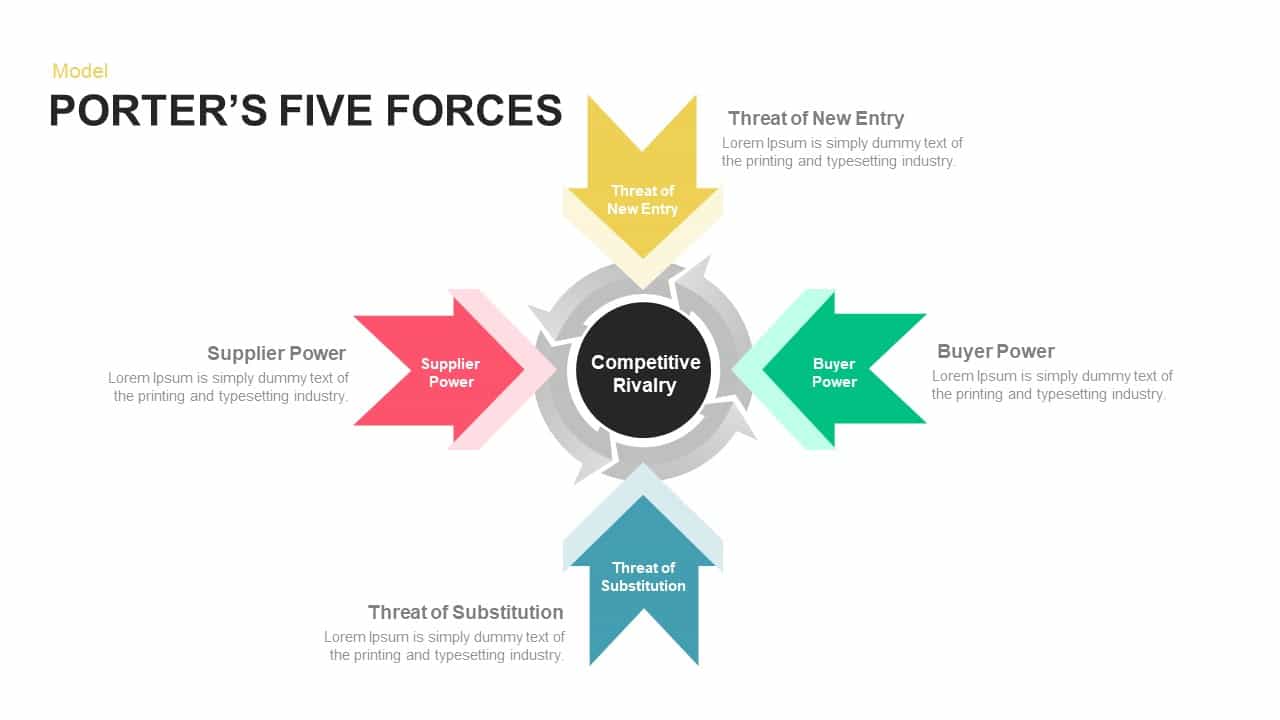
Porter’s Five Forces Model Diagram Template for PowerPoint & Google Slides
Competitor Analysis
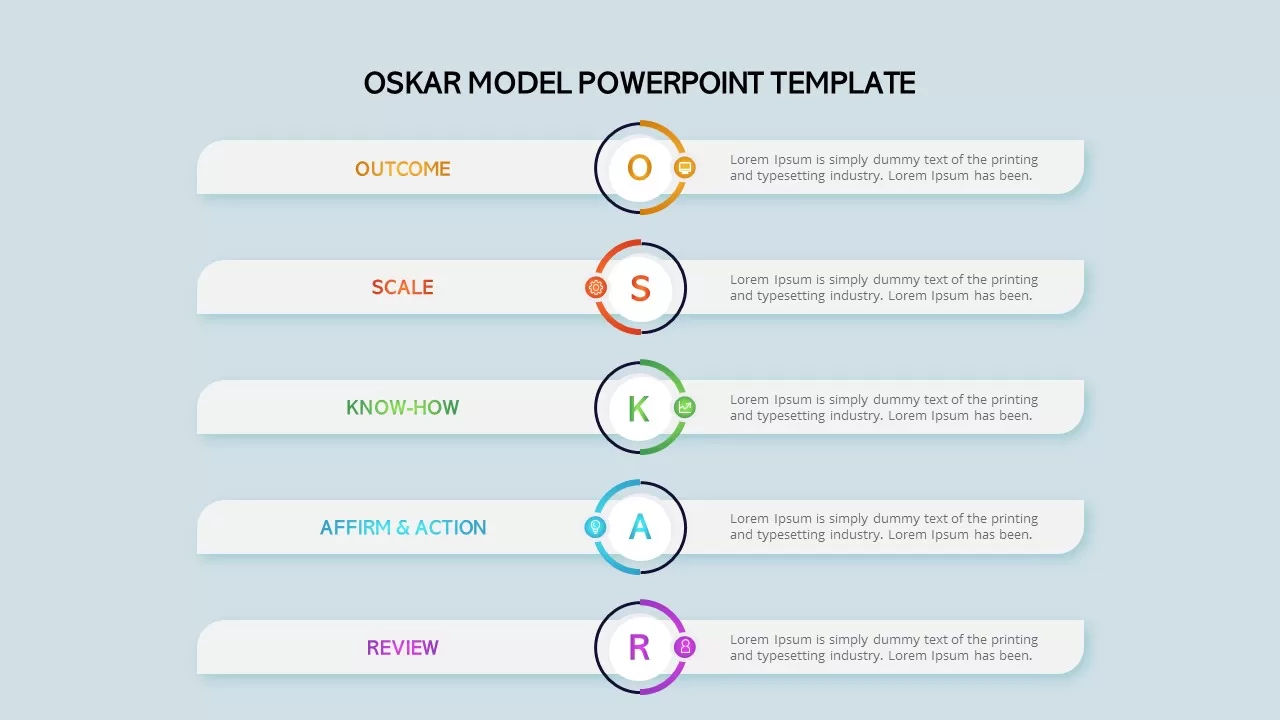
OSKAR Coaching Model Five-Step Framework Template for PowerPoint & Google Slides
Leadership
Six Hexagon Stages Process Flow Diagram Template for PowerPoint & Google Slides
Process
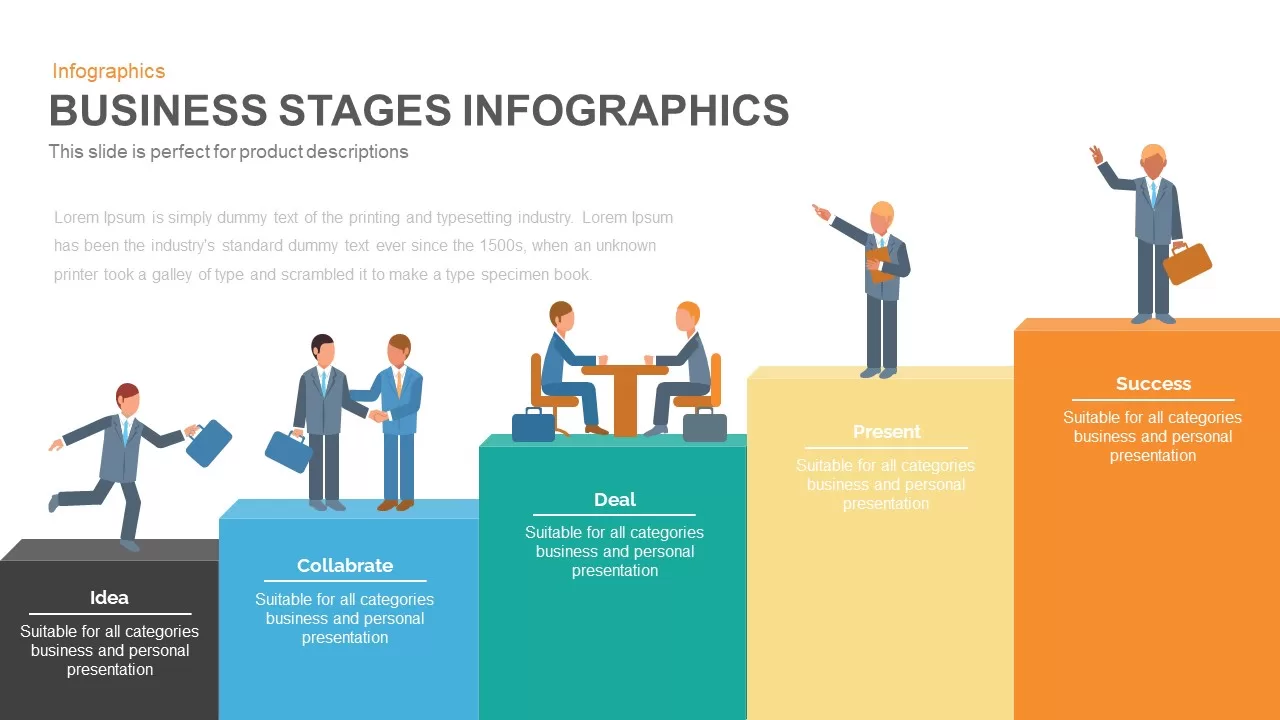
Business Stages Progression Infographic template for PowerPoint & Google Slides
Process
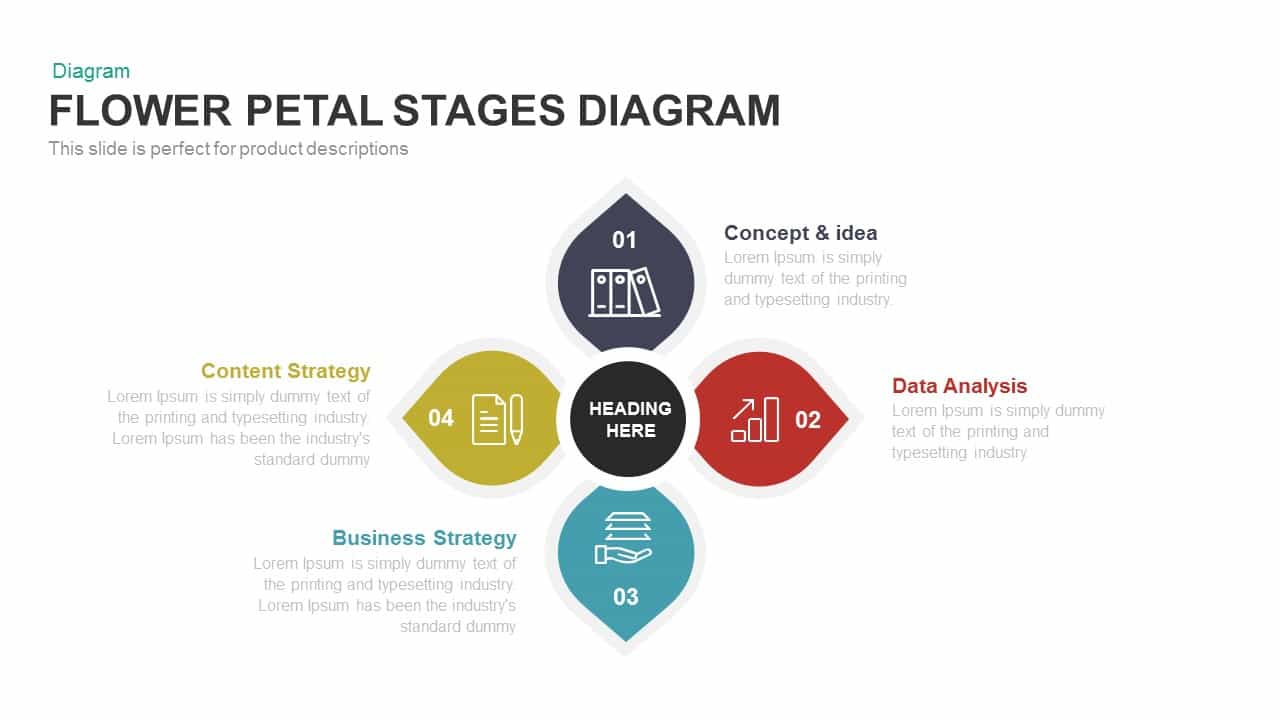
Modern Flower Petal Stages Diagram Template for PowerPoint & Google Slides
Circular

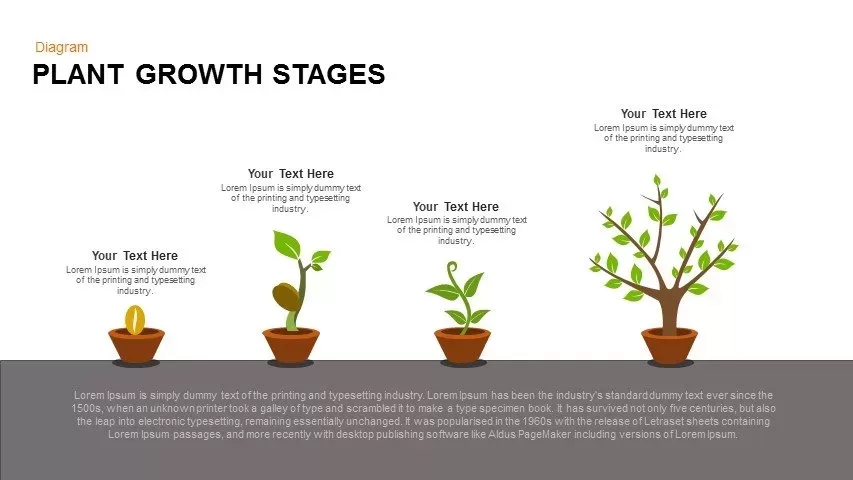
Editable Plant Growth Stages Diagram Template for PowerPoint & Google Slides
Process

10 Stages Business Flow Process Diagram template for PowerPoint & Google Slides
Business
7 Stages Jigsaw Diagram template for PowerPoint & Google Slides
Process

3 Stages Hexagon Shaped Diagram template for PowerPoint & Google Slides
Infographics
3, 4 & 5 Circular Stages Cycle Diagram Deck Template for PowerPoint & Google Slides
Circular
Stages Process Template for PowerPoint & Google Slides
Process
Problem Solving Stages Template for PowerPoint & Google Slides
Infographics
PDCA Cycle Infographic with Four Stages Template for PowerPoint & Google Slides
Process
6 Stage Hub and Spoke Stages template for PowerPoint & Google Slides
Business Models
Inverted Sales Funnel Marketing Stages Template for PowerPoint & Google Slides
Marketing Funnel
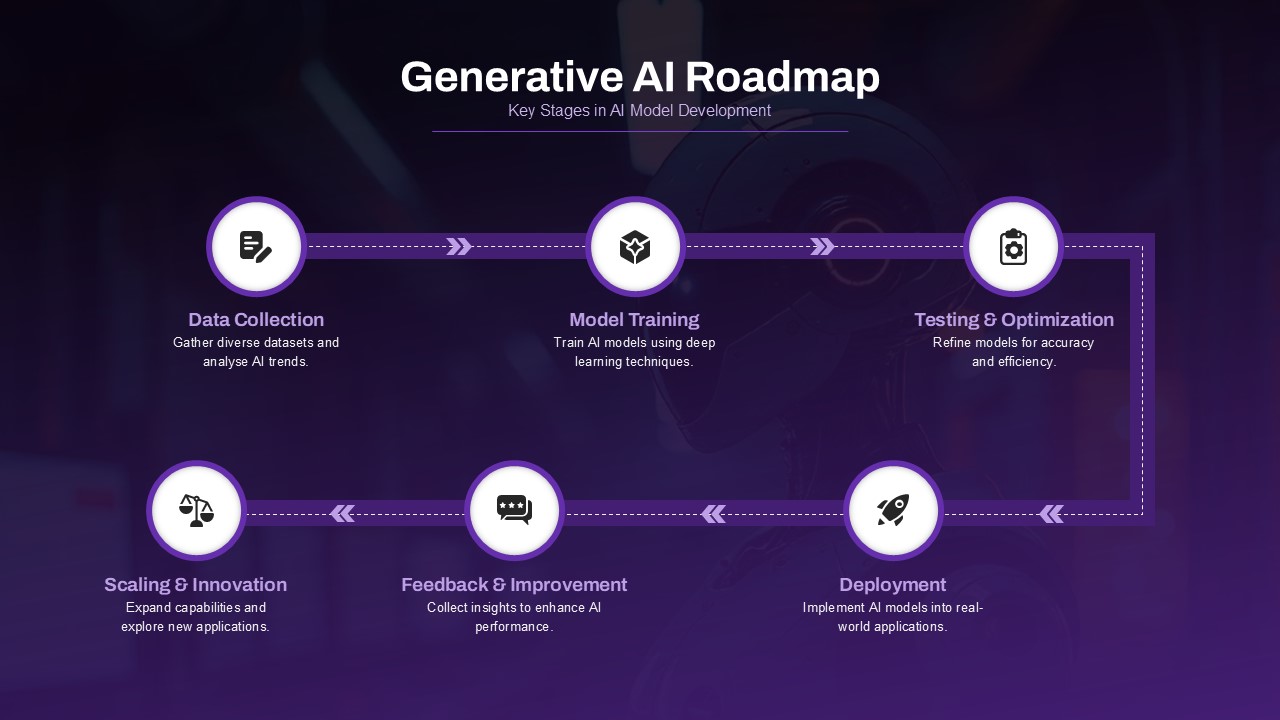
Generative AI Roadmap Key Stages Template for PowerPoint & Google Slides
Roadmap
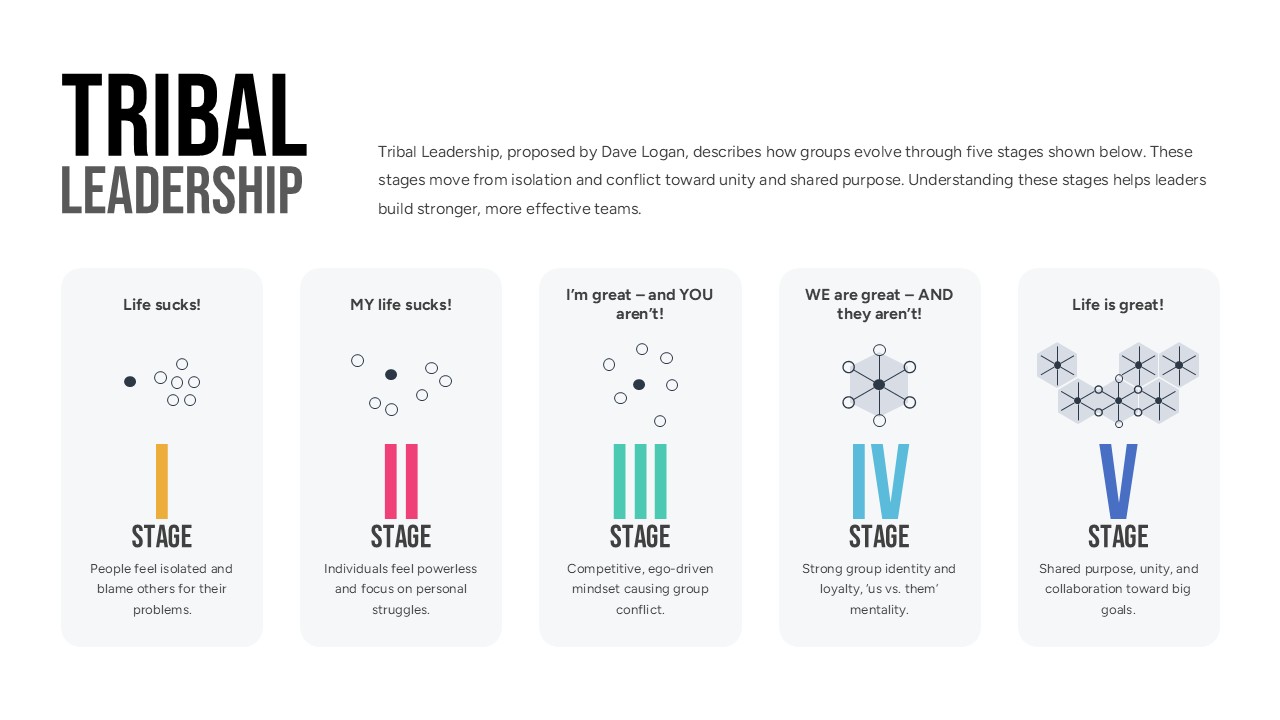
Tribal Leadership Stages Overview template for PowerPoint & Google Slides
Business
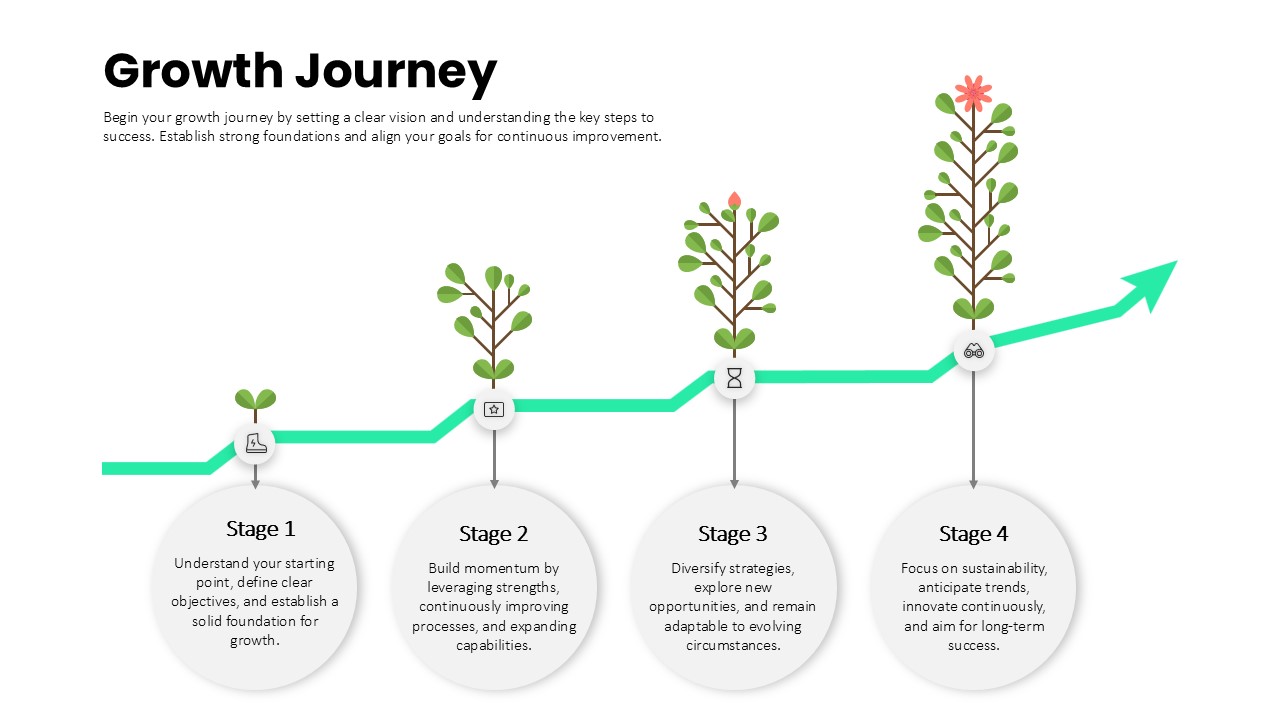
Growth Journey Stages Process template for PowerPoint & Google Slides
Business Strategy
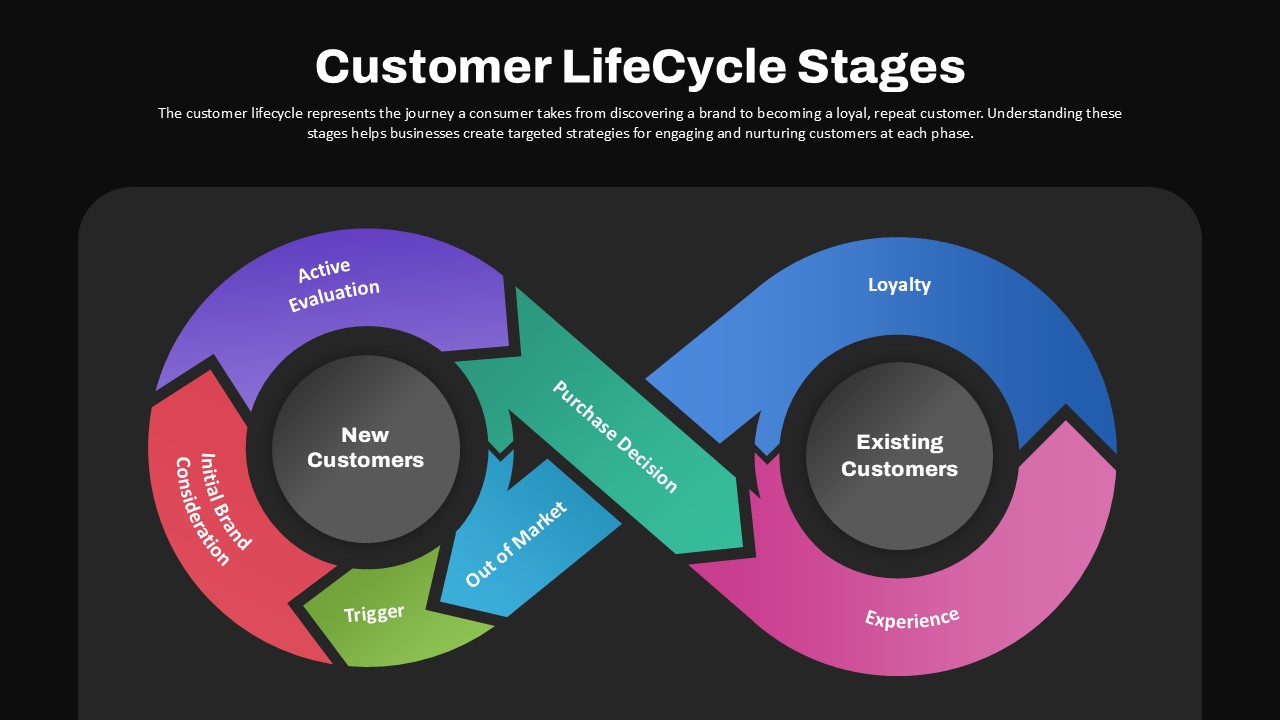
Customer Lifecycle Stages Infinity Loop Template for PowerPoint & Google Slides
Customer Journey
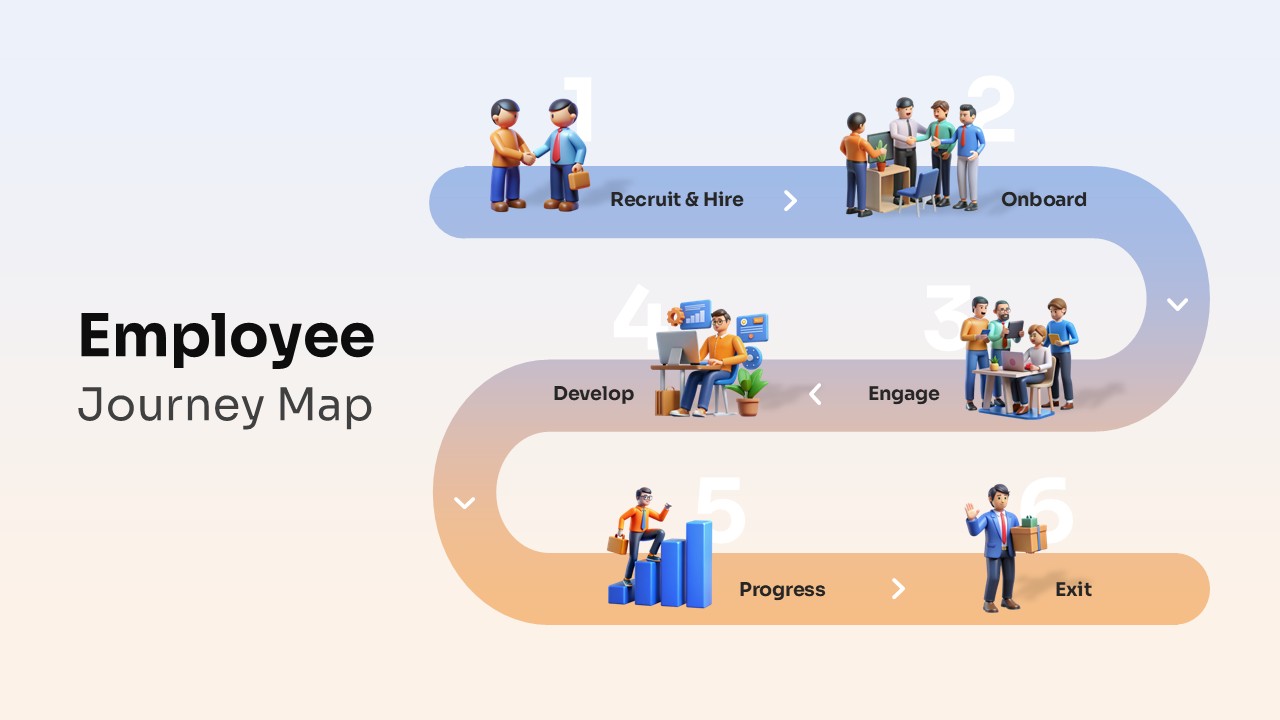
Employee Journey Map with Stages template for PowerPoint & Google Slides
Recruitment
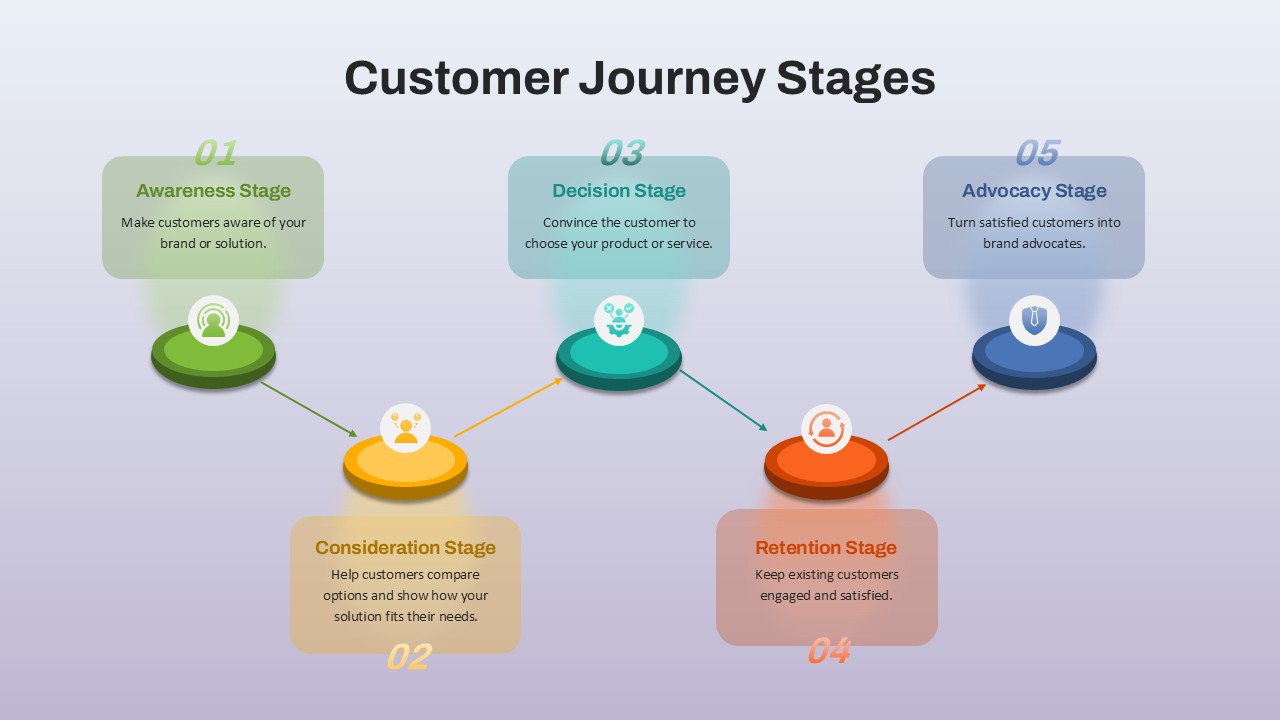
Customer Journey Stages template for PowerPoint & Google Slides
Business
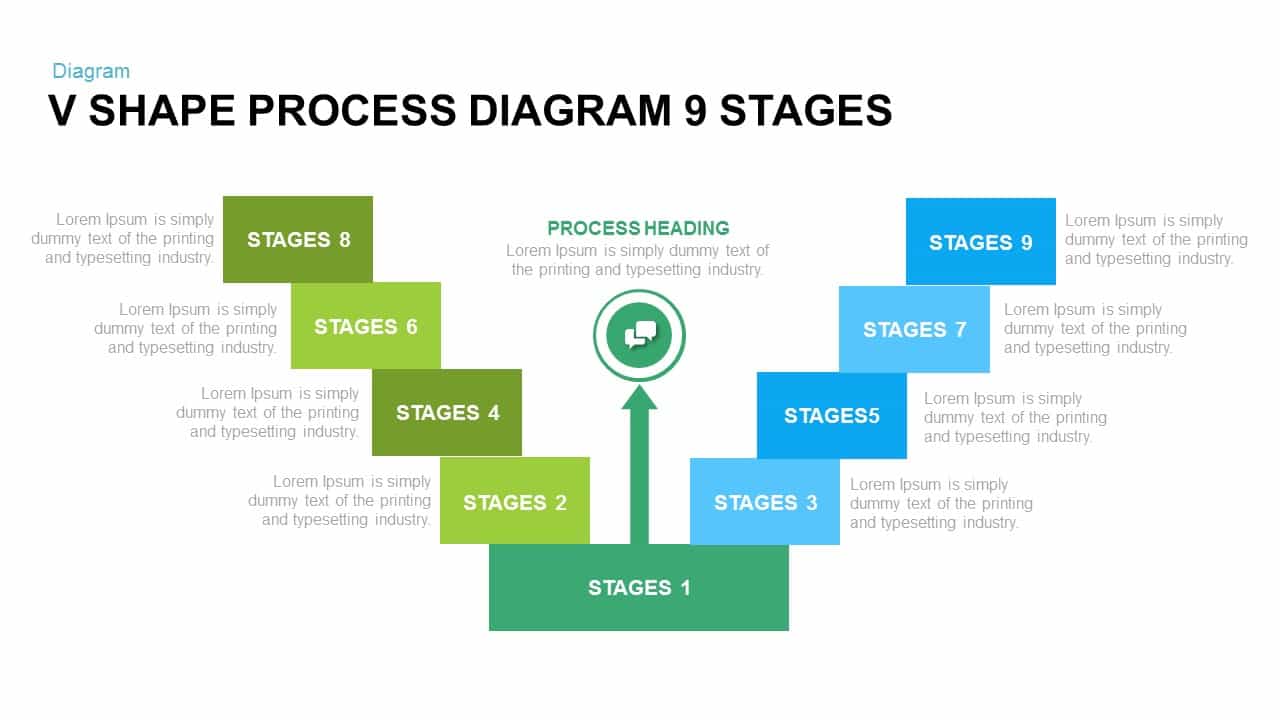
V Shape Process Diagram 9 Stages for PowerPoint & Google Slides
Infographics
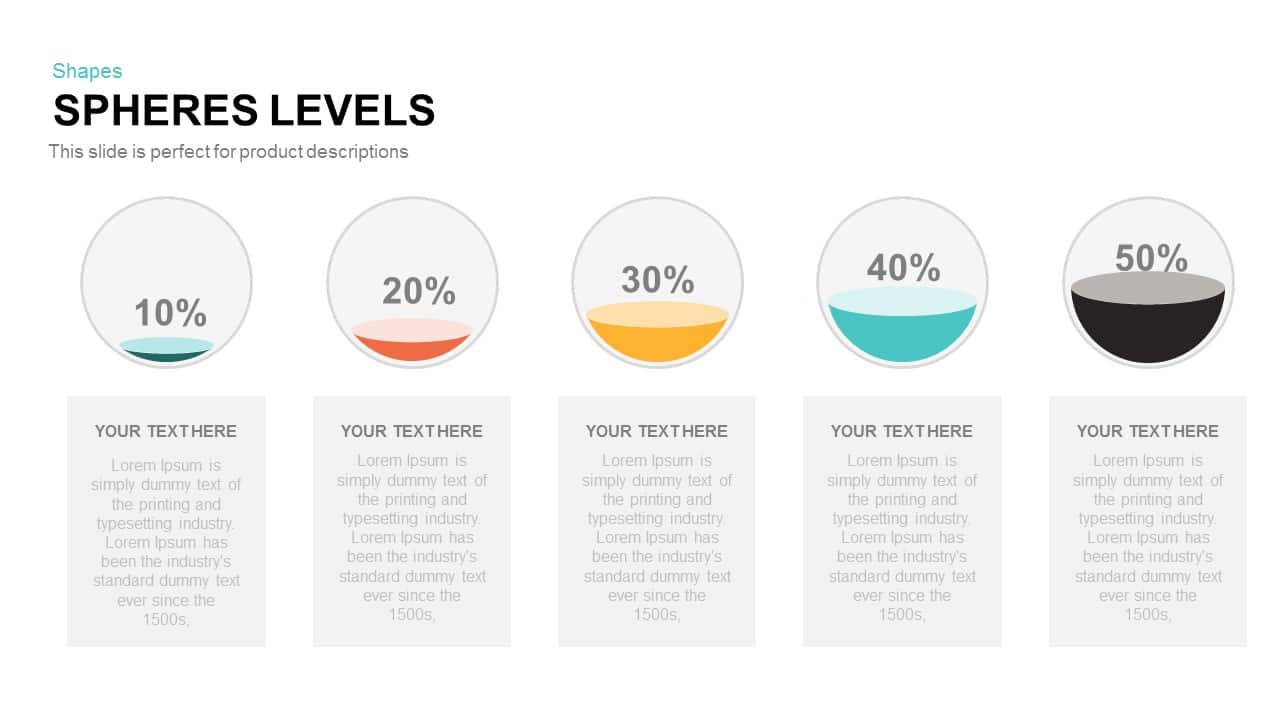
Five-Level Sphere Indicators Diagram template for PowerPoint & Google Slides
Infographics
Curved Five-Section Timeline Infographic template for PowerPoint & Google Slides
Timeline
Colorful Five-Stage Relationship Diagram Template for PowerPoint & Google Slides
Process
Five-Stage Arrow Infographics Timeline Template for PowerPoint & Google Slides
Arrow
Five-Stage Pyramid Infographics Diagram Template for PowerPoint & Google Slides
Pyramid
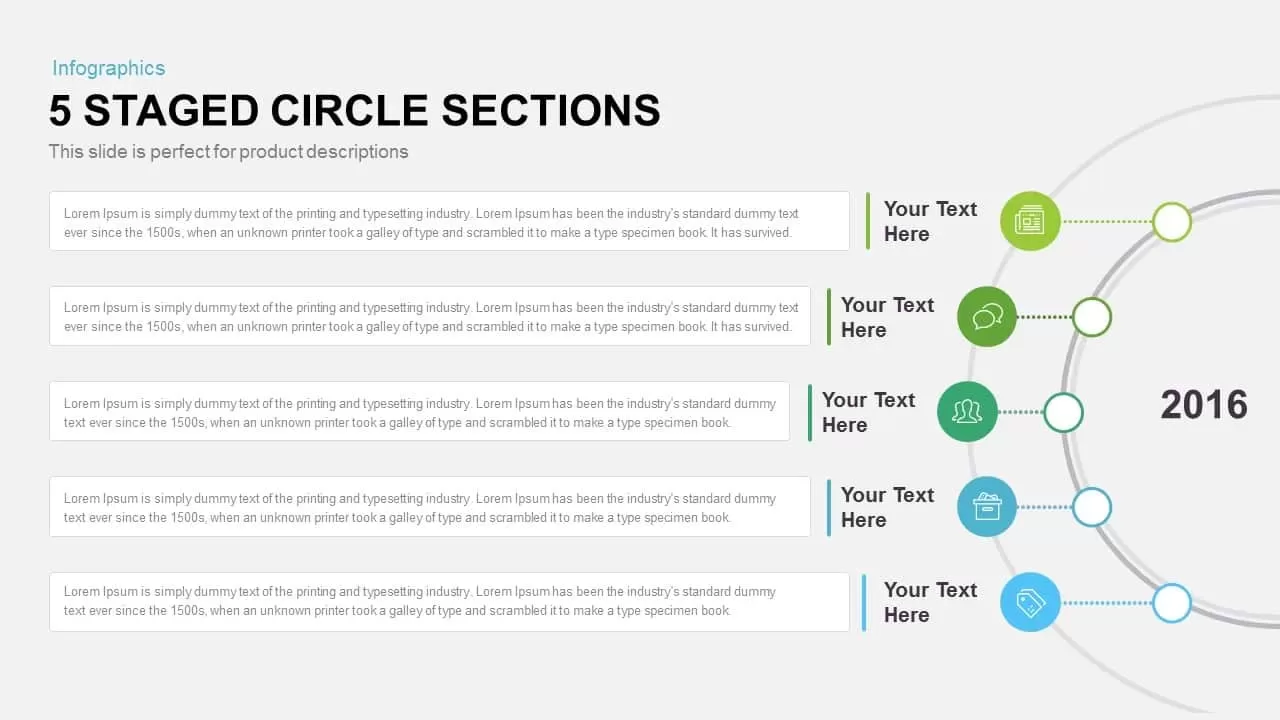
Five-Staged Circle Sections Diagram Template for PowerPoint & Google Slides
Circular
Engaging Five-Stage Process Diagram Template for PowerPoint & Google Slides
Process
Five-Stage Direct Flow Arrow Process Template for PowerPoint & Google Slides
Arrow
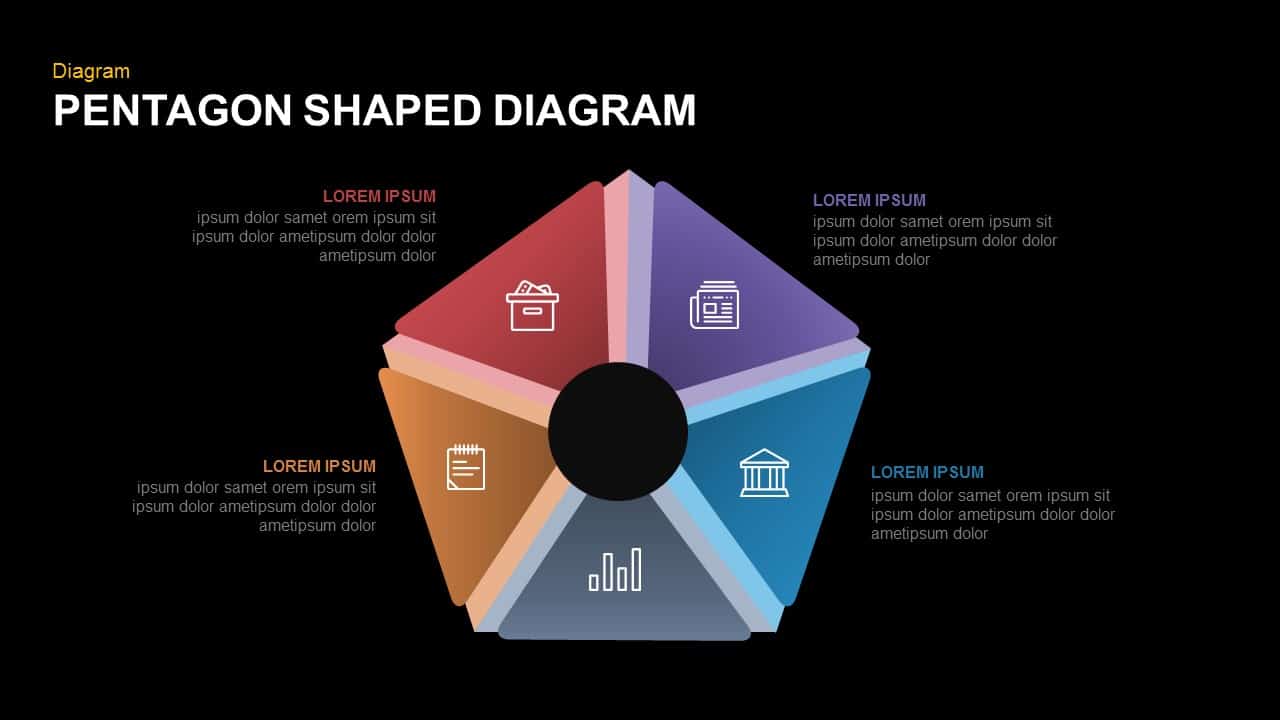
Five-Part Pentagon Shaped Diagram Template for PowerPoint & Google Slides
Process
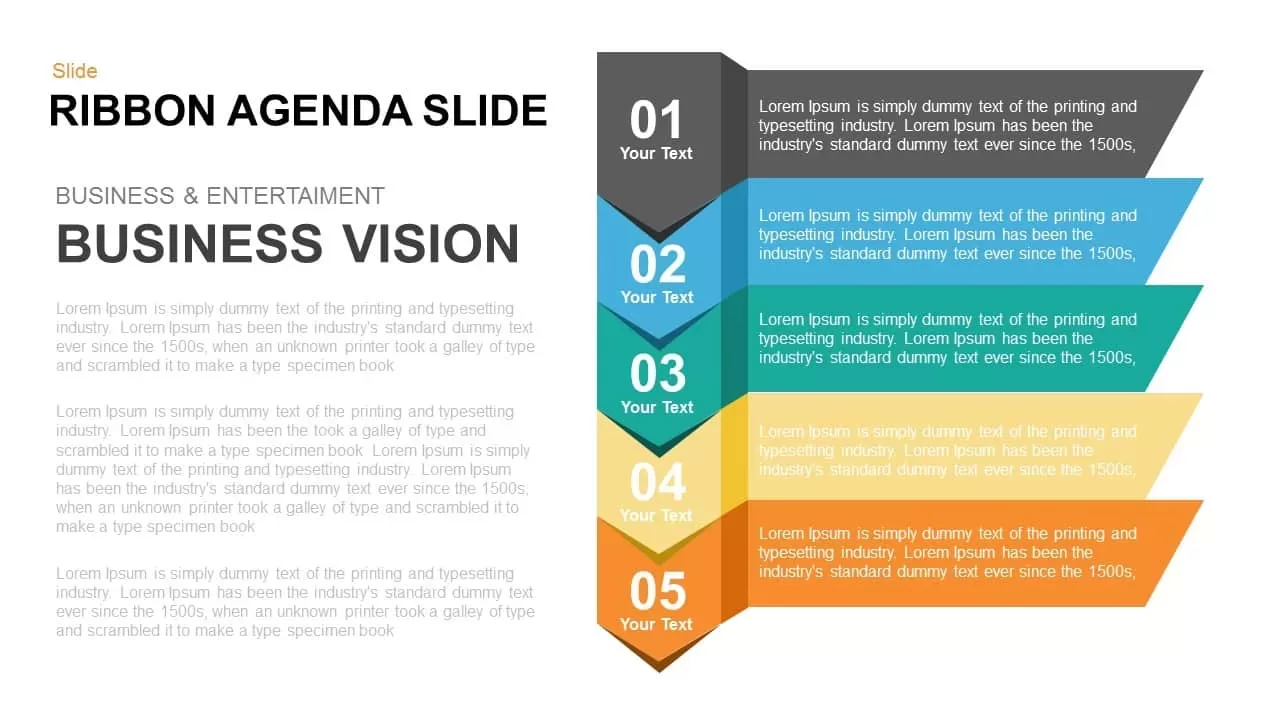
Dynamic Five-Step Ribbon Agenda Layout Template for PowerPoint & Google Slides
Agenda
Five-Step Concept to Delivery Process Template for PowerPoint & Google Slides
Process
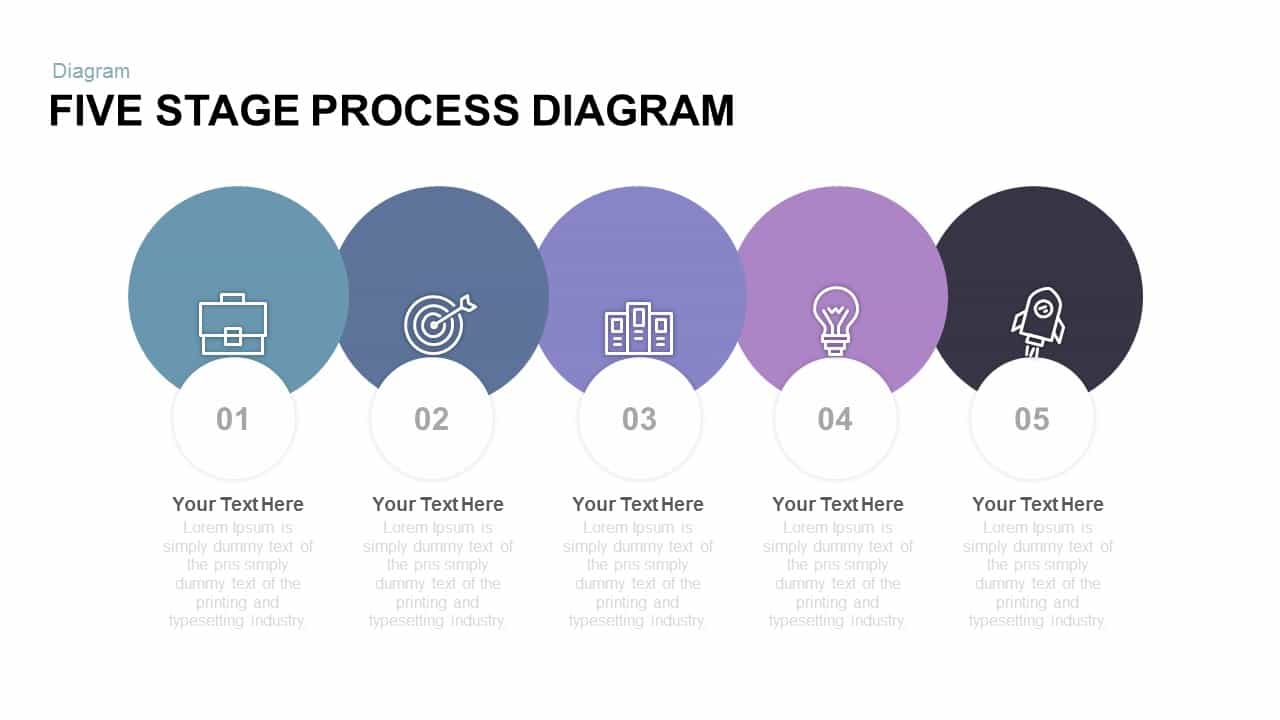
Five Stage Process Diagram template for PowerPoint & Google Slides
Process
Free
Five-Stage Growth Arrow Infographic Template for PowerPoint & Google Slides
Arrow
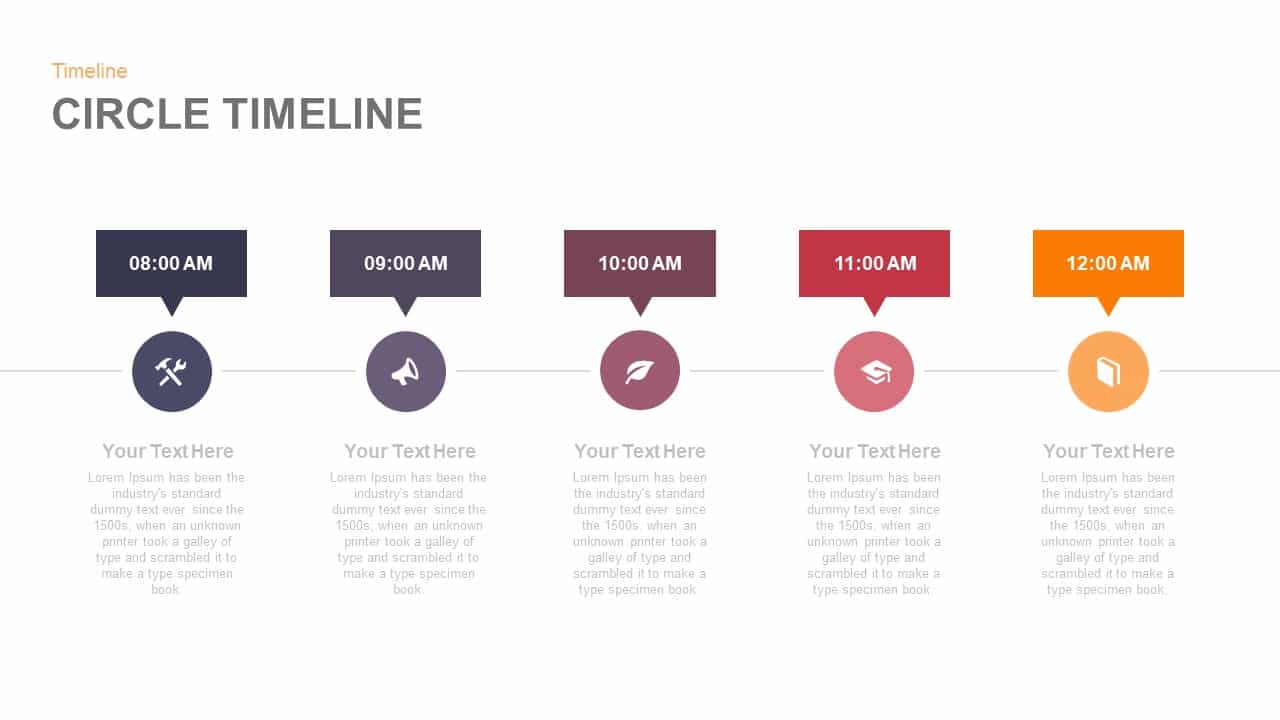
Five-Point Circle Timeline Diagram Template for PowerPoint & Google Slides
Timeline
Five-Stage Cyclic Process Arrow Diagram Template for PowerPoint & Google Slides
Process
Five-Level Staged Pyramid Diagram Template for PowerPoint & Google Slides
Pyramid
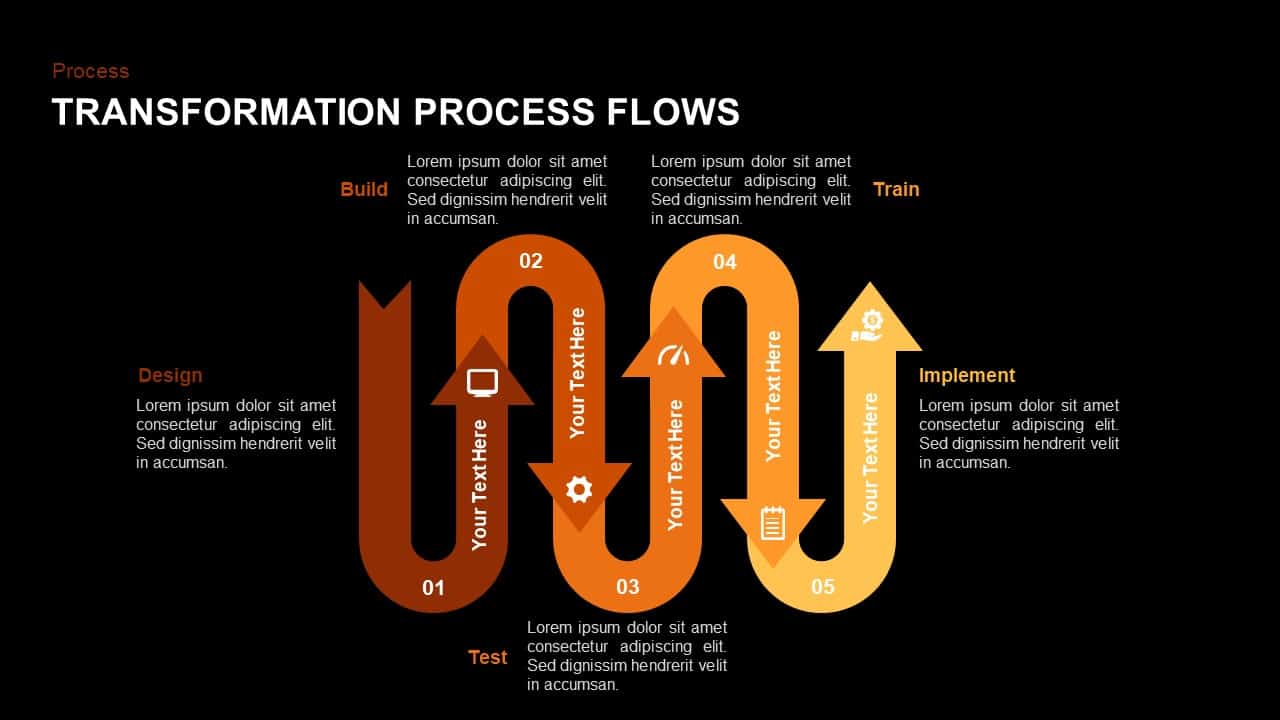
Wavy Five-Stage Transformation Flow Template for PowerPoint & Google Slides
Process
Five-Stage Process Diagram Template for PowerPoint & Google Slides
Process
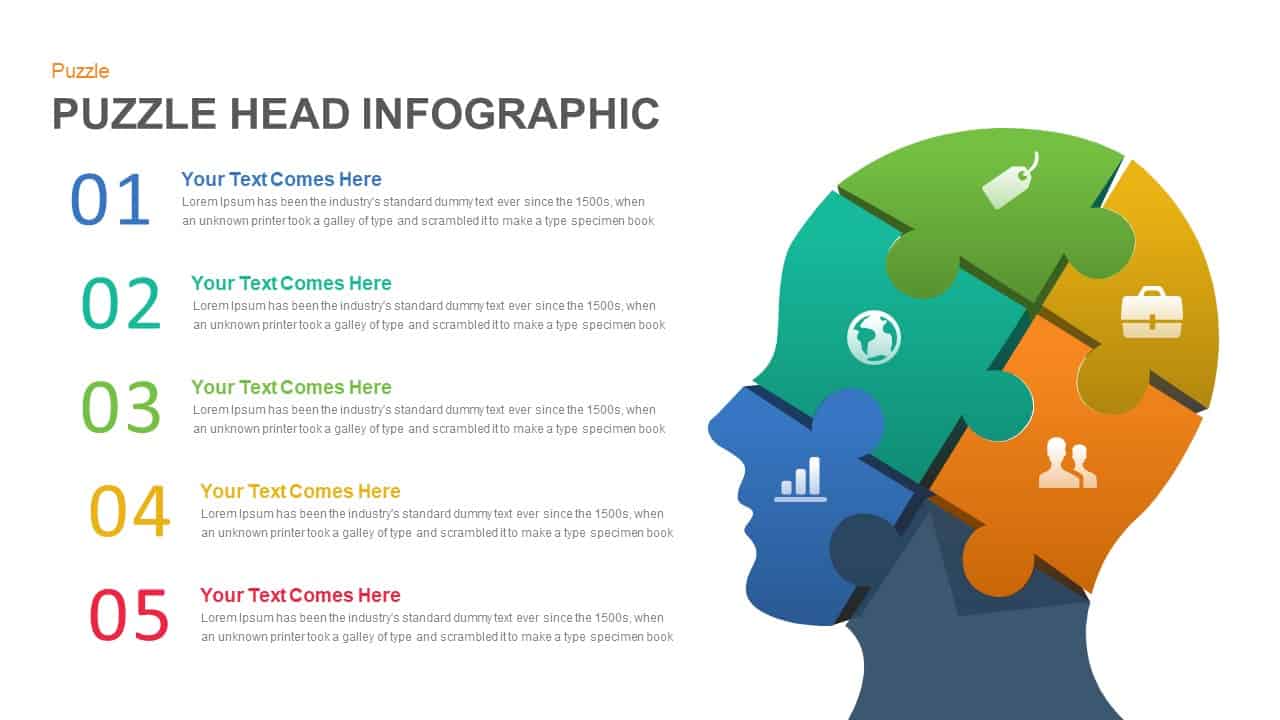
Five-Step Puzzle Head Infographic Template for PowerPoint & Google Slides
Process
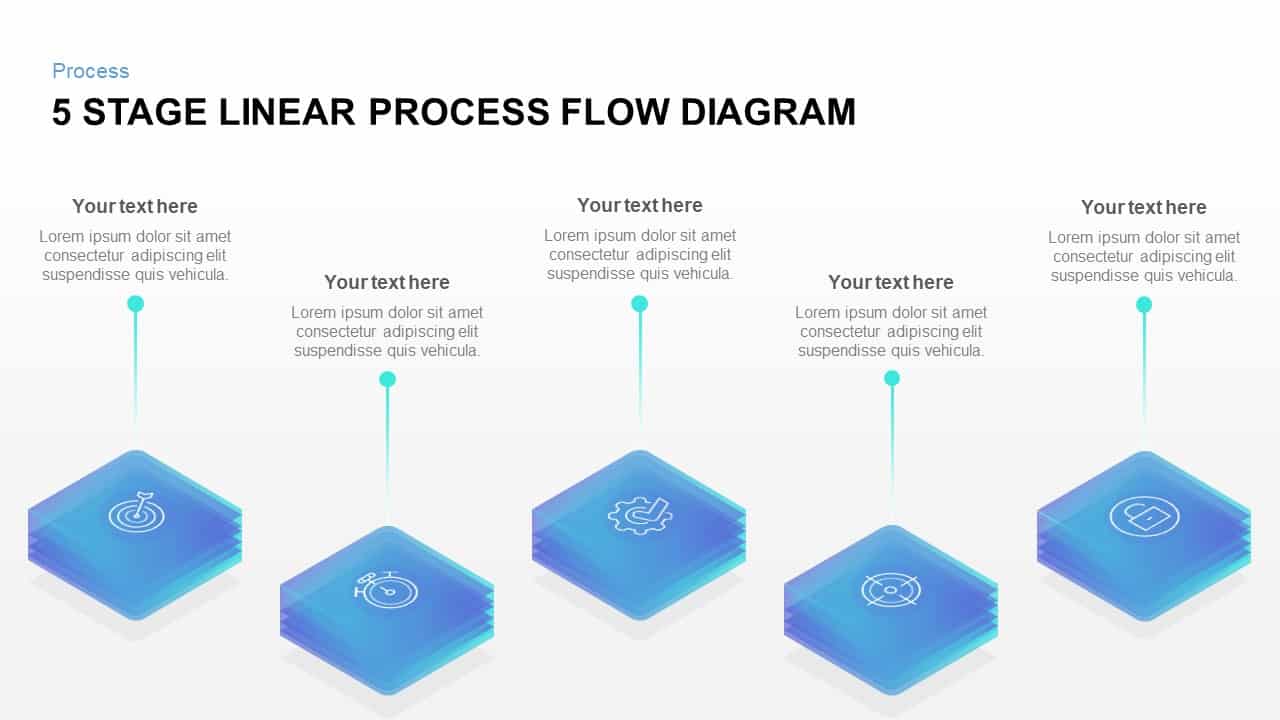
Five Stage Linear Process Flow Diagram Template for PowerPoint & Google Slides
Process
Isometric Five-Stage Process Flow Template for PowerPoint & Google Slides
Process
Five-Stage Linear Process Flow Diagram Template for PowerPoint & Google Slides
Process
Five-Stage Circular Infographic Diagram Template for PowerPoint & Google Slides
Process
Five-Stage Pyramid Infographics Process Template for PowerPoint & Google Slides
Pyramid
Five-Stage Circular Process Diagram Template for PowerPoint & Google Slides
Circular
Five-Stage Agenda Flow Diagram Template for PowerPoint & Google Slides
Agenda
Five-Stage Circular Process Flow Diagram Template for PowerPoint & Google Slides
Circular
Five-Stage Slanted Timeline Diagram Template for PowerPoint & Google Slides
Timeline
Five-Step Gradient Blue Funnel Diagram Template for PowerPoint & Google Slides
Funnel
Five-Year Gradient Timeline Infographic Template for PowerPoint & Google Slides
Timeline
Five-Step Growth Timeline Infographic Template for PowerPoint & Google Slides
Timeline
Business System Five-Step Process Template for PowerPoint & Google Slides
Process
Five-Input Cause and Effect Diagram Template for PowerPoint & Google Slides
Arrow
Five-Level Puzzle House Infographic Template for PowerPoint & Google Slides
Pyramid
Pencil Qualification Process Five-Step Template for PowerPoint & Google Slides
Process
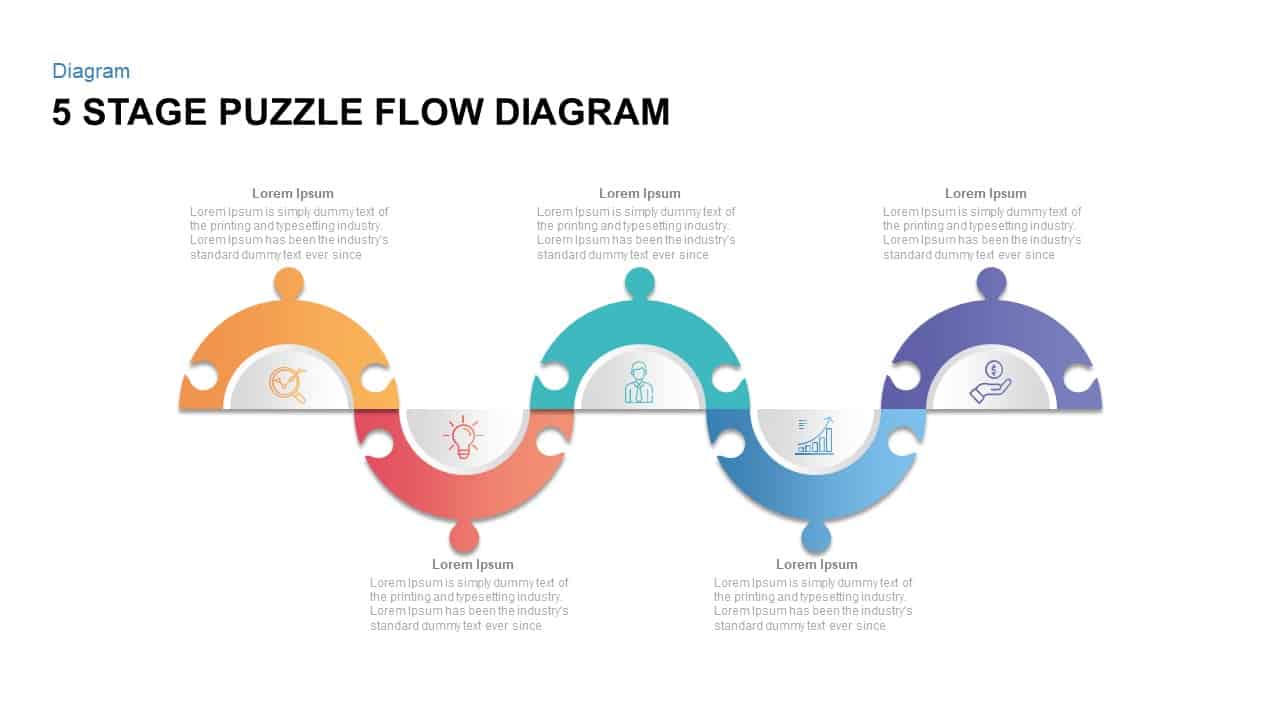
Five Stage Puzzle Flow Diagram Template for PowerPoint & Google Slides
Process
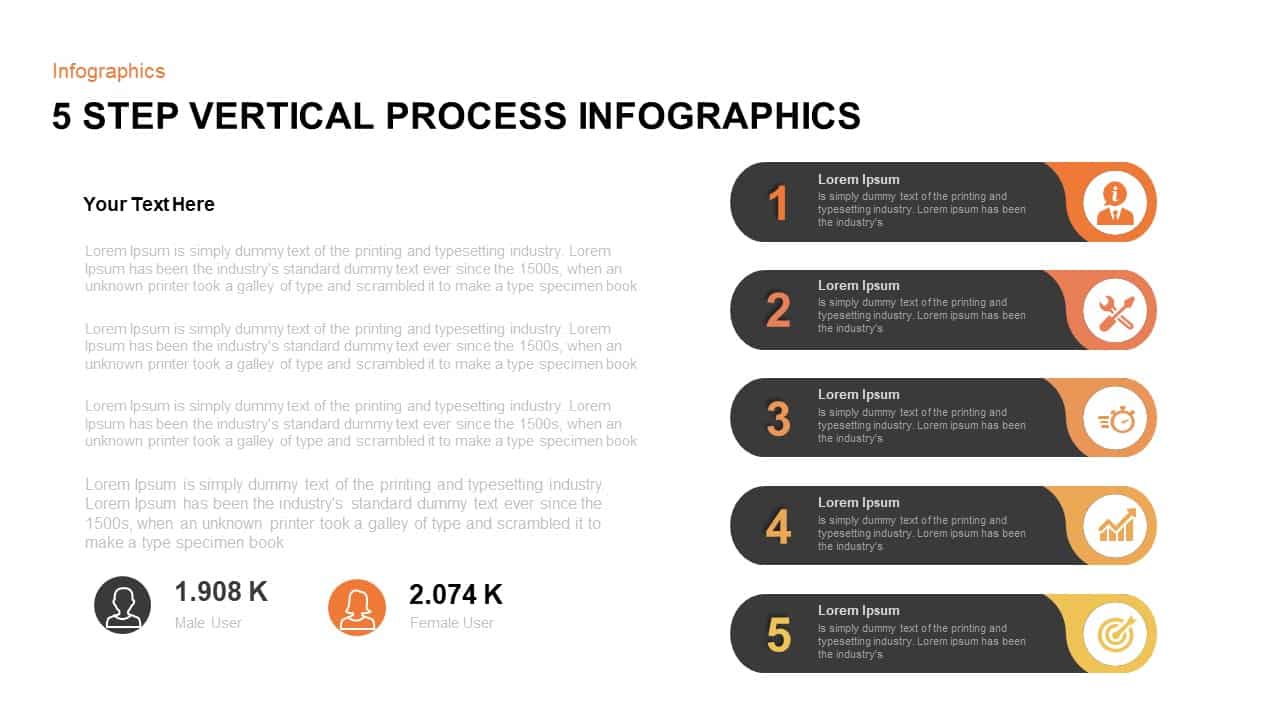
Five-Step Vertical Process Infographic Template for PowerPoint & Google Slides
Process
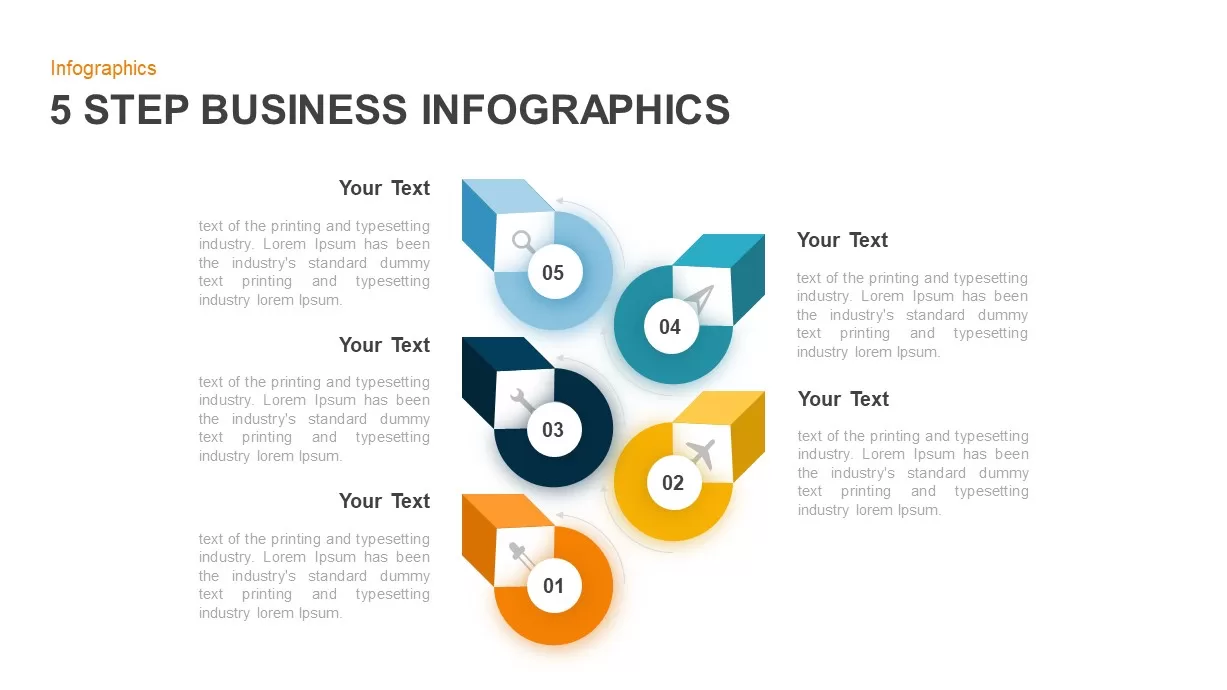
Five-Step Business Infographics Template for PowerPoint & Google Slides
Infographics
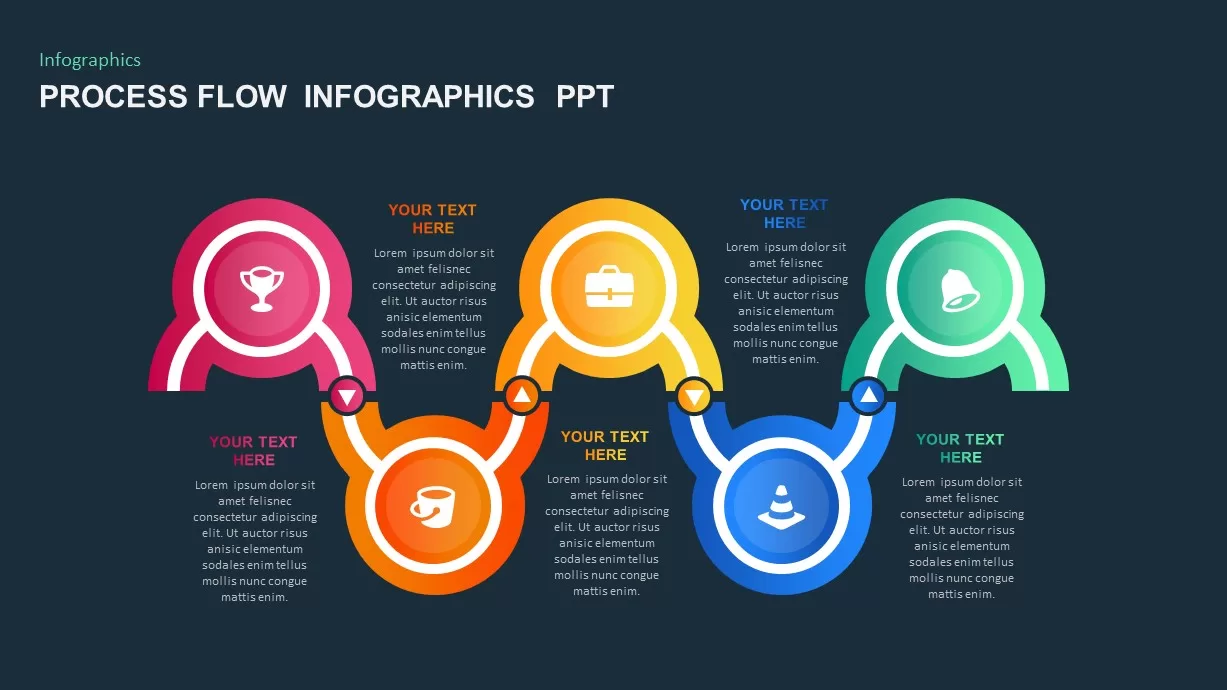
Five-Step Process Flow Infographic Template for PowerPoint & Google Slides
Process
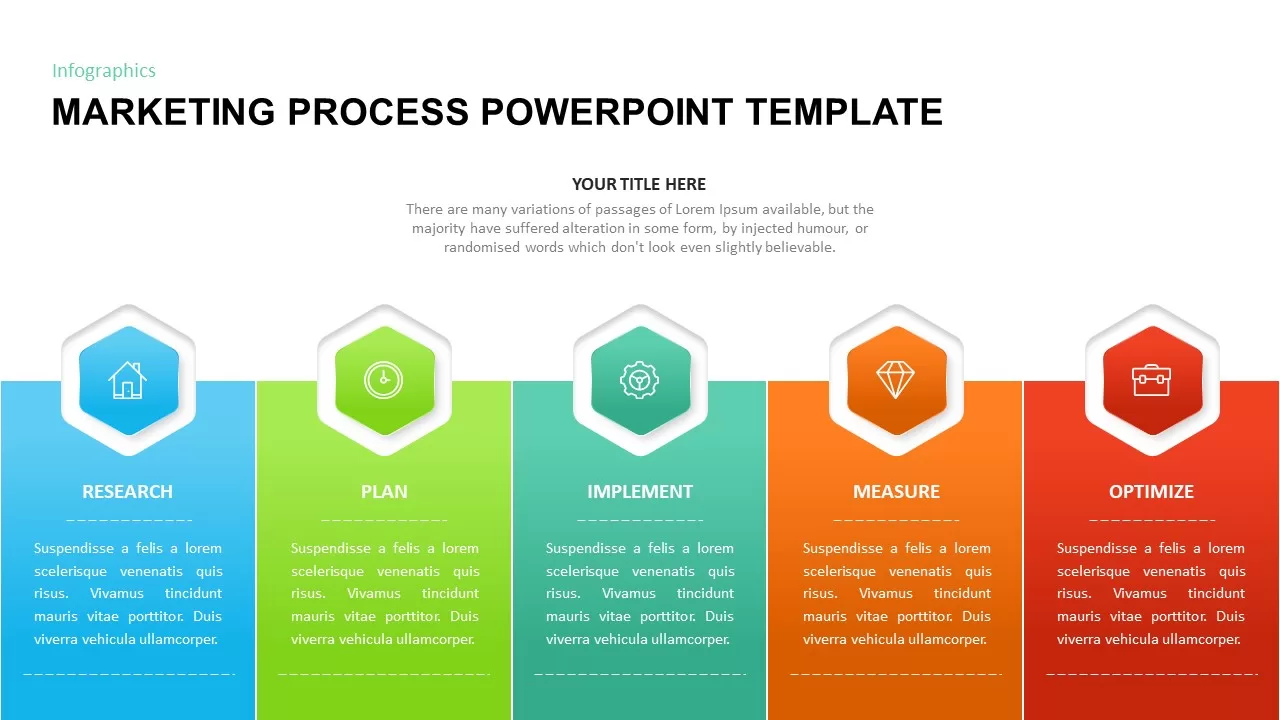
Five-Step Marketing Process Infographic Template for PowerPoint & Google Slides
Process
Five-Step Circular Badge Infographics Template for PowerPoint & Google Slides
Circular
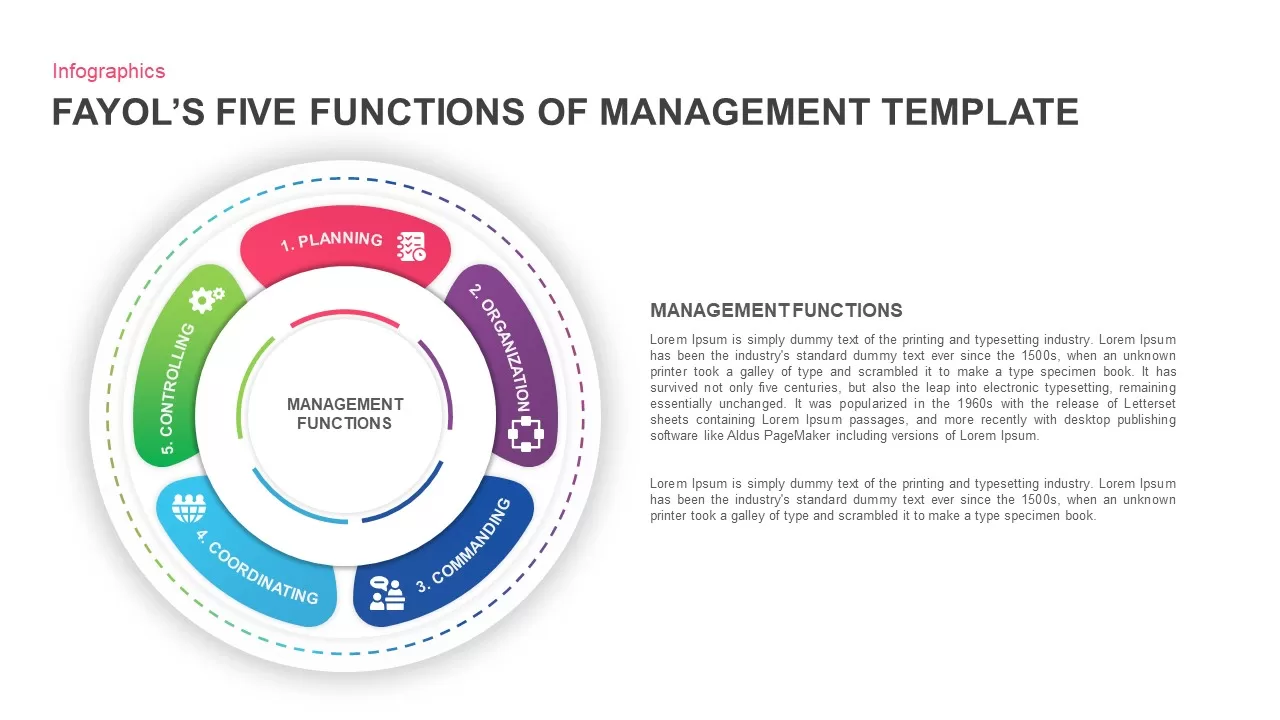
Fayol’s Five Functions of Management Template for PowerPoint & Google Slides
Business
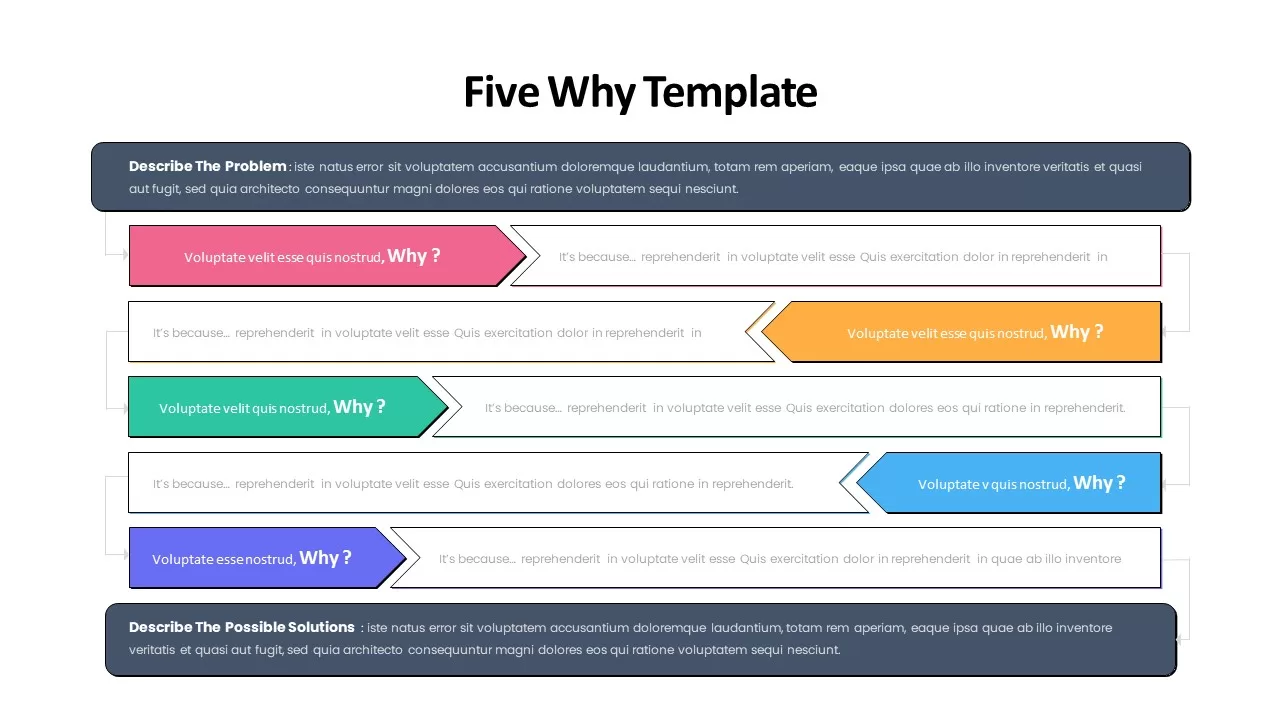
Five Whys Infographic template for PowerPoint & Google Slides
Business
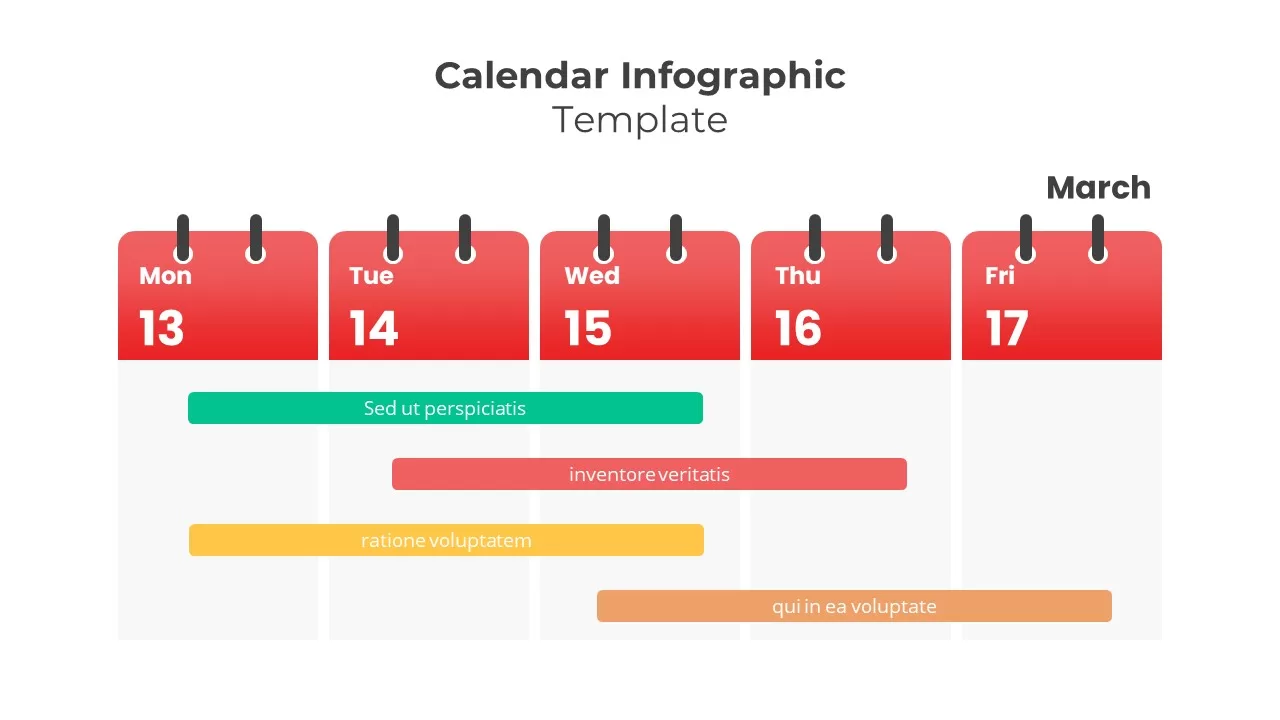
Weekly Five-Day Calendar Infographic Template for PowerPoint & Google Slides
Timeline
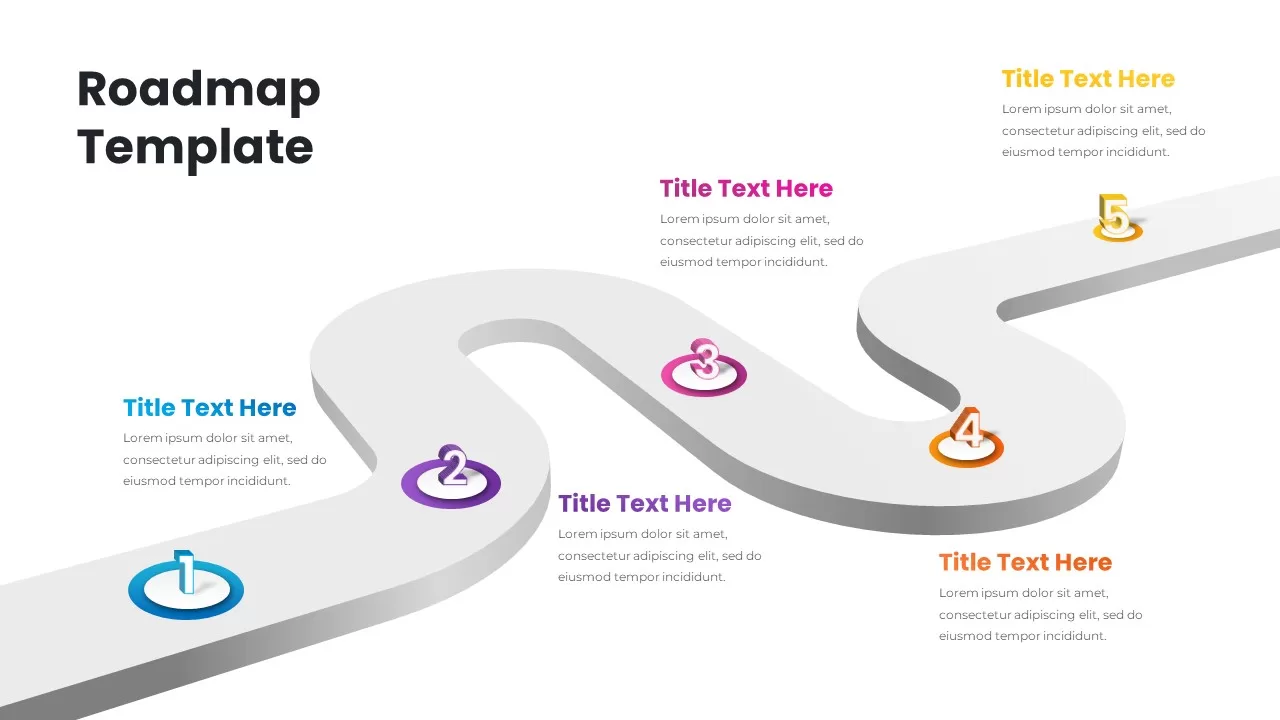
3D Five-Step Roadmap Diagram Slide Layout Template for PowerPoint & Google Slides
Roadmap
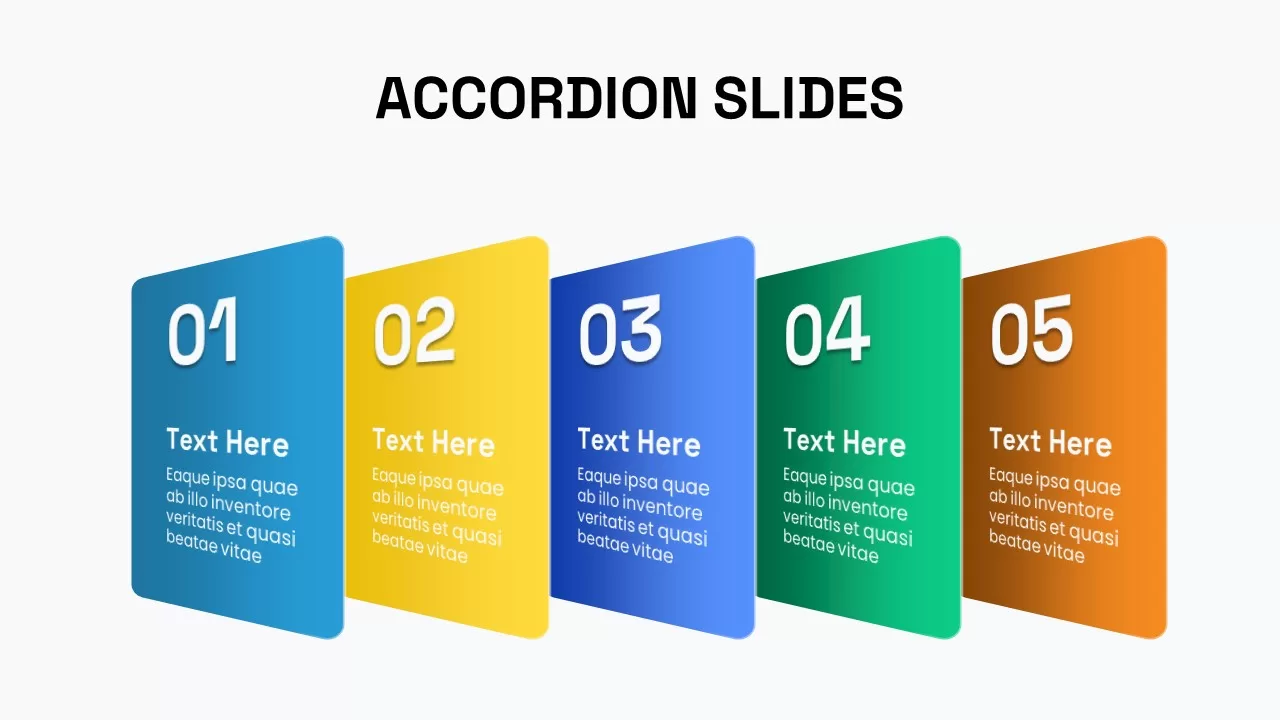
Five-Step Animated Accordion Process Template for PowerPoint & Google Slides
Process
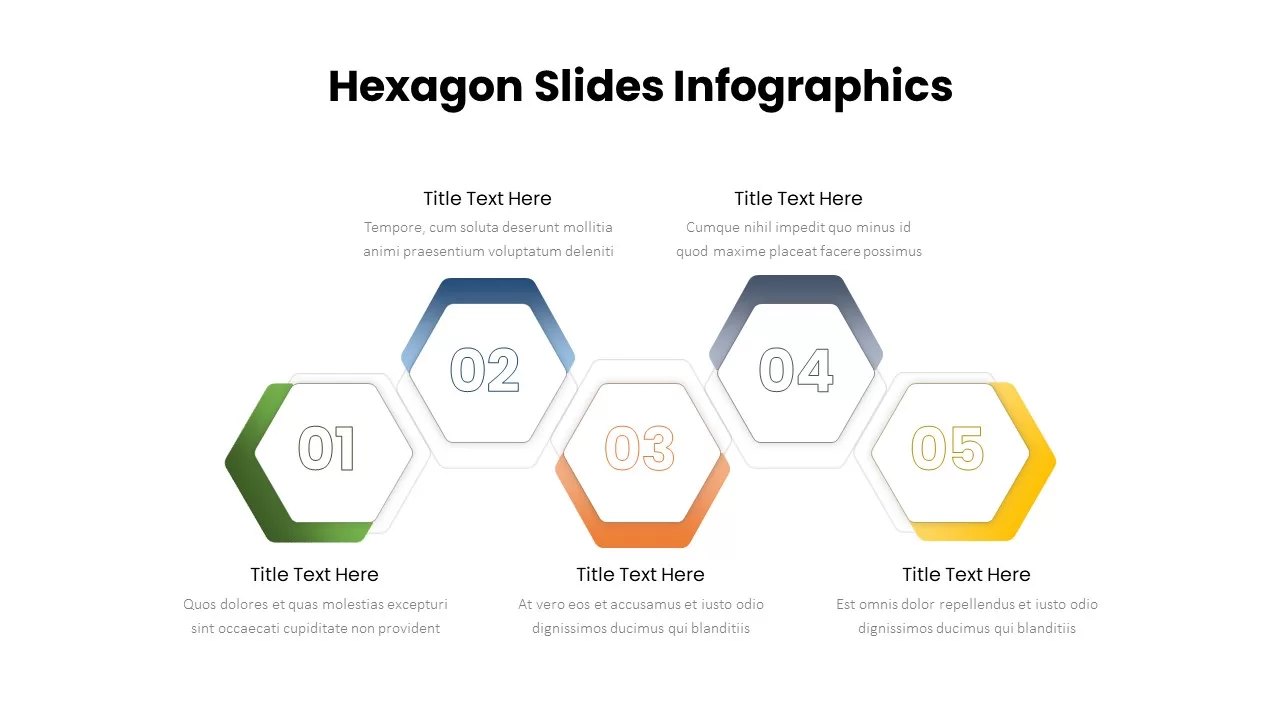
Five-Step Hexagon Infographic Process Template for PowerPoint & Google Slides
Process
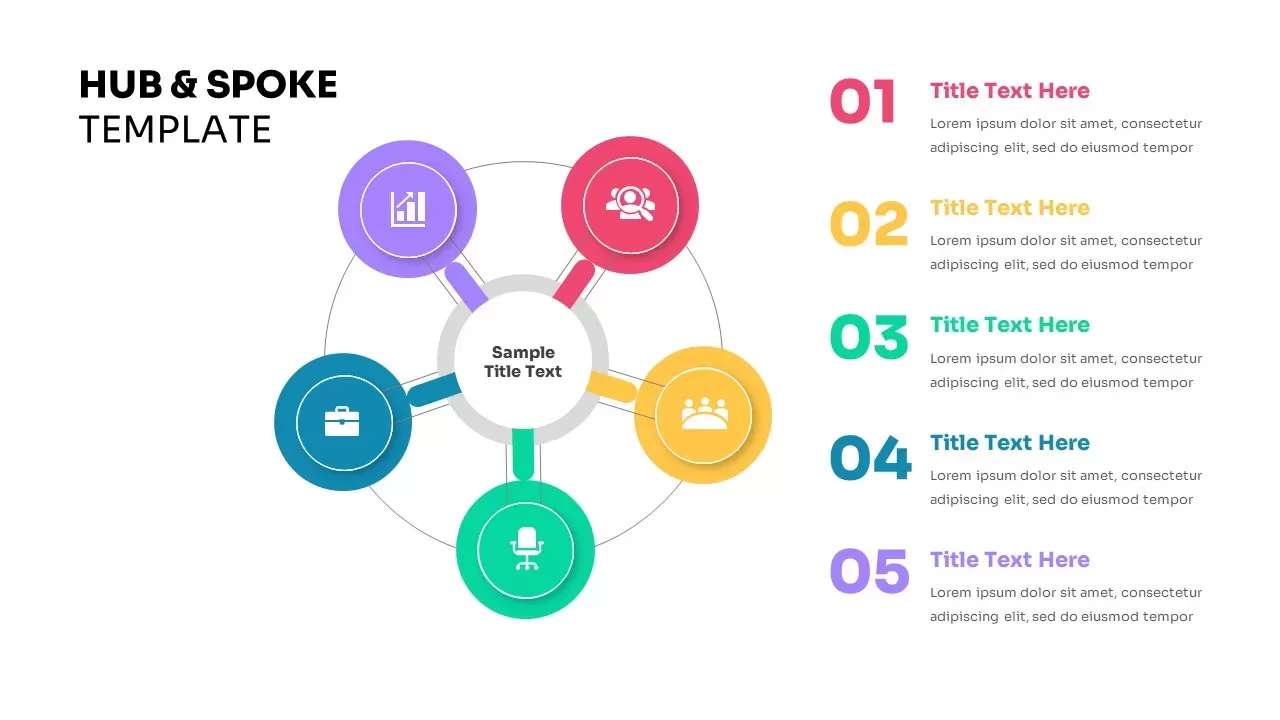
Five-Node Hub & Spoke Diagram Process Template for PowerPoint & Google Slides
Business Models
Five-Step Interlocking Gears Diagram Template for PowerPoint & Google Slides
Process
Five Circle Venn Diagram for Template for PowerPoint & Google Slides
Circular
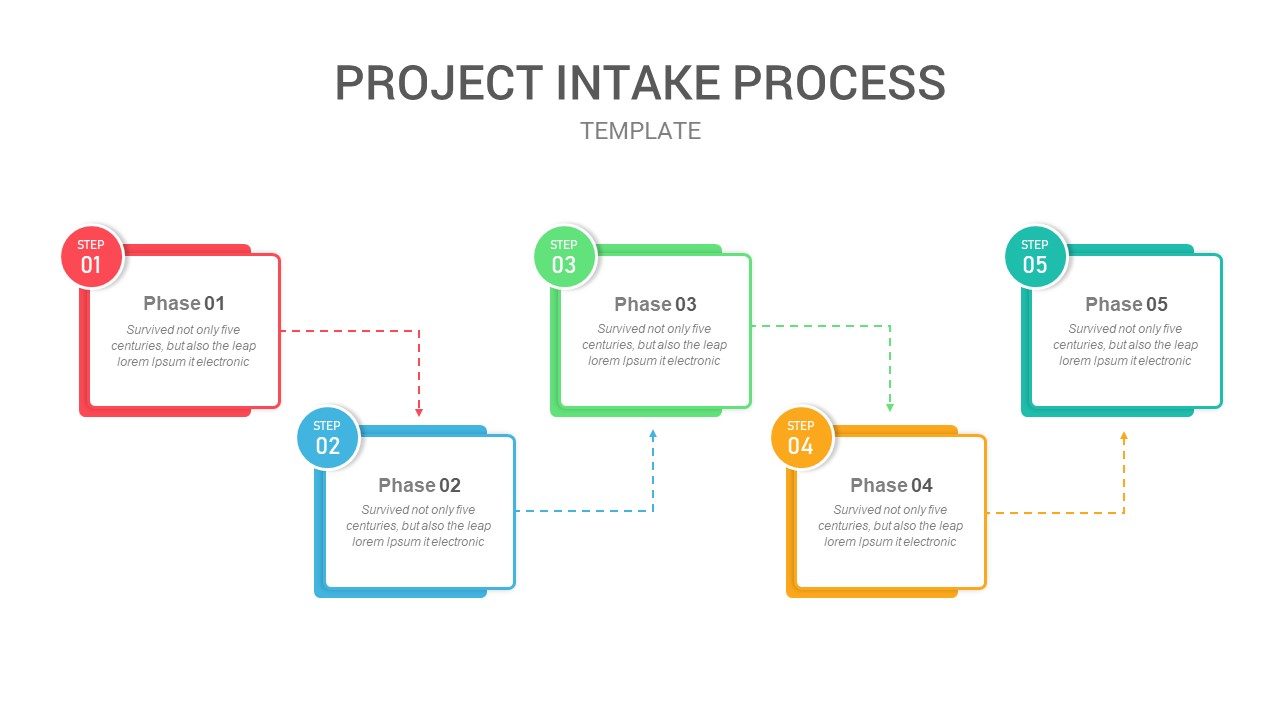
Five-Phase Project Intake Process Flow Template for PowerPoint & Google Slides
Process
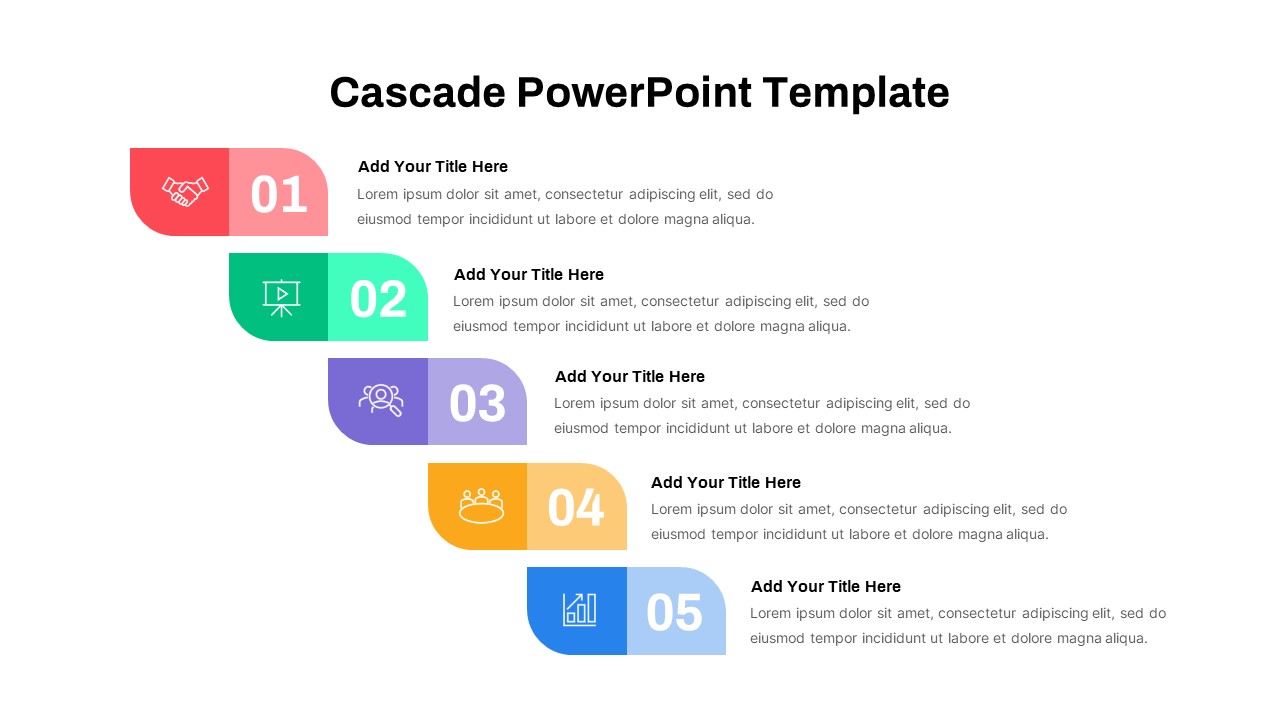
Five-Step Cascade Diagram & Timeline Template for PowerPoint & Google Slides
Process
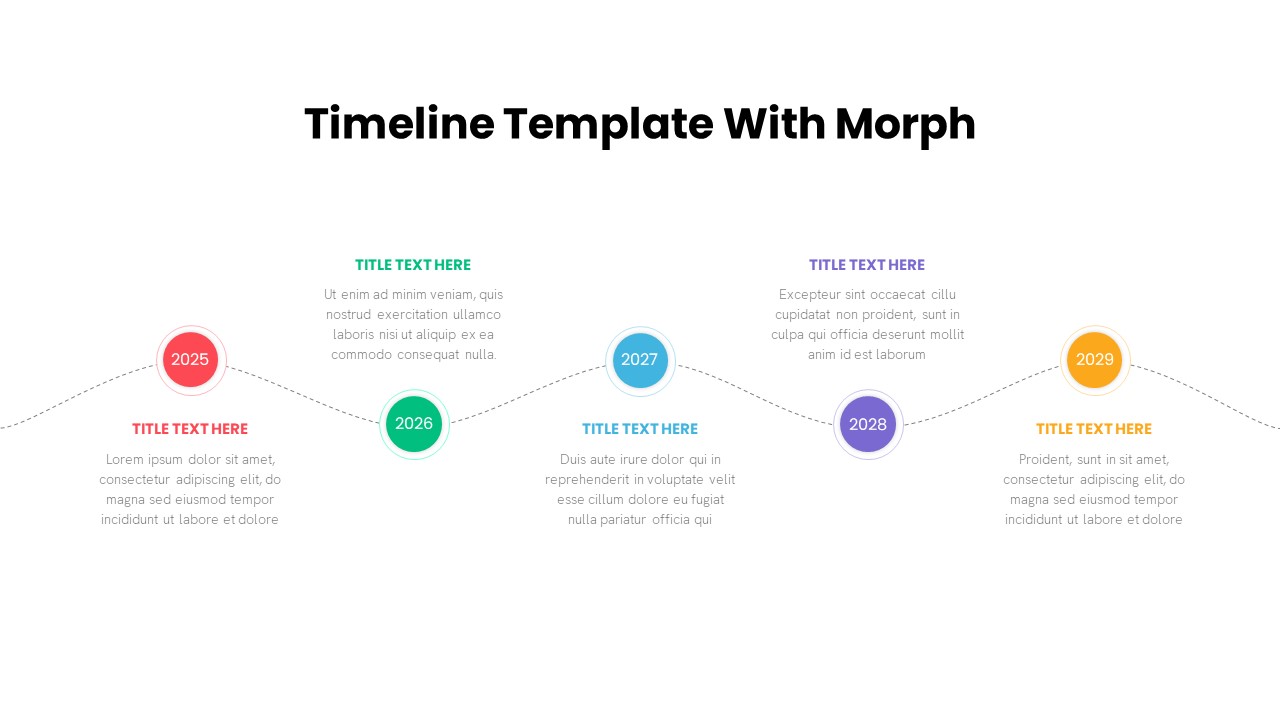
Five-Step Timeline with Morph Animation Template for PowerPoint & Google Slides
Timeline
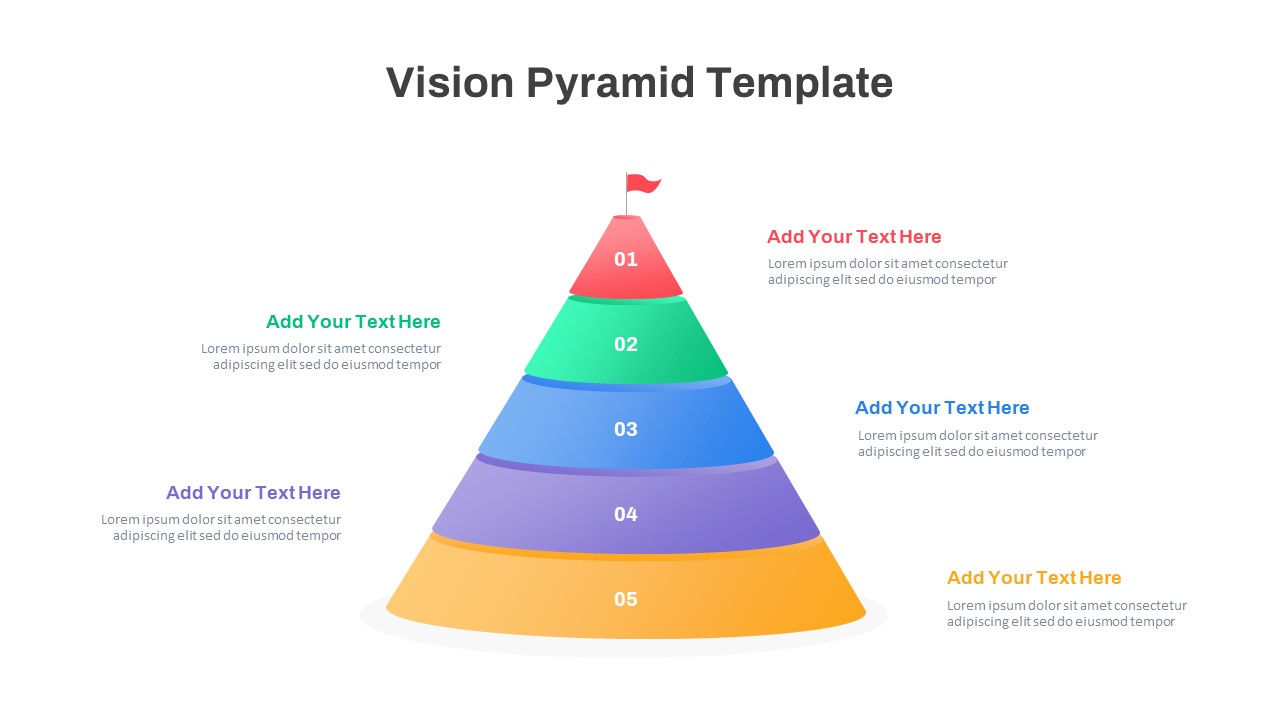
Five-Level Vision Pyramid Diagram Template for PowerPoint & Google Slides
Pyramid
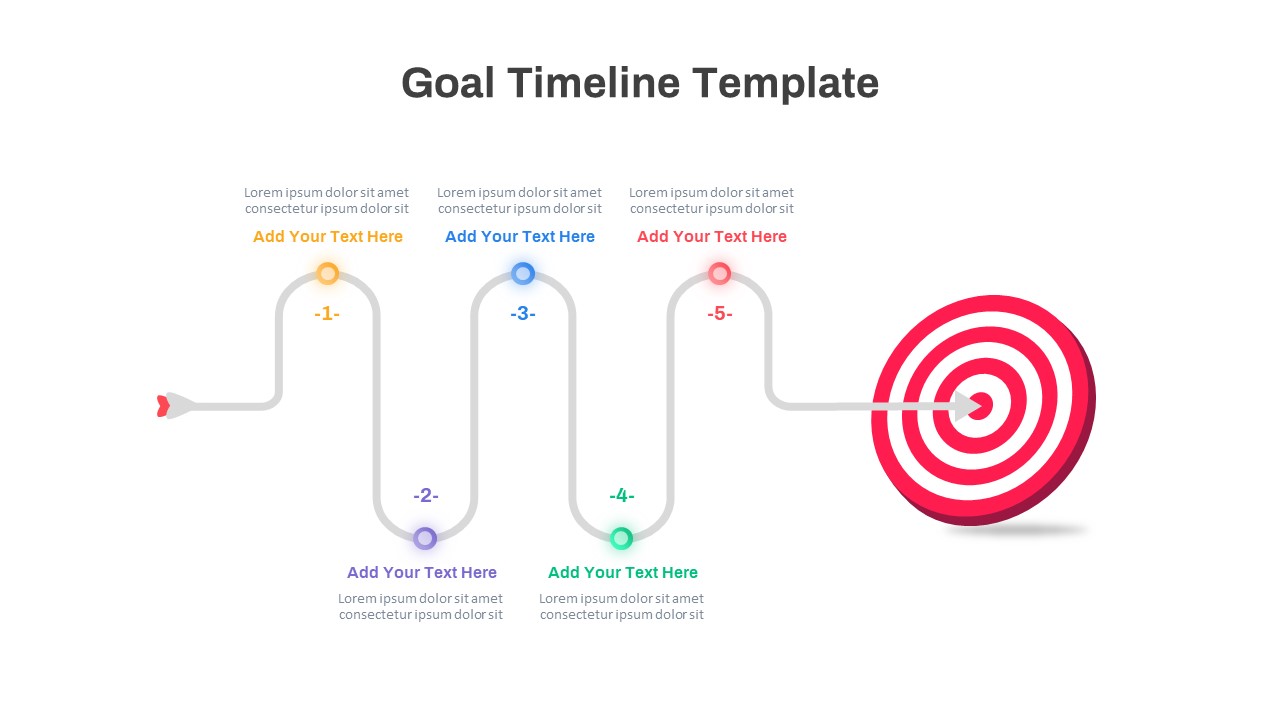
Colorful Five-Step Goal Timeline Template for PowerPoint & Google Slides
Timeline
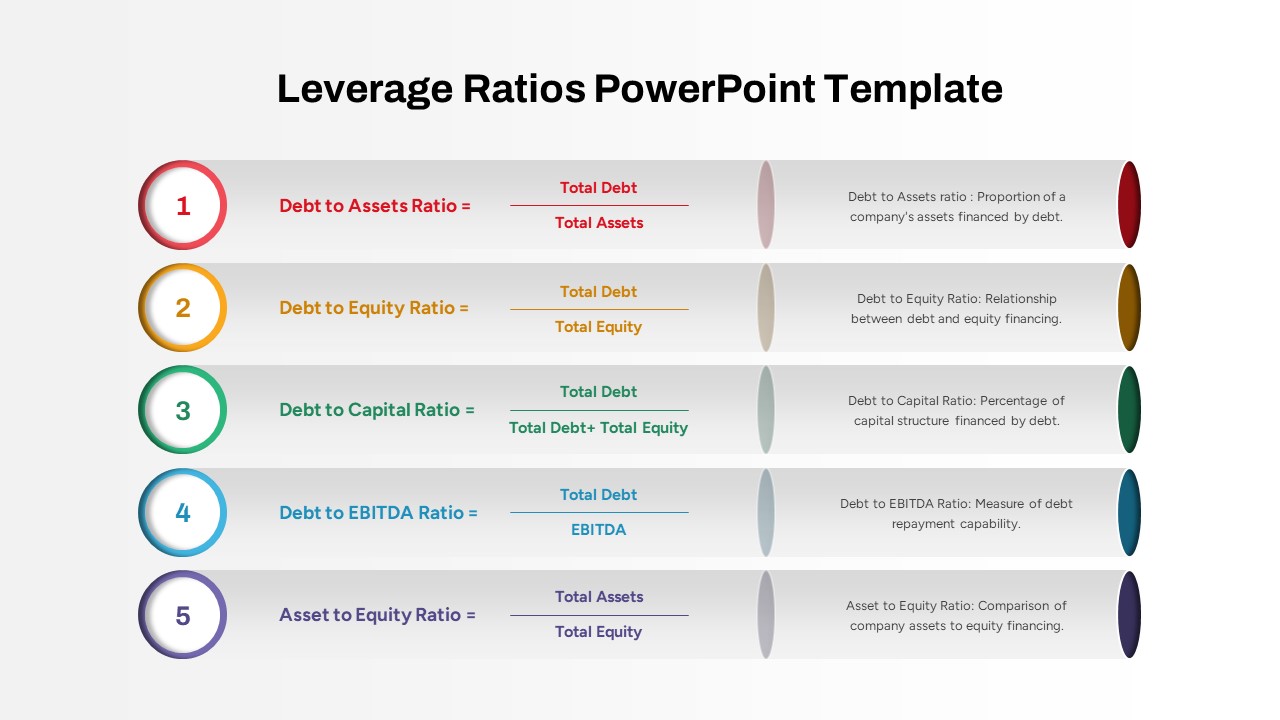
Five Key Leverage Ratios Overview Template for PowerPoint & Google Slides
Finance
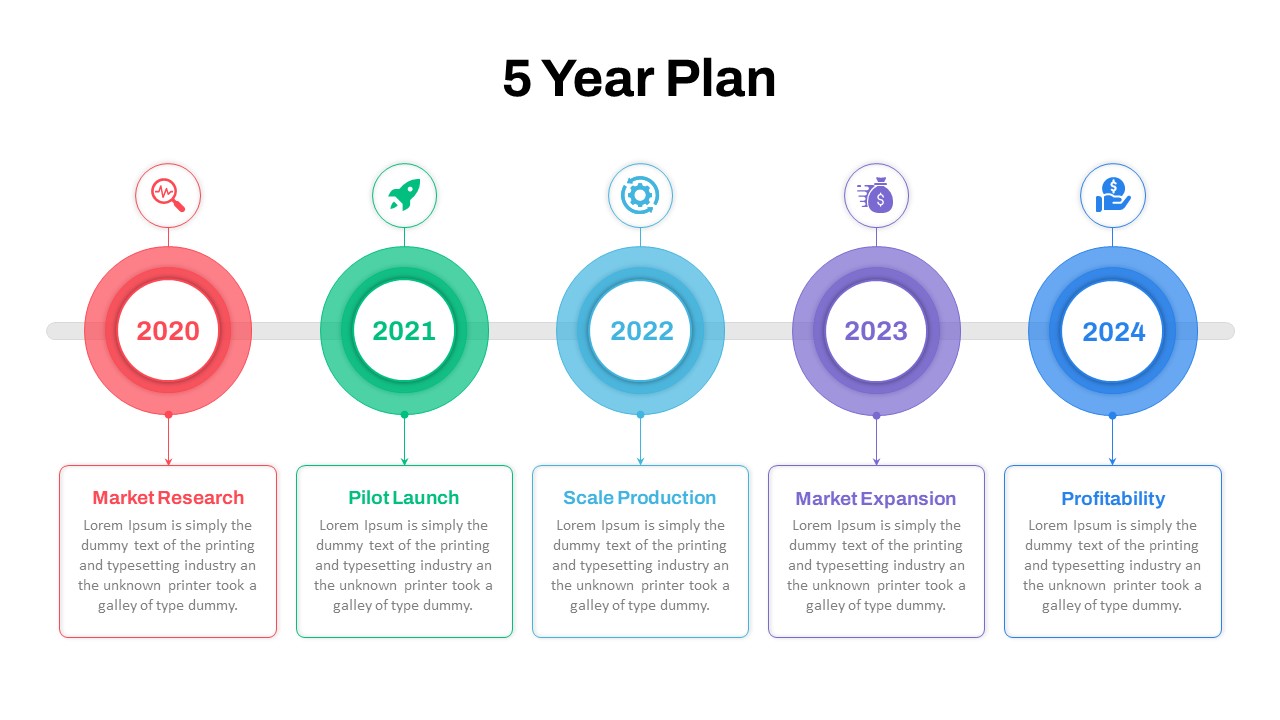
Five-Year Plan Timeline Diagram Template for PowerPoint & Google Slides
Timeline
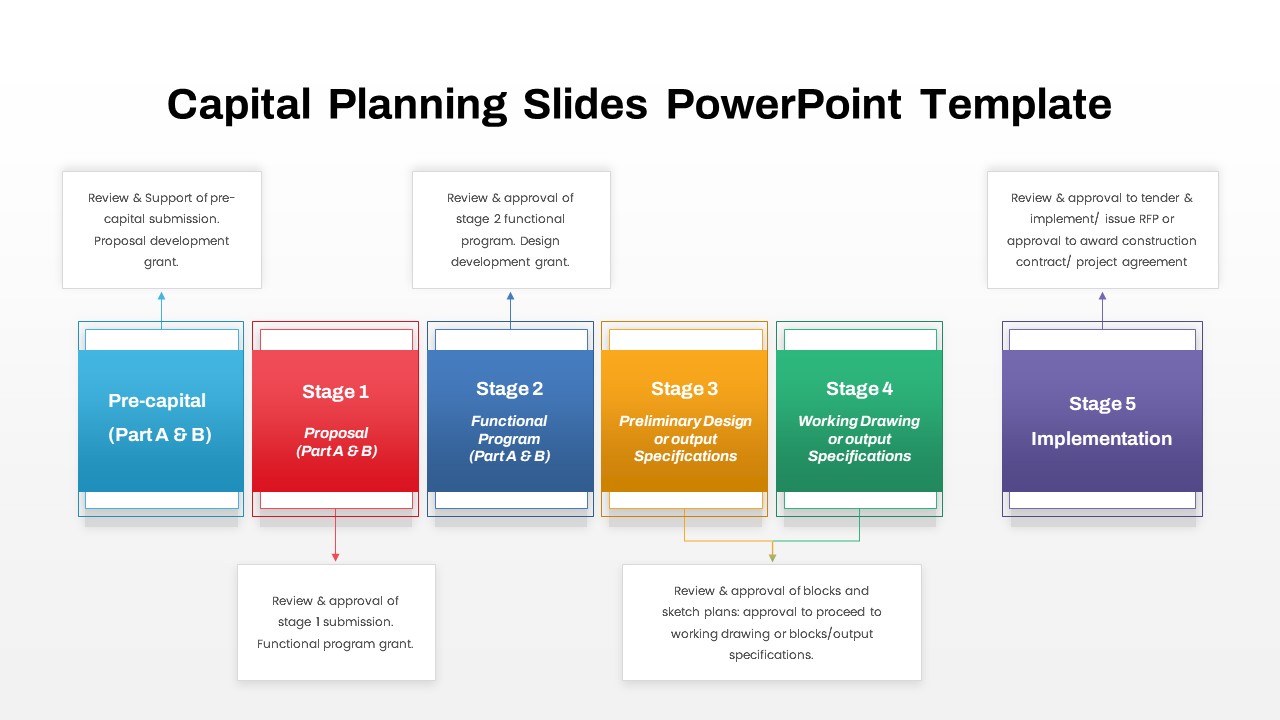
Capital Planning Five-Stage Process template for PowerPoint & Google Slides
Process
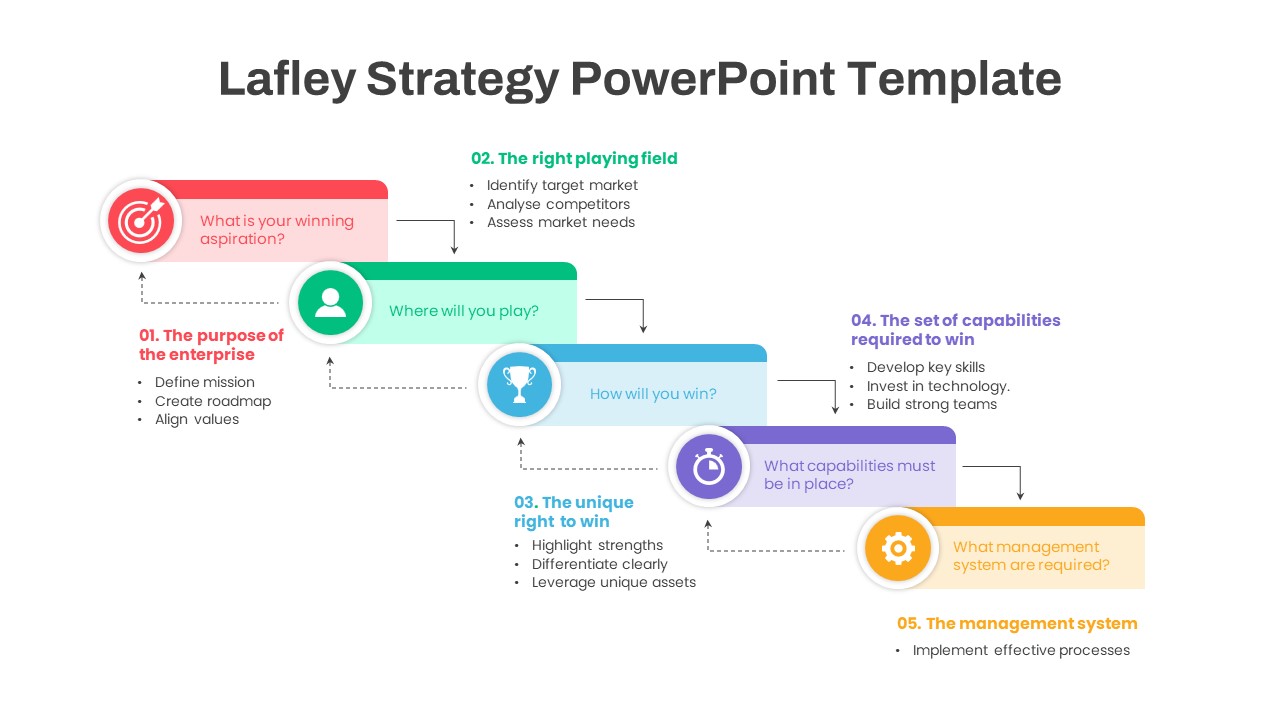
Lafley Strategy Five-Step Framework Template for PowerPoint & Google Slides
Business Strategy
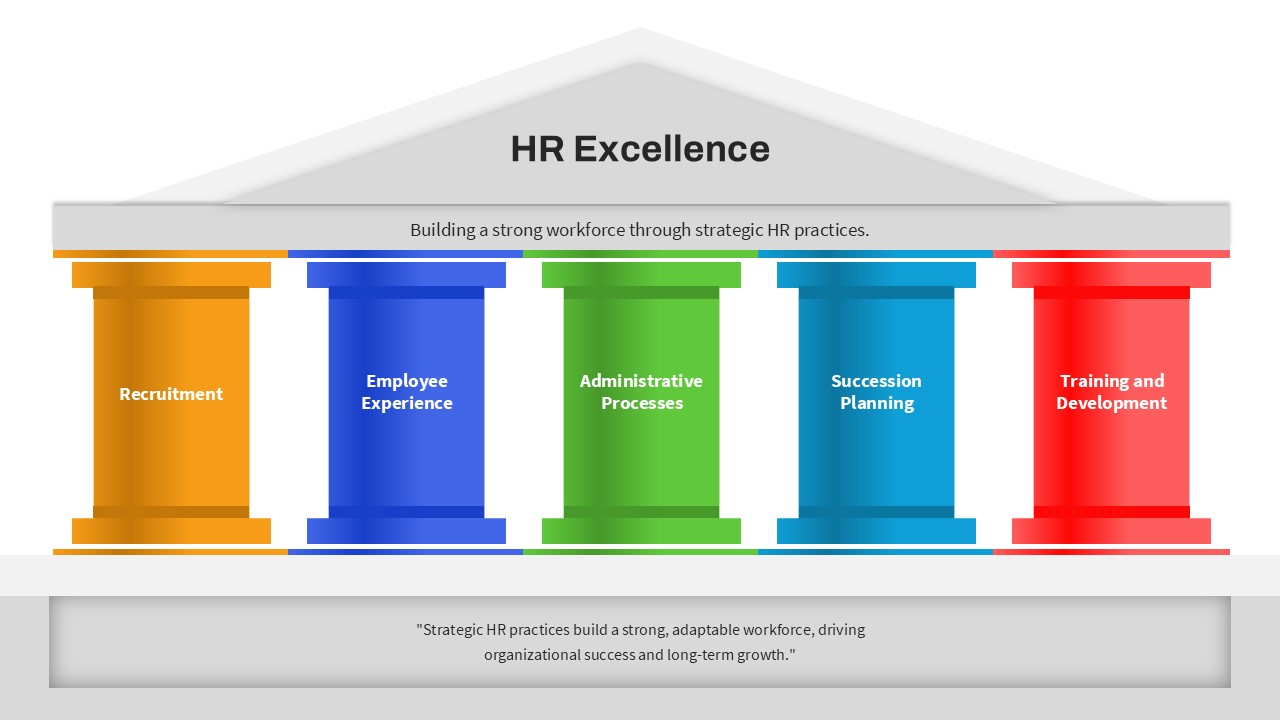
HR Excellence Five Pillar Framework Template for PowerPoint & Google Slides
Business Models
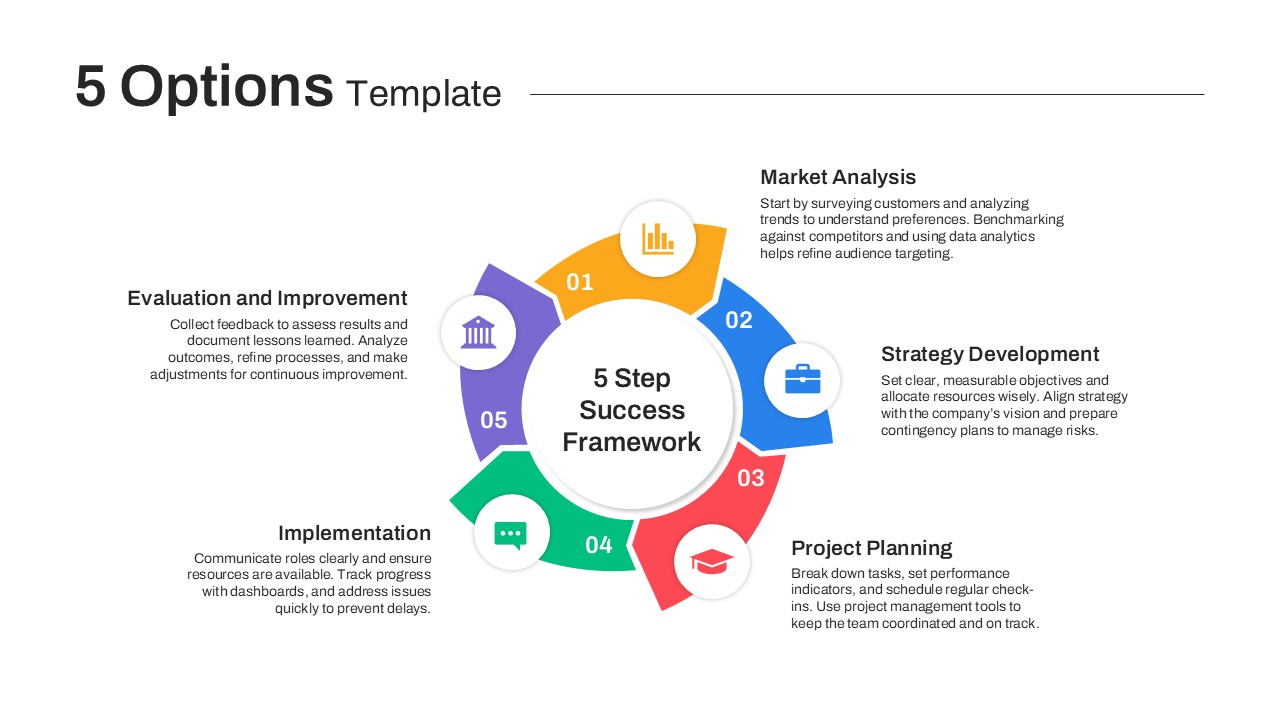
Colorful Five-Option Ribbon Infographic Template for PowerPoint & Google Slides
Process
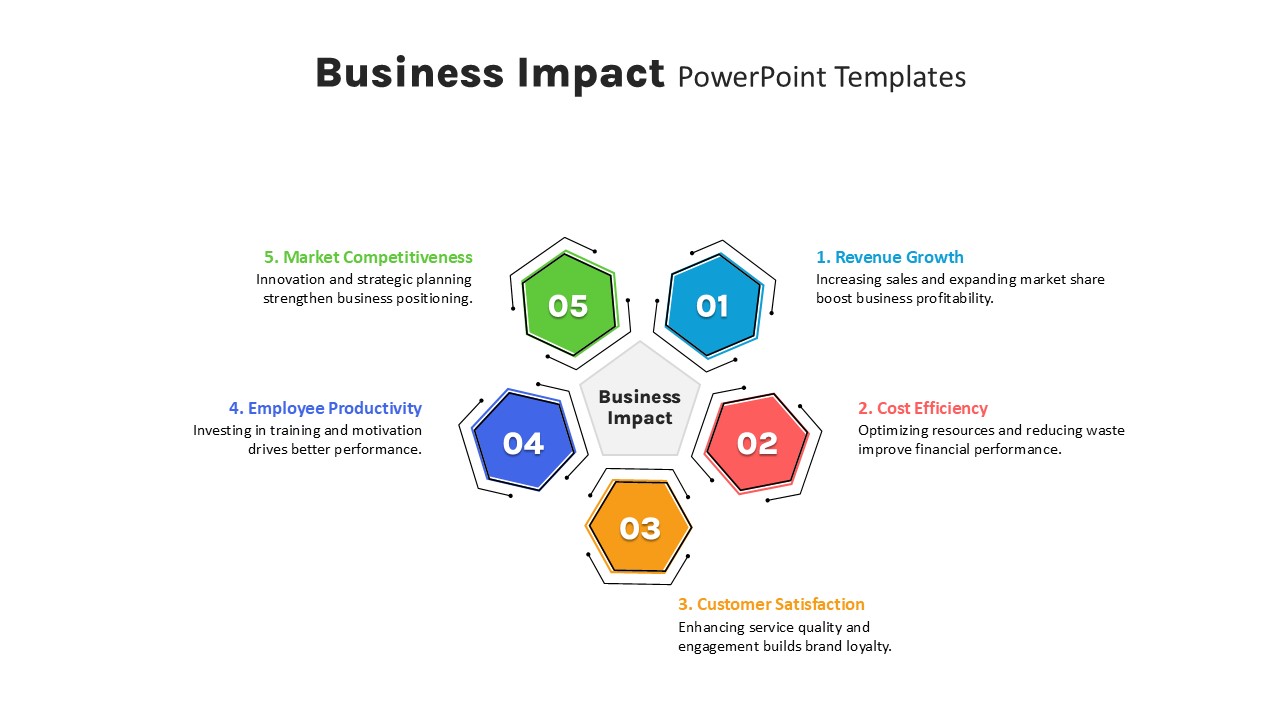
Five-Step Hexagon Business Impact Template for PowerPoint & Google Slides
Circular
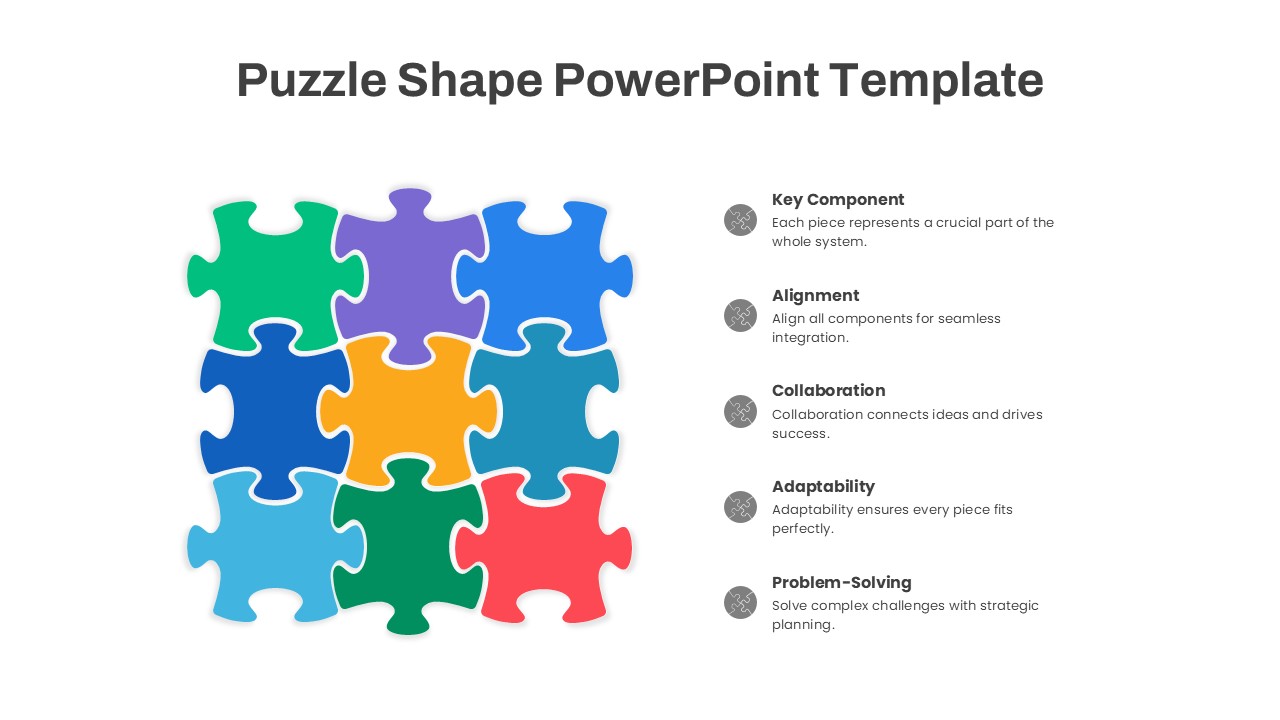
Puzzle Shape Diagram with Five Elements Template for PowerPoint & Google Slides
Circular
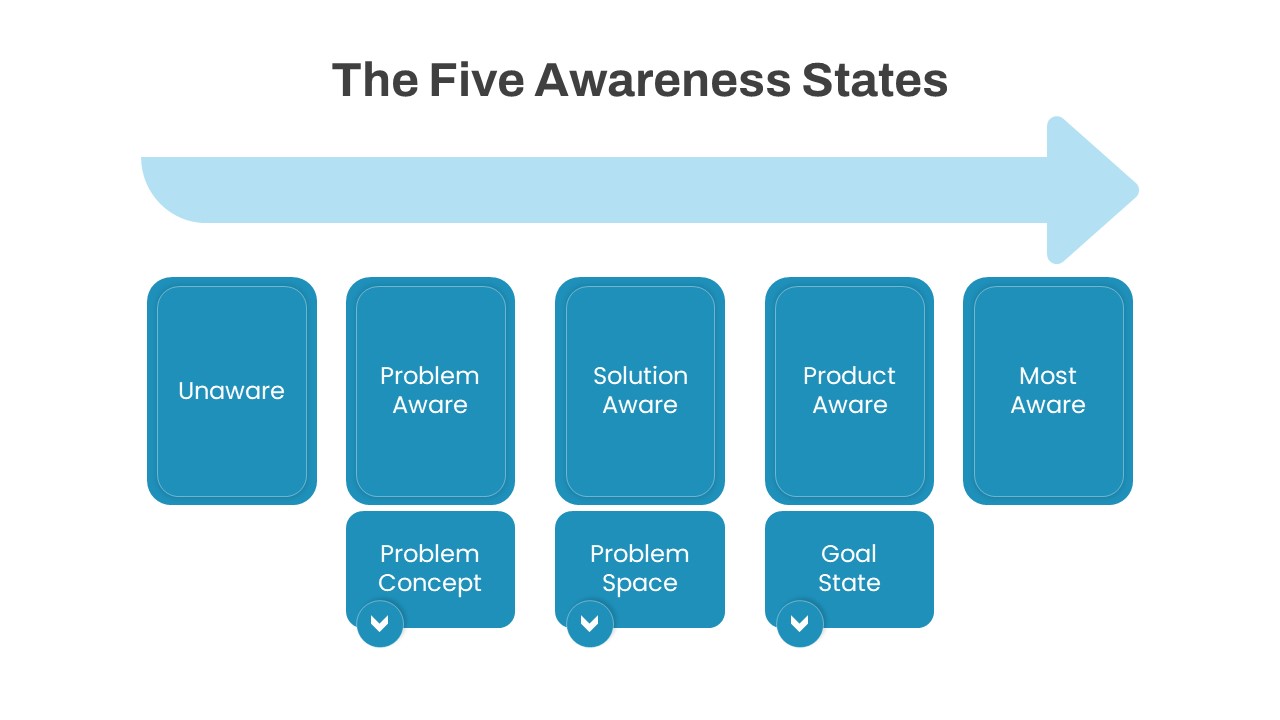
The Five Awareness States diagram template for PowerPoint & Google Slides
Infographics
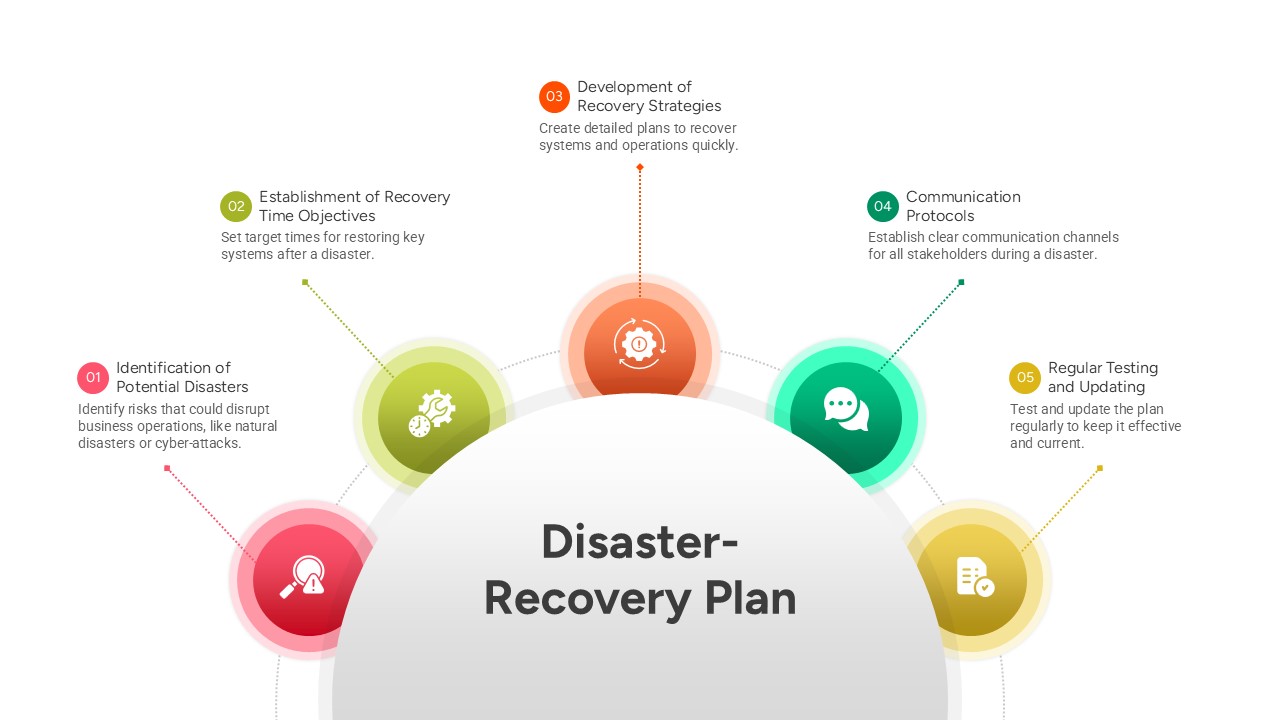
Five-Step Disaster Recovery Plan Template for PowerPoint & Google Slides
Project
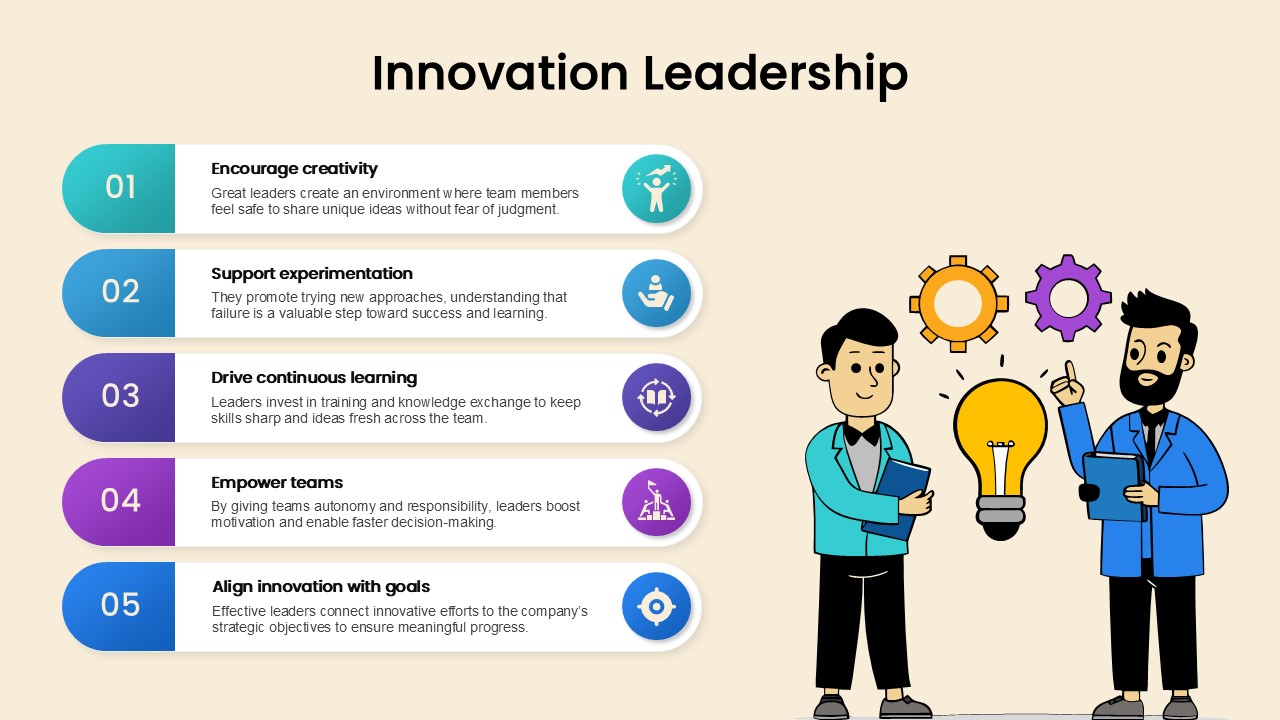
Innovation Leadership Five-Step List Template for PowerPoint & Google Slides
Leadership
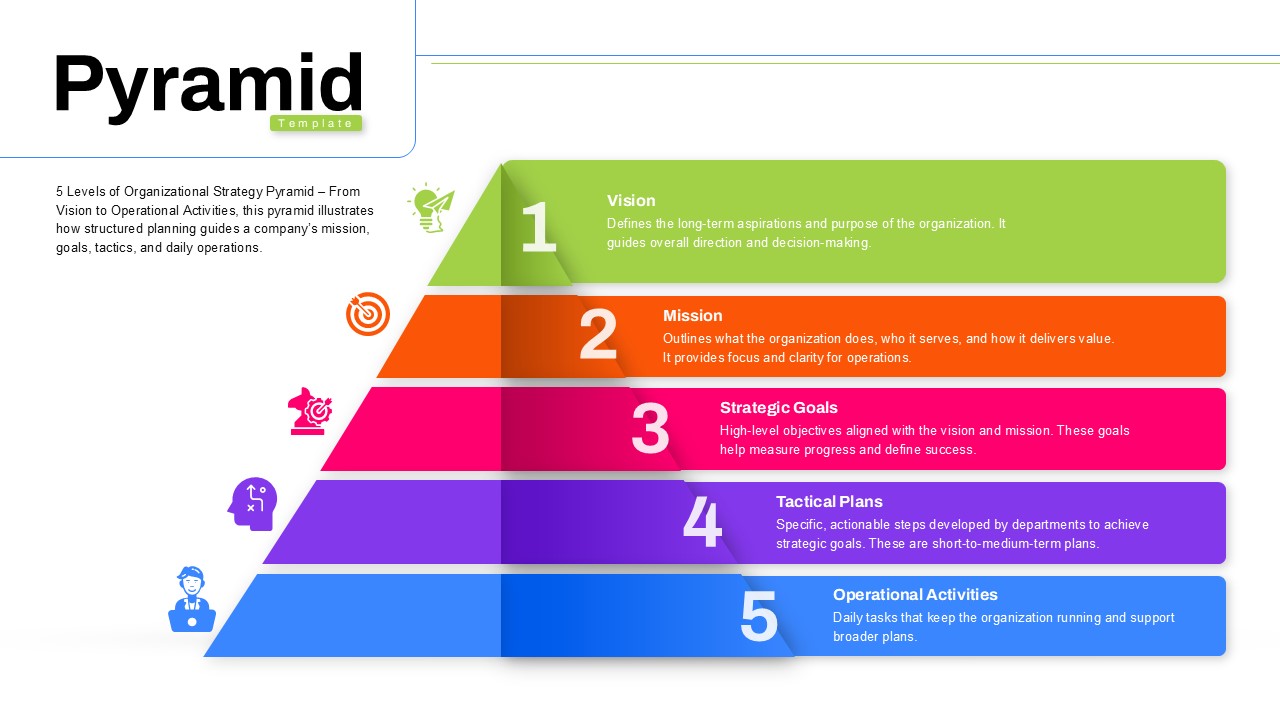
Five-Stage Pyramid Template for PowerPoint & Google Slides
Pyramid