Isometric 3D Block Comparison Diagram Template for PowerPoint & Google Slides


Description
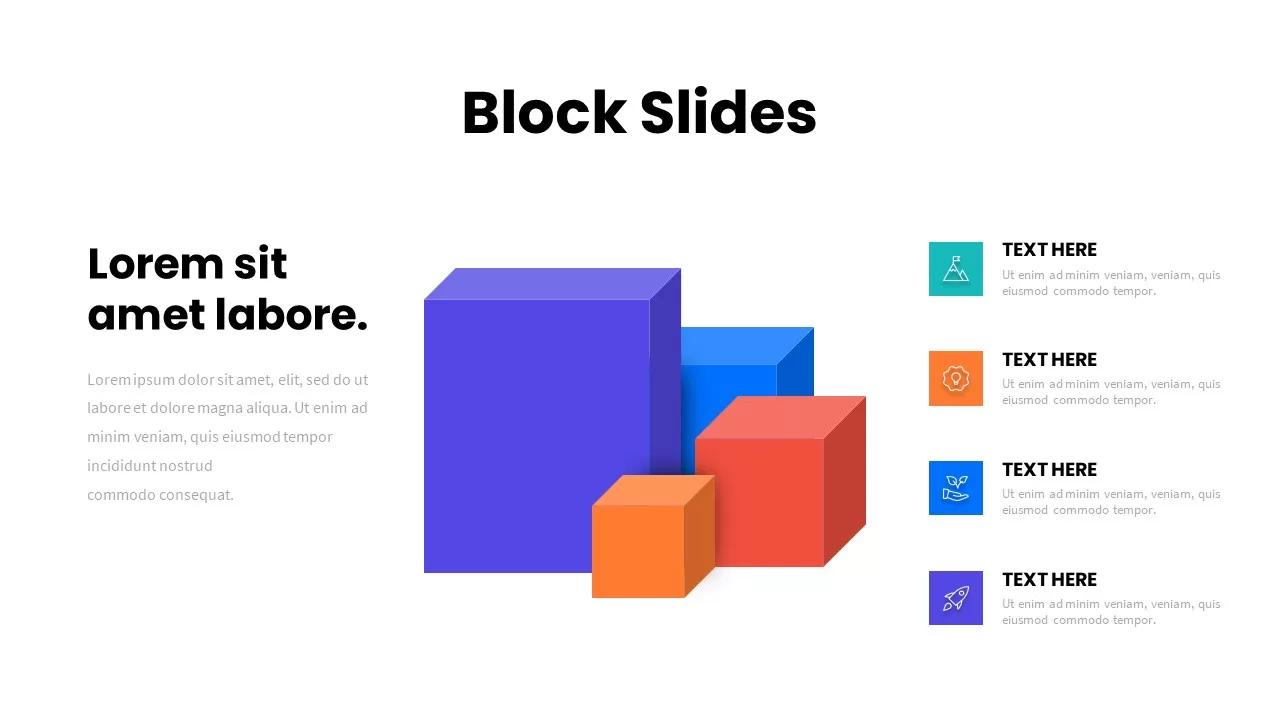
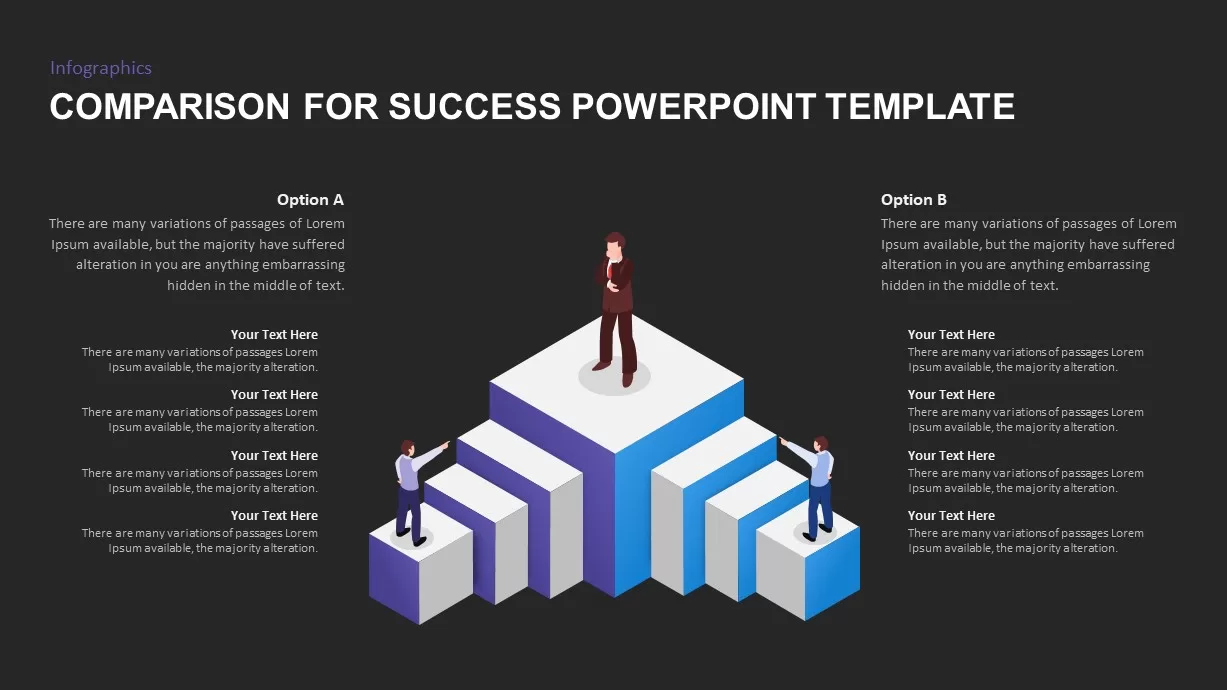
Leverage this isometric 3D block comparison diagram to present side-by-side option analyses in a visually compelling format. The slide features a central podium stack elevated above two flanking stepped block sequences, each rendered in crisp isometric perspective with solid purple and blue faces and clean white tops. Vector characters atop each stack signify stakeholders or scenarios, while adjacent text areas on the left and right offer space for headings, paragraphs, and bullet points to articulate the strengths, differences, or success criteria of Option A versus Option B. The white background and neutral grey text ensure maximum legibility and an uncluttered canvas for your data.
Every shape, color, and text element is fully editable in both PowerPoint and Google Slides. Use the master slide layout to modify block heights, adjust face colors, swap figures for custom icons or images, and update fonts or sizes to match your brand guidelines. Connector lines and subtle shadows add depth without distracting from core content. Simply duplicate or remove block modules to expand comparisons beyond two options, or adjust perspective and alignment guides to reposition elements for alternative layouts. Retina-ready graphics preserve clarity across high-resolution displays and printed materials.
Ideal for performance reviews, strategy comparisons, and project evaluations, this 3D comparison diagram enhances stakeholder alignment by making complex contrasts intuitive at a glance. Extend its use to resource allocation analyses, risk vs. reward assessments, competitive benchmarking, or training modules. Consultants, product managers, and executives can leverage the slide to frame decision-making discussions, report on KPIs, or compare business scenarios effectively. This template streamlines the customization process, empowering presenters to focus on insights rather than design intricacies.
Who is it for
Business leaders, consultants, product managers, sales teams, and executive presenters will leverage this template to compare strategic options, showcase project outcomes, and drive data-driven decisions.
Other Uses
Repurpose this isometric block diagram for resource allocation, risk analysis, training scenarios, product feature comparisons, roadmap visualizations, and executive summaries in any industry.
Login to download this file

Item ID
SB01721
Related Templates

Isometric Block Infographic Steps Template for PowerPoint & Google Slides
Process
Isometric Block Steps Infographic Template for PowerPoint & Google Slides
Process
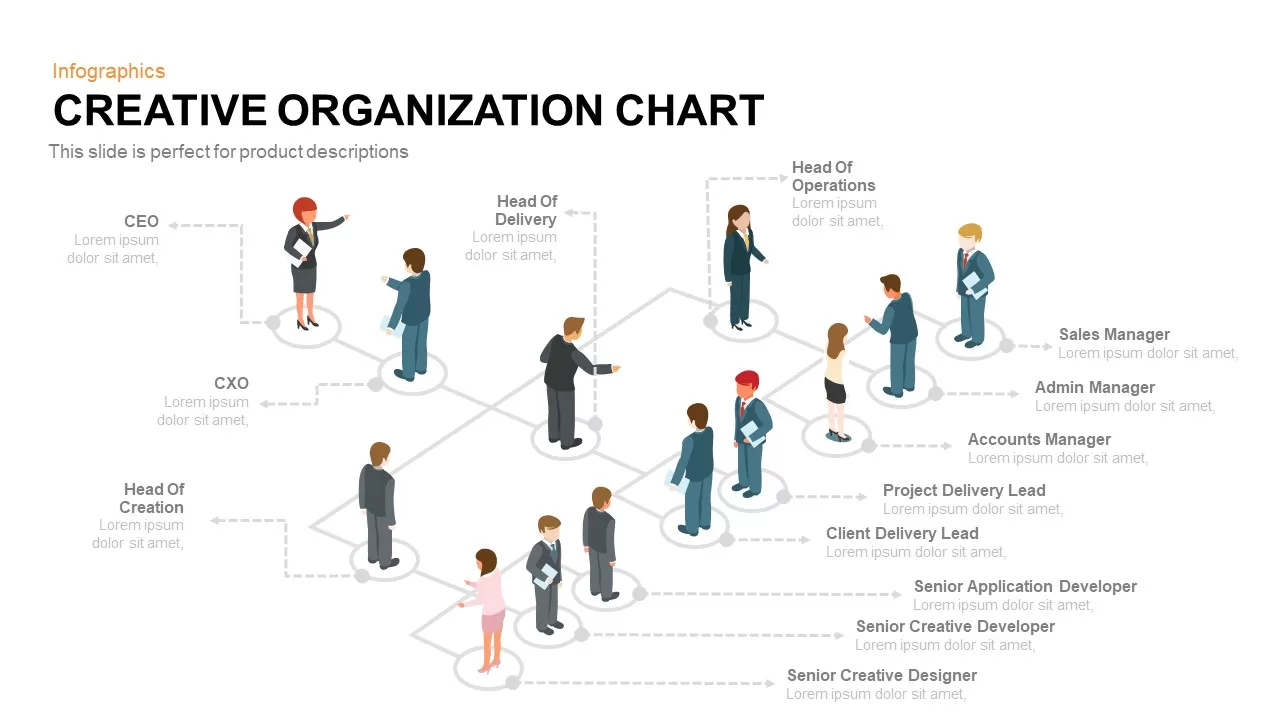
Isometric Organization Chart Diagram Template for PowerPoint & Google Slides
Org Chart
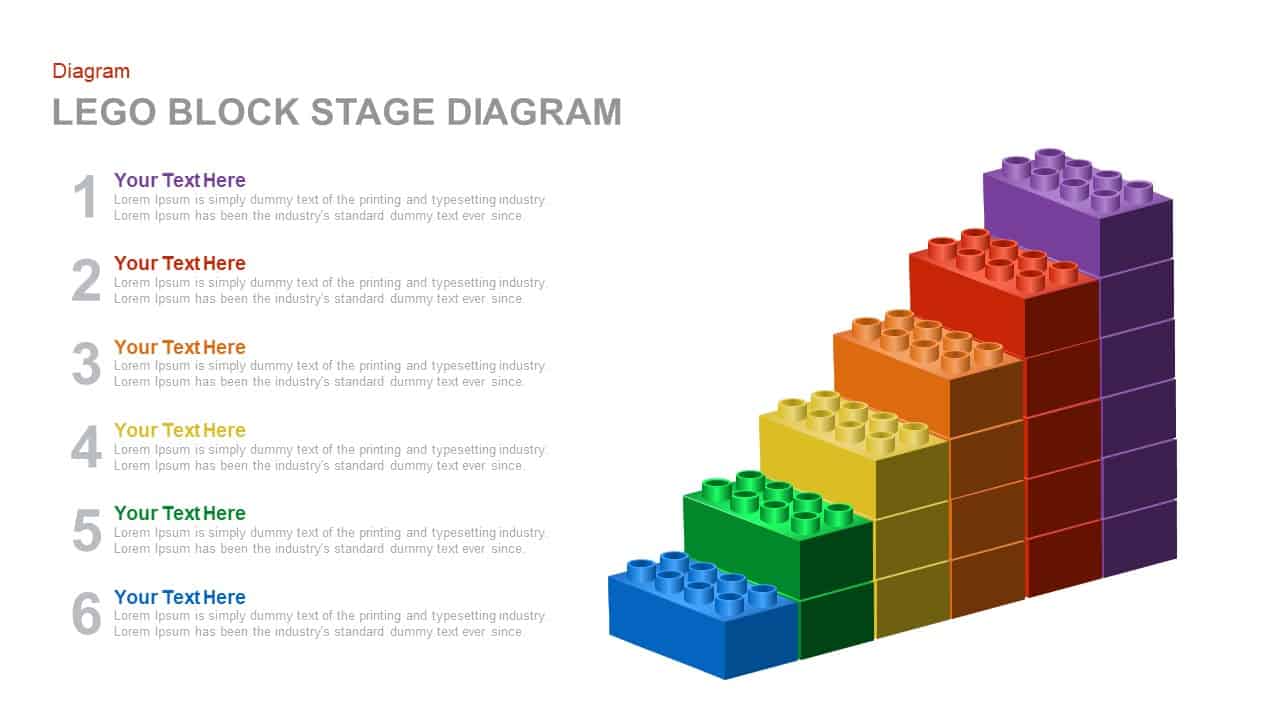
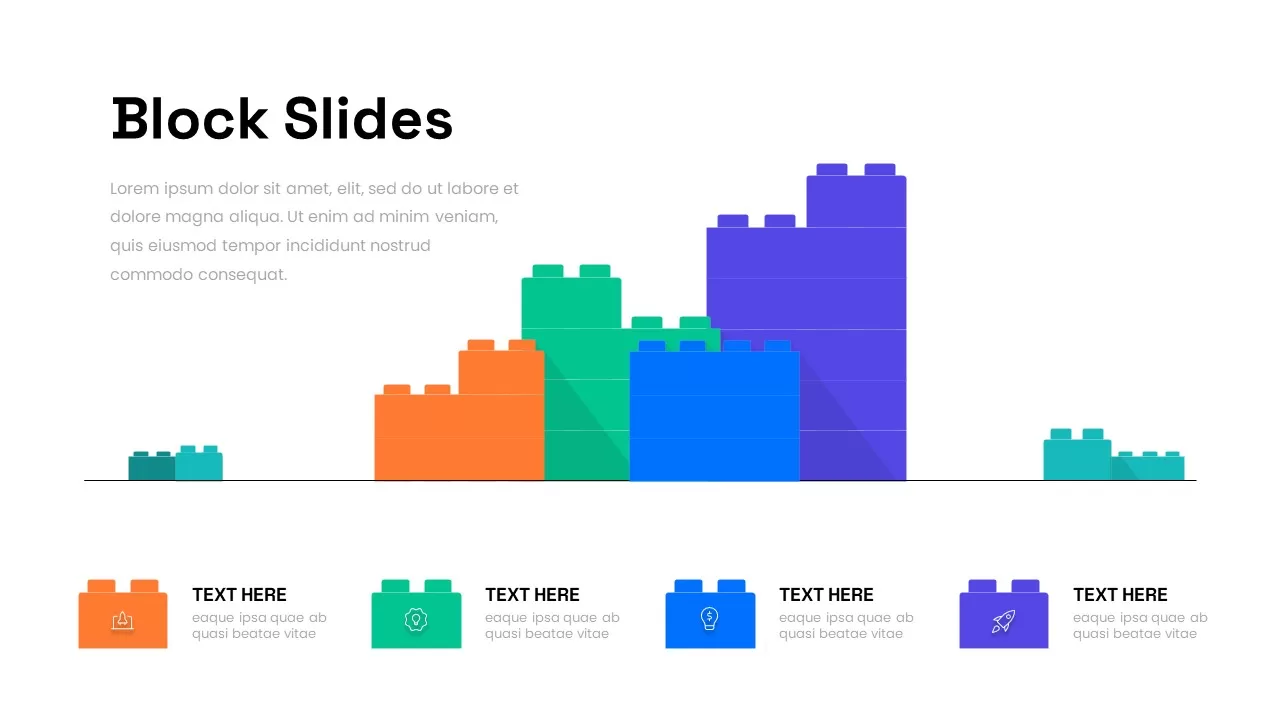
Colorful LEGO Block Stage Diagram Template for PowerPoint & Google Slides
Process
3D Block Arrow Infographic Diagram Template for PowerPoint & Google Slides
Arrow
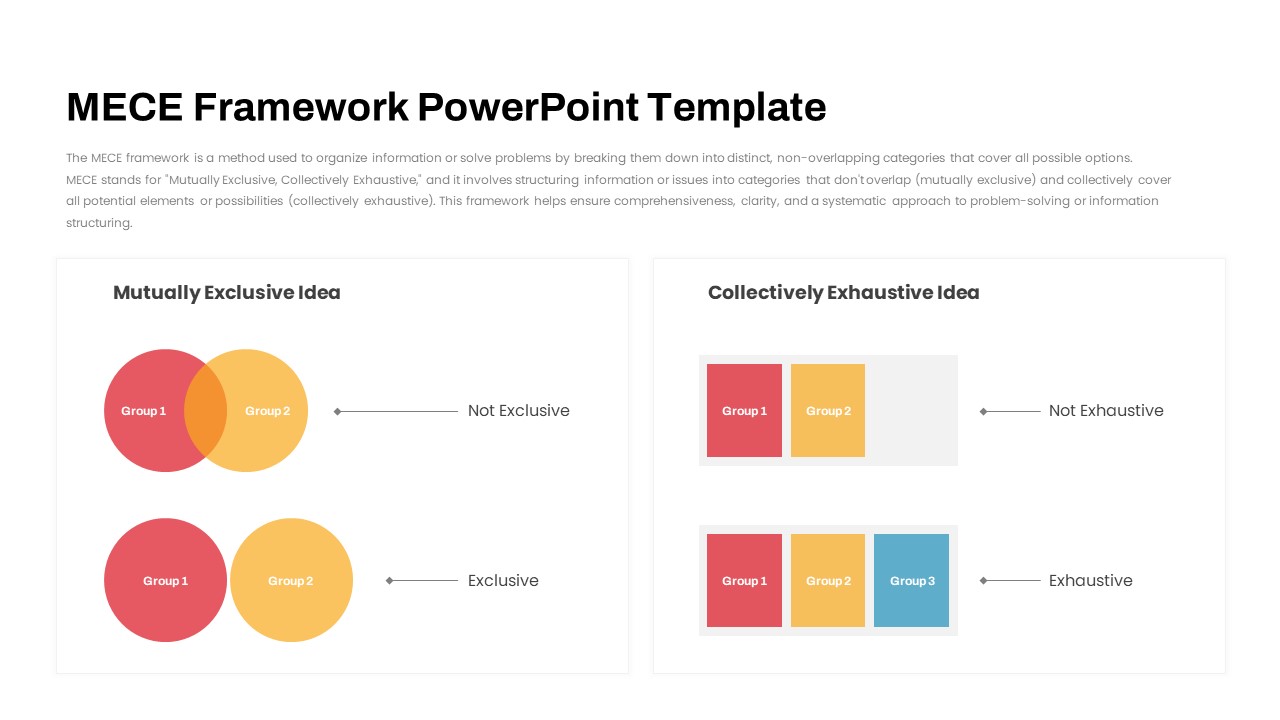
MECE Framework Venn & Block Diagram Template for PowerPoint & Google Slides
Comparison
Smart Bank Isometric PowerPoint Template for PowerPoint & Google Slides
Information Technology
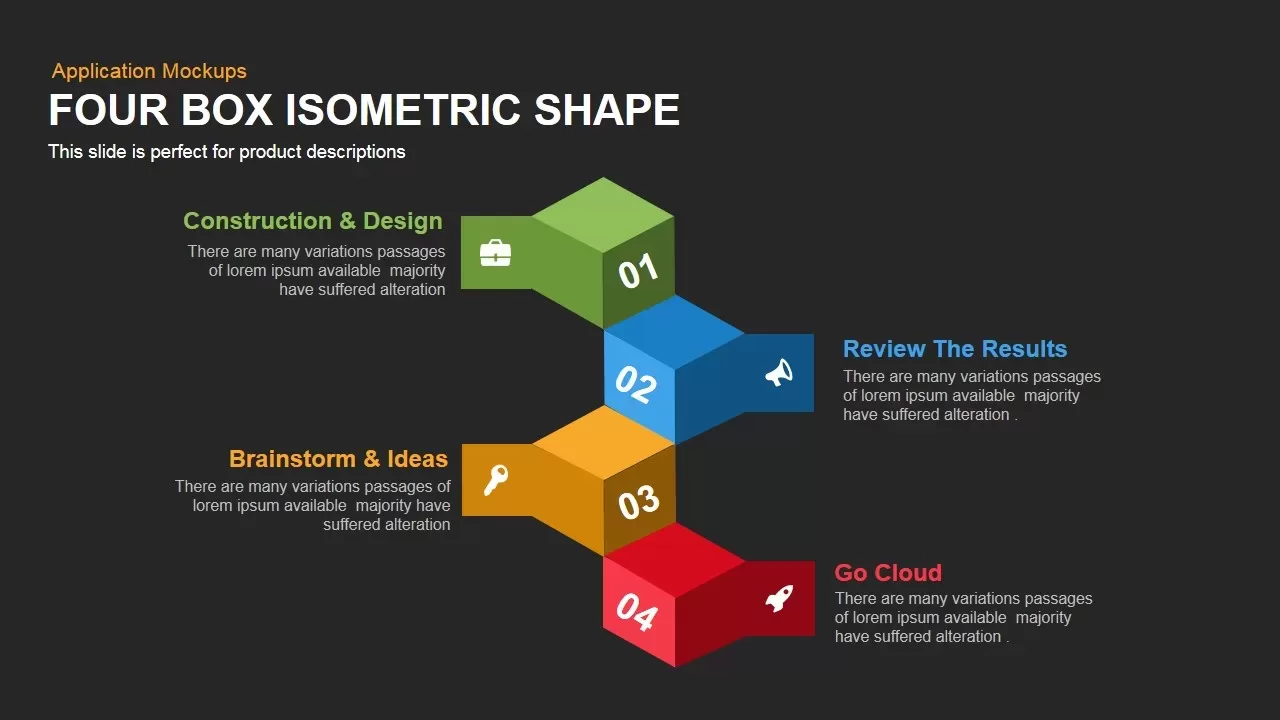
Four Box Isometric template for PowerPoint & Google Slides
Process
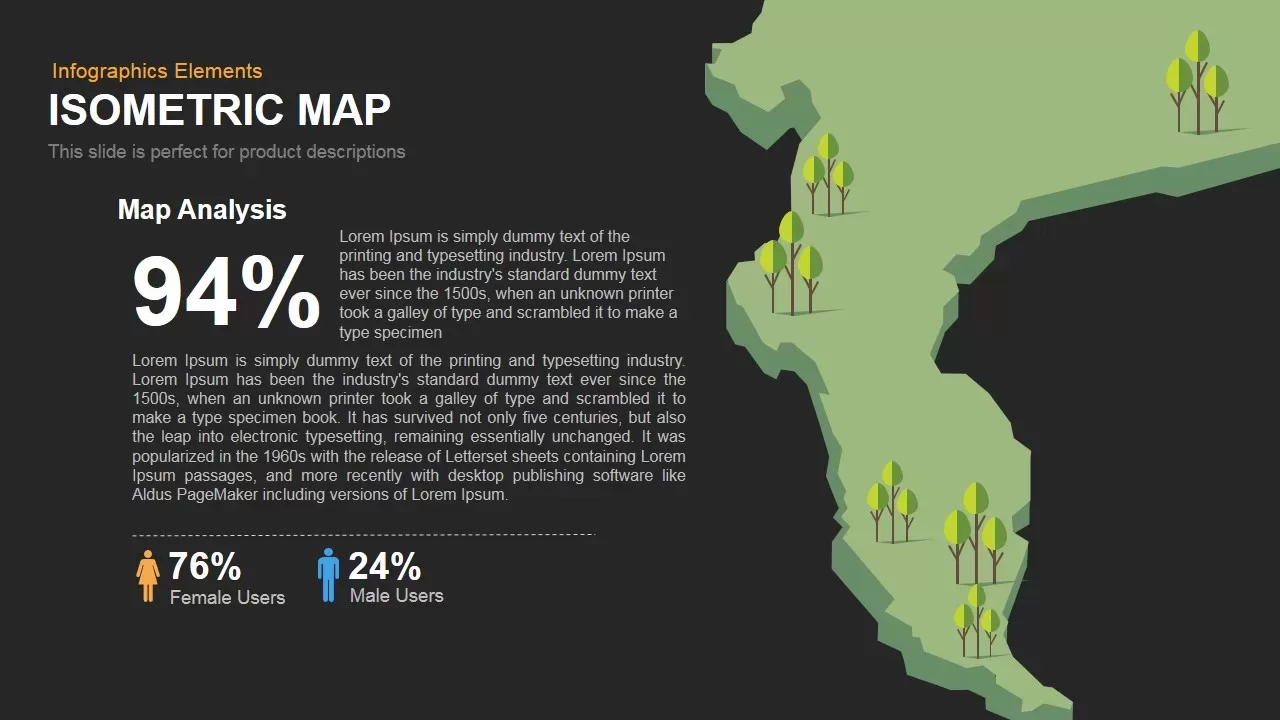
Isometric Map Analysis Slide Template for PowerPoint & Google Slides
World Maps

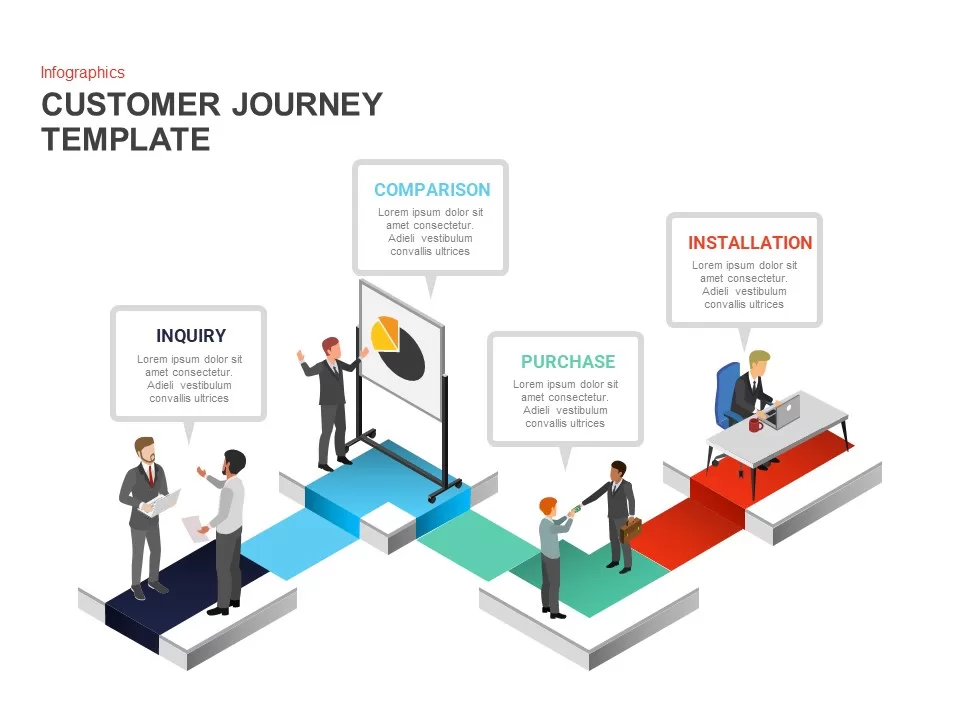
Isometric Customer Journey Path Template for PowerPoint & Google Slides
Customer Journey
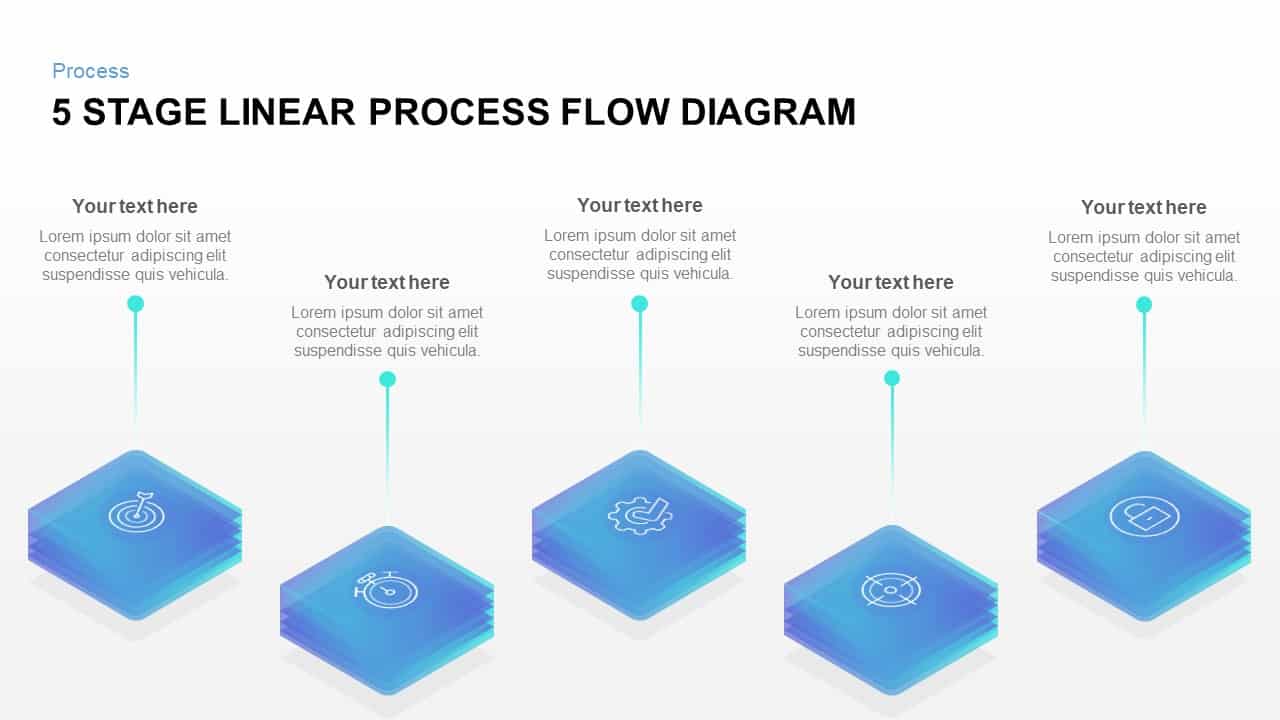
Isometric Five-Stage Process Flow Template for PowerPoint & Google Slides
Process
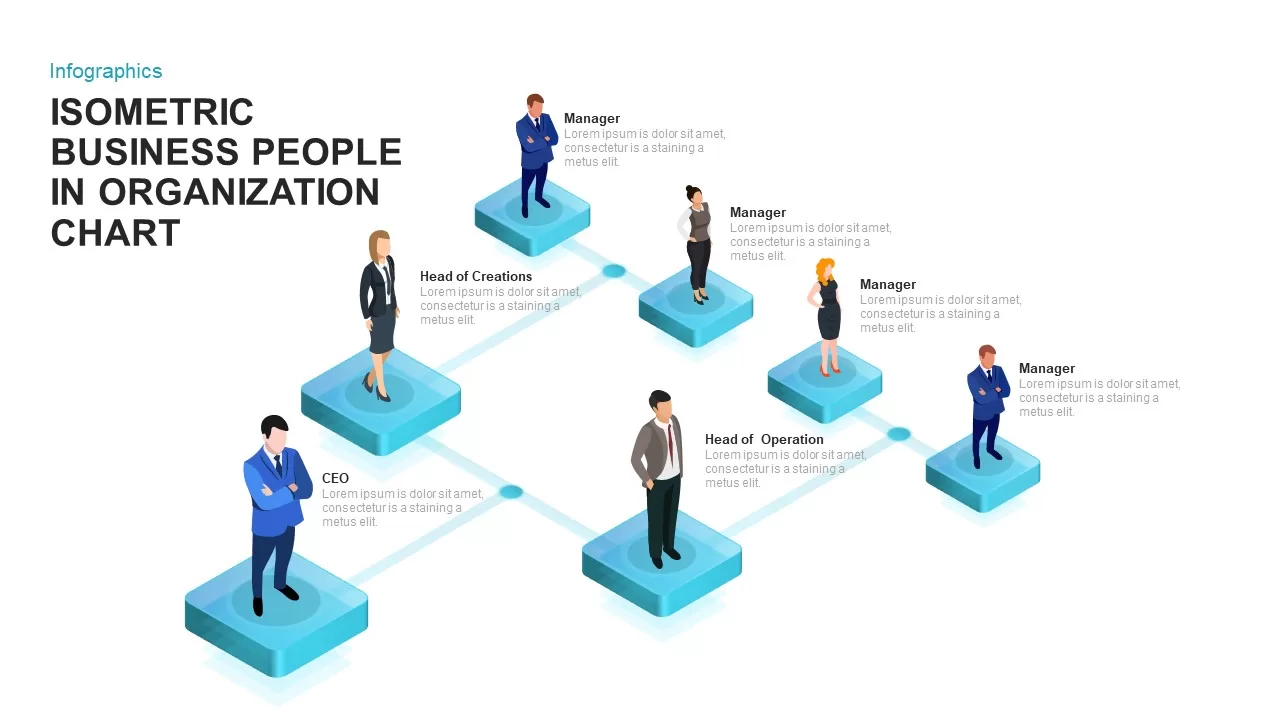
Isometric Business Organization Chart Template for PowerPoint & Google Slides
Org Chart
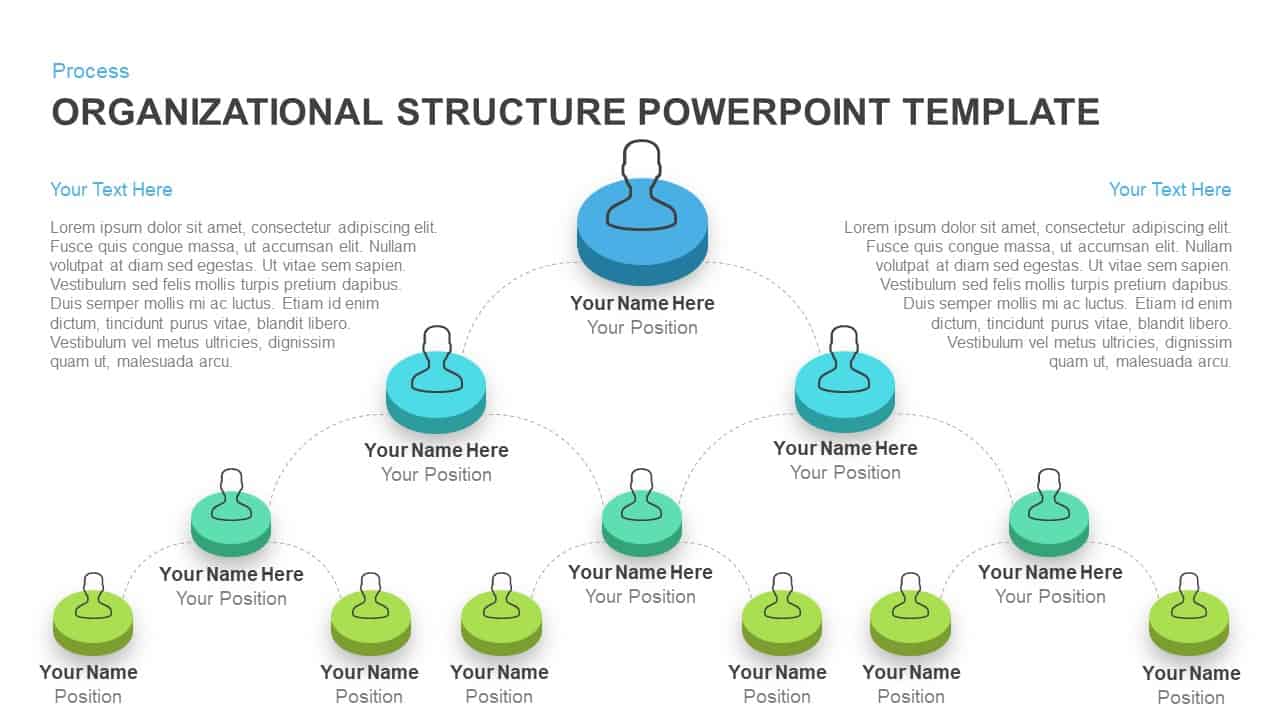
Isometric Organizational Structure Chart Template for PowerPoint & Google Slides
Org Chart
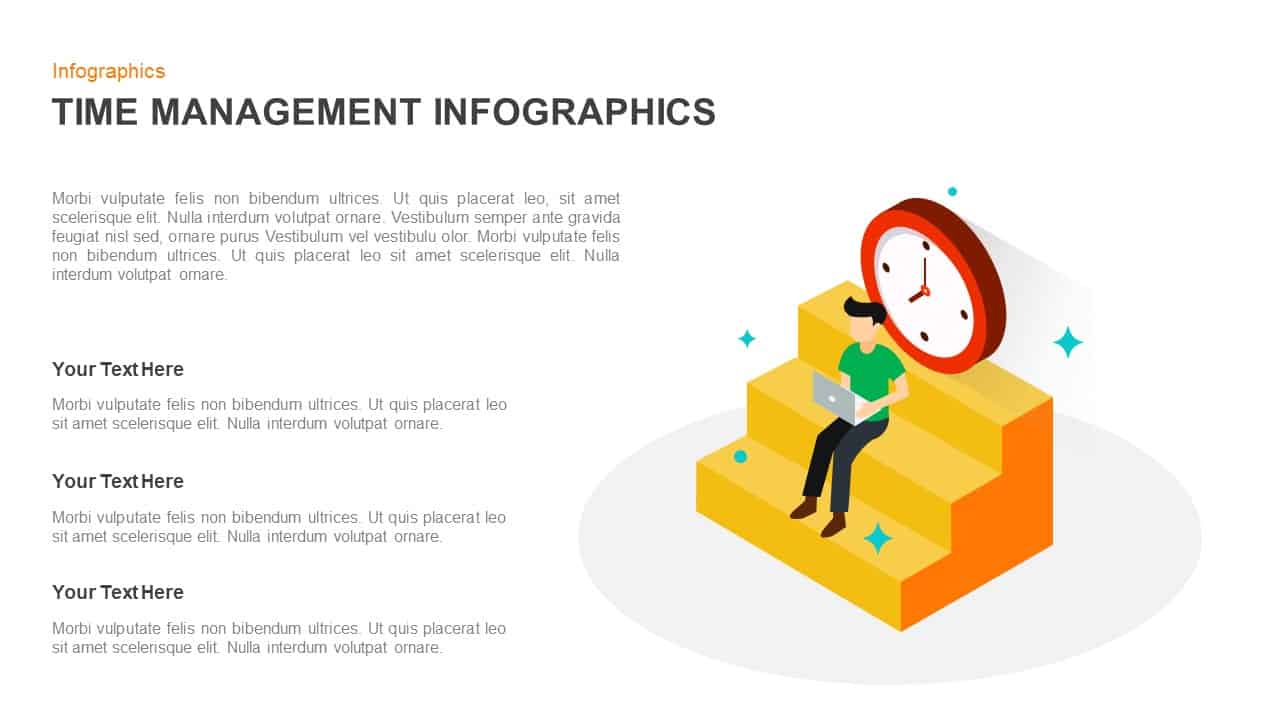
Isometric Time Management Infographic Template for PowerPoint & Google Slides
Process
Modern Isometric Company Profile Template for PowerPoint & Google Slides
Company Profile

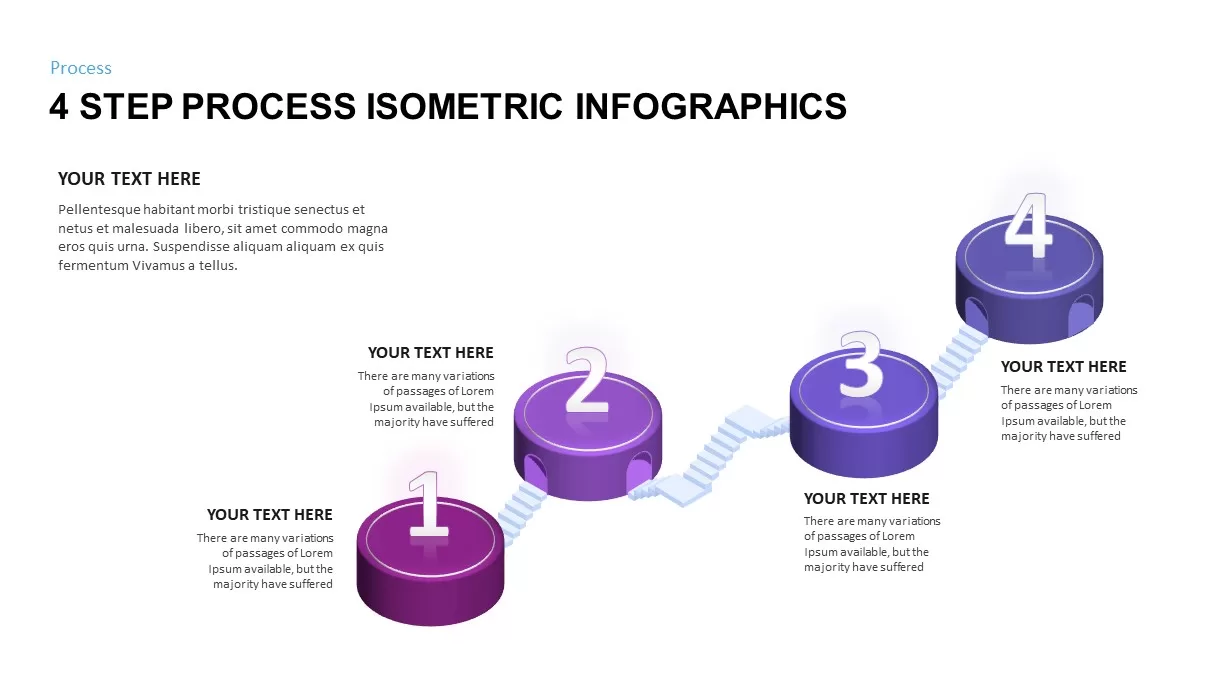
Four-Step Isometric Process Infographic Template for PowerPoint & Google Slides
Process
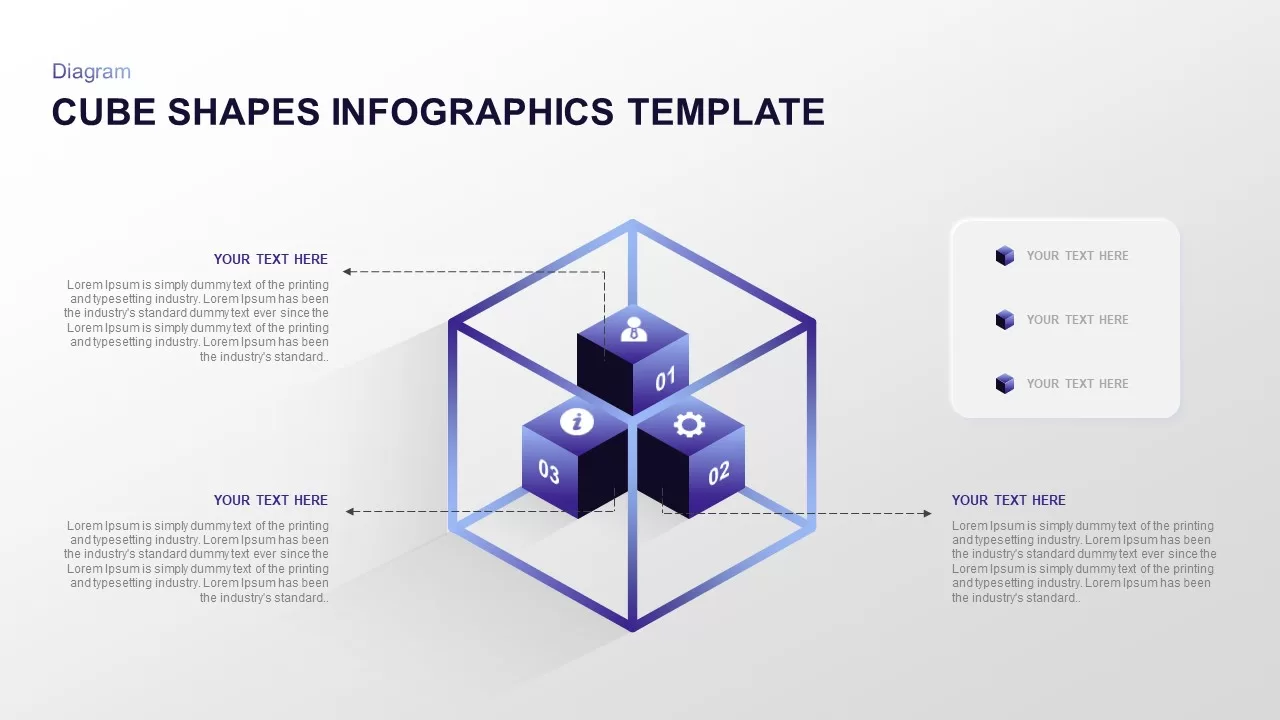
Isometric 3D Cube Shapes Infographics Template for PowerPoint & Google Slides
Infographics
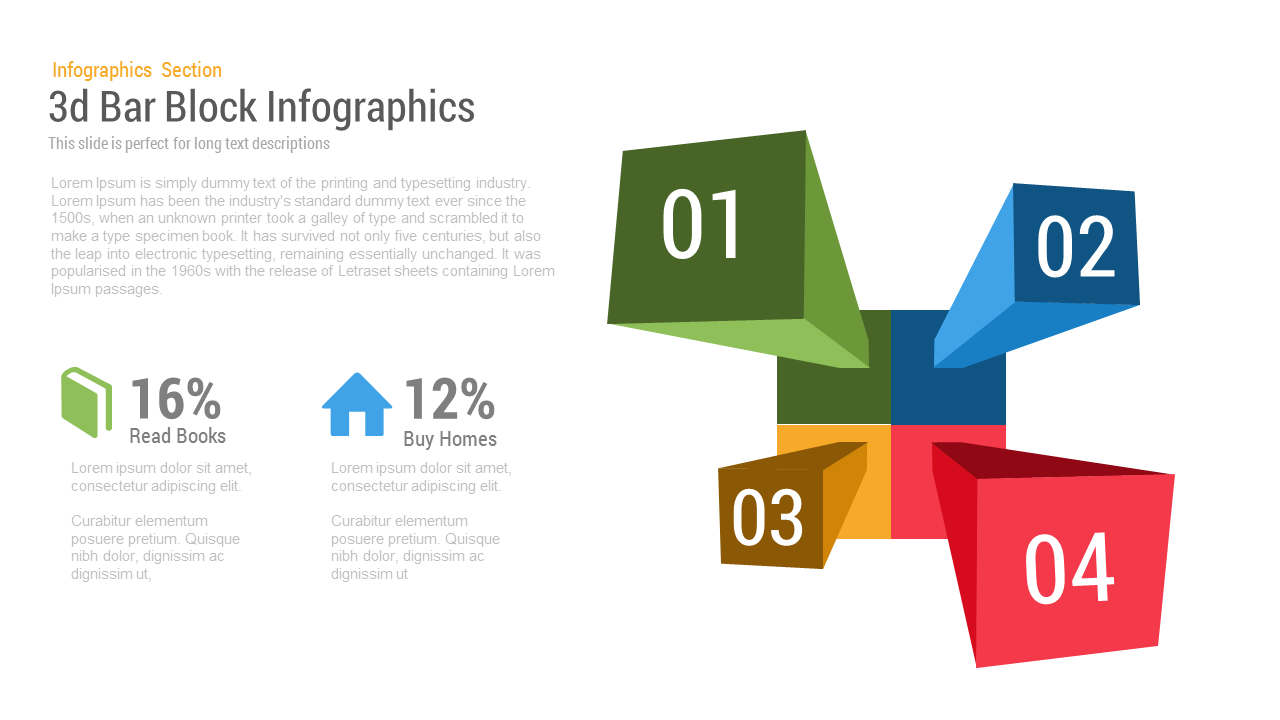
3D Block Infographic template for PowerPoint & Google Slides
Infographics
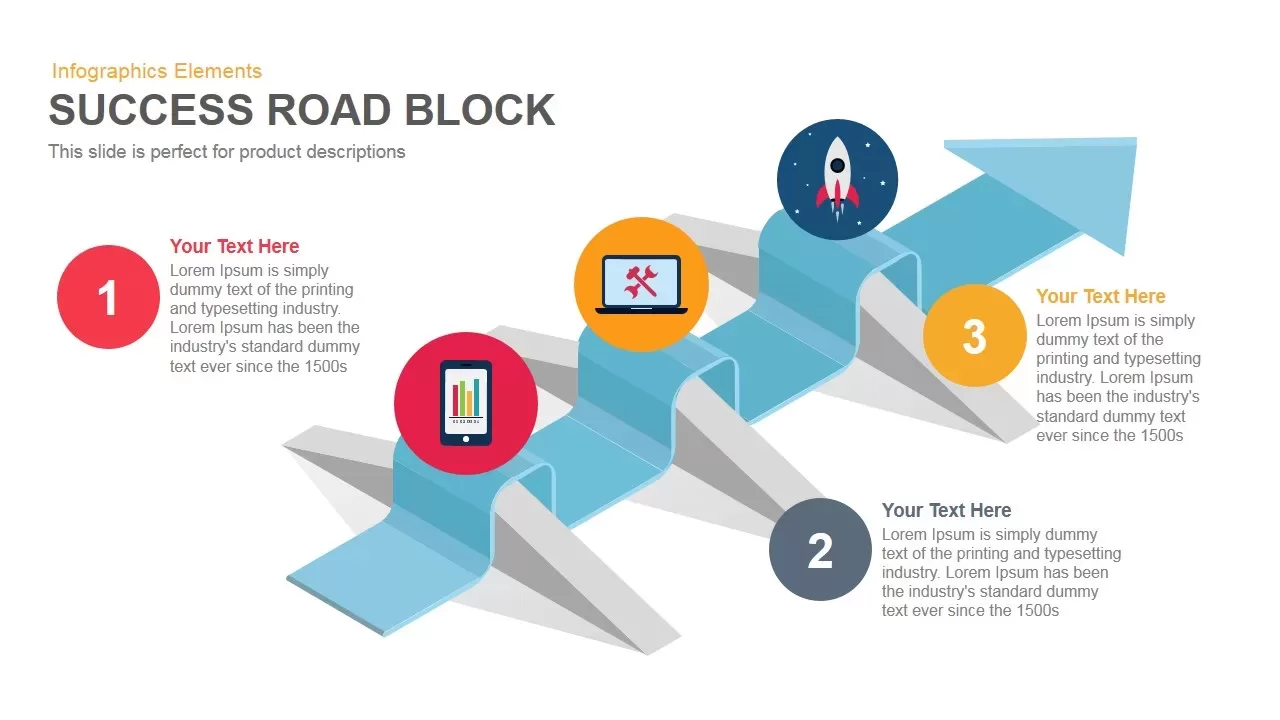
Success Road Block template for PowerPoint & Google Slides
Process

Modern Ten-Block Section Title Chart template for PowerPoint & Google Slides
Comparison
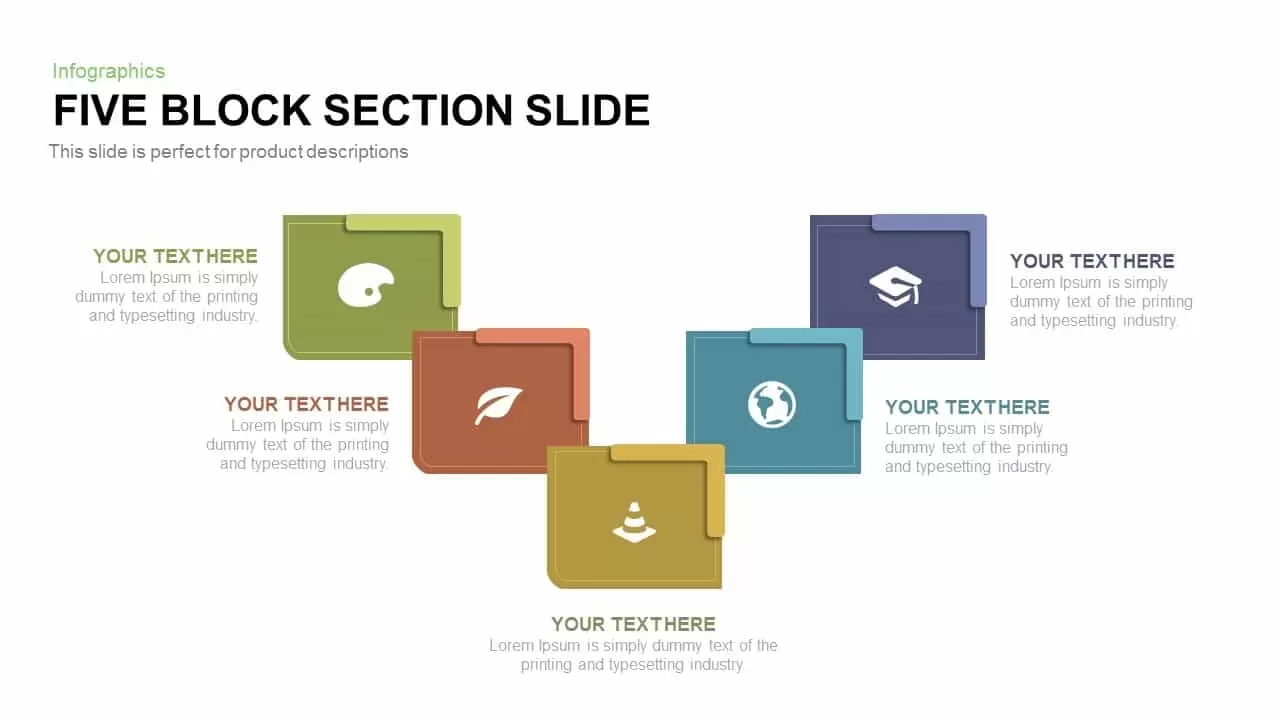
Five-Block Section Feature Highlights Template for PowerPoint & Google Slides
Comparison
Modular Block Infographic Slide Template for PowerPoint & Google Slides
Infographics
Six-Layer 3D Block Stack Infographic Template for PowerPoint & Google Slides
Process
Colorful Block Infographic Metrics Slide Template for PowerPoint & Google Slides
Infographics
Six-Block Capability Statement Template for PowerPoint & Google Slides
Business Report
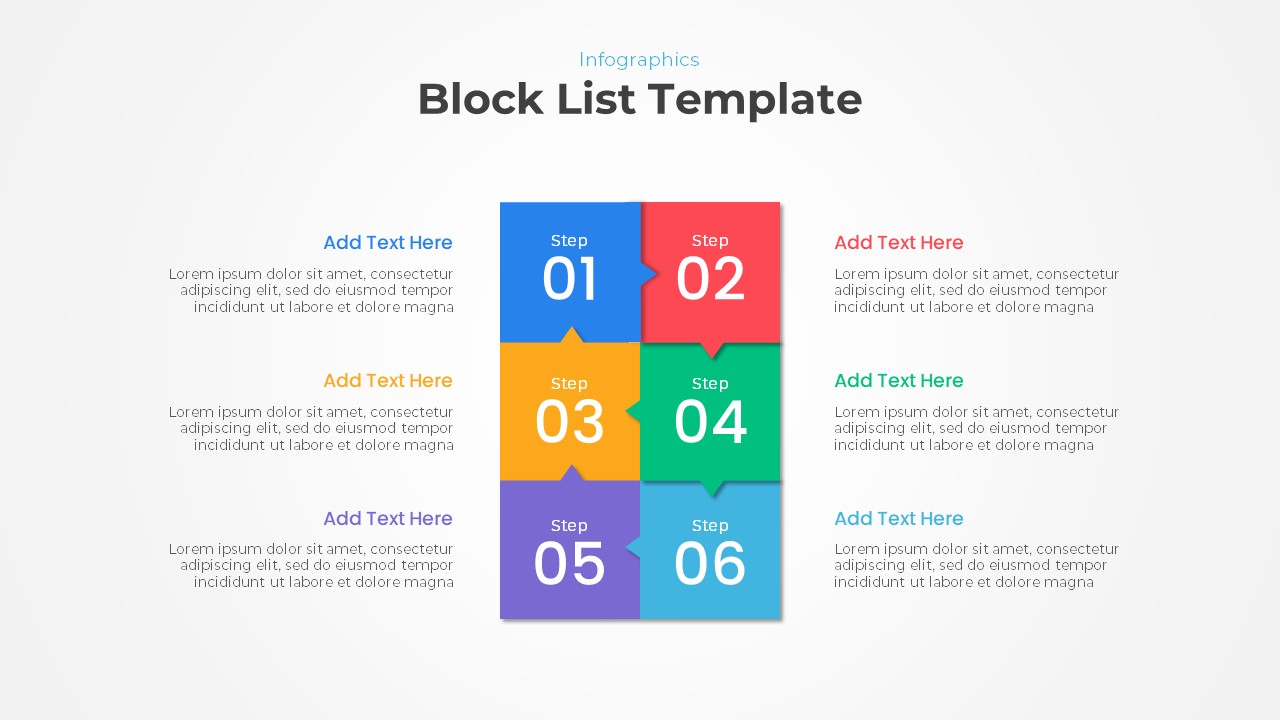
Creative Block List Infographic Template for PowerPoint & Google Slides
Agenda
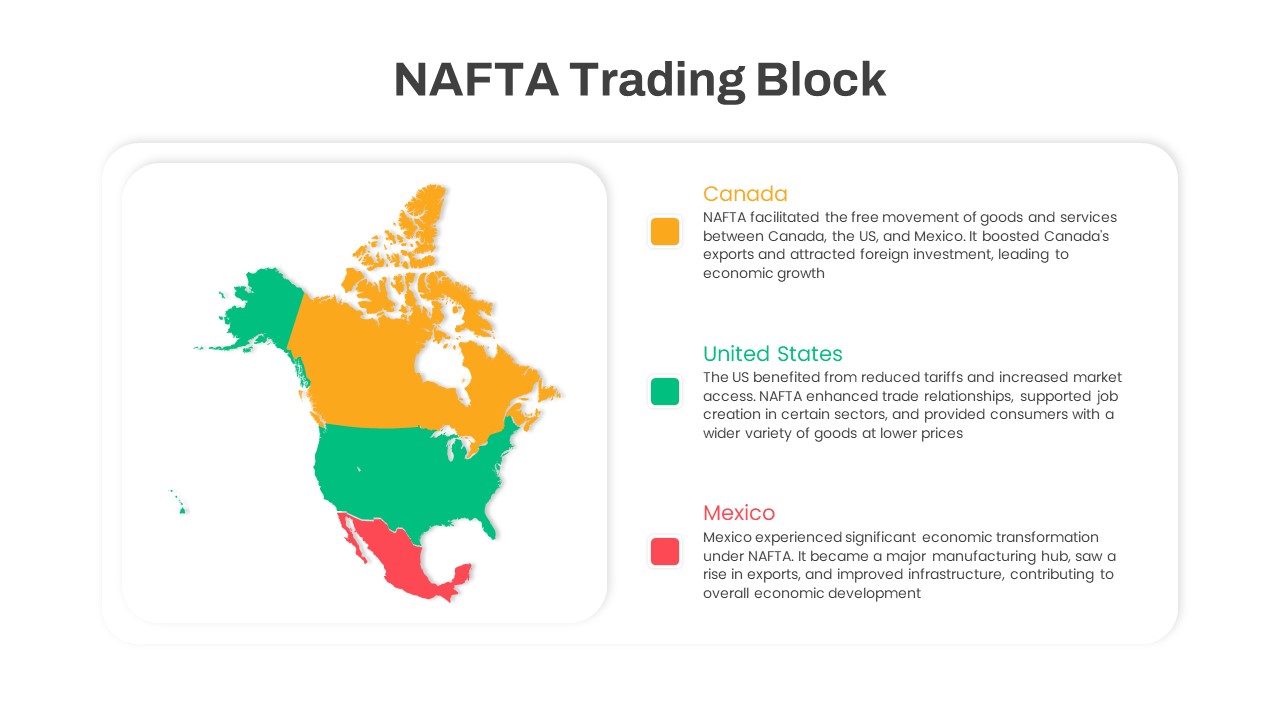
NAFTA Trading Block Map Infographic Template for PowerPoint & Google Slides
World Maps
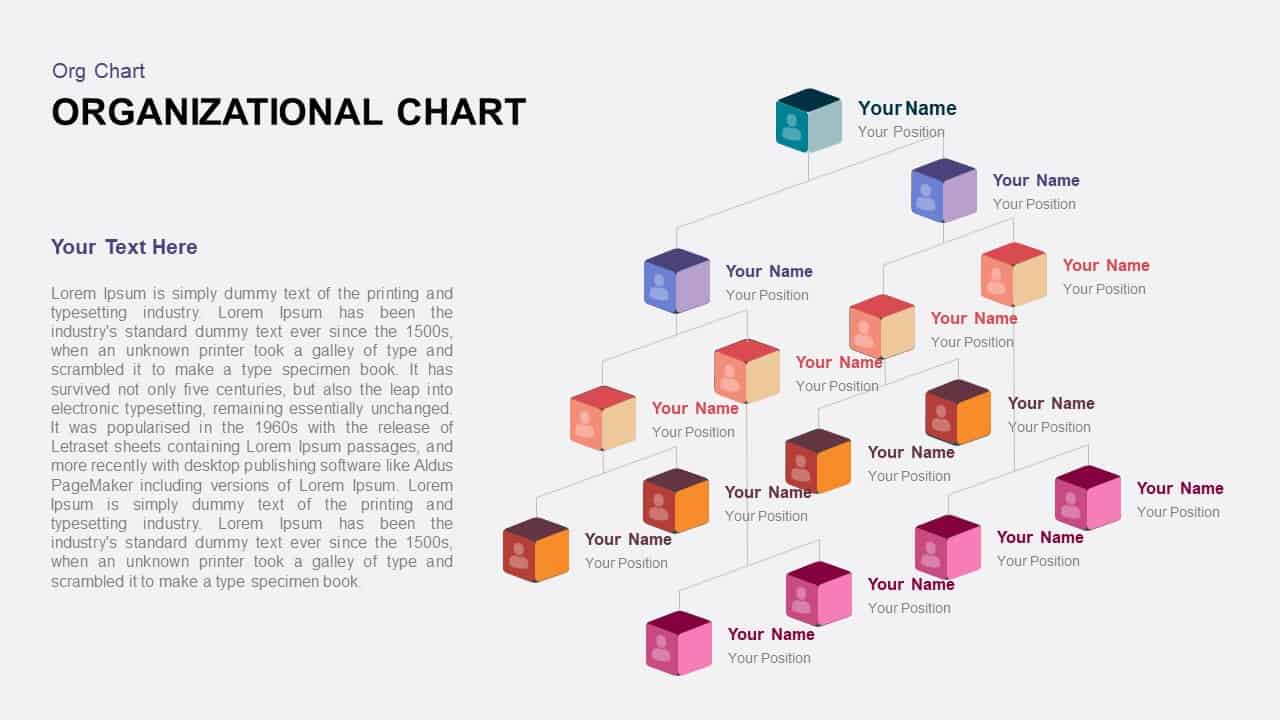
3D Color Block Organizational Chart Slide for PowerPoint & Google Slides
Org Chart
Four Section Comparison Chart Diagram Template for PowerPoint & Google Slides
Infographics

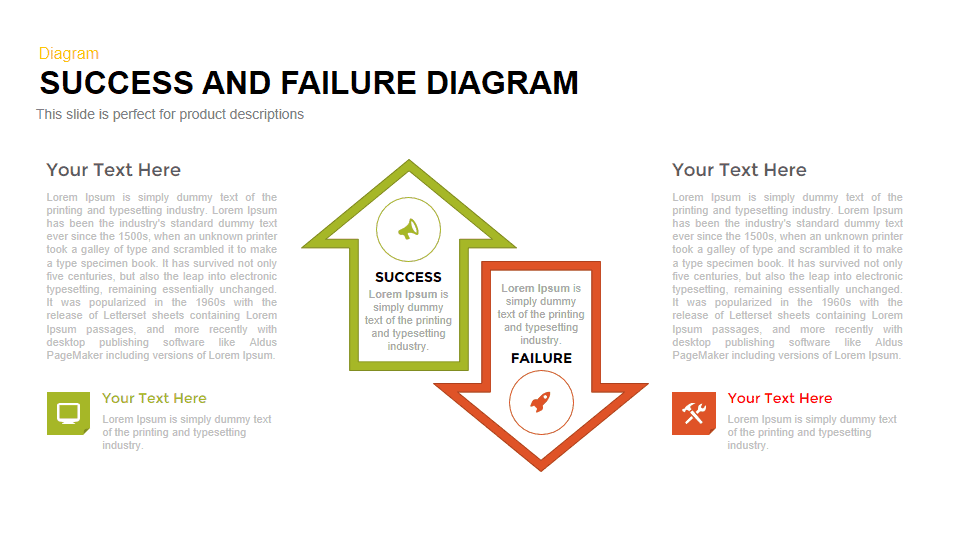
Success vs Failure Comparison Diagram Template for PowerPoint & Google Slides
Comparison
Four Business Structure Types Comparison Diagram Template for PowerPoint & Google Slides
Business Strategy
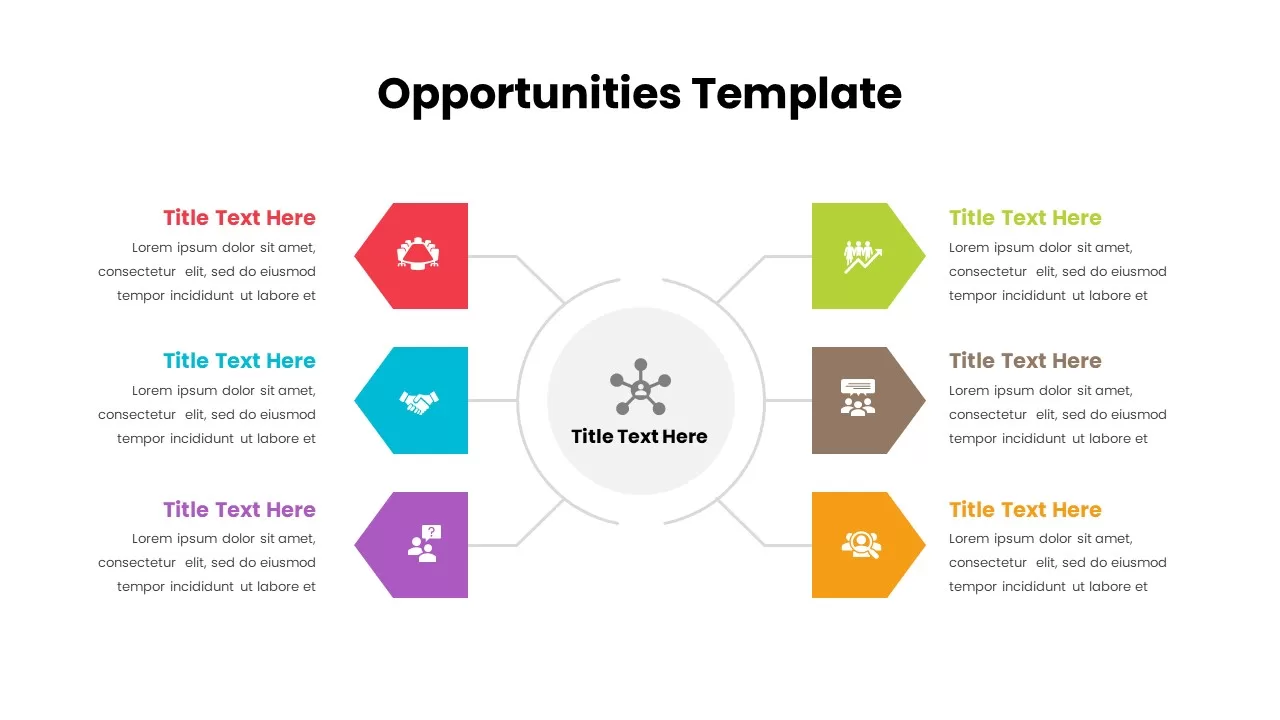
Opportunities Hub-and-Spoke Comparison Diagram Template for PowerPoint & Google Slides
Opportunities Challenges
Integrative Thinking Comparison Diagram Template for PowerPoint & Google Slides
Comparison
Market Share Comparison Diagram Template for PowerPoint & Google Slides
Comparison Chart
Two-Sided Coin Comparison Diagram Template for PowerPoint & Google Slides
Comparison
Attribution Models Comparison Diagram Template for PowerPoint & Google Slides
Comparison
Operating Channels Comparison Diagram Template for PowerPoint & Google Slides
Business Models
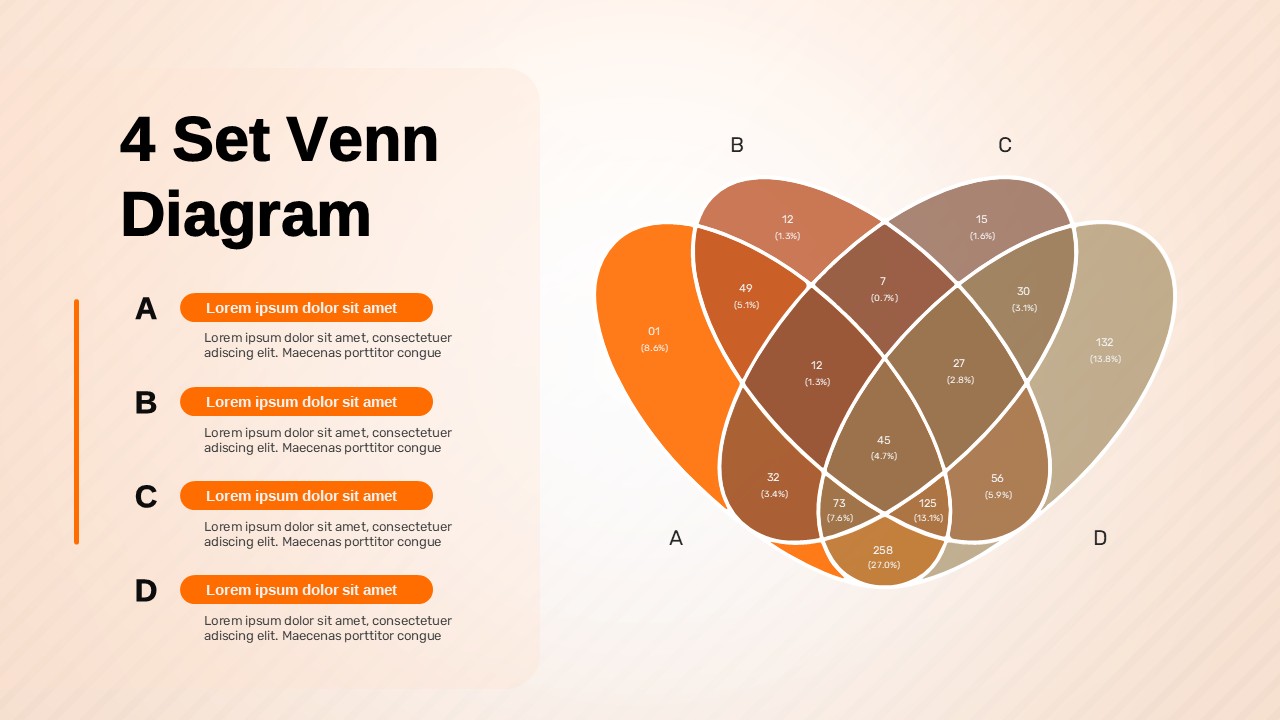
4 Set Venn Diagram Comparison Template for PowerPoint & Google Slides
Comparison
Service Zoom Feature Slides Comparison template for PowerPoint & Google Slides
Process
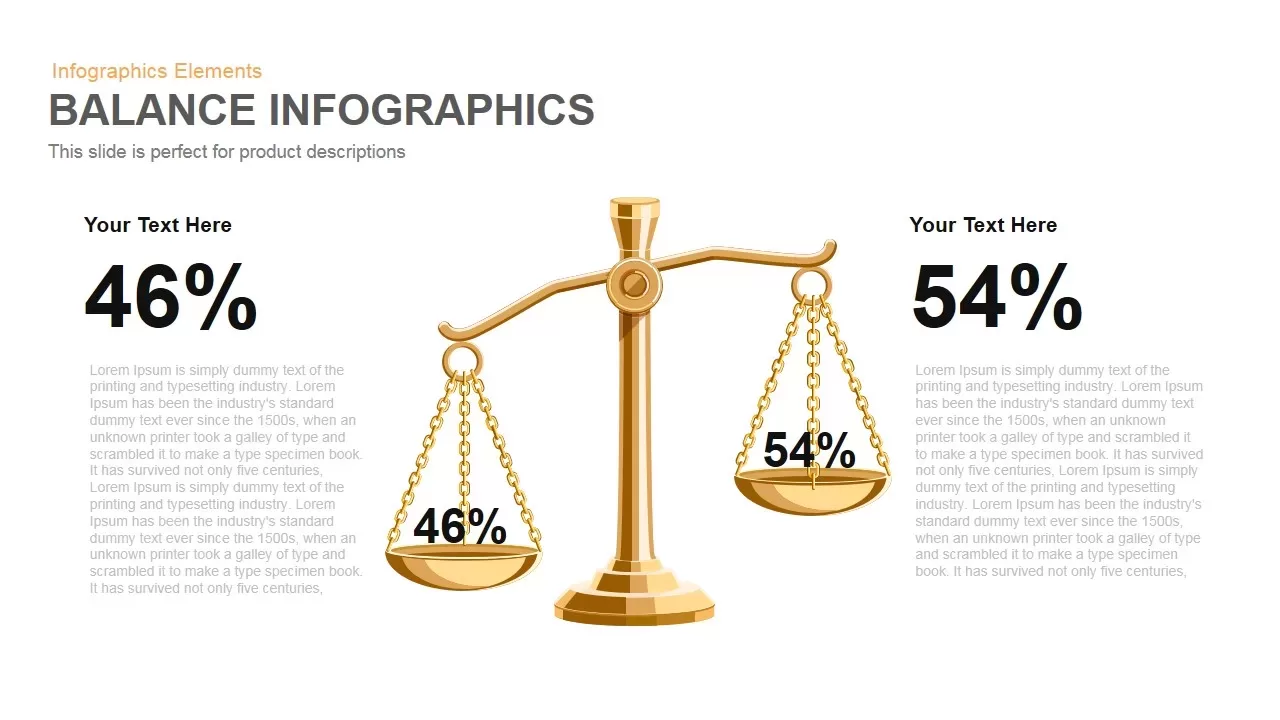
Gold Scales Balance Comparison Template for PowerPoint & Google Slides
Comparison
Four-Tier Pricing Comparison Table Template for PowerPoint & Google Slides
Comparison
Comparison Bar Chart template for PowerPoint & Google Slides
Comparison Chart
3-Column Comparison template for PowerPoint & Google Slides
Comparison

A/B Testing Comparison Infographic template for PowerPoint & Google Slides
Comparison
Four-Plan Pricing Table Comparison Template for PowerPoint & Google Slides
Comparison
Interactive Product Comparison Bar Chart Template for PowerPoint & Google Slides
Bar/Column
Gender Comparison People Infographic Template for PowerPoint & Google Slides
Comparison
Comparison Chart Overview template for PowerPoint & Google Slides
Comparison Chart

Comparison Pricing Table Infographic Template for PowerPoint & Google Slides
Comparison Chart
Interactive Pricing Plan Comparison Template for PowerPoint & Google Slides
Comparison
Six-Metric Green Product Comparison Template for PowerPoint & Google Slides
Comparison
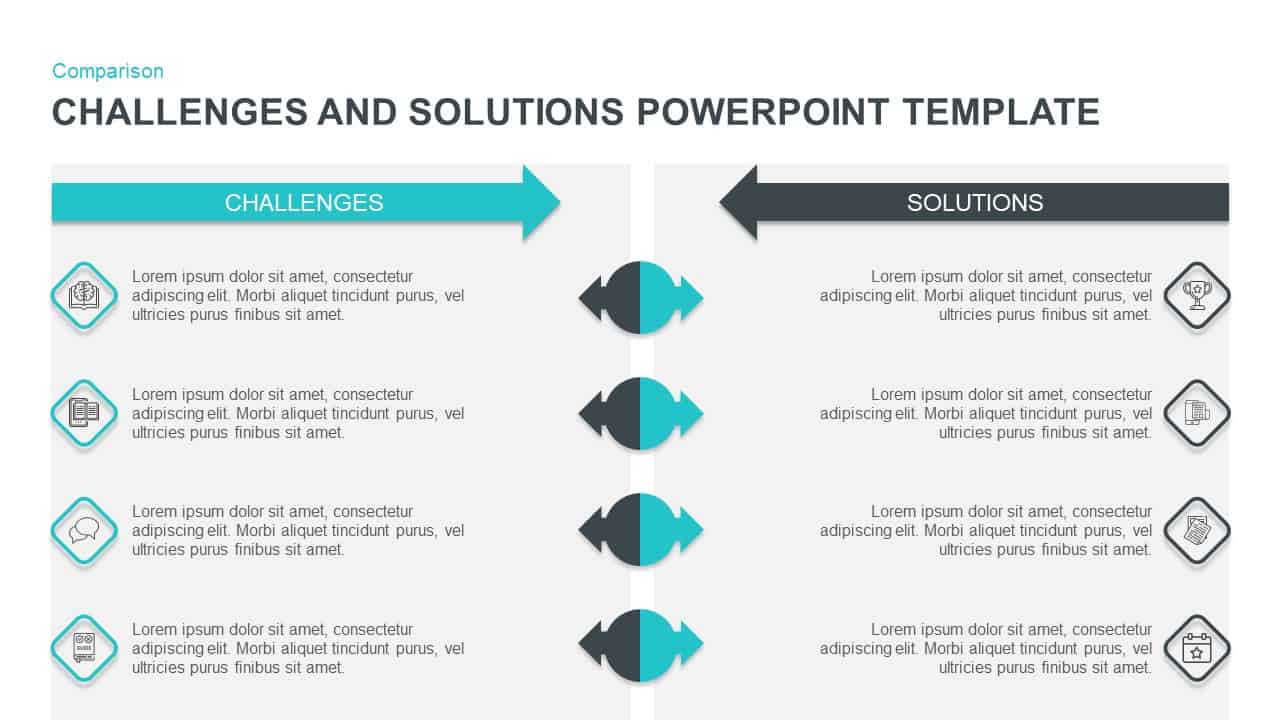
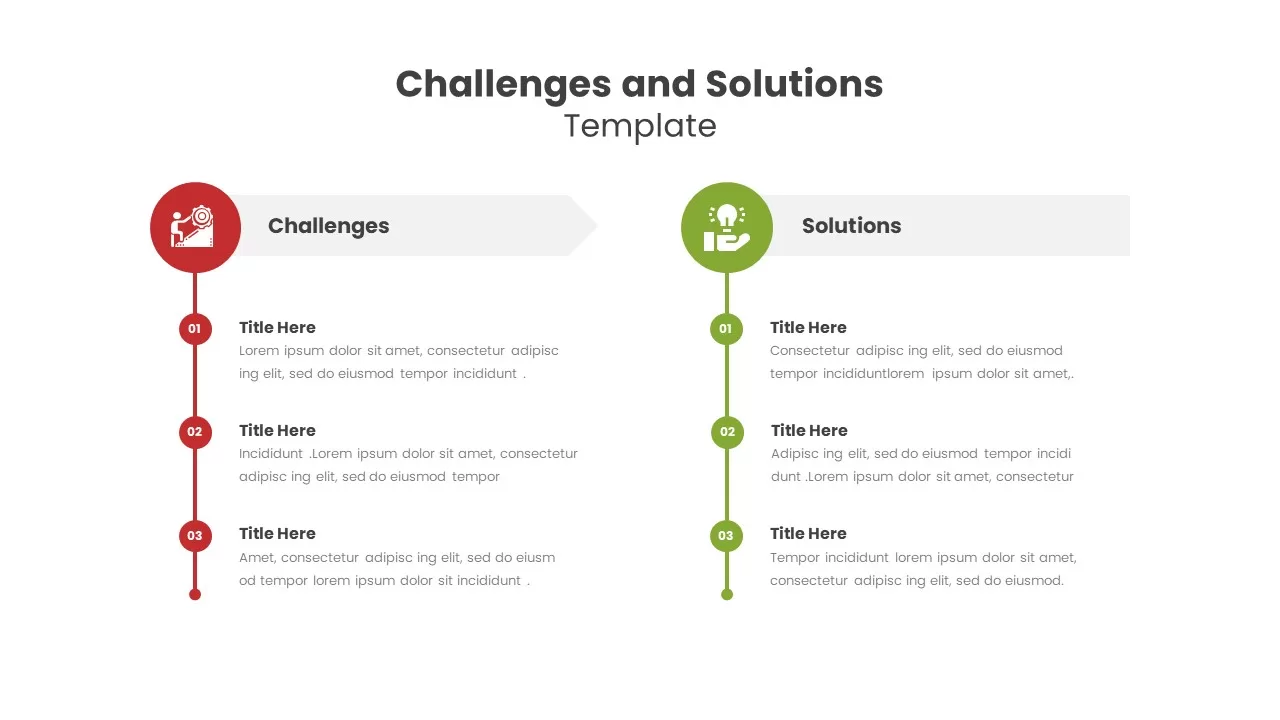
Challenges vs Solutions Comparison Template for PowerPoint & Google Slides
Comparison
Two-Column Comparison Infographic Slide Template for PowerPoint & Google Slides
Comparison
BMI Category Comparison Chart Template for PowerPoint & Google Slides
Comparison
Circular Product Comparison Chart Template for PowerPoint & Google Slides
Comparison Chart
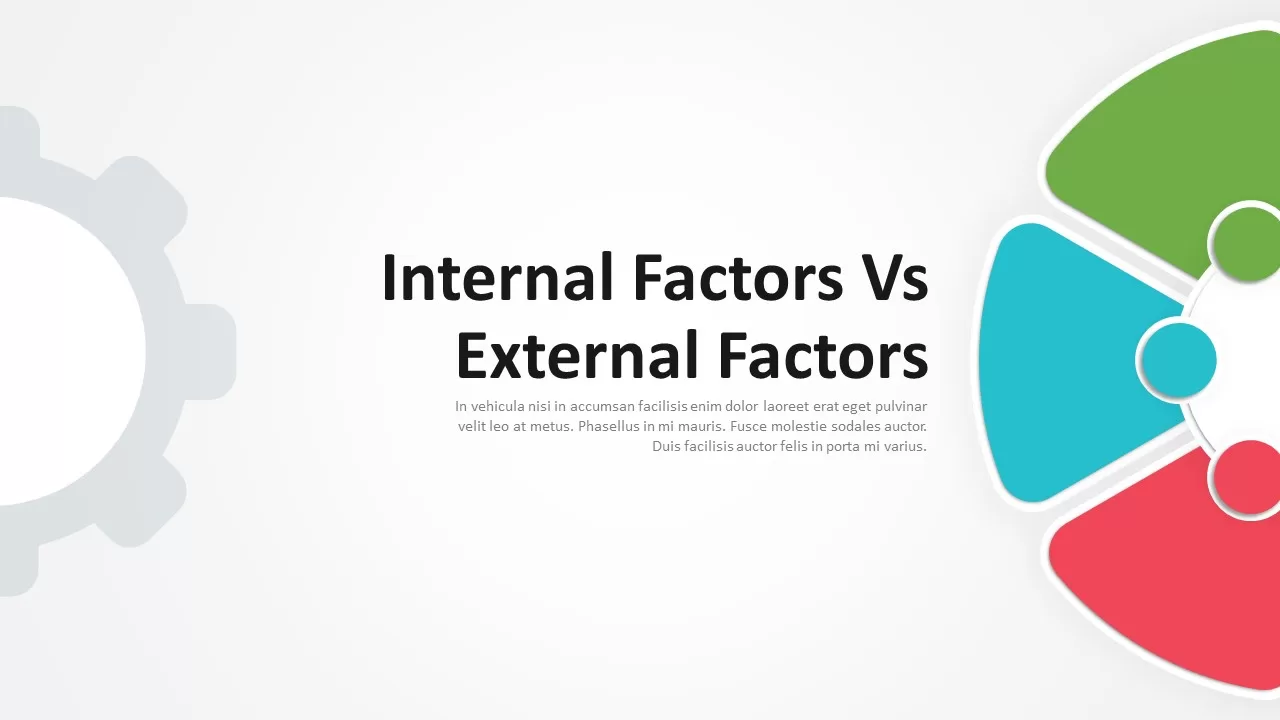
Internal vs External Factors Comparison Template for PowerPoint & Google Slides
Comparison
Theory X and Theory Y Comparison Template for PowerPoint & Google Slides
Comparison
Competitive Landscape Comparison Template Pack for PowerPoint & Google Slides
Comparison
Before and After Comparison Infographics Template for PowerPoint & Google Slides
Comparison
Current vs Future State Comparison Slide Template for PowerPoint & Google Slides
Comparison Chart
Before and After Comparison Infographic Template for PowerPoint & Google Slides
Comparison
Free
Challenges and Solutions Comparison Template for PowerPoint & Google Slides
Opportunities Challenges
Dynamic Benchmarking Comparison Chart Template for PowerPoint & Google Slides
Comparison Chart
Cost Benefit Analysis Comparison Template for PowerPoint & Google Slides
Comparison
Risk Heatmap Comparison Template for PowerPoint & Google Slides
Maps
Heatmap Comparison Template for PowerPoint & Google Slides
Maps
Vendor Comparison Analysis template for PowerPoint & Google Slides
Comparison Chart
Conflict Infographics Comparison Template for PowerPoint & Google Slides
Infographics
Clustered Bar Chart Comparison Template for PowerPoint & Google Slides
Bar/Column
Business Timeline Comparison Bar Chart Template for PowerPoint & Google Slides
Comparison Chart
Multiple Line Chart Comparison Template for PowerPoint & Google Slides
Comparison Chart
Interactive Multi-Use Cost Comparison Template for PowerPoint & Google Slides
Comparison
Free Global Warming Infographic Comparison Template for PowerPoint & Google Slides
Comparison Chart
Free
Dynamic Bar-of-Pie Chart Comparison Template for PowerPoint & Google Slides
Pie/Donut
Types of AI Comparison Infographic Template for PowerPoint & Google Slides
AI
ESG Initiatives Comparison Chart Template for PowerPoint & Google Slides
Business
Regional Revenue Comparison Overview Template for PowerPoint & Google Slides
Comparison
Pricing Model Types Comparison Infographic Template for PowerPoint & Google Slides
Pitch Deck
Project Comparison Timeline Roadmap Template for PowerPoint & Google Slides
Comparison
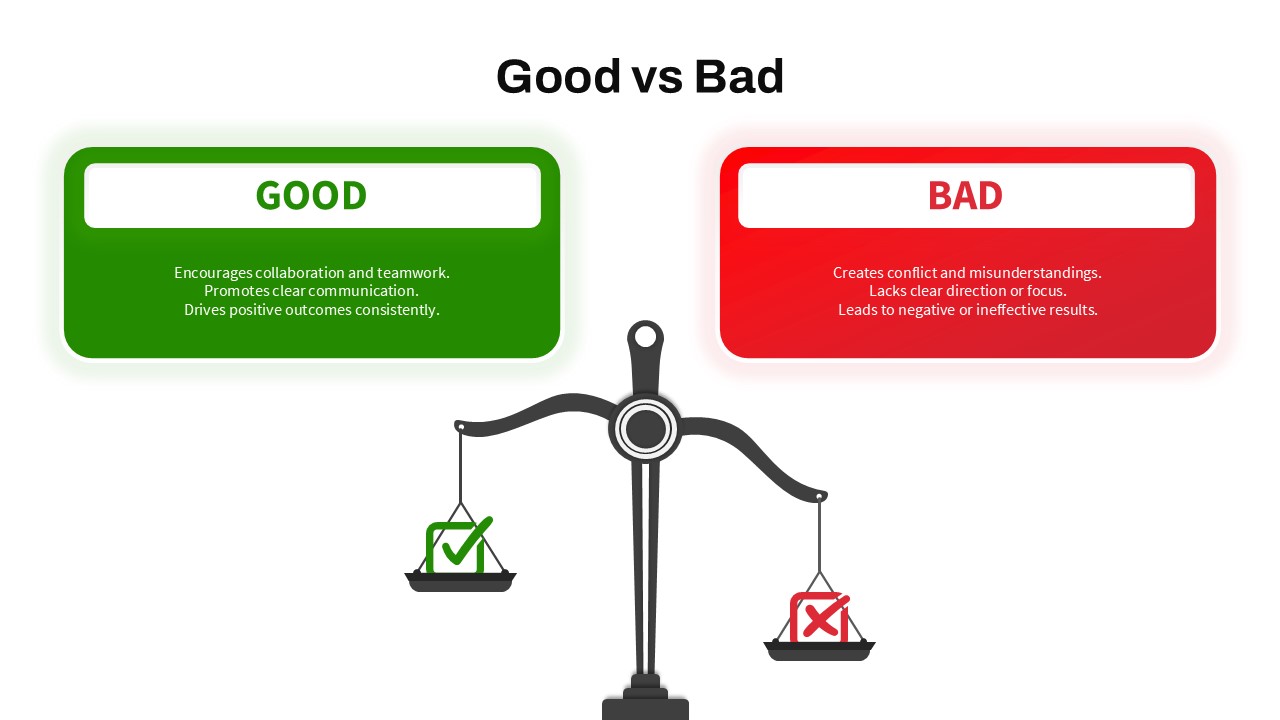
Good vs Bad Comparison with Scale Template for PowerPoint & Google Slides
Comparison
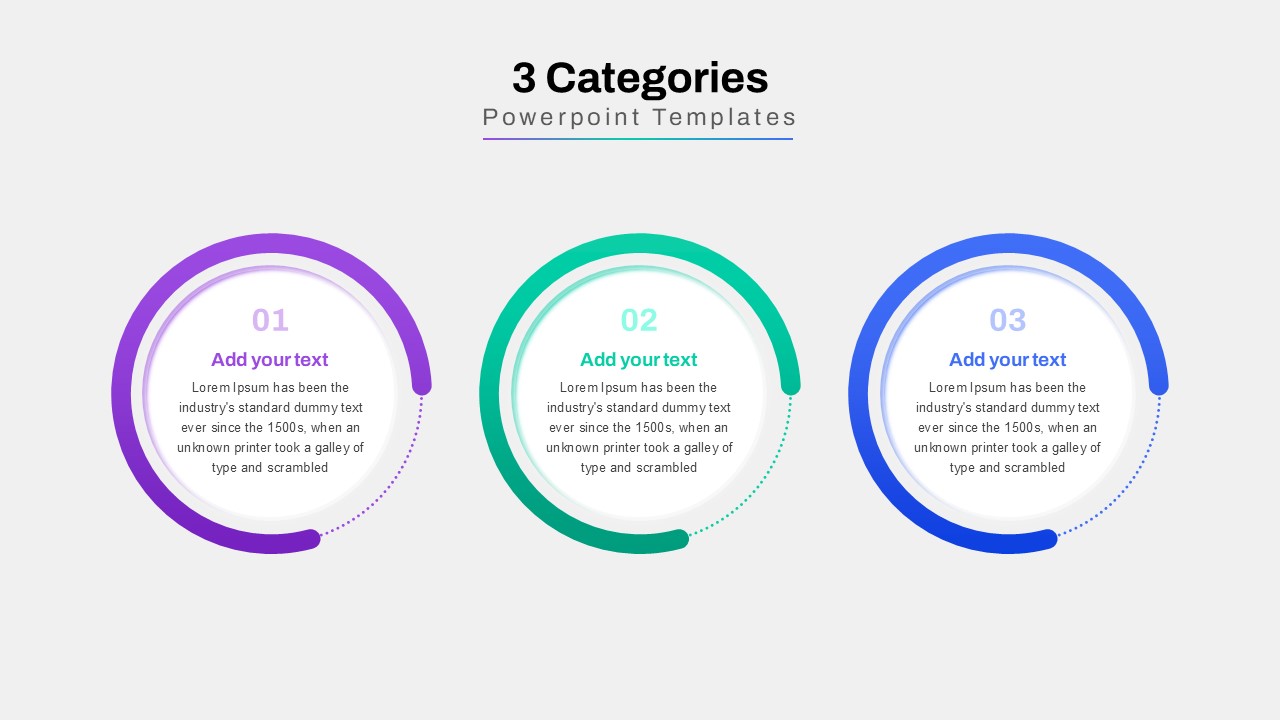
Three-Category Comparison Template for PowerPoint & Google Slides
Comparison
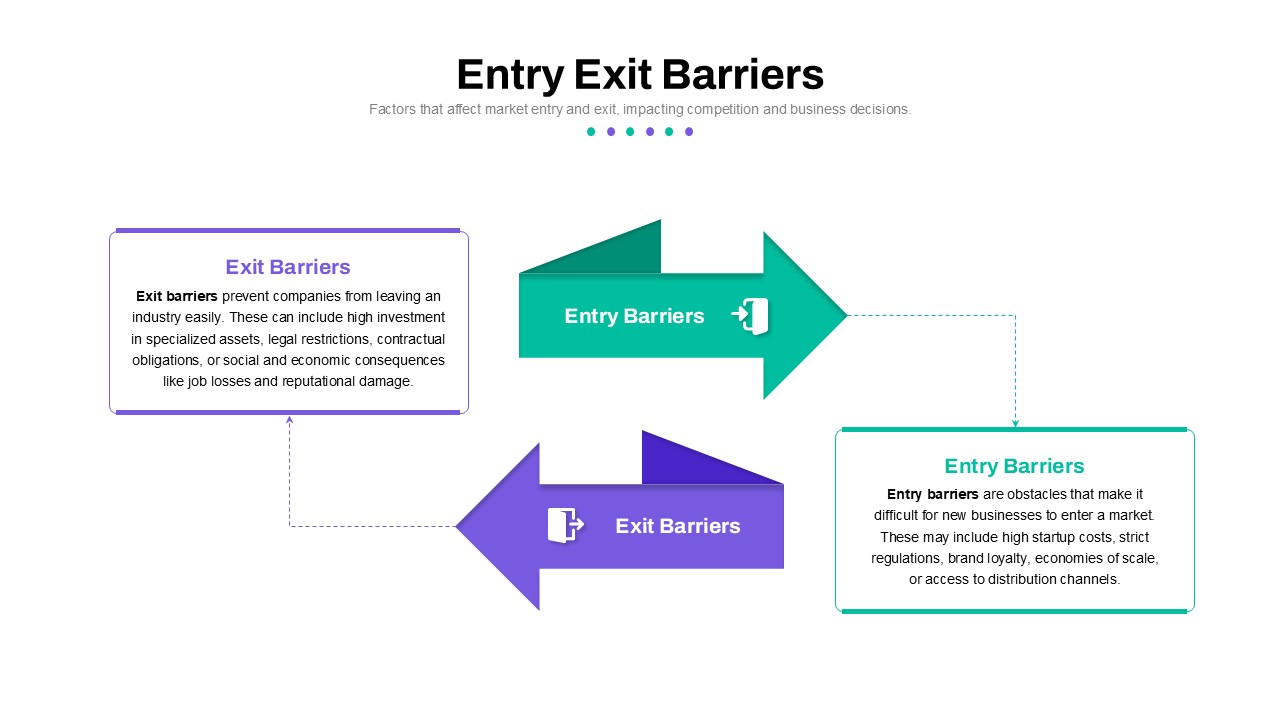
Entry and Exit Barriers Comparison Template for PowerPoint & Google Slides
Comparison
Competitor Comparison Chart Design Template for PowerPoint & Google Slides
Comparison
Profile Comparison Chart template for PowerPoint & Google Slides
Comparison Chart
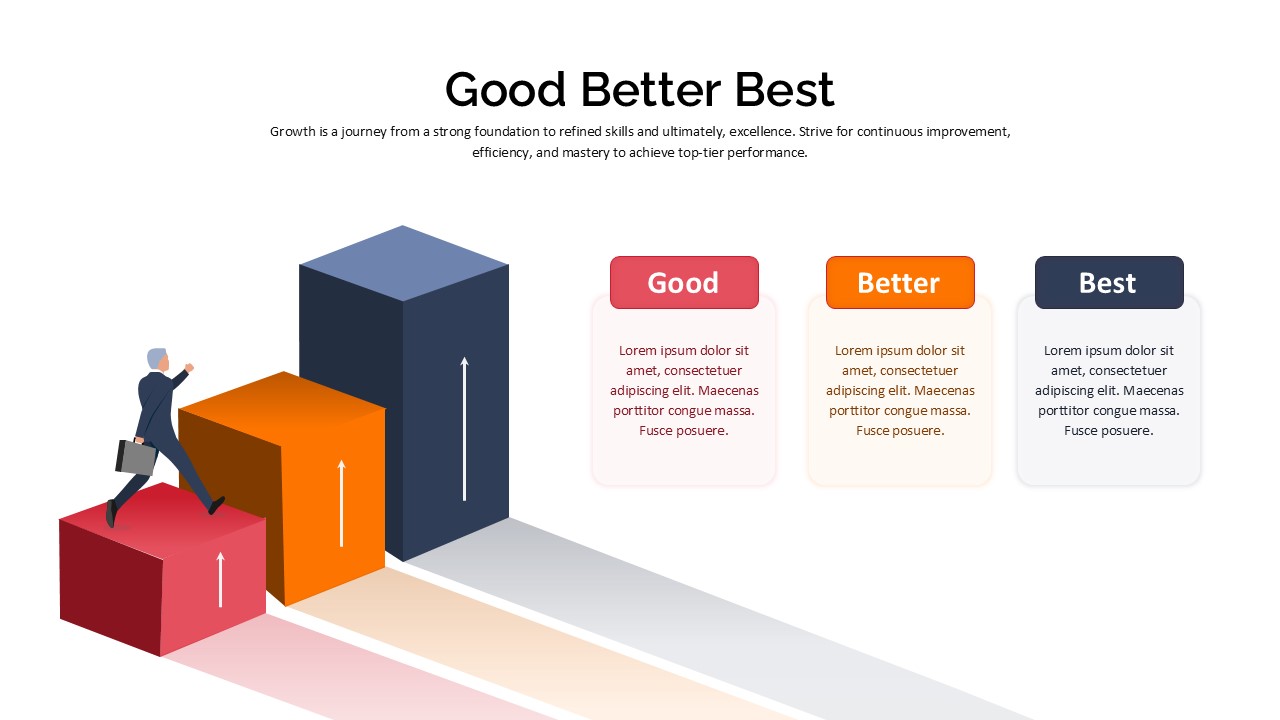
Good Better Best Comparison template for PowerPoint & Google Slides
Comparison
Competitor Profile Matrix Comparison Template for PowerPoint & Google Slides
Comparison Chart
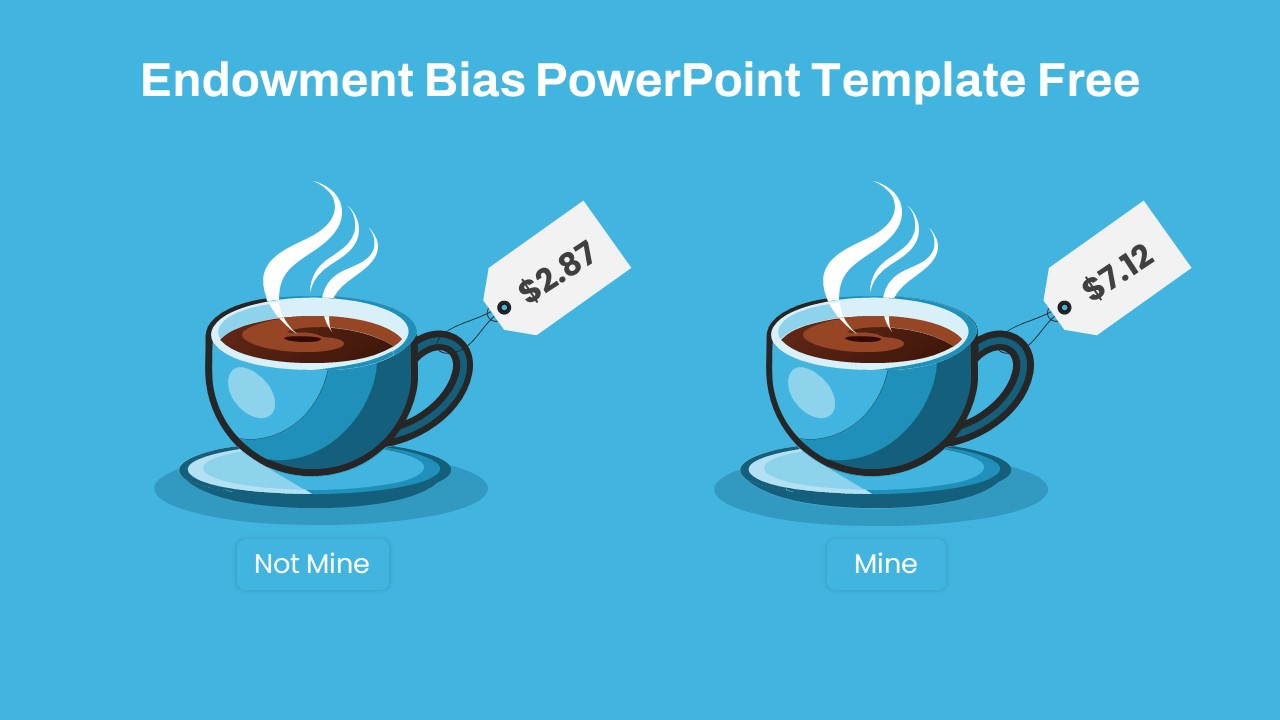
Endowment Bias Coffee Price Comparison Template for PowerPoint & Google Slides
Comparison
Free
Sales Growth Comparison Chart & Table Template for PowerPoint & Google Slides
Bar/Column
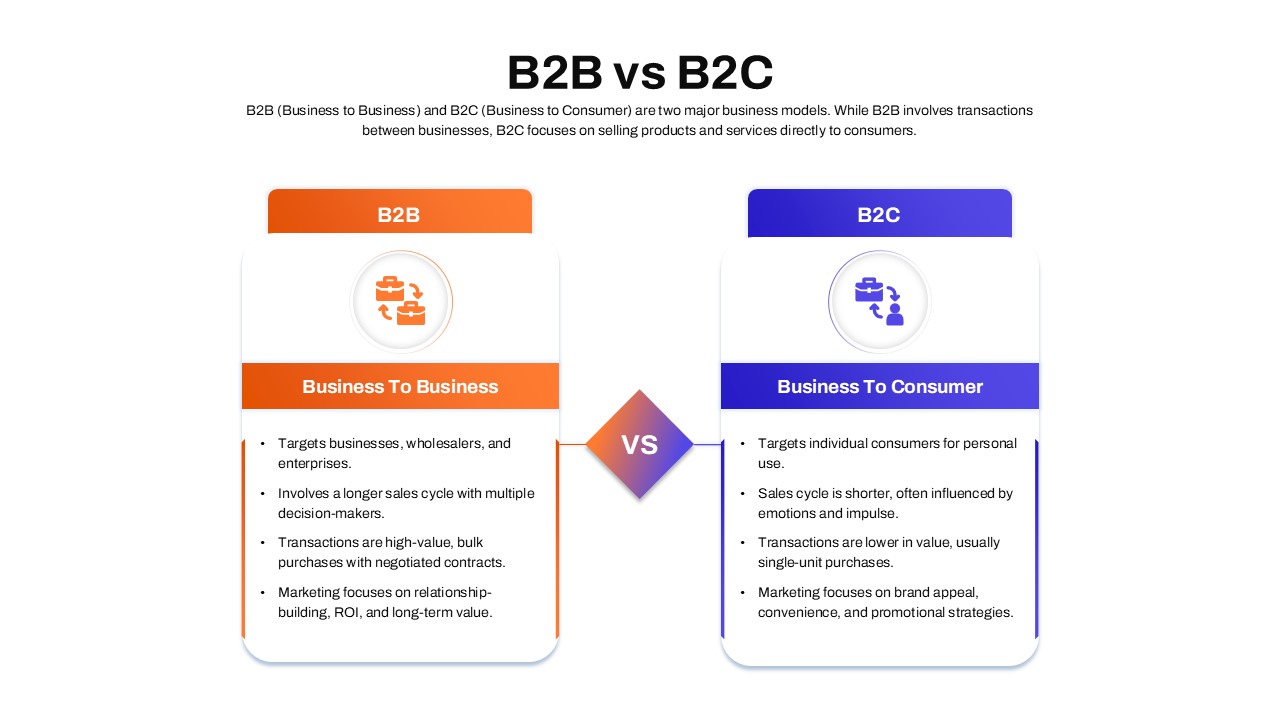
B2B vs B2C Comparison template for PowerPoint & Google Slides
Business Models
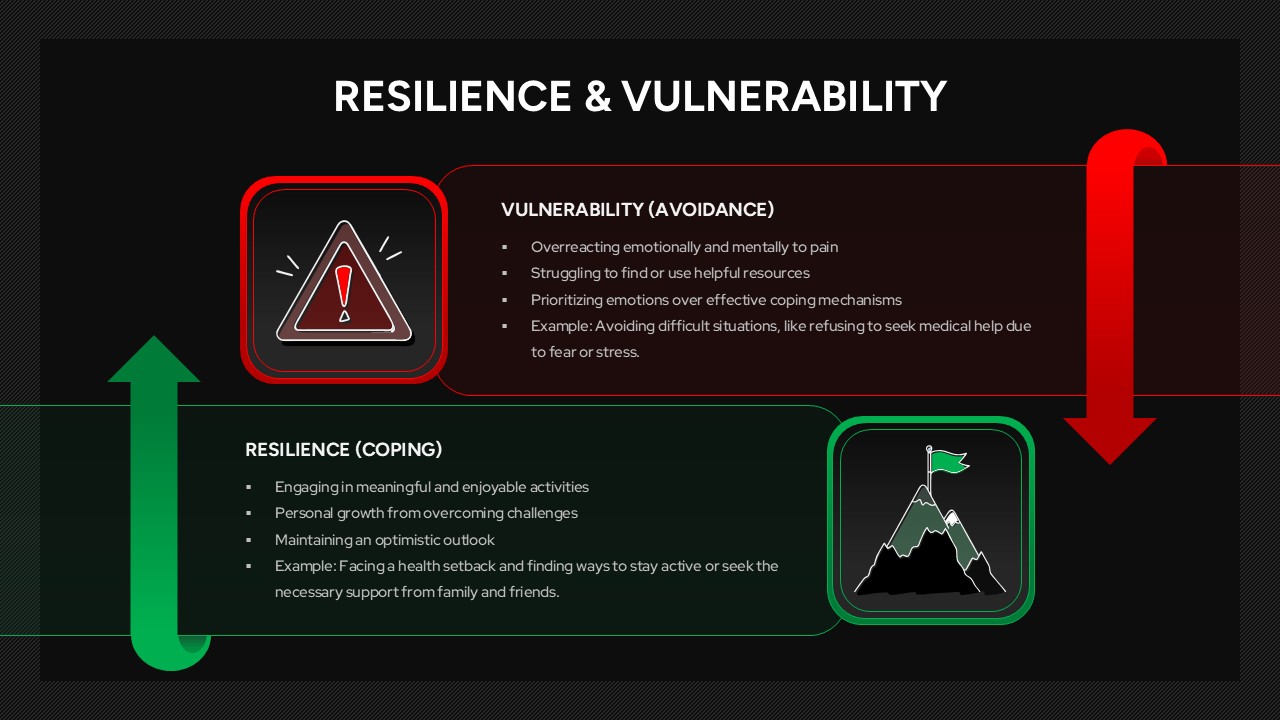
Resilience & Vulnerability Comparison Template for PowerPoint & Google Slides
Comparison
Skills Gap Analysis Comparison Chart Template for PowerPoint & Google Slides
Gap
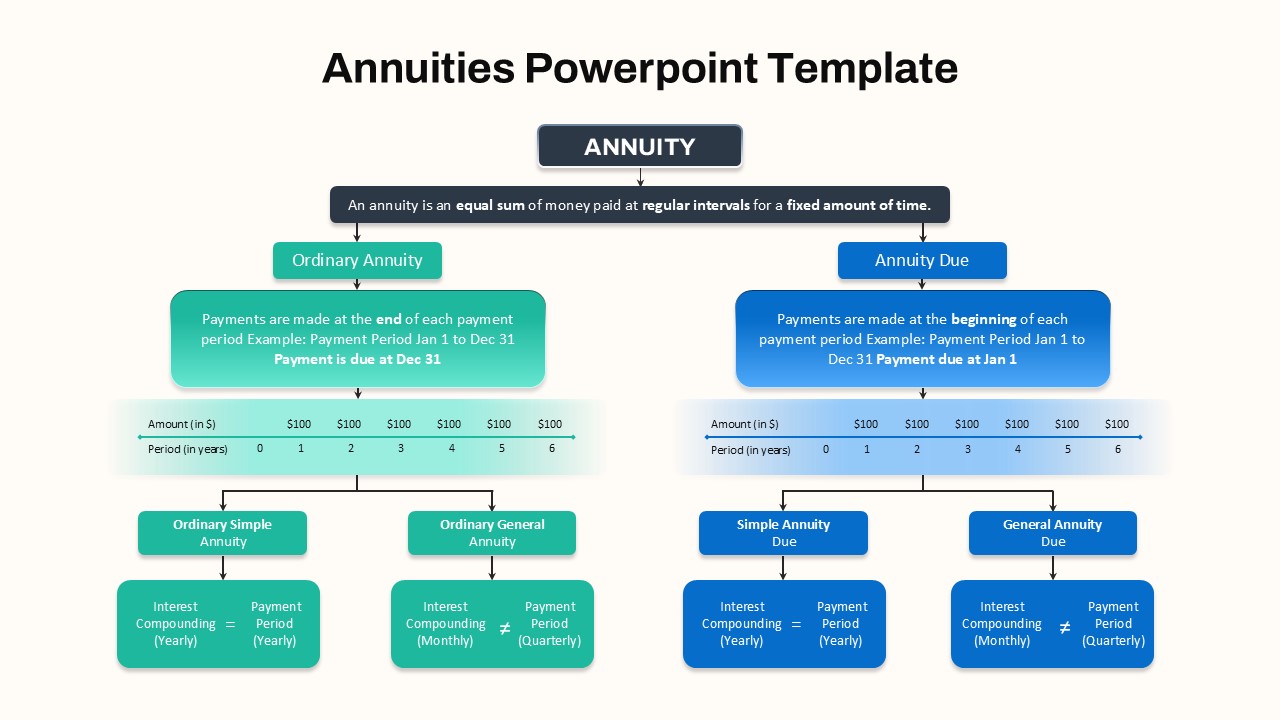
Hierarchical Annuity Comparison Flowchart Template for PowerPoint & Google Slides
Business Report
Feasibility Matrix Comparison Chart Template for PowerPoint & Google Slides
Comparison Chart
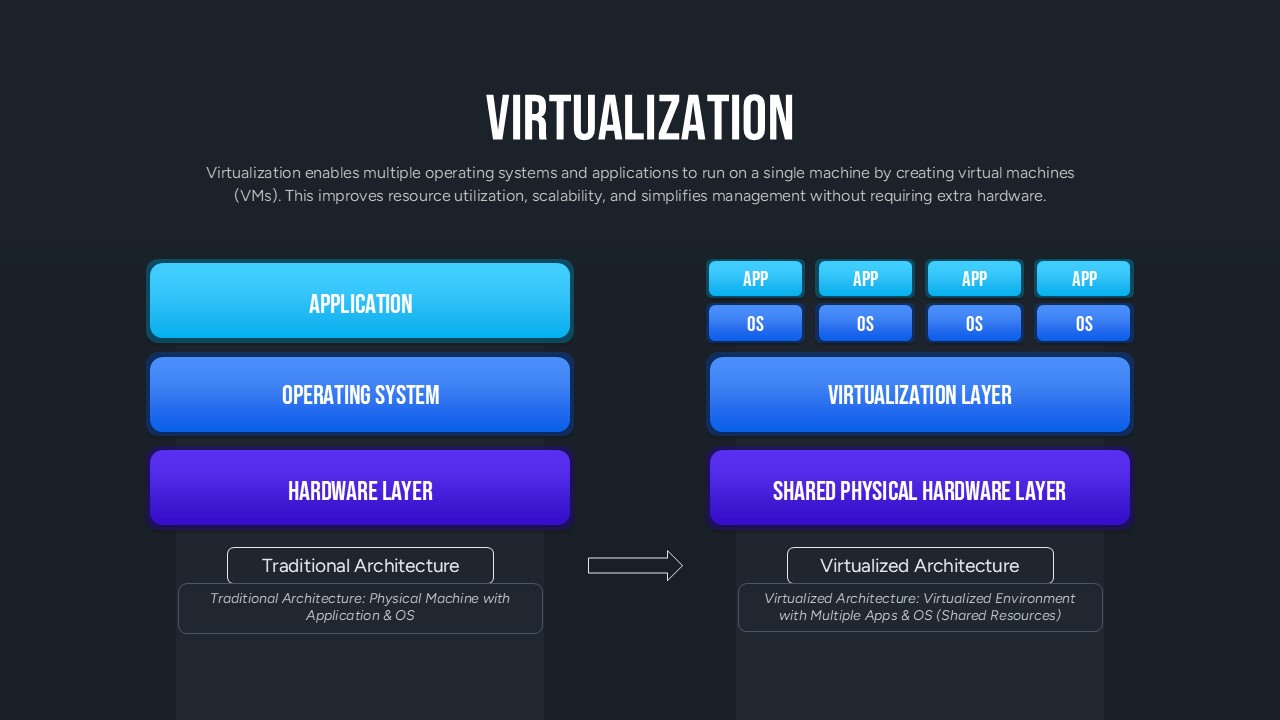
Virtualization Architecture Comparison Template for PowerPoint & Google Slides
Comparison Chart
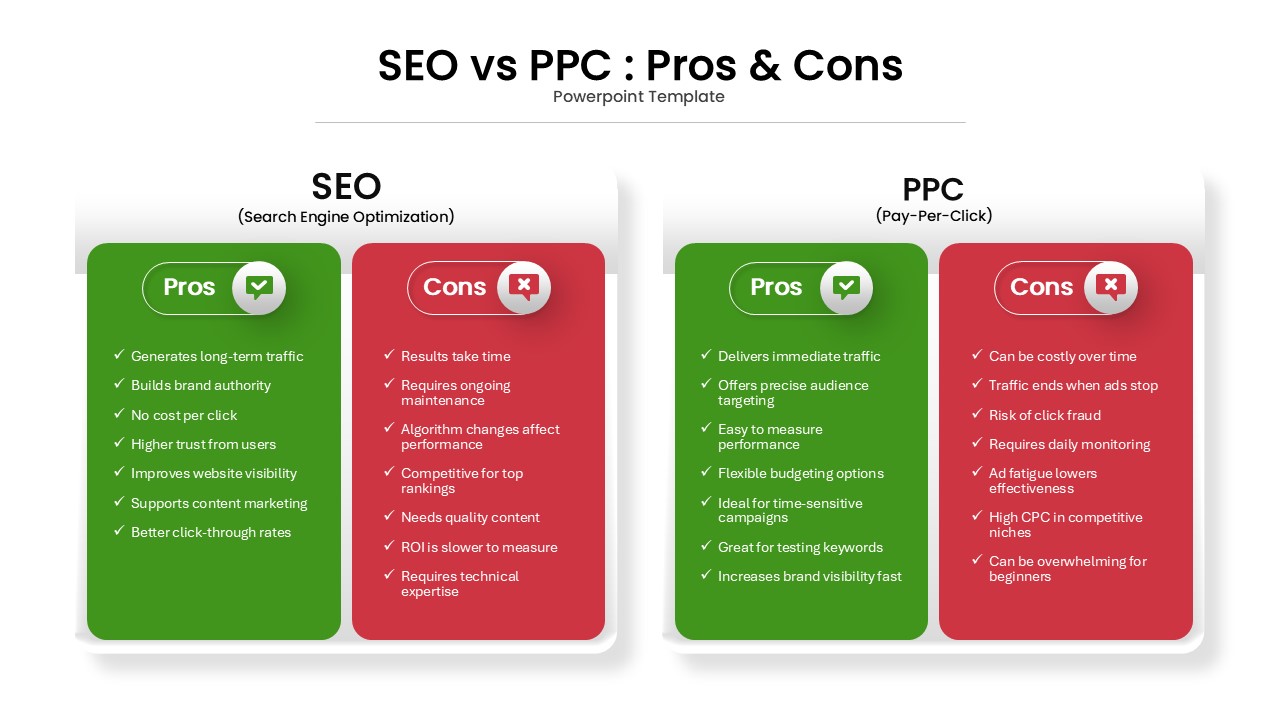
SEO vs PPC: Pros & Cons Comparison Template for PowerPoint & Google Slides
Comparison
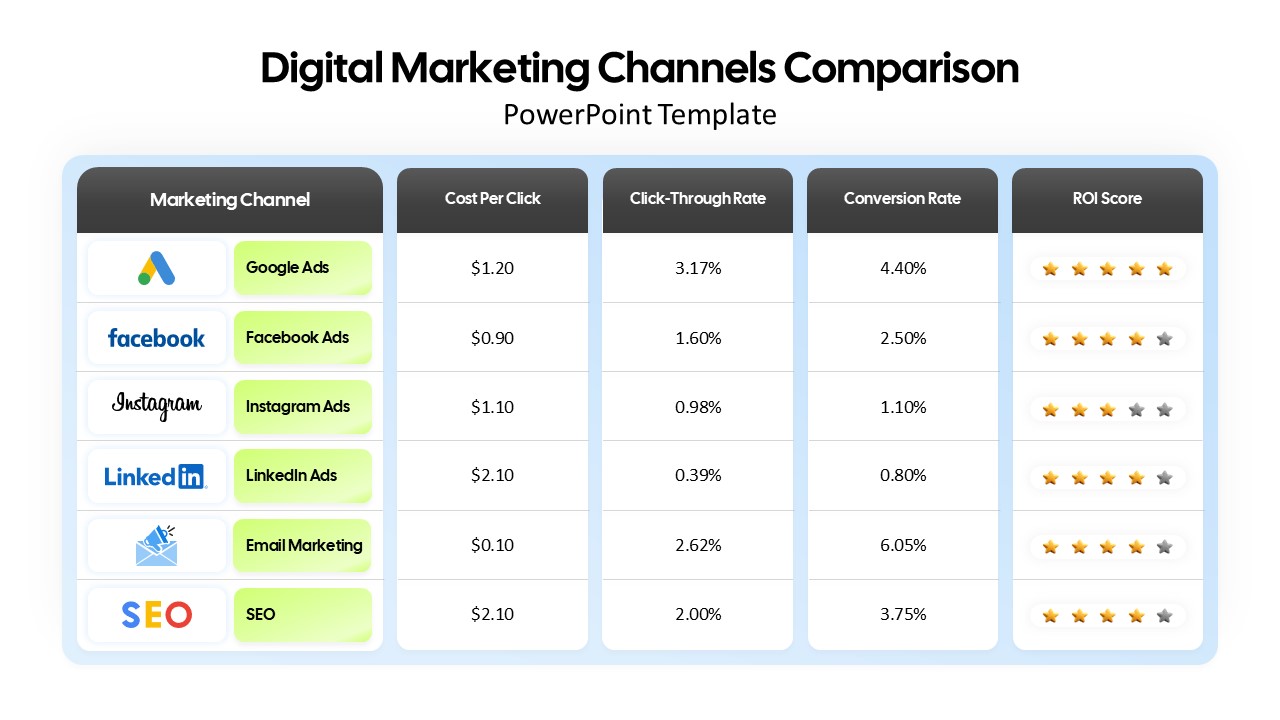
Digital Marketing Channels Comparison template for PowerPoint & Google Slides
Business
Colorful Business Data Comparison Table Template for PowerPoint & Google Slides
Table
Pros and Cons Comparison Table Template for PowerPoint & Google Slides
Comparison Chart
Customer Persona Comparison Profile Template for PowerPoint & Google Slides
Business
Year-over-Year Performance Comparison Template for PowerPoint & Google Slides
Comparison Chart