Interactive Taiwan Map Highlight Template for PowerPoint & Google Slides

Description
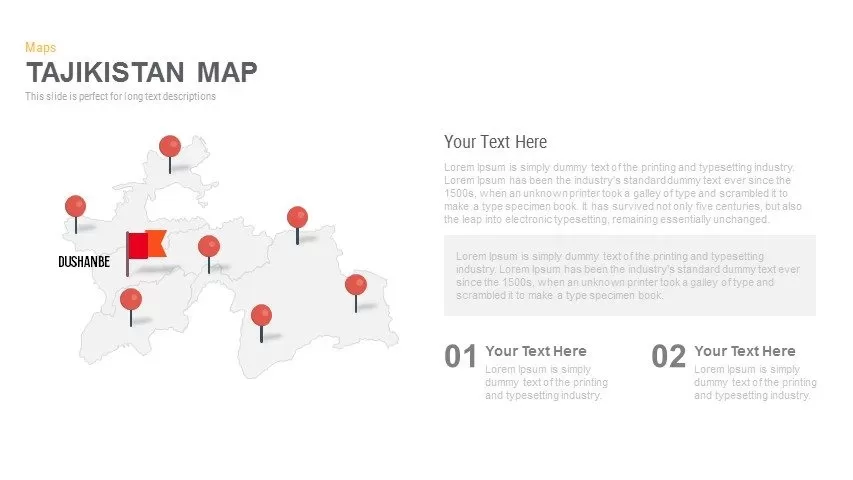
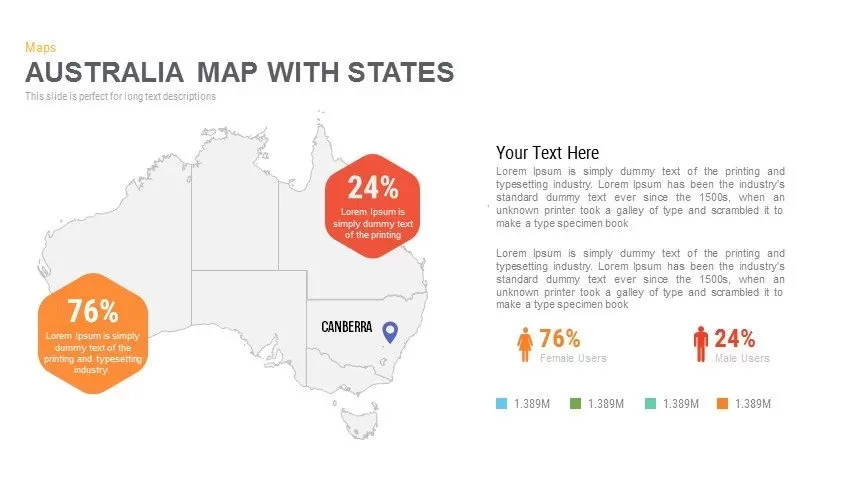
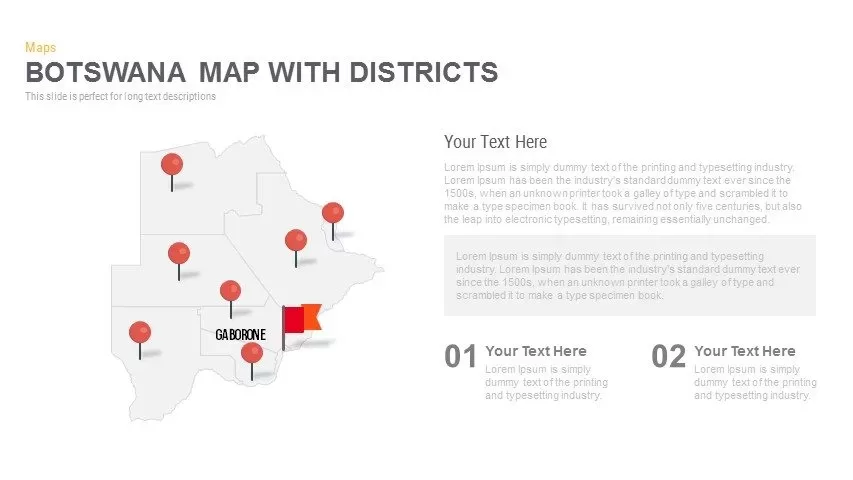
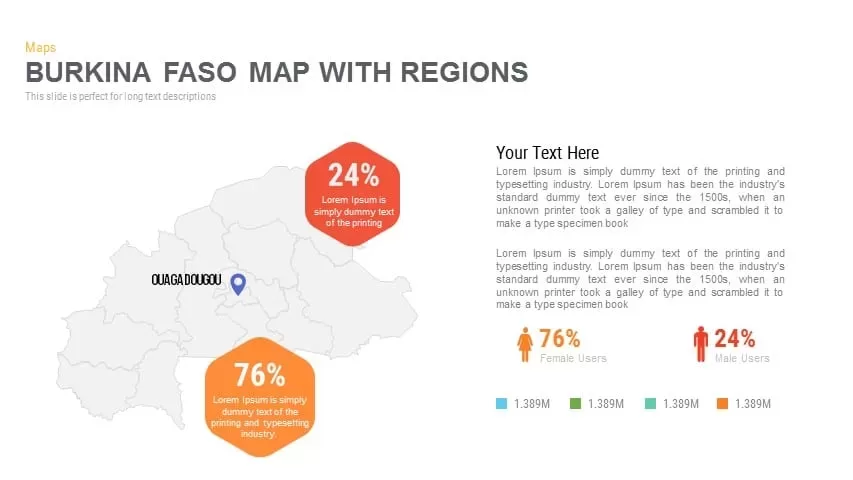
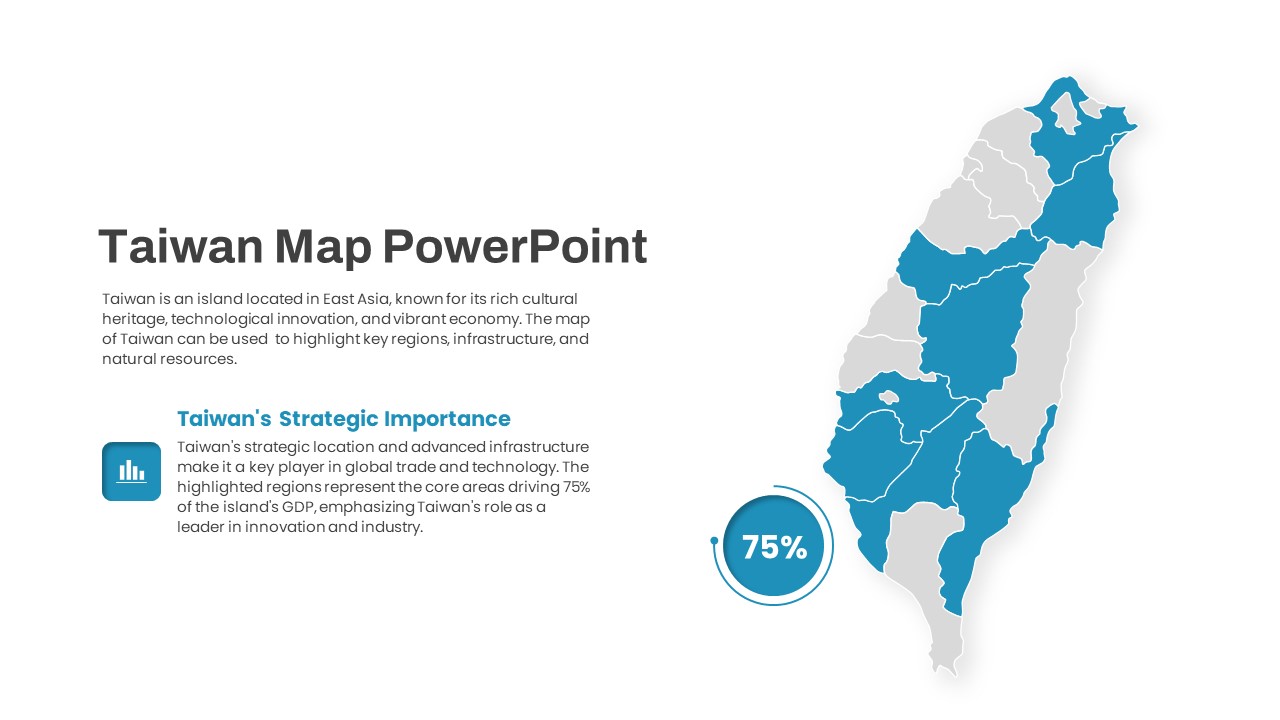
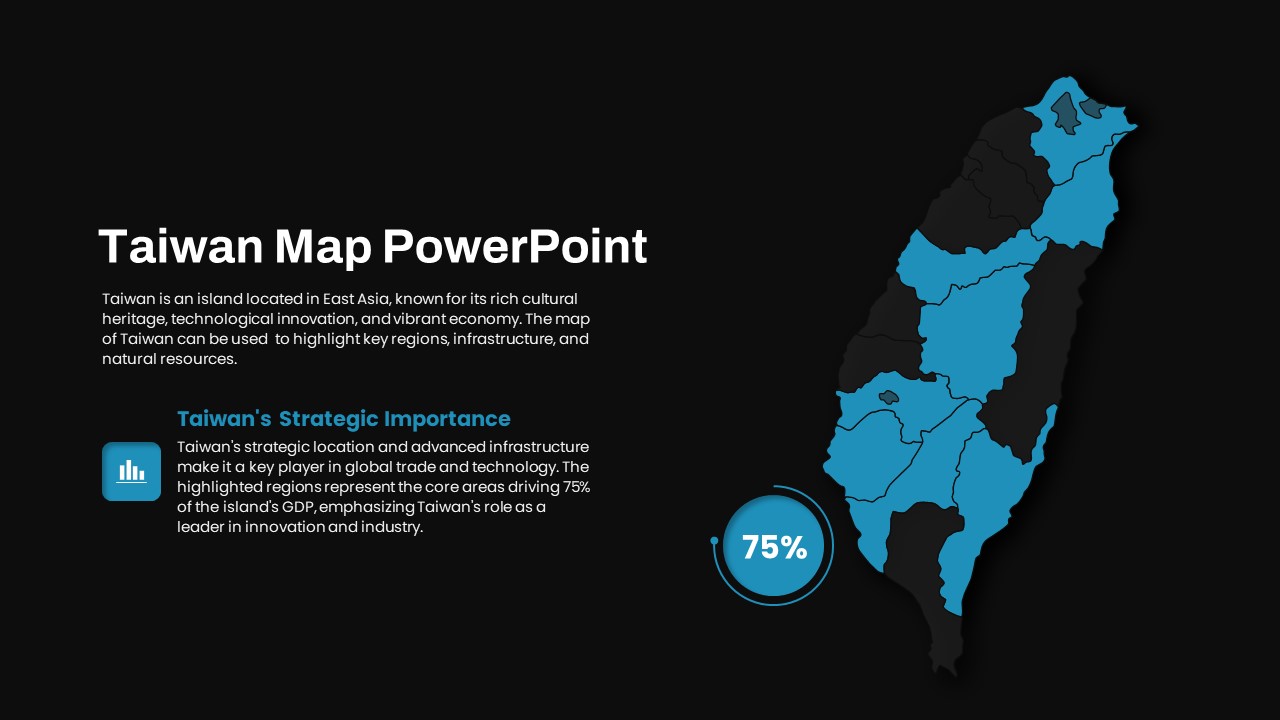
Present detailed regional analysis of Taiwan with this fully editable map slide, designed to highlight core provinces and districts in contrasting blue against neutral gray backdrops. The slide features a clean outline of Taiwan with individual regions separated by fine white borders, allowing you to emphasize key areas driving economic output, technology hubs, natural resources, or demographic concentrations. A prominent circular percentage infographic visually communicates critical metrics—such as 75% of GDP contribution—with customizable icon placeholders for quick data association. Accompanying text boxes provide ample space for slide titles, subtitles, and strategic context on the left, ensuring a balanced layout that guides audience focus.
This modern flat design leverages vector-based shapes, crisp sans-serif fonts, and subtle geographic grid lines to maintain visual clarity and professional polish across devices. Master slide compatibility enables rapid customization: adjust color palettes to match corporate branding, replace icons or percentage values, add or remove regional highlights, and update labels in seconds without breaking alignment. Grid-based guides and automatic snap-to-grid positioning ensure perfect spacing when duplicating the slide or resizing individual elements. Interactive animation presets let you sequentially reveal highlighted regions or statistics, creating dynamic storytelling opportunities during live presentations.
Optimized for both PowerPoint and Google Slides, the template preserves fidelity across platforms and screen sizes, while high-resolution exports guarantee sharp print and digital assets. Optional legend placeholders, callout arrows, and adjustable map scales offer deeper customization for academic research, infrastructure planning, supply chain mapping, or market segmentation analyses. Whether you are presenting geographic insights to executive boards, training regional sales teams, or illustrating project deployment zones, this Taiwan map slide streamlines your workflow and elevates your strategic narratives with impactful design and intuitive editing controls.
Who is it for
Educators, regional planners, marketing strategists, supply chain managers, and C-level executives who require precise geographic visuals to communicate economic hotspots, infrastructure networks, market territories, or research findings with clarity and professional design.
Other Uses
Aside from economic analysis, repurpose this slide for tourism development proposals, demographic studies, disaster response planning, retail site selection, environmental assessments, or international trade briefings where geographic emphasis informs decision-making.
Login to download this file

Item ID
SB04504
Related Templates

Highlight Business Section for PowerPoint & Google Slides
Process
Interactive US Population Data Map Slide Template for PowerPoint & Google Slides
World Maps
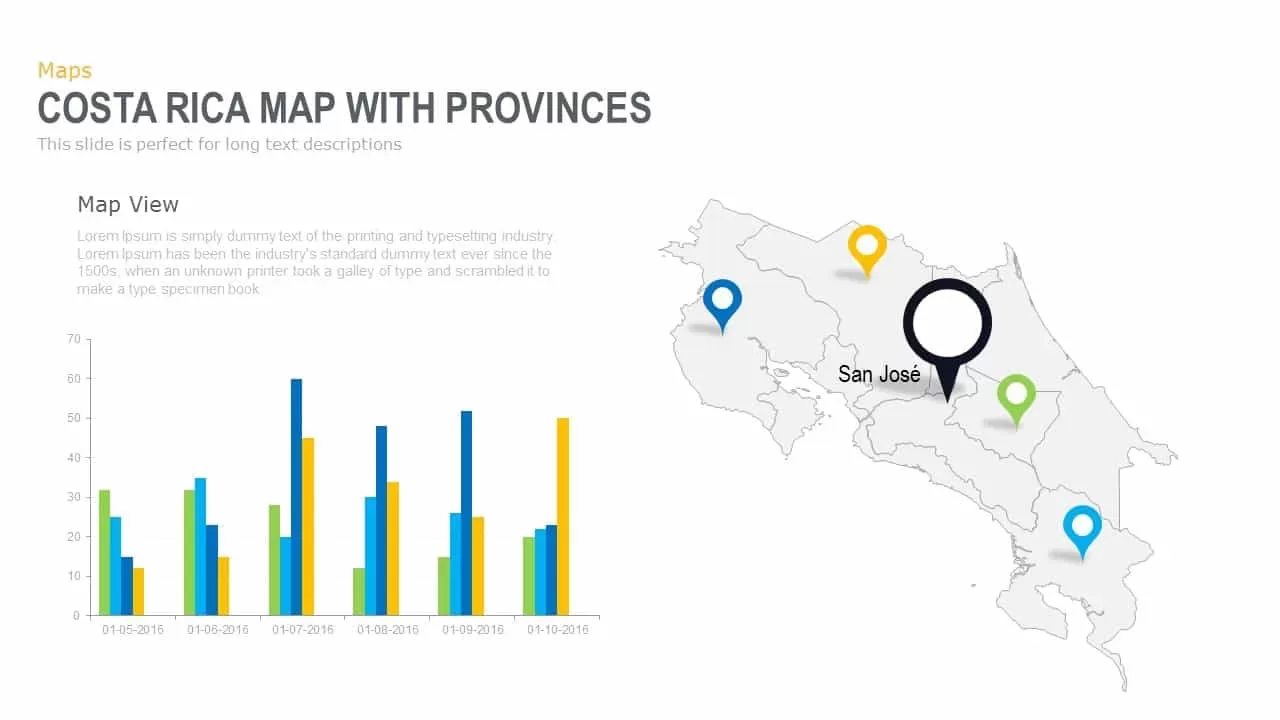
Interactive Costa Rica Province Map Template for PowerPoint & Google Slides
World Maps

Interactive Empathy Map Diagram Template for PowerPoint & Google Slides
Process
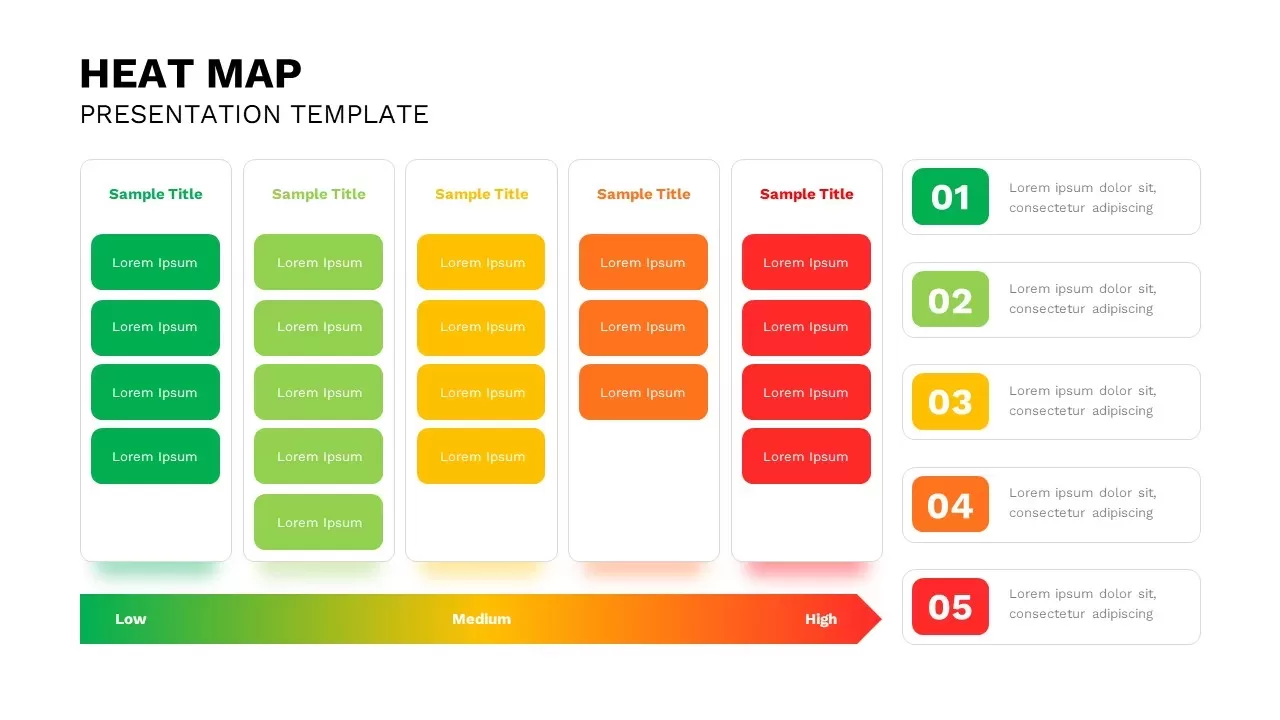
Professional Interactive Heat Map Matrix Template for PowerPoint & Google Slides
Comparison Chart
Interactive Heat Map Template for PowerPoint & Google Slides
Bar/Column
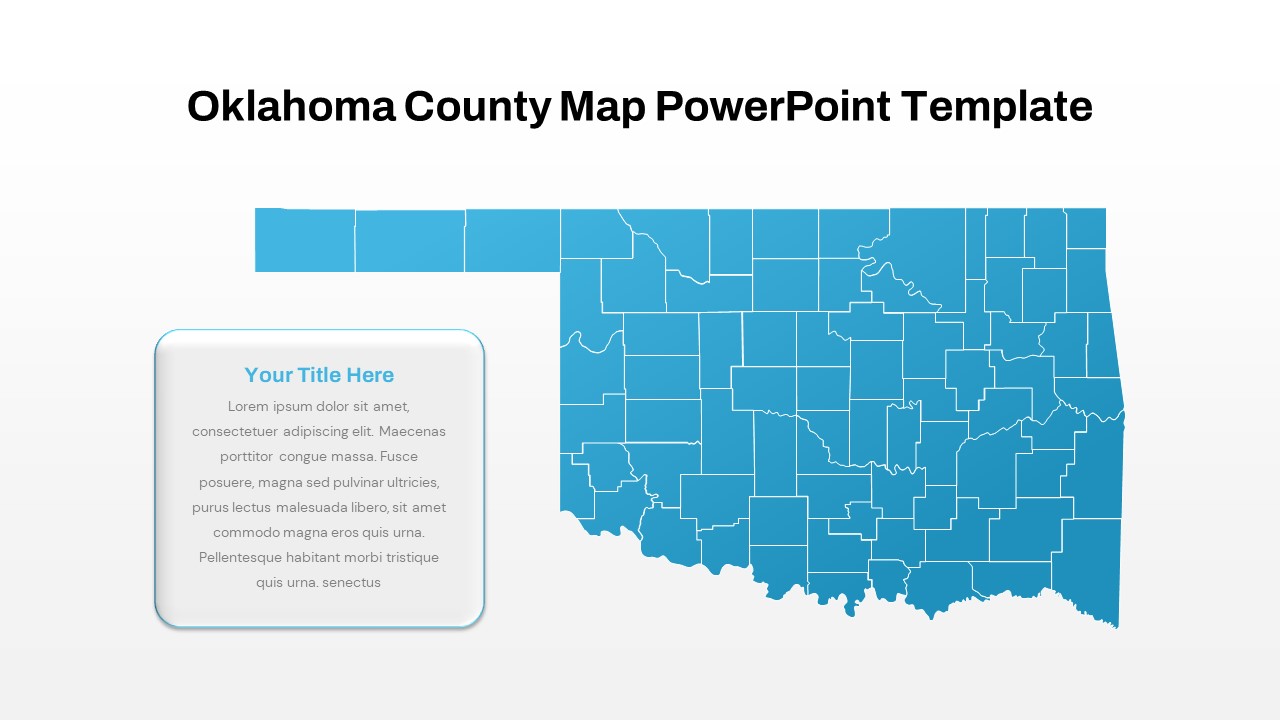
Interactive Oklahoma County Map Template for PowerPoint & Google Slides
World Maps

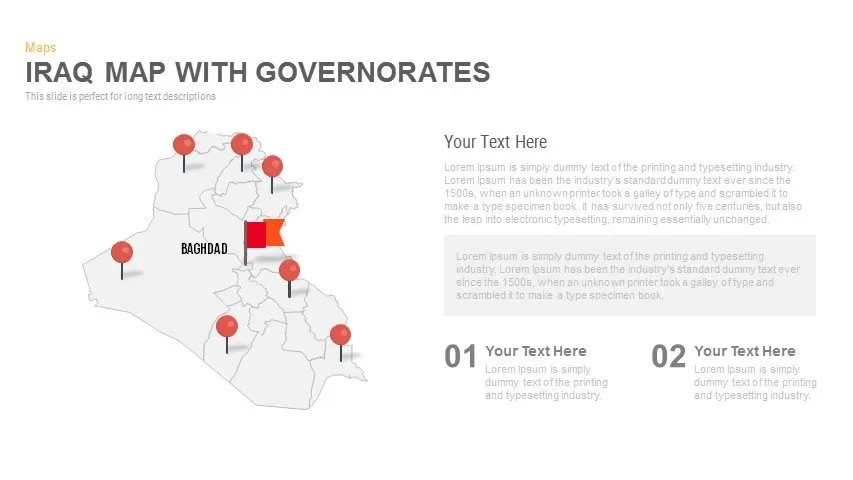
Interactive Iraq Map with Governorates Slide Pack for PowerPoint & Google Slides
World Maps
Interactive Products Tree Diagram template for PowerPoint & Google Slides
Org Chart
Interactive Connected Network Diagram Template for PowerPoint & Google Slides
Process
Interactive Product Comparison Bar Chart Template for PowerPoint & Google Slides
Bar/Column
Interactive Pricing Plan Comparison Template for PowerPoint & Google Slides
Comparison

Interactive Gap Analysis Puzzle Diagram Template for PowerPoint & Google Slides
Gap

Interactive RACI Responsibility Matrix Template for PowerPoint & Google Slides
Project
Interactive 3D Puzzle SWOT Analysis Slide Template for PowerPoint & Google Slides
SWOT
Interactive OKR Strategy Diagram Template for PowerPoint & Google Slides
Process
Free Interactive Online Course Presentation Template for PowerPoint & Google Slides
Pitch Deck
Free
Interactive Project Gantt Chart Timeline Template for PowerPoint & Google Slides
Gantt Chart
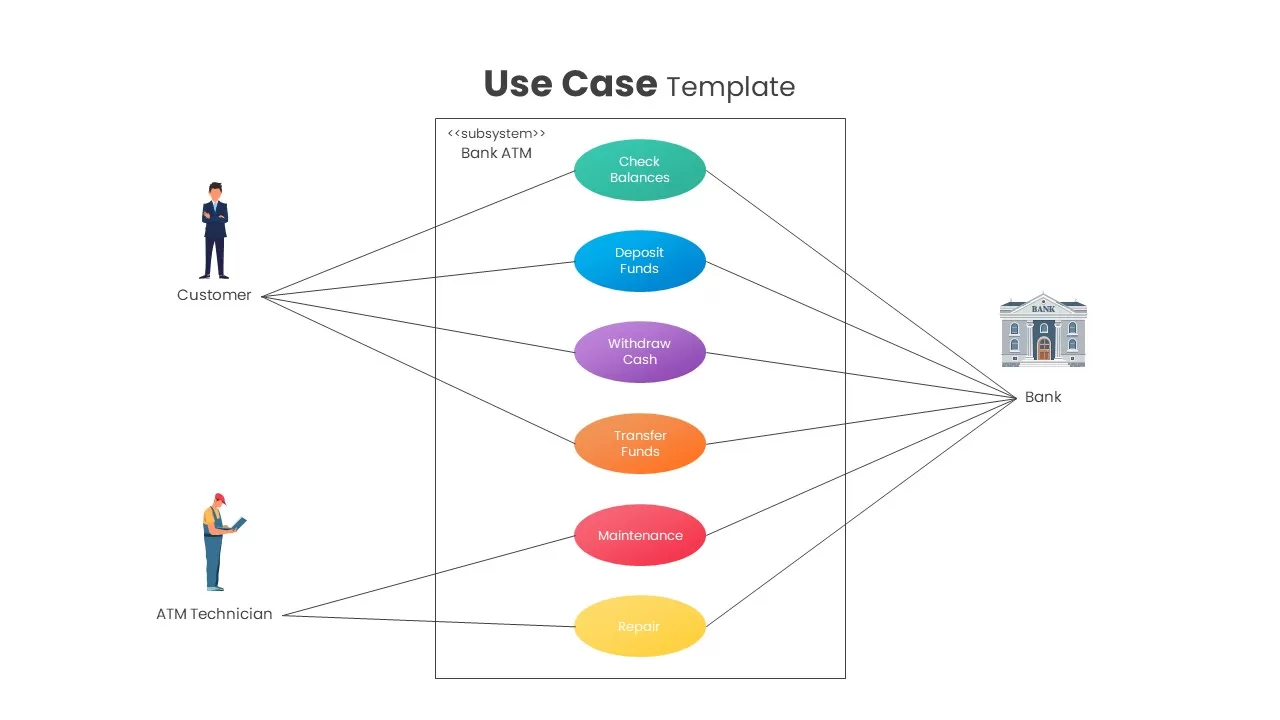
Interactive Bank ATM Use Case Diagram Template for PowerPoint & Google Slides
Software Development
Interactive Benchmarking Gauge Dashboard Template for PowerPoint & Google Slides
Pie/Donut
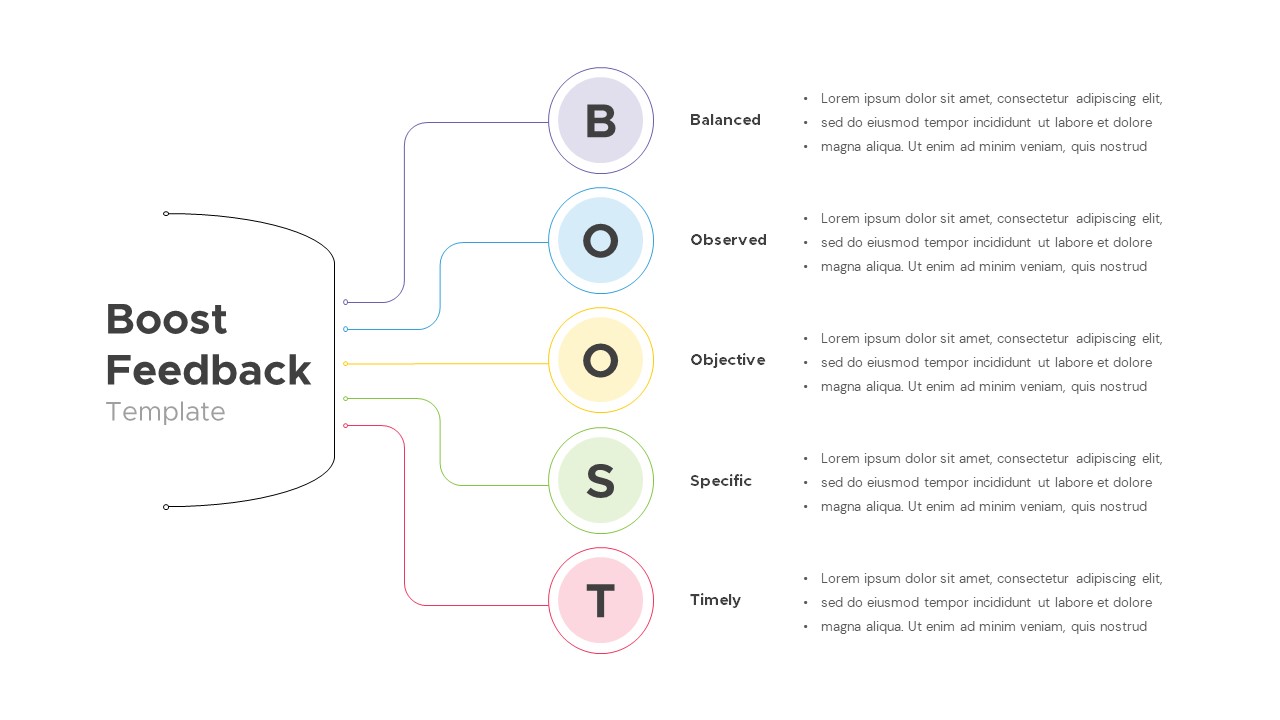
Interactive Boost Feedback Model Diagram Template for PowerPoint & Google Slides
Process

Free Interactive Trivia Presentation Template for PowerPoint & Google Slides
Graphics
Free
Free Interactive Two Truths and a Lie Game Template for PowerPoint & Google Slides
Decks
Free
Free Spin the Wheel Interactive Game Template for PowerPoint & Google Slides
Decks
Free
Interactive Slide Zoom & Transition Template for PowerPoint & Google Slides
Decks
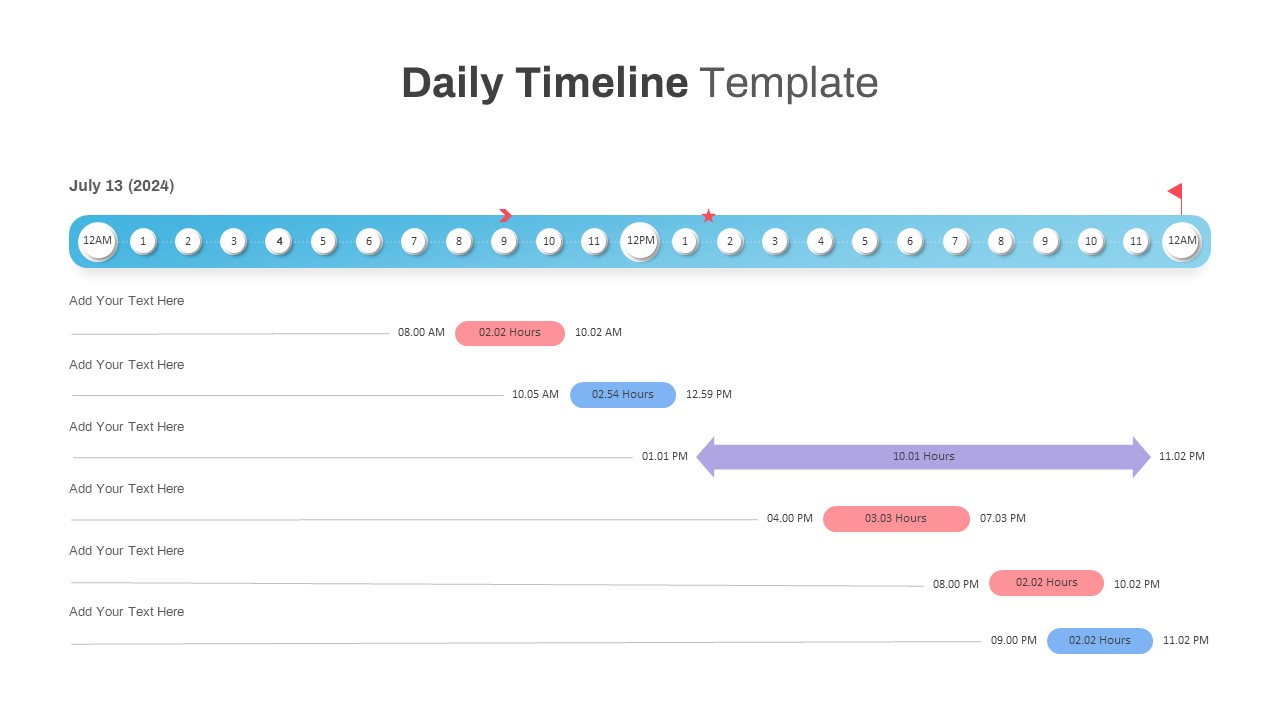
Interactive Daily Timeline Schedule Chart Template for PowerPoint & Google Slides
Timeline
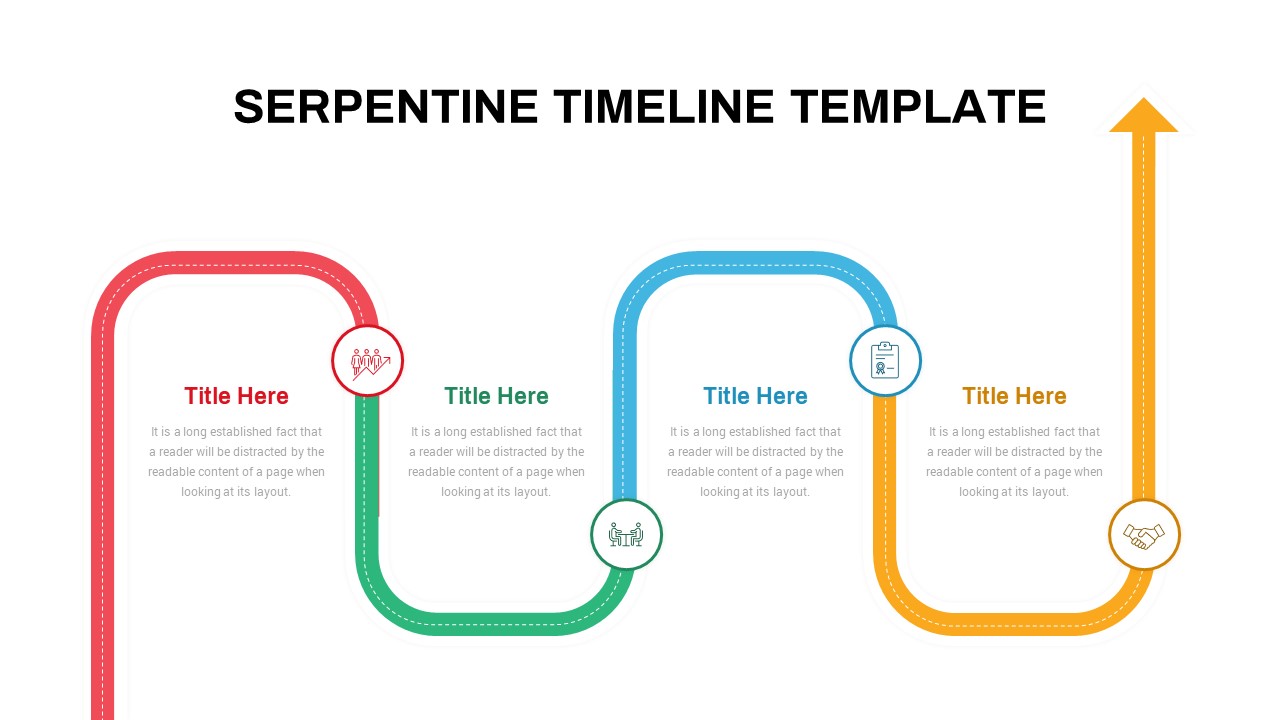
Interactive Serpentine Timeline Diagram Template for PowerPoint & Google Slides
Timeline
Interactive Milestone Timeline Template for PowerPoint & Google Slides
Timeline
Interactive Multi-Use Cost Comparison Template for PowerPoint & Google Slides
Comparison
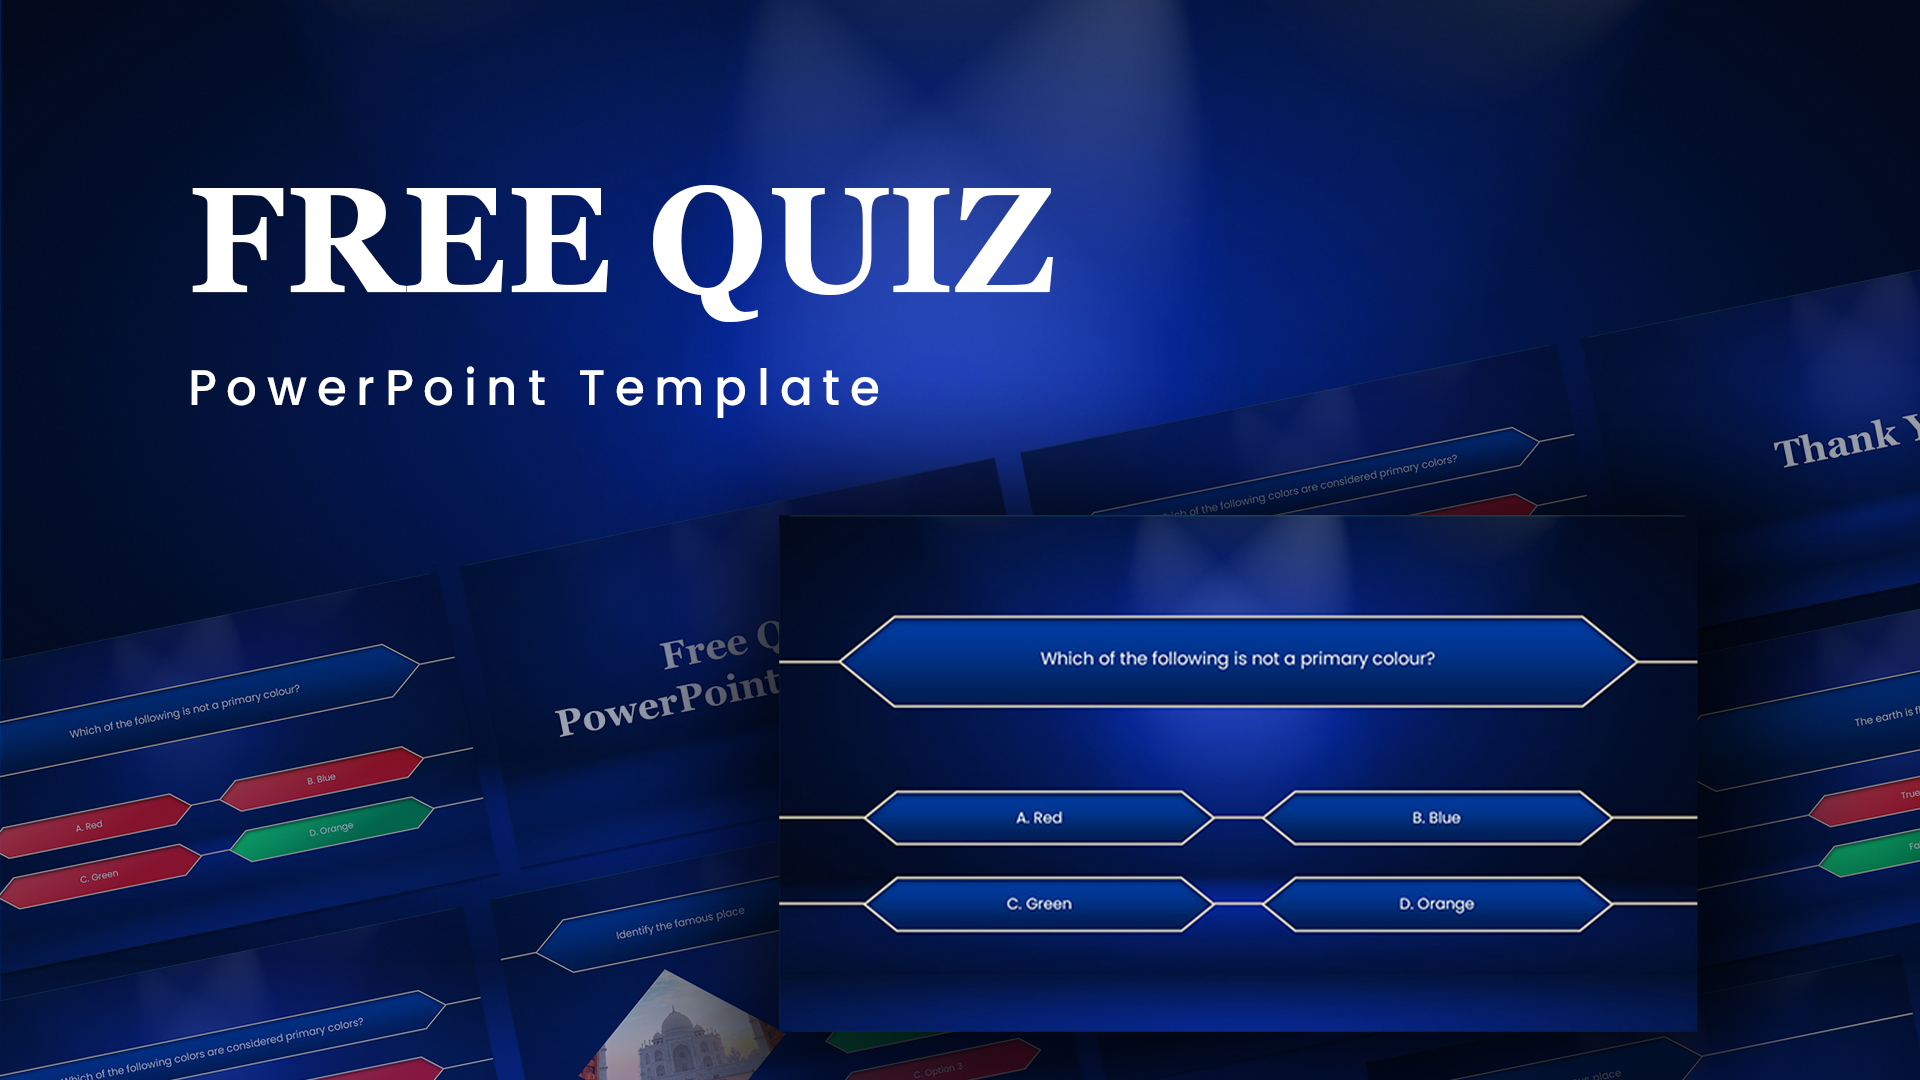
Free Animated Quiz Interactive Template for PowerPoint & Google Slides
Pitch Deck
Free
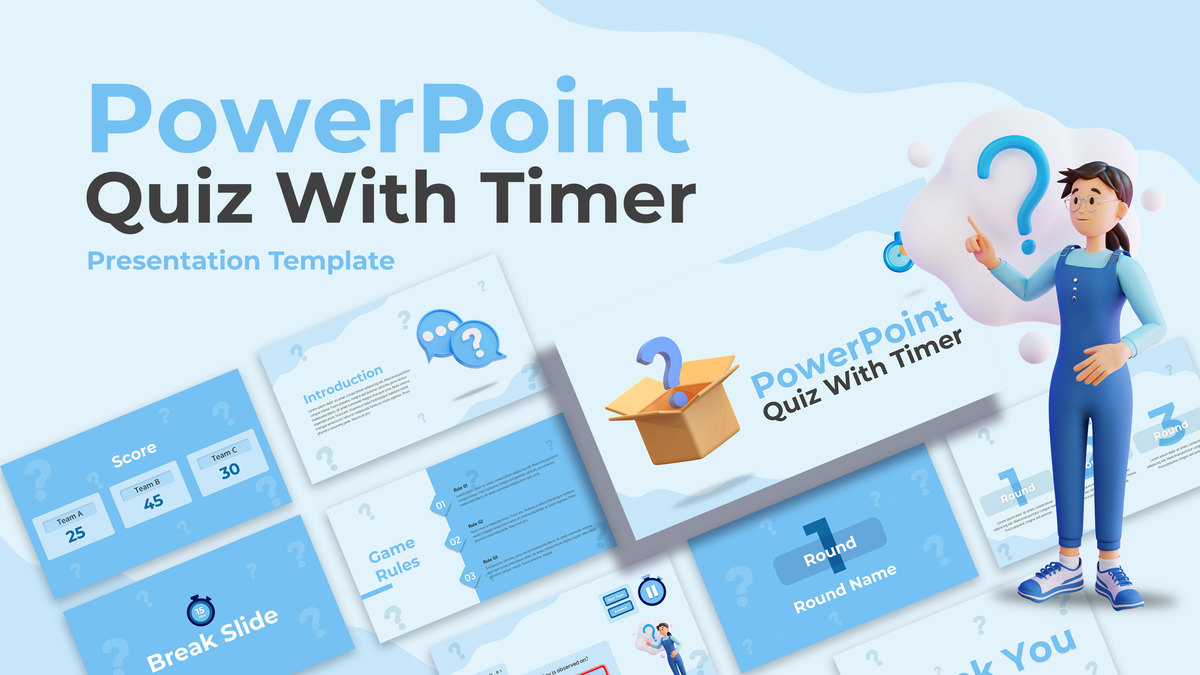
Interactive Quiz with Countdown Timer Template for PowerPoint & Google Slides
Pitch Deck
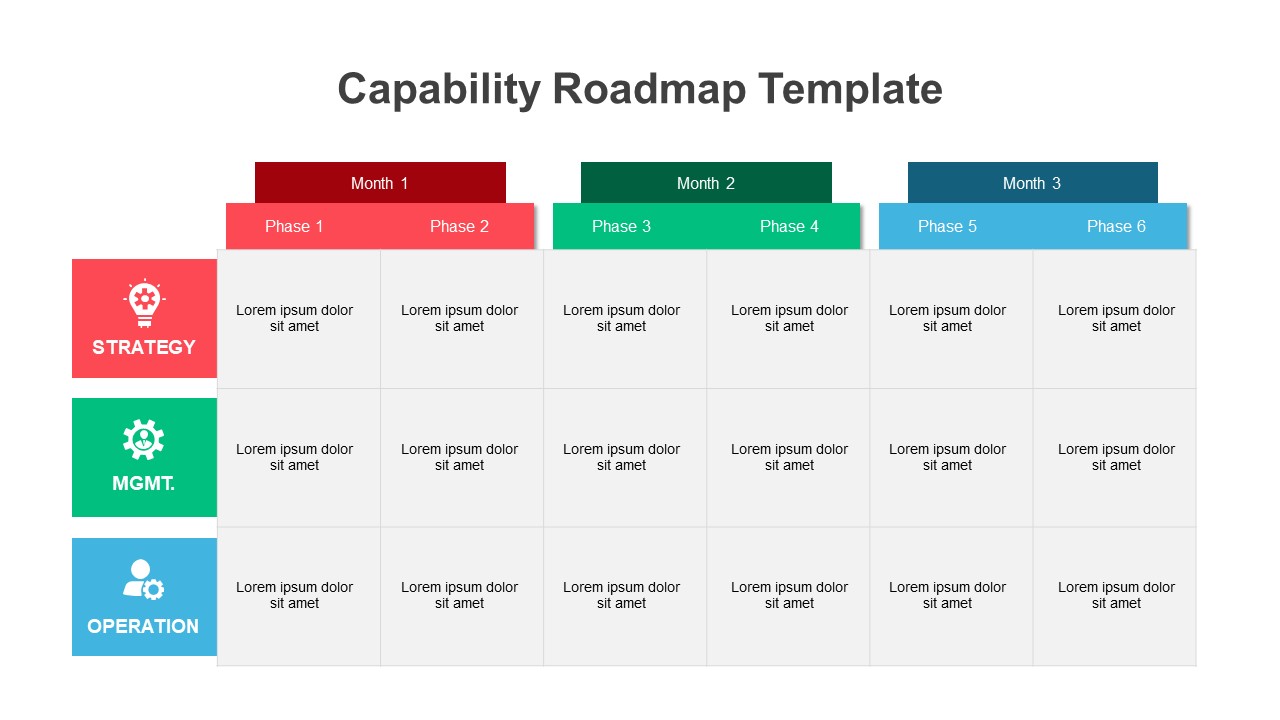
Interactive Strategic Capability Roadmap Template for PowerPoint & Google Slides
Roadmap
Interactive Jump Line Data Chart Template for PowerPoint & Google Slides
Comparison Chart
Interactive Quiz with Game Rules Template for PowerPoint & Google Slides
Graphics
Free
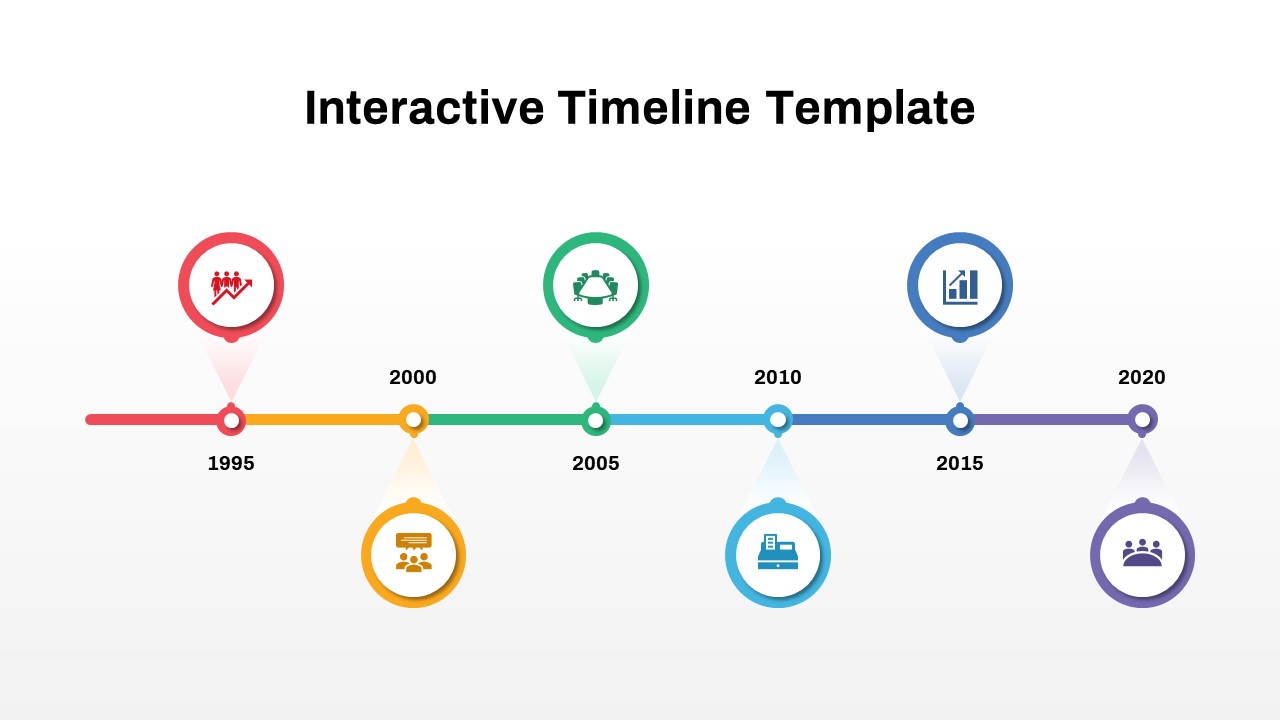
Interactive Innovation Timeline Roadmap Template for PowerPoint & Google Slides
Timeline
Free Interactive Flashcards Q&A Deck Template for PowerPoint & Google Slides
Free
Free
Free Interactive Notebook for PowerPoint & Google Slides
Business
Free
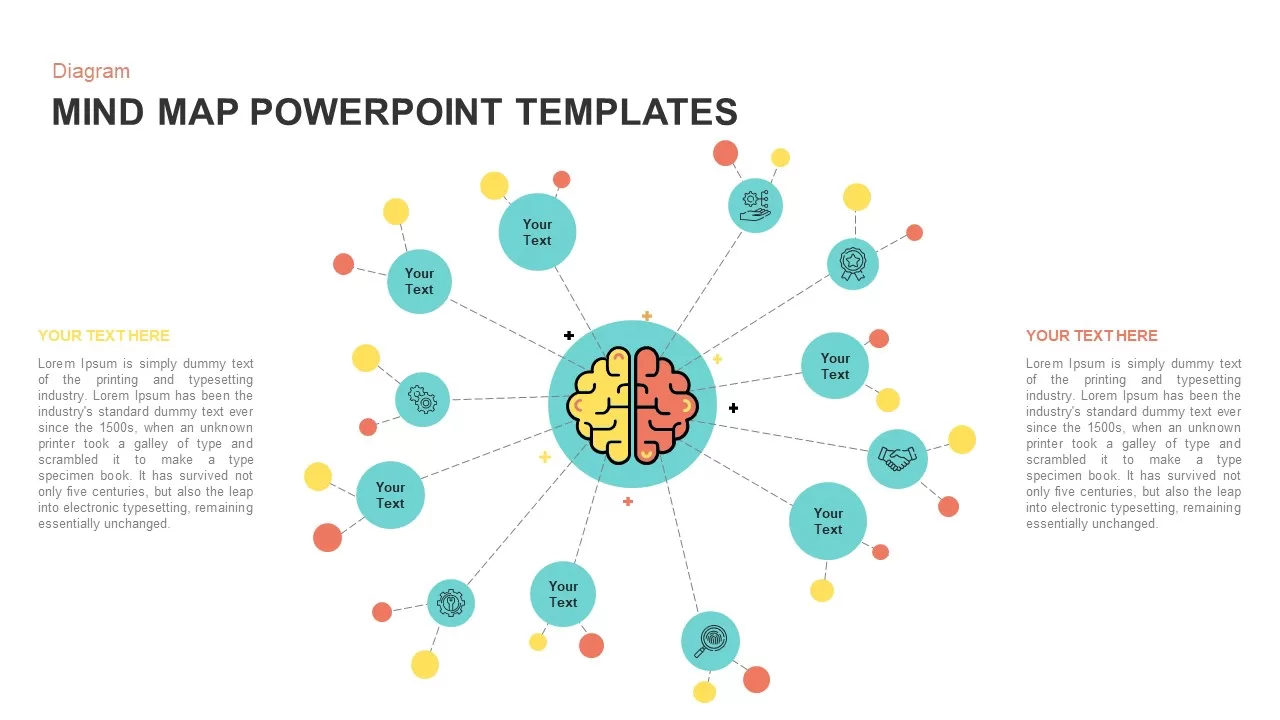
Mind Map PowerPoint template for PowerPoint & Google Slides
Mind Maps
Editable Colombia Map PowerPoint Template for PowerPoint & Google Slides
Business Models
Free Social Media Users Map template for PowerPoint & Google Slides
World Maps
Free
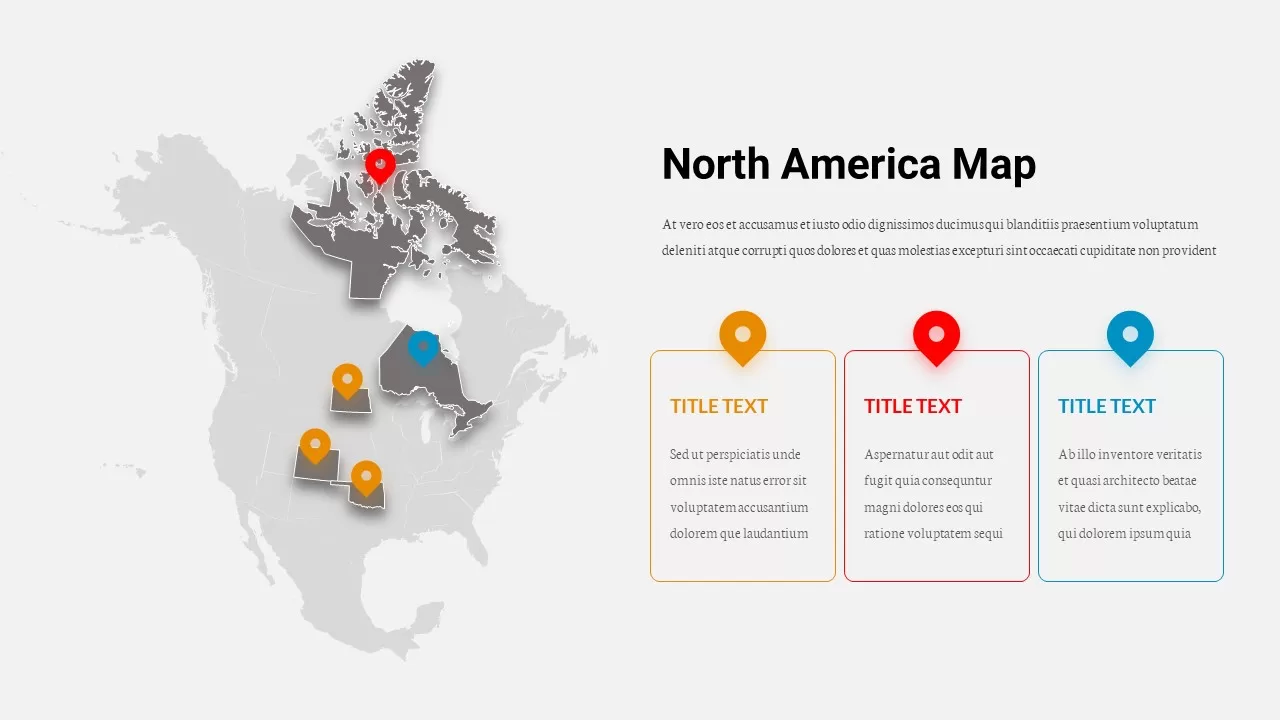
North America Map template for PowerPoint & Google Slides
World Maps
World Map Bubble template for PowerPoint & Google Slides
World Maps
Risk Management Mind Map Radial Diagram template for PowerPoint & Google Slides
Mind Maps
Colorful Creative Mind Map Diagram template for PowerPoint & Google Slides
Mind Maps
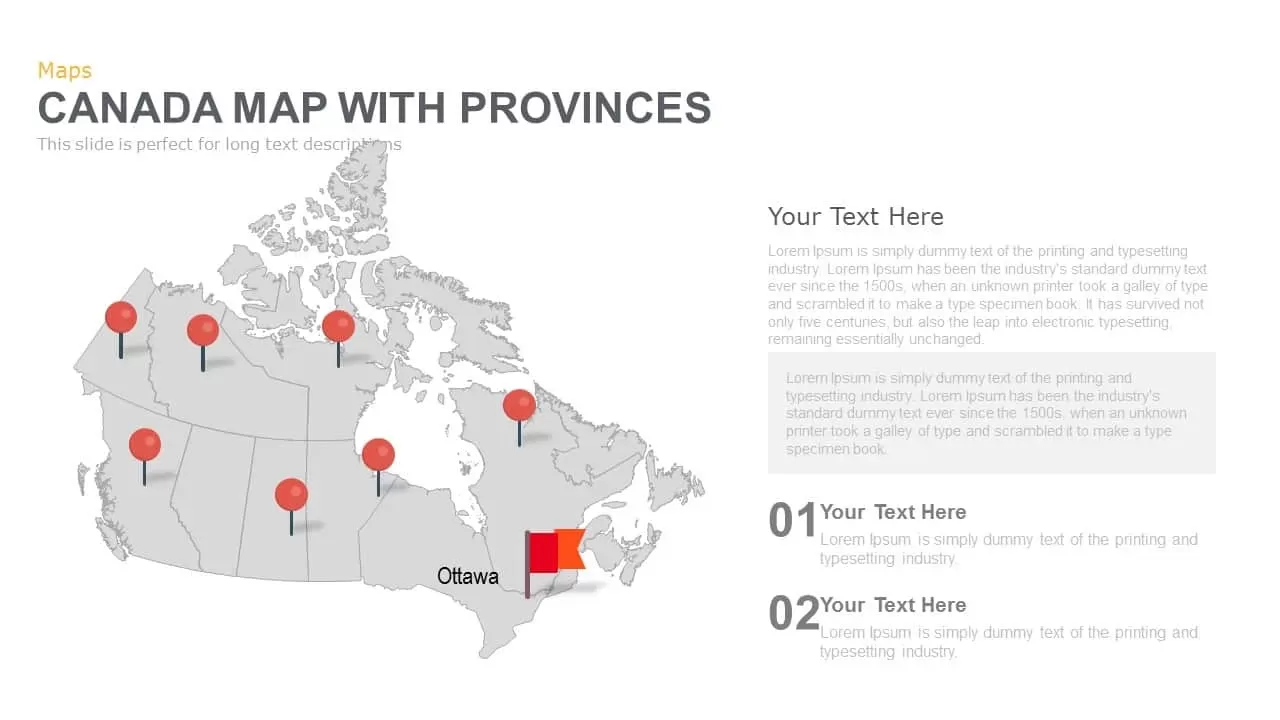
Canada Provinces Map Multi-Layout Template for PowerPoint & Google Slides
World Maps
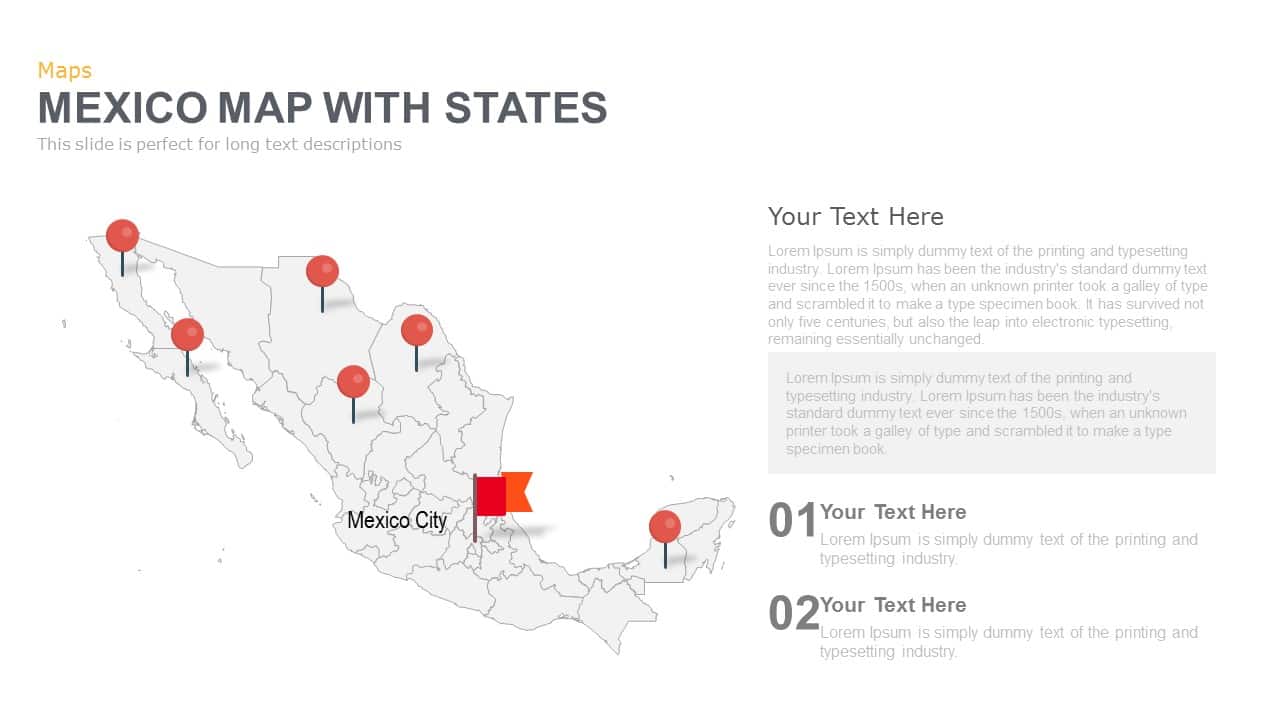
Mexico Map With States Template for PowerPoint & Google Slides
World Maps
Curved Road Map Timeline Infographic Template for PowerPoint & Google Slides
Roadmap
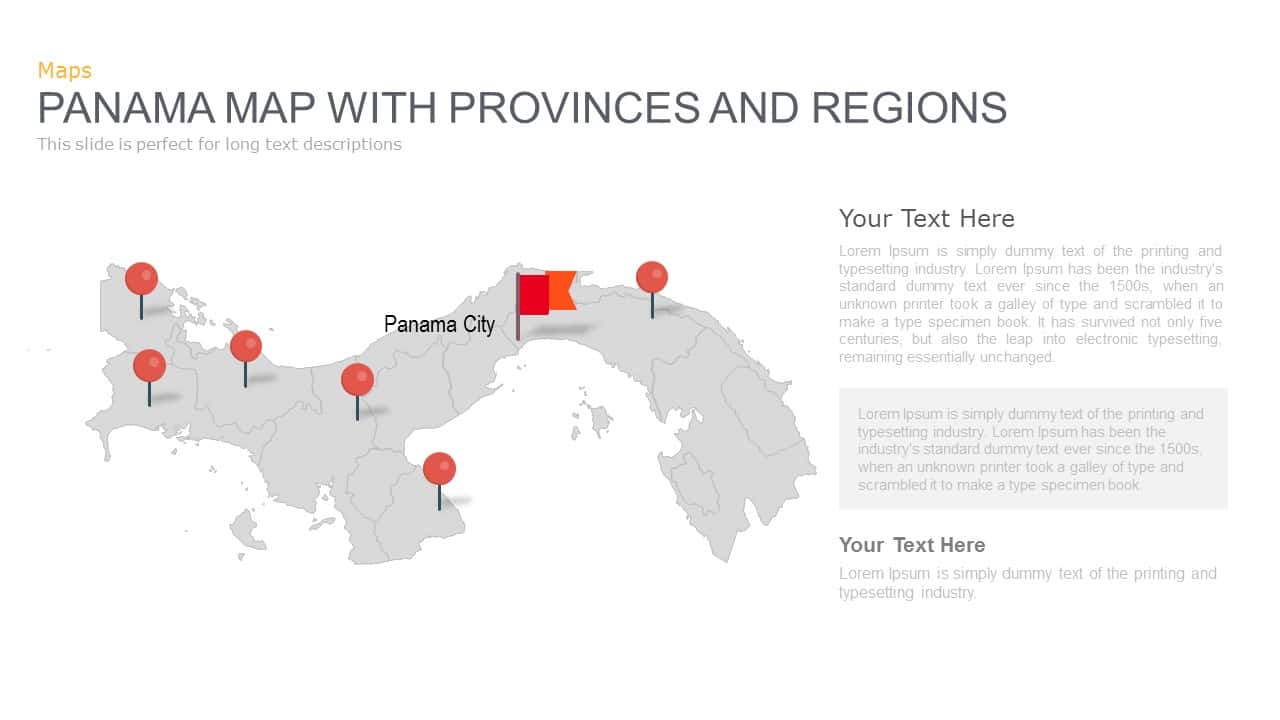
Panama Map with Region Markers Template for PowerPoint & Google Slides
World Maps
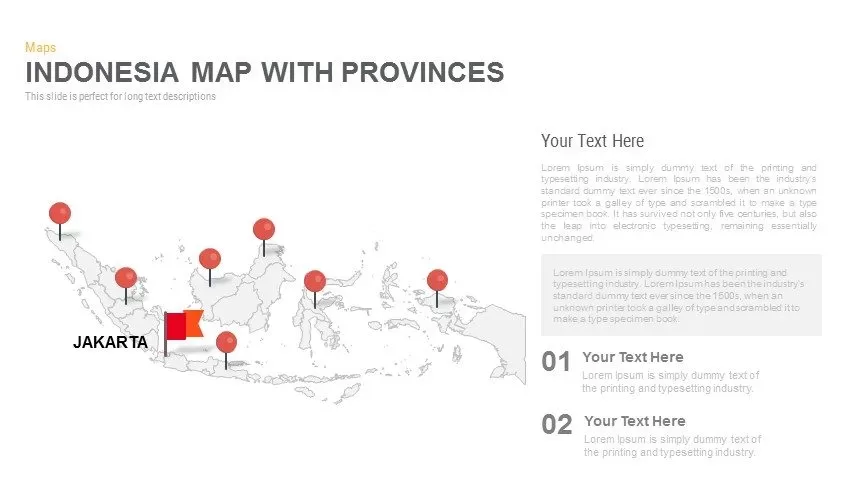
Indonesia Province Map Callout Slide Template for PowerPoint & Google Slides
Maps
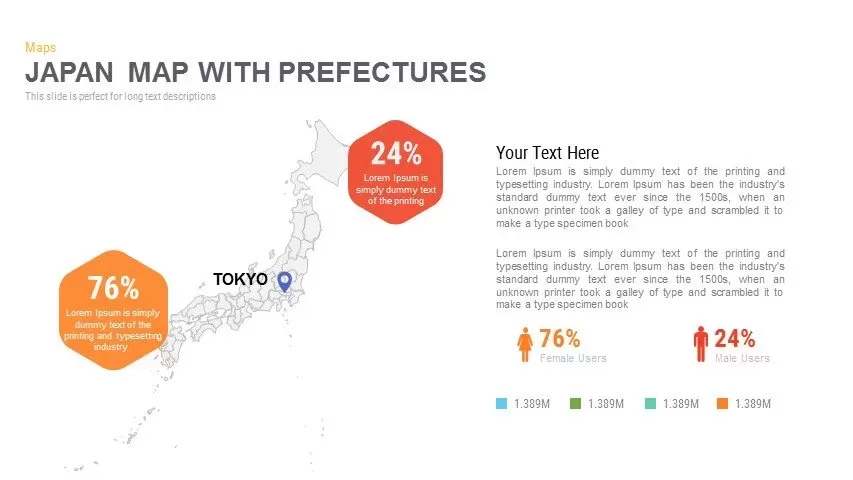
Japan Province Map Infographic Template for PowerPoint & Google Slides
Maps
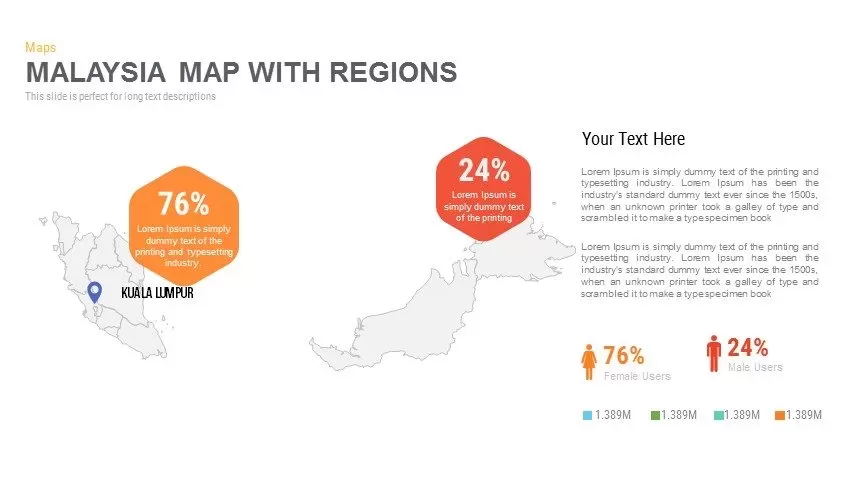
Malaysia Regional Map Infographic Template for PowerPoint & Google Slides
Maps
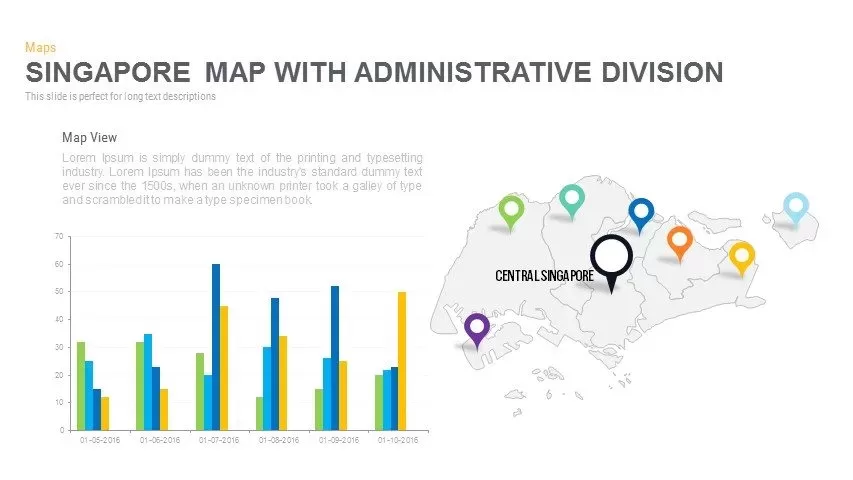
Singapore Map Pack Template for PowerPoint & Google Slides
Maps
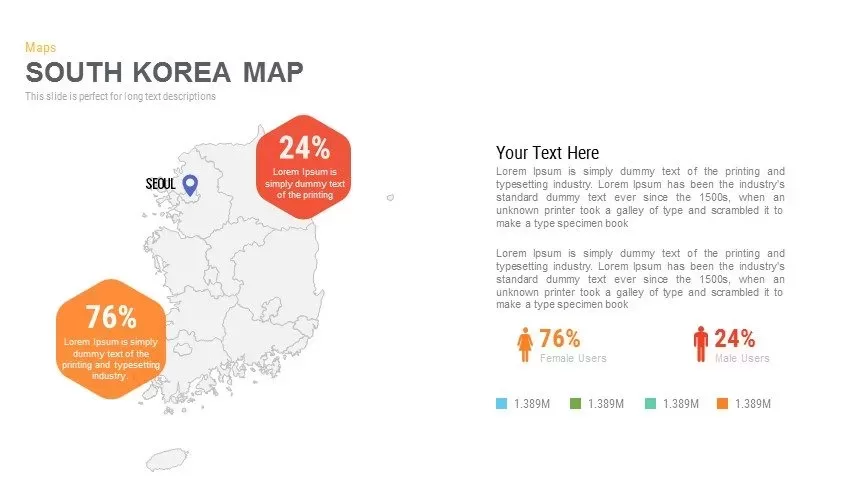
Infographic South Korea Map Template for PowerPoint & Google Slides
Maps
Sri Lanka Map Infographic Pack Template for PowerPoint & Google Slides
Maps
Editable Tajikistan Provinces Map Pack Template for PowerPoint & Google Slides
Maps
Australia Map with State Markers Template for PowerPoint & Google Slides
Maps
Angola Map with Provinces Slide Pack Template for PowerPoint & Google Slides
World Maps
Burkina Faso Map with Regions Slide Pack Template for PowerPoint & Google Slides
World Maps
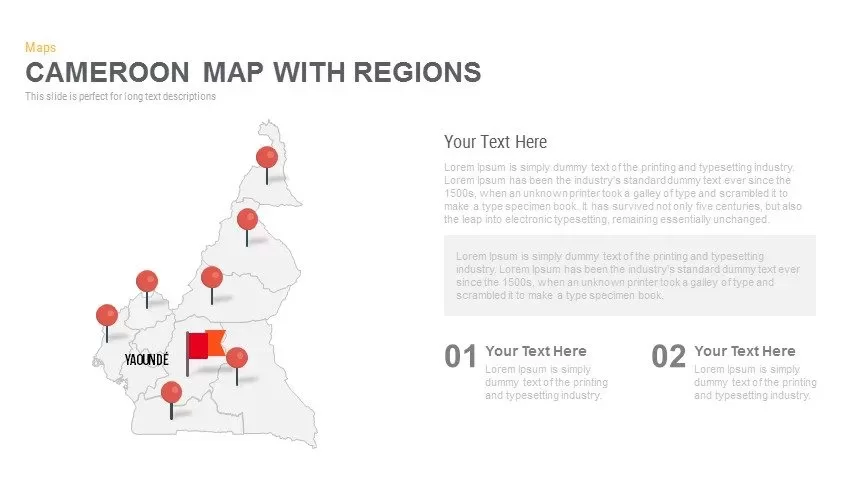
Cameroon Map with Regions Slide Pack Template for PowerPoint & Google Slides
World Maps
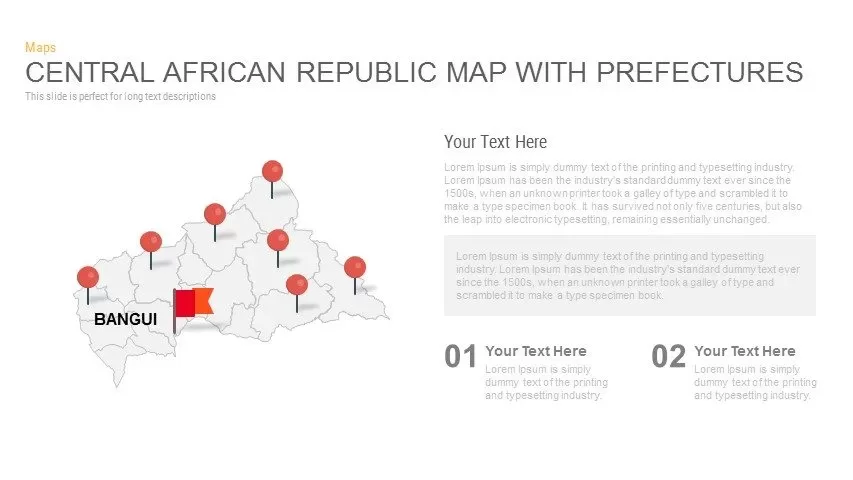
Central African Republic Prefectures Map Template for PowerPoint & Google Slides
World Maps
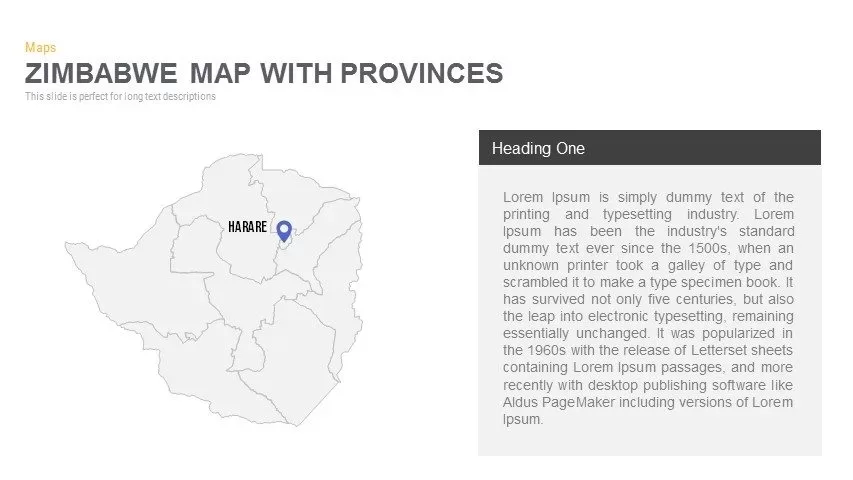
Zimbabwe Map with Provinces Slide Pack Template for PowerPoint & Google Slides
World Maps

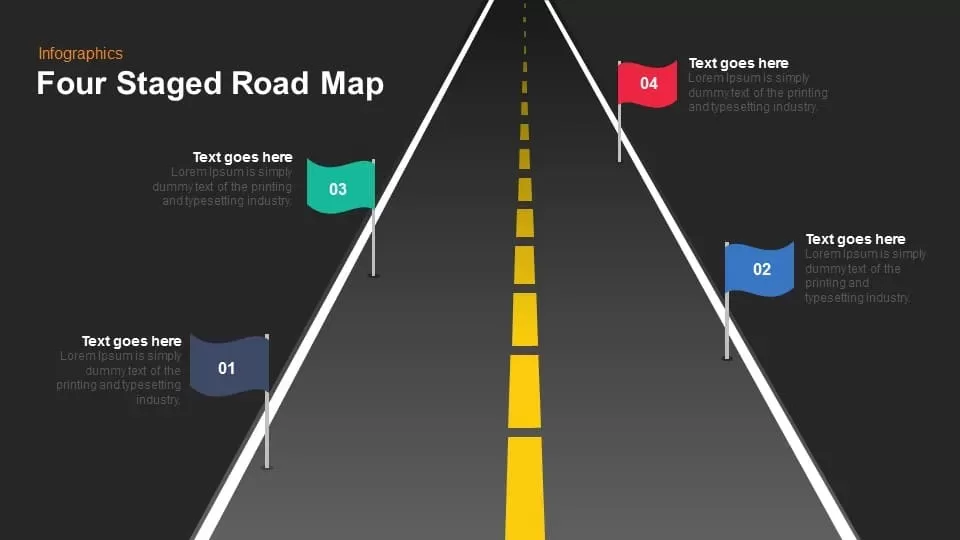
Four Staged Road Map template for PowerPoint & Google Slides
Roadmap

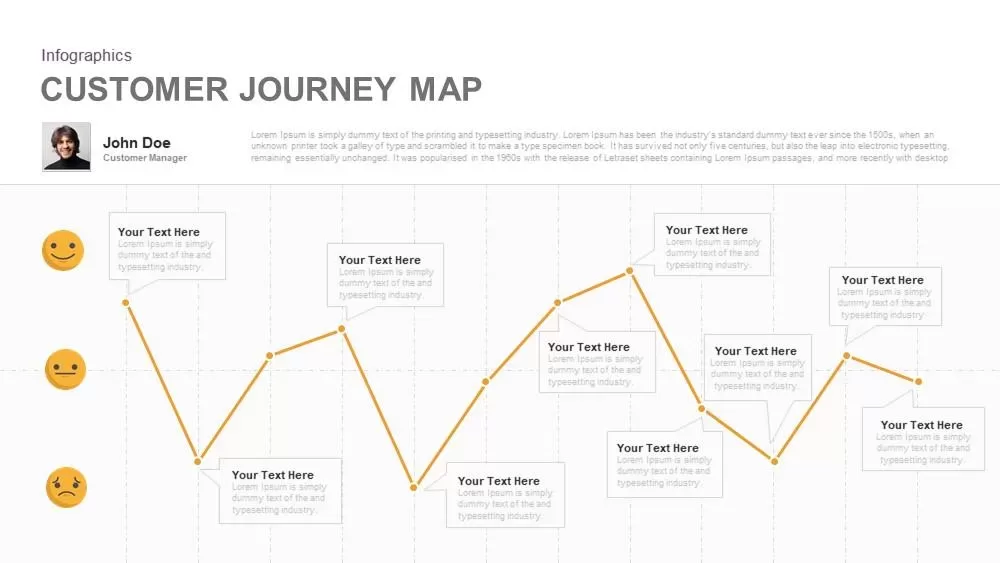
Emotional Customer Journey Map Template for PowerPoint & Google Slides
Customer Journey
Risk Management Heat Map Diagram Template for PowerPoint & Google Slides
Comparison Chart
Colorful Mind Map Infographic Template with Icons for PowerPoint & Google Slides
Mind Maps
Colorful Mind Map Infographic Template for PowerPoint & Google Slides
Mind Maps
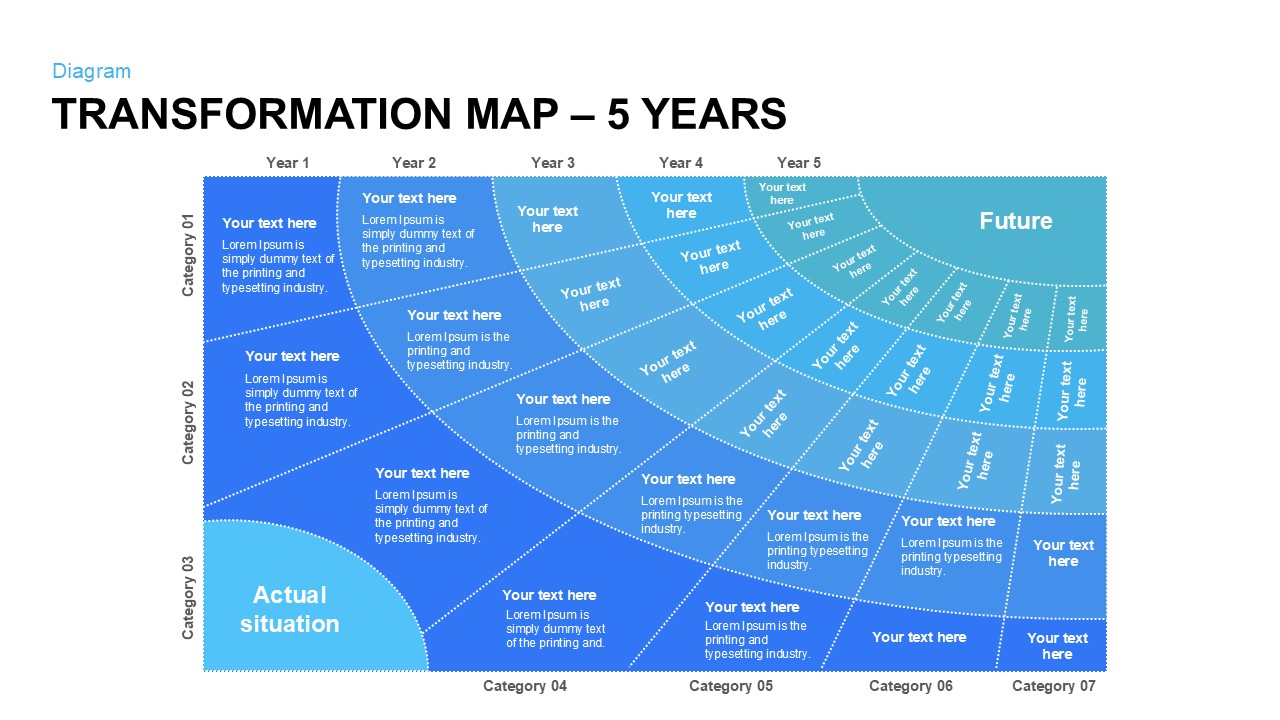
Five-Year Transformation Map Diagram Template for PowerPoint & Google Slides
Process
Mind Map Diagram Template for PowerPoint & Google Slides
Mind Maps
Fully Editable World Map Infographic Template for PowerPoint & Google Slides
World Maps
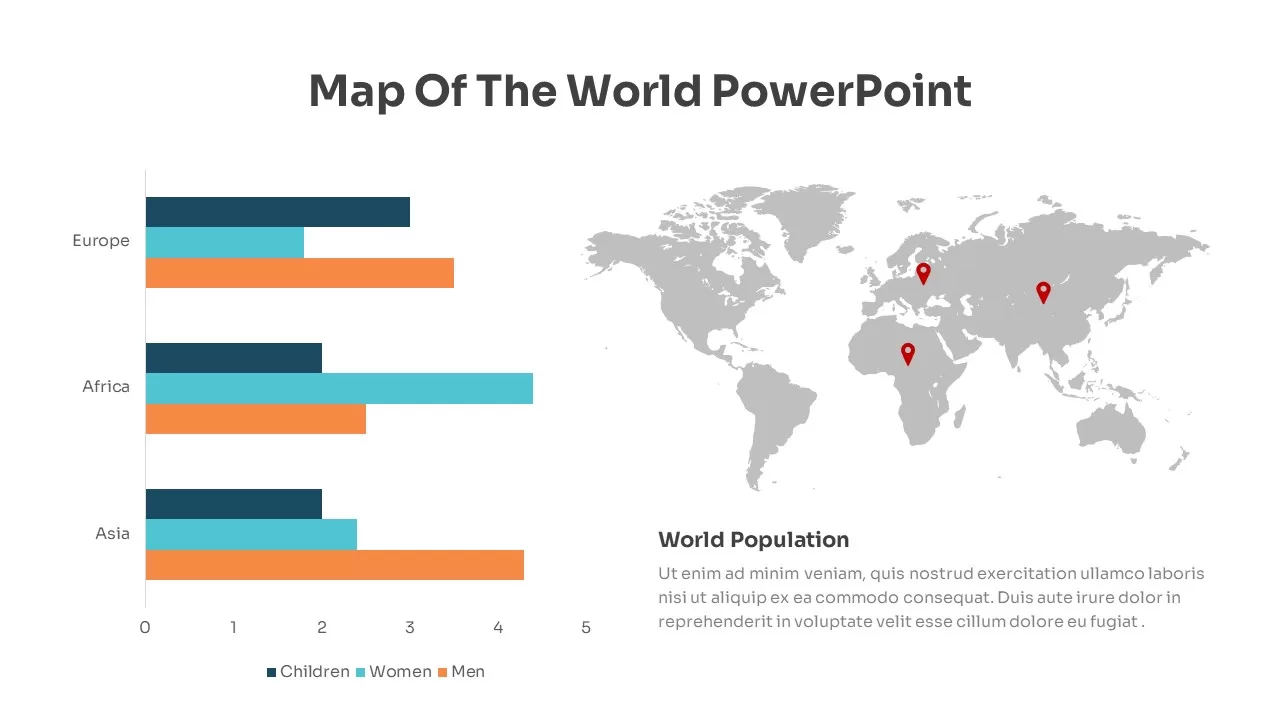
Global Population Demographics & Map Template for PowerPoint & Google Slides
Bar/Column
Colorful Mind Map Template for PowerPoint & Google Slides
Mind Maps
Circular Mind Map Template for PowerPoint & Google Slides
Mind Maps
Mind Map Template for PowerPoint & Google Slides
Mind Maps
World Map Without Names Template for PowerPoint & Google Slides
World Maps
North America Percentage Map Infographic Template for PowerPoint & Google Slides
World Maps
North America Location Pin Map Overview Template for PowerPoint & Google Slides
World Maps
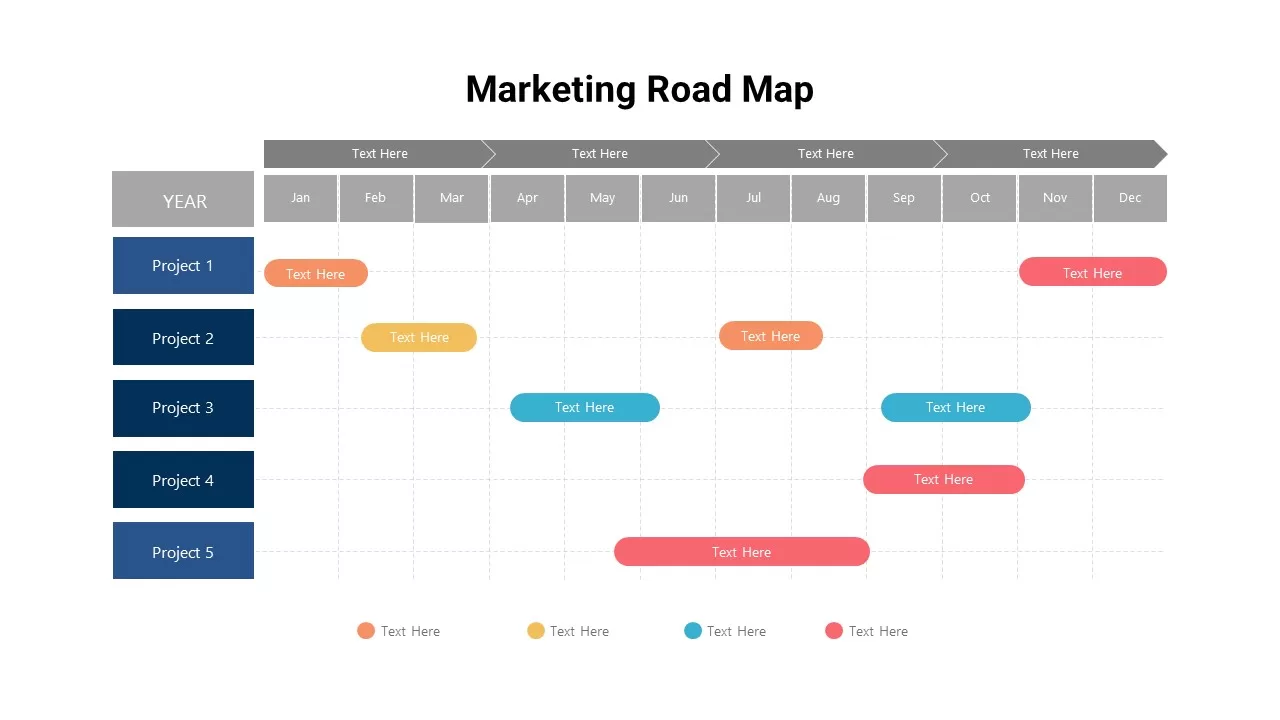
Marketing Projects Road Map Timeline Template for PowerPoint & Google Slides
Roadmap
North America Data Map Callouts Template for PowerPoint & Google Slides
World Maps
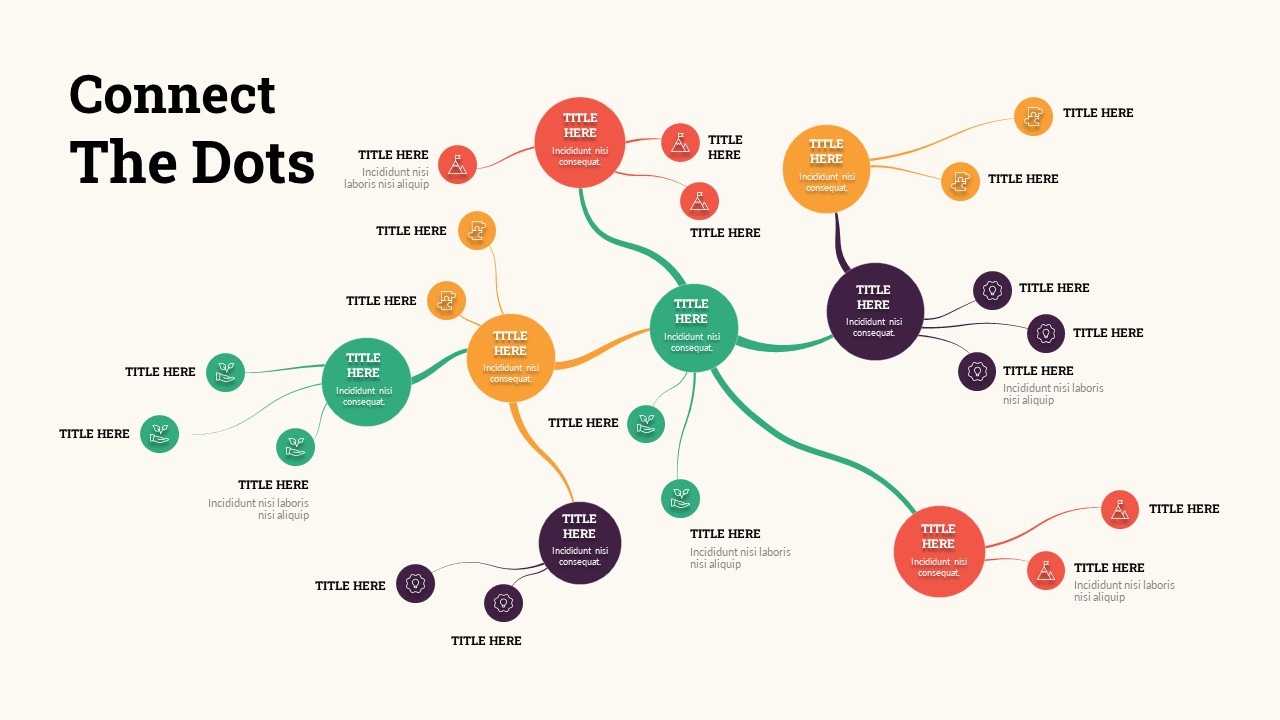
Connect the Dots Mind Map template for PowerPoint & Google Slides
Mind Maps
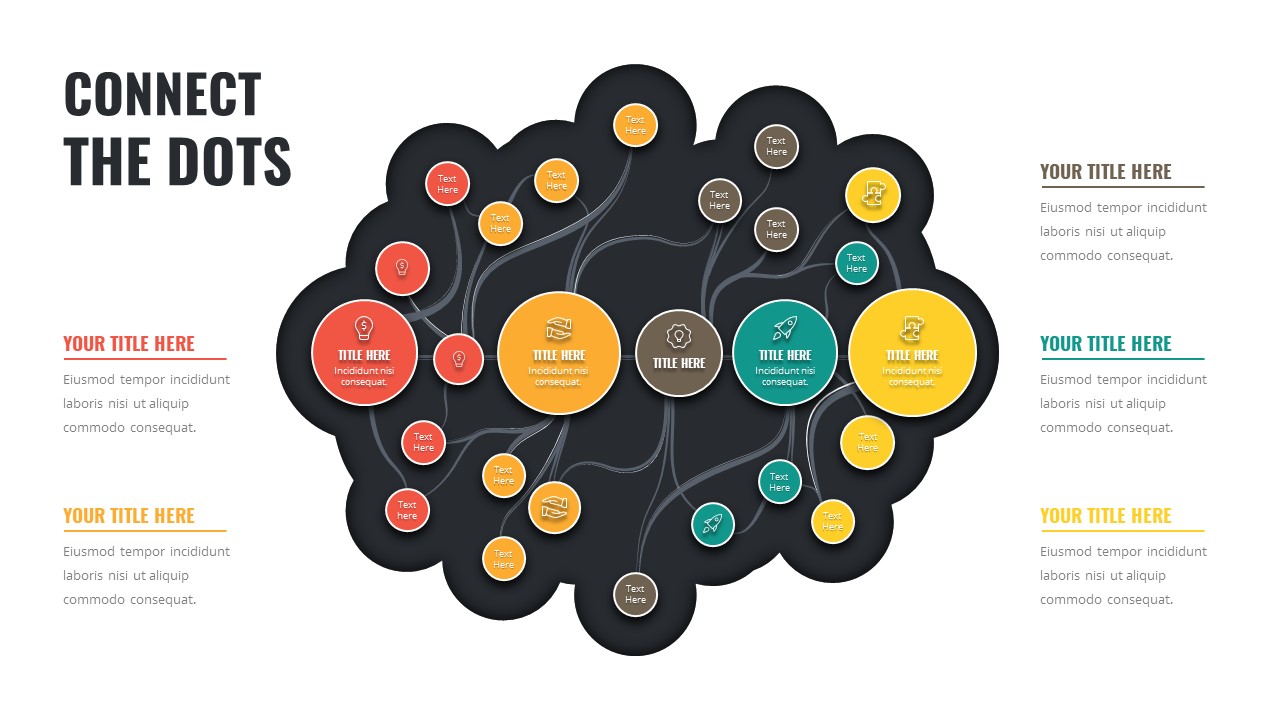
Connect the Dots Mind Map Diagram Template for PowerPoint & Google Slides
Mind Maps
Free Editable Saudi Arabia Map Template for PowerPoint & Google Slides
World Maps
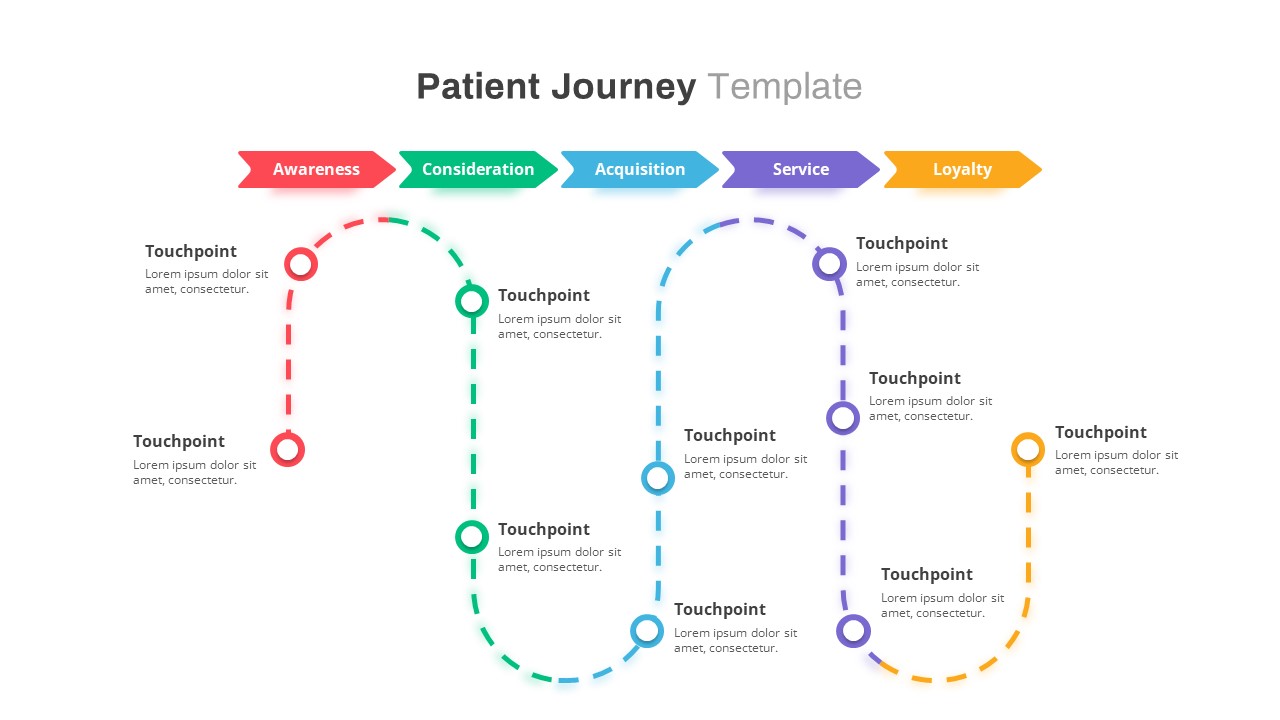
Healthcare Patient Journey Map Overview Template for PowerPoint & Google Slides
Health
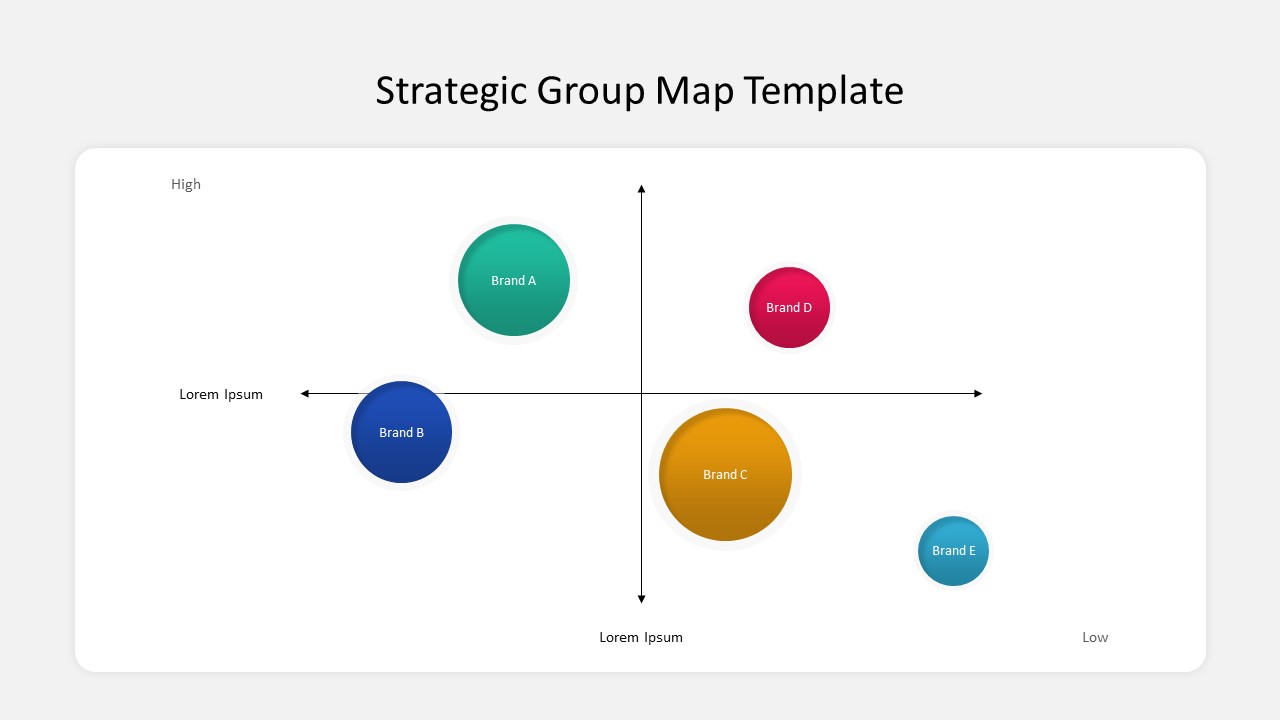
Business Strategic Group Map Analysis Template for PowerPoint & Google Slides
Competitor Analysis
Free
Germany Map with Regional Callouts Template for PowerPoint & Google Slides
World Maps
Editable Africa Map Infographic Data Template for PowerPoint & Google Slides
World Maps
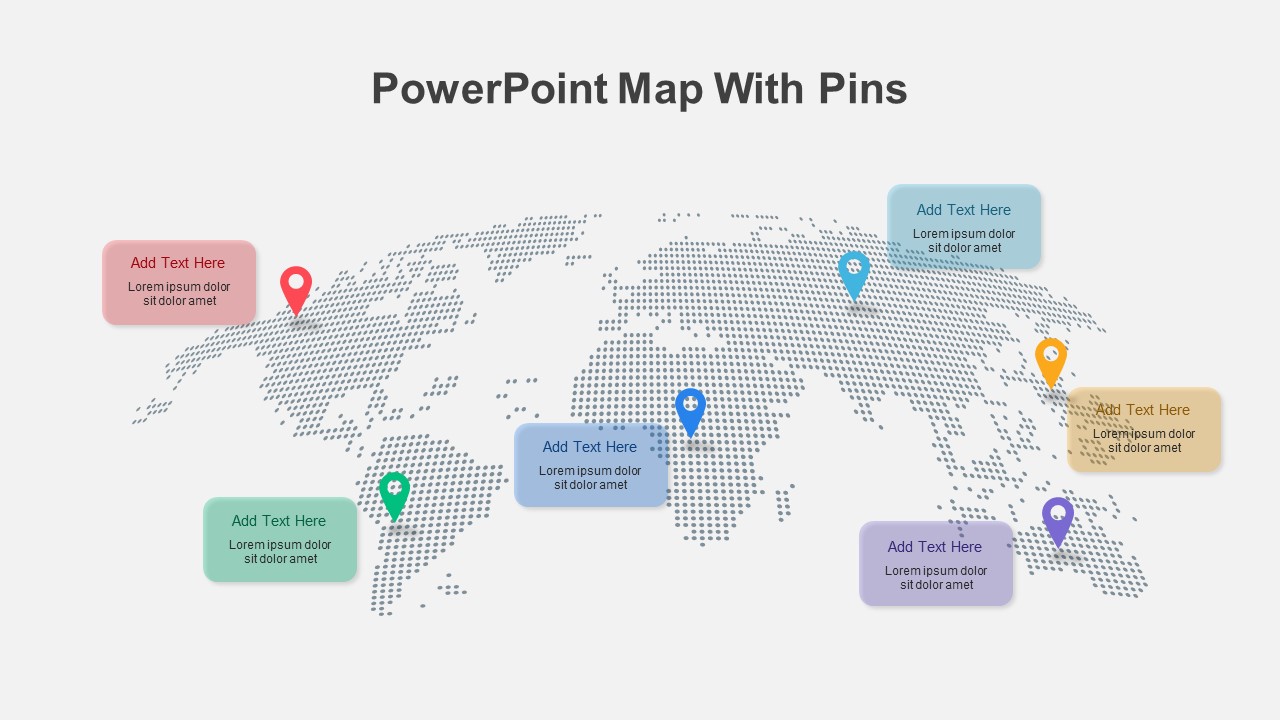
Colorful World Map with Location Pins Template for PowerPoint & Google Slides
World Maps
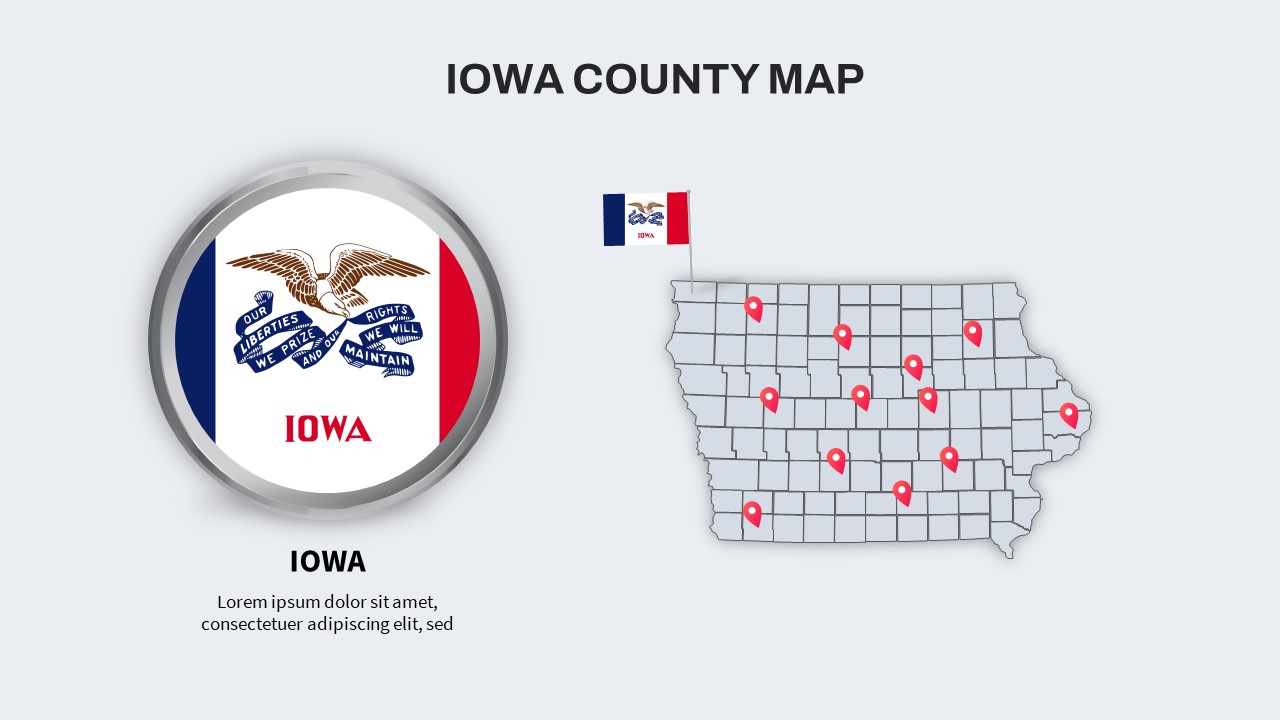
Iowa County Map with Location Markers Template for PowerPoint & Google Slides
World Maps
Kentucky County Map Visualization Template for PowerPoint & Google Slides
World Maps
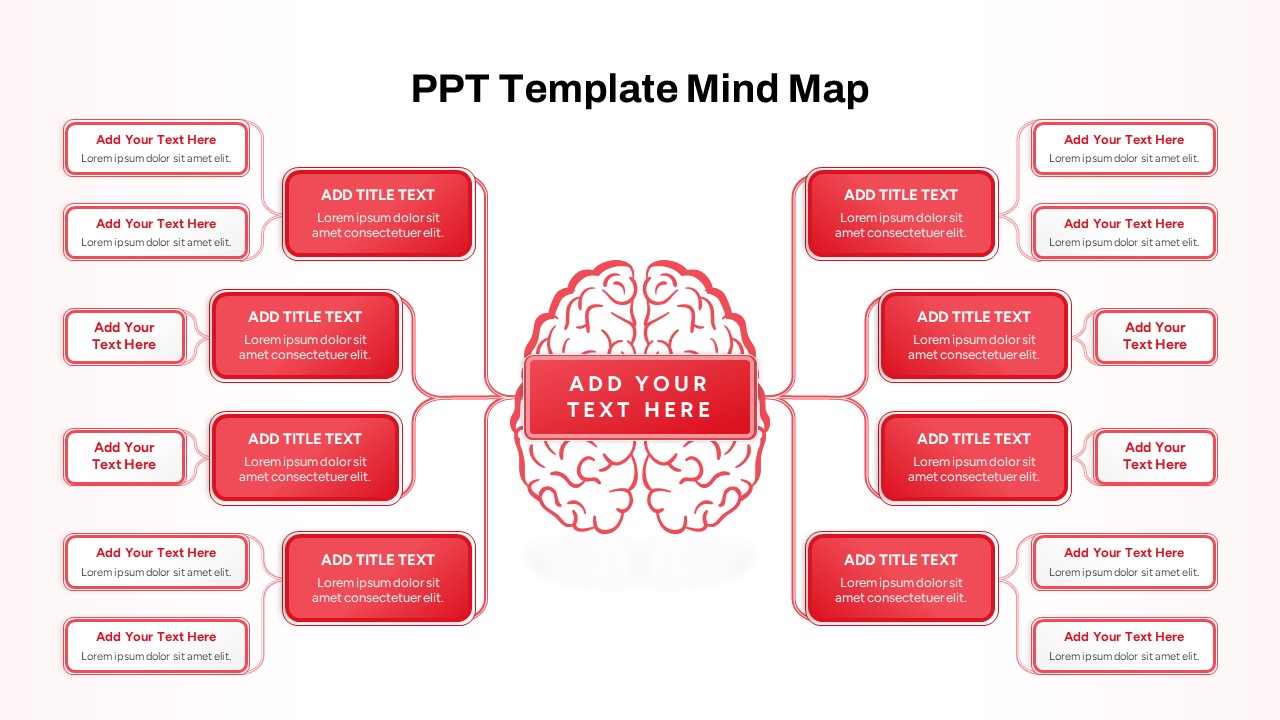
Red Brain Mind Map Diagram Template for PowerPoint & Google Slides
Mind Maps
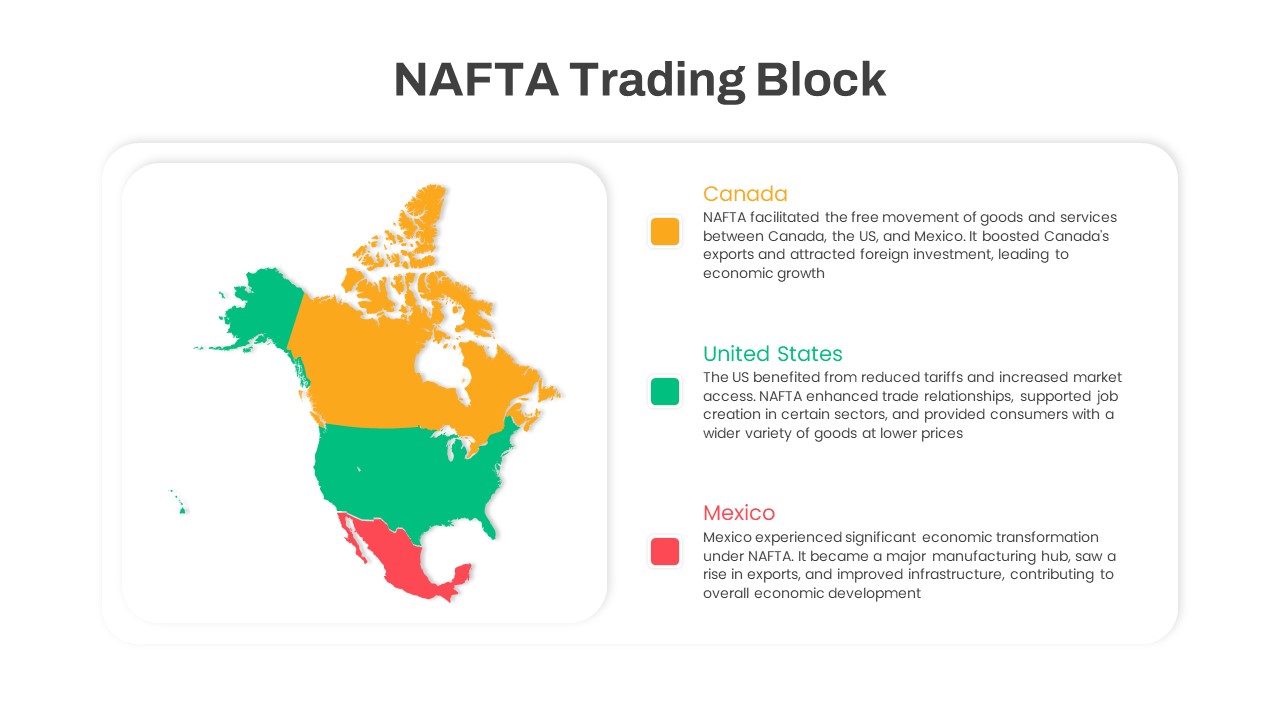
NAFTA Trading Block Map Infographic Template for PowerPoint & Google Slides
World Maps
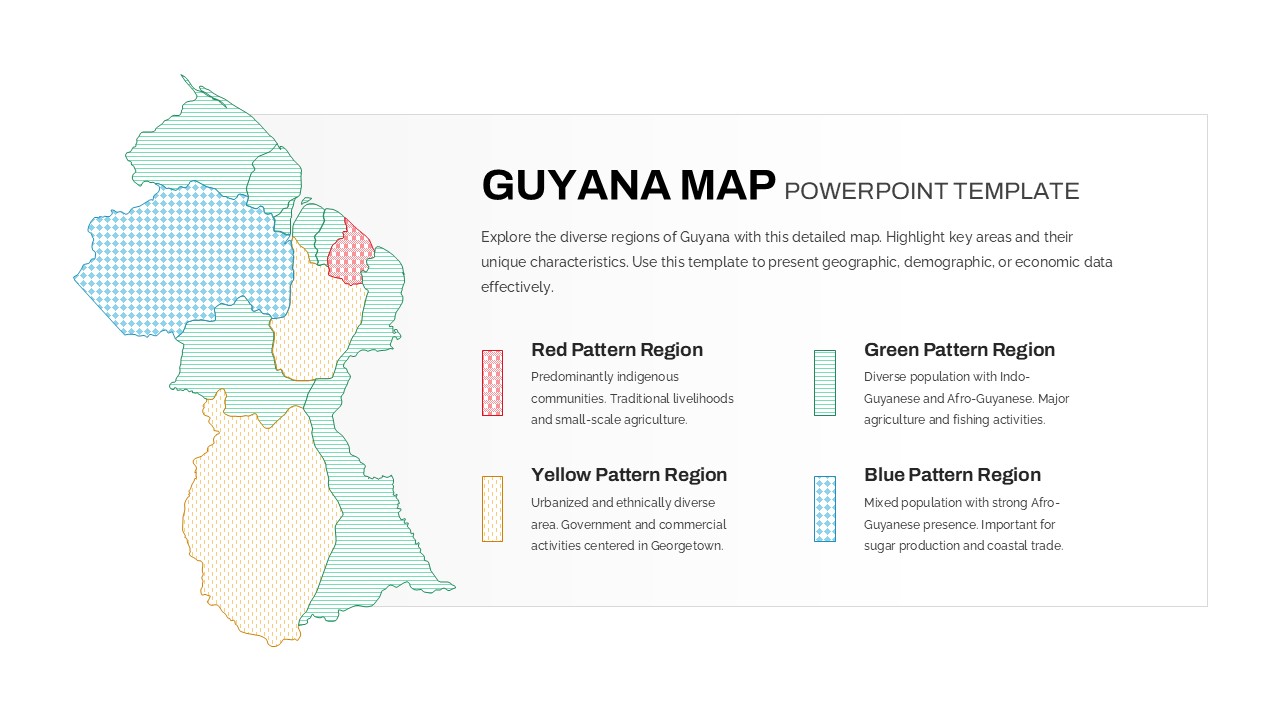
Patterned Guyana Regional Map Template for PowerPoint & Google Slides
World Maps
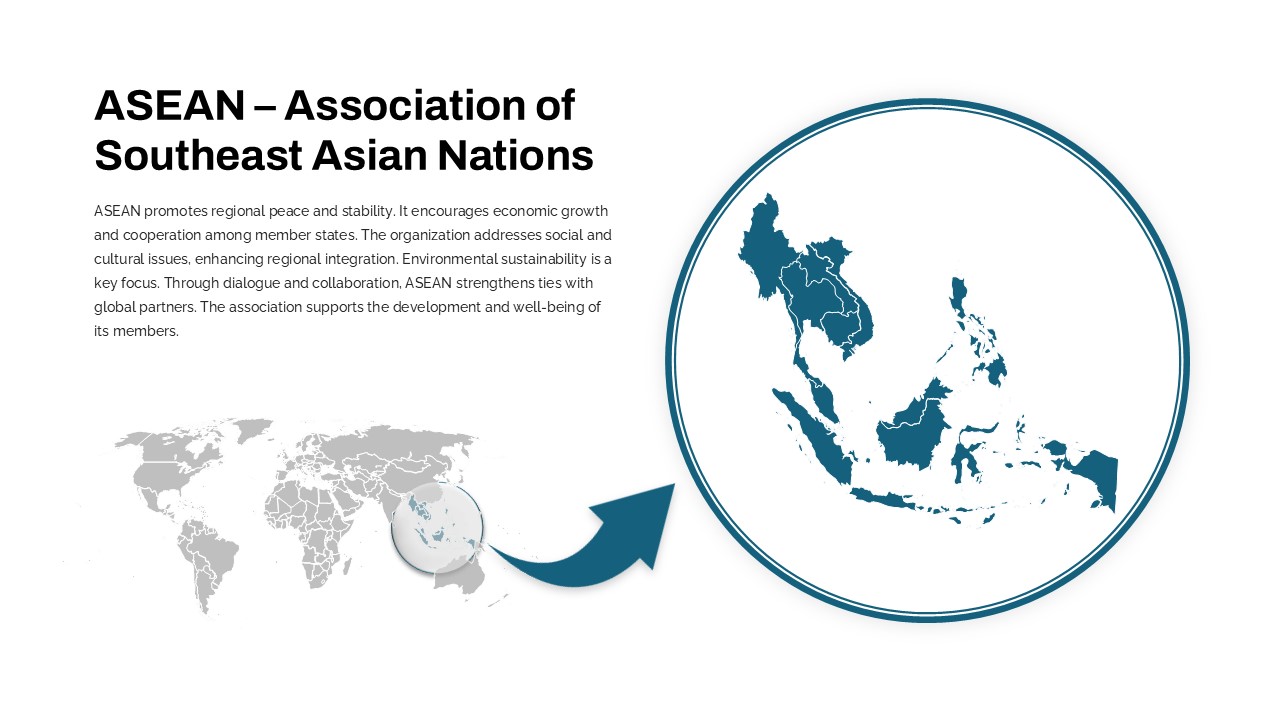
Professional ASEAN Region Zoom Map Slide Template for PowerPoint & Google Slides
World Maps
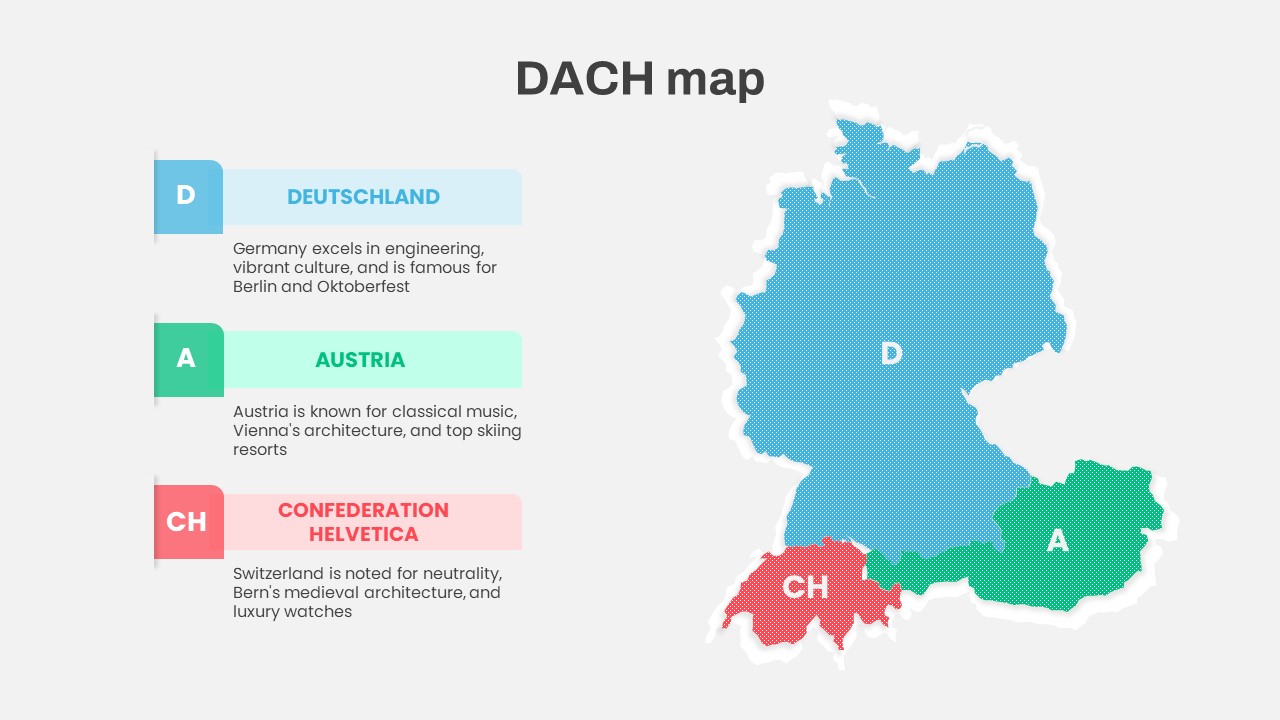
DACH Region Map with Country Highlights Template for PowerPoint & Google Slides
Maps
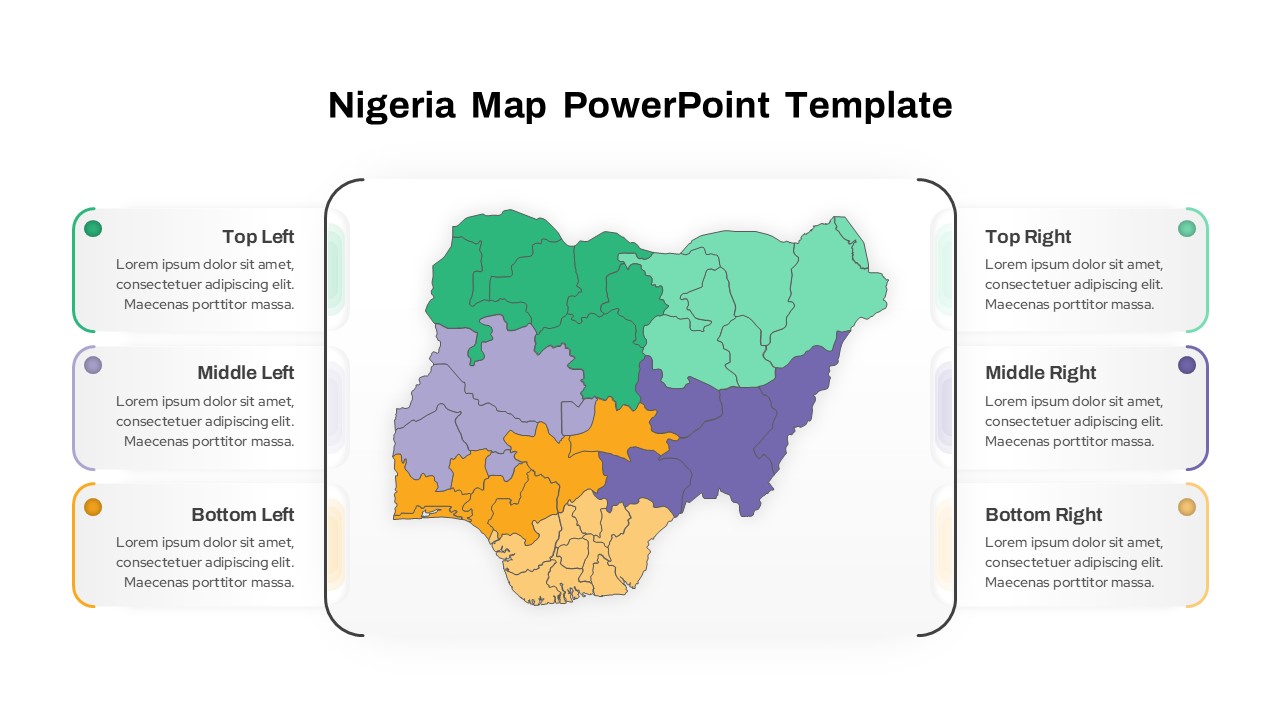
Nigeria Regional Callout Map Diagram Template for PowerPoint & Google Slides
Maps
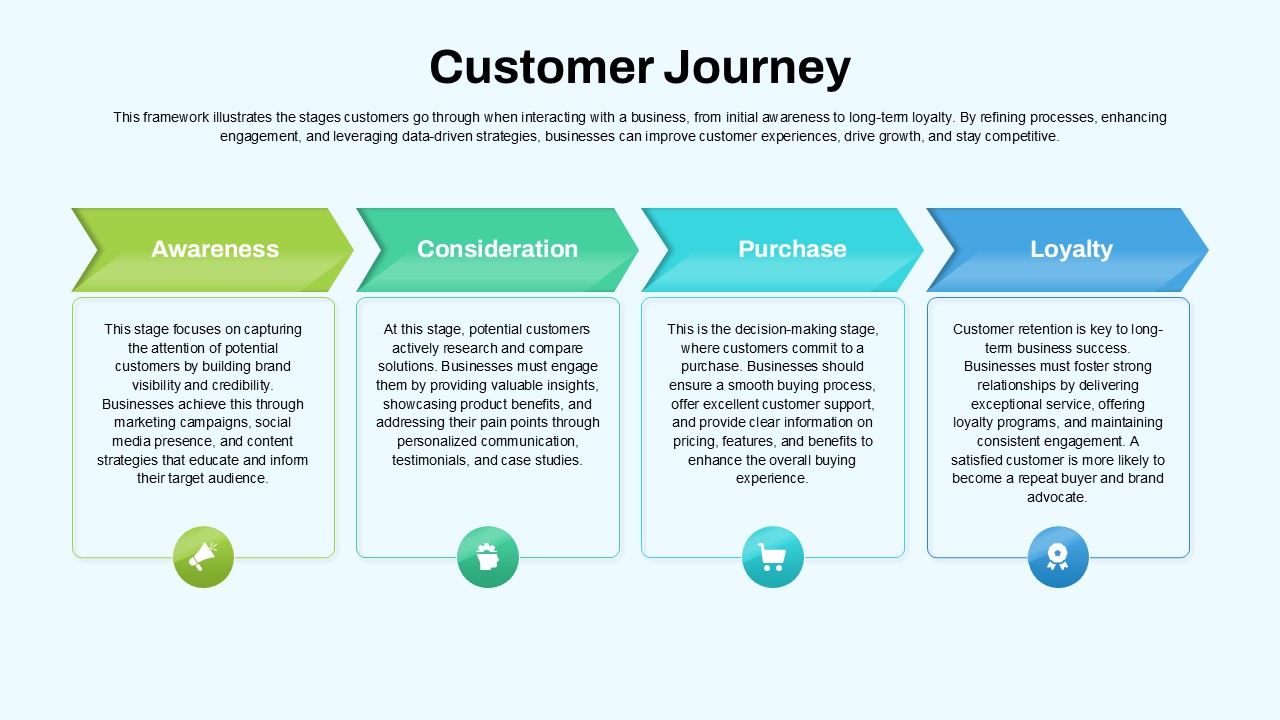
Customer Journey Process Map Infographic Template for PowerPoint & Google Slides
Customer Journey
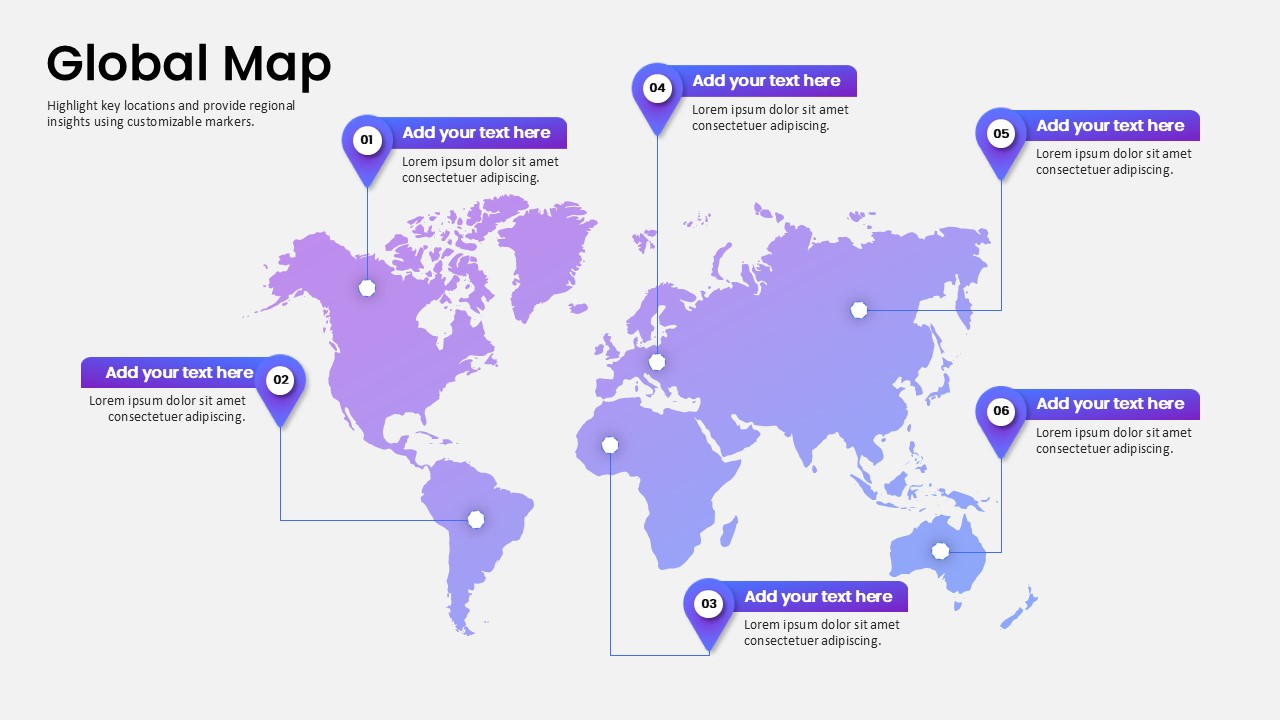
Global Map Highlighting Key Locations template for PowerPoint & Google Slides
World Maps
AI and Data Ecosystem Map Template for PowerPoint & Google Slides
AI
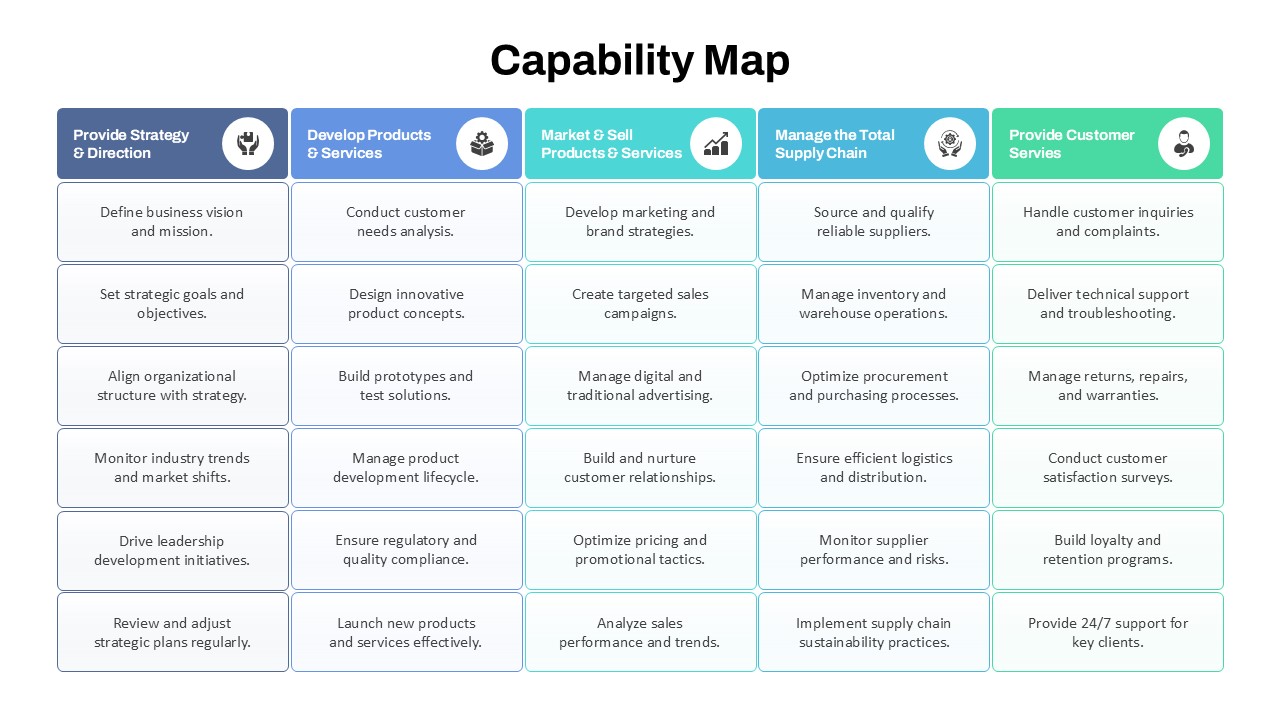
Capability Map Overview Template for PowerPoint & Google Slides
Business Strategy
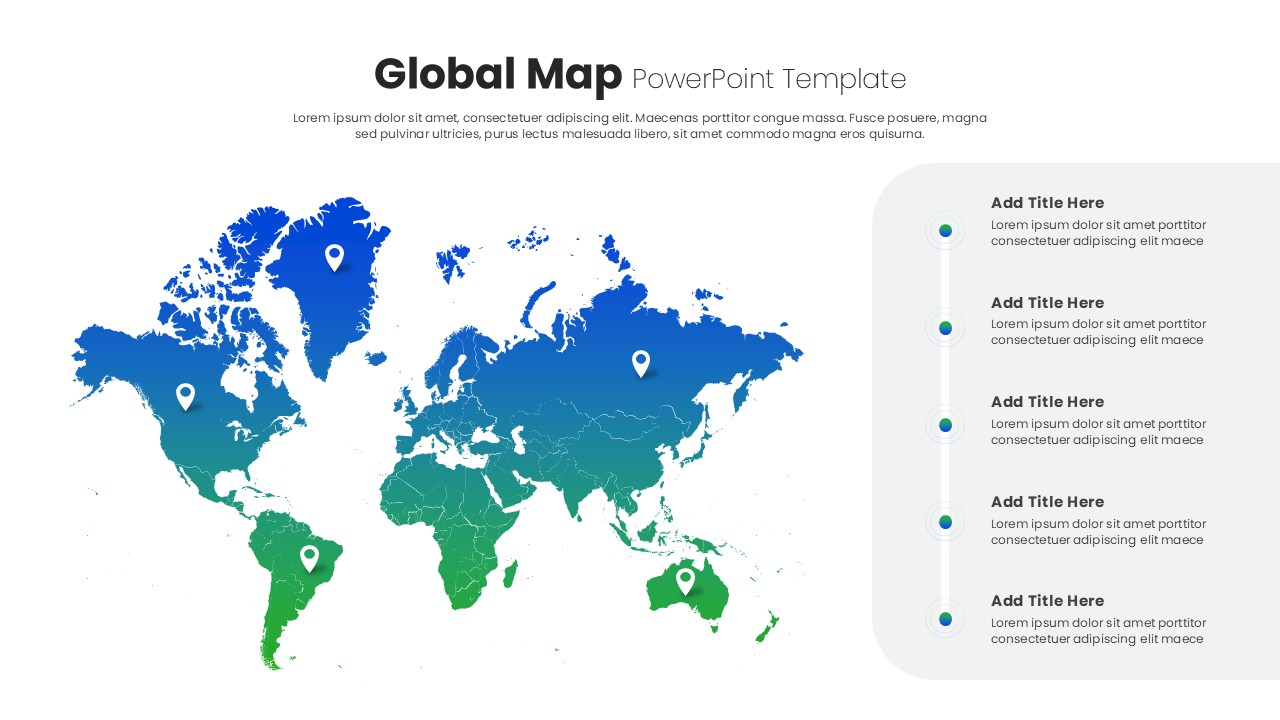
Global Map with Pinpoint Markers template for PowerPoint & Google Slides
Business
London Map with Highlighted Boroughs Template for PowerPoint & Google Slides
World Maps