Target Operating Model Diagram Template for PowerPoint & Google Slides


Description
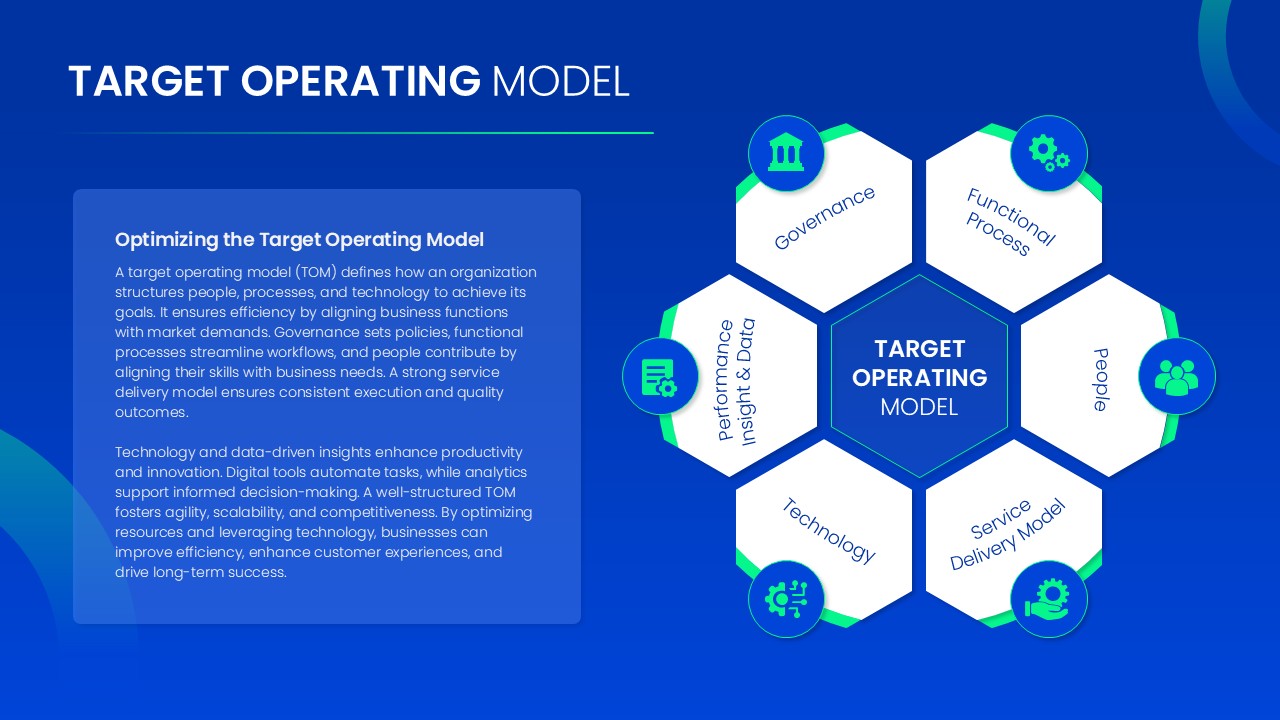
Elevate your strategic presentations with this versatile Target Operating Model slide set for PowerPoint & Google Slides. Designed to articulate an organization’s future-state framework, this template pack offers three distinct layouts to suit any audience:
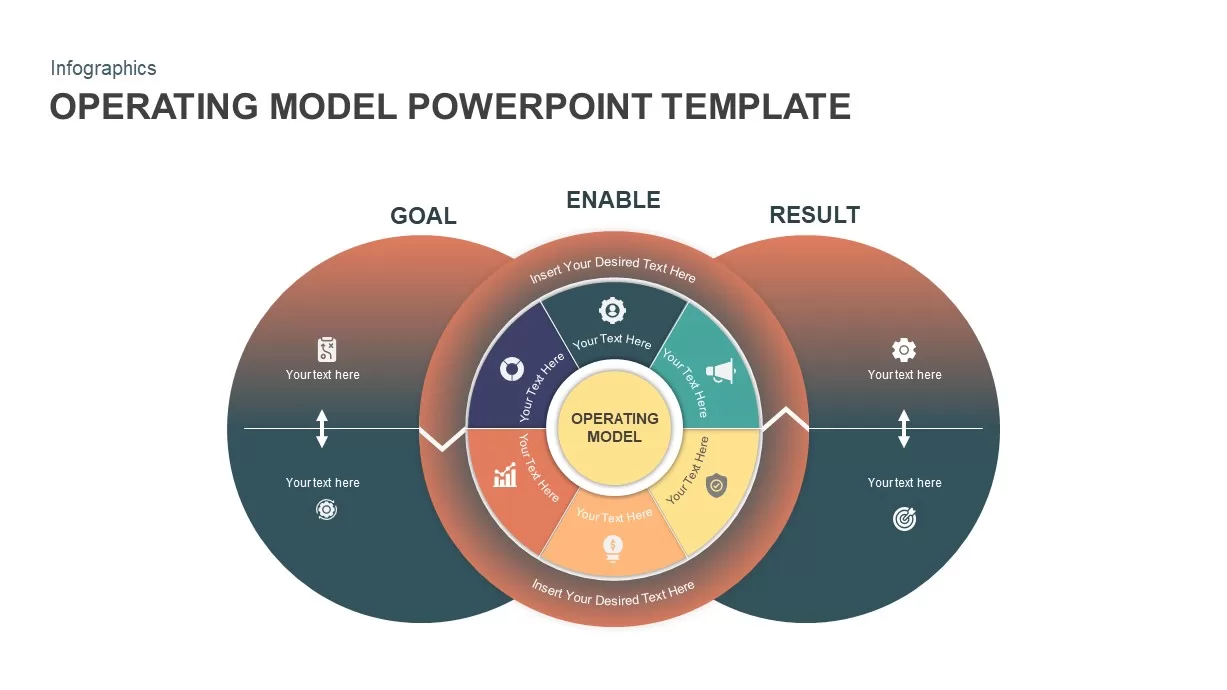
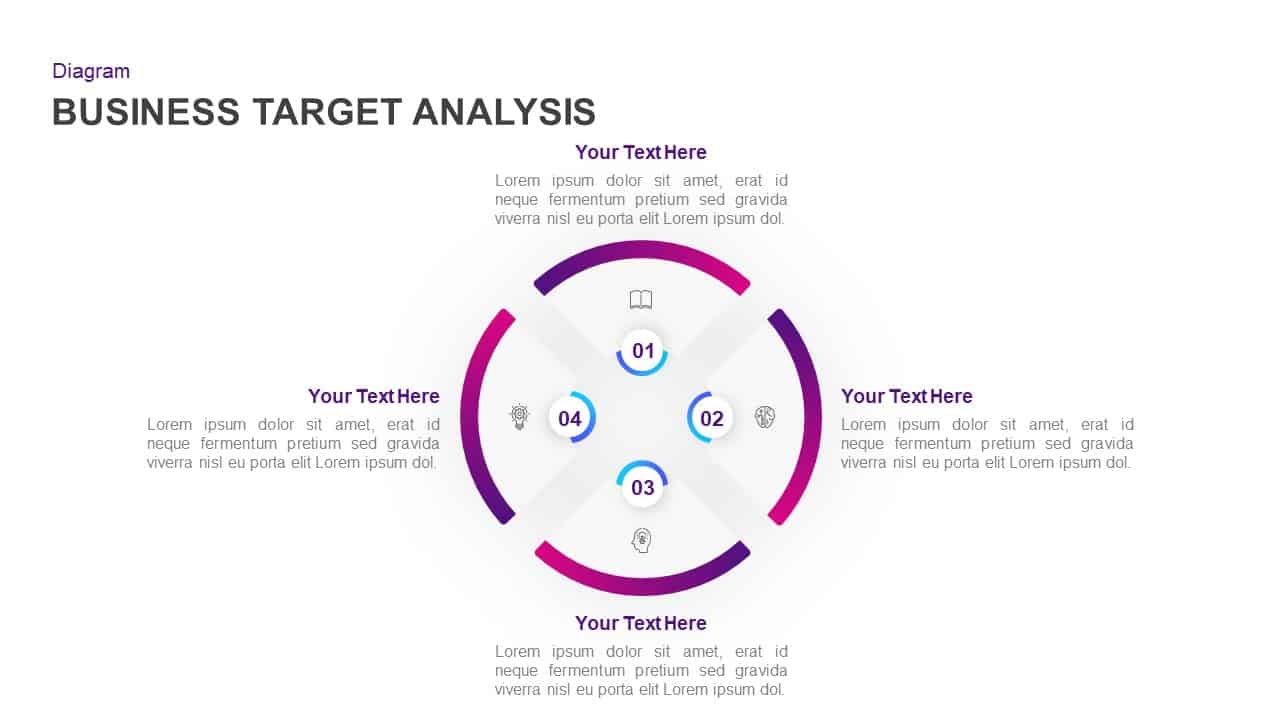
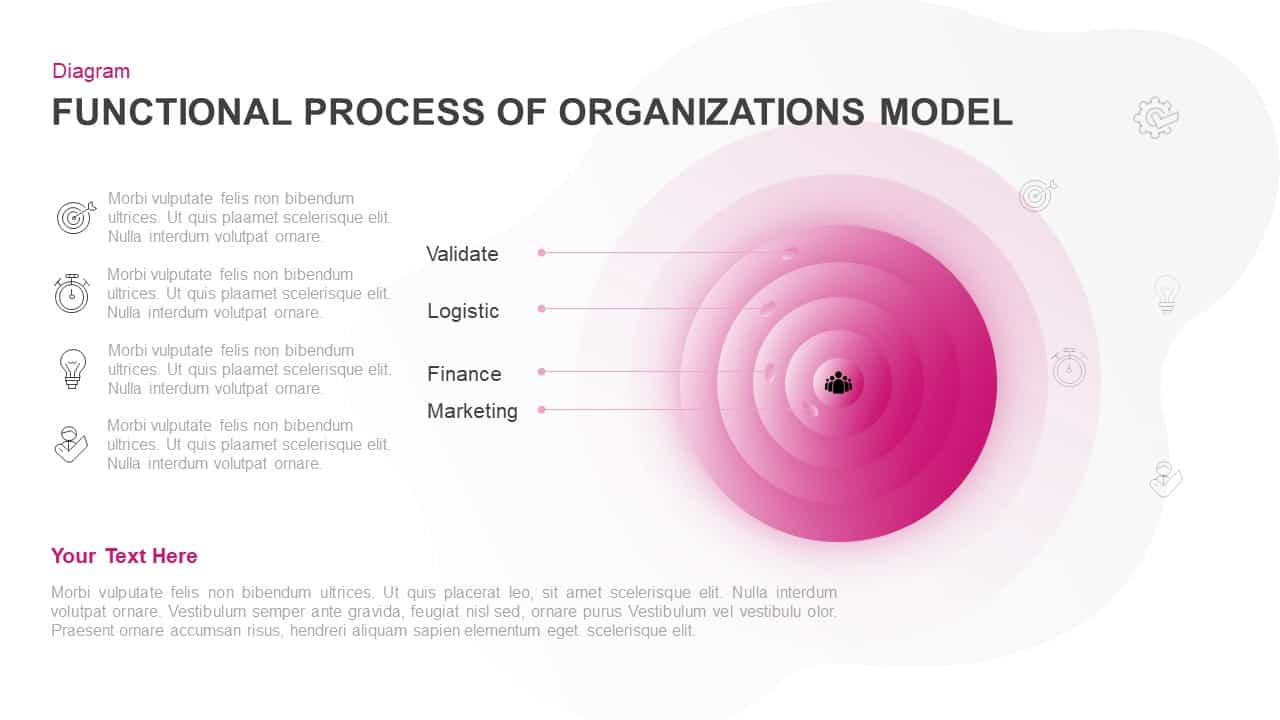
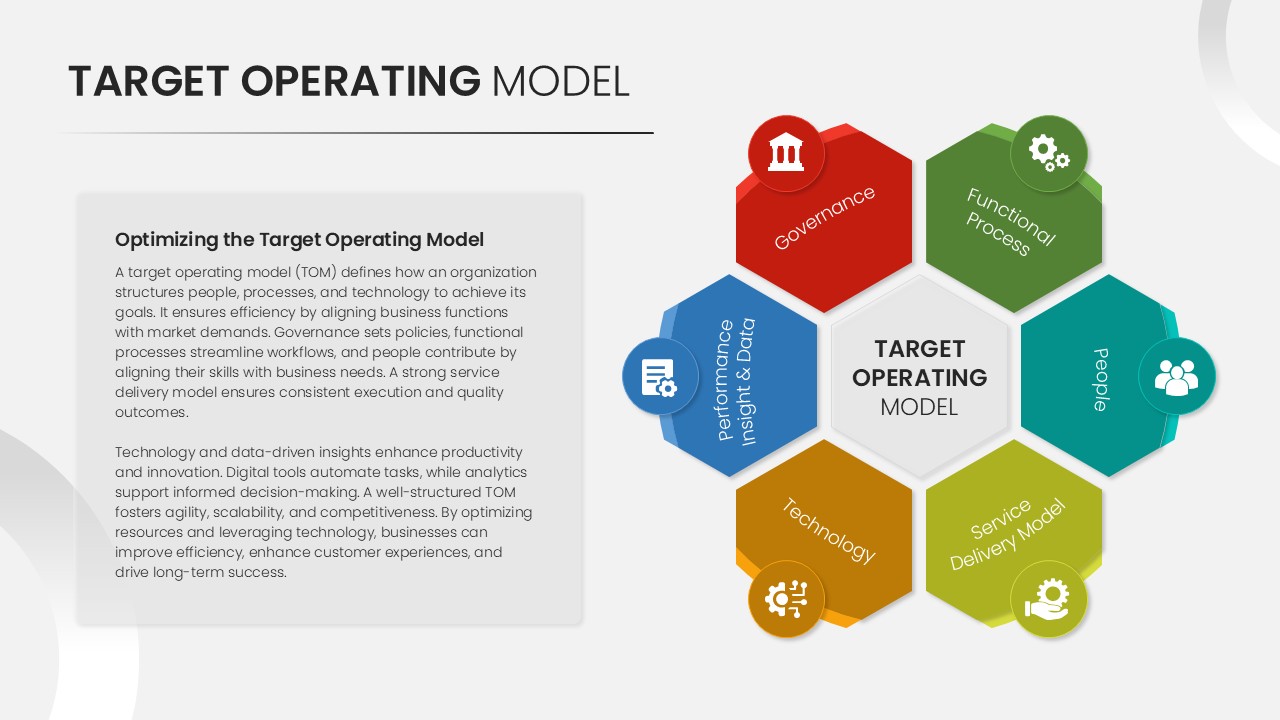
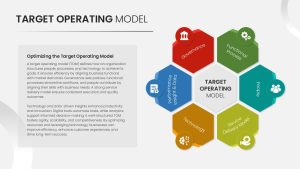
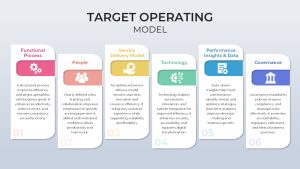
Hexagon Circle Diagram: A vibrant six-node hexagon wheel—each segment color-coded and paired with infographic icons—visually represents key TOM components: Functional Process, People, Service Delivery Model, Technology, Performance Insights & Data, and Governance.
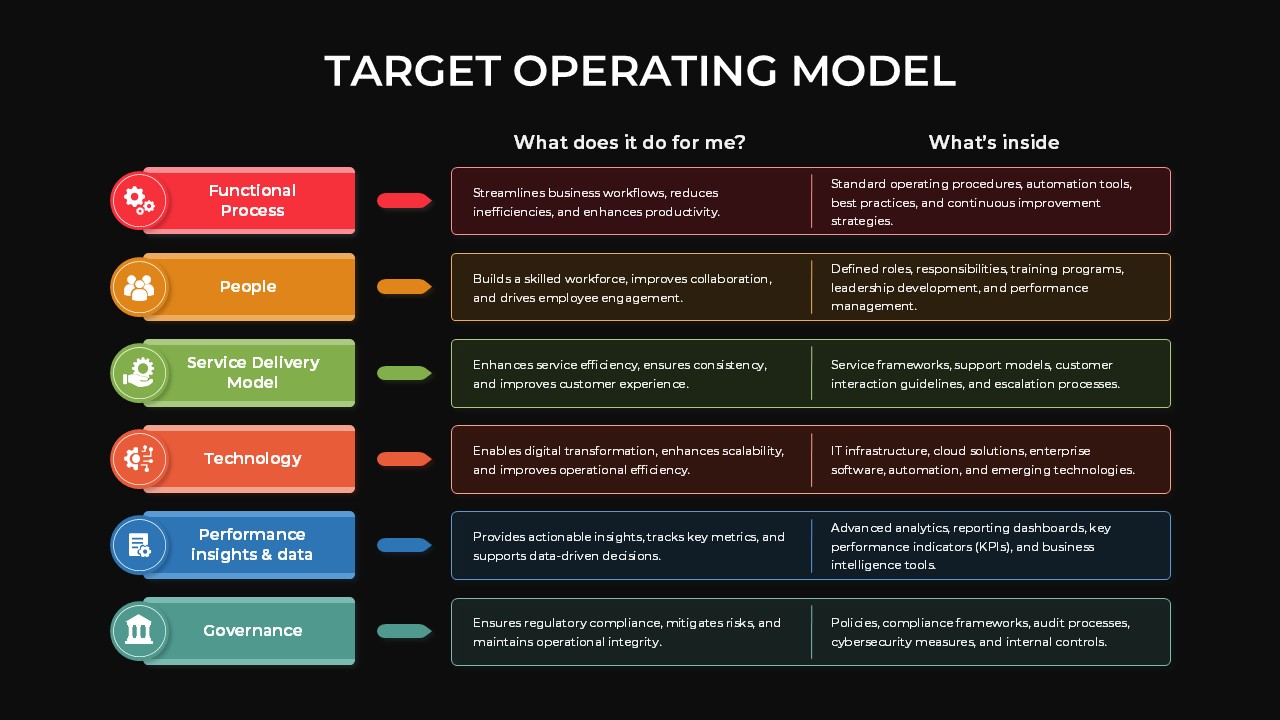
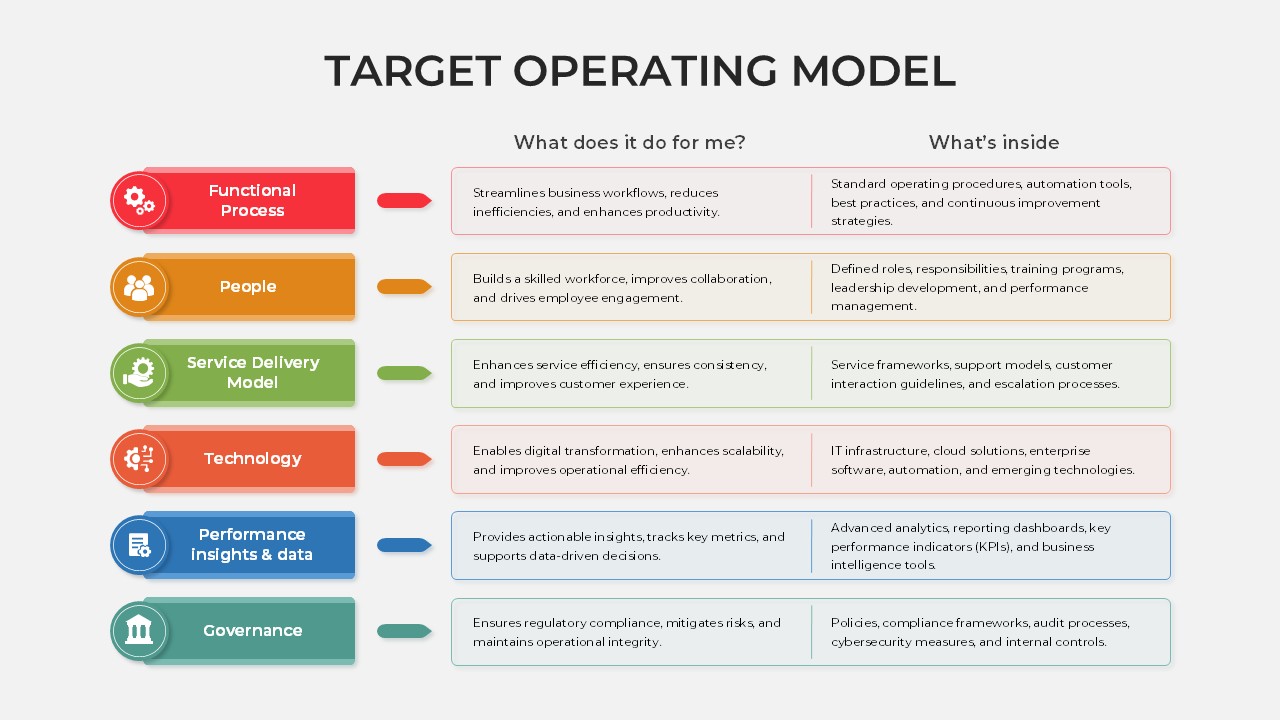
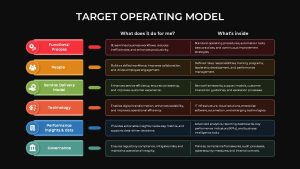
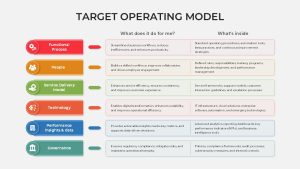
Comparison Table Slide: A clean, side-by-side layout that maps “What does it do?” versus “What’s inside,” using color-tinted labels and iconography for quick reference. Ideal for data-driven analysis, boardroom briefings, and stakeholder workshops.
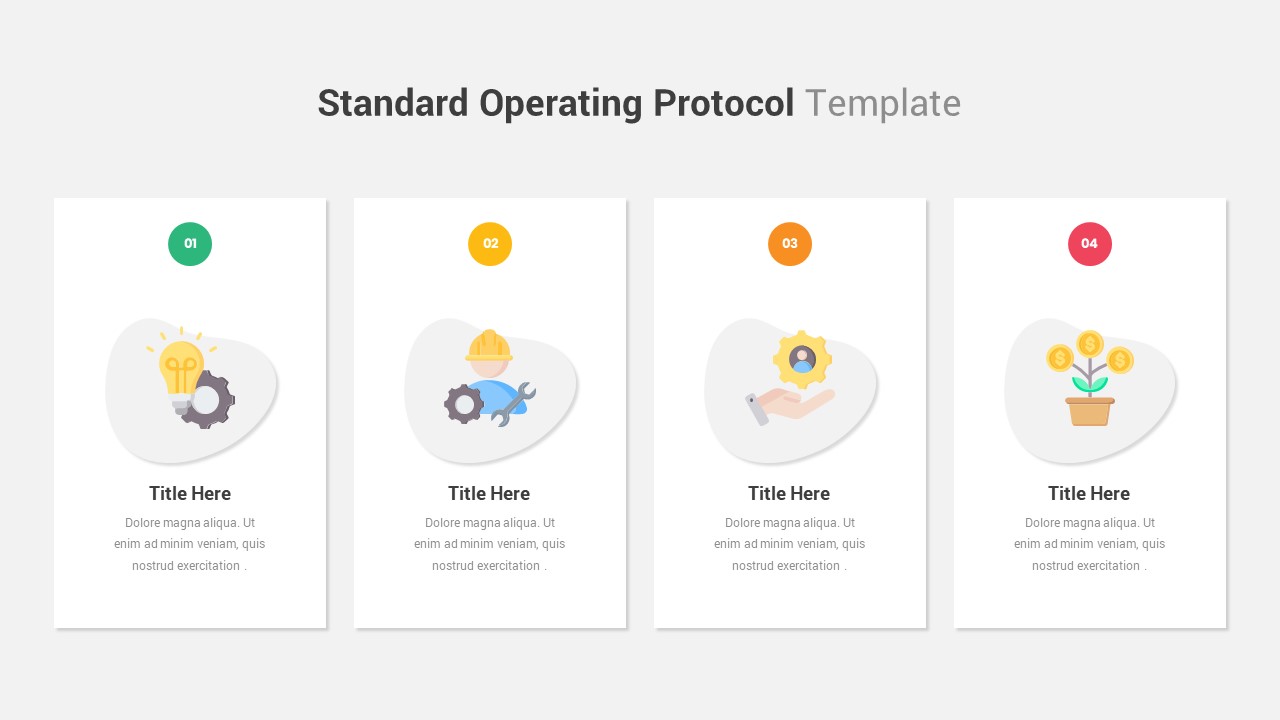
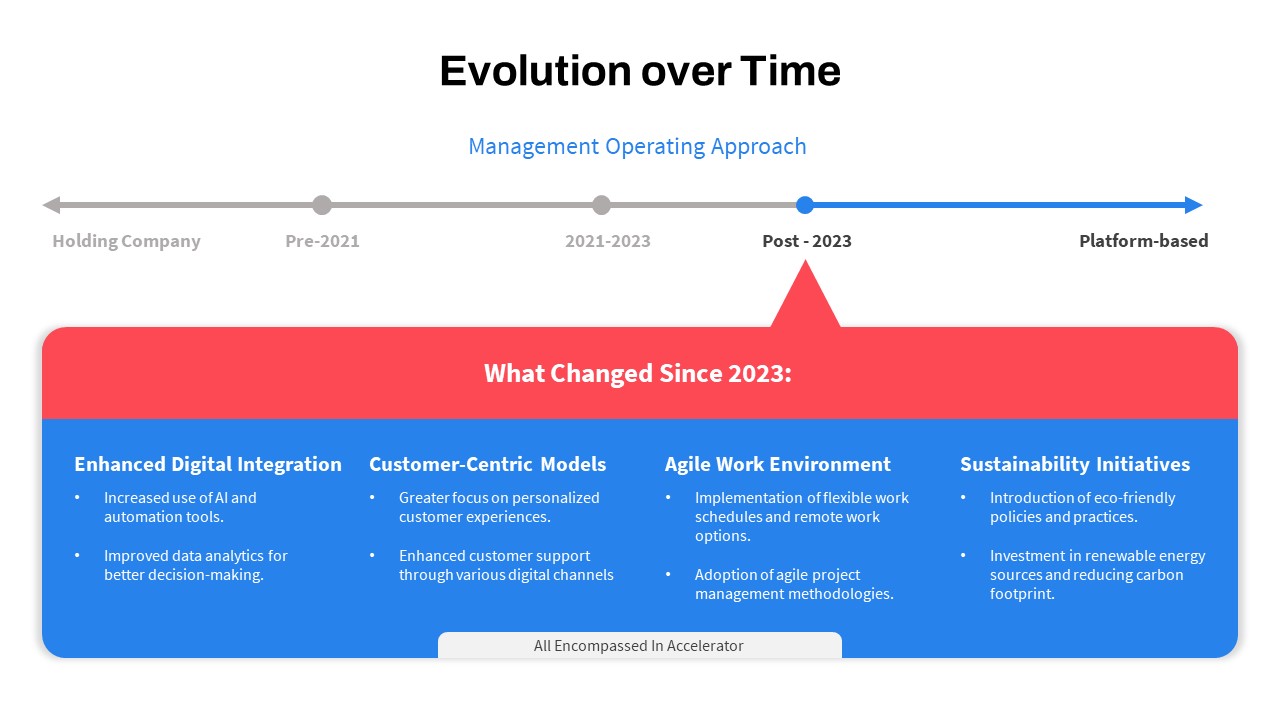
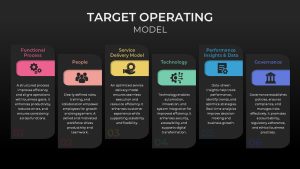
Timeline Model Template: A sequential, rounded-edge panel design featuring numbered stages and concise descriptions—perfect for outlining transformation roadmaps, project phases, or operational milestones.
All slides are fully editable: customize colors, icons, typography, and layouts to match your brand guidelines. Built-in master slides and intuitive placeholders streamline the editing process, ensuring consistency and speed. Optimized for both PowerPoint & Google Slides, these slides maintain full-resolution clarity across devices, eliminating formatting issues and version conflicts. Use the included icon library or swap in your own graphics to adapt these frameworks for marketing strategies, IT planning, HR roadmaps, or financial process reviews.
Who is it for
Business executives, strategy consultants, and project managers will find this template essential for boardroom presentations, transformation workshops, and client proposals. Educators and MBA students can leverage the clear visual frameworks to teach organizational design concepts. Startup founders and transformation leads can use these layouts to secure buy-in and align cross-functional teams.
Other Uses
Beyond operating models, repurpose these layouts for quarterly business reviews, performance dashboards, risk assessments, and change management plans. Adapt the hexagon wheel for SWOT analyses or capability maps, the comparison table for feature benchmarking, and the timeline panels for product launch plans or marketing strategies.
Login to download this file

Item ID
SB04722
Related Templates

Operating Model Hub-and-Spoke Diagram Template for PowerPoint & Google Slides
Business Models

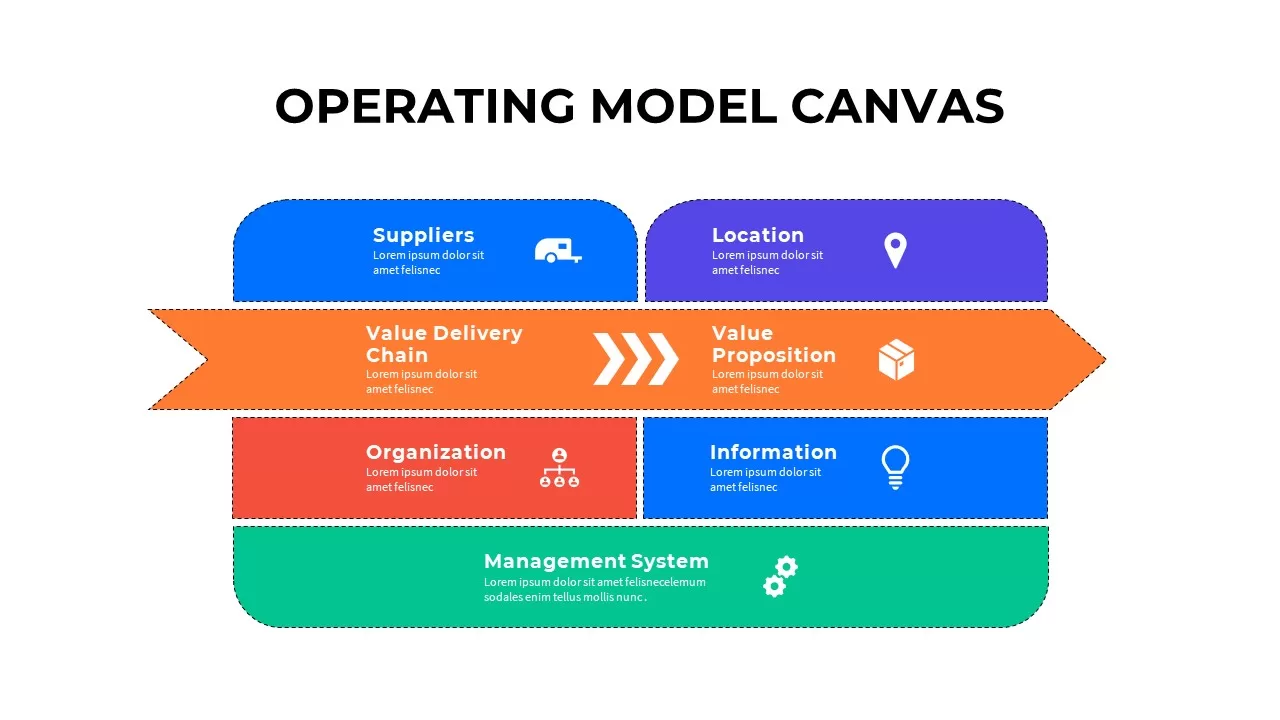
Operating Model Canvas Infographic Template for PowerPoint & Google Slides
Business Models
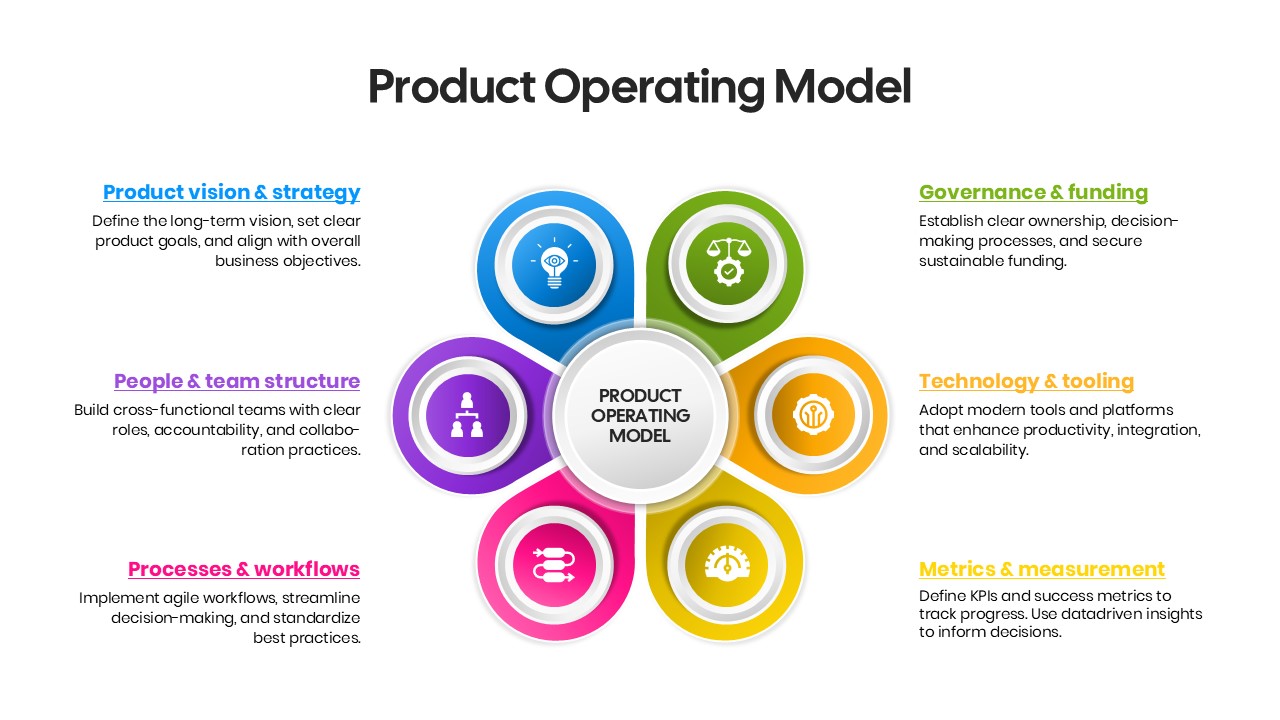
Product Operating Model Framework Template for PowerPoint & Google Slides
Business Strategy
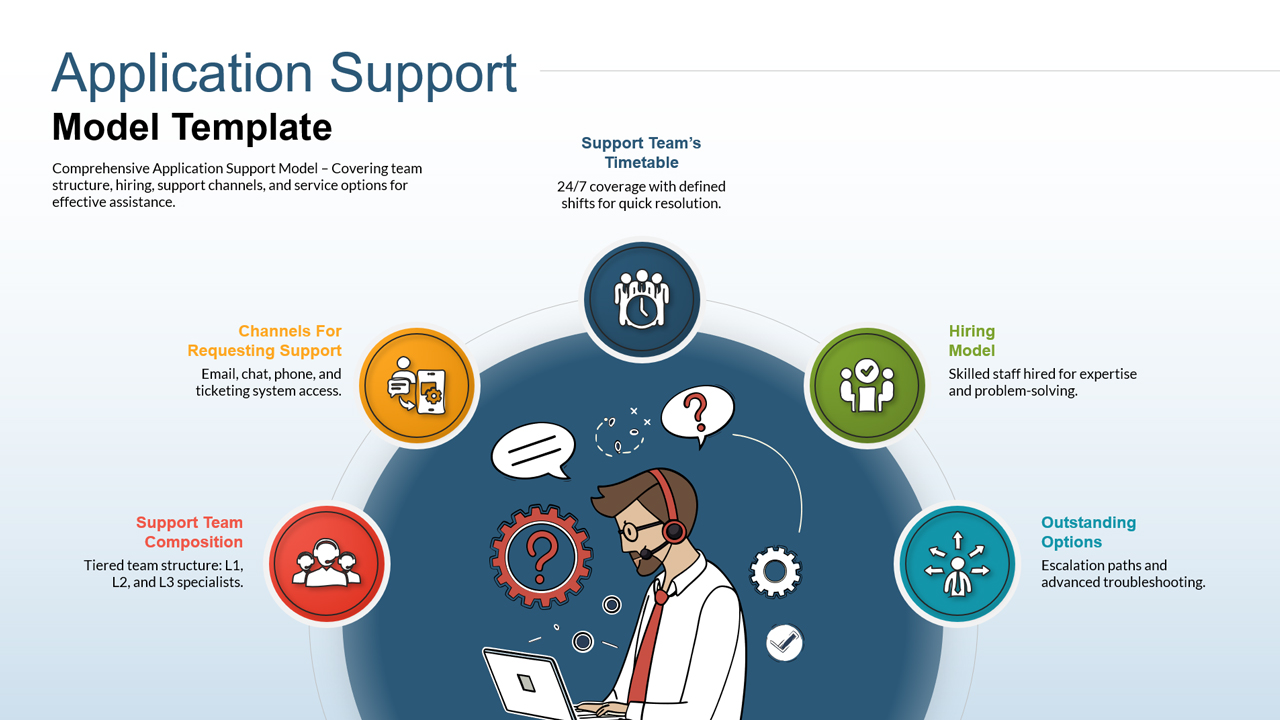
Application Support Operating Model Framework Slide Template for PowerPoint & Google Slides
Information Technology
Operating Channels Comparison Diagram Template for PowerPoint & Google Slides
Business Models
Standard operating protocol template for PowerPoint & Google Slides
Business
Operating Approach Evolution Timeline Template for PowerPoint & Google Slides
Timeline
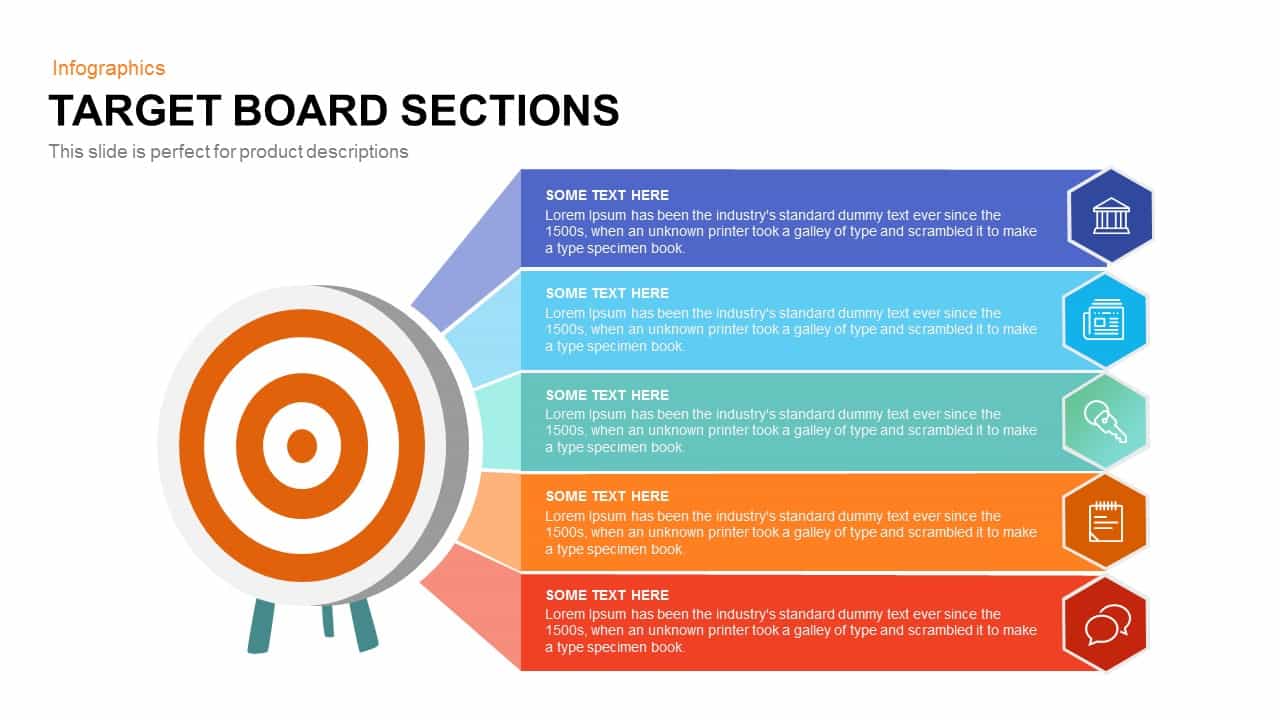
Target Board Sections Circular Diagram Template for PowerPoint & Google Slides
Circular
Business Target Analysis Diagram Template for PowerPoint & Google Slides
Circular
Free Vision and Mission Target Diagram Template for PowerPoint & Google Slides
Vision and Mission
Free
Project Objectives Target Diagram Template for PowerPoint & Google Slides
Goals
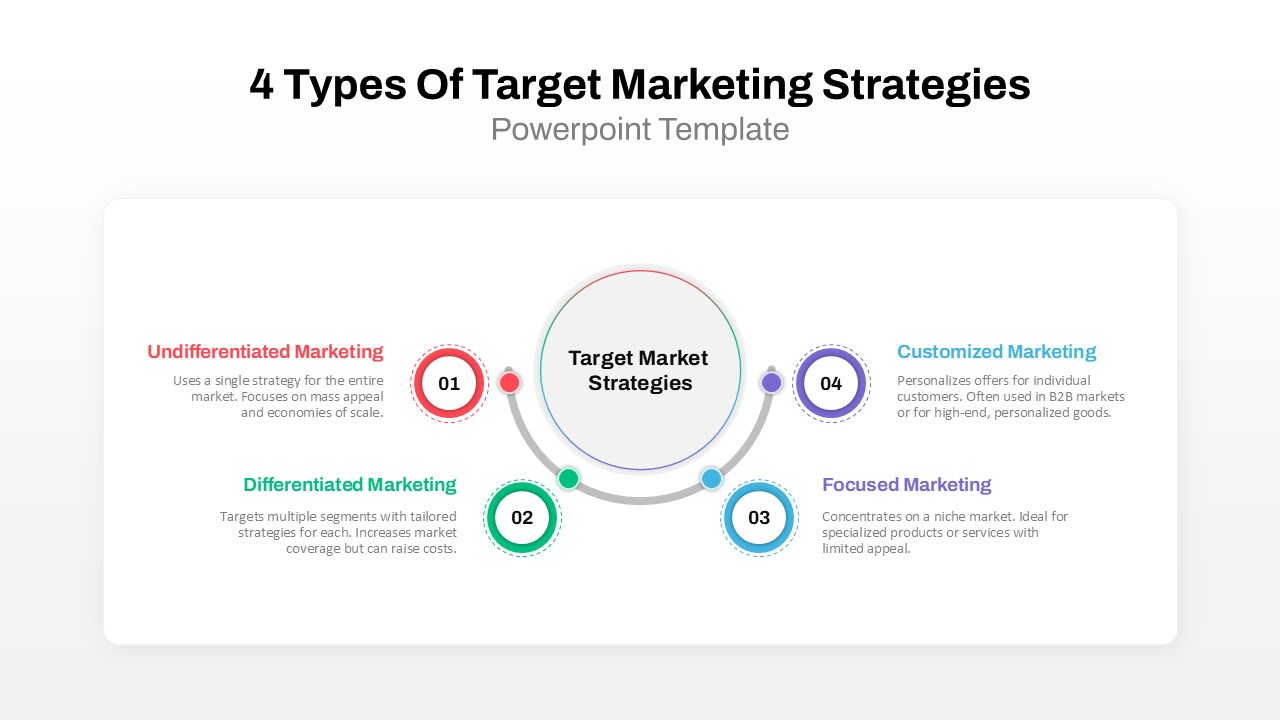
4 Types of Target Marketing Strategies PowerPoint Template for PowerPoint & Google Slides
Comparison
Be On The Target template for PowerPoint & Google Slides
Circular
Target Marketing template for PowerPoint & Google Slides
Business
Business Target Milestone Roadmap Template for PowerPoint & Google Slides
Roadmap
Sales Target Achievement Arrows Template for PowerPoint & Google Slides
Arrow
Target Achievement Milestone Curve Template for PowerPoint & Google Slides
Roadmap
Target Marketing Infographic Slide Pack Template for PowerPoint & Google Slides
Infographics
Target Marketing Infographic Callouts Template for PowerPoint & Google Slides
Circular
Education Target Achievement Infographic Template for PowerPoint & Google Slides
Goals
Goal Arrow and Target Infographic Template for PowerPoint & Google Slides
Goals
Target Goals Infographic Slide Template for PowerPoint & Google Slides
Goals
Shooting Target Process Infographic Template for PowerPoint & Google Slides
Process
Free Goal Setting Target Infographic Slide Template for PowerPoint & Google Slides
Goals
Free
Two-Box Analysis & Target Comparison Template for PowerPoint & Google Slides
Comparison

Revenue vs Target Growth Chart Template for PowerPoint & Google Slides
Revenue
Free Target Milestone Achievements Slide for PowerPoint & Google Slides
Accomplishment
Free
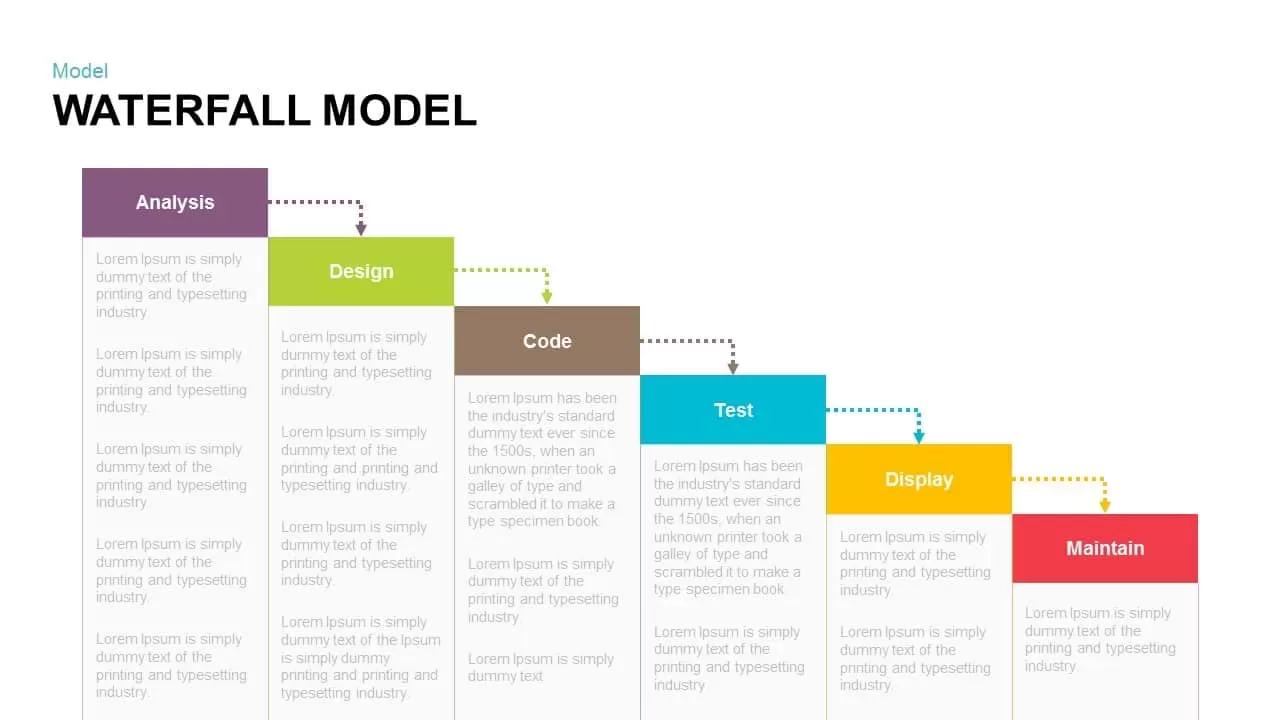
Waterfall Model Diagram Template for PowerPoint & Google Slides
Information Technology
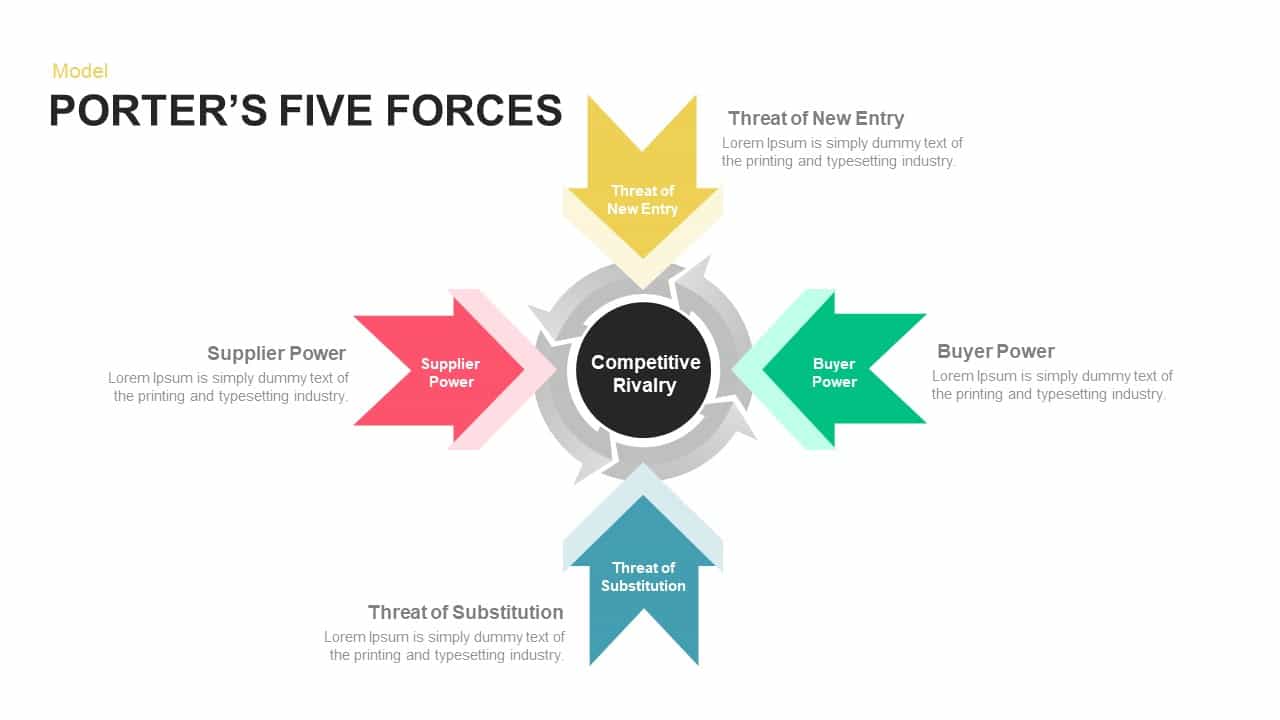
Porter’s Five Forces Model Diagram Template for PowerPoint & Google Slides
Competitor Analysis
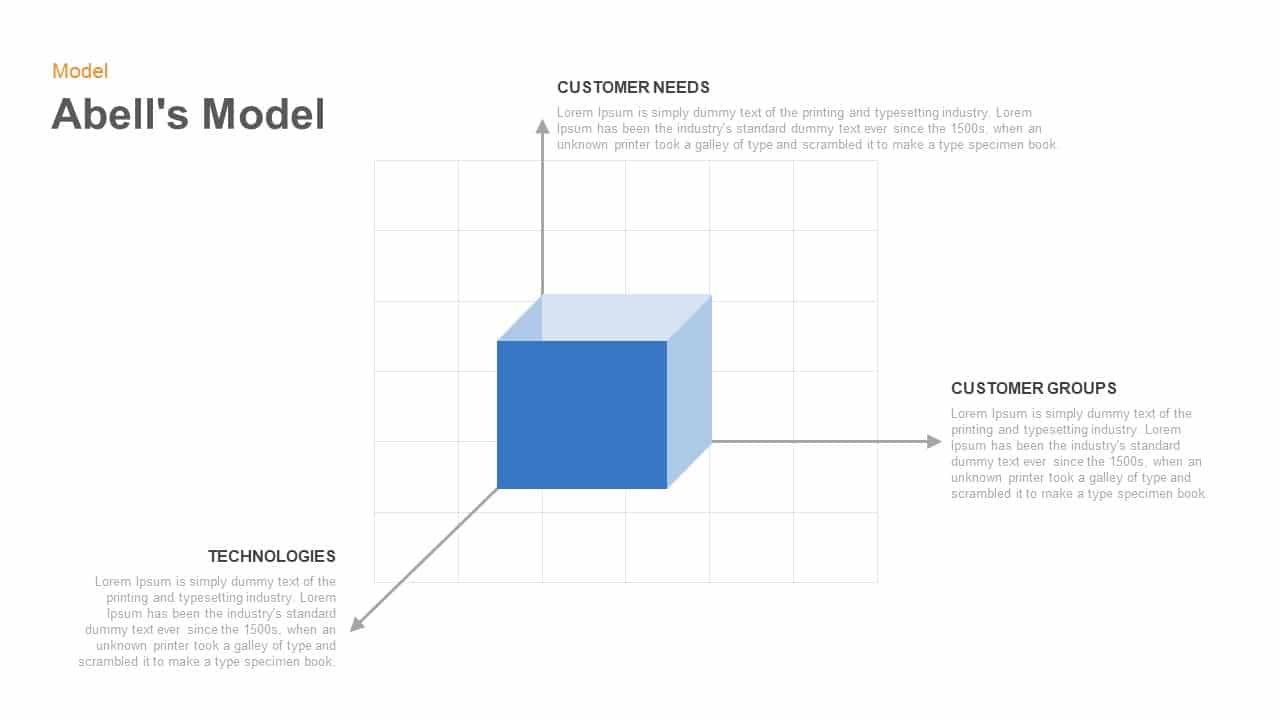
Abell’s 3D Cube Model Diagram Template for PowerPoint & Google Slides
Business Models

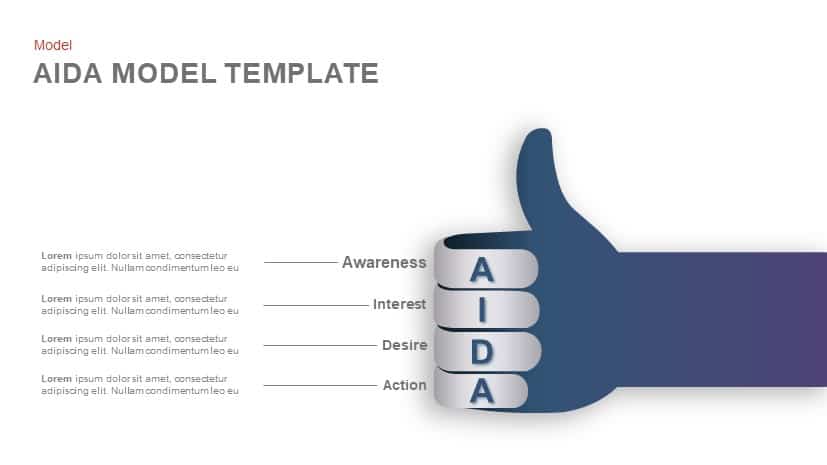
AIDA Model Funnel Thumb Diagram Template for PowerPoint & Google Slides
Process
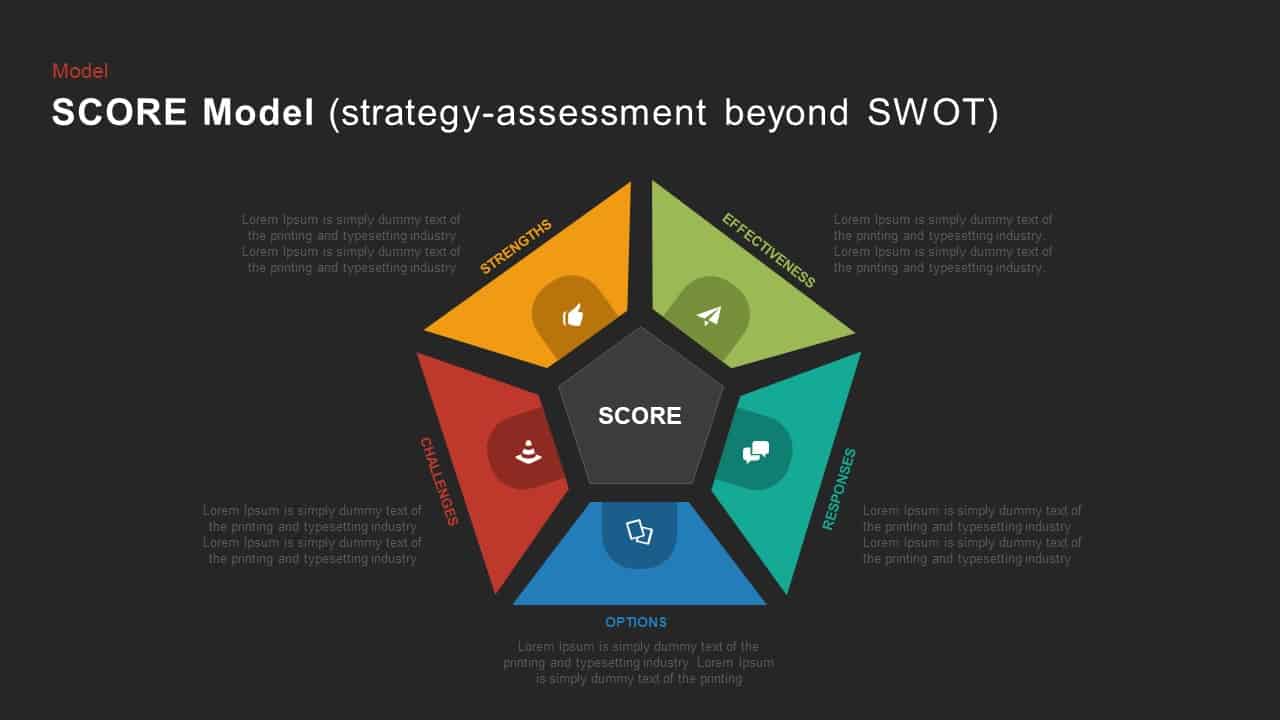
SCORE Model Pentagon Assessment Diagram Template for PowerPoint & Google Slides
Circular
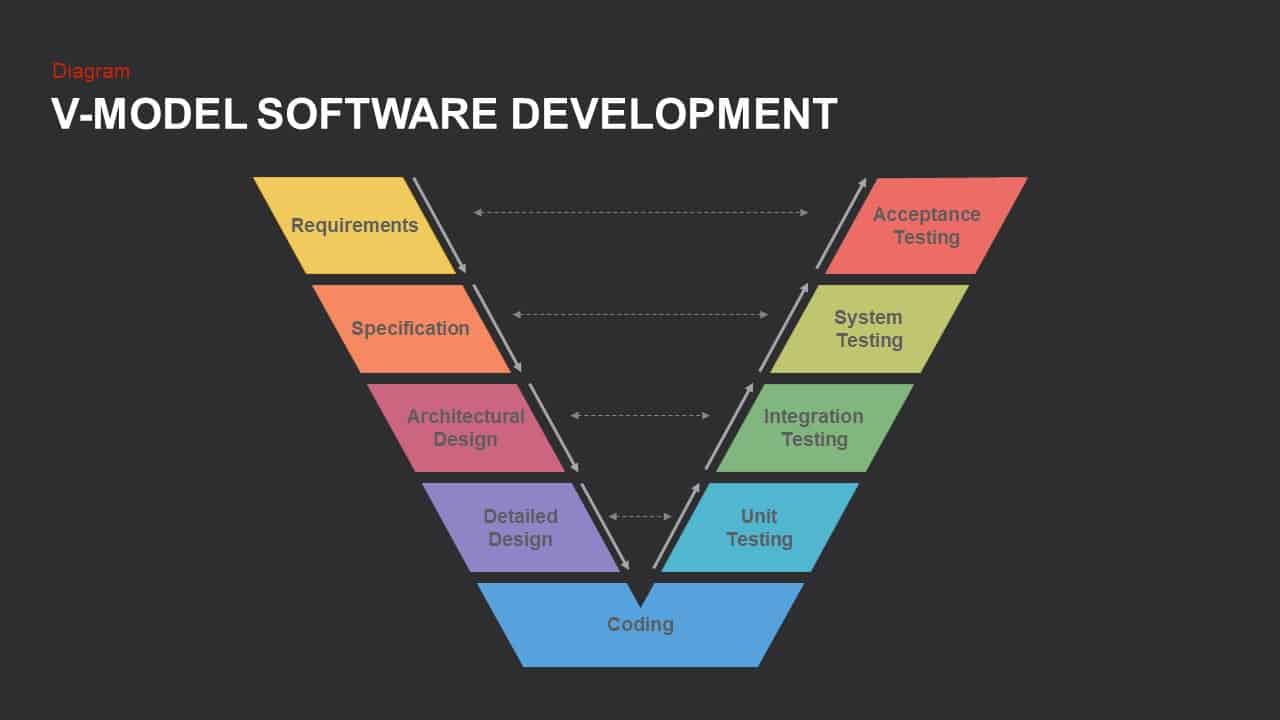
V-Model Software Development Diagram Template for PowerPoint & Google Slides
Software Development
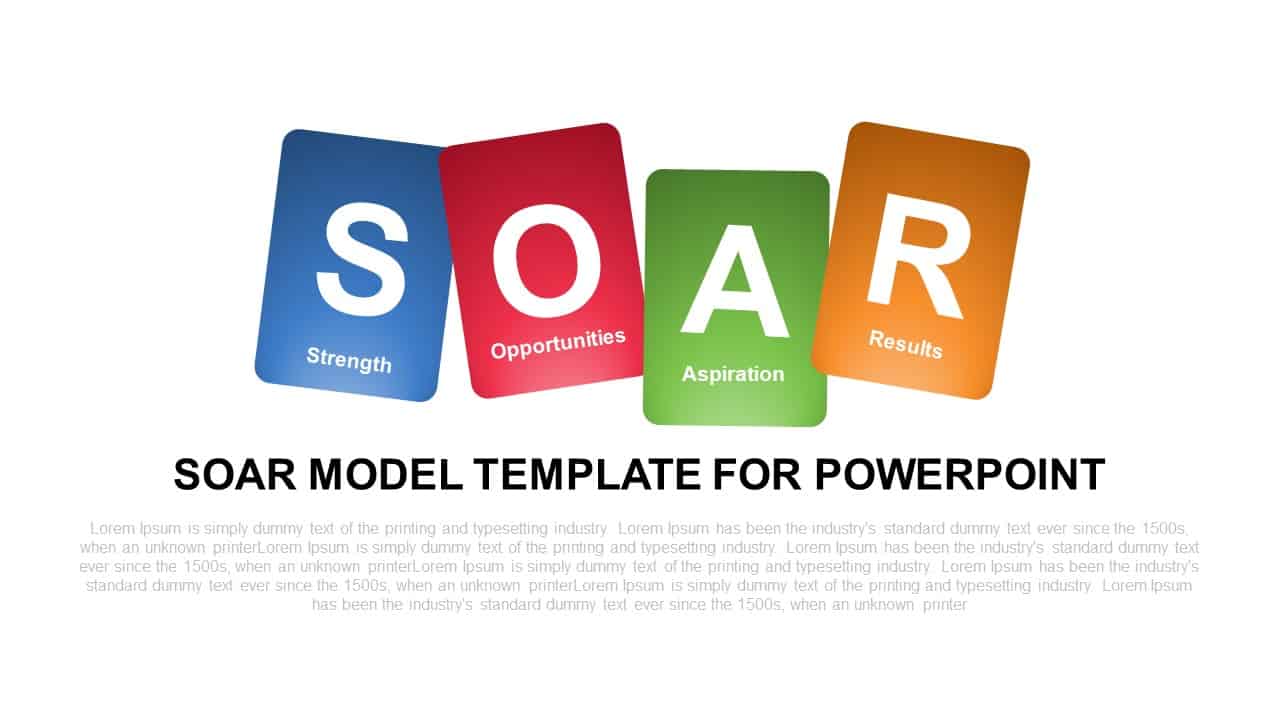
SOAR Strategic Model Card Diagram Template for PowerPoint & Google Slides
Process
4 Quadrant Model Diagram template for PowerPoint & Google Slides
Process
PESO Model Marketing Diagram Template for PowerPoint & Google Slides
Digital Marketing
Iterative Process Model Diagram Template for PowerPoint & Google Slides
Process
Greiner Growth Model Six-Phase Diagram Template for PowerPoint & Google Slides
Business Models
ADDIE Model Hub and Spoke Diagram Template for PowerPoint & Google Slides
Process
Four-Phase Maturity Model Diagram Template for PowerPoint & Google Slides
Process
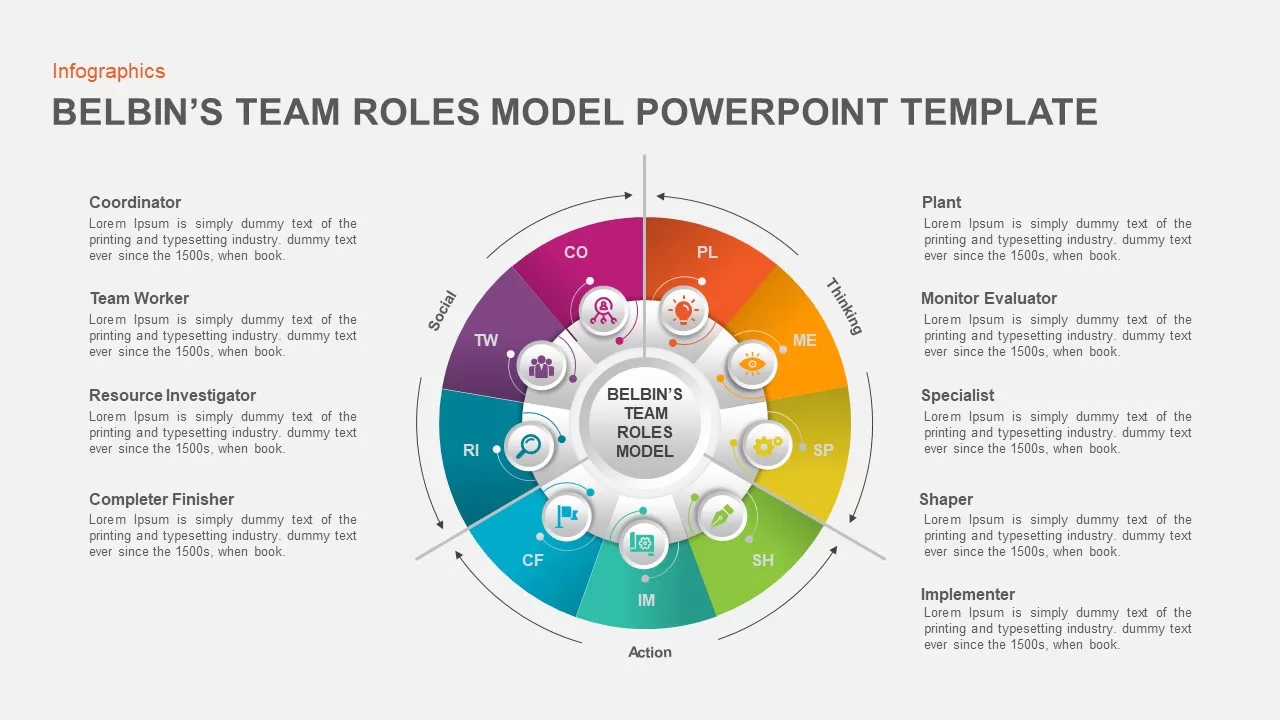
Belbin’s Team Roles Model Diagram Template for PowerPoint & Google Slides
HR
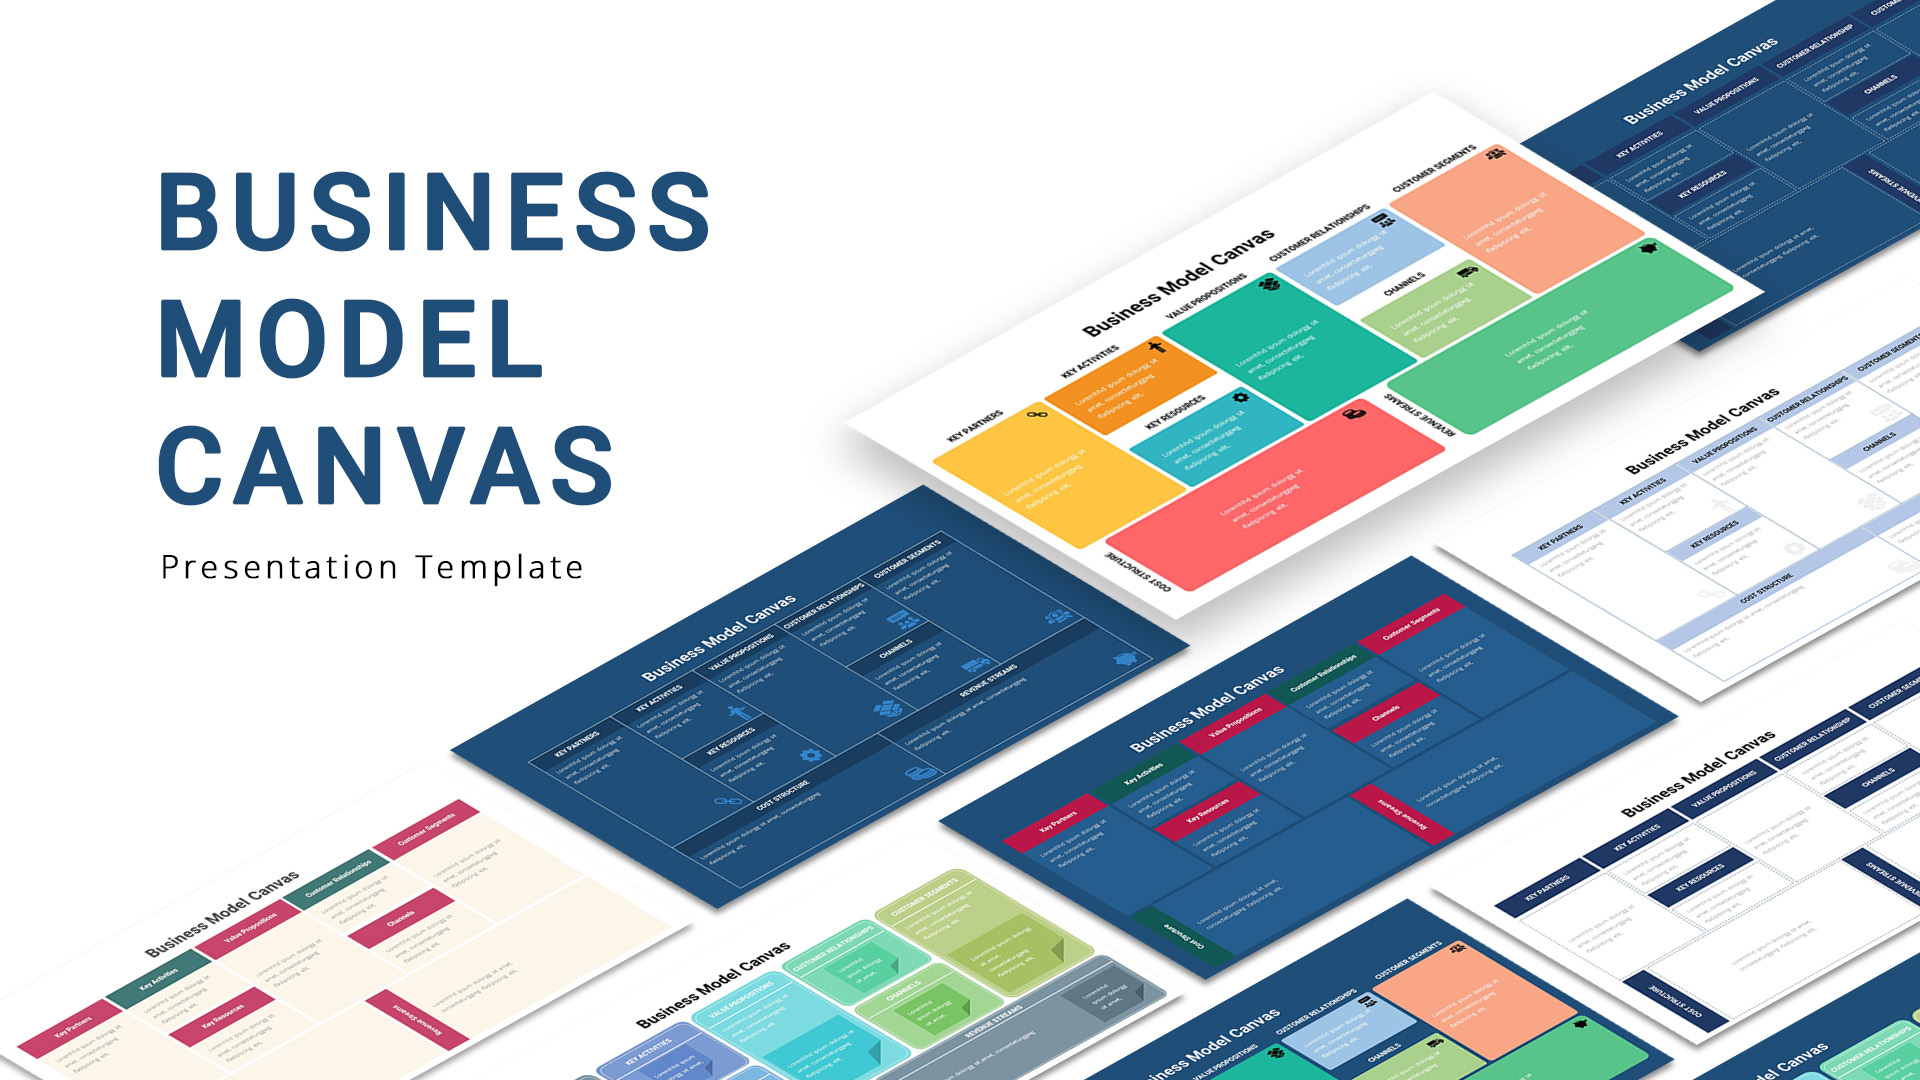
Business Model Canvas Diagram Template for PowerPoint & Google Slides
Business Models
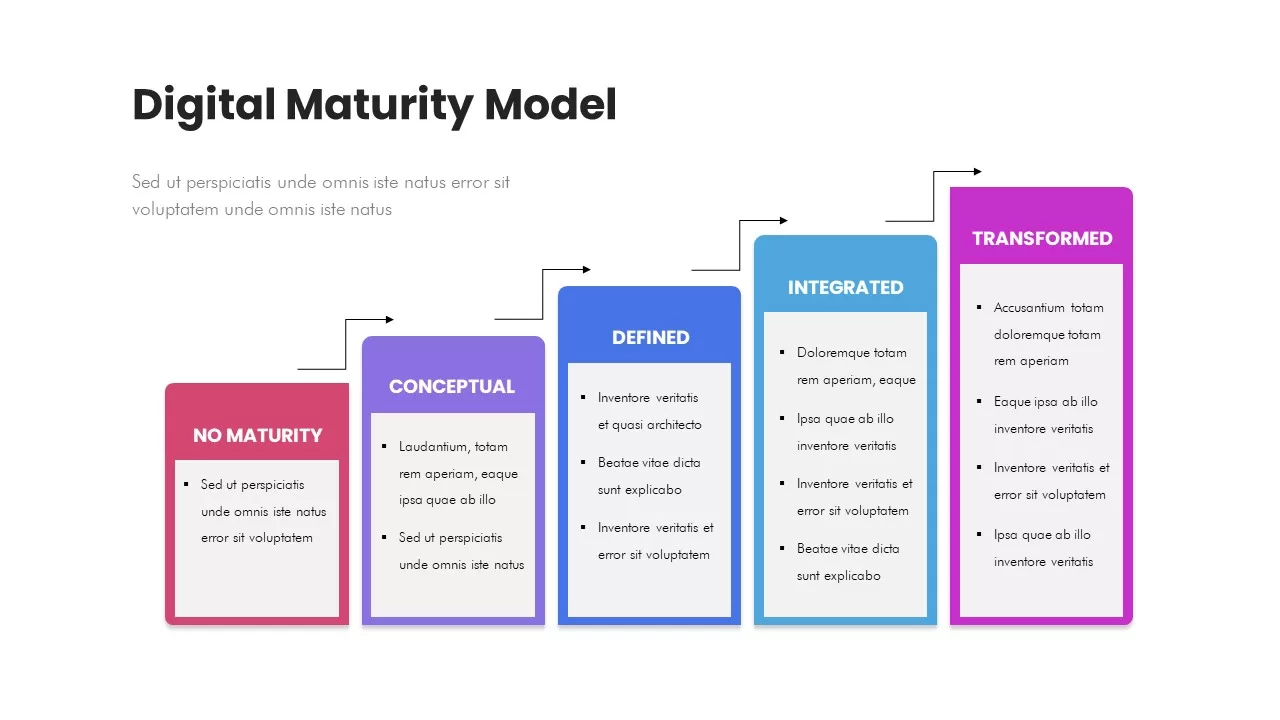
Digital Maturity Model Stages Diagram Template for PowerPoint & Google Slides
Process
Five-Stage Digital Maturity Model Diagram Template for PowerPoint & Google Slides
Process
Business Strategy House Model Diagram Template for PowerPoint & Google Slides
Business Strategy
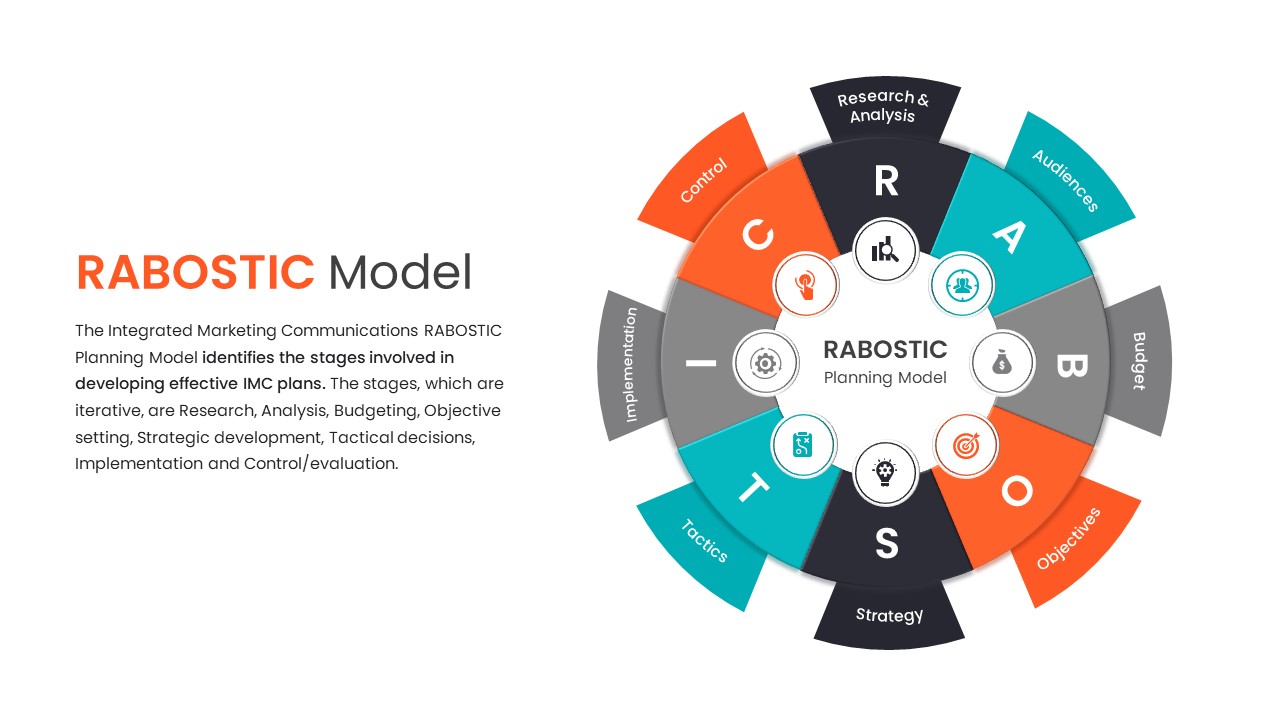
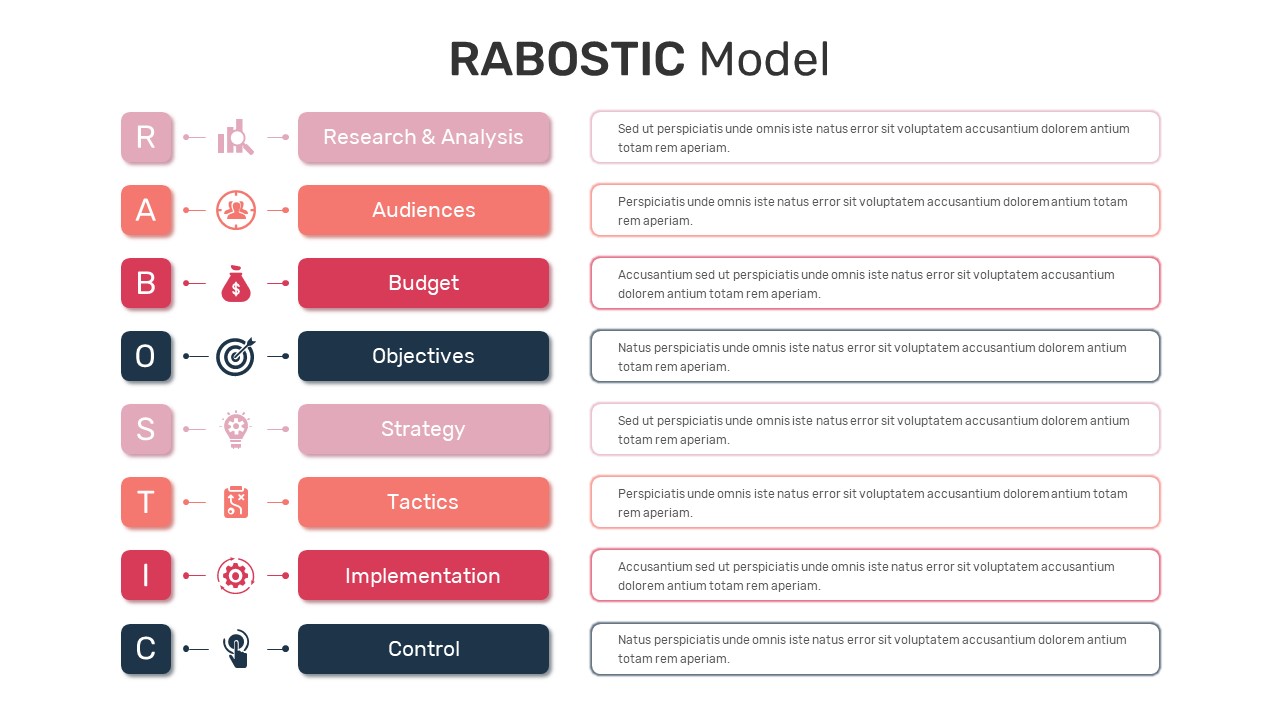
RABOSTIC IMC Planning Model Diagram Template for PowerPoint & Google Slides
Process
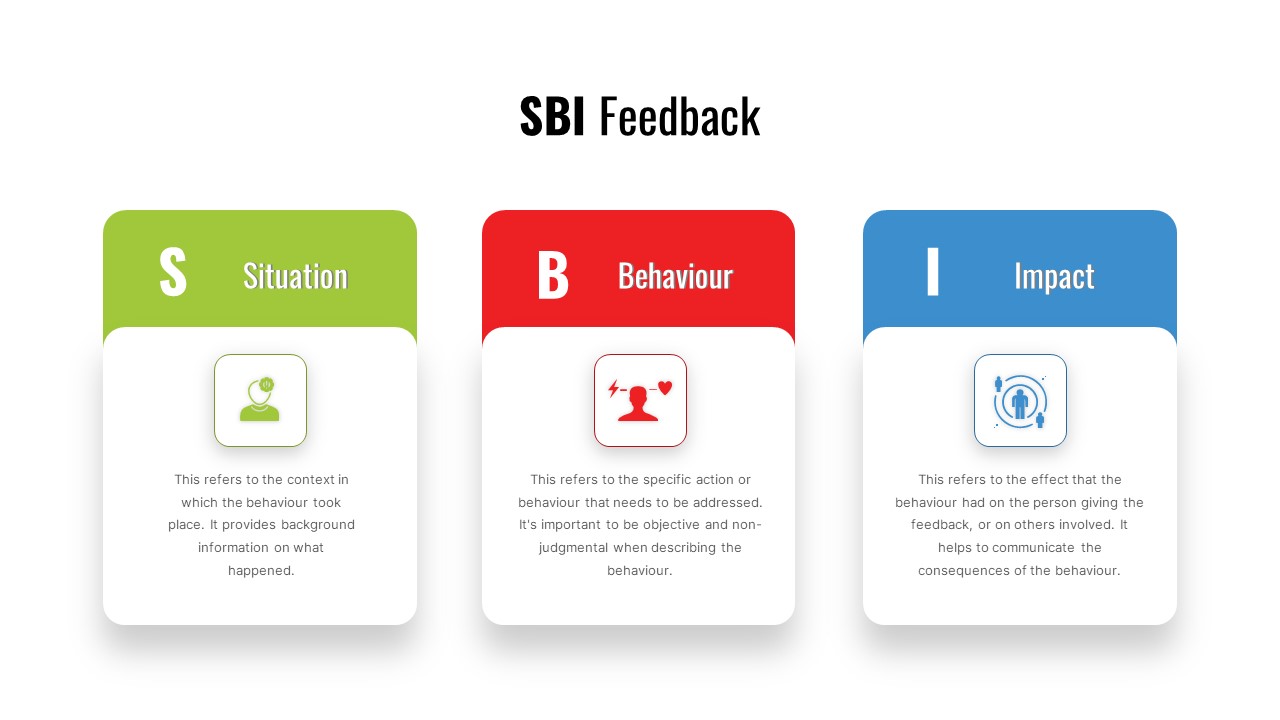
SBI Feedback Model Process Diagram Template for PowerPoint & Google Slides
Process
RABOSTIC Marketing Model Process Diagram Template for PowerPoint & Google Slides
Process
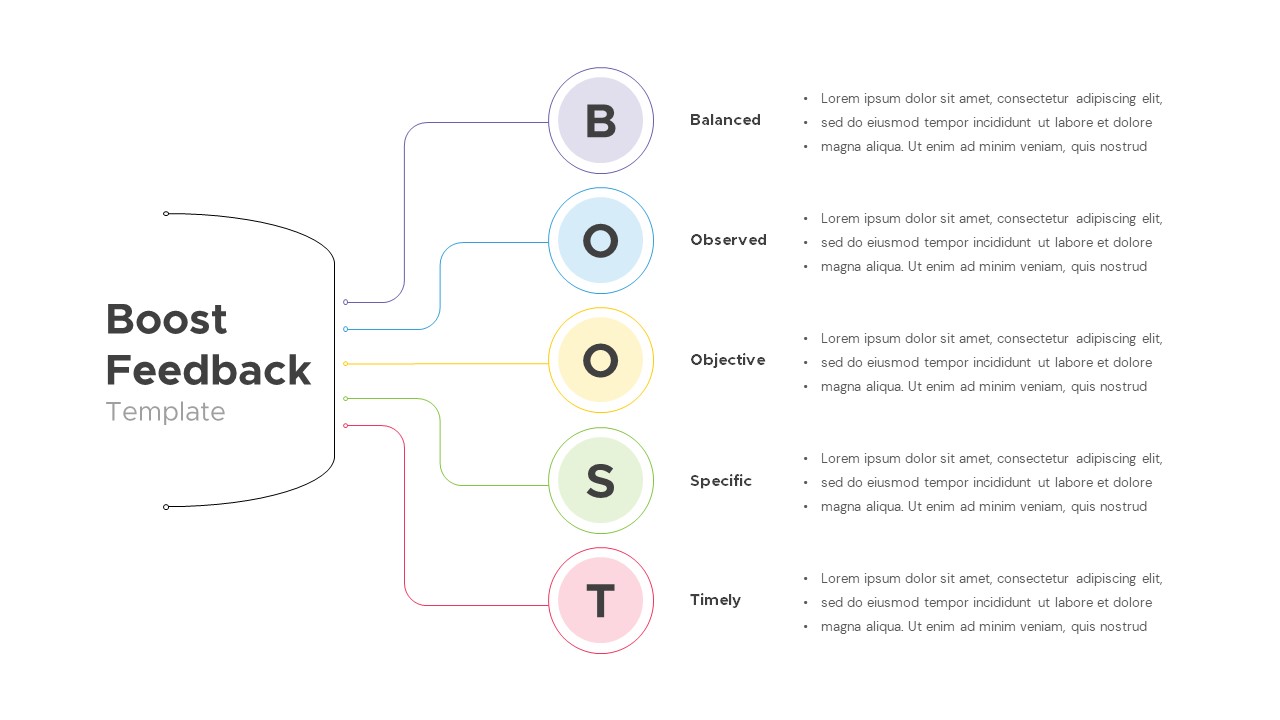
Interactive Boost Feedback Model Diagram Template for PowerPoint & Google Slides
Process
Organizational Maturity Model Diagram Template for PowerPoint & Google Slides
Process
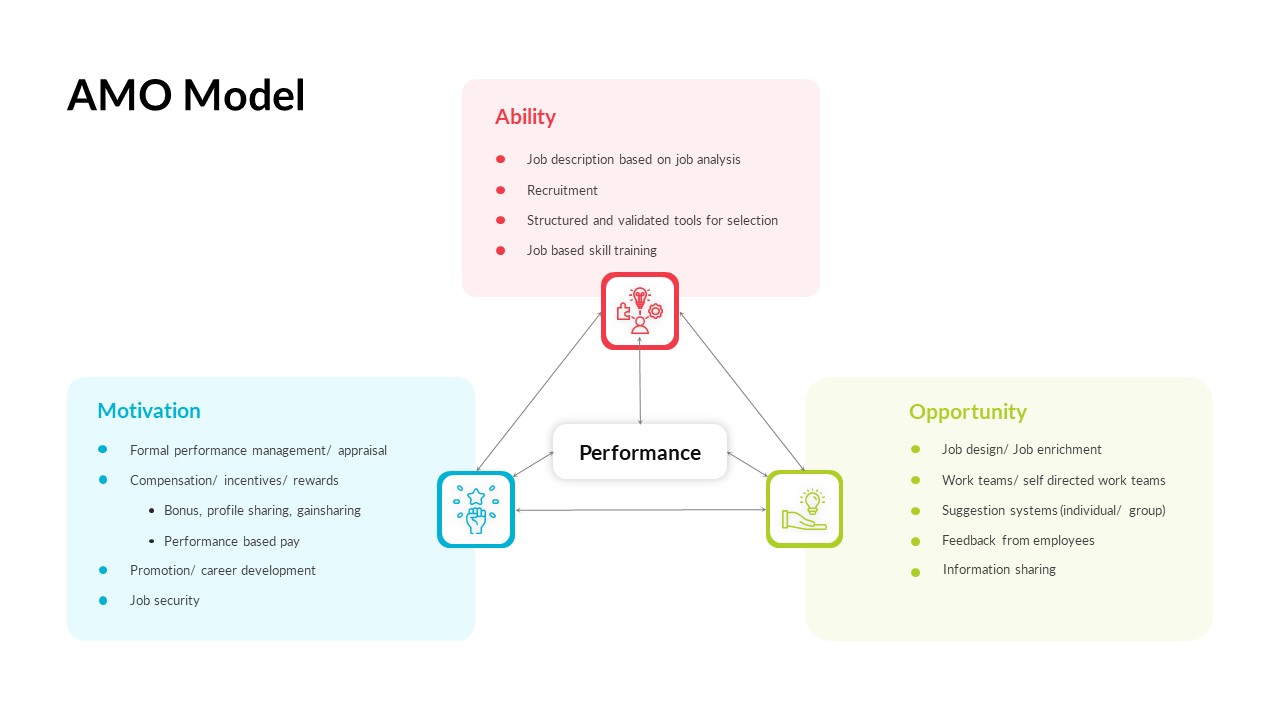
AMO Performance Model Feedback Diagram Template for PowerPoint & Google Slides
Employee Performance
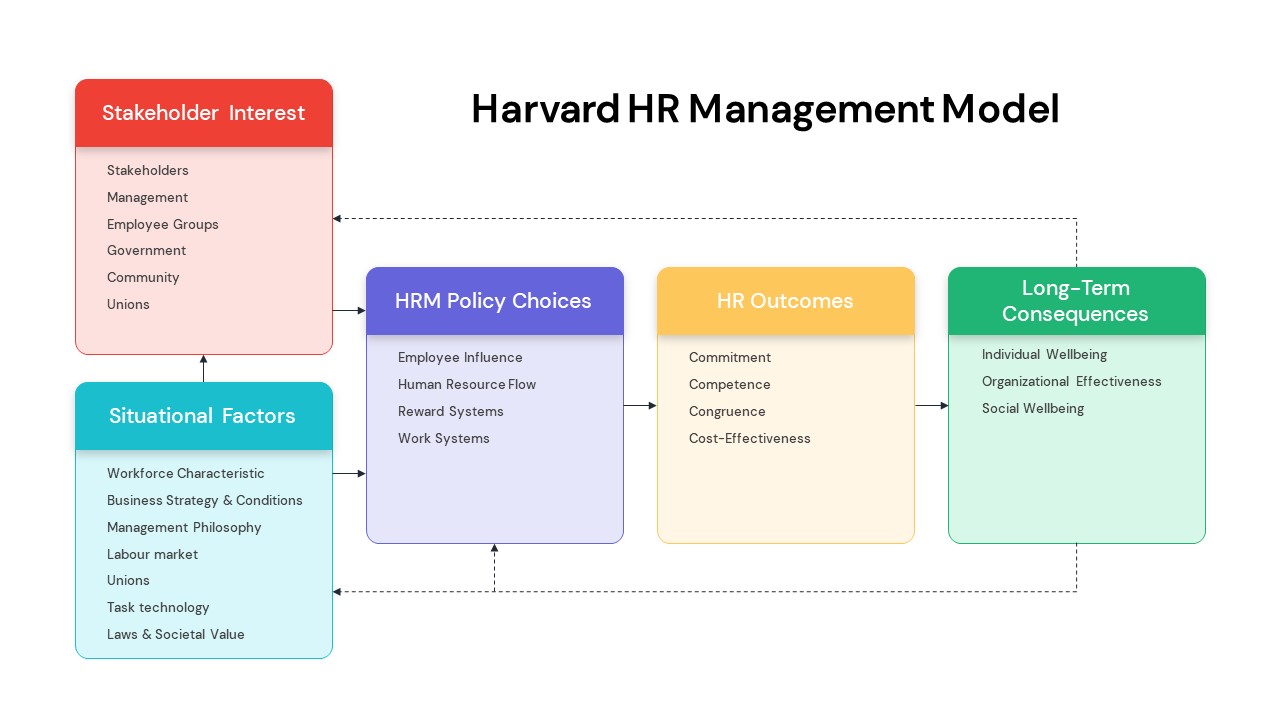
Harvard HR Management Model Diagram Template for PowerPoint & Google Slides
Process
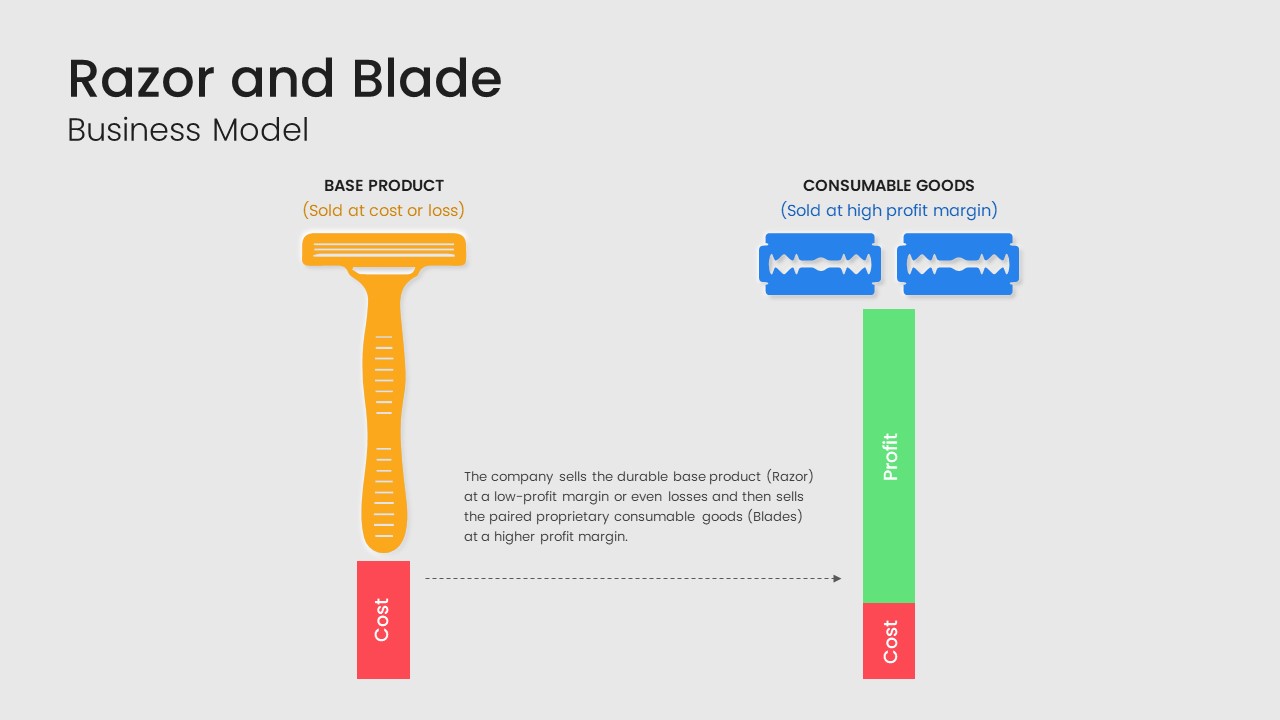
Razor and Blade Business Model Diagram Template for PowerPoint & Google Slides
Business Models
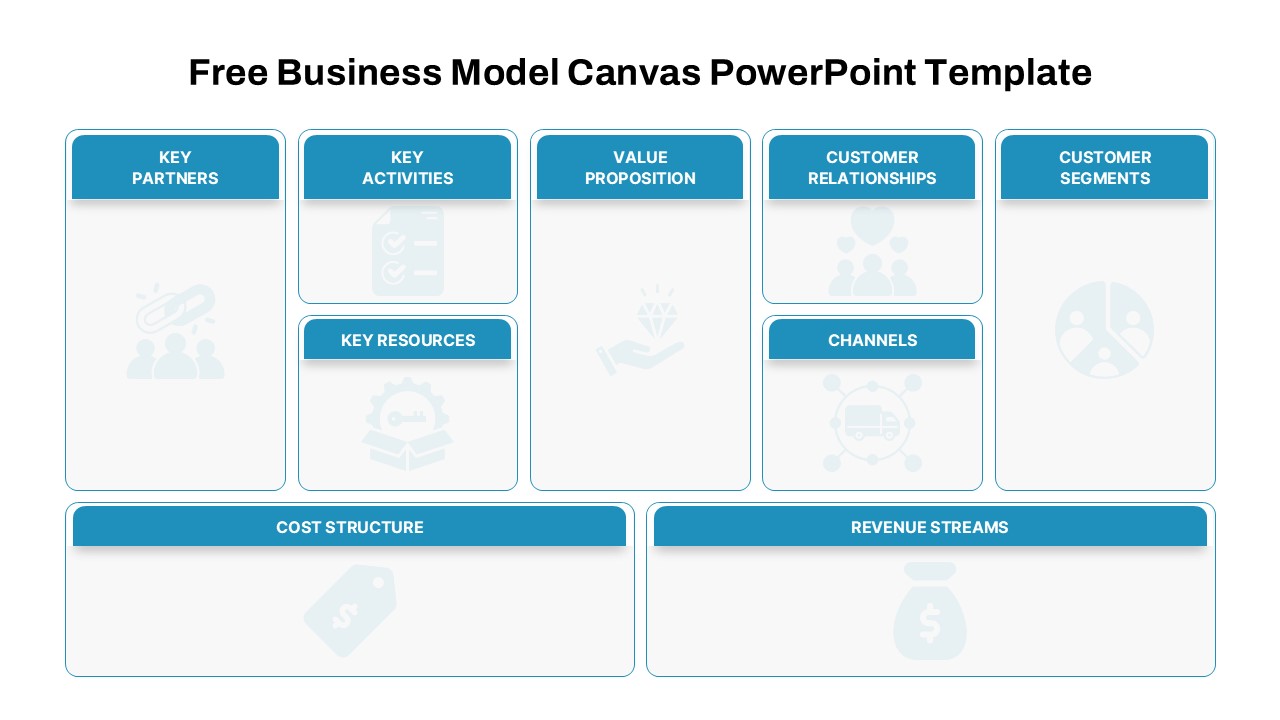
Free Business Model Canvas Diagram Slide Template for PowerPoint & Google Slides
Business Models
Free
Salience Model Venn Diagram Infographic Template for PowerPoint & Google Slides
Circular
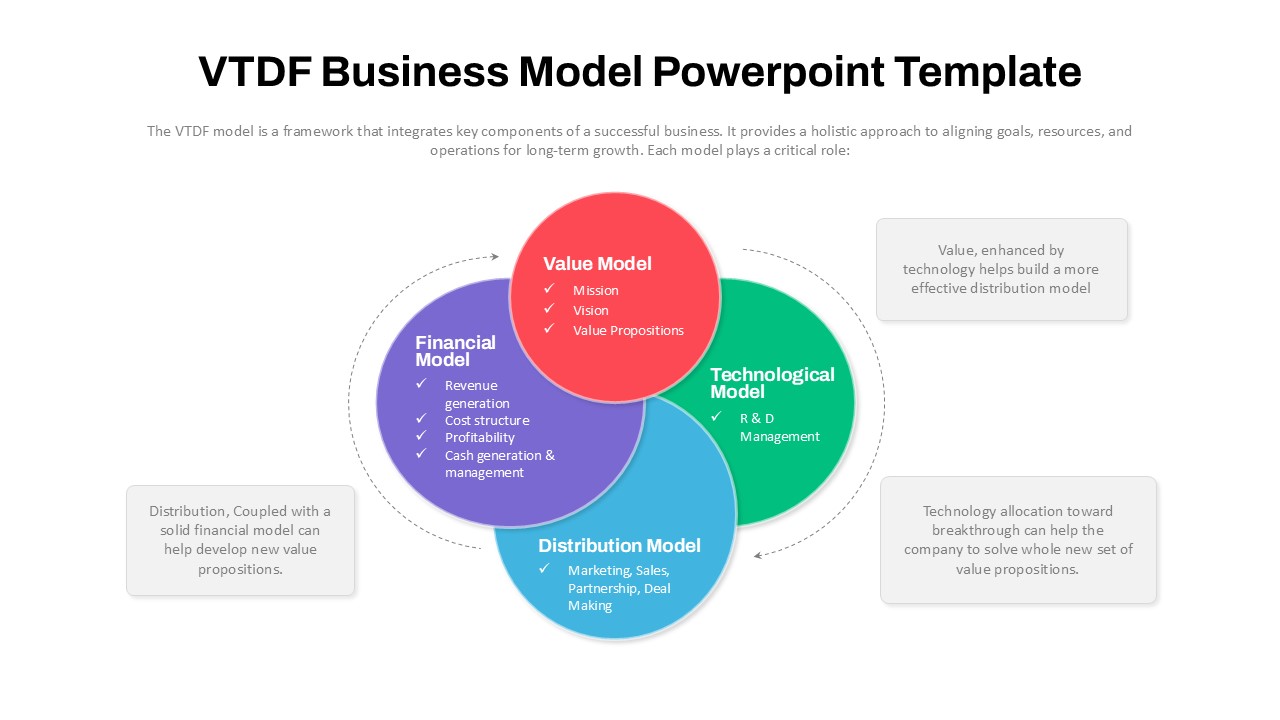
VTDF Business Model Framework Diagram Template for PowerPoint & Google Slides
Business Models
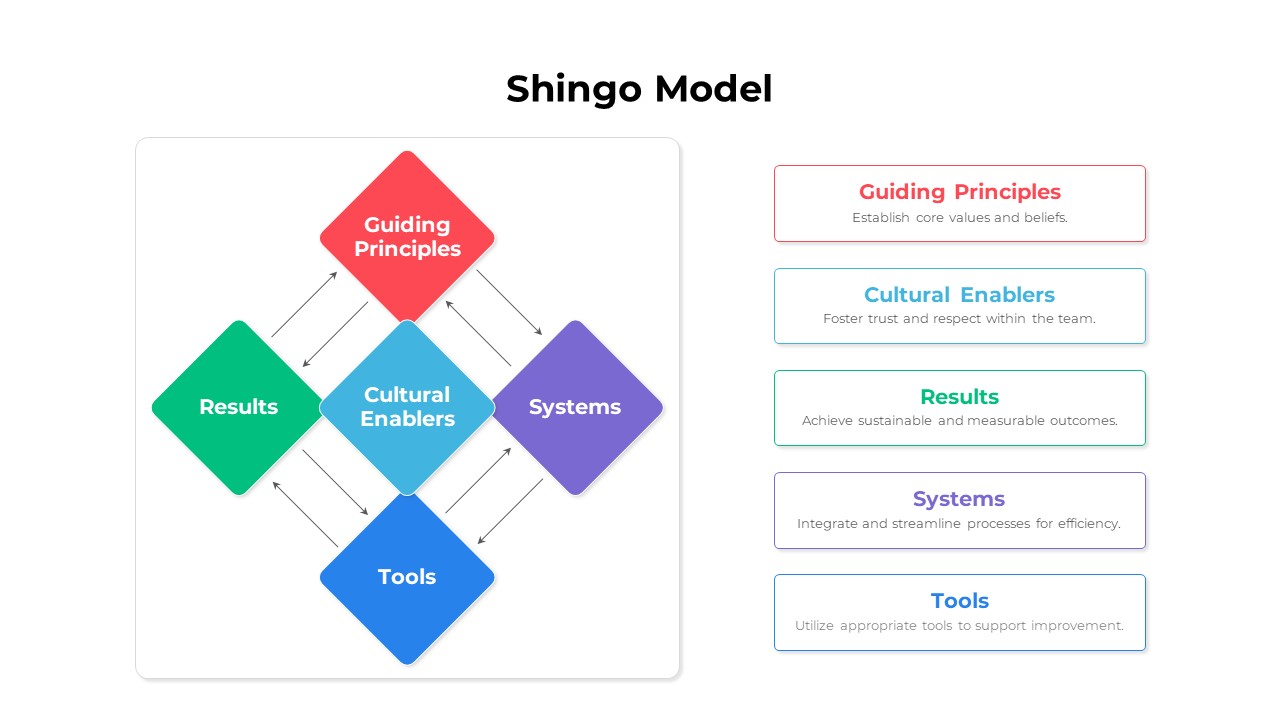
Shingo Model Diagram Template for PowerPoint & Google Slides
Process
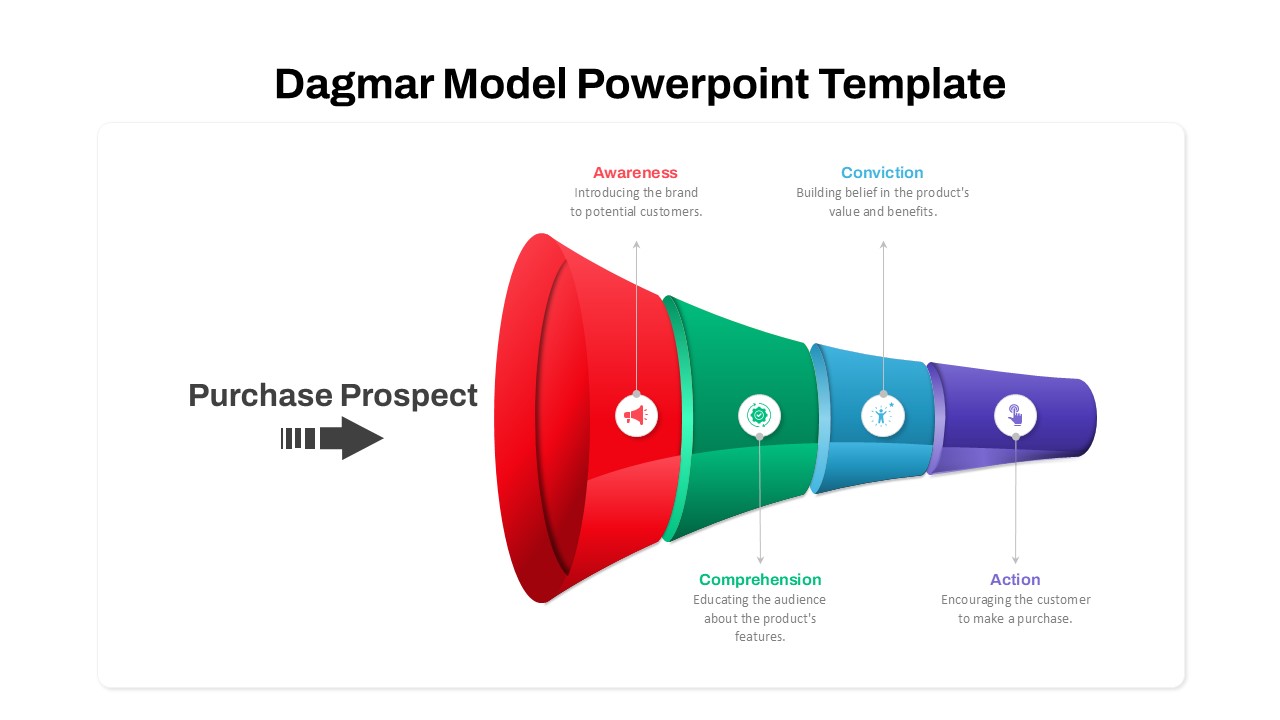
Dagmar Model Marketing Funnel Diagram Template for PowerPoint & Google Slides
Funnel
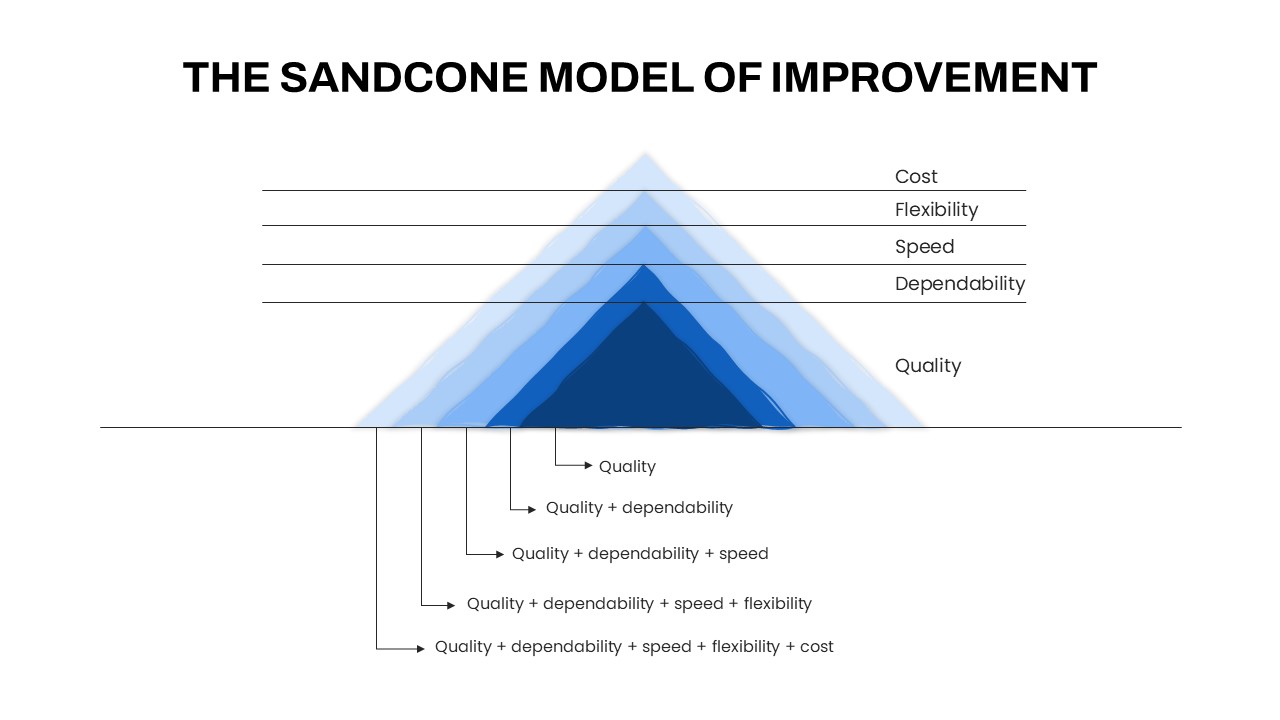
Sandcone Model of Improvement Diagram Template for PowerPoint & Google Slides
Pyramid
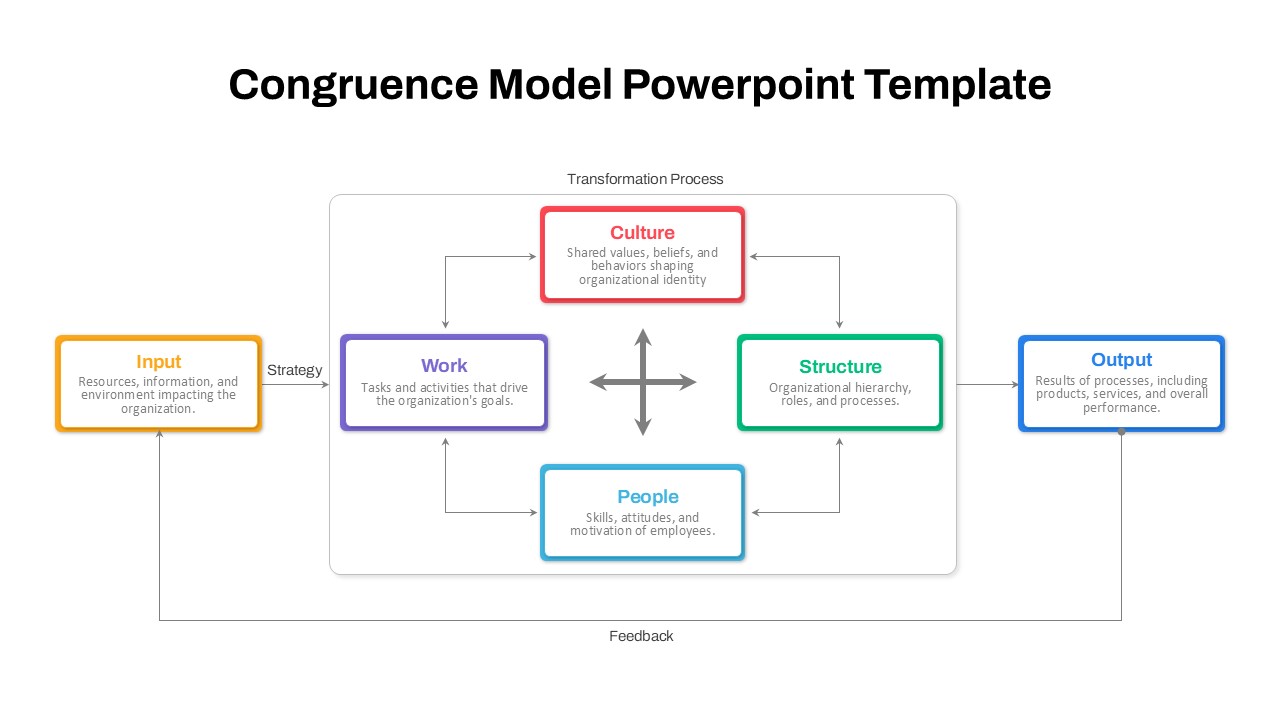
Organizational Congruence Model Diagram Template for PowerPoint & Google Slides
Process
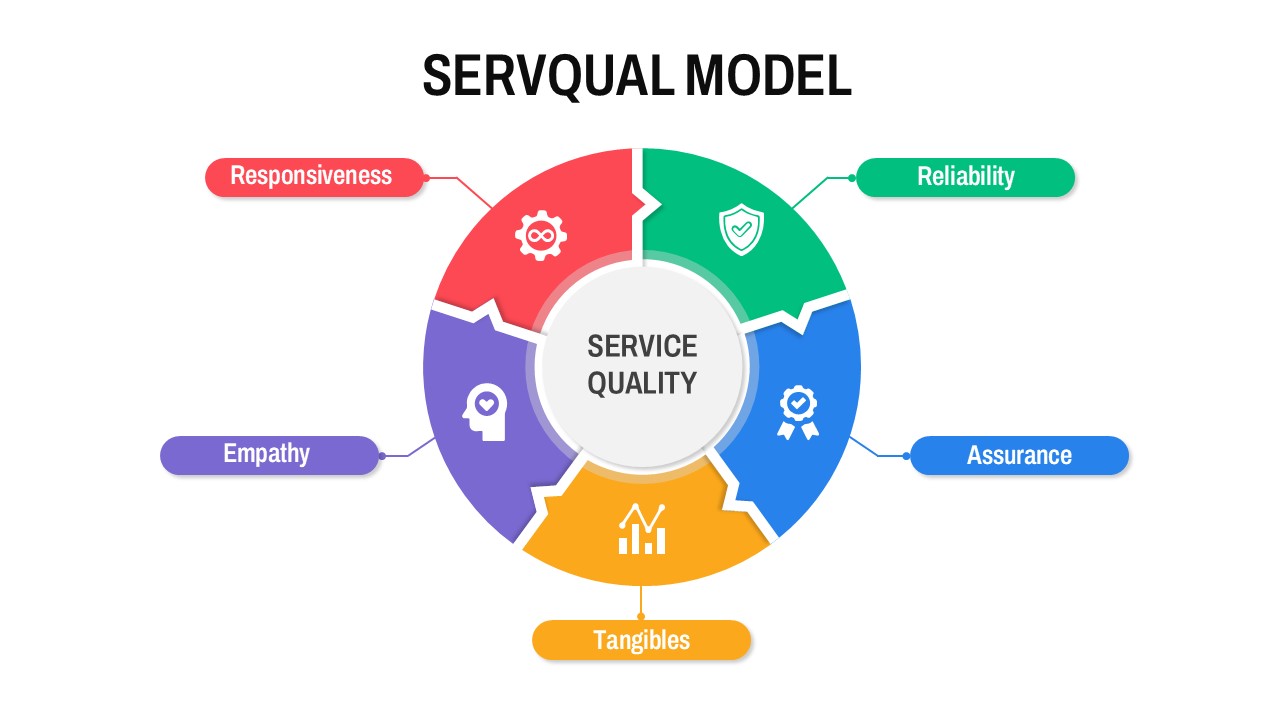
Circular SERVQUAL Model Diagram Template for PowerPoint & Google Slides
Business Strategy
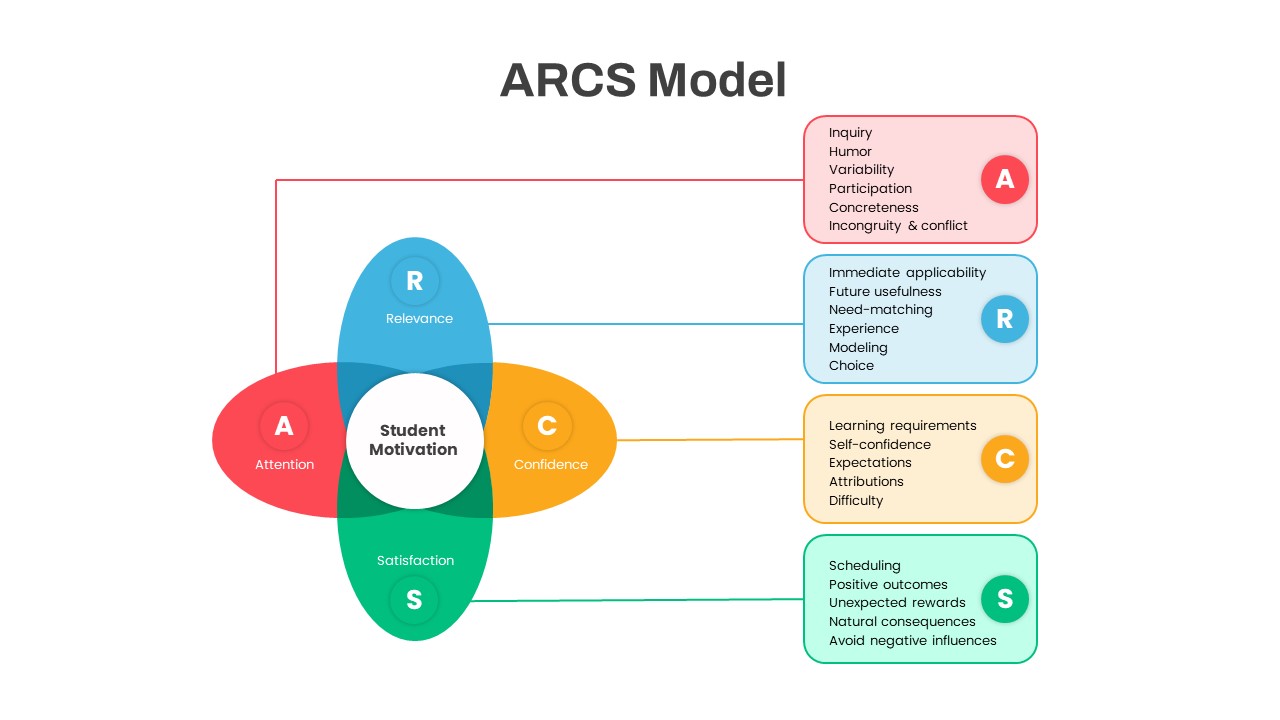
ARCS Student Motivation Model Diagram Template for PowerPoint & Google Slides
Process
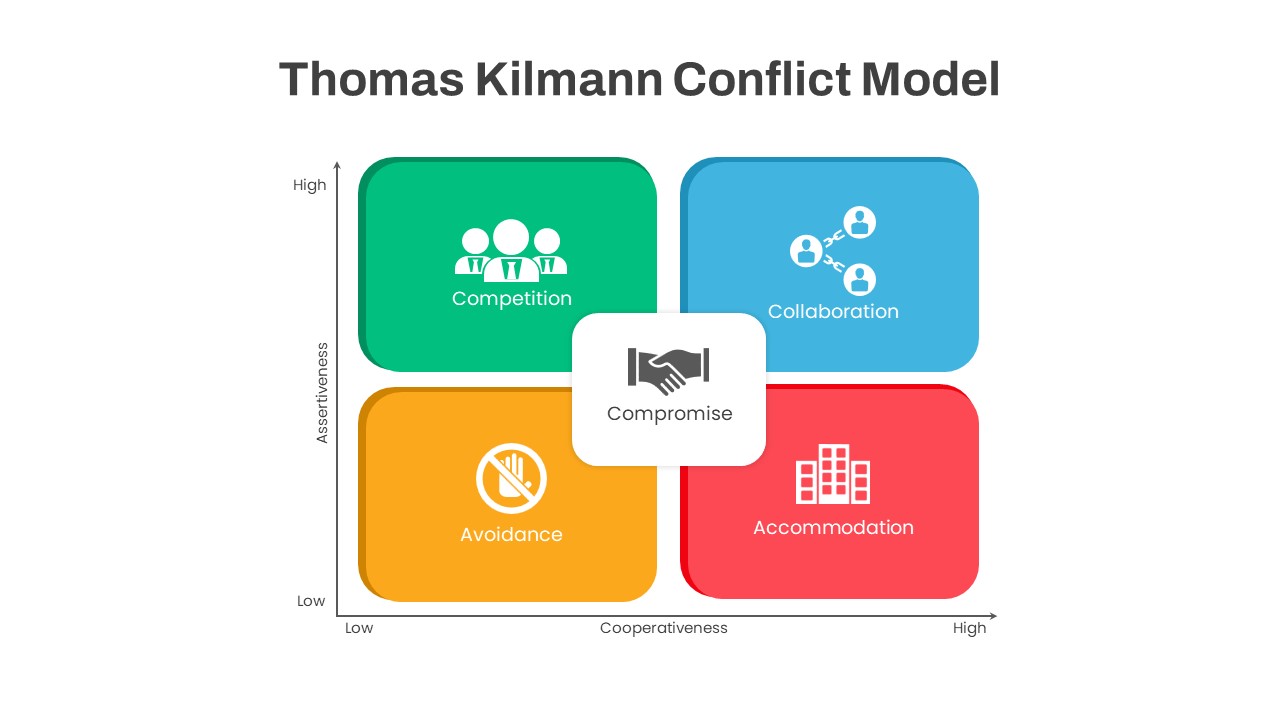
Thomas Kilmann Conflict Model Diagram Template for PowerPoint & Google Slides
Leadership
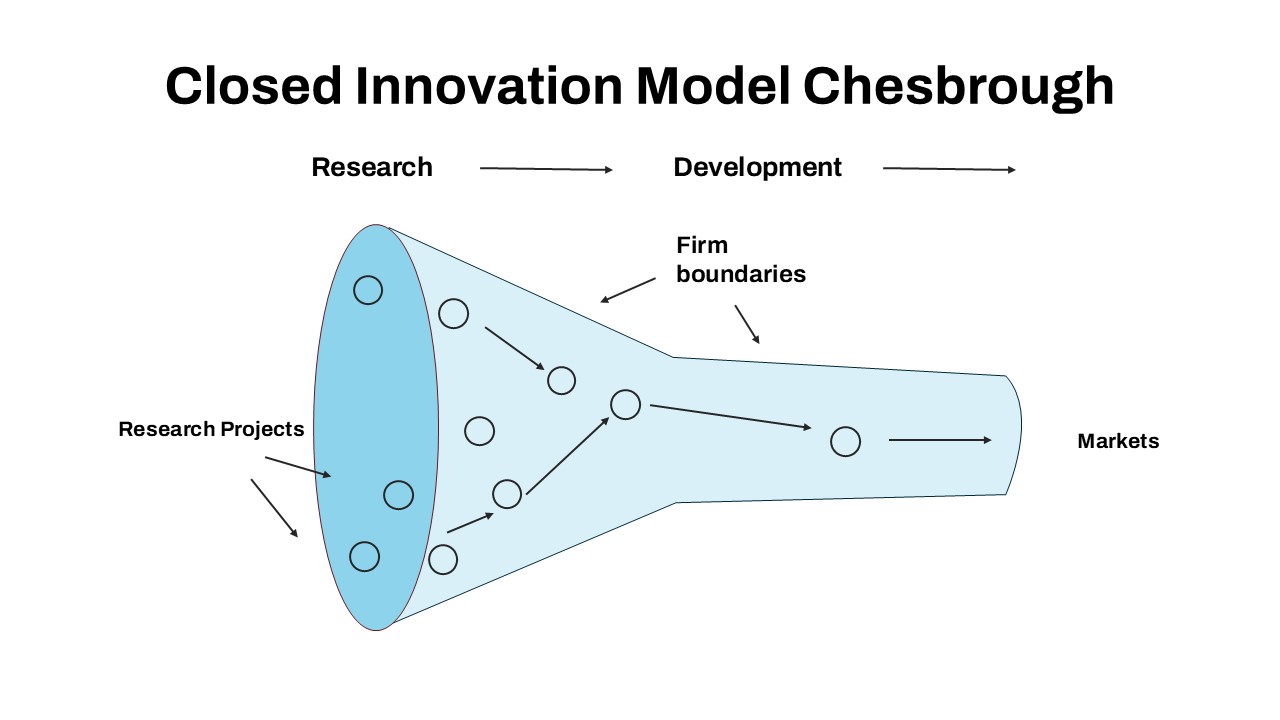
Closed Innovation Model Funnel Diagram Template for PowerPoint & Google Slides
Funnel
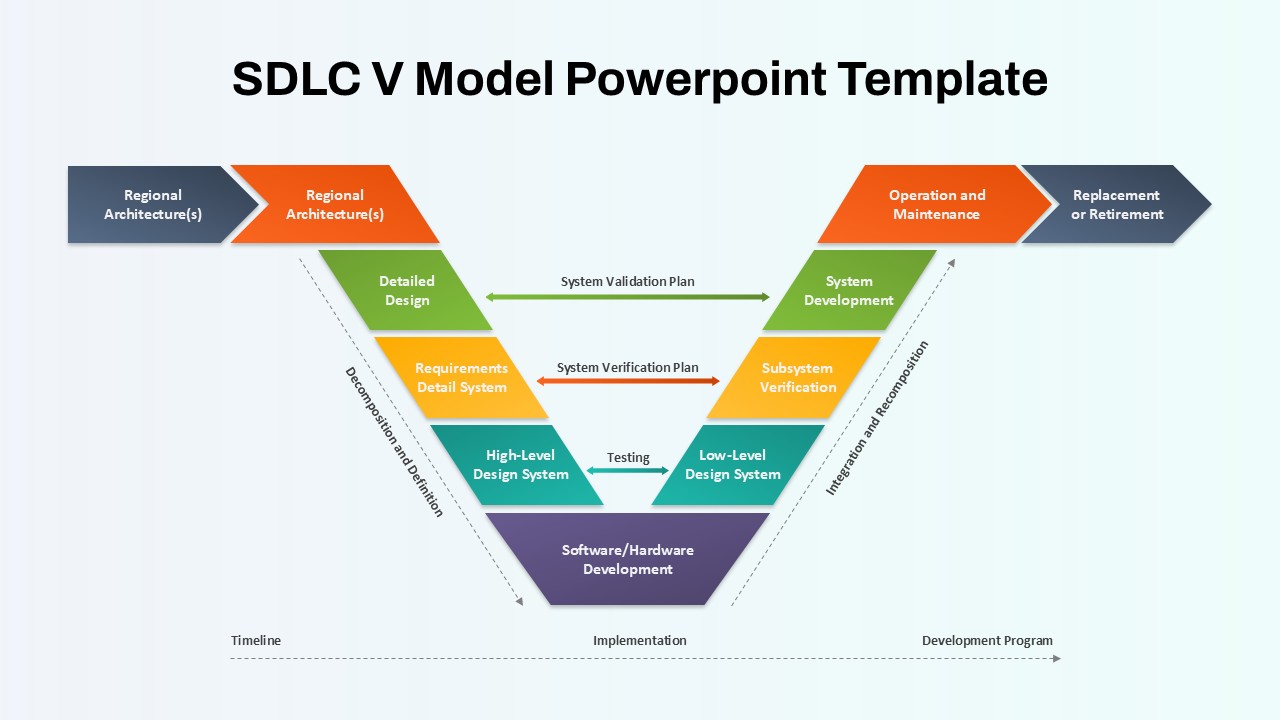
SDLC V Model Lifecycle Diagram Template for PowerPoint & Google Slides
Process
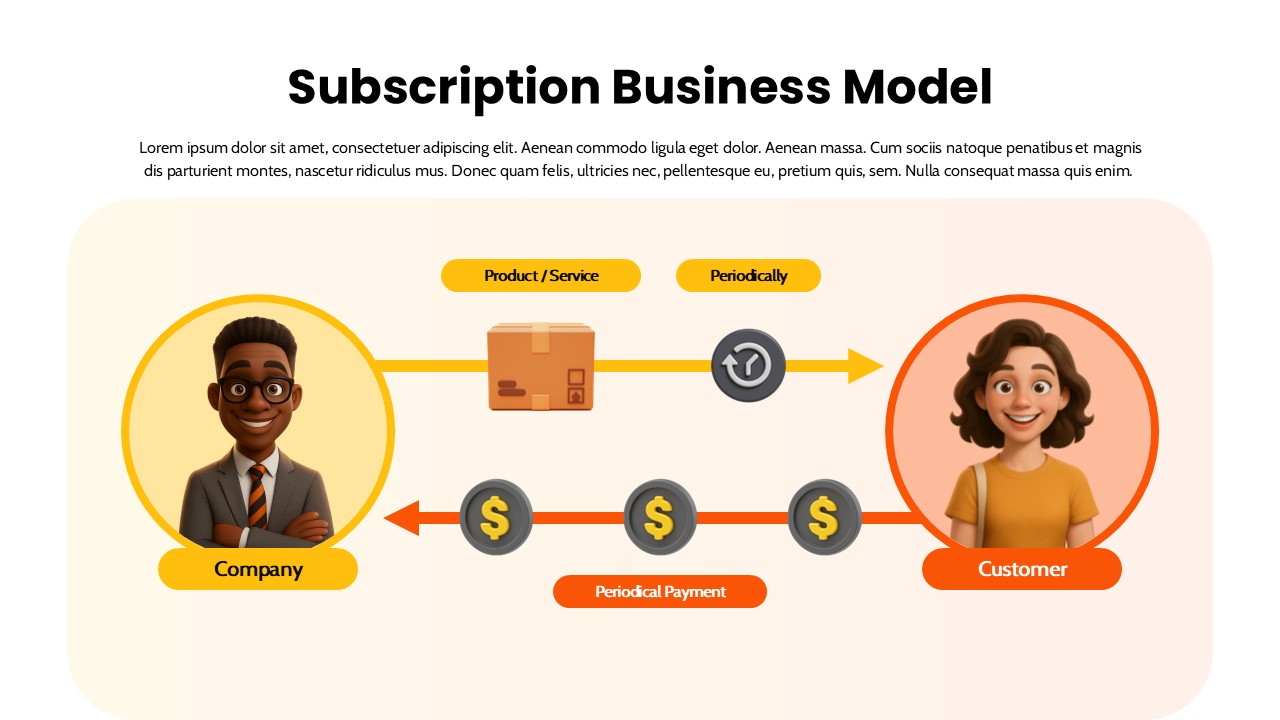
Subscription Business Model Flow Diagram Template for PowerPoint & Google Slides
Business Models
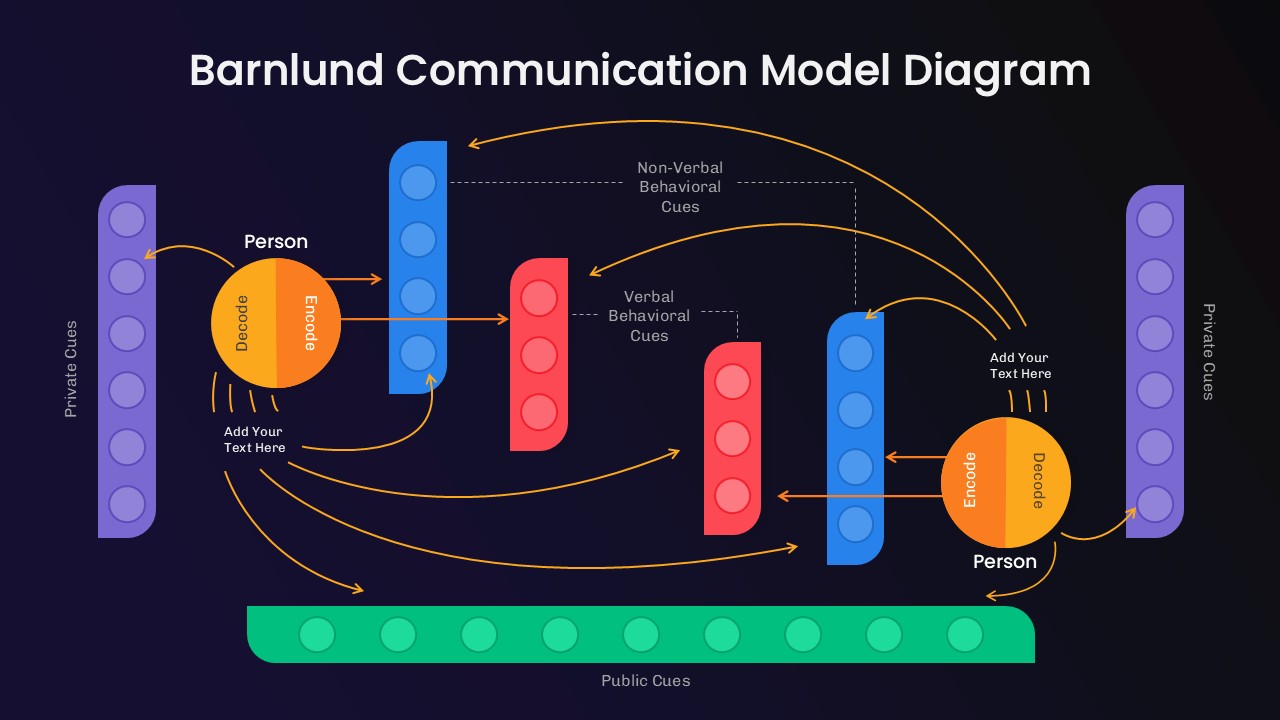
Barnlund Communication Model Diagram Template for PowerPoint & Google Slides
Process
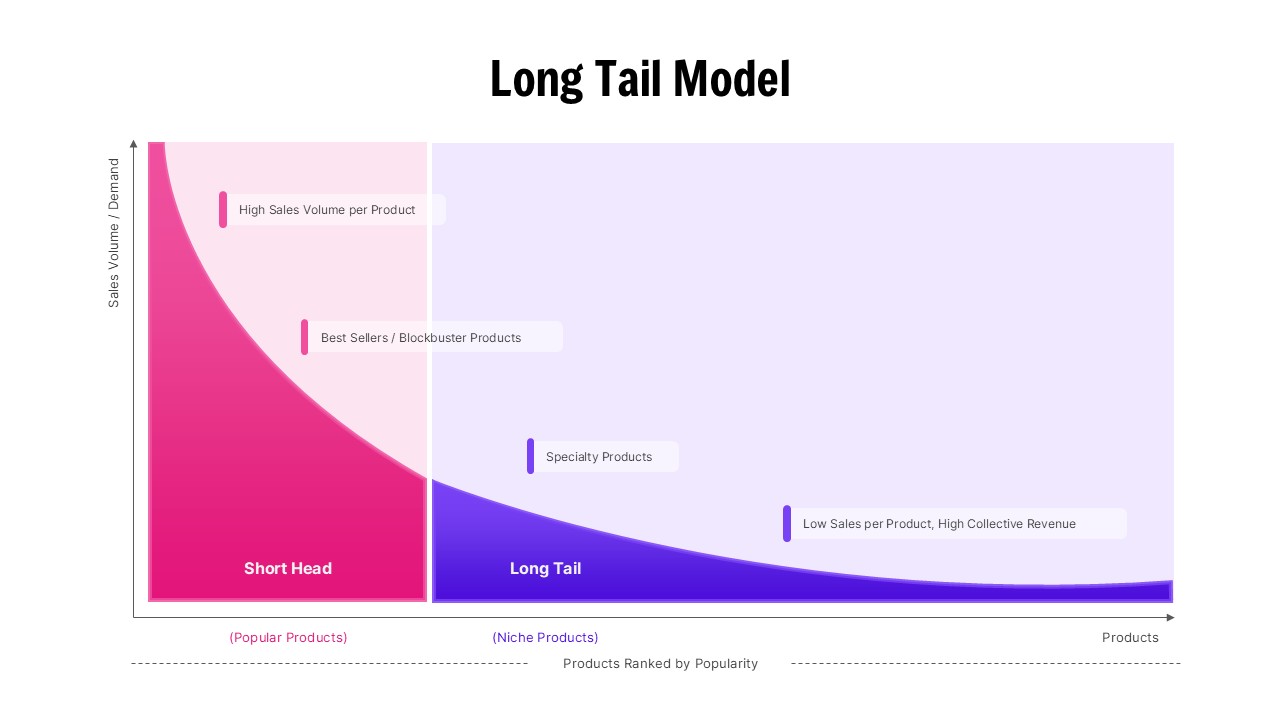
Long Tail Model Business Strategy Diagram Template for PowerPoint & Google Slides
Business
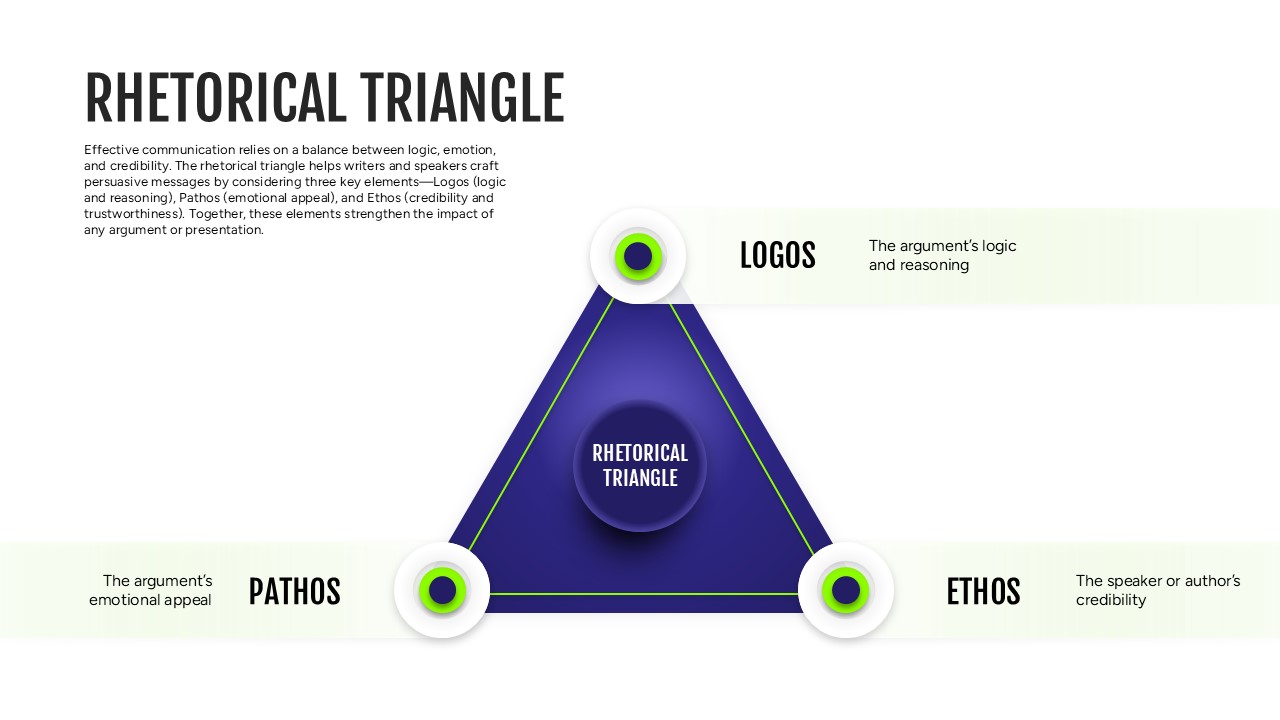
Rhetorical Triangle Model Diagram Template for PowerPoint & Google Slides
Leadership
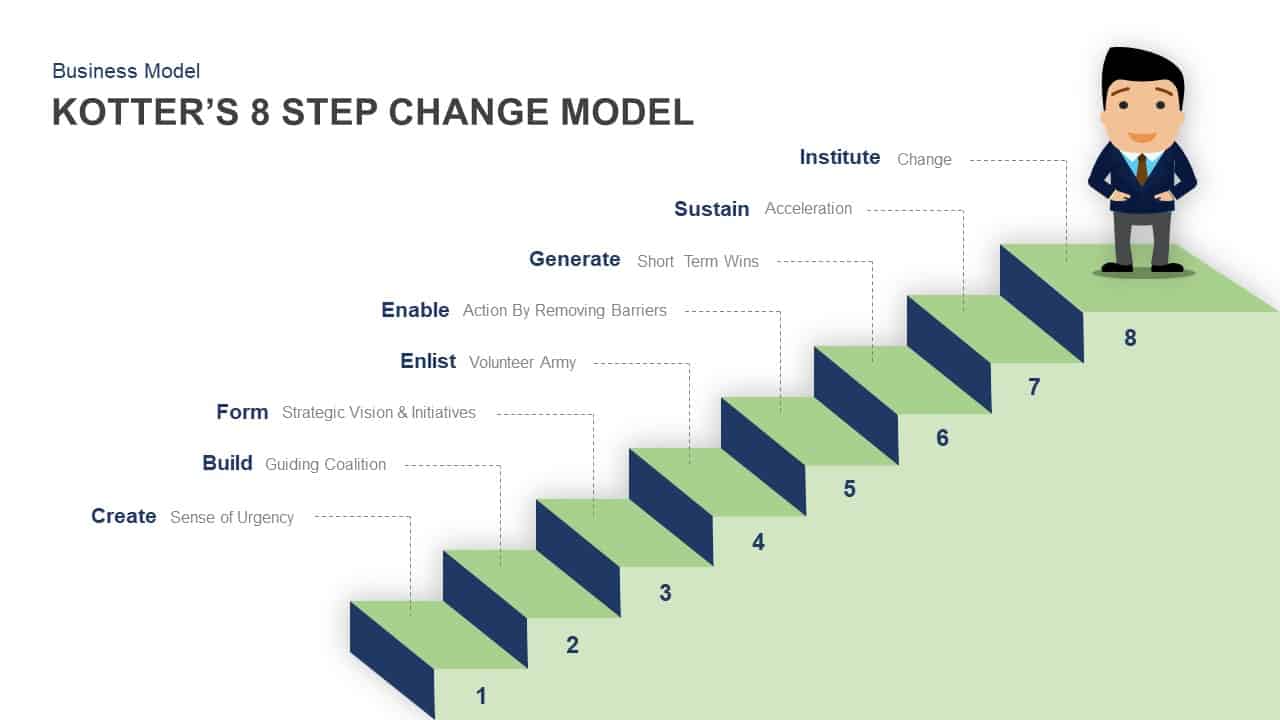
Kotter’s 8 Step Change Model Diagram for PowerPoint & Google Slides
Business Models
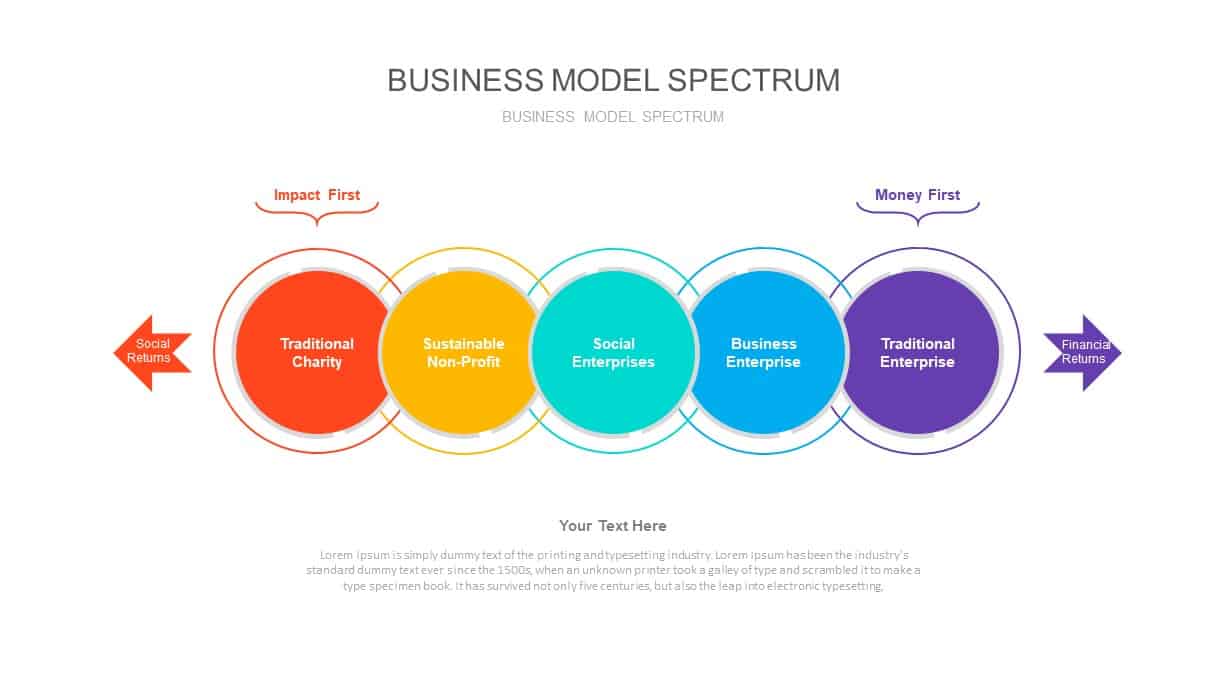
Business Model Spectrum Diagram Pack for PowerPoint & Google Slides
Business Models
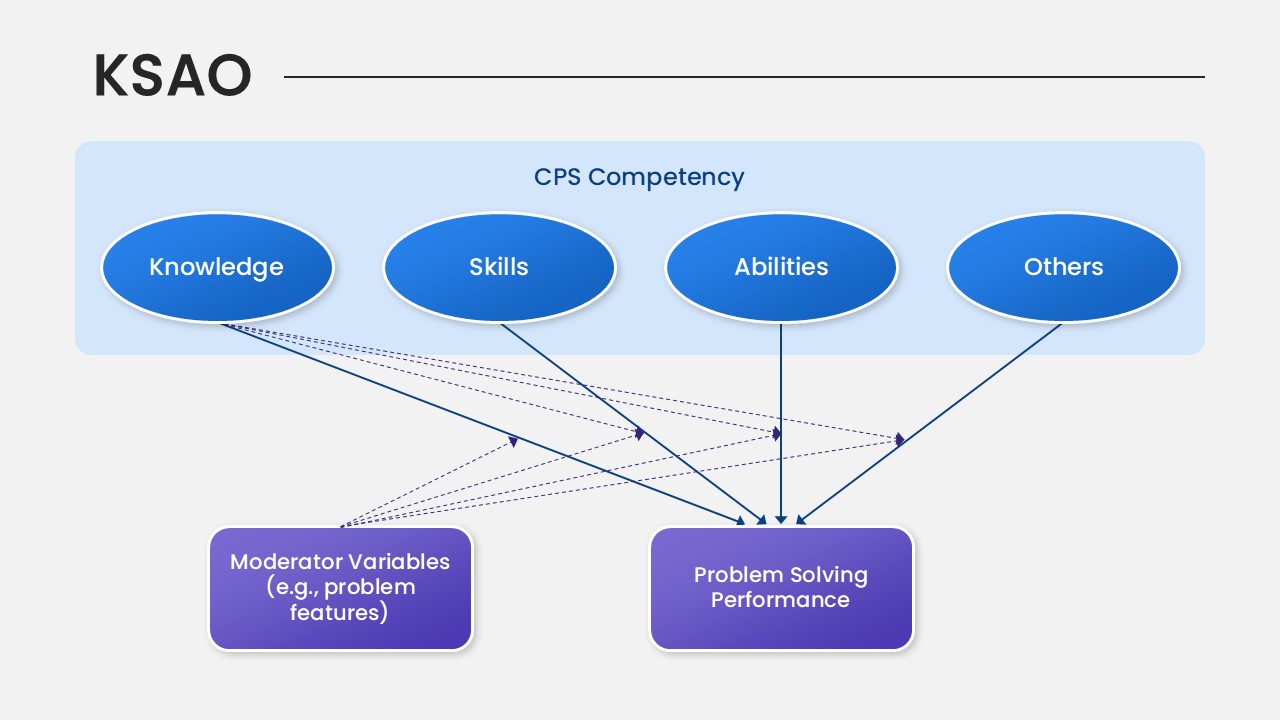
KSAO Model PowerPoint Template for PowerPoint & Google Slides
Business Strategy
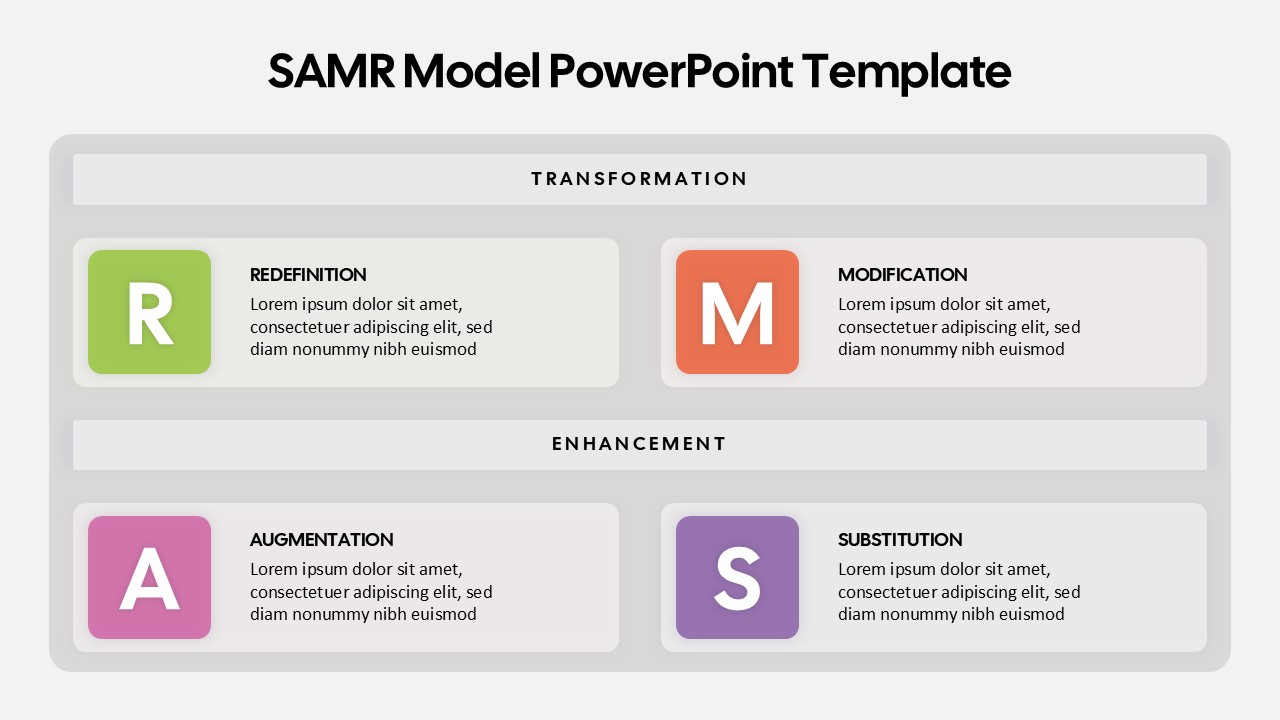
SAMR Model PowerPoint Template for PowerPoint & Google Slides
Business
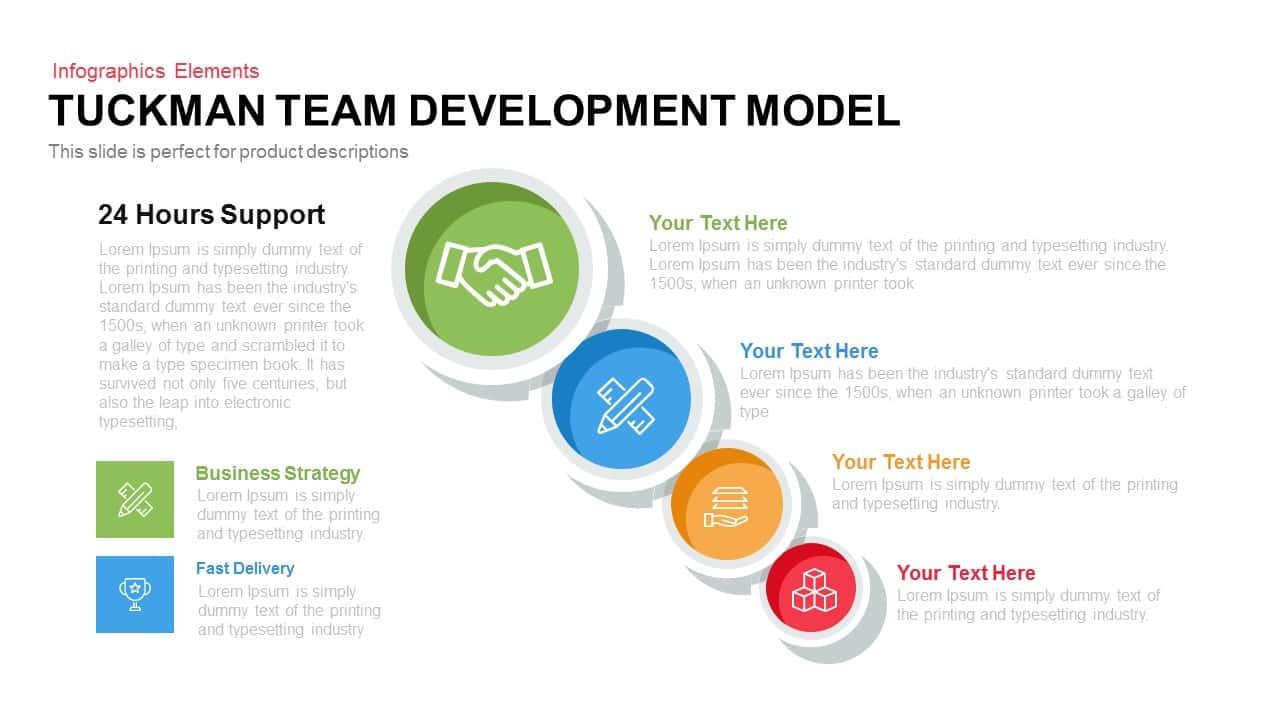
Tuckman Team Model Template for PowerPoint & Google Slides
Infographics
Ansoff Matrix Growth Strategy Model Template for PowerPoint & Google Slides
BCG
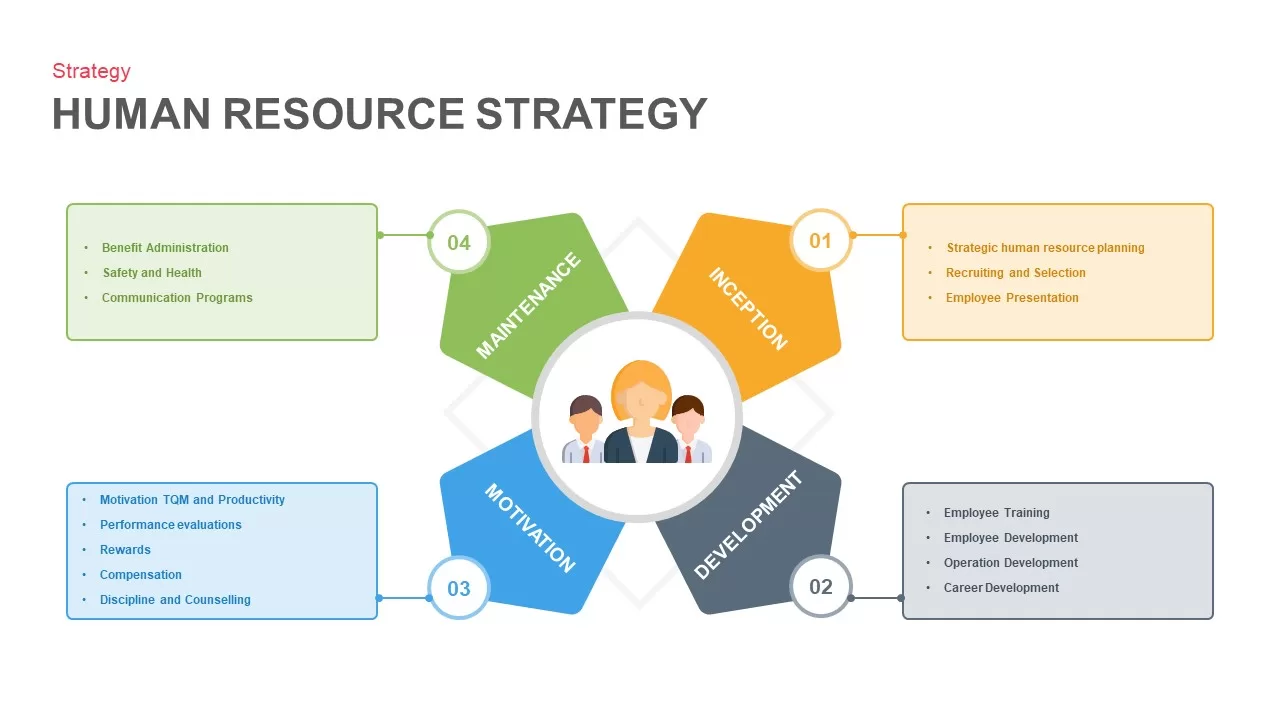
Human Resource Strategy Model Pack Template for PowerPoint & Google Slides
HR
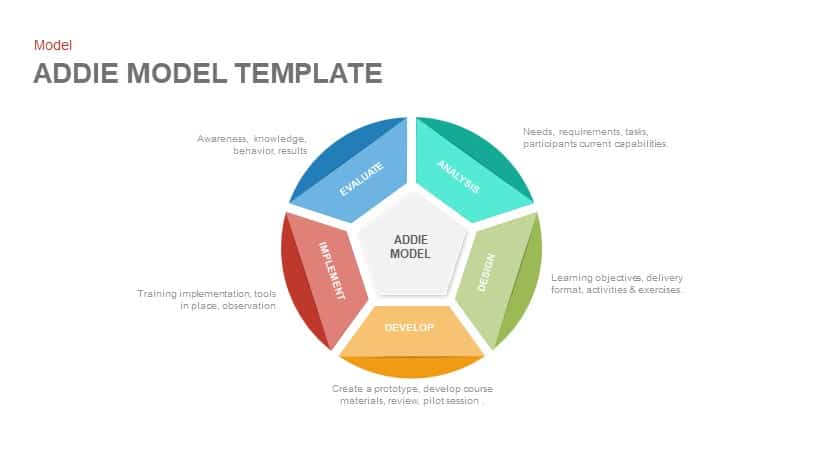
ADDIE Model Instructional Design Template for PowerPoint & Google Slides
Circular
Concentric Functional Process Model Template for PowerPoint & Google Slides
Circular
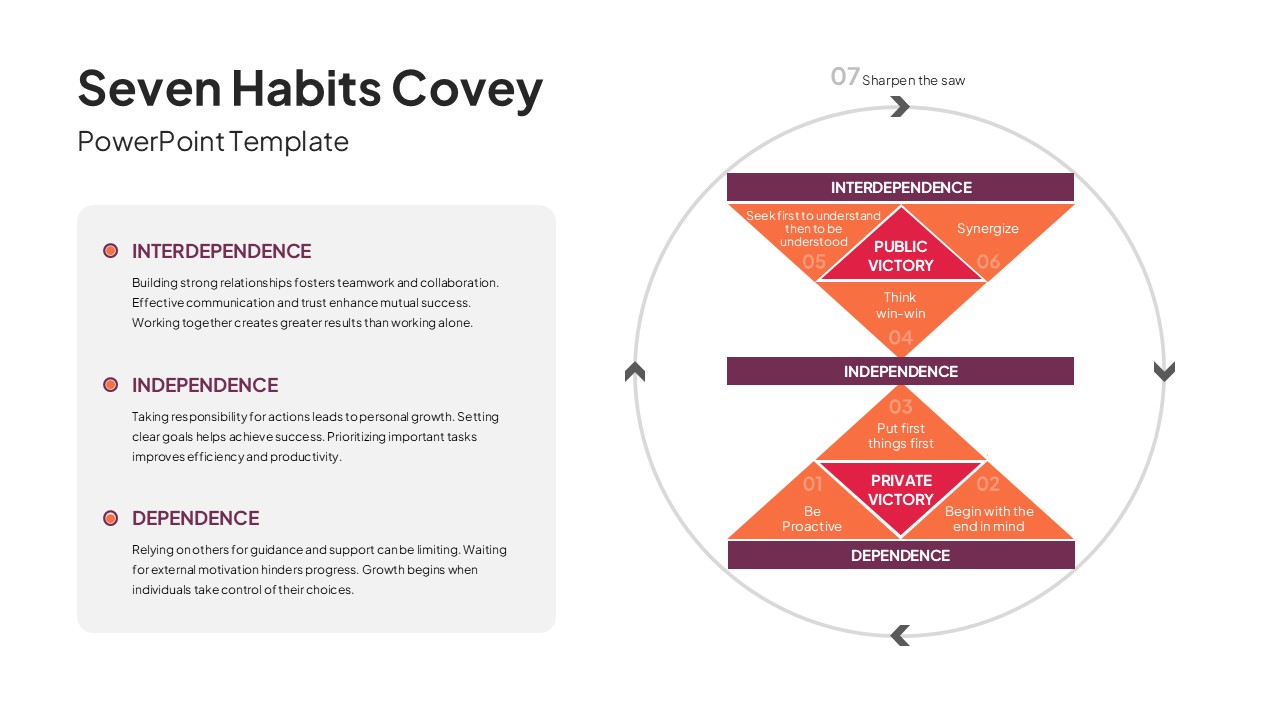
7 Habits of Highly Effective People Covey Model Template for PowerPoint & Google Slides
Leadership
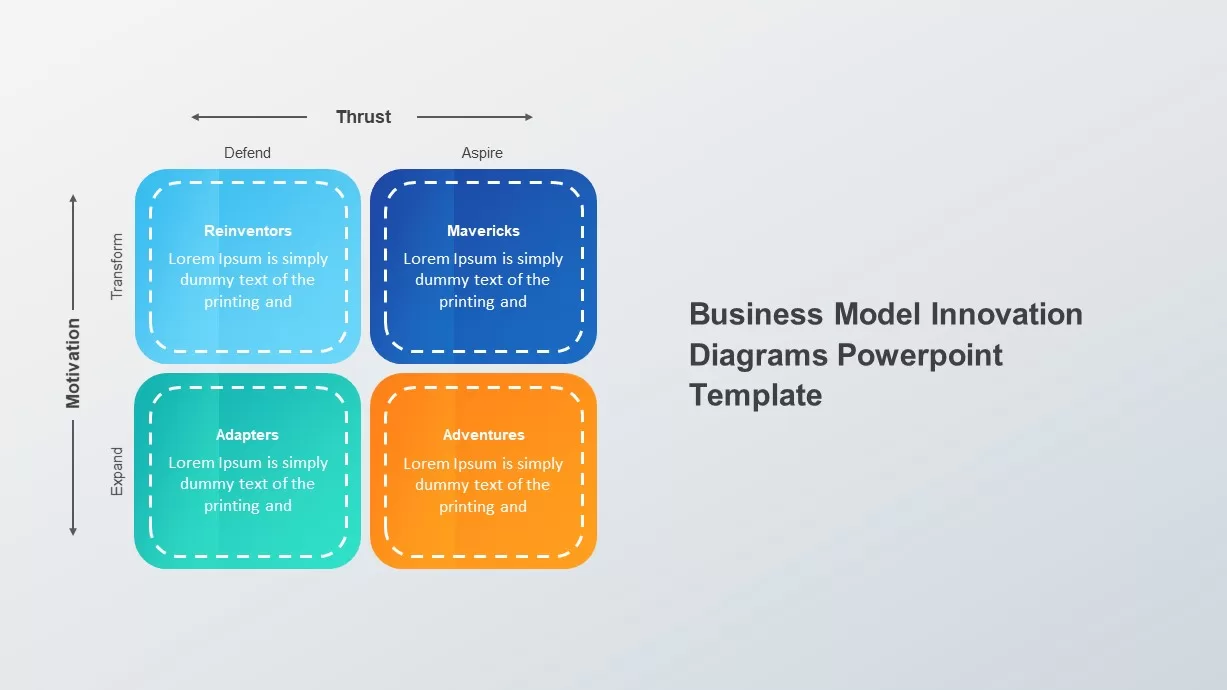
Business Model Innovation Diagrams template for PowerPoint & Google Slides
Process
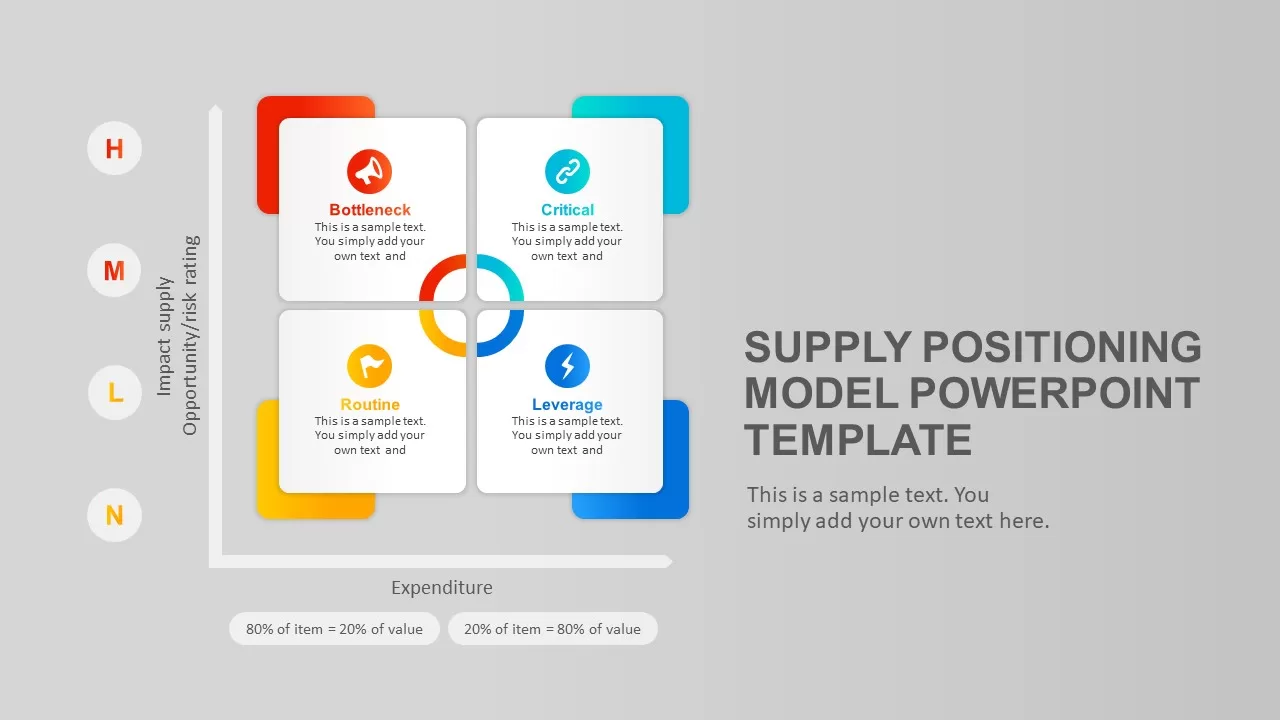
Supply Positioning Model Template for PowerPoint & Google Slides
Business Models
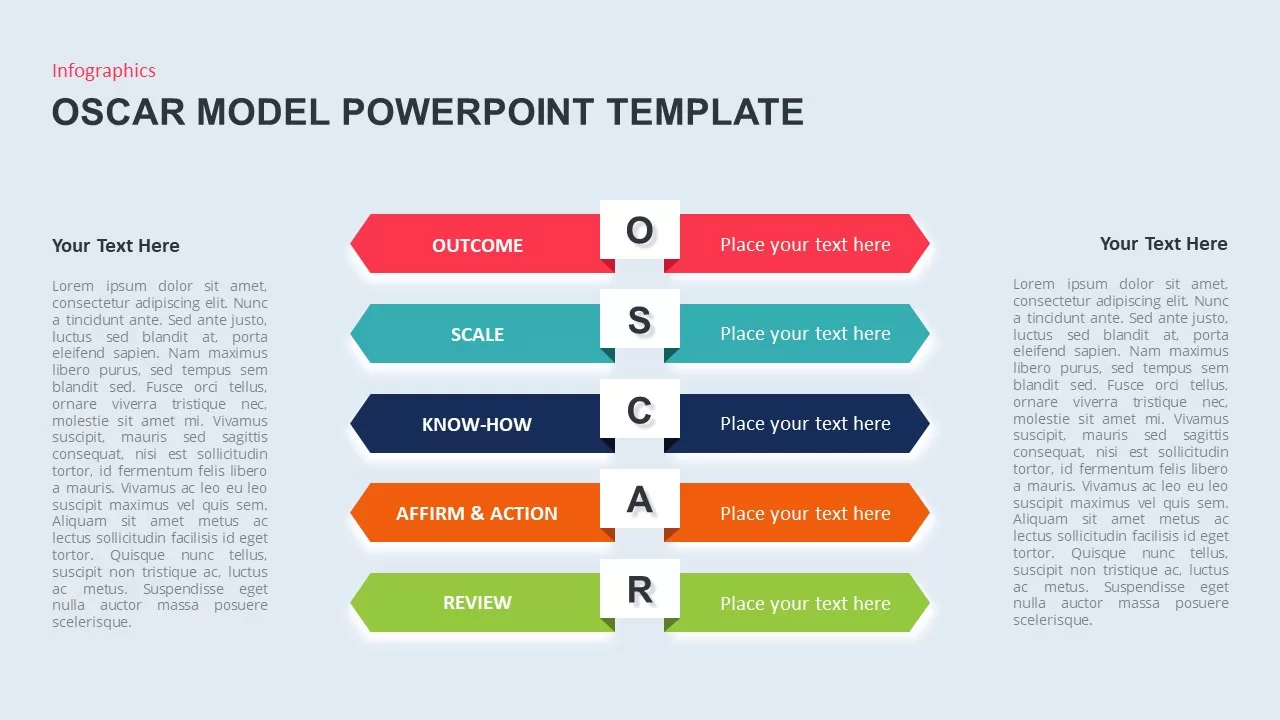
OSCAR Behavior Model Infographic Template for PowerPoint & Google Slides
HR
Demographic Transition Model Template for PowerPoint & Google Slides
Process
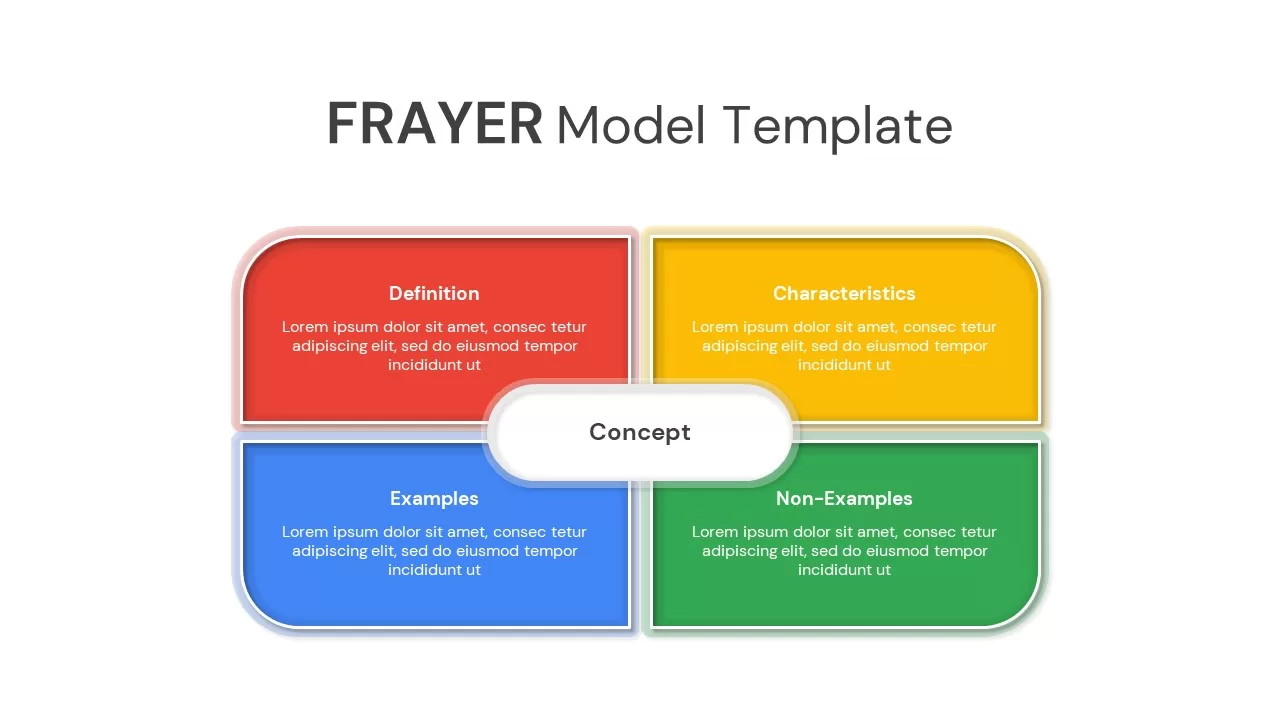
FRAYER Model template for PowerPoint & Google Slides
Infographics
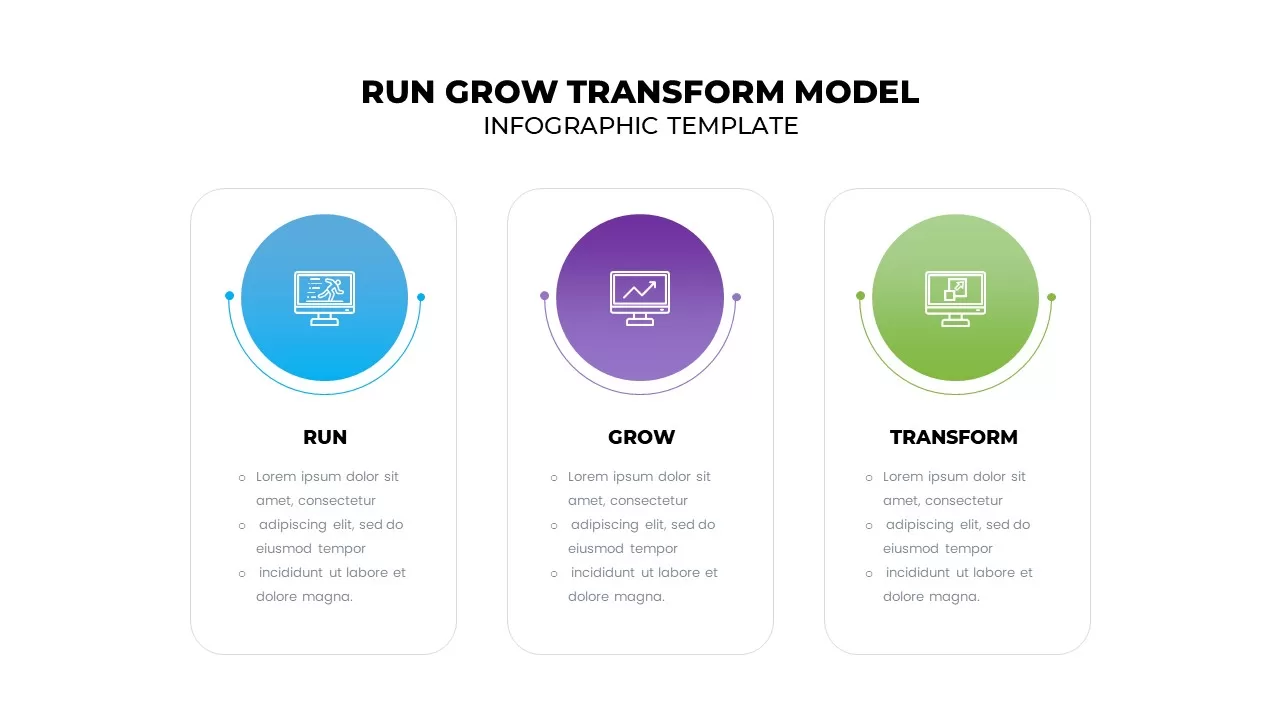
Run Grow Transform Model Infographic Template for PowerPoint & Google Slides
Business
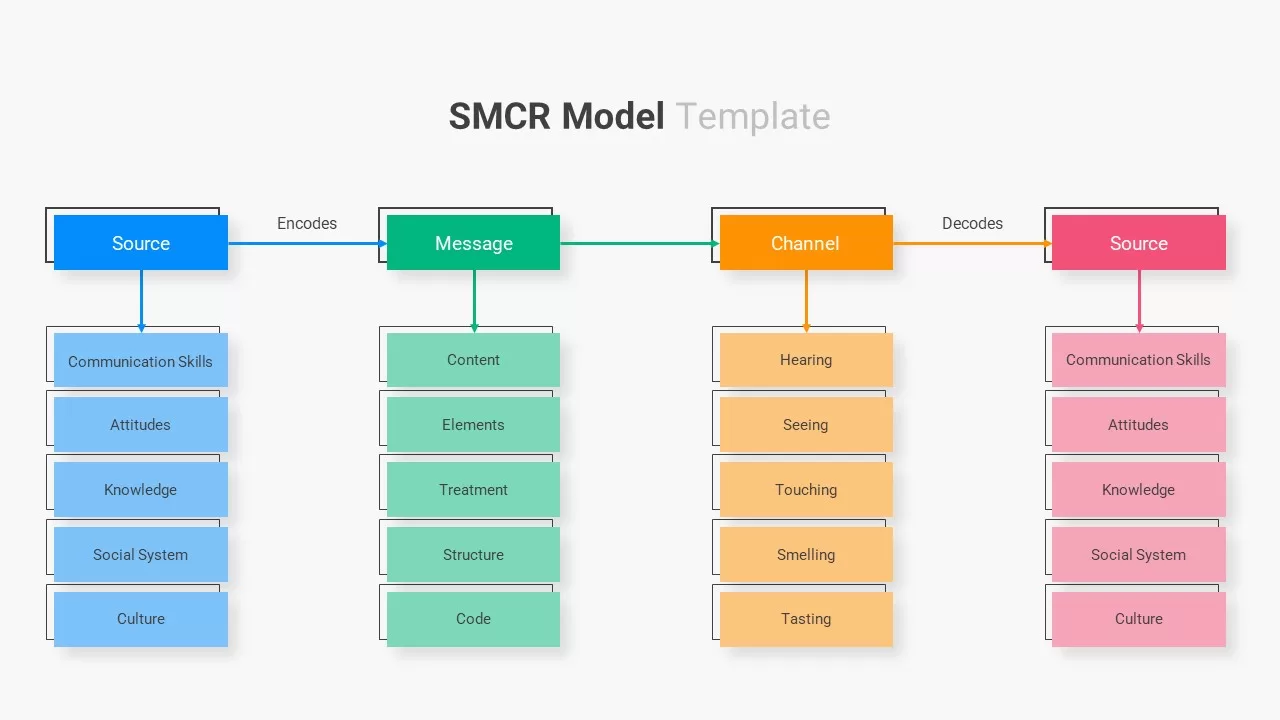
SMCR Model Template for PowerPoint & Google Slides
Infographics
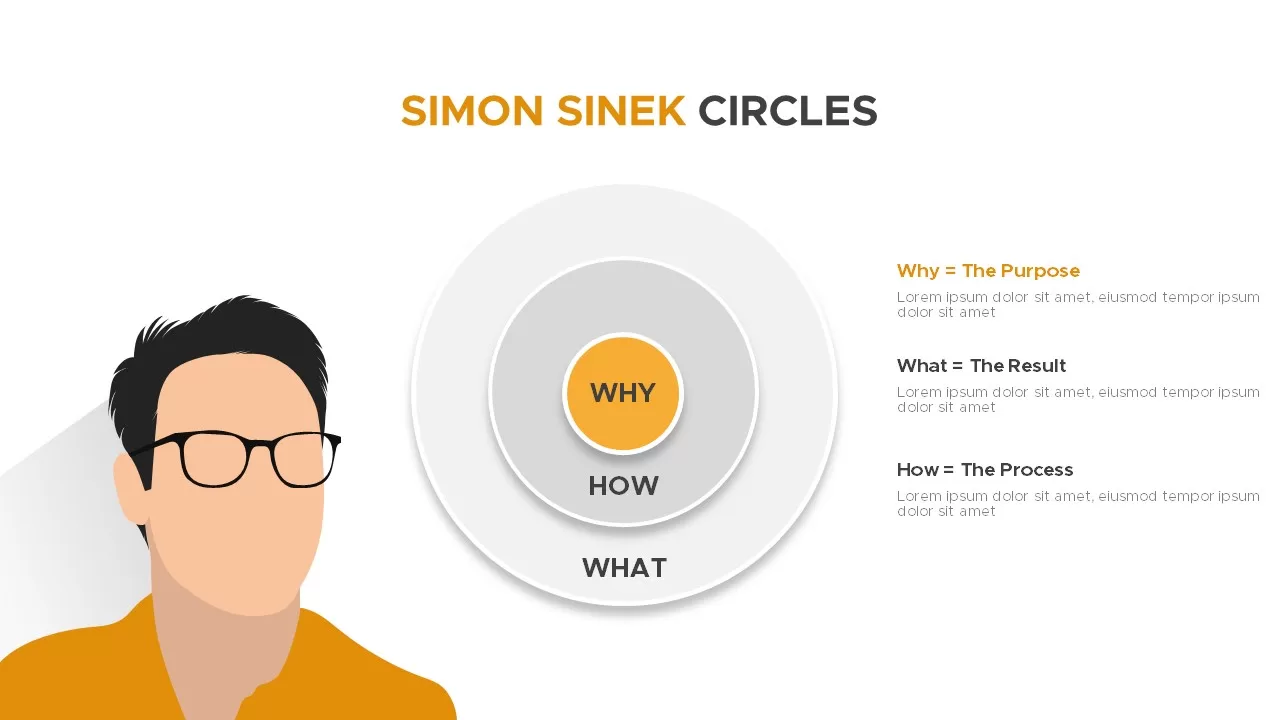
Simon Sinek Circles Model Infographic template for PowerPoint & Google Slides
Business Strategy
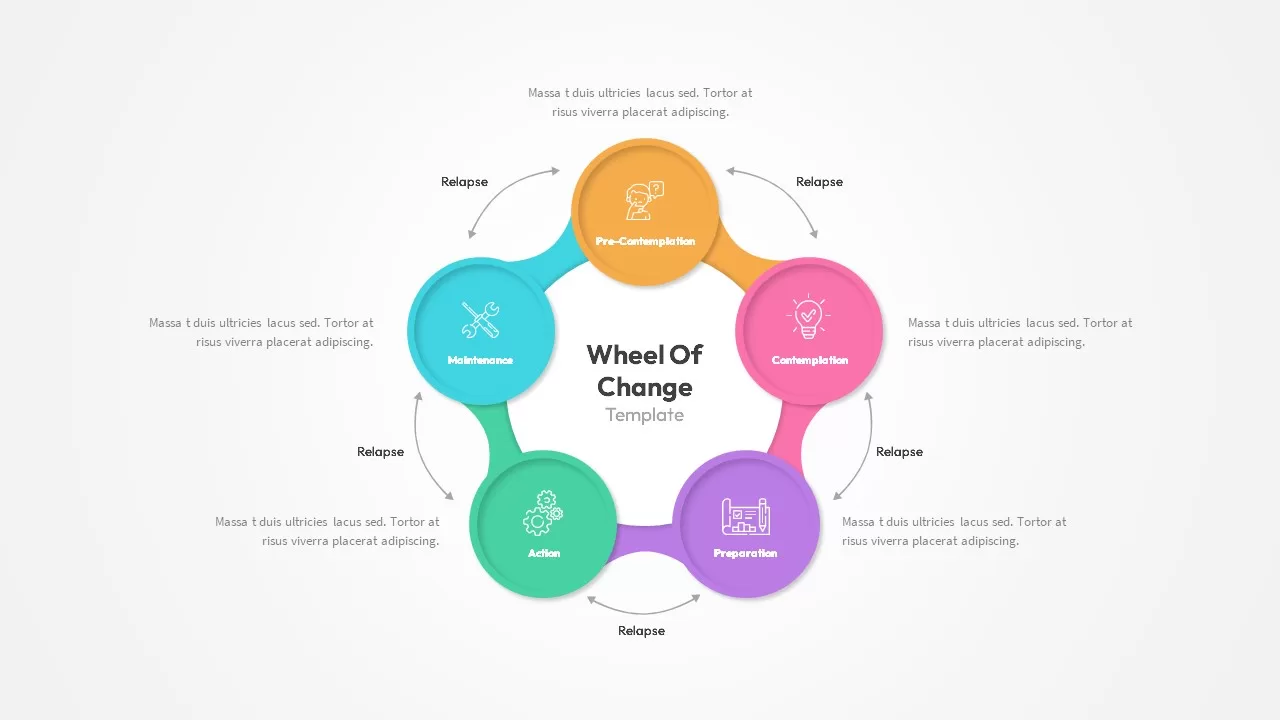
Wheel of Change Model template for PowerPoint & Google Slides
Business Strategy
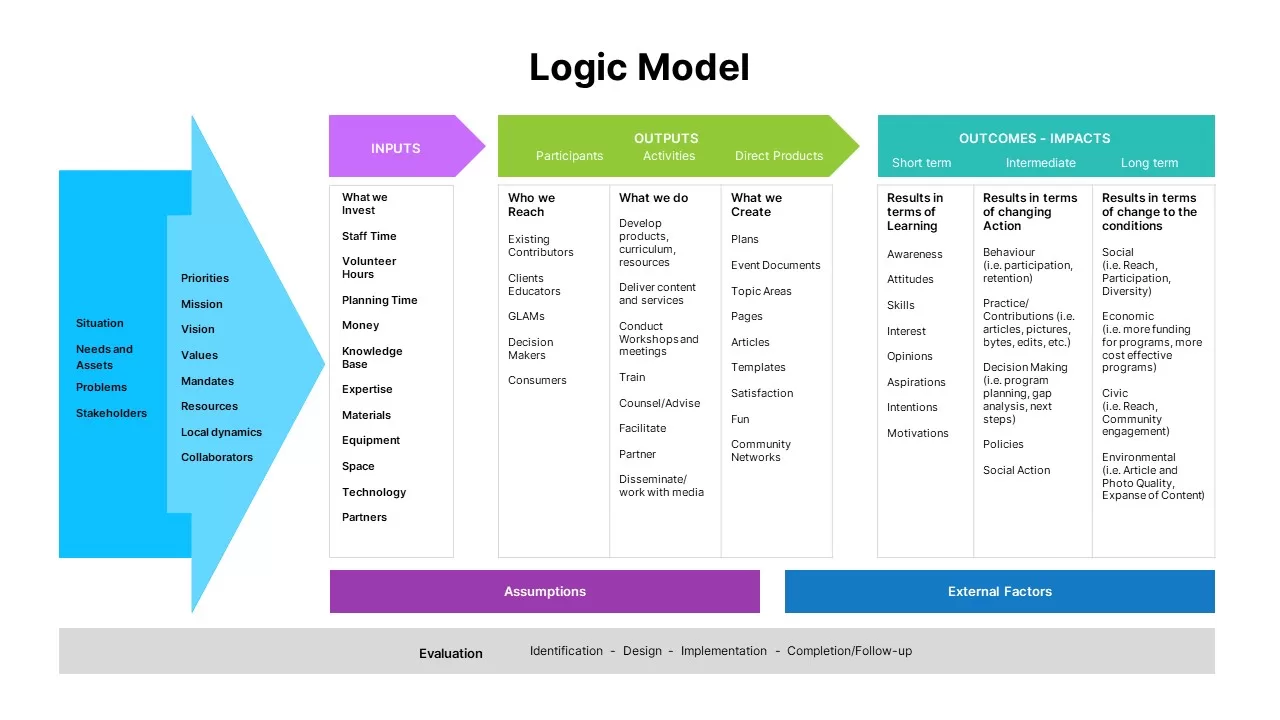
Logic Model template for PowerPoint & Google Slides
Infographics
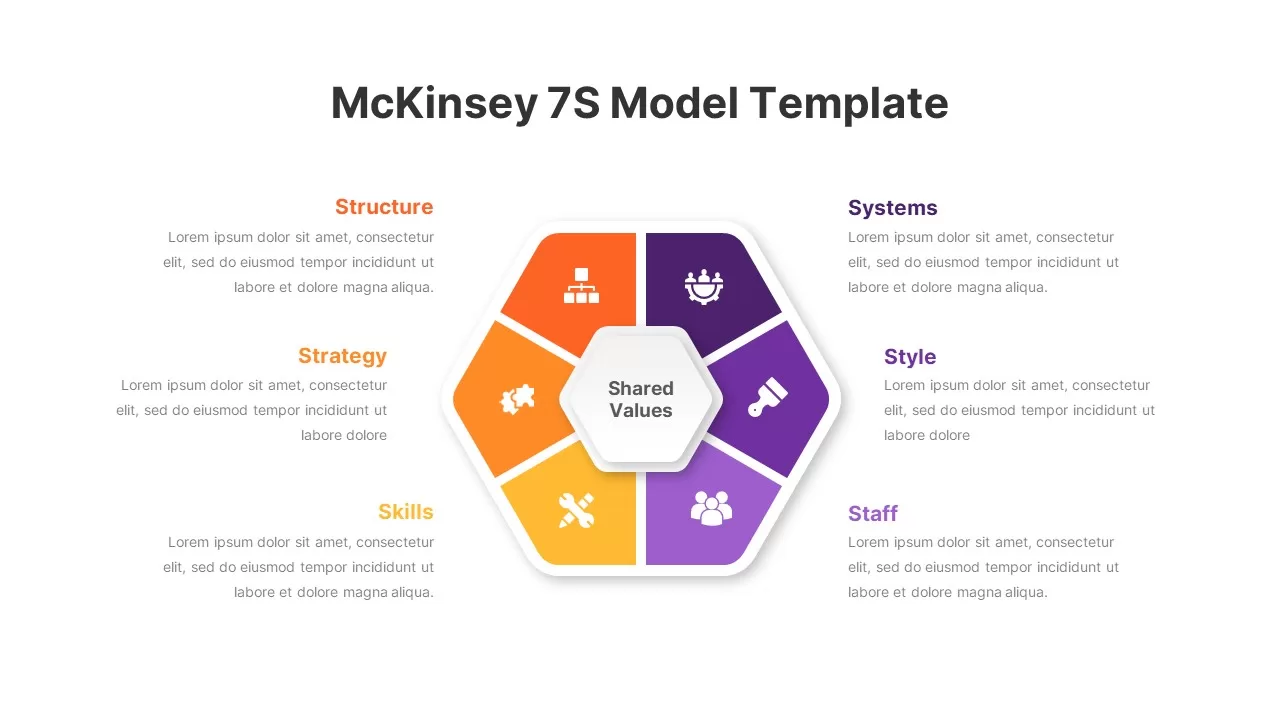
Hexagon 7S Strategic Alignment Model Template for PowerPoint & Google Slides
Business Strategy
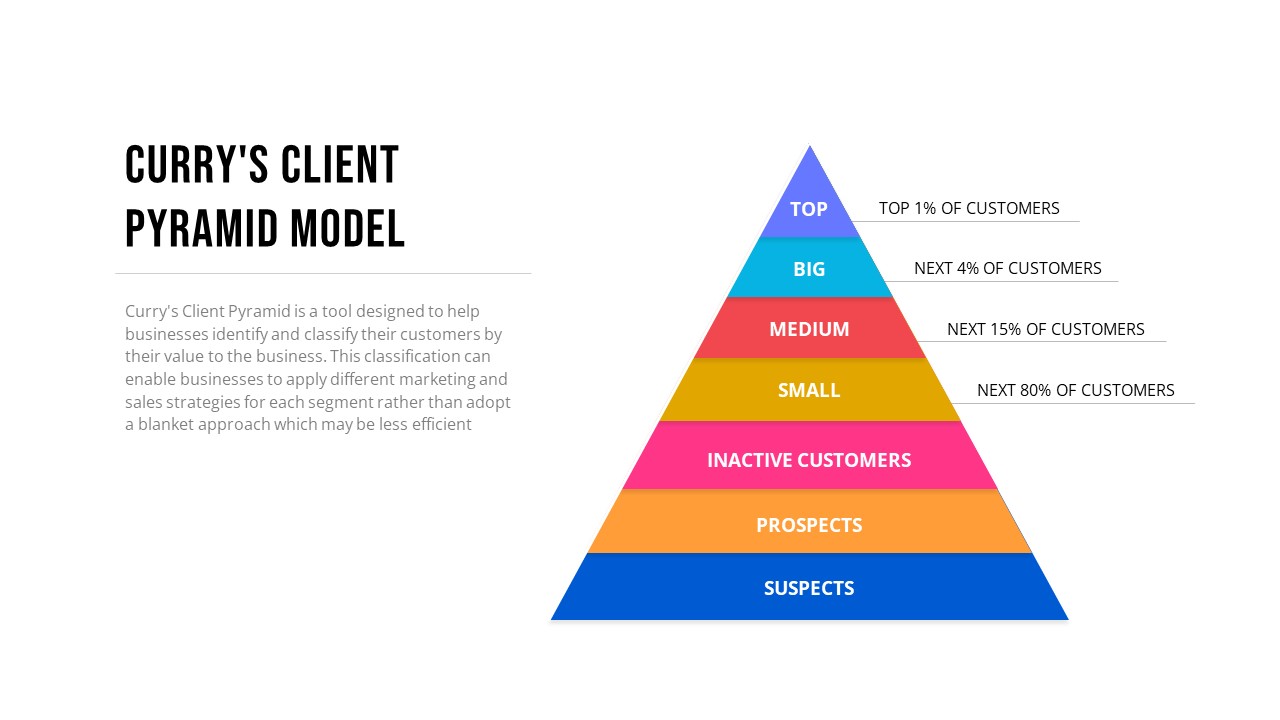
Curry’s Client Segmentation Pyramid Model Template for PowerPoint & Google Slides
Pyramid
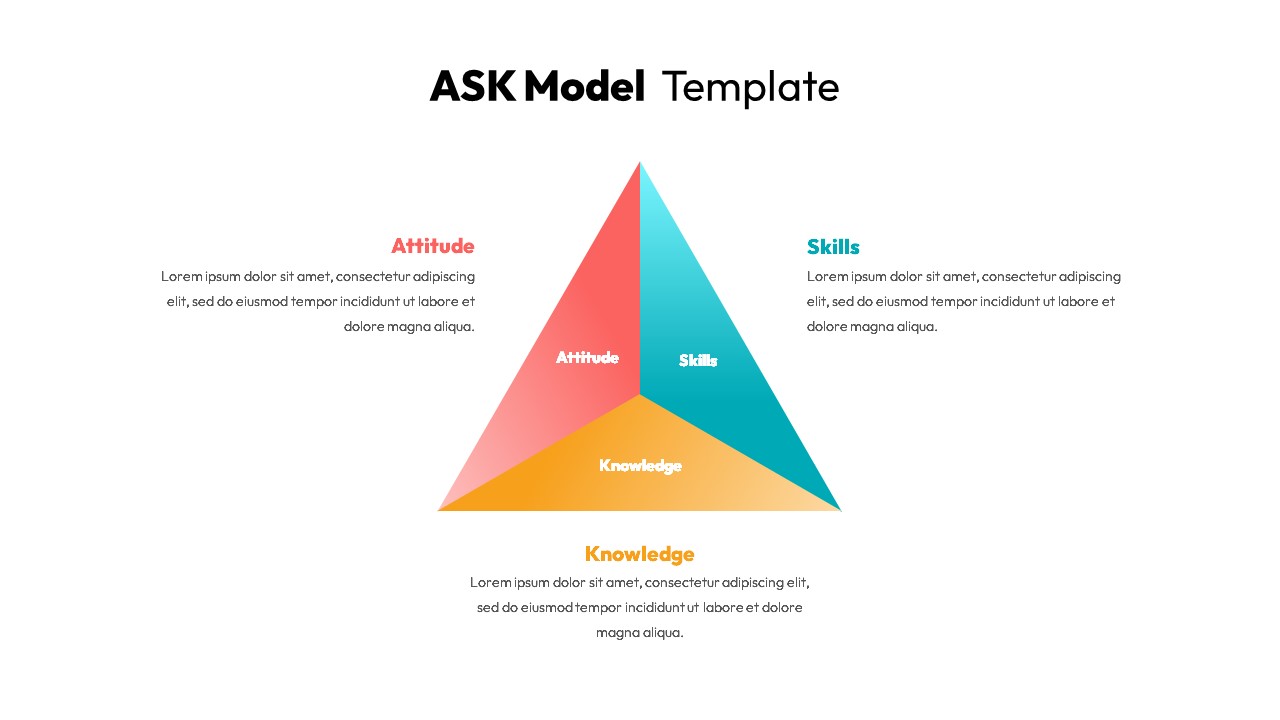
Professional ASK Model Template for PowerPoint & Google Slides
Employee Performance
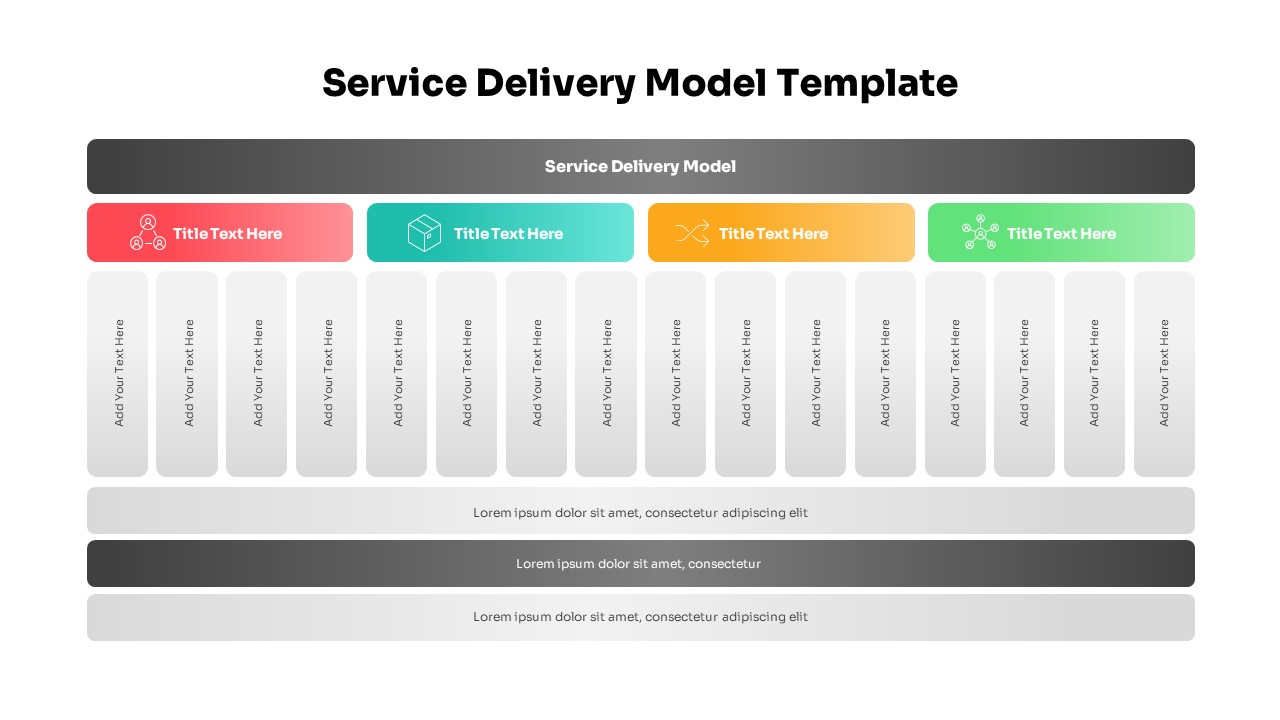
Comprehensive Service Delivery Model Template for PowerPoint & Google Slides
Project
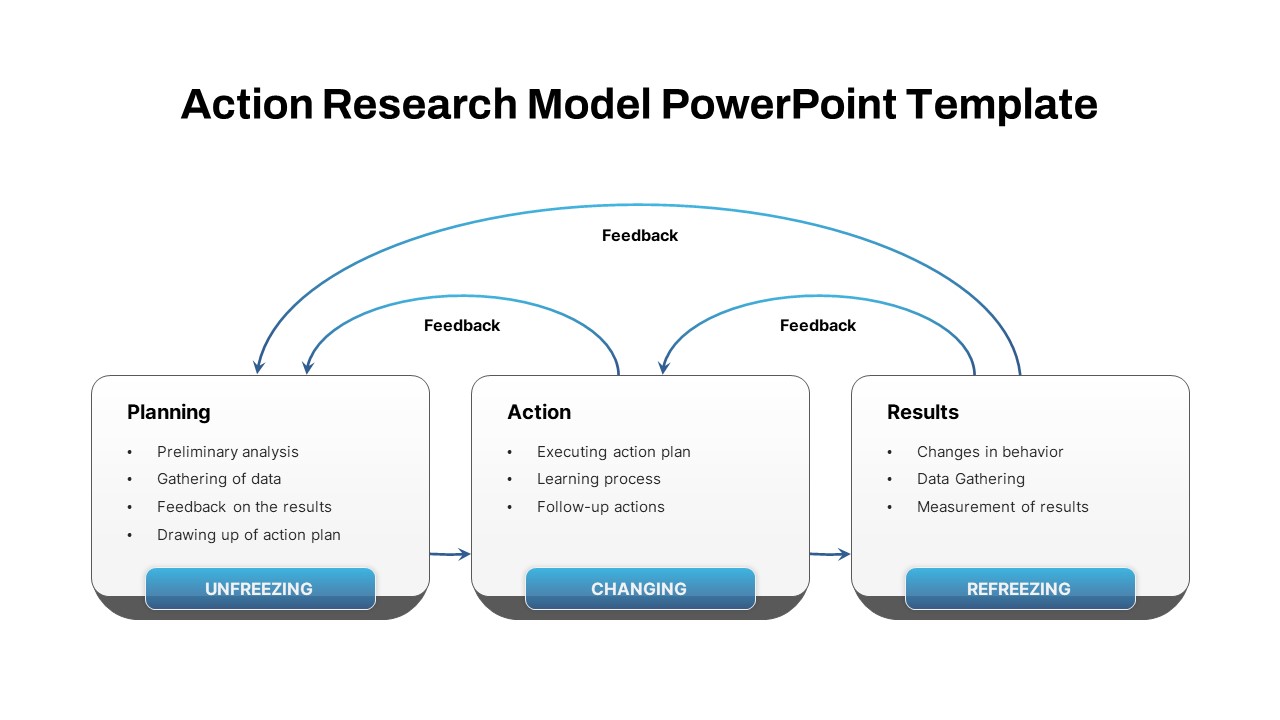
Action Research Feedback Process Model Template for PowerPoint & Google Slides
Process
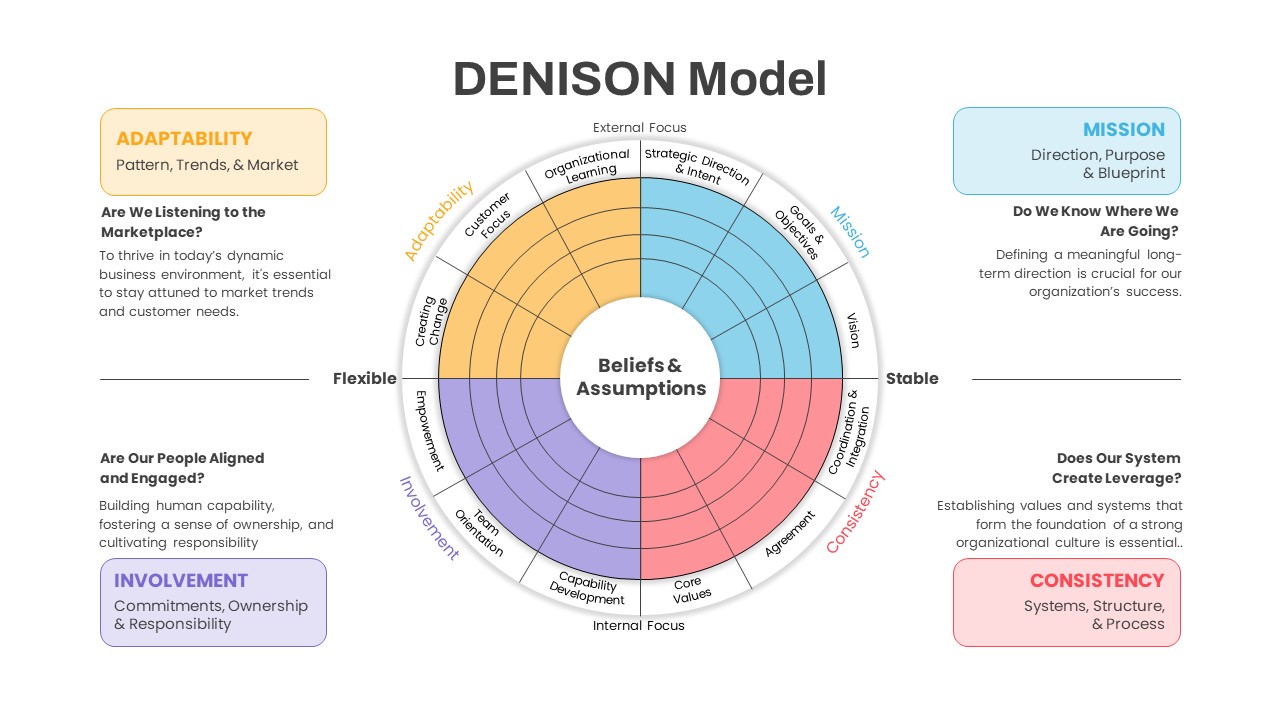
Denison Culture Model Wheel template for PowerPoint & Google Slides
Leadership
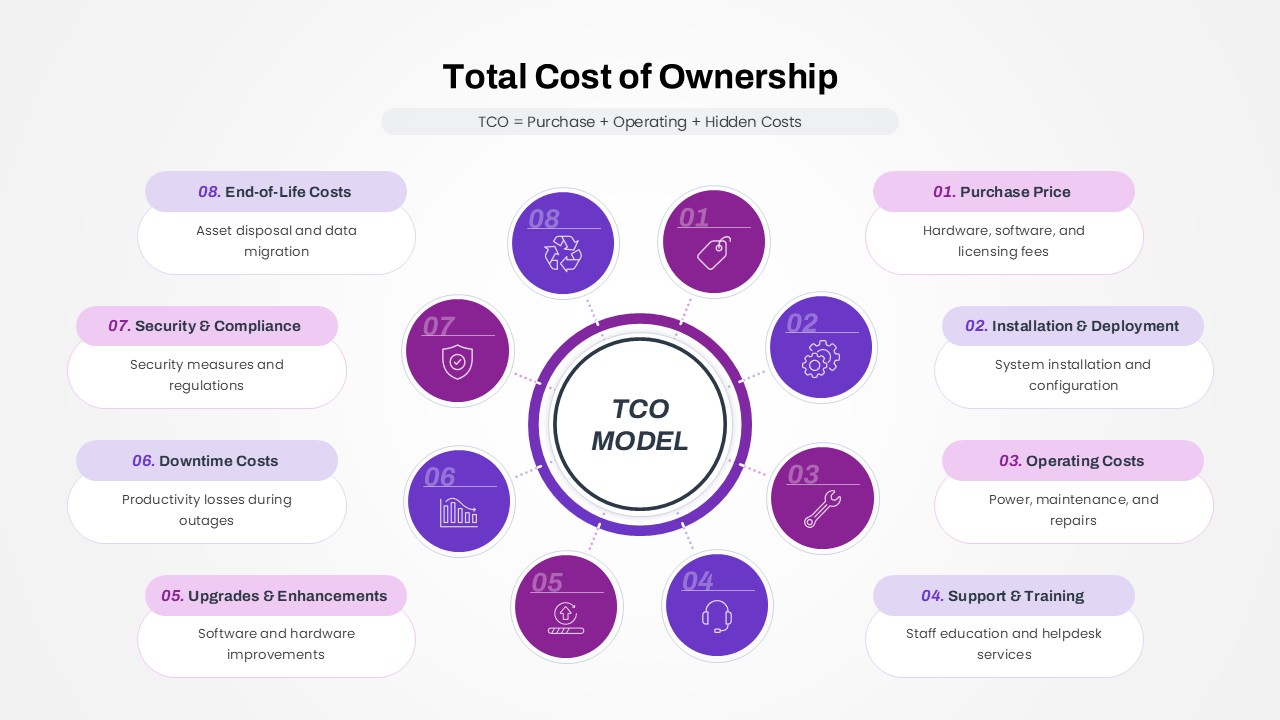
Total Cost of Ownership (TCO) Model template for PowerPoint & Google Slides
Business
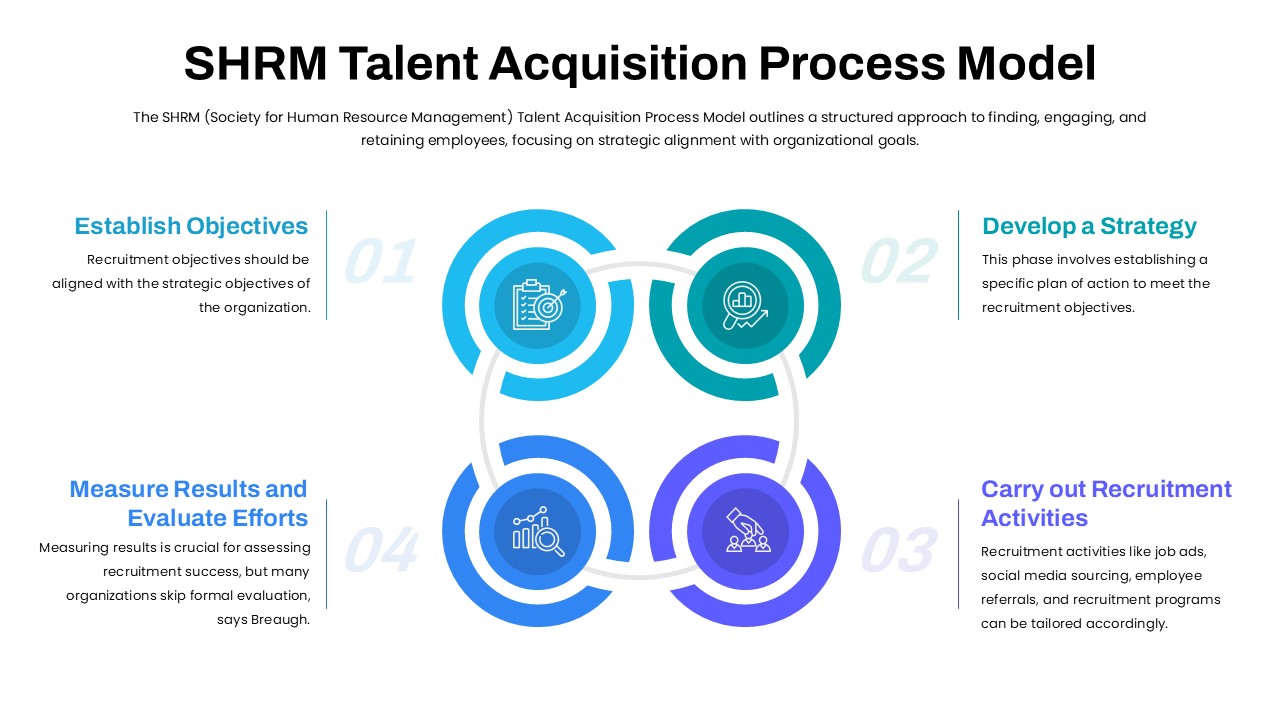
SHRM Talent Acquisition Process Model Template for PowerPoint & Google Slides
Business Models
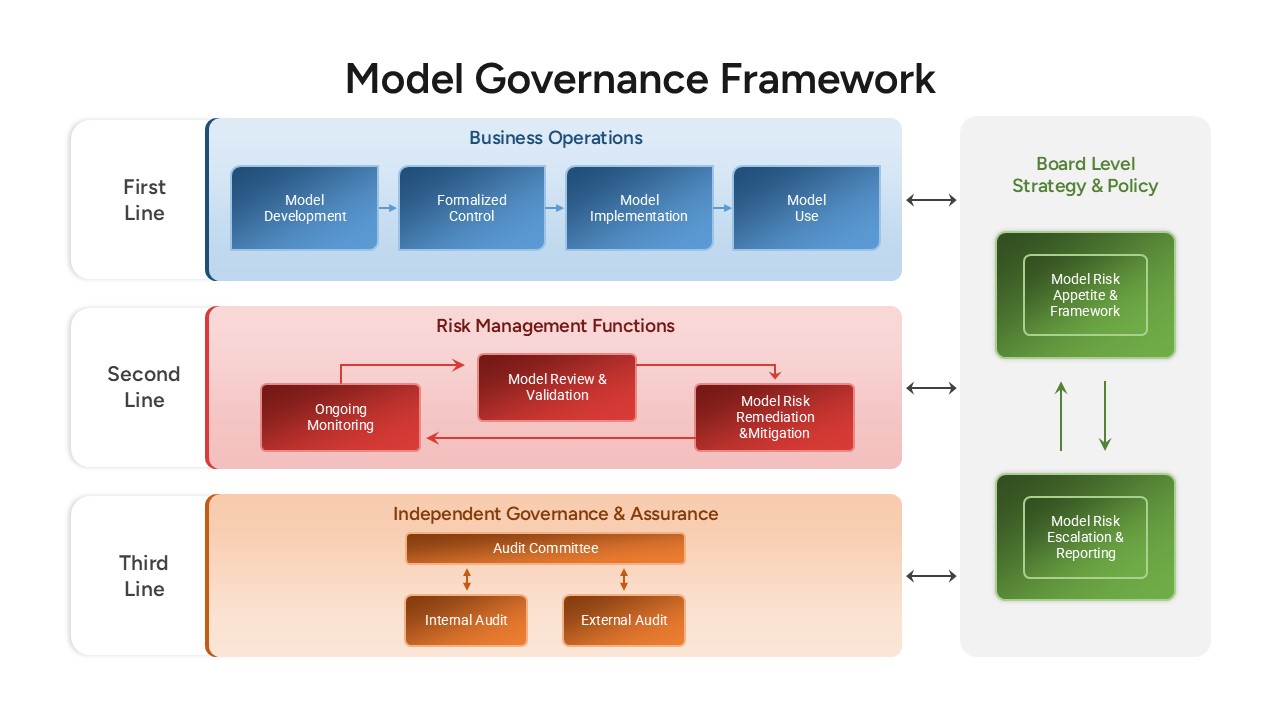
Model Governance Framework Template for PowerPoint & Google Slides
Risk Management
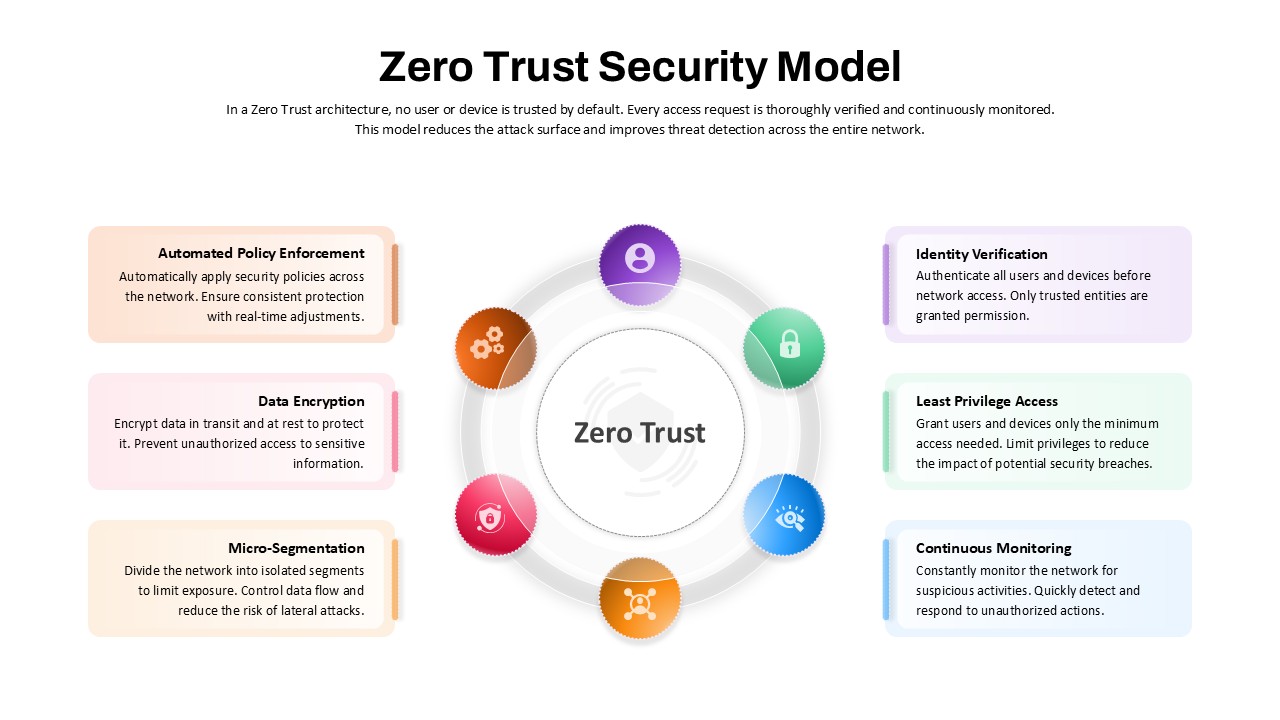
Zero Trust Security Model Overview template for PowerPoint & Google Slides
Risk Management
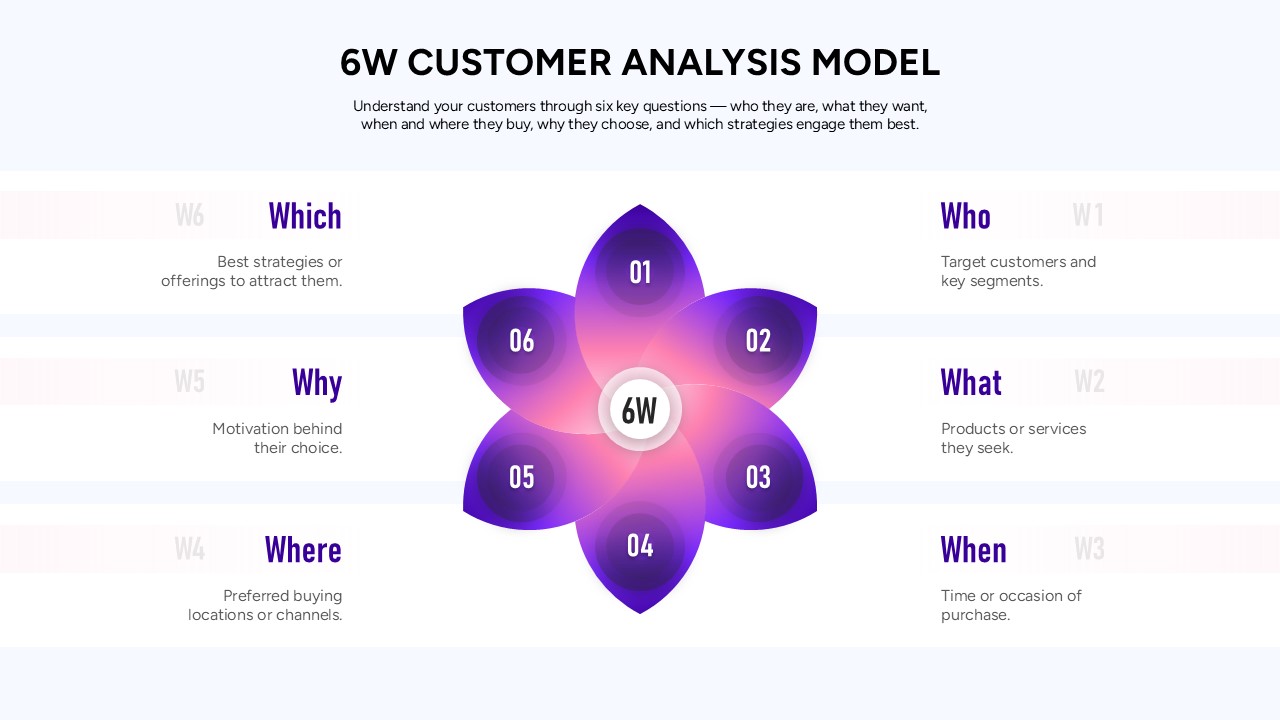
6W Customer Analysis Model Template for PowerPoint & Google Slides
Customer Experience