Greiner Growth Model Six-Phase Diagram Template for PowerPoint & Google Slides

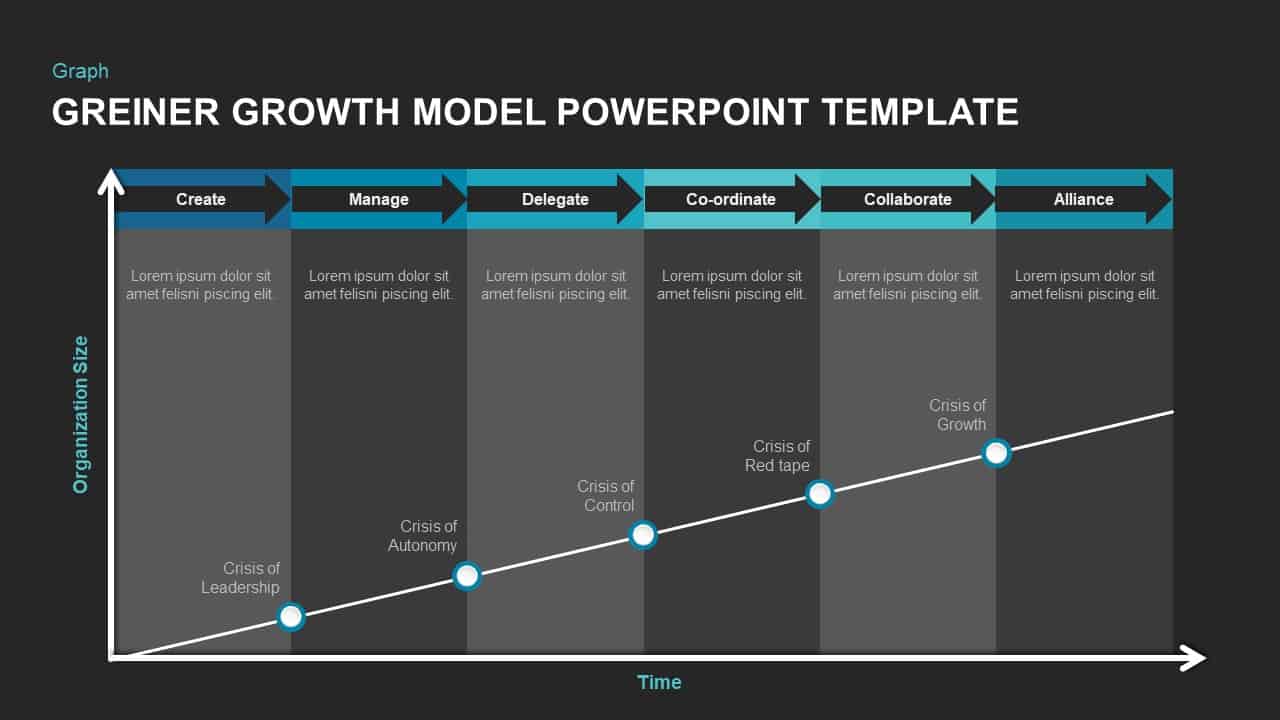
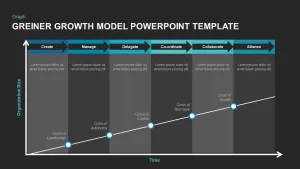
Harness the power of the Greiner Growth Model with this visually engaging diagram slide, designed to map six distinct phases of organizational evolution: Create, Manage, Delegate, Co-ordinate, Collaborate, and Alliance. Each phase is represented by a bold arrow header in progressive blue-teal hues, paired with subtle alternating background panels and a clean line chart tracking organizational size over time. Key crisis points—Leadership, Autonomy, Control, Red tape, and Growth—are marked by accent circles along the timeline, guiding audiences through critical inflection moments in a clear, sequential flow. The modern flat design features vector shapes, editable text placeholders, and high-contrast typography to ensure readability and customization across brands.
Optimized for convenience, this template comes with fully editable master slides, intuitive icon placeholders, and modular chart components. Users can effortlessly resize arrows, swap color themes, and adjust crisis labels without compromising visual alignment. Whether you need to highlight strategic milestones, illustrate growth challenges, or conduct leadership workshops, this asset simplifies complex content delivery while maintaining a polished, corporate aesthetic. Seamlessly compatible with both PowerPoint and Google Slides, it guarantees consistent formatting and crisp resolution on any device, streamlining collaboration and version control for consultants, executives, or academic presenters.
Beyond standard presentations, this versatile framework can support strategic planning sessions, investor pitch decks, leadership training modules, or academic lectures on organizational behavior. Adapt the colored arrows to match corporate branding, rename crisis labels to reflect industry-specific thresholds, or duplicate timeline segments to spotlight additional growth stages. With drag-and-drop vector elements and prebuilt animation options, presenters can craft dynamic storytelling sequences that resonate with stakeholders and reinforce data-driven insights.
Who is it for
Business strategists, executive leaders, consultants, and MBA instructors seeking to visualize organizational growth trajectories. It’s also ideal for project managers, HR professionals, and startup founders who want to communicate phase-based development, anticipate crises, and align teams around strategic milestones.
Other Uses
Repurpose this slide for change management briefings, boardroom discussions, team-building workshops, or performance reviews. Use the sequential flow to compare competitor growth paths, illustrate career progression frameworks, or map product development roadmaps.
Login to download this file

Item ID
SB01407
Related Templates

Greiner’s Growth Model Curve template for PowerPoint & Google Slides
Infographics
Five-Phase and Three-Phase Phases Chart Template for PowerPoint & Google Slides
Charts
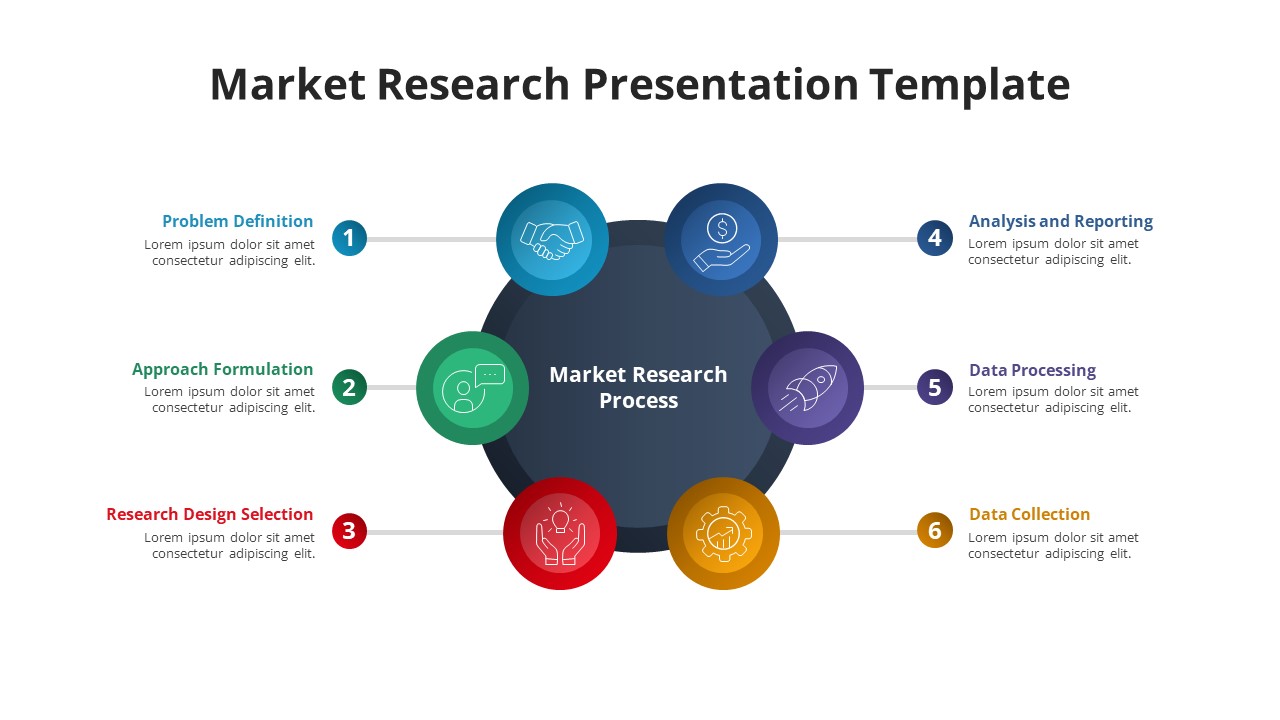
Free Six-Phase Market Research Process Template for PowerPoint & Google Slides
Process
Free

Four-Phase Maturity Model Diagram Template for PowerPoint & Google Slides
Process
Gear Process Phase Diagram template for PowerPoint & Google Slides
Process
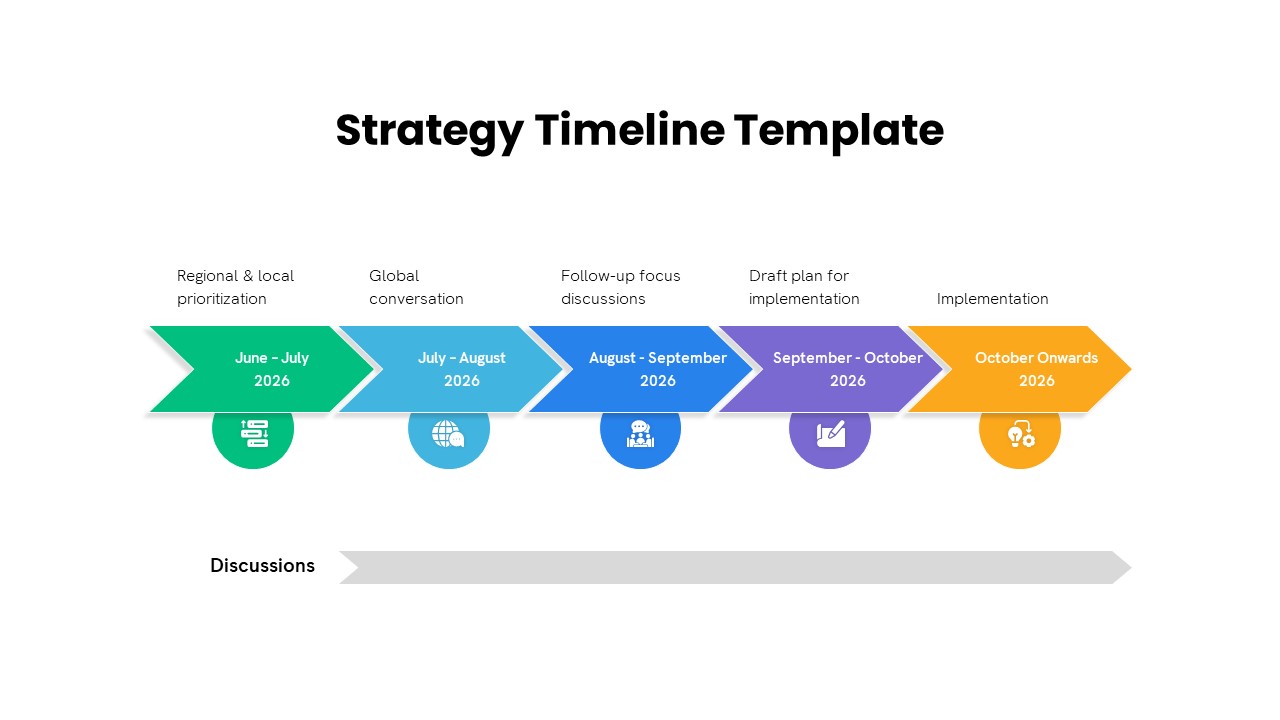
Five-Phase Strategy Timeline Diagram Template for PowerPoint & Google Slides
Timeline
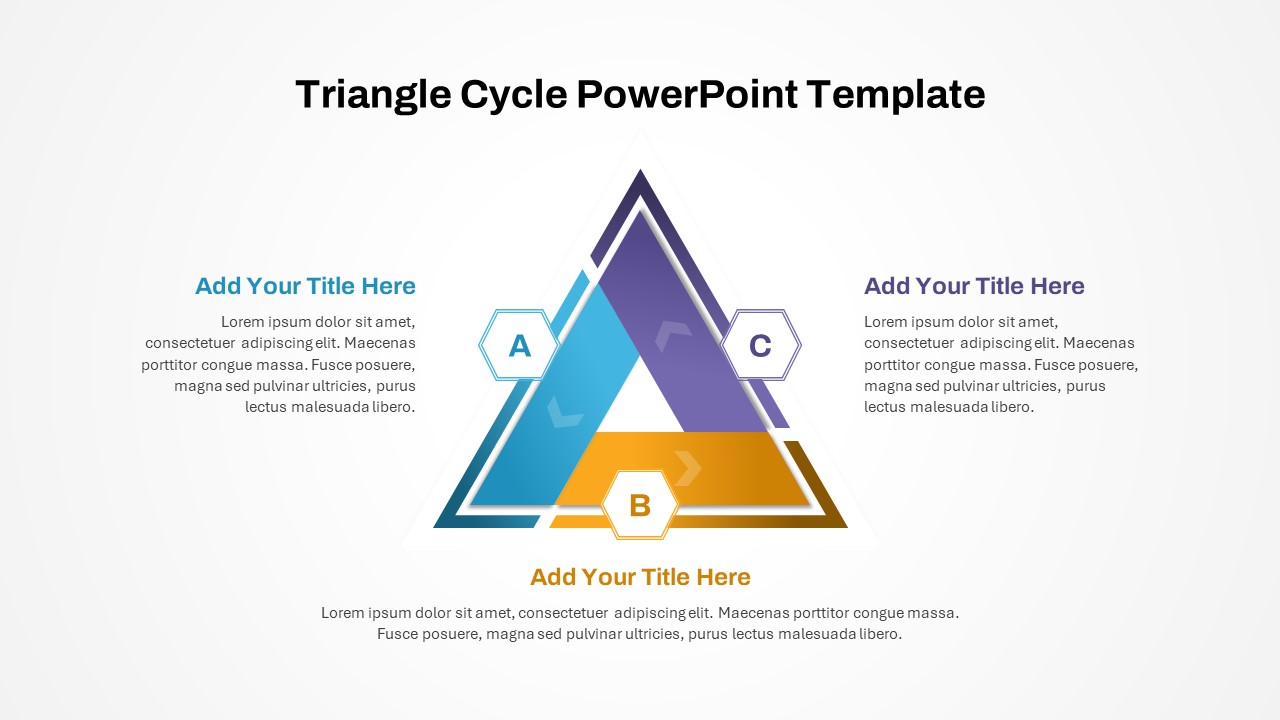
Three-Phase Triangle Cycle Diagram Template for PowerPoint & Google Slides
Infographics
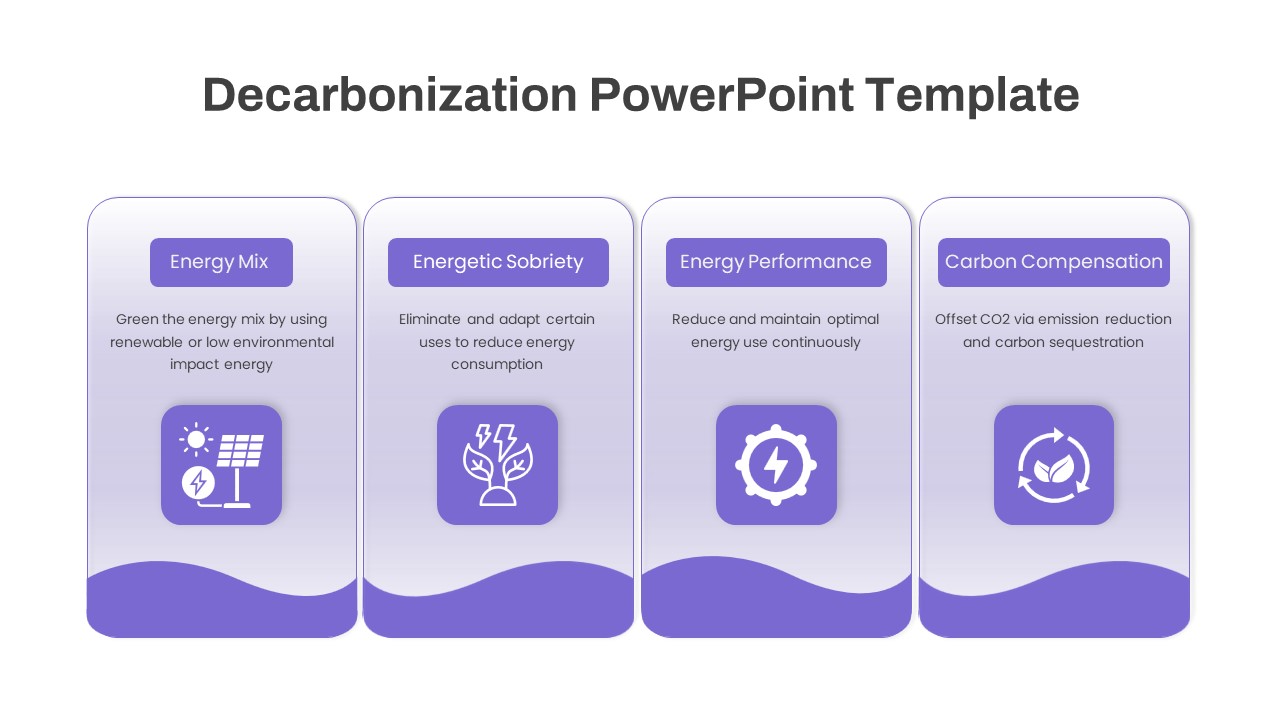
Four-Phase Decarbonization Diagram Template for PowerPoint & Google Slides
Process
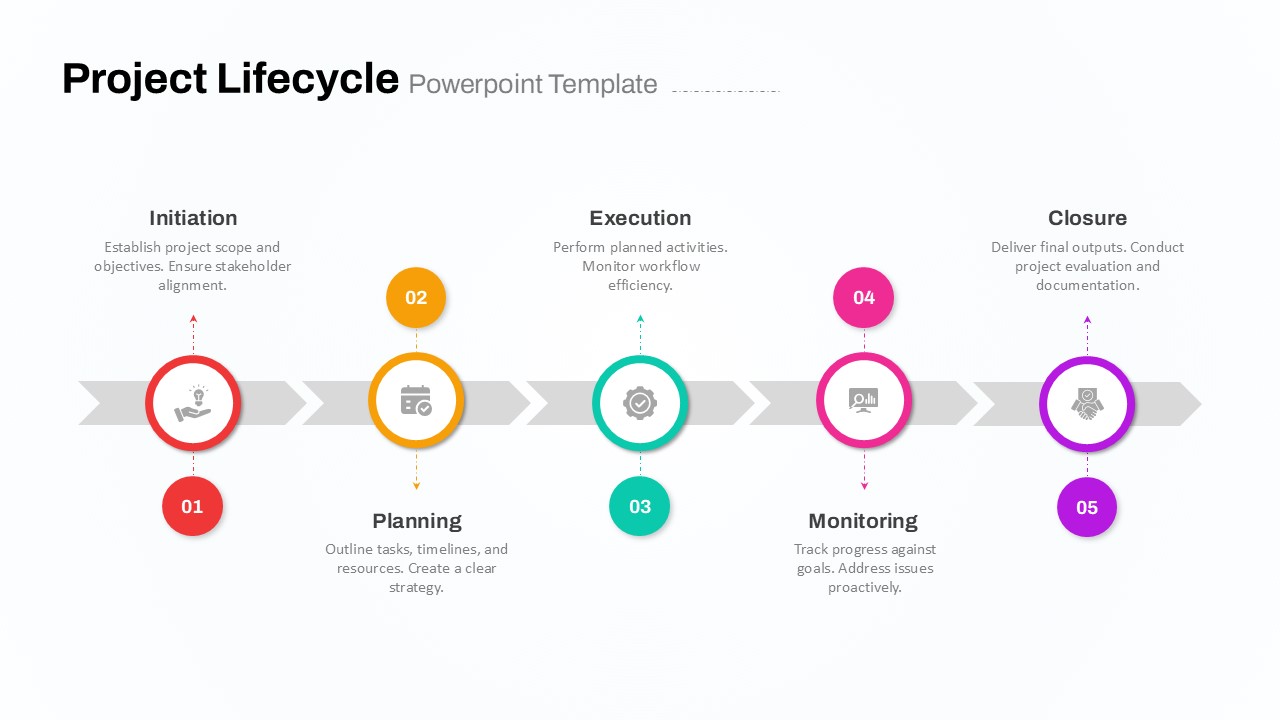
Five-Phase Project Lifecycle Diagram Template for PowerPoint & Google Slides
Infographics
Three-Phase Planning Gear Infographic Template for PowerPoint & Google Slides
Process
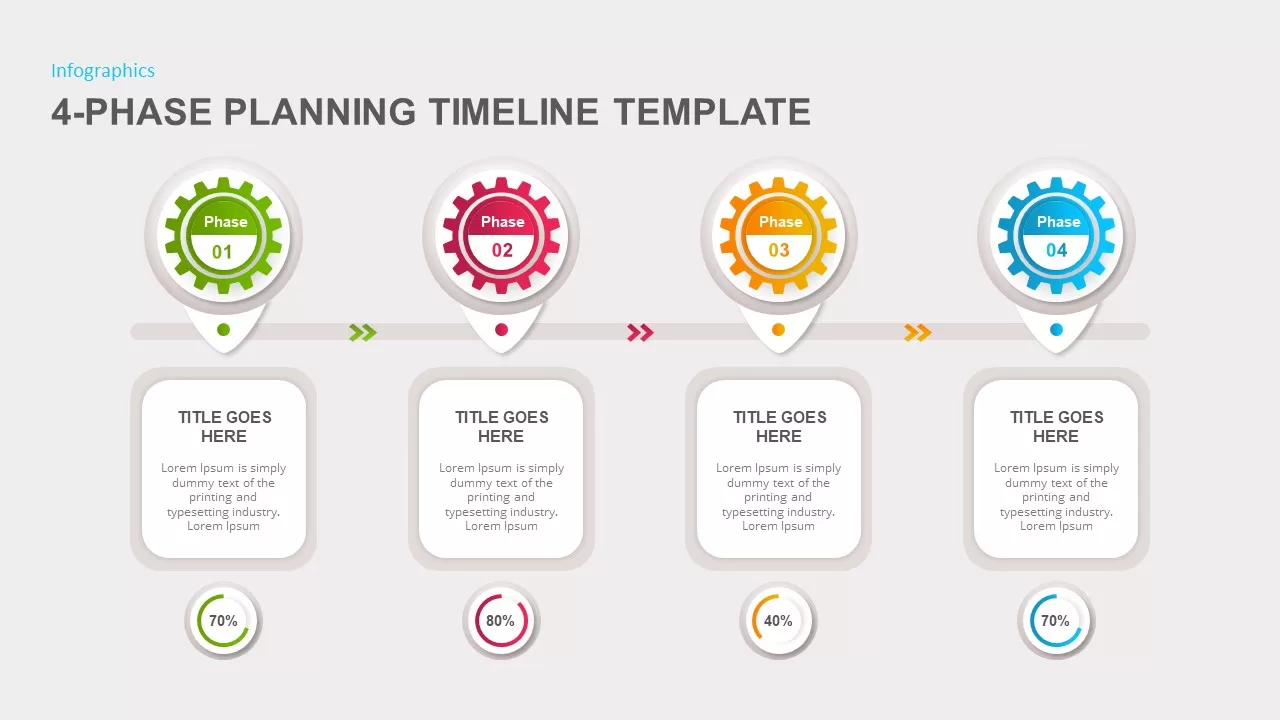
4-Phase Planning Timeline template for PowerPoint & Google Slides
Infographics
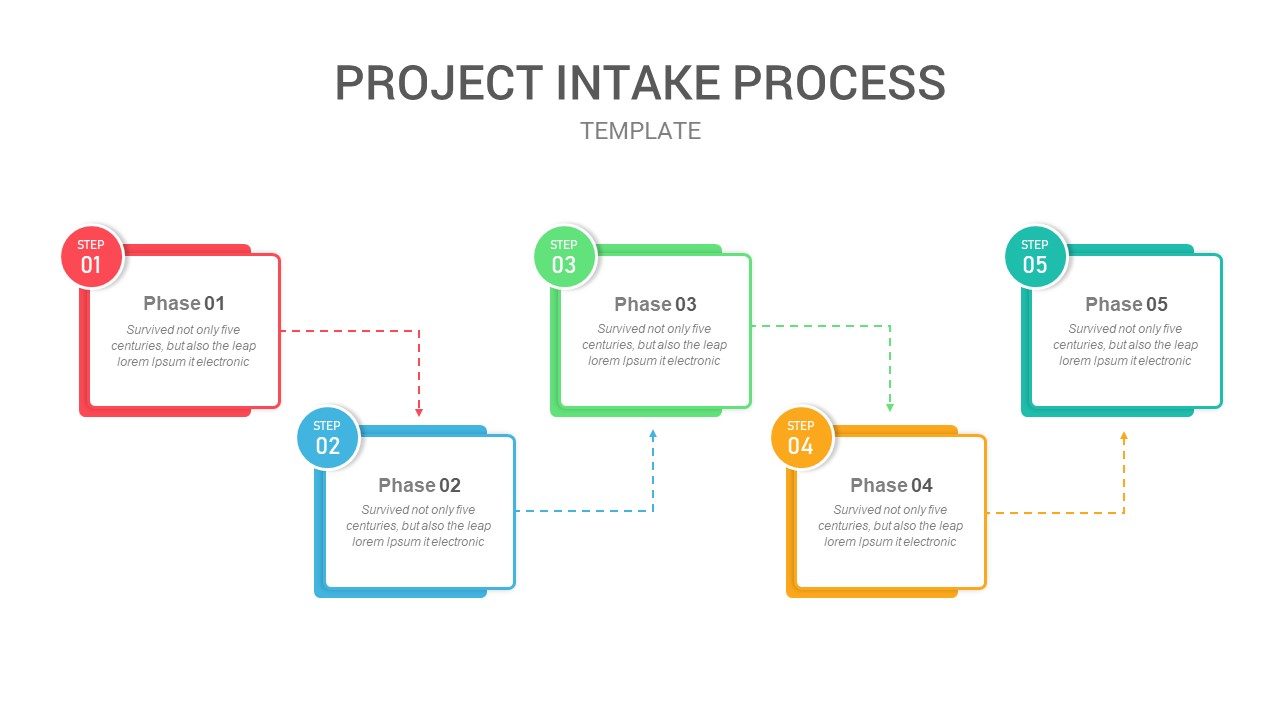
Five-Phase Project Intake Process Flow Template for PowerPoint & Google Slides
Process
Five-Phase Horizontal Timeline Chart Template for PowerPoint & Google Slides
Timeline
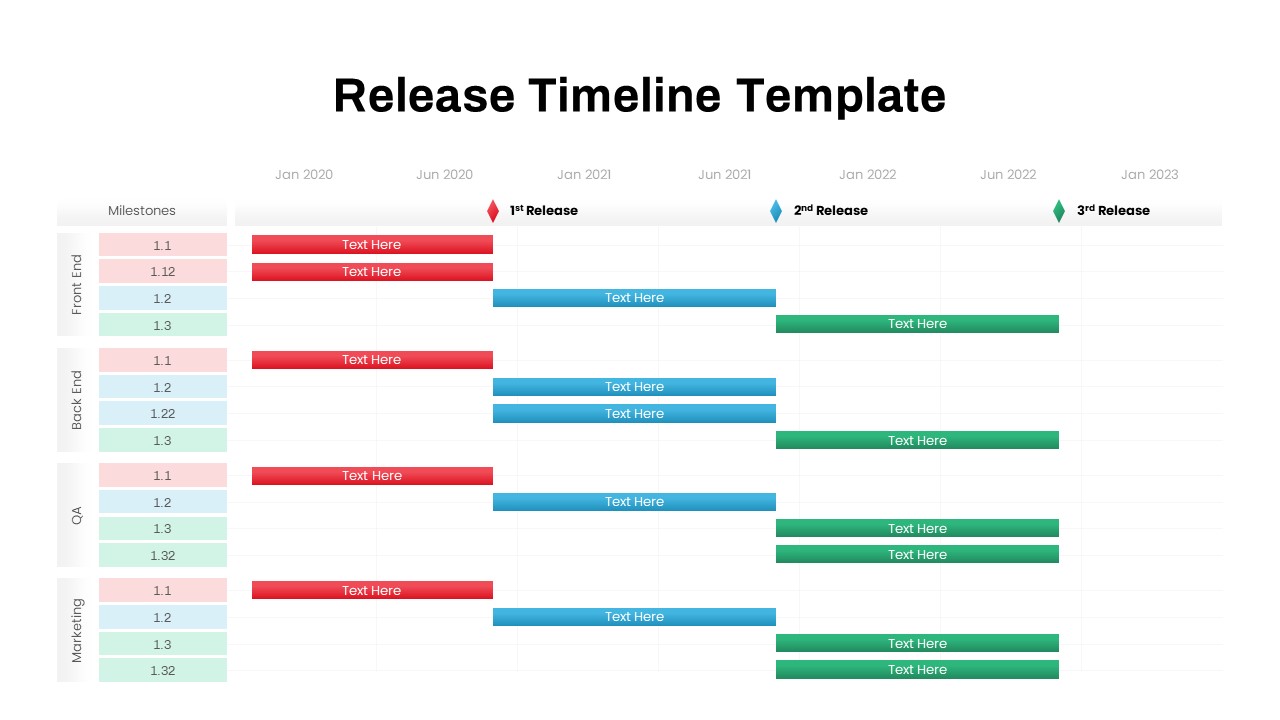
Multi-Team Multi-Phase Release Timeline Template for PowerPoint & Google Slides
Timeline
Multi-Phase Research Roadmap Infographic Template for PowerPoint & Google Slides
Roadmap
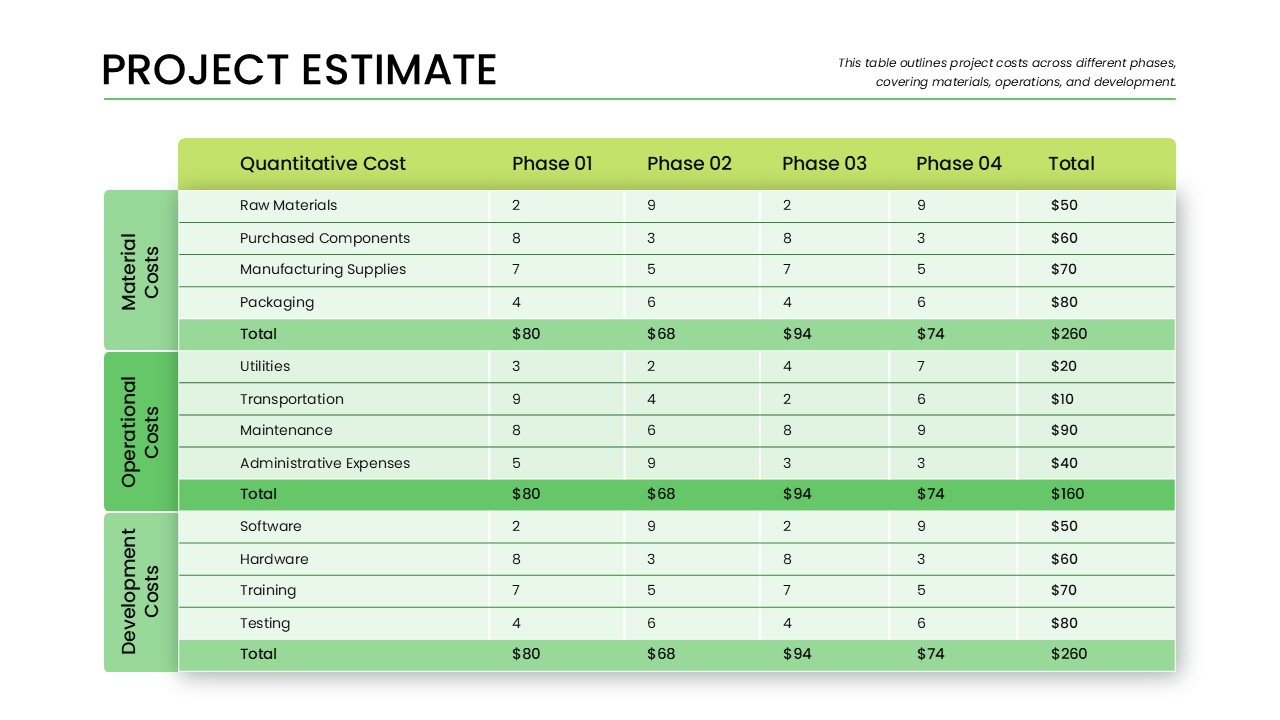
Phase-Wise Project Estimate Table Template for PowerPoint & Google Slides
Business Report
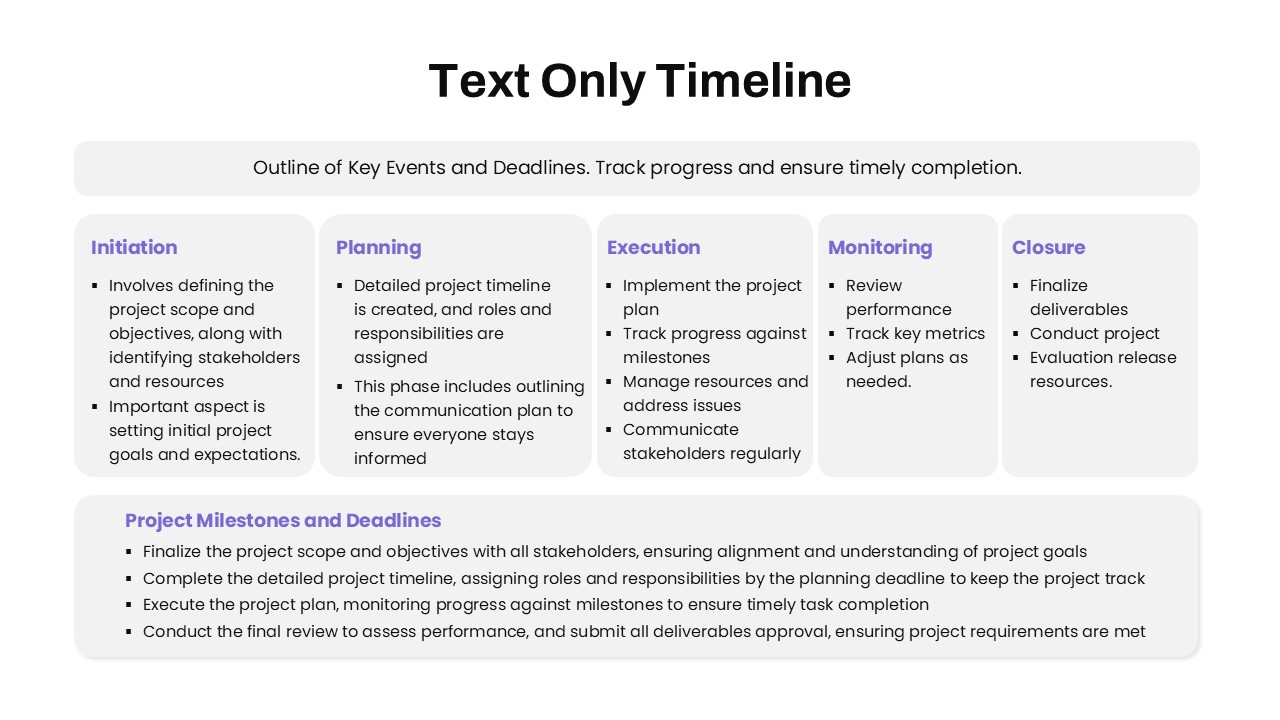
Text-Only Five-Phase Timeline Template for PowerPoint & Google Slides
Timeline

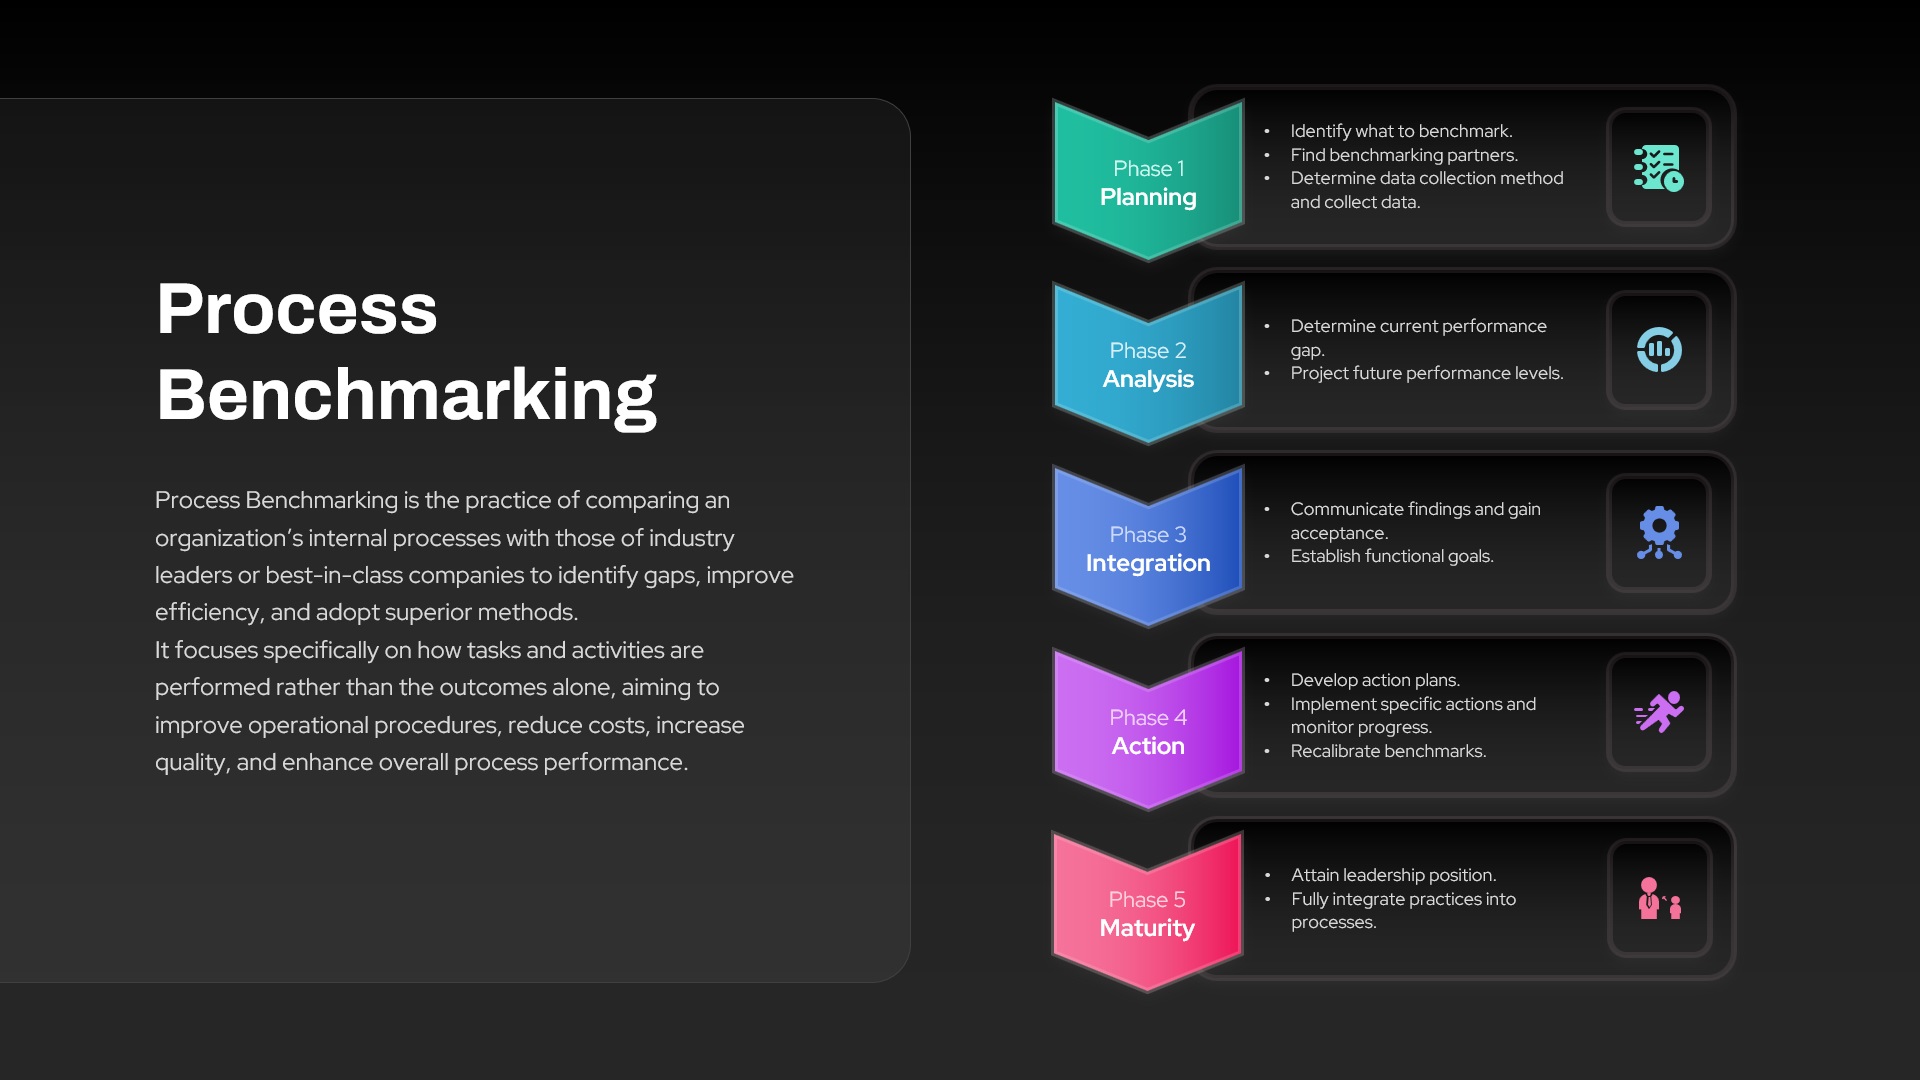
Process Benchmarking Five-Phase Framework Template for PowerPoint & Google Slides
Process
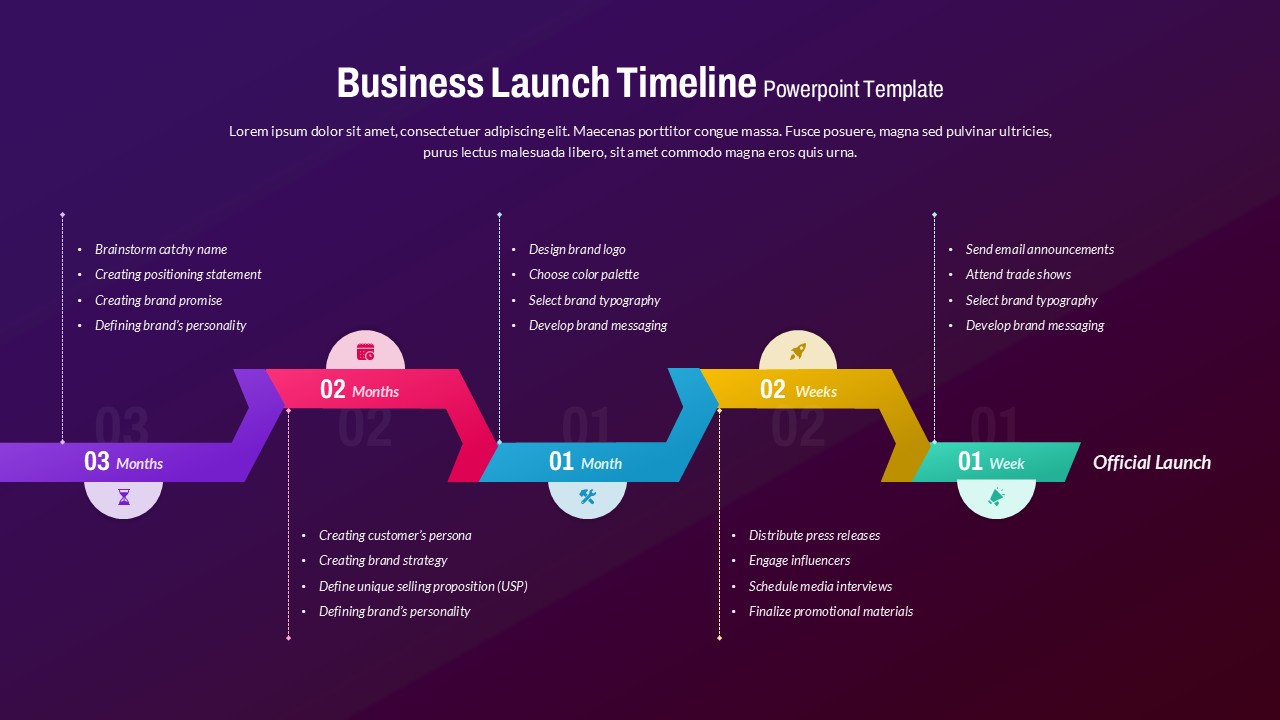
Business Launch Timeline Roadmap 5-Phase Template for PowerPoint & Google Slides
Business
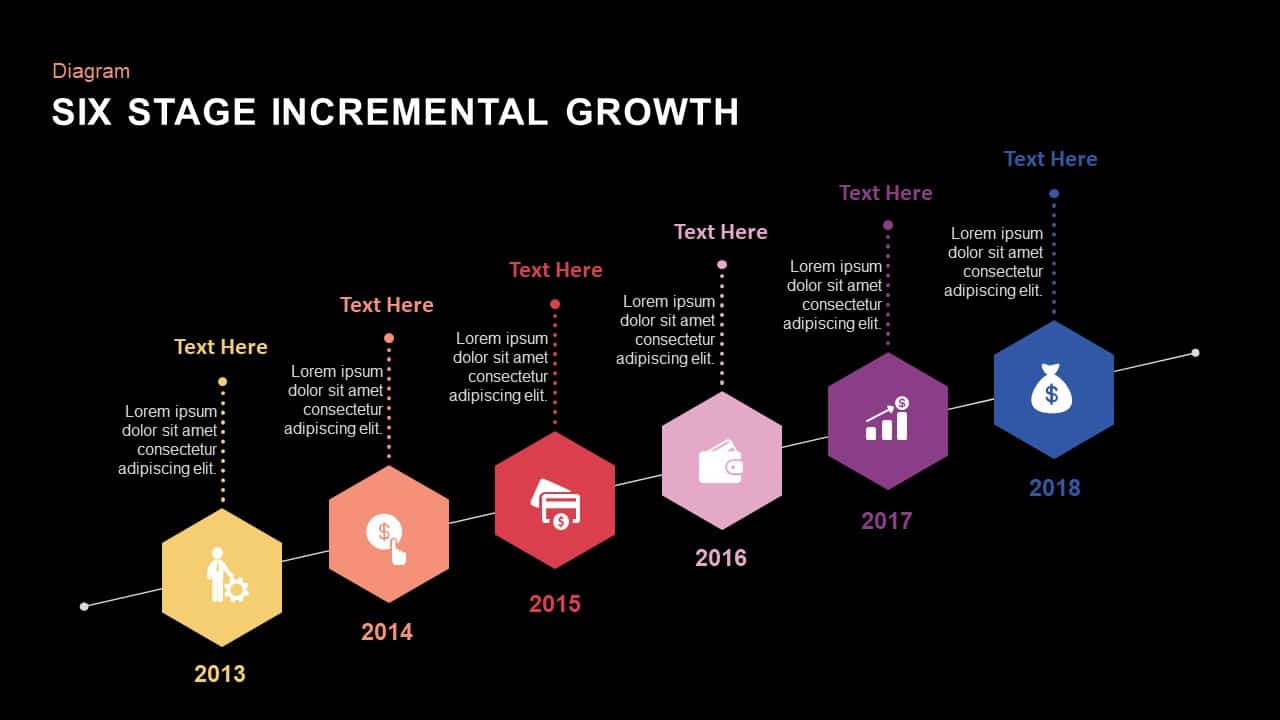
Six Stage Incremental Growth template for PowerPoint & Google Slides
Timeline

Growth Arrow for Progress & Growth template for PowerPoint & Google Slides
Arrow
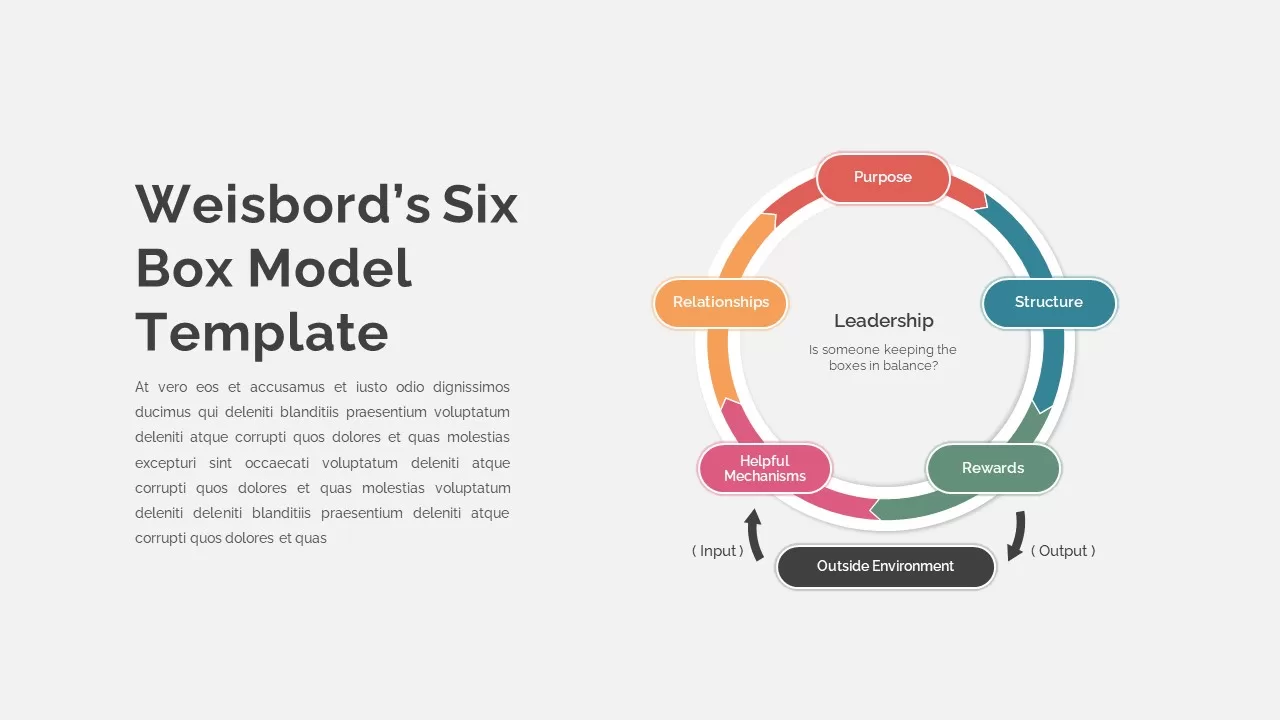
Weisbord’s Six Box Model Infographics Template for PowerPoint & Google Slides
Circular
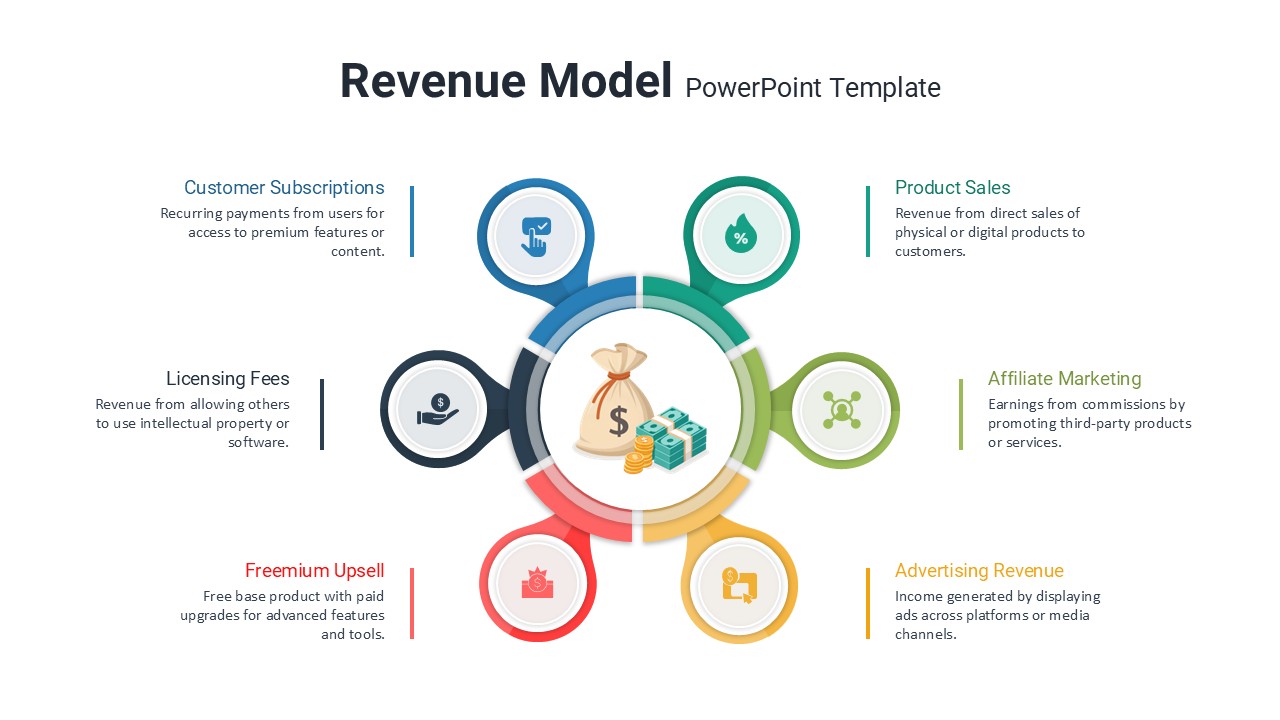
Six Revenue Stream Model Infographic Template for PowerPoint & Google Slides
Circular
Ansoff Matrix Growth Strategy Model Template for PowerPoint & Google Slides
BCG
Seeds Growth Cycle Business Model Template for PowerPoint & Google Slides
Process
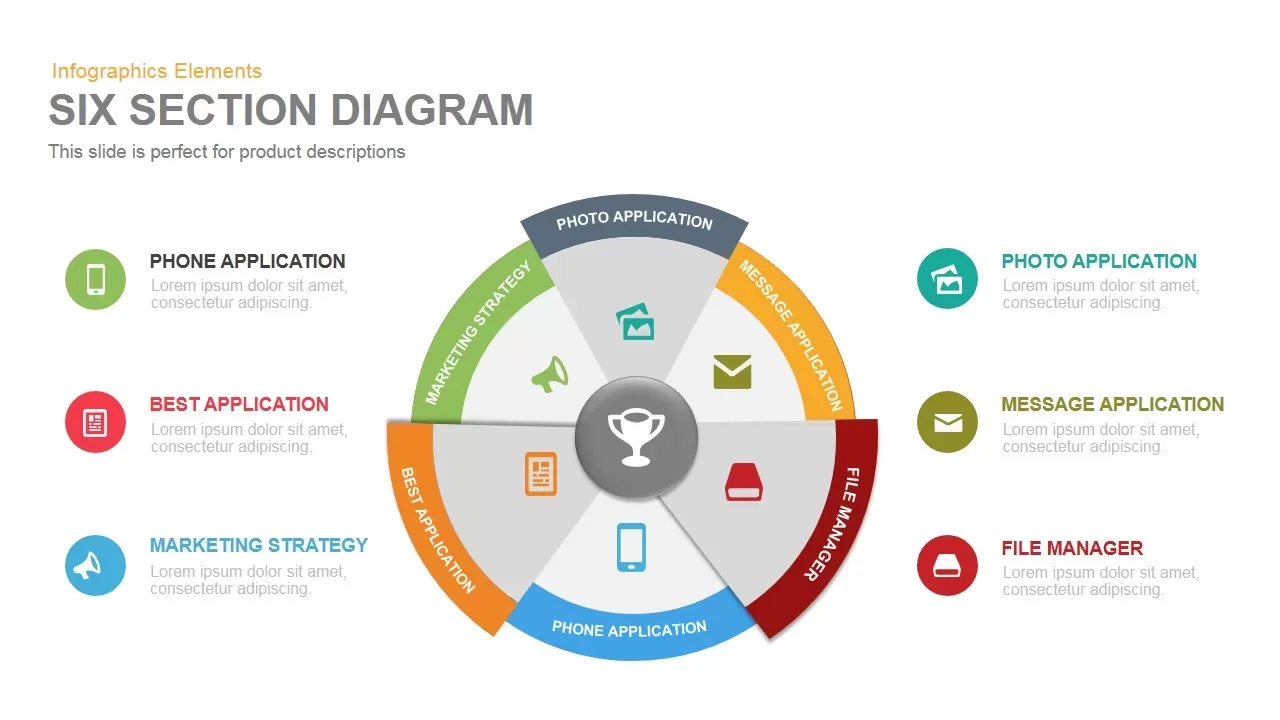
Six Section Diagram template for PowerPoint & Google Slides
Circular
Six Arrow Radial Process Diagram template for PowerPoint & Google Slides
Infographics
Six Step Creative Circular Diagram Template for PowerPoint & Google Slides
Circular
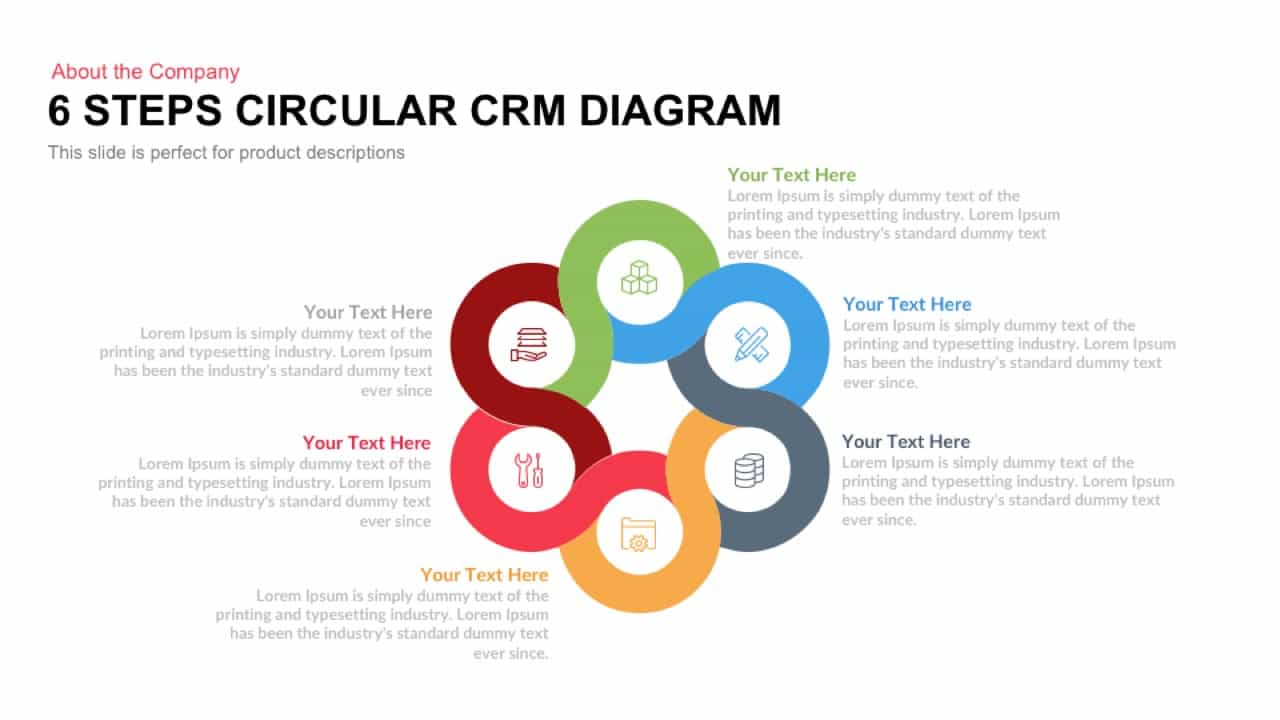
Six Steps Circular CRM Diagram Template for PowerPoint & Google Slides
Customer Journey
Six Hexagon Stages Process Flow Diagram Template for PowerPoint & Google Slides
Process
Six Stage Zigzag Process Diagram Template for PowerPoint & Google Slides
Process
Six Section Circular Infographic Diagram Template for PowerPoint & Google Slides
Circular

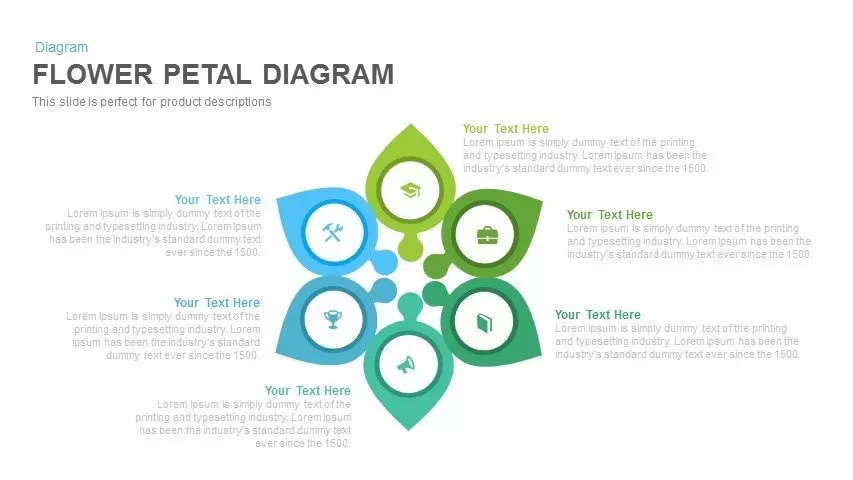
Six-Segment Flower Petal Diagram Template for PowerPoint & Google Slides
Circular
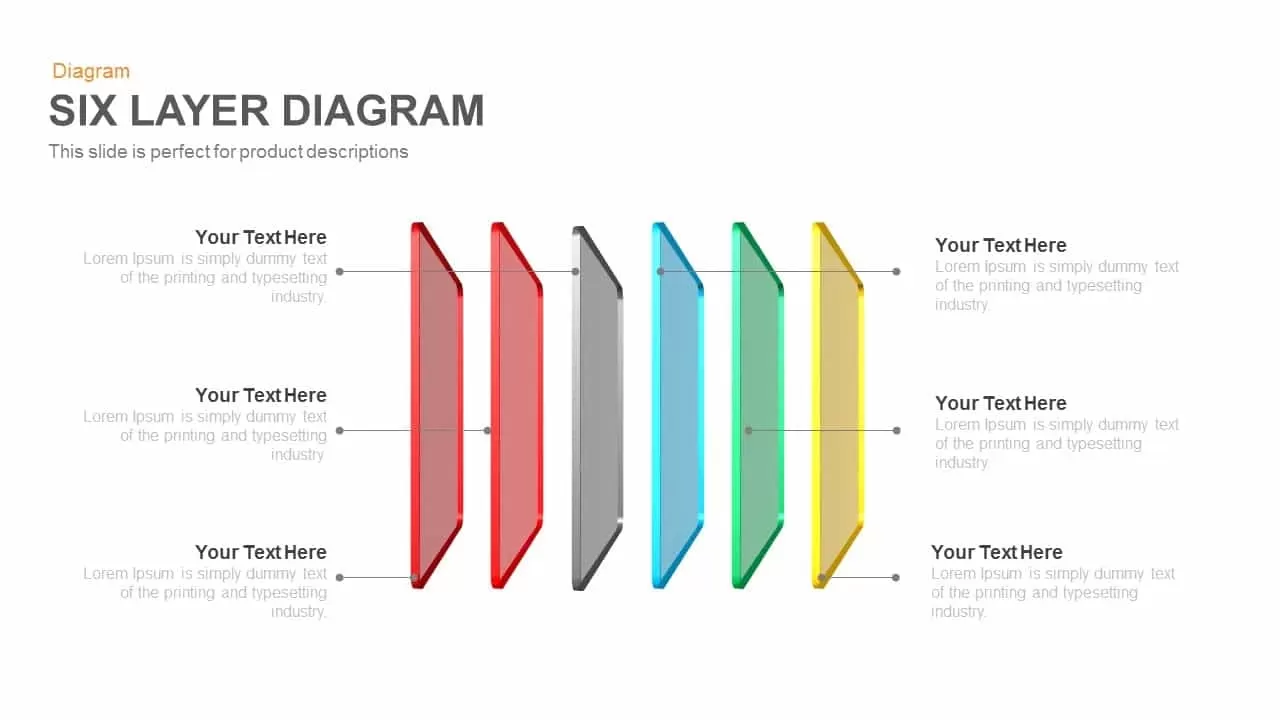
Six Layer Diagram template for PowerPoint & Google Slides
Process
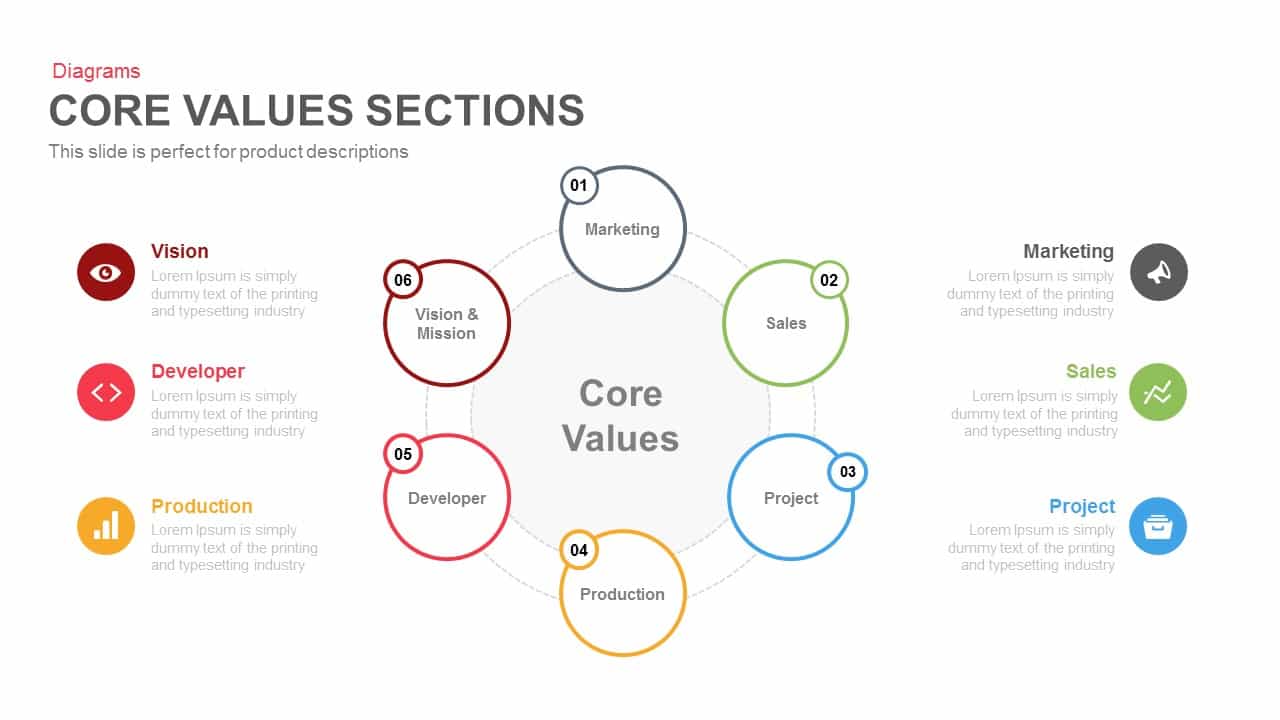
Six-Part Core Values Circular Diagram Template for PowerPoint & Google Slides
Circular
Roadmap Six-Step Process Diagram Template for PowerPoint & Google Slides
Roadmap
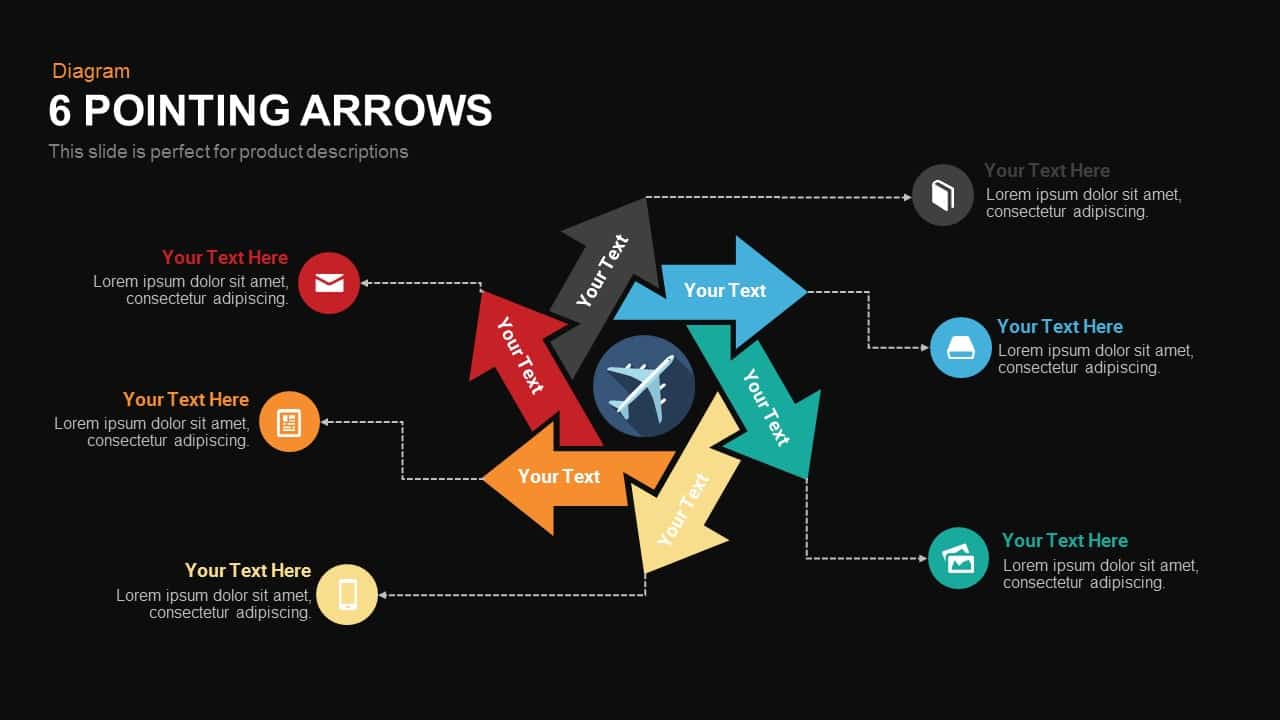
Six Pointing Arrow Process Diagram Template for PowerPoint & Google Slides
Arrow
Six-Stage Zig-Zag Process Flow Diagram Template for PowerPoint & Google Slides
Process
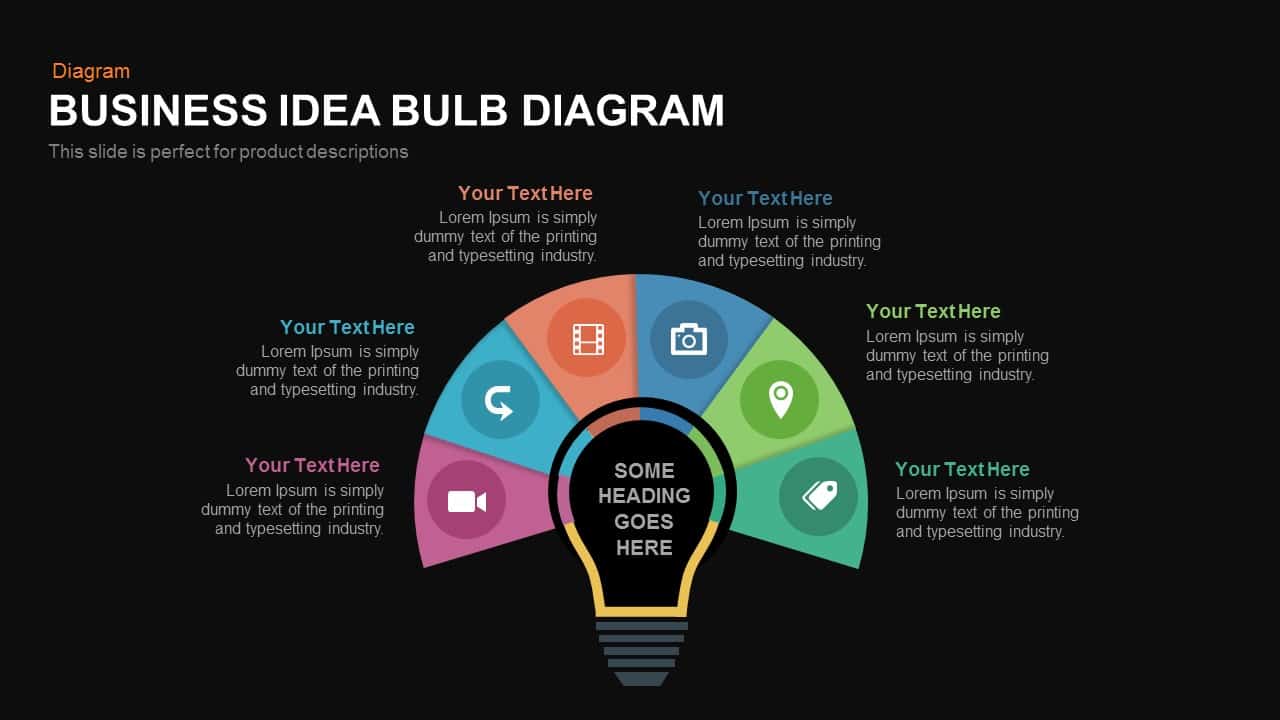
Six-Part Business Idea Bulb Diagram Template for PowerPoint & Google Slides
Circular
Six-Stage Semi-Circle Diagram with Icons Template for PowerPoint & Google Slides
Circular
Six-Sided Shutter Diagram Process Flow Template for PowerPoint & Google Slides
Process
Six-Stage Circular Cycle Diagram Template for PowerPoint & Google Slides
Process
Six-Staged Gear Diagram Framework Template for PowerPoint & Google Slides
Process
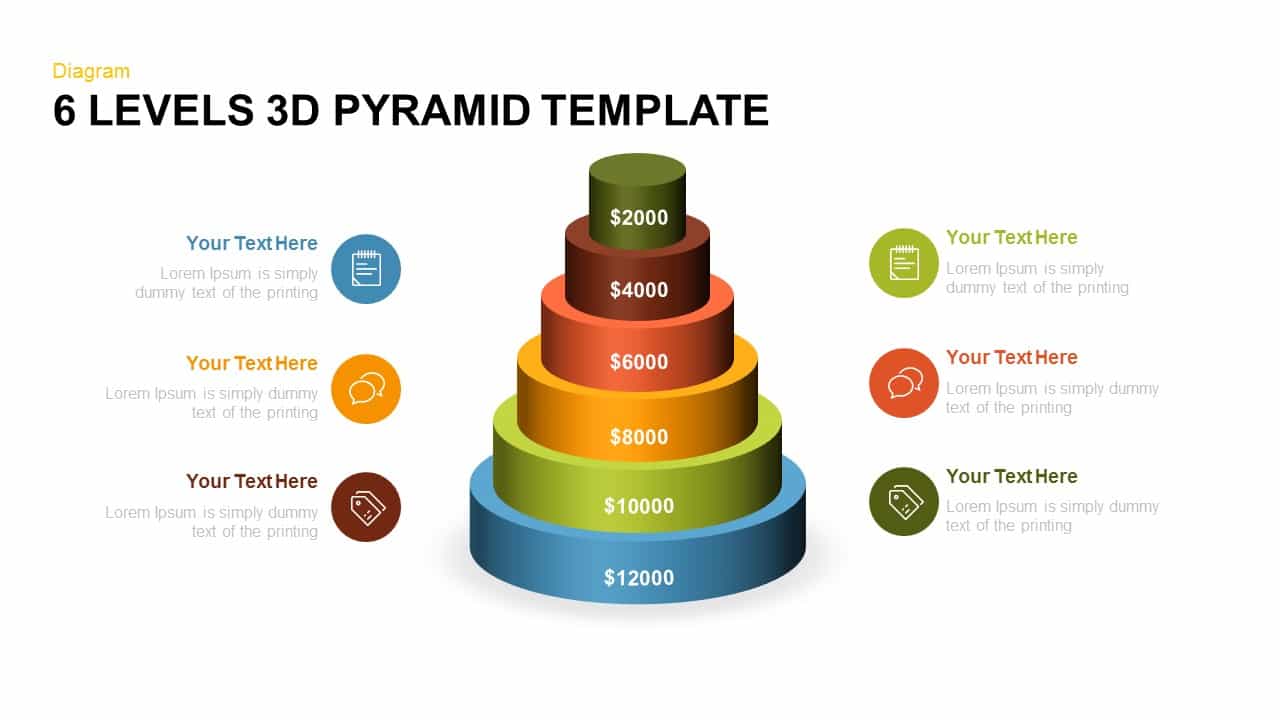
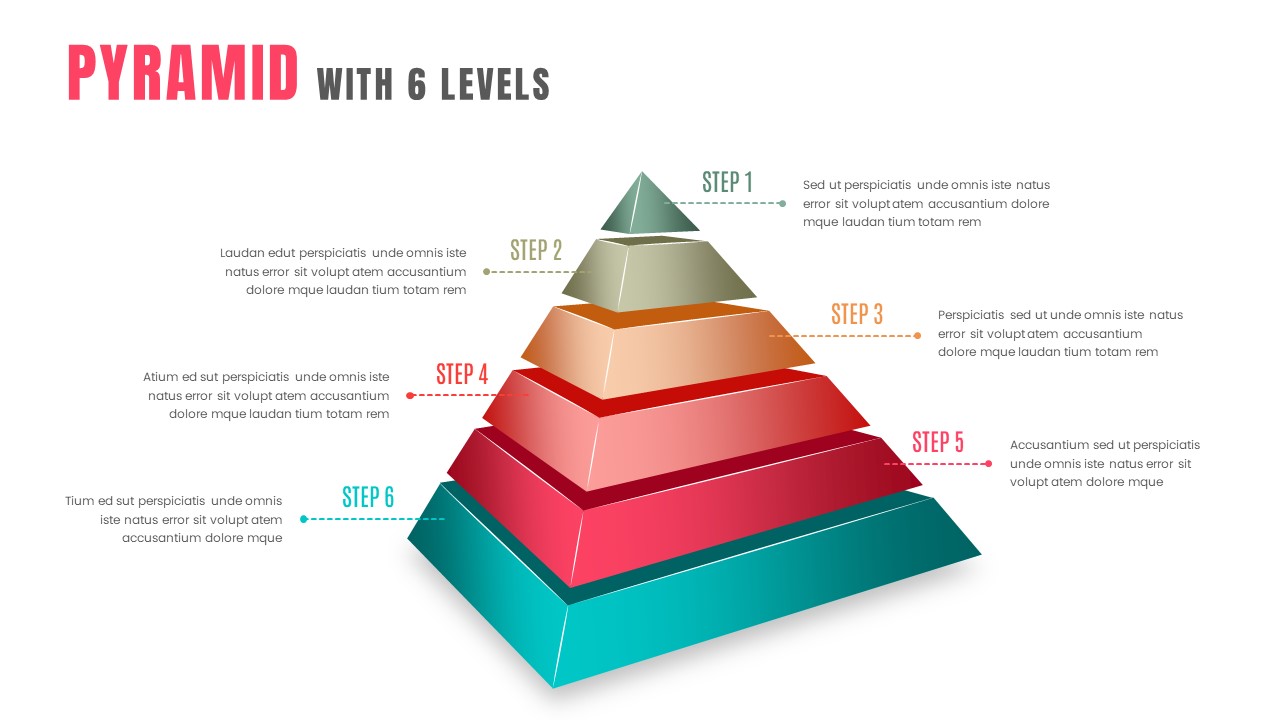
Editable Six-Level 3D Pyramid Diagram Template for PowerPoint & Google Slides
Pyramid
Editable Six-Step Bubble Process Diagram Template for PowerPoint & Google Slides
Process
Six-Process Circular Arrow Diagram Template for PowerPoint & Google Slides
Circular
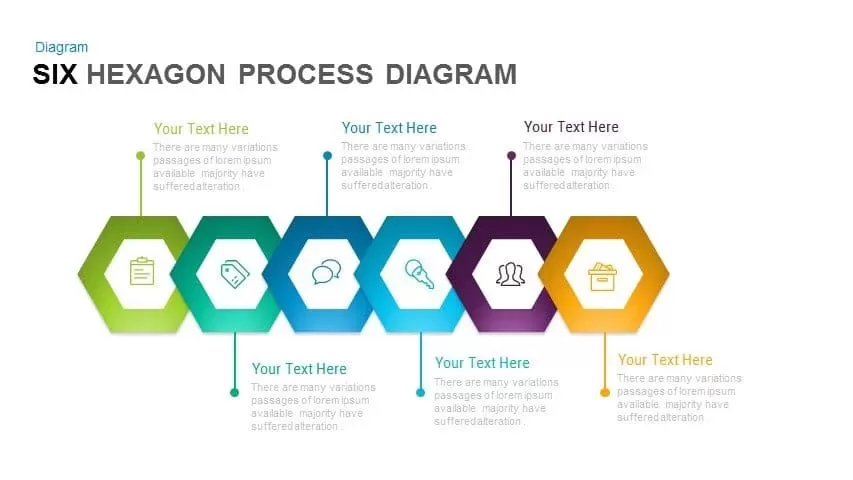
Six-Step Hexagon Process Diagram Template for PowerPoint & Google Slides
Process
Free Six Stage Bubble Process Diagram template for PowerPoint & Google Slides
Process
Free
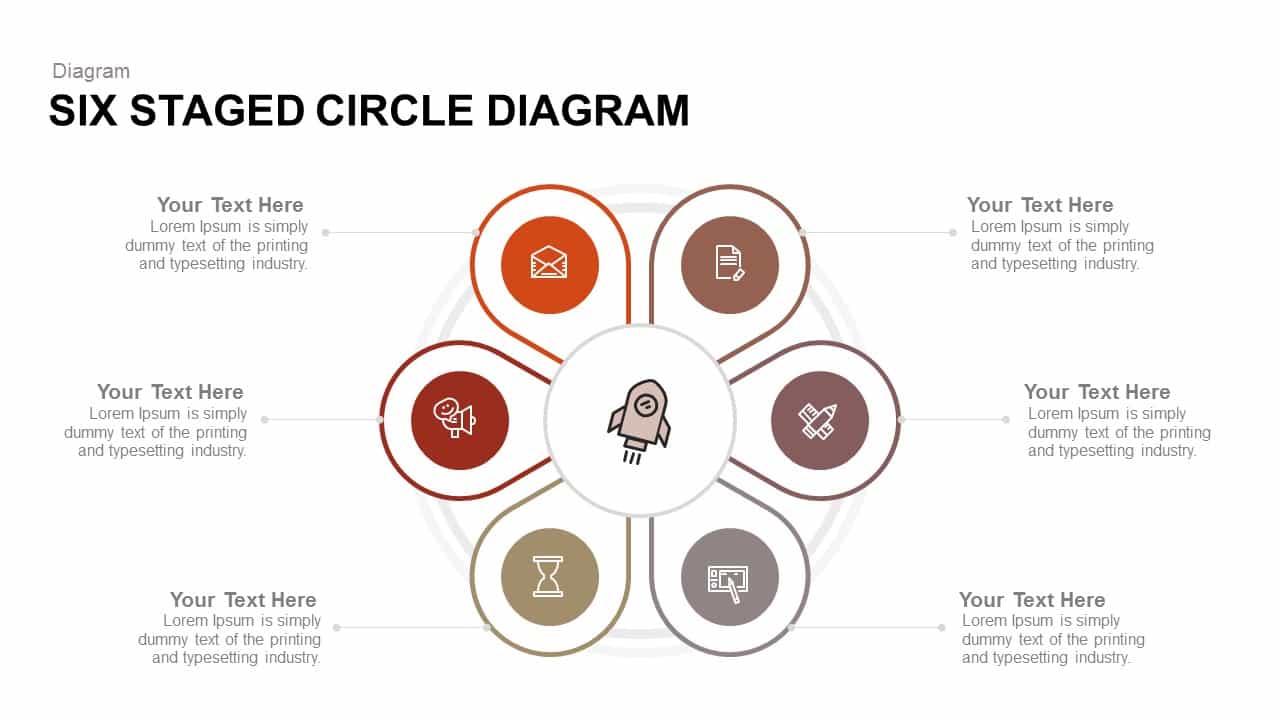
Six Staged Circle Diagram template for PowerPoint & Google Slides
Circular
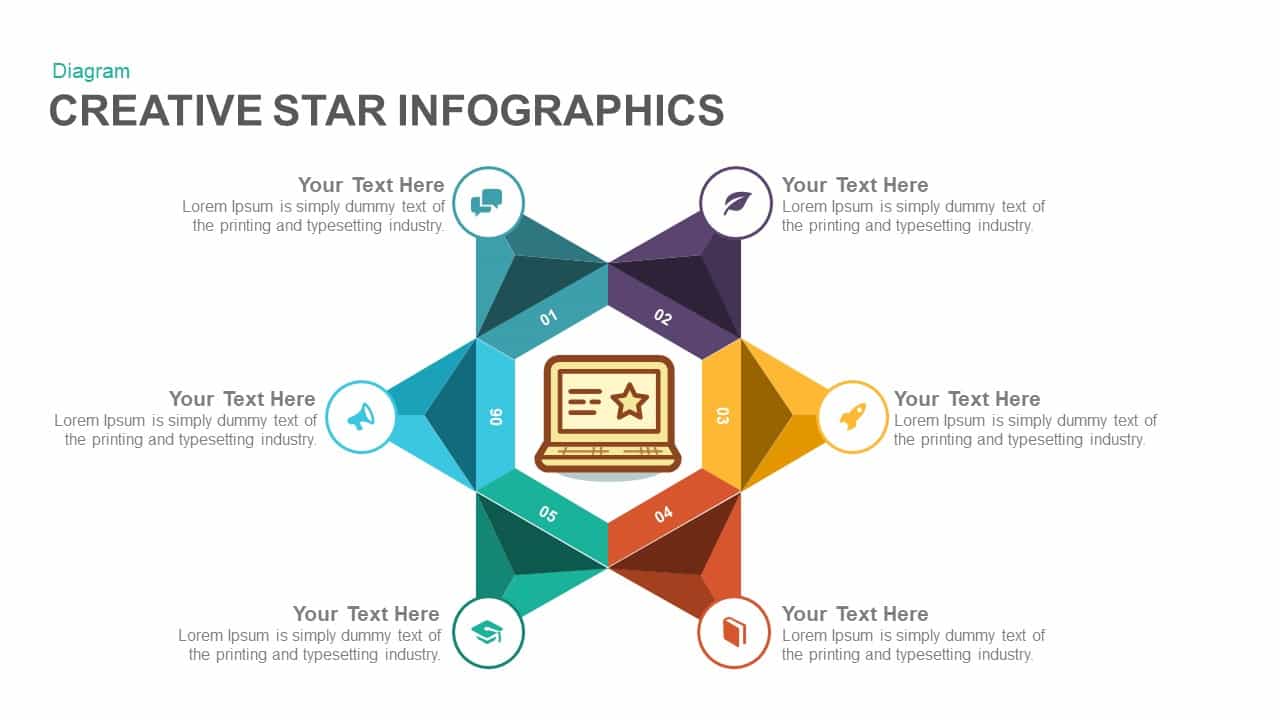
Six-Section Star Infographic Diagram Template for PowerPoint & Google Slides
Circular
Six Hexagon Hub-and-Spoke Diagram Template for PowerPoint & Google Slides
Process
Six-Step Two-Sided Arrow Diagram Template for PowerPoint & Google Slides
Process

Six-Stage Circular Process Diagram Template for PowerPoint & Google Slides
Process
Six Stage Circular Diagram with Icons Template for PowerPoint & Google Slides
Circular
Six Segment Hexagon Circular Diagram Template for PowerPoint & Google Slides
Circular
Six-Step Hexagonal Diagram Slide Template for PowerPoint & Google Slides
Circular
Six-Stage Circle Process Diagram Template for PowerPoint & Google Slides
Process
Six-Step Vertical Process Diagram Template for PowerPoint & Google Slides
Process
Six Sigma Gear Process Diagram Template for PowerPoint & Google Slides
Process
Three to Six Staged Circular Diagram Template for PowerPoint & Google Slides
Process
Free Six-Stage Arrow Process Diagram Template for PowerPoint & Google Slides
Process
Free
Six-Step Linear Arrow Process Diagram Template for PowerPoint & Google Slides
Process
Six-Stage Gear Wheel Diagram Template for PowerPoint & Google Slides
Circular
Six-Stage Circular Diagram Process Template for PowerPoint & Google Slides
Circular
Six-Step Hexagon Process Flow Diagram Template for PowerPoint & Google Slides
Process
Six-Stage Arrow Timeline Diagram Template for PowerPoint & Google Slides
Timeline
Six Stage Hexagon Process Diagram Template for PowerPoint & Google Slides
Process
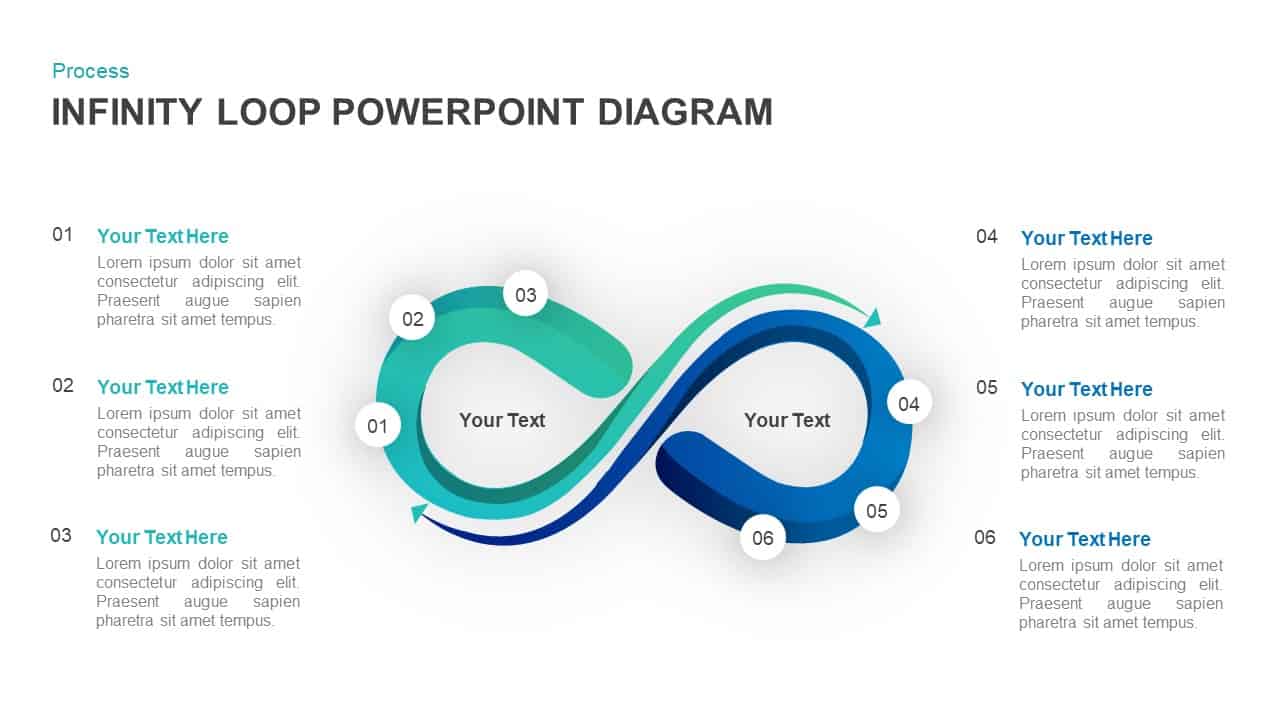
Six-Stage Infinity Loop Process Diagram Template for PowerPoint & Google Slides
Process
Six-Stage Clockwise Circular Diagram Template for PowerPoint & Google Slides
Circular
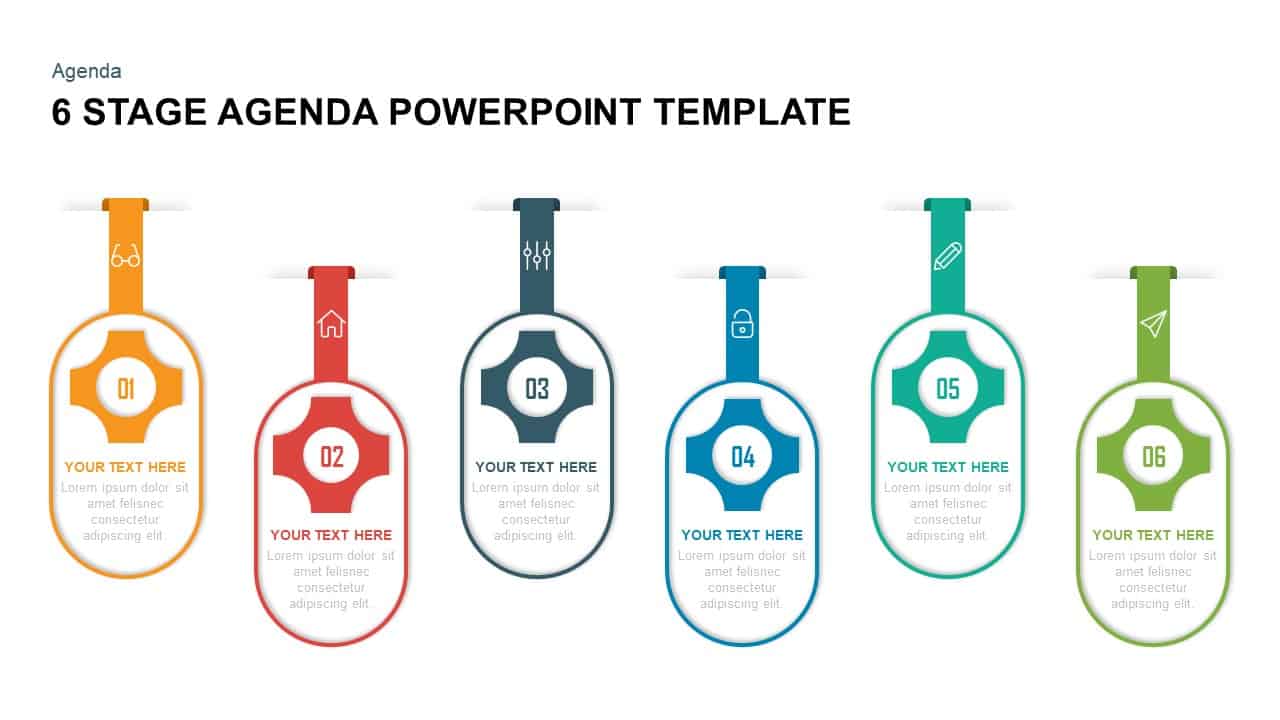
Six Stage Agenda Timeline Diagram template for PowerPoint & Google Slides
Agenda
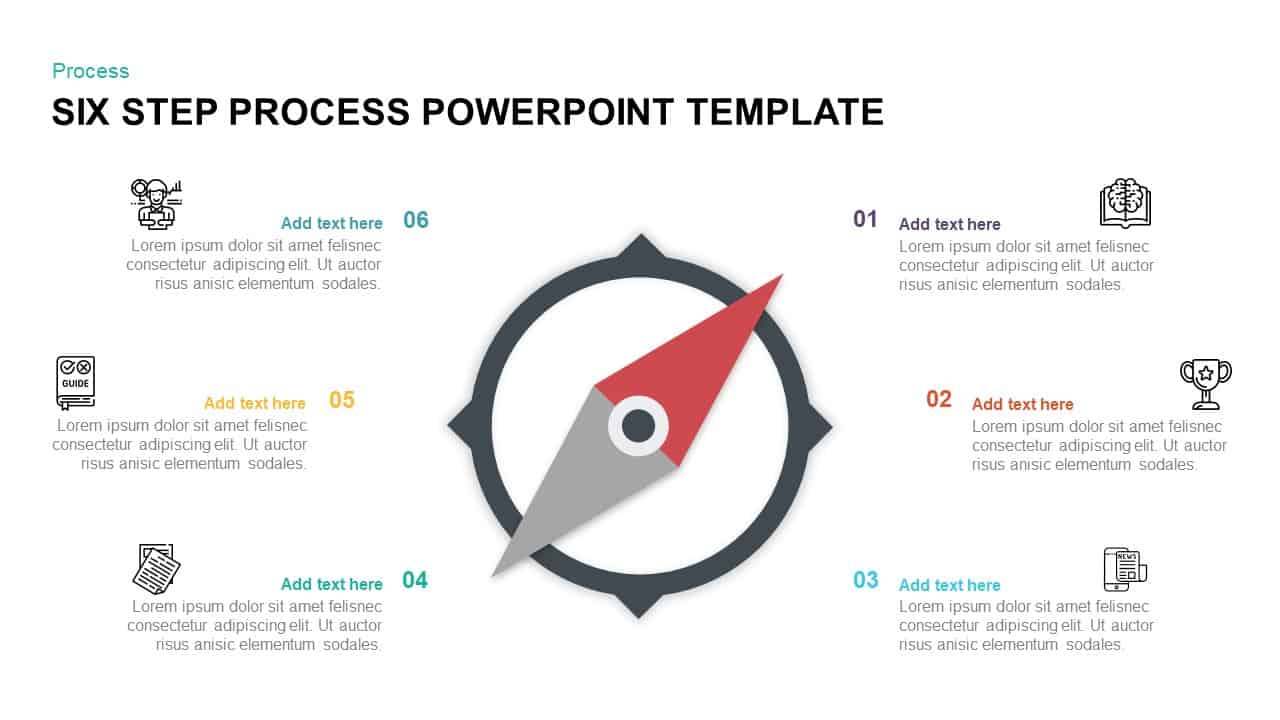
Compass-Themed Six-Step Process Diagram Template for PowerPoint & Google Slides
Process
Six-Stage Circular Flow Diagram Template for PowerPoint & Google Slides
Circular
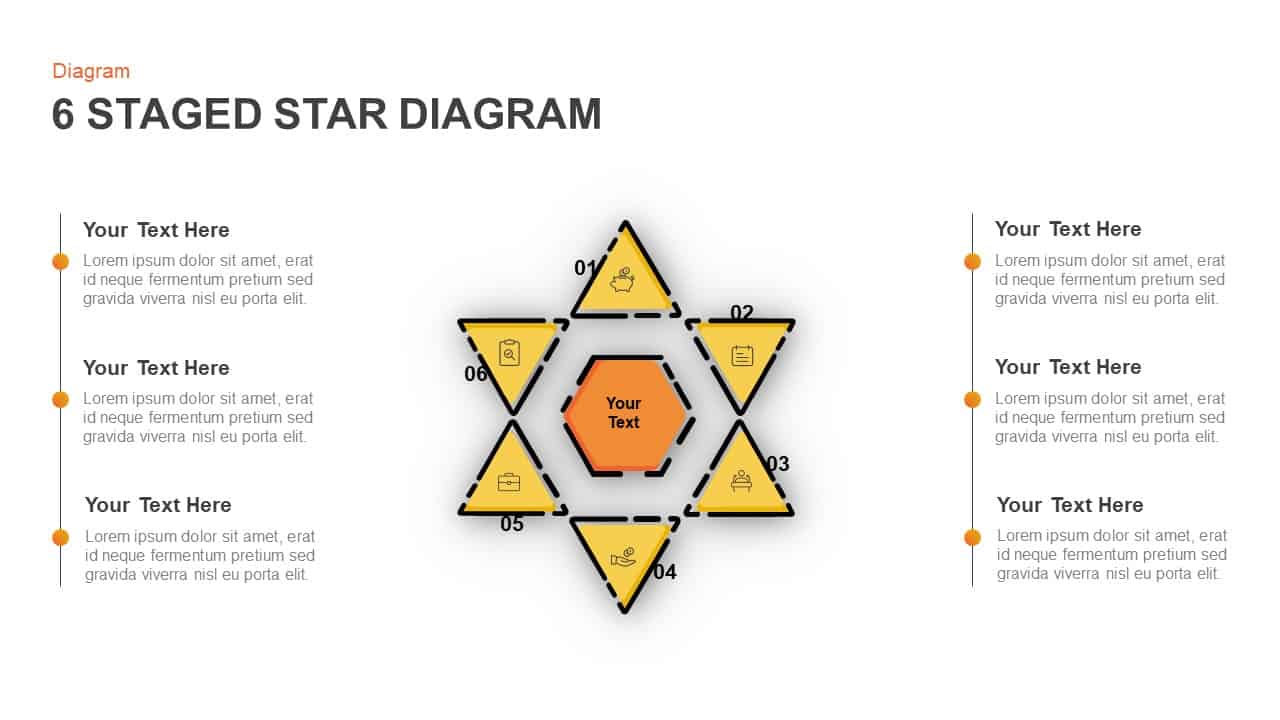
Six-Stage Star Diagram Infographic Template for PowerPoint & Google Slides
Process
Six-Step Infinity Loop Process Diagram Template for PowerPoint & Google Slides
Process
Six Sigma 6S Process Infographic Diagram Template for PowerPoint & Google Slides
Process
Six Sigma 6S Process Diagram Template for PowerPoint & Google Slides
Process
Six-Step Tree Diagram Infographic Template for PowerPoint & Google Slides
Infographics
Six-Circle Process Infographic Diagram Template for PowerPoint & Google Slides
Circular
Six-Stage Infinity Loop Diagram Template for PowerPoint & Google Slides
Process
Six-Step Output Process Diagram Template for PowerPoint & Google Slides
Process
Six-Step Circular Diagram Infographics Template for PowerPoint & Google Slides
Circular
Circular 3D Cube Six-Segment Diagram Template for PowerPoint & Google Slides
Infographics
Stacked Cubes Pyramid Six-Option Diagram Template for PowerPoint & Google Slides
Pyramid
Animated Six-Stage 3D Process Diagram Template for PowerPoint & Google Slides
Arrow
Six-Piece Puzzle Diagram Template for PowerPoint & Google Slides
Process
Colorful Six-Piece Puzzle Diagram Template for PowerPoint & Google Slides
Infographics
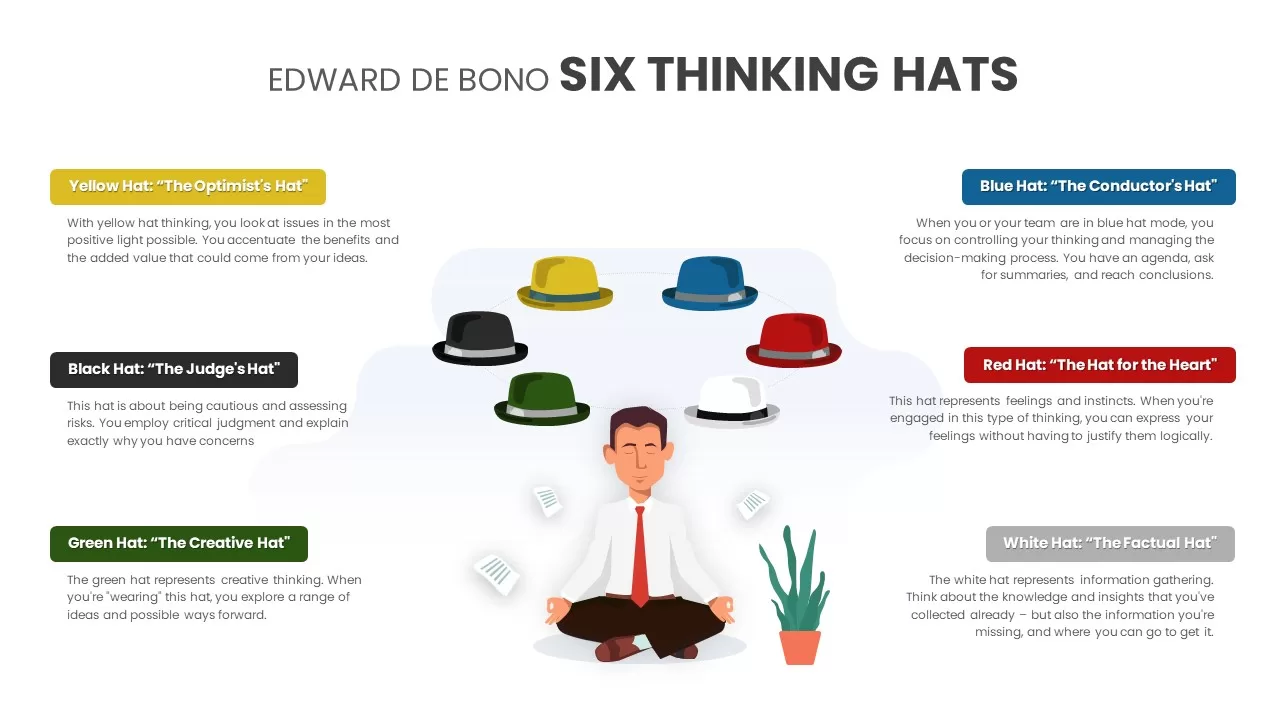
Six Thinking Hats Diagram Presentation Template for PowerPoint & Google Slides
Infographics
Six-Step Business Analysis Diagram template for PowerPoint & Google Slides
Circular
Six-Step Colorful Flywheel Diagram Template for PowerPoint & Google Slides
Circular
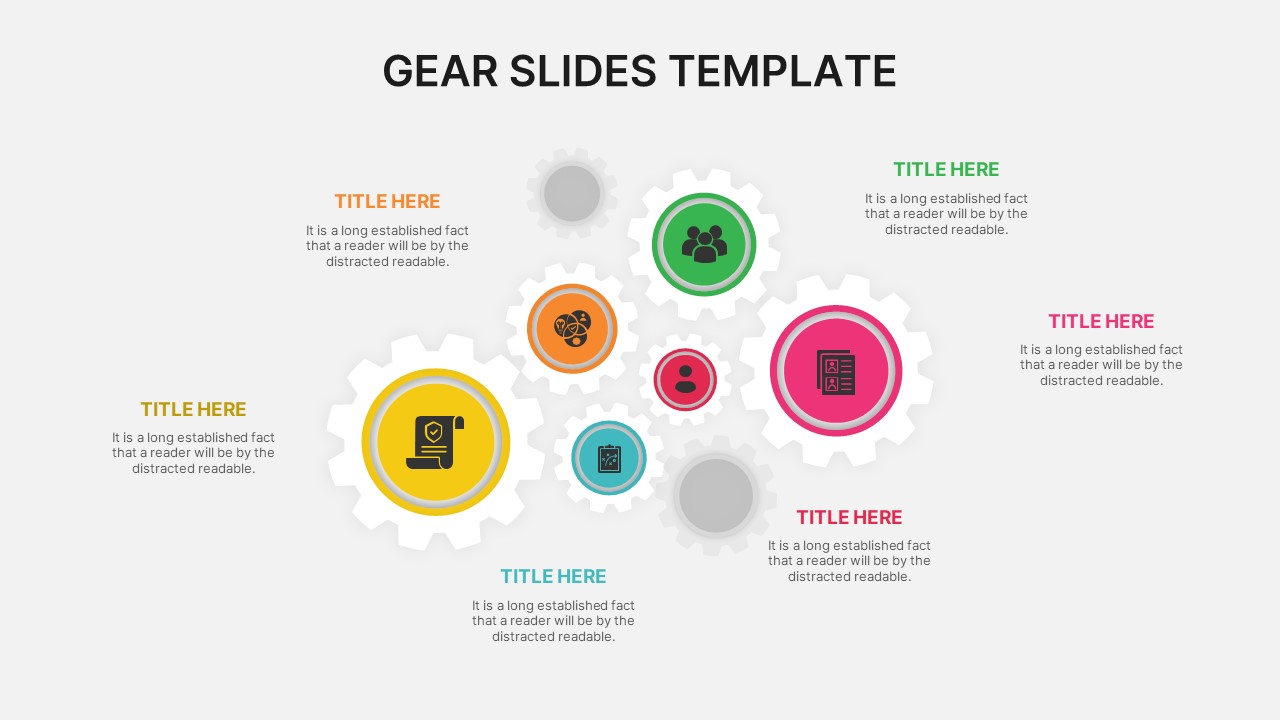
Six-Option Gear Diagram Slide Template for PowerPoint & Google Slides
Circular
3D Six-Level Pyramid Diagram Infographic Template for PowerPoint & Google Slides
Pyramid
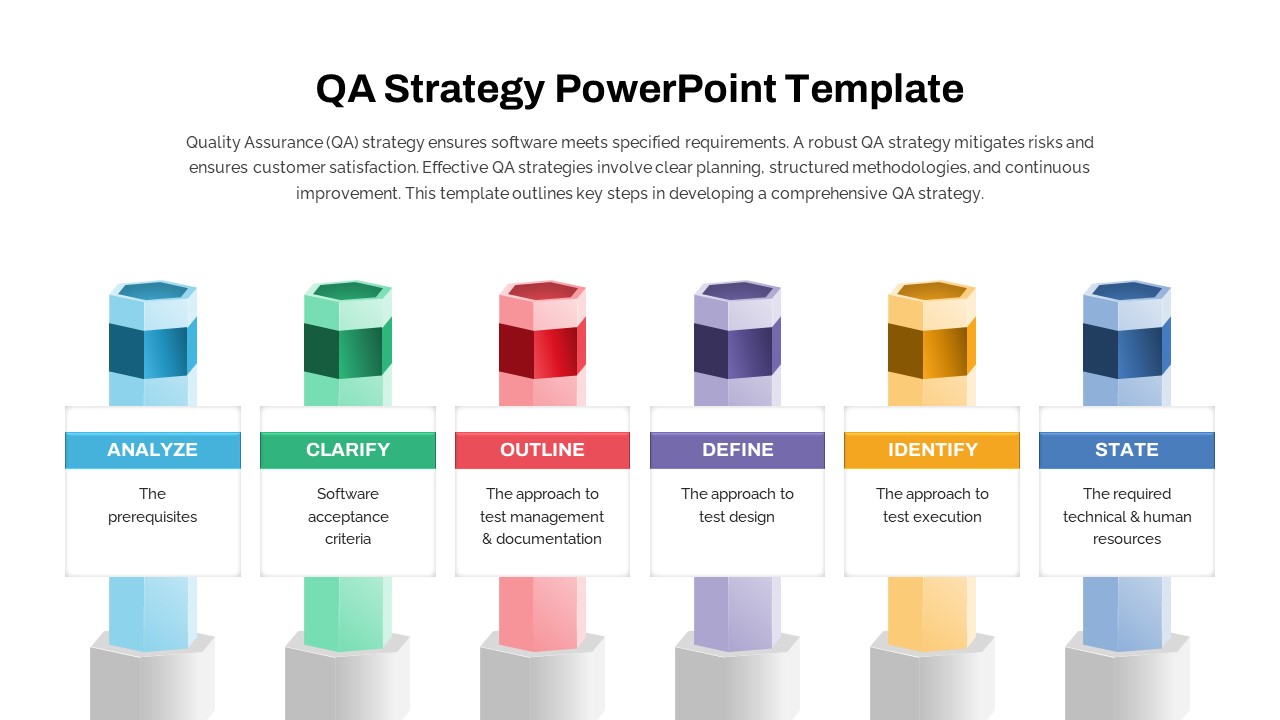
Six-Step QA Strategy Pillar Diagram Template for PowerPoint & Google Slides
Software Development
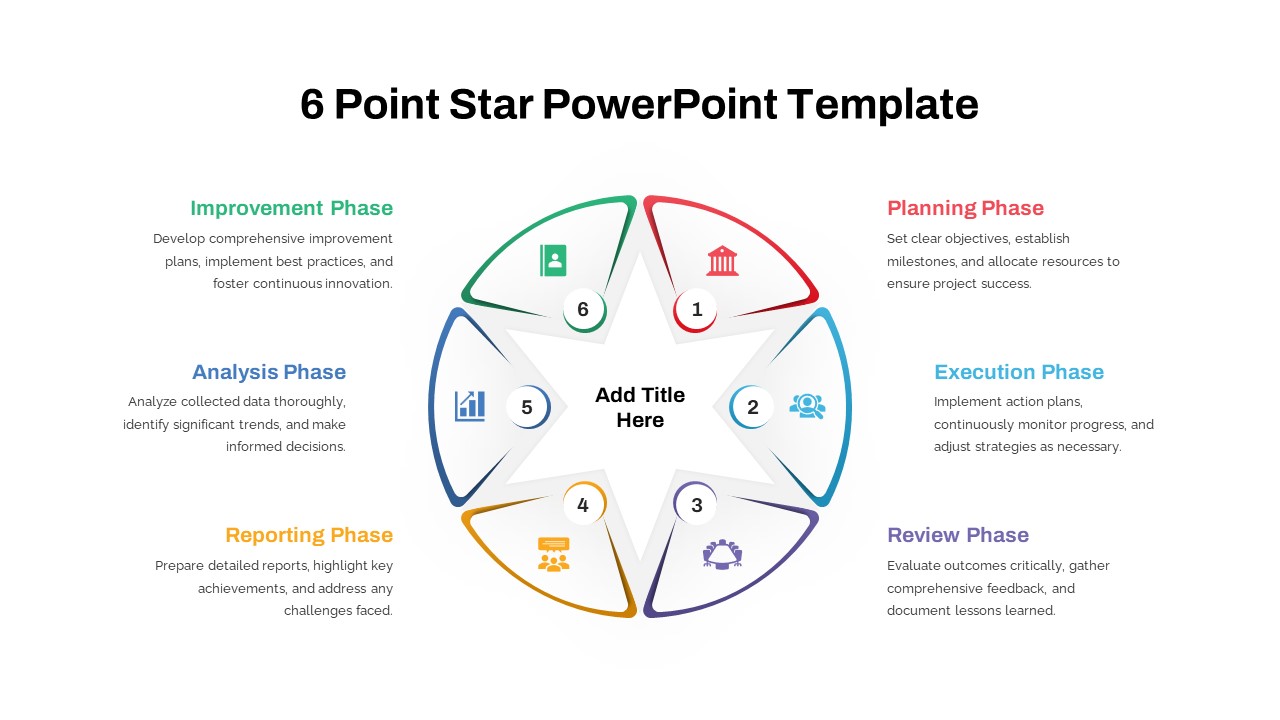
Six-Point Star Process Diagram Template for PowerPoint & Google Slides
Process
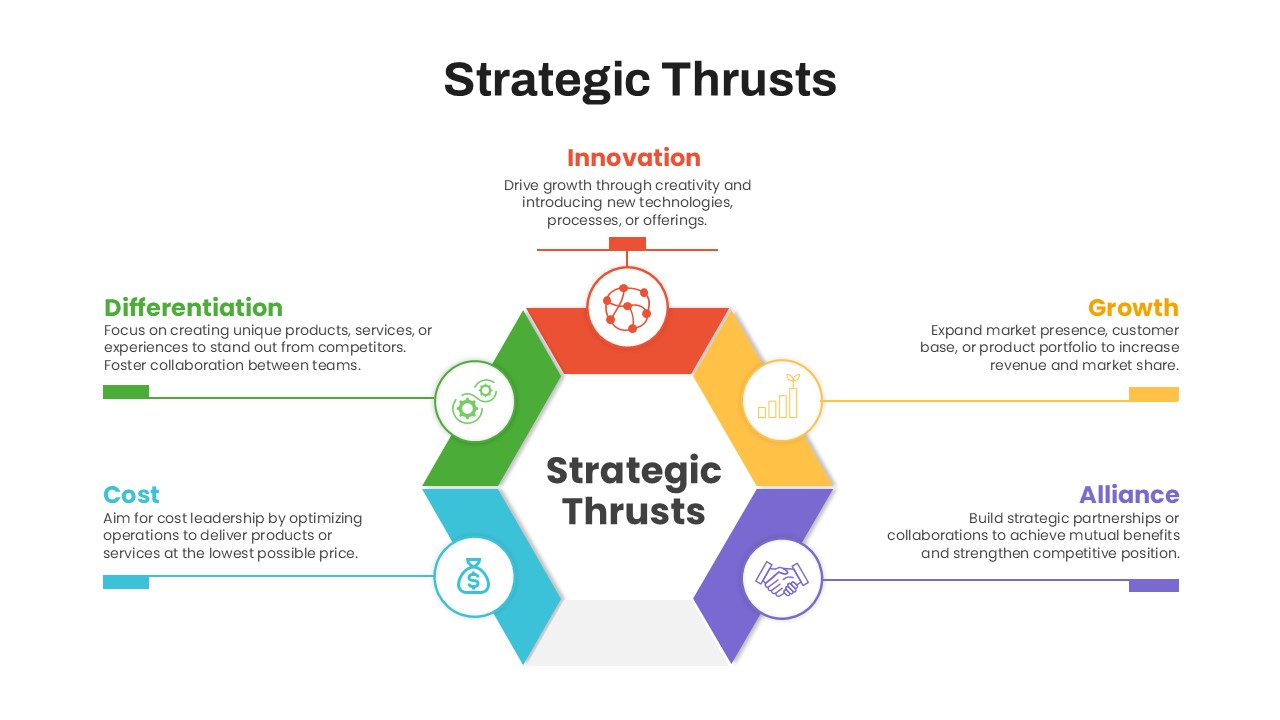
Six-Step Strategic Thrusts Diagram Slide Template for PowerPoint & Google Slides
Process
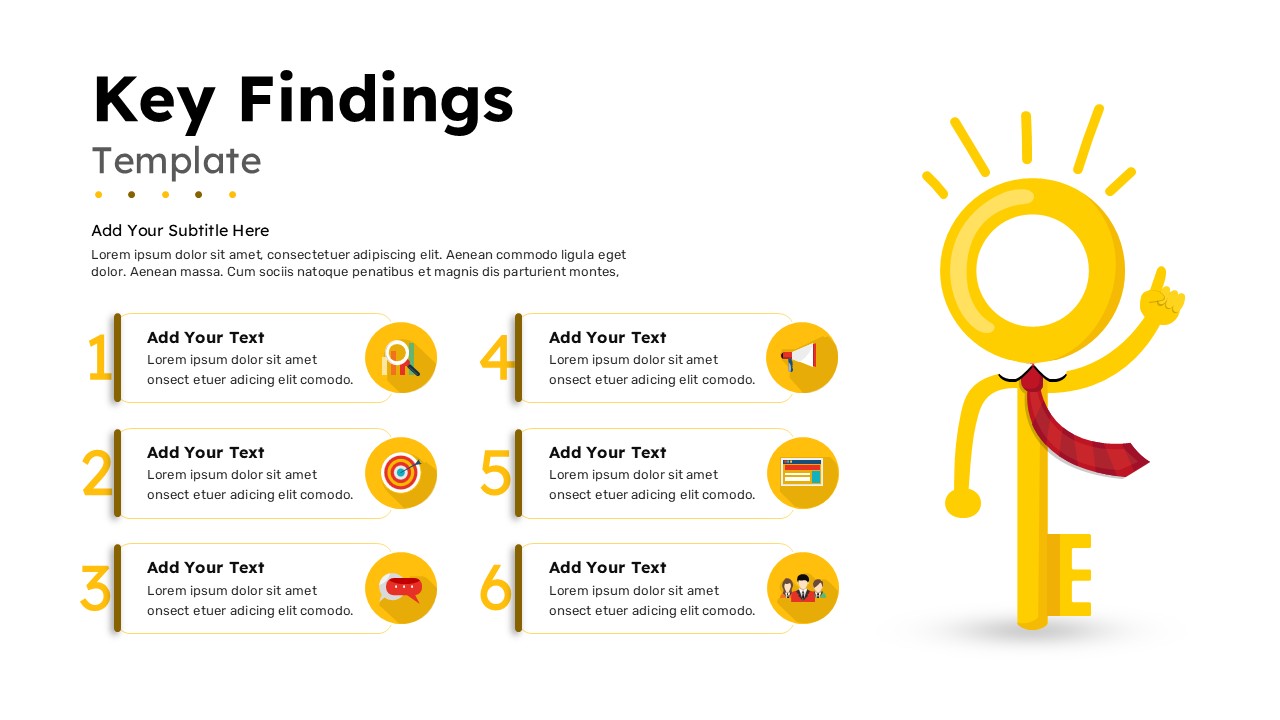
Key Findings Six-Step Diagram Template for PowerPoint & Google Slides
Business Report
Six Stage Timeline Diagram for PowerPoint & Google Slides
Timeline
Five and Six Step Line Linear Stage Diagram for PowerPoint & Google Slides
Infographics
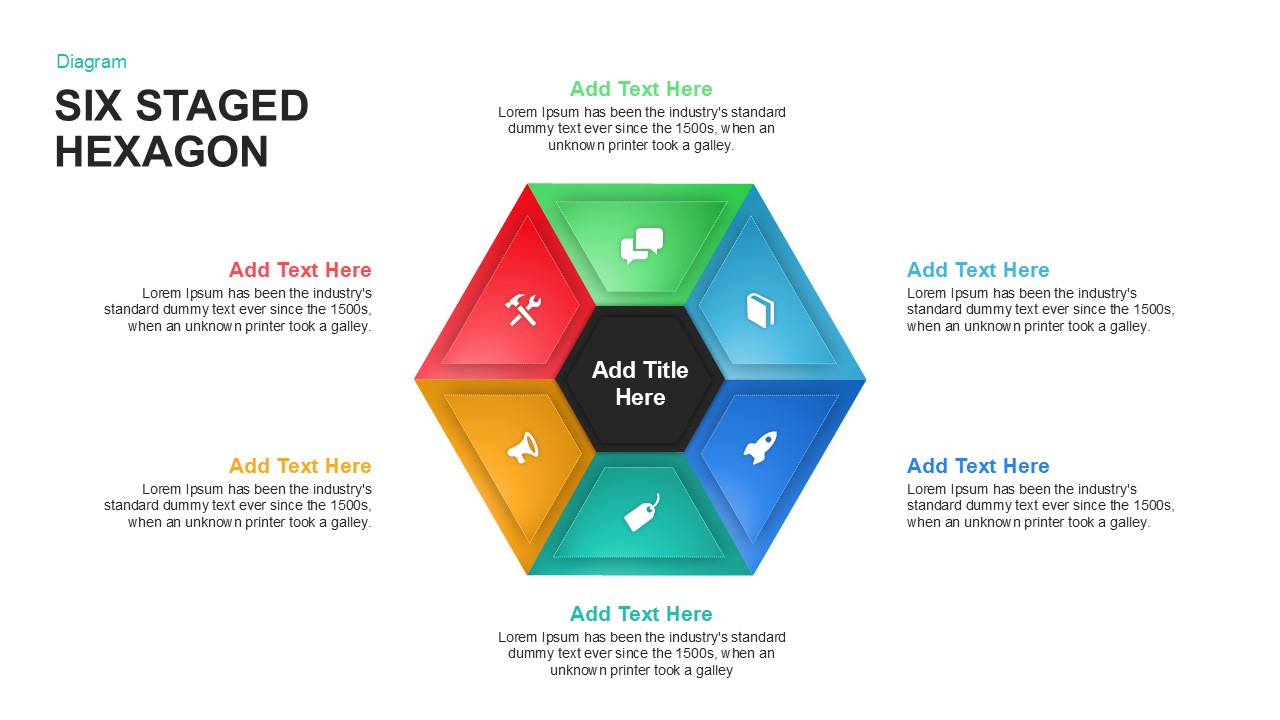
Six Staged Hexagon Diagram for PowerPoint & Google Slides
Process
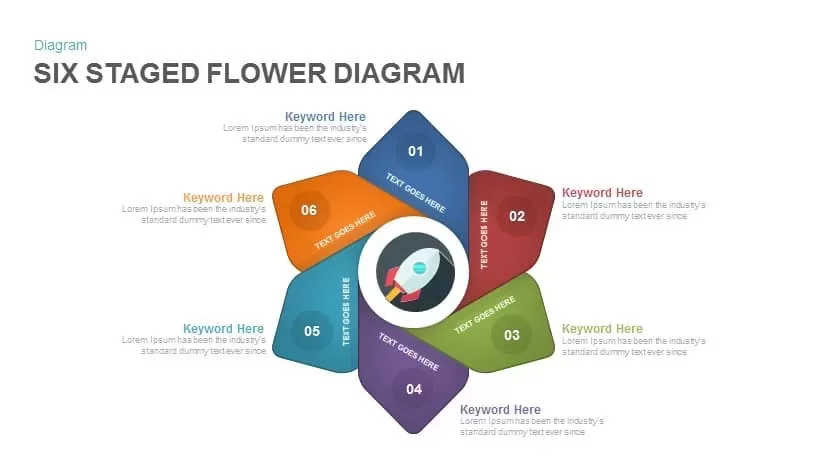
Six Staged Flower Diagram for PowerPoint & Google Slides
Process
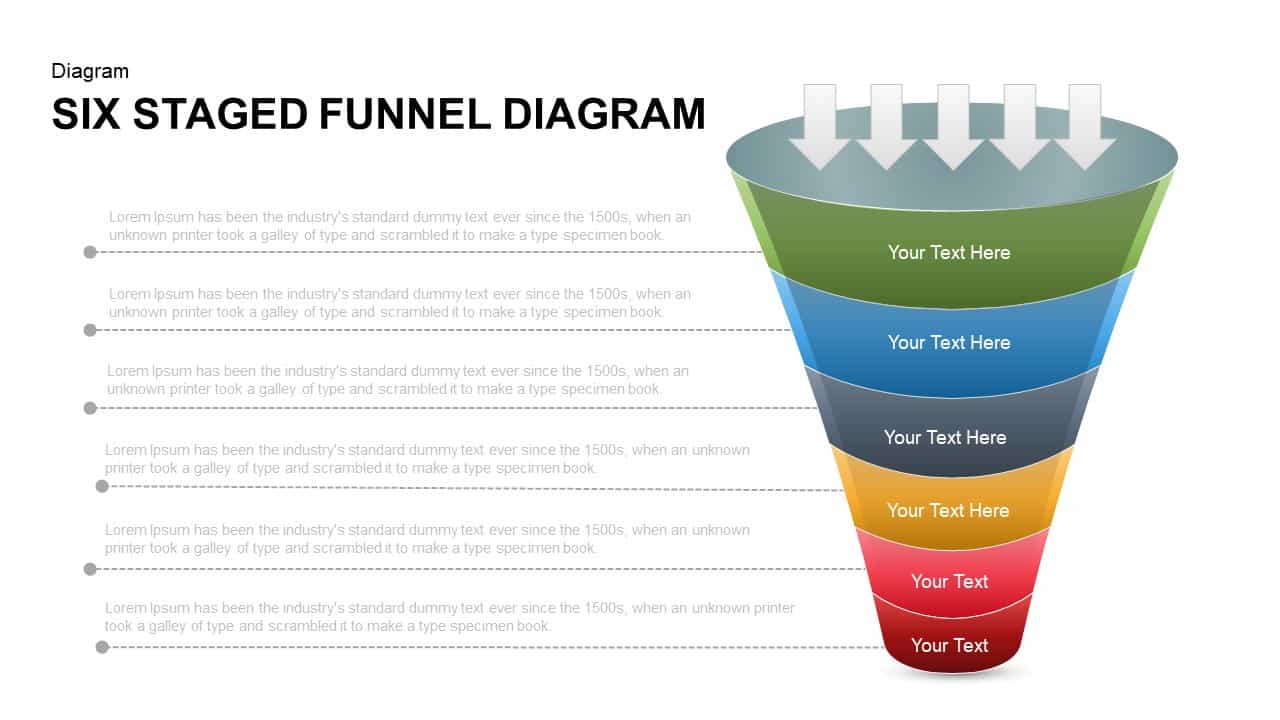
Six Staged Funnel Diagram for PowerPoint & Google Slides
Funnel