Goal-Setting Process Flow Diagram Template for PowerPoint & Google Slides
Description
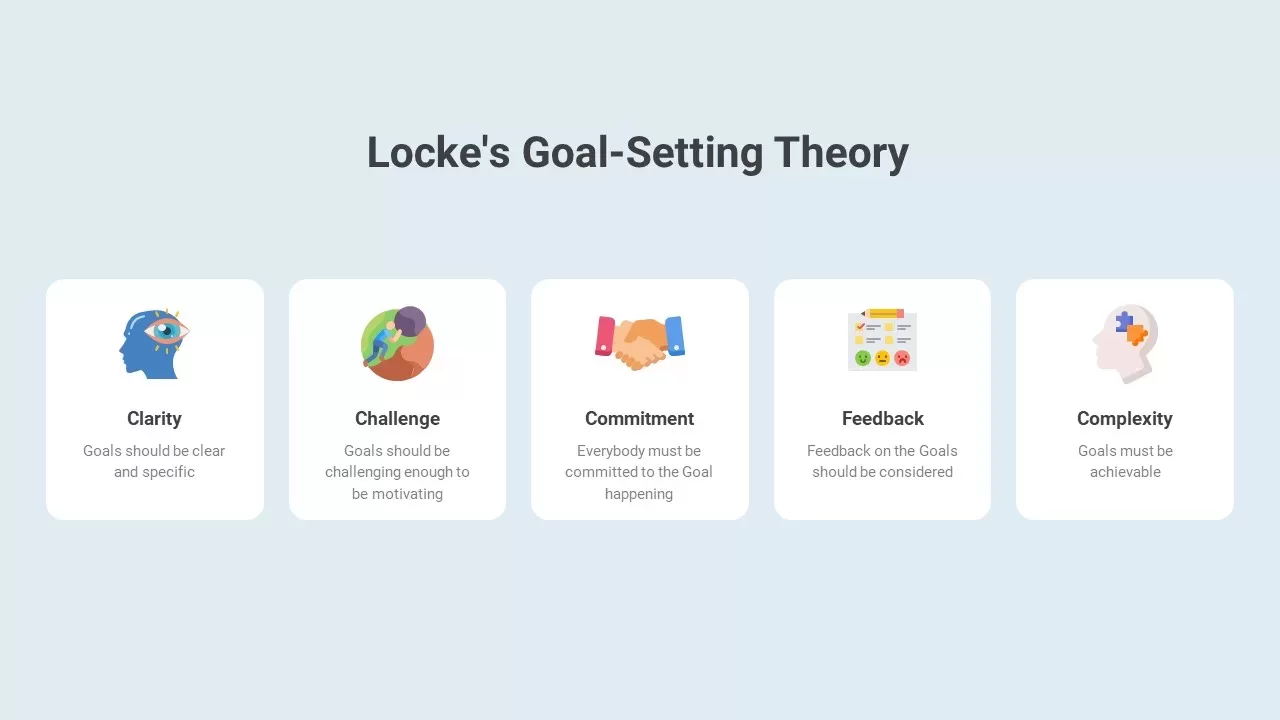
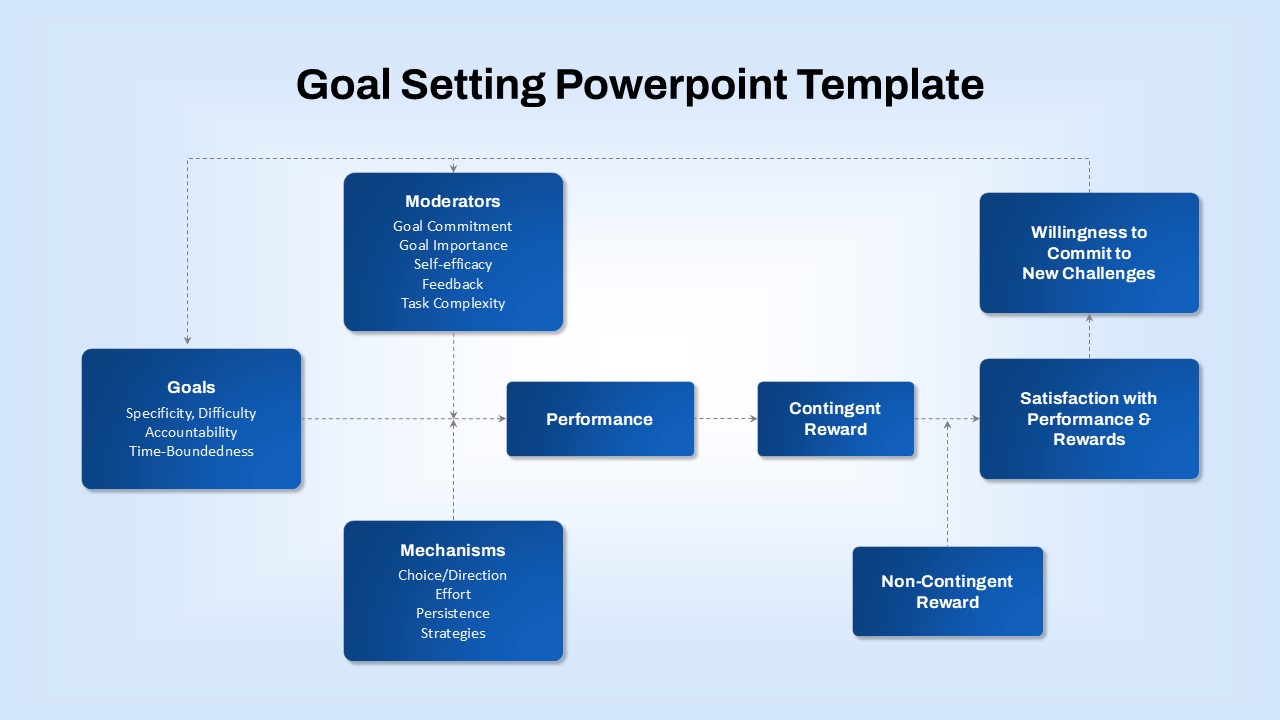
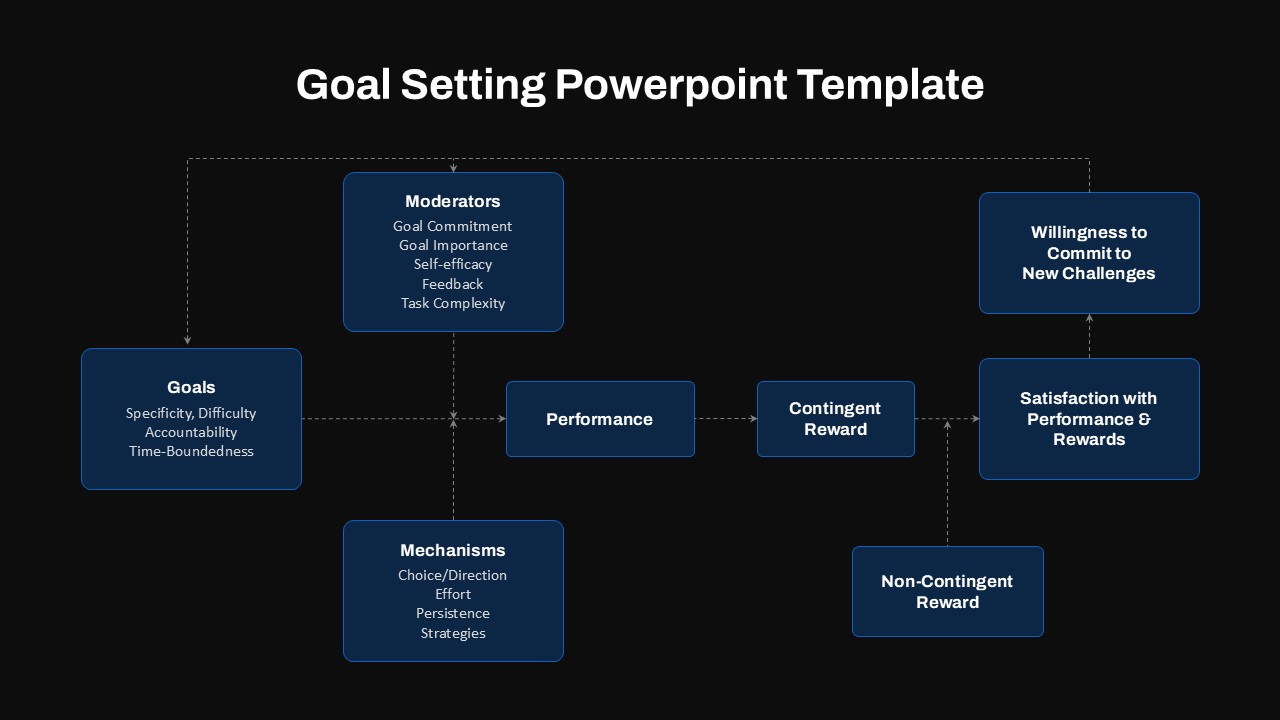
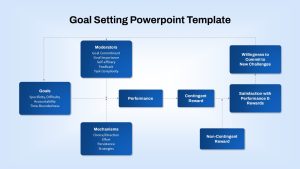
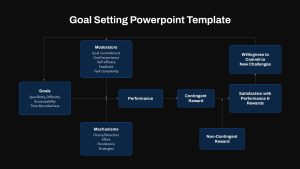
This Goal-Setting Process Flow diagram illustrates how structured goal attributes combine with moderating factors and underlying mechanisms to drive performance, reward outcomes, and ongoing commitment. On the left, the Goals box defines specificity, difficulty, accountability, and time-boundedness as essential goal characteristics. Above center, the Moderators box lists goal commitment, importance, self-efficacy, feedback, and task complexity, while the Mechanisms box below captures choice/direction, effort, persistence, and strategies. These inputs converge on the central Performance node. To the right, Contingent and Non-Contingent Reward boxes feed into Satisfaction with Performance & Rewards, which in turn drives Willingness to Commit to New Challenges. Solid and dashed arrows map the input-process-output flow, making it easy to follow each step of Locke and Latham’s goal-setting theory.
Built on master slides for seamless editing in both PowerPoint and Google Slides, this template lets you swap text, recolor boxes, adjust arrow styles, and replace icons without disrupting alignment. Vector shapes ensure crisp visuals at any resolution, while the clean white background and blue gradient accents deliver a professional, modern look. Use this slide in training sessions, strategic planning workshops, or academic lectures to explain complex performance models with clarity and impact.
Who is it for
Organizational psychologists, HR professionals, leadership trainers, and business consultants will find this diagram invaluable for presenting goal-setting frameworks, performance management processes, or motivation strategies to executives, teams, or students.
Other Uses
Repurpose this layout for risk-reward analyses, incentive program overviews, process improvement flows, or any cause-and-effect model by updating labels, icons, and color schemes to suit your narrative.
Login to download this file

Item ID
SB04592
Related Templates

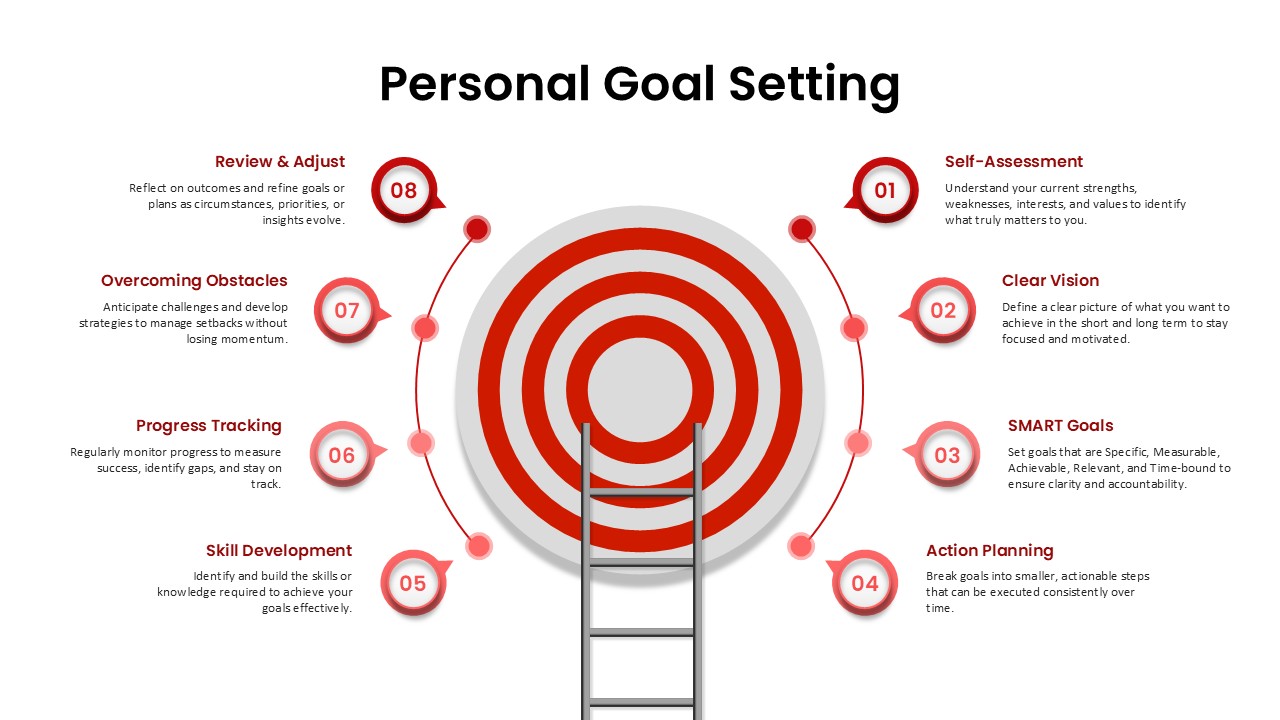
Free Personal Goal Setting Process Template for PowerPoint & Google Slides
Goals
Free
Locke’s Goal-Setting Theory Infographic Template for PowerPoint & Google Slides
Goals
Free Goal Setting Target Infographic Slide Template for PowerPoint & Google Slides
Goals
Free
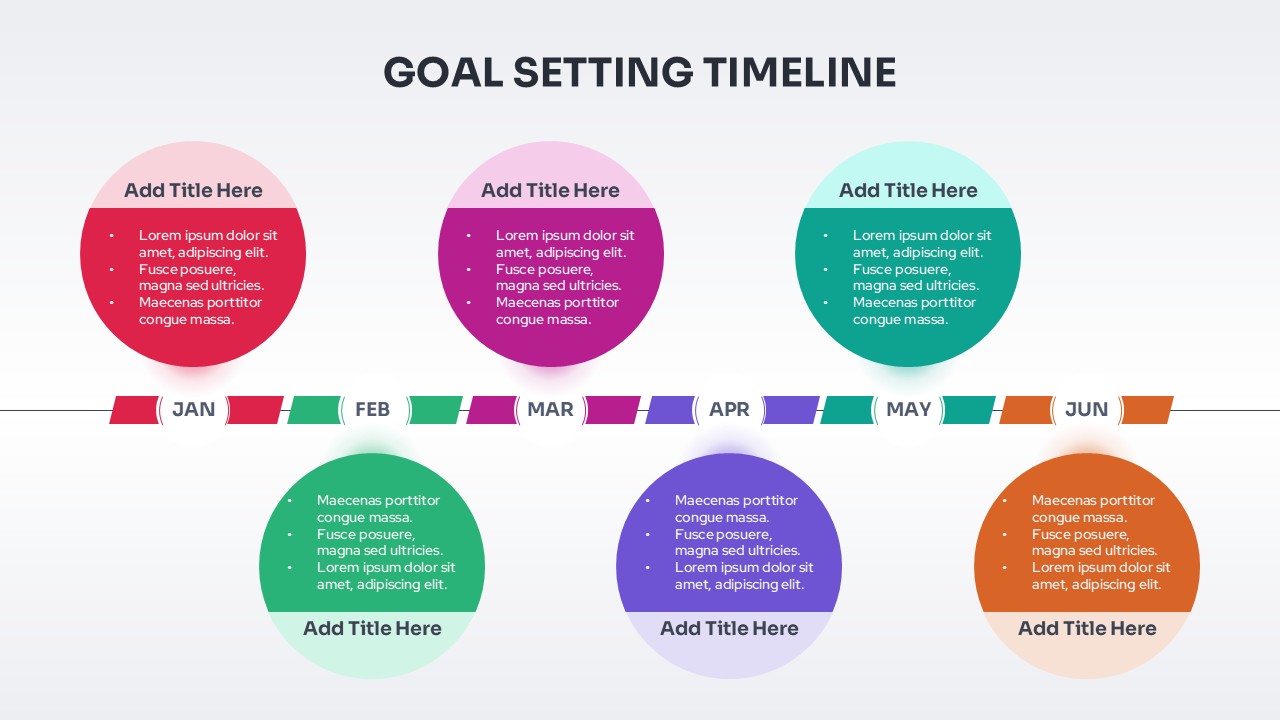
Goal Setting Timeline Roadmap Template for PowerPoint & Google Slides
Goals
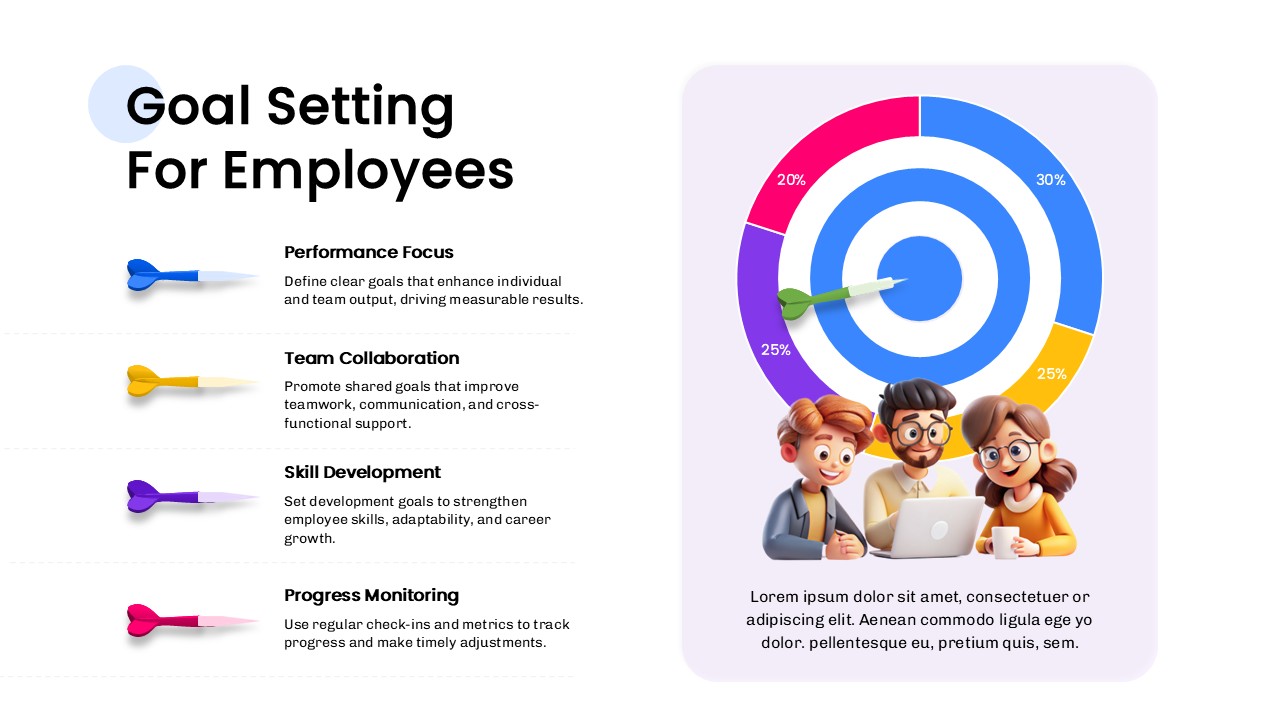
Goal Setting For Employees Template for PowerPoint & Google Slides
Goals
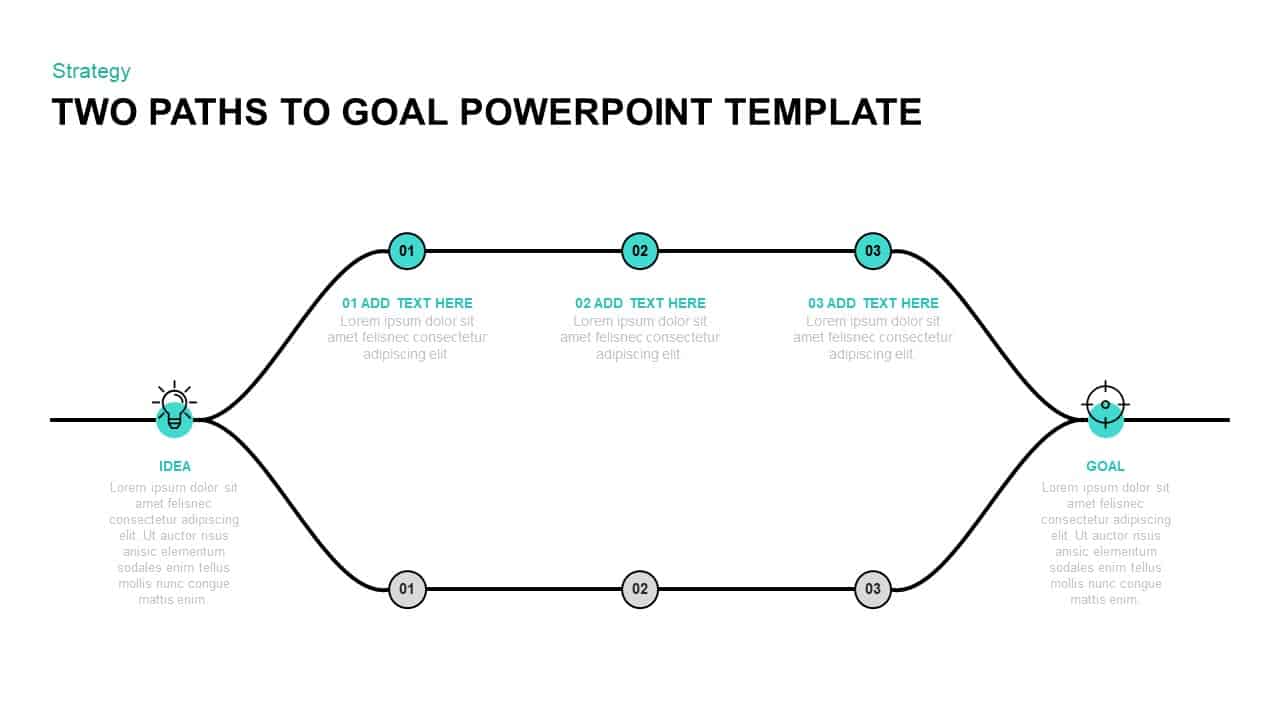
Two-Path Idea-to-Goal Process Diagram Template for PowerPoint & Google Slides
Infographics
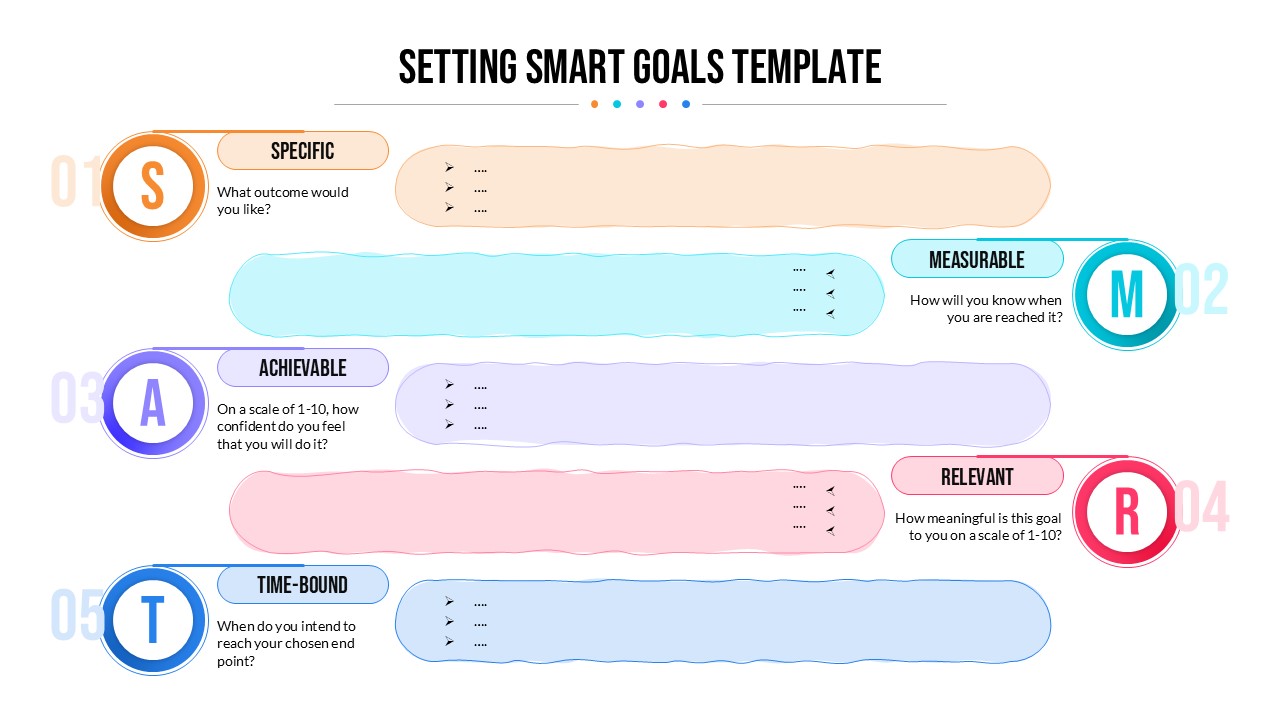
SMART Goals Setting Template for PowerPoint & Google Slides
Goals
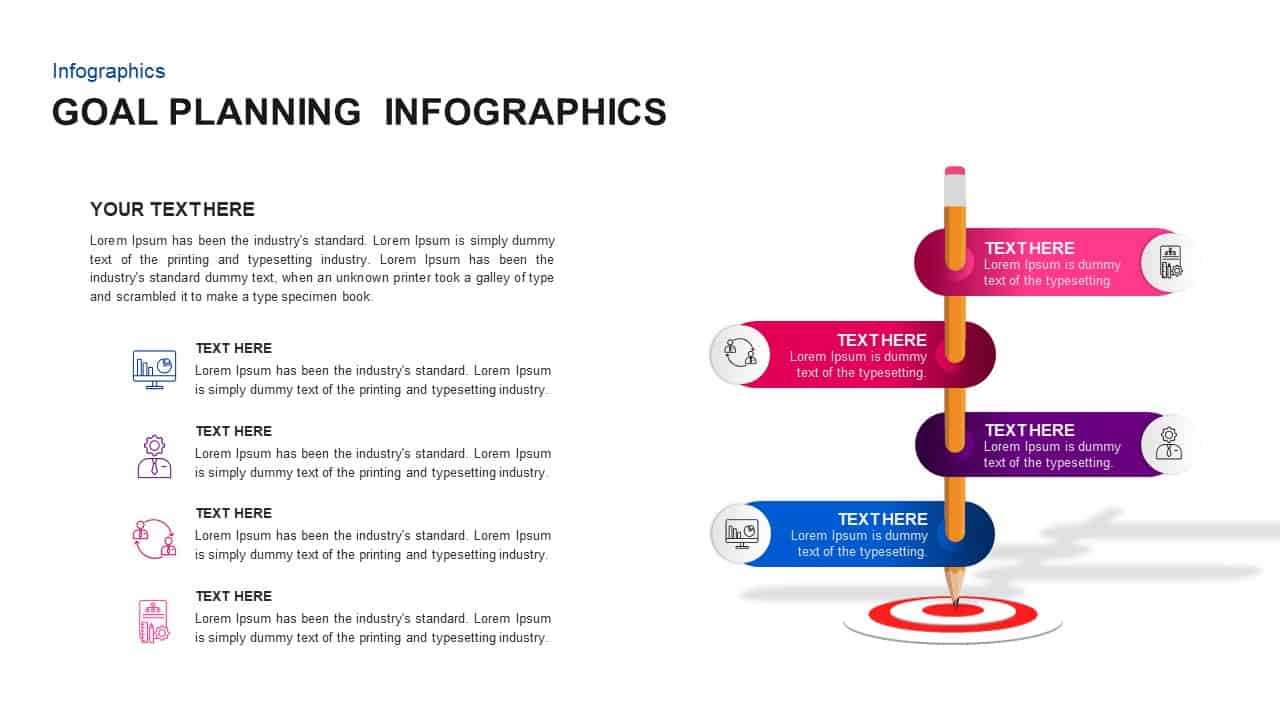
Goal Planning Ribbon Process Infographic Template for PowerPoint & Google Slides
Goals
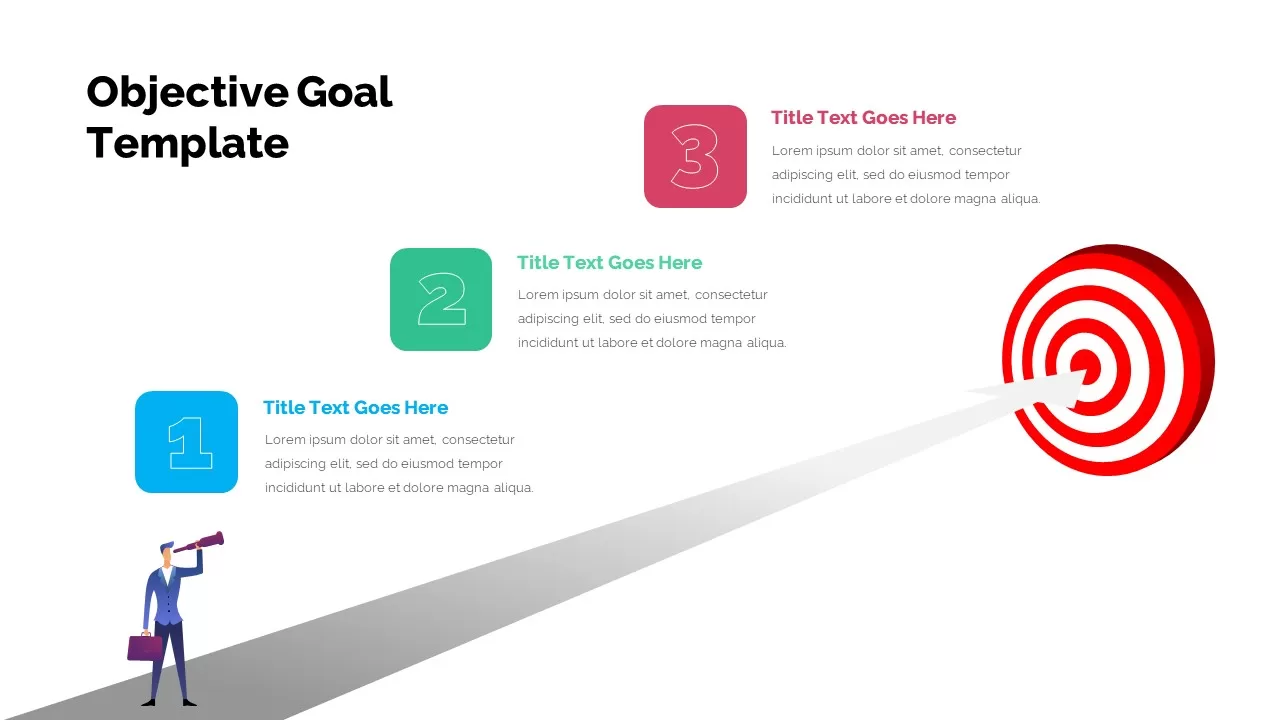
Three-Step Objective Goal Process Template for PowerPoint & Google Slides
Goals
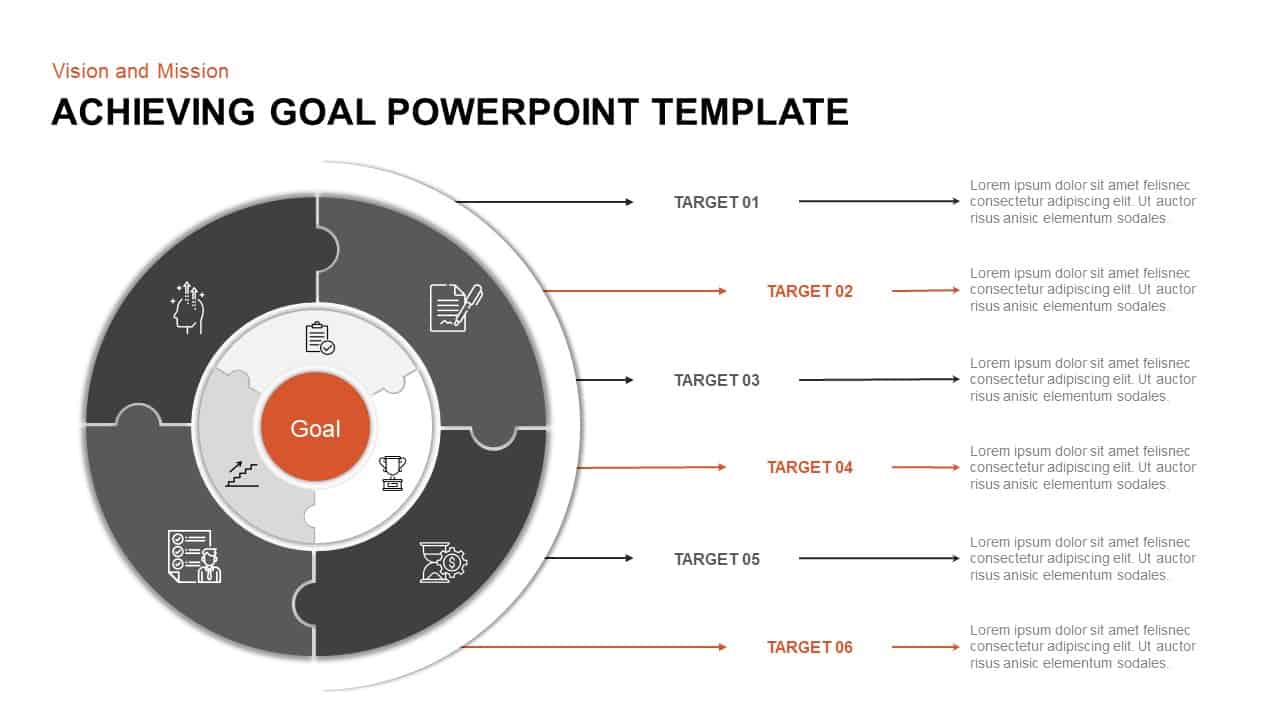
Puzzle Diagram for Goal Achievement Template for PowerPoint & Google Slides
Circular
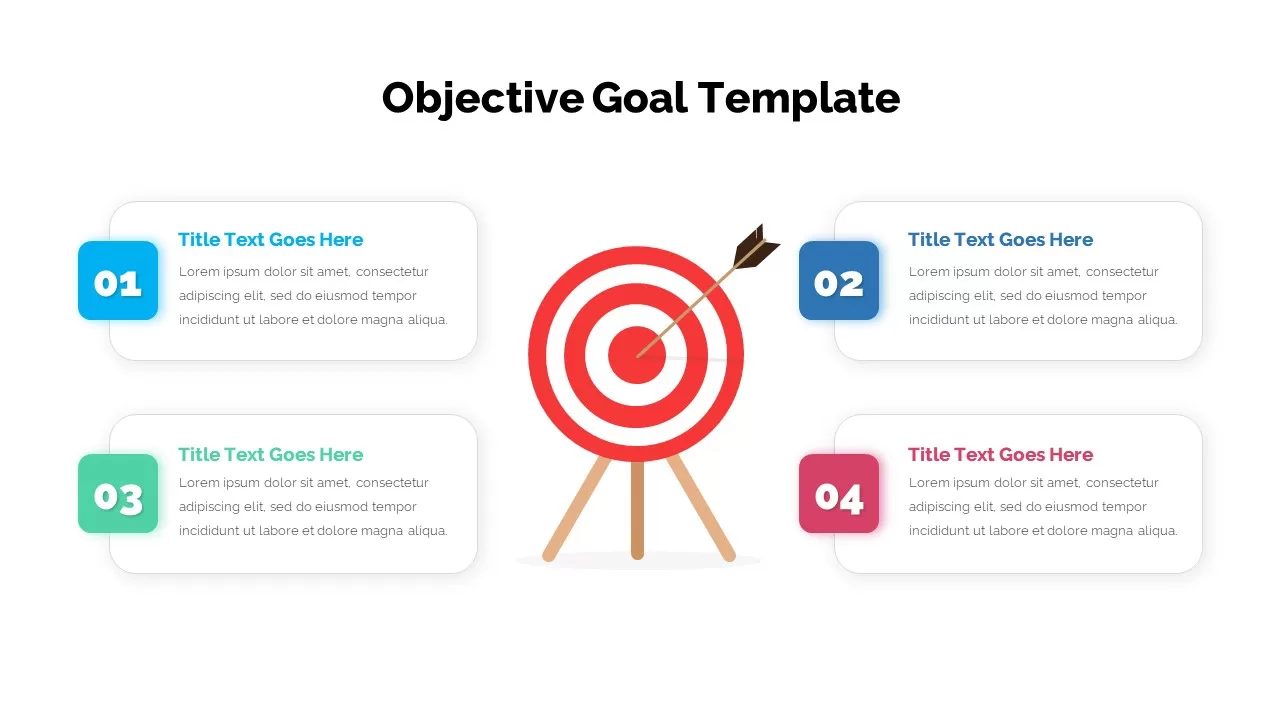
Four-Step Objective Goal Diagram Template for PowerPoint & Google Slides
Goals
Goal Diagram Presentation Slide Template for PowerPoint & Google Slides
Goals
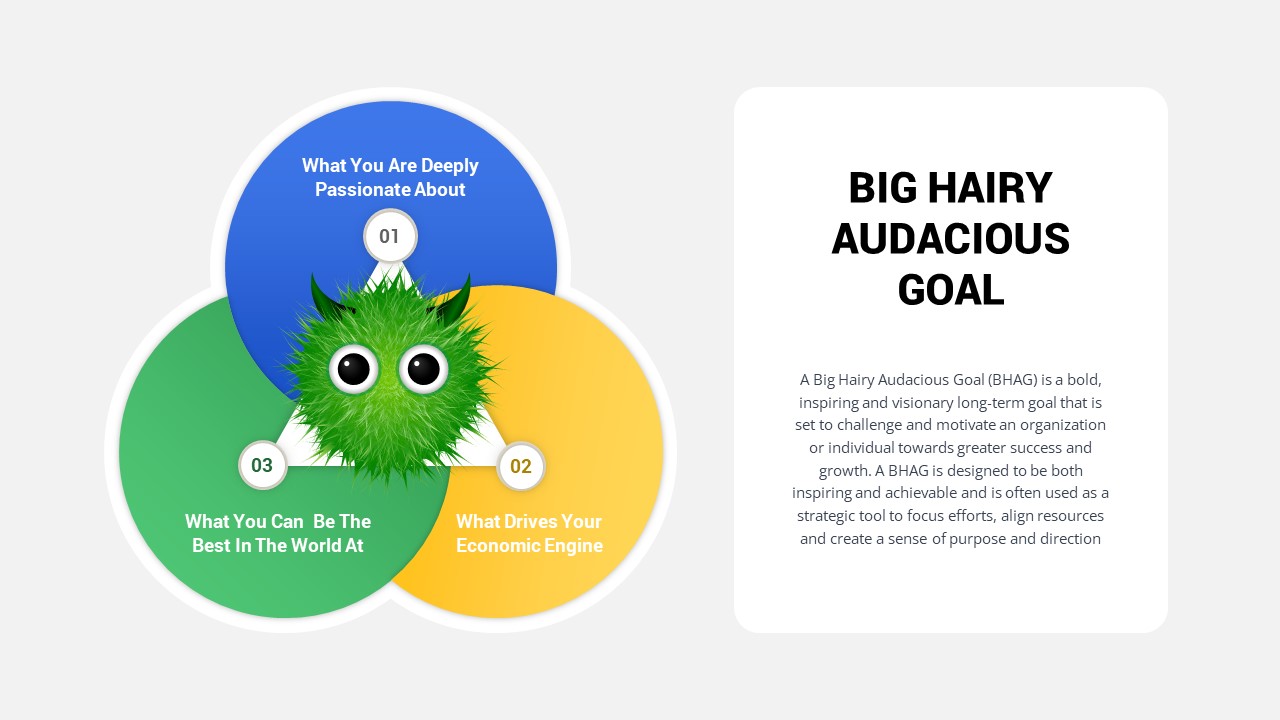
Big Hairy Audacious Goal Venn Diagram Template for PowerPoint & Google Slides
Circular

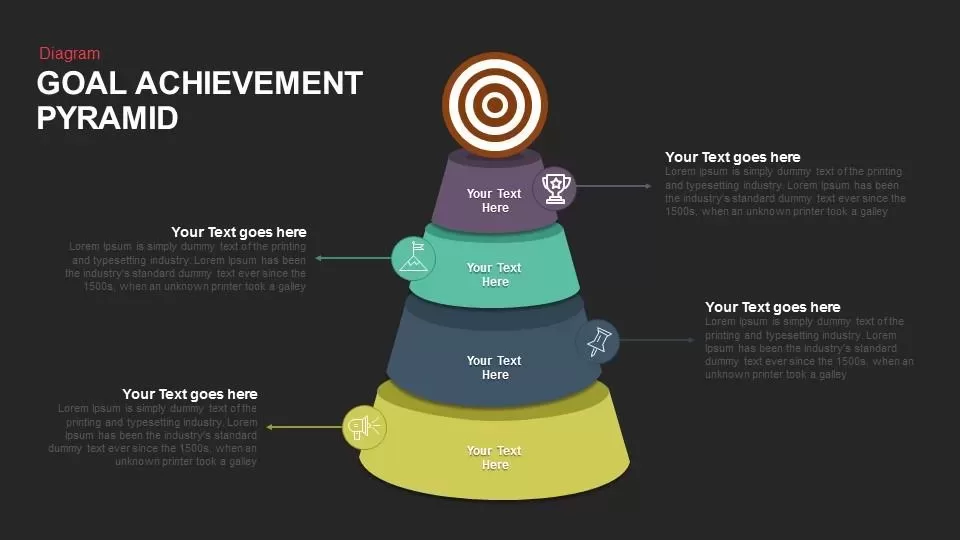
Goal Achievement Pyramid Diagram for PowerPoint & Google Slides
Pyramid
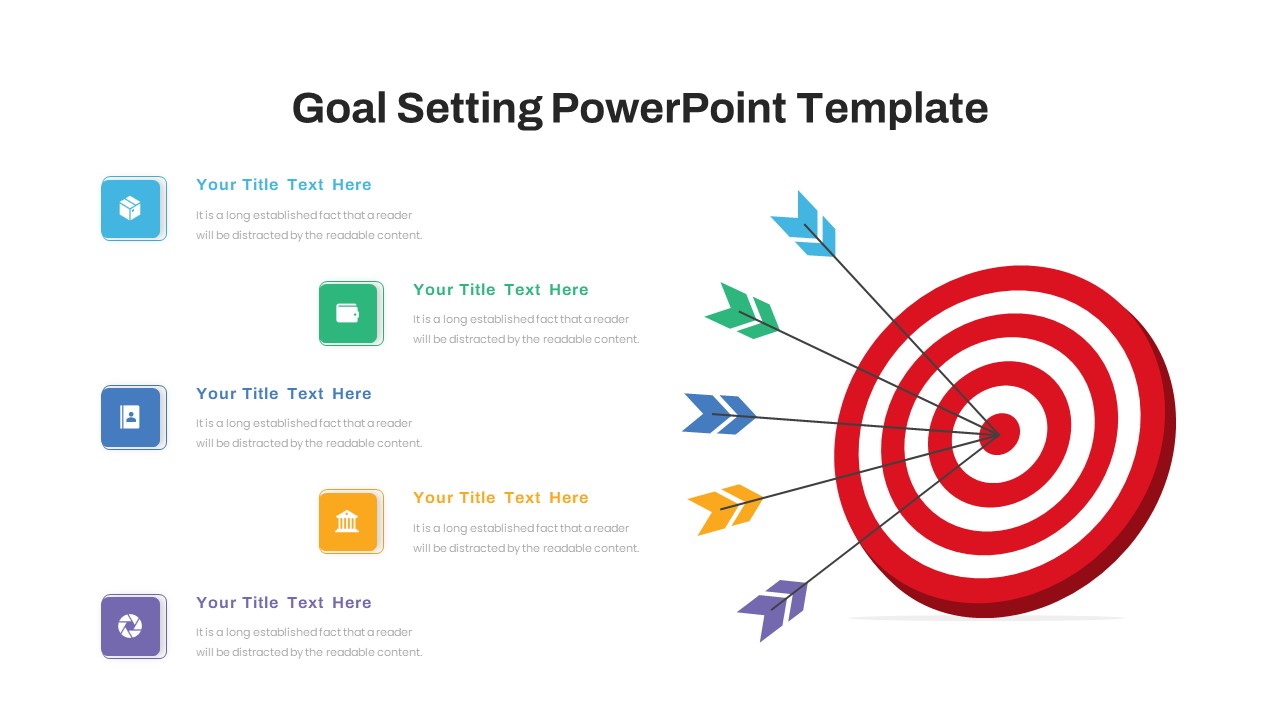
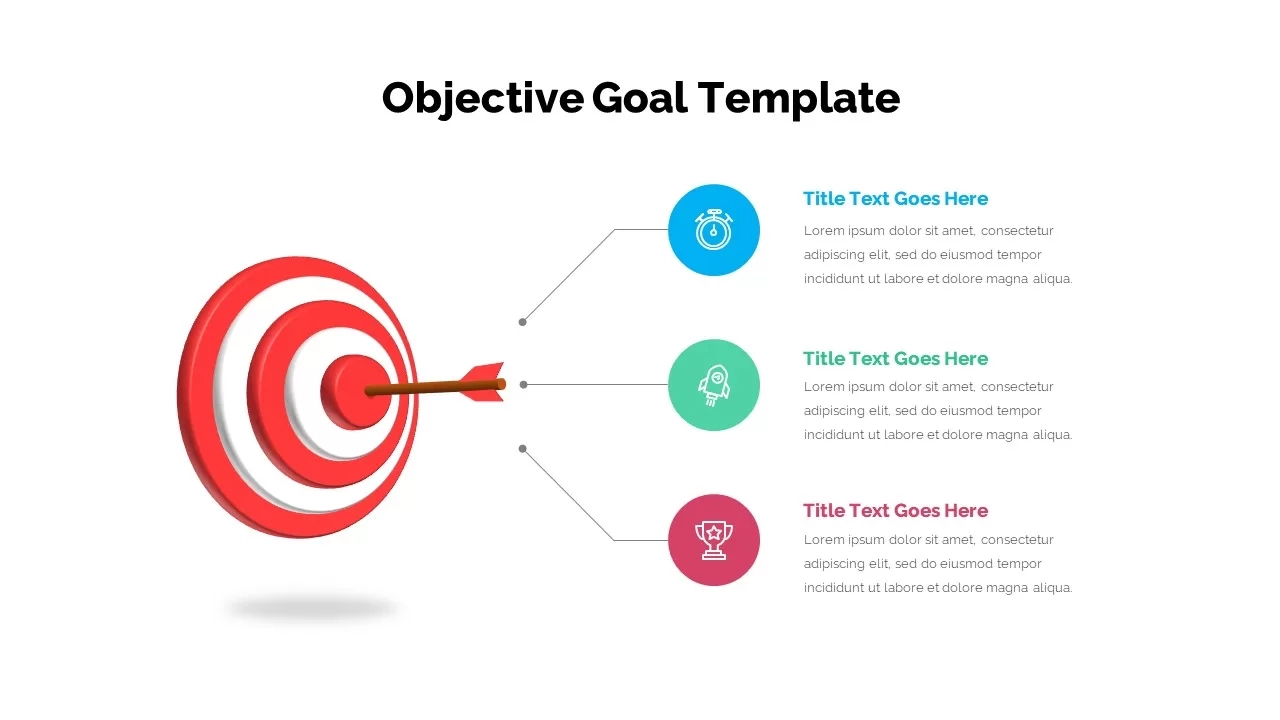
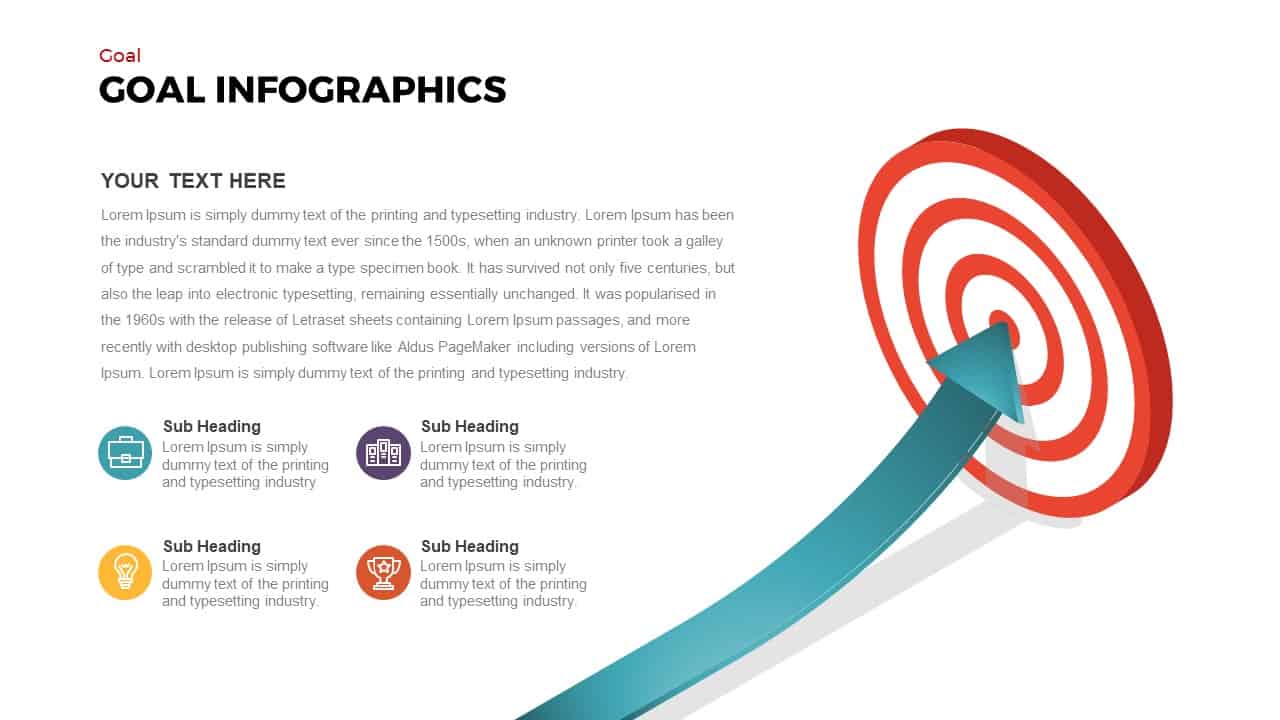
Goal Arrow and Target Infographic Template for PowerPoint & Google Slides
Goals
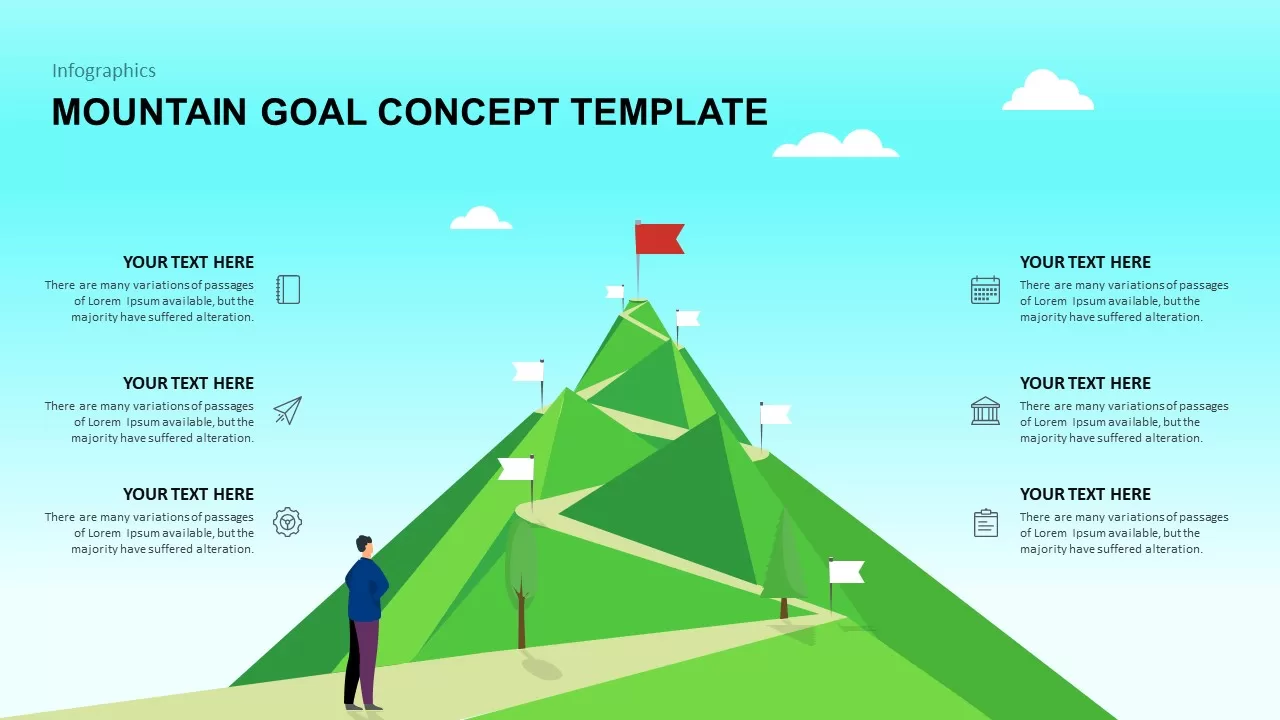
Mountain Goal Concept Template for PowerPoint & Google Slides
Process
Bow and Arrow Goal Infographic Slide Template for PowerPoint & Google Slides
Goals
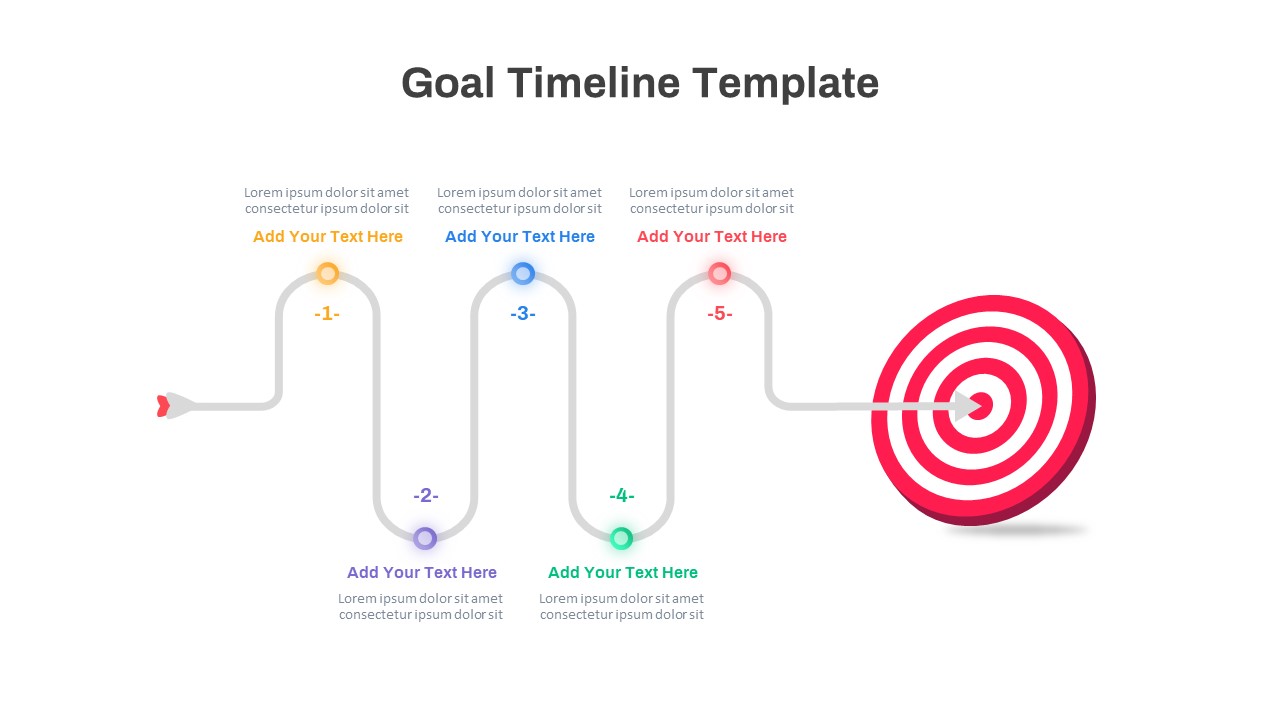
Colorful Five-Step Goal Timeline Template for PowerPoint & Google Slides
Timeline
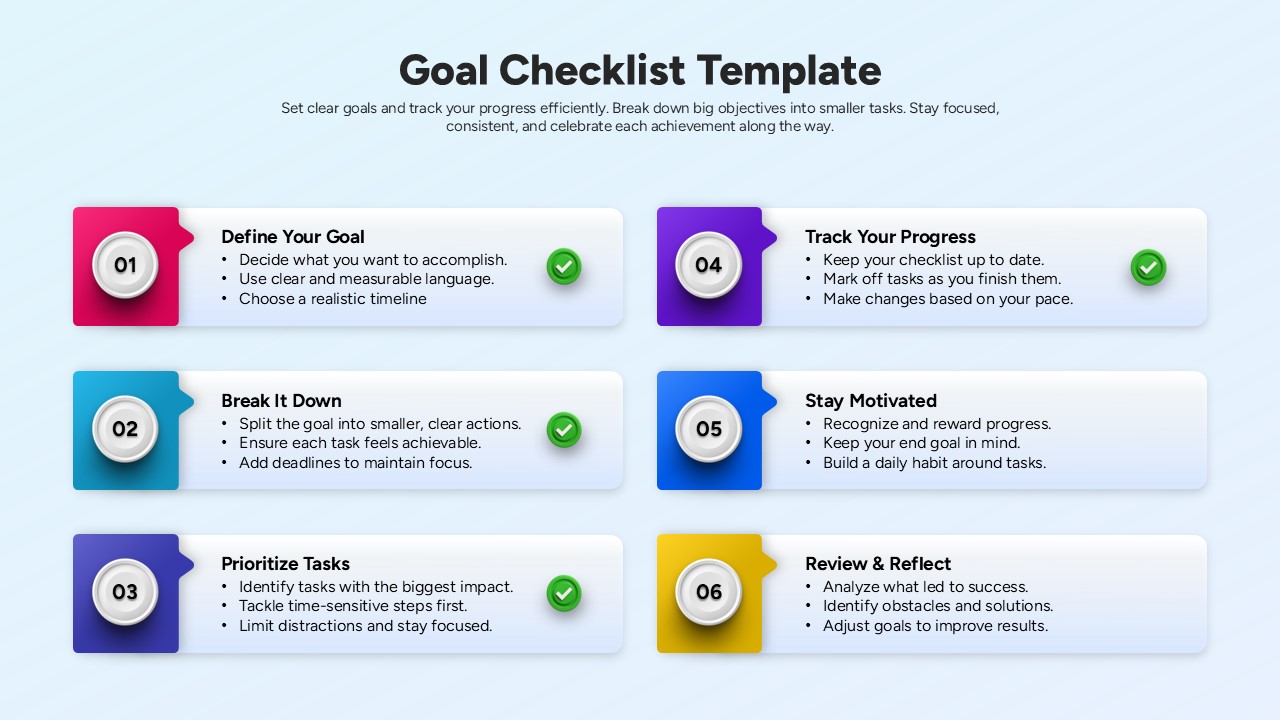
Goal Checklist Template for PowerPoint & Google Slides
Goals
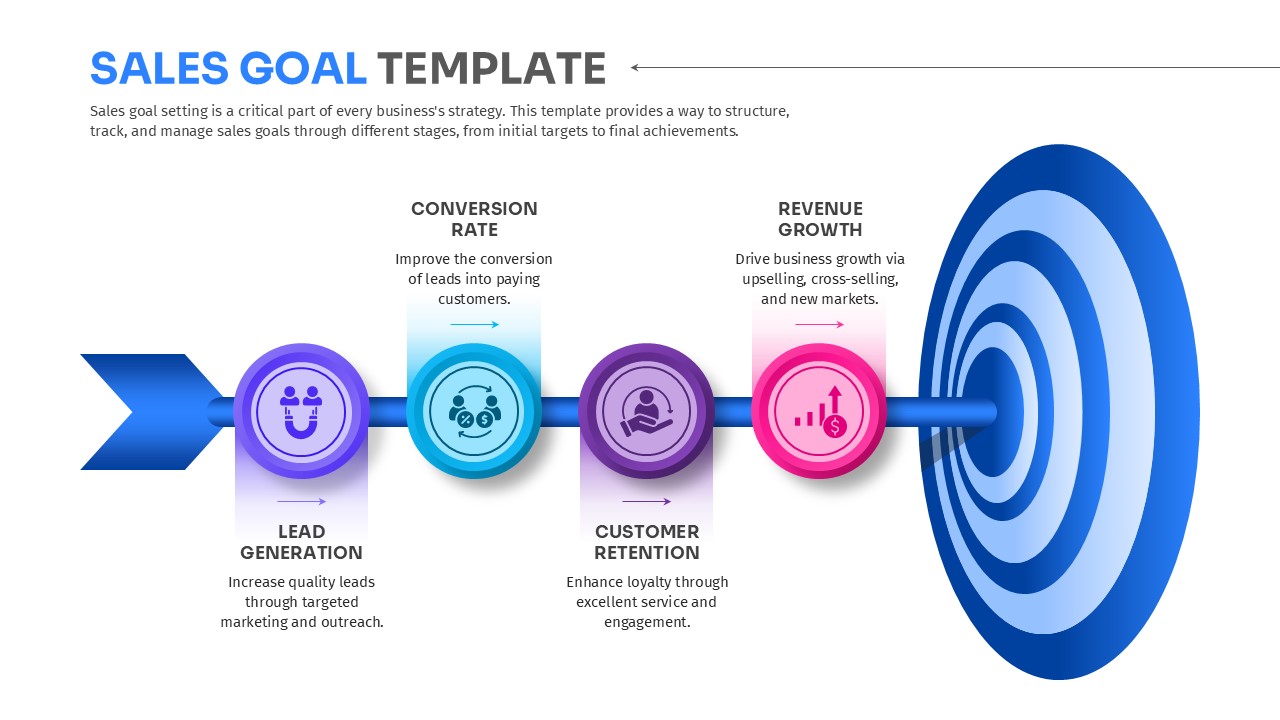
Sales Goal Template for PowerPoint & Google Slides
Goals
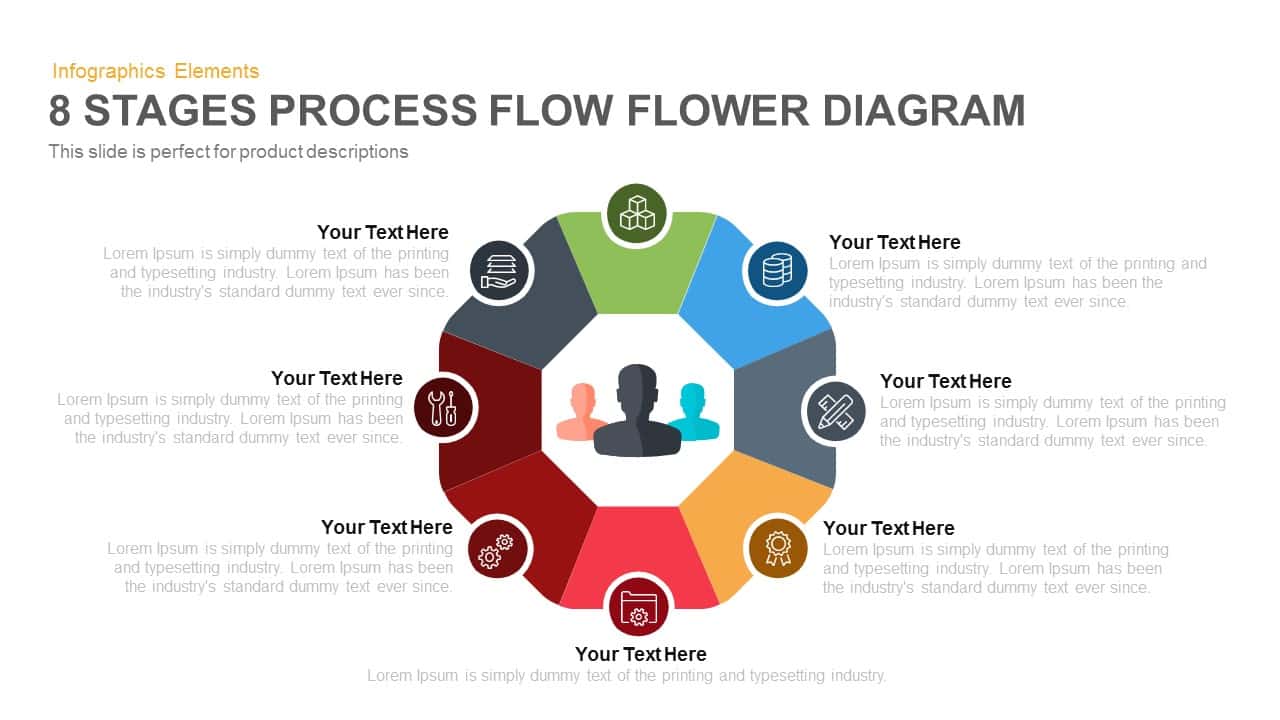
8-Stage Process Flow Flower Diagram Template for PowerPoint & Google Slides
Infographics
4 Section Pipe Diagram Process Flow Template for PowerPoint & Google Slides
Process
Dynamic Shield Process Flow Diagram template for PowerPoint & Google Slides
Process
Six Hexagon Stages Process Flow Diagram Template for PowerPoint & Google Slides
Process
Process Flow Diagram template for PowerPoint & Google Slides
Infographics

15-Step Process Flow Diagram Template for PowerPoint & Google Slides
Process
3D Shape Linear Process Flow Diagram Template for PowerPoint & Google Slides
Process
Linear Process Flow Circles Diagram Template for PowerPoint & Google Slides
Process
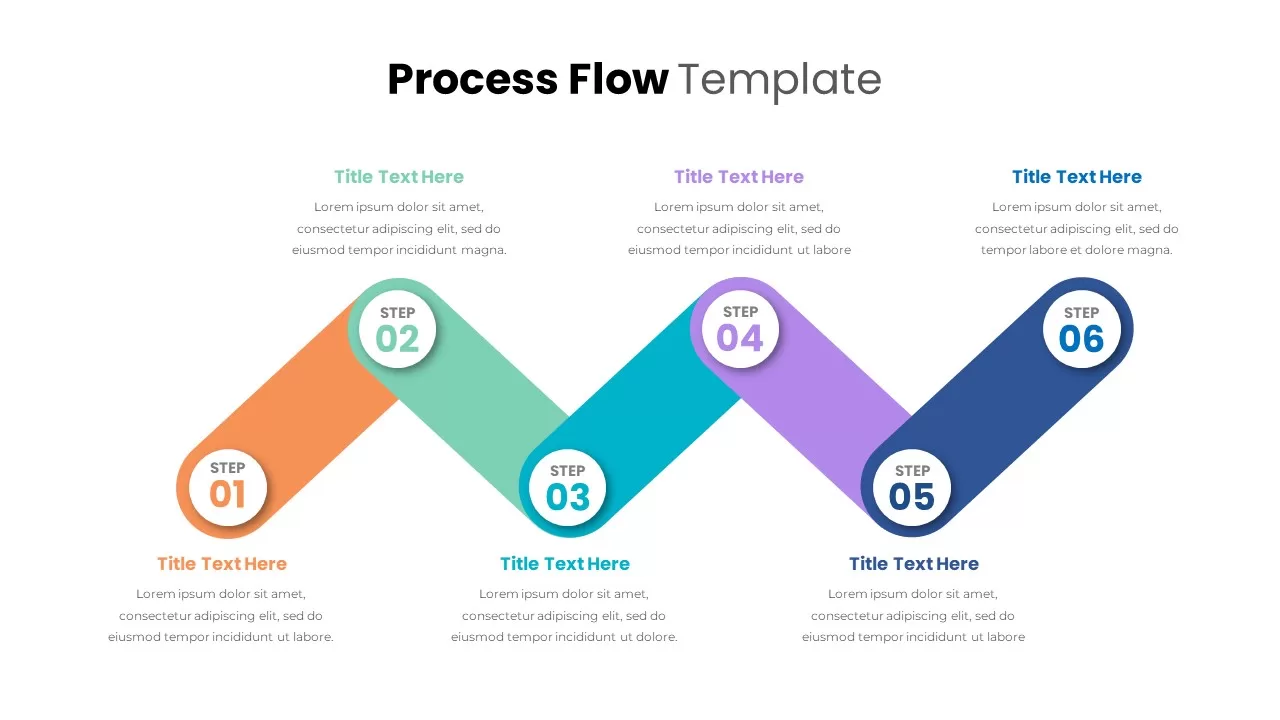
Six-Stage Zig-Zag Process Flow Diagram Template for PowerPoint & Google Slides
Process
Vertical Business Process Flow Diagram Template for PowerPoint & Google Slides
Process
Six-Sided Shutter Diagram Process Flow Template for PowerPoint & Google Slides
Process
10 Stages Business Flow Process Diagram template for PowerPoint & Google Slides
Business

Eight-Stage Radial Process Flow Diagram Template for PowerPoint & Google Slides
Process
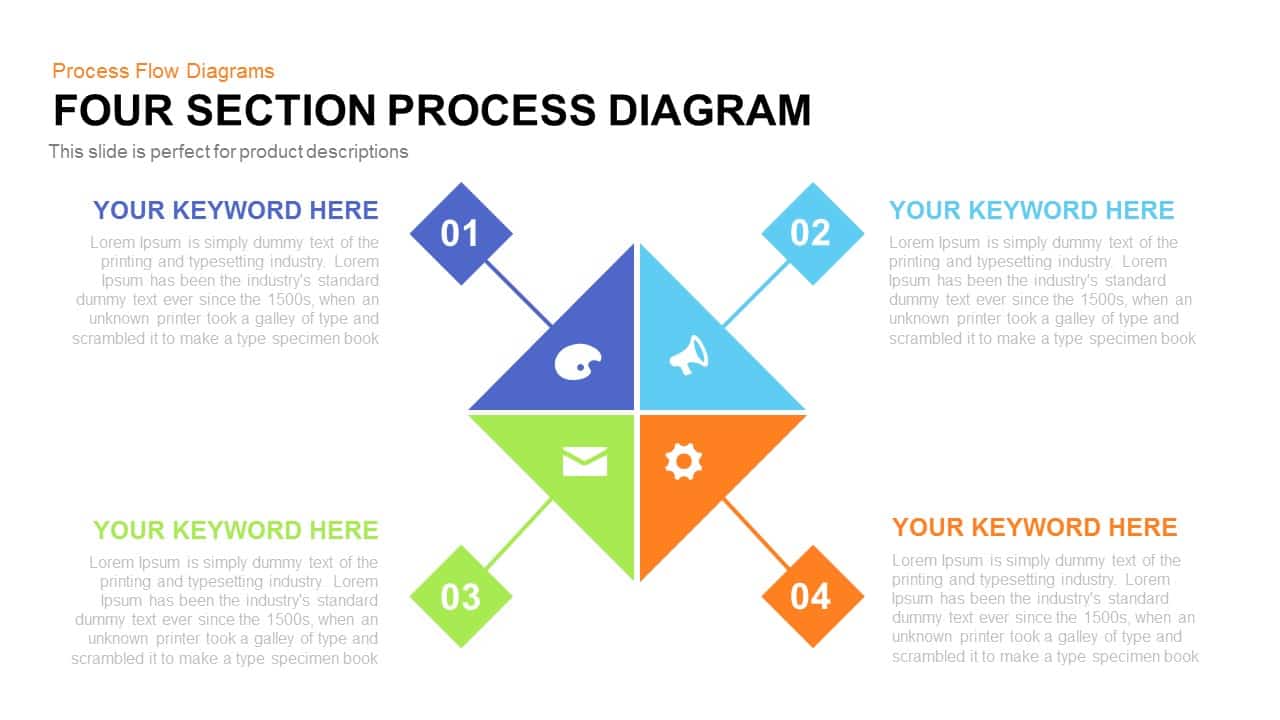
Four-Plus Process Flow Diagram Template for PowerPoint & Google Slides
Process
Five Stage Linear Process Flow Diagram Template for PowerPoint & Google Slides
Process
Five-Stage Linear Process Flow Diagram Template for PowerPoint & Google Slides
Process
Six-Step Hexagon Process Flow Diagram Template for PowerPoint & Google Slides
Process
Five-Stage Circular Process Flow Diagram Template for PowerPoint & Google Slides
Circular
5-Stage Gear Process Flow Diagram Template for PowerPoint & Google Slides
Process
3D Seven-Stage Process Flow Diagram Template for PowerPoint & Google Slides
Process
Four-Stage Linear Process Flow Diagram Template for PowerPoint & Google Slides
Process
5-Stage Linear Process Flow Diagram Template for PowerPoint & Google Slides
Process
5 Stage Linear Process Flow Diagram Template for PowerPoint & Google Slides
Process
Five-Stage Process Flow Diagram Template for PowerPoint & Google Slides
Process
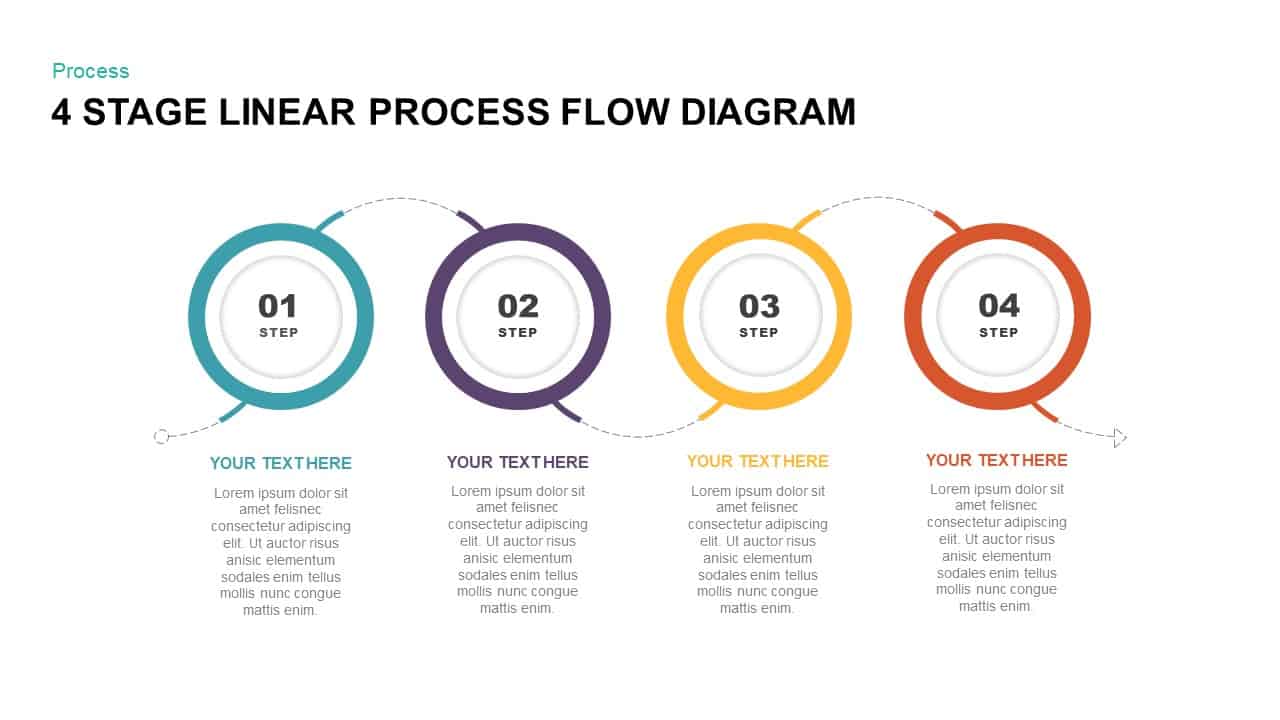
4 Stage Linear Process Flow Diagram Template for PowerPoint & Google Slides
Process
7 Stage Linear Process Flow Diagram Template for PowerPoint & Google Slides
Process
8 Step Circular Process Flow Diagram Template for PowerPoint & Google Slides
Process
4 Stage Linear Process Flow Diagram Template for PowerPoint & Google Slides
Process
6-Step Business Process Flow Diagram Template for PowerPoint & Google Slides
Process
6-Step Circular Process Flow Diagram Template for PowerPoint & Google Slides
Process
4-Stage Linear Process Flow Diagram Template for PowerPoint & Google Slides
Process
4-Step Linear Process Flow Diagram Template for PowerPoint & Google Slides
Process
Business Process Management Flow Diagram Template for PowerPoint & Google Slides
Process
Colorful 8-Stage Droplet Process Flow Diagram Template for PowerPoint & Google Slides
Process
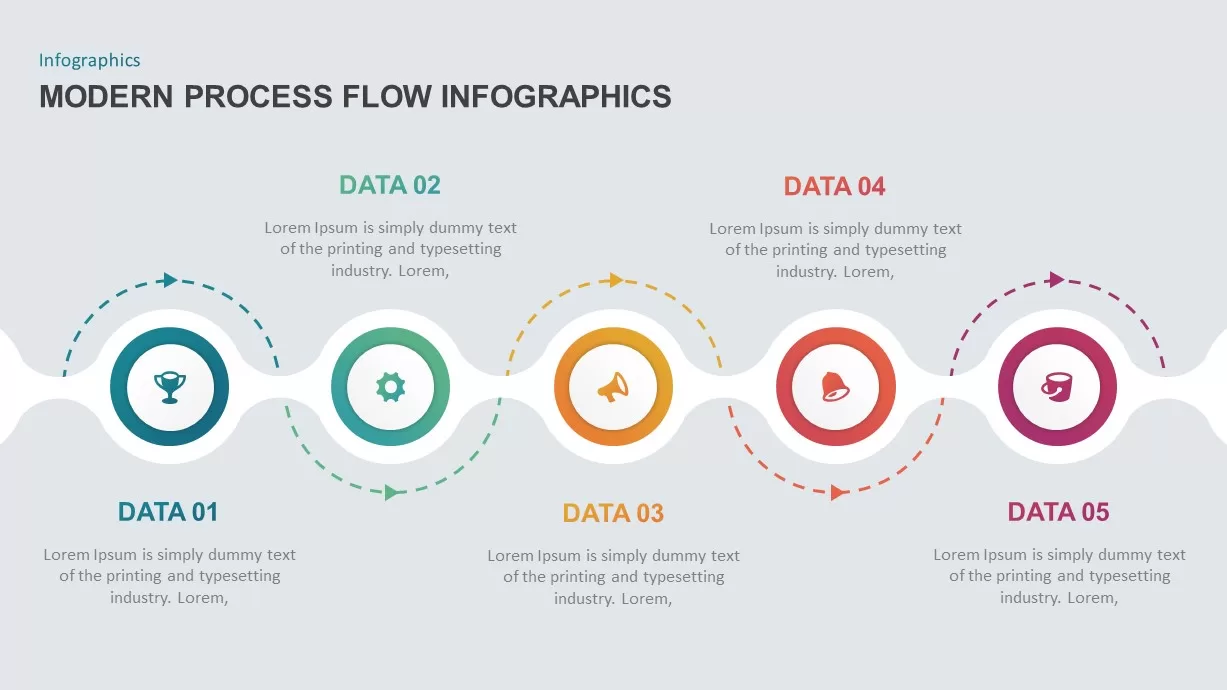
Minimal Process Flow Diagram Infographic Template for PowerPoint & Google Slides
Process
Process Flow Diagram template for PowerPoint & Google Slides
Process
Curved Arrow Process Flow Diagram Template for PowerPoint & Google Slides
Process
Curved Arrow Process Flow Diagram Template for PowerPoint & Google Slides
Arrow
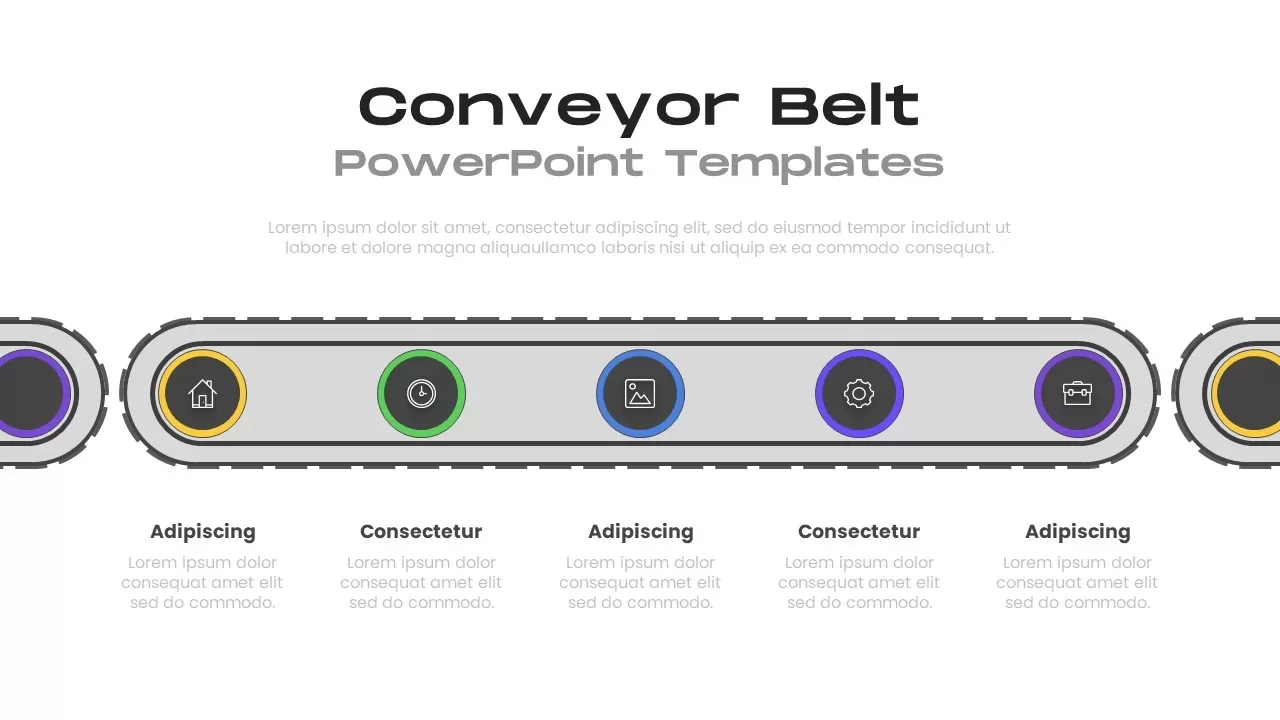
3D Conveyor Belt Process Flow Diagram Template for PowerPoint & Google Slides
Process
E-Waste Management Process Flow Diagram Template for PowerPoint & Google Slides
Process
Comprehensive Process Flow Diagram Template for PowerPoint & Google Slides
Process
Animated Gears Process Flow Diagram Template for PowerPoint & Google Slides
Process
Capital Investments Process Flow Diagram Template for PowerPoint & Google Slides
Process
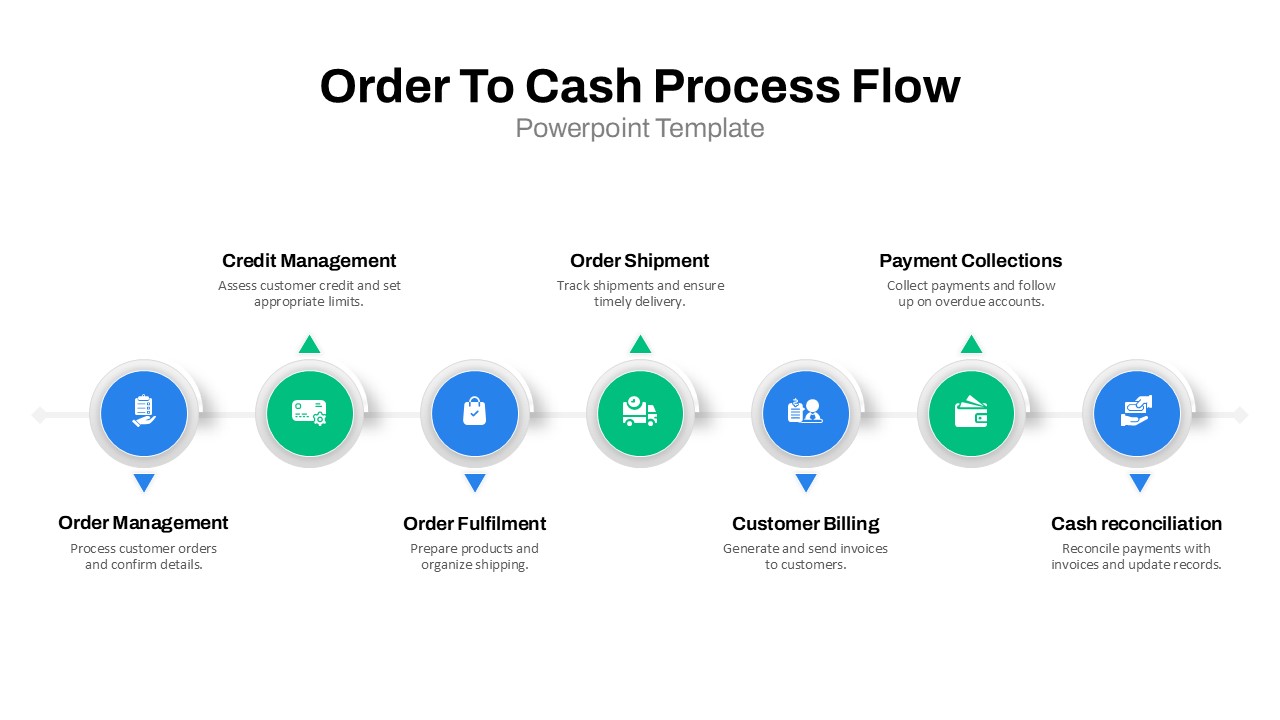
Order to Cash Process Flow Diagram Template for PowerPoint & Google Slides
Process
Resume Screening Process Flow Diagram Template for PowerPoint & Google Slides
Process
Q-Learning Process Flow Diagram Template for PowerPoint & Google Slides
Process
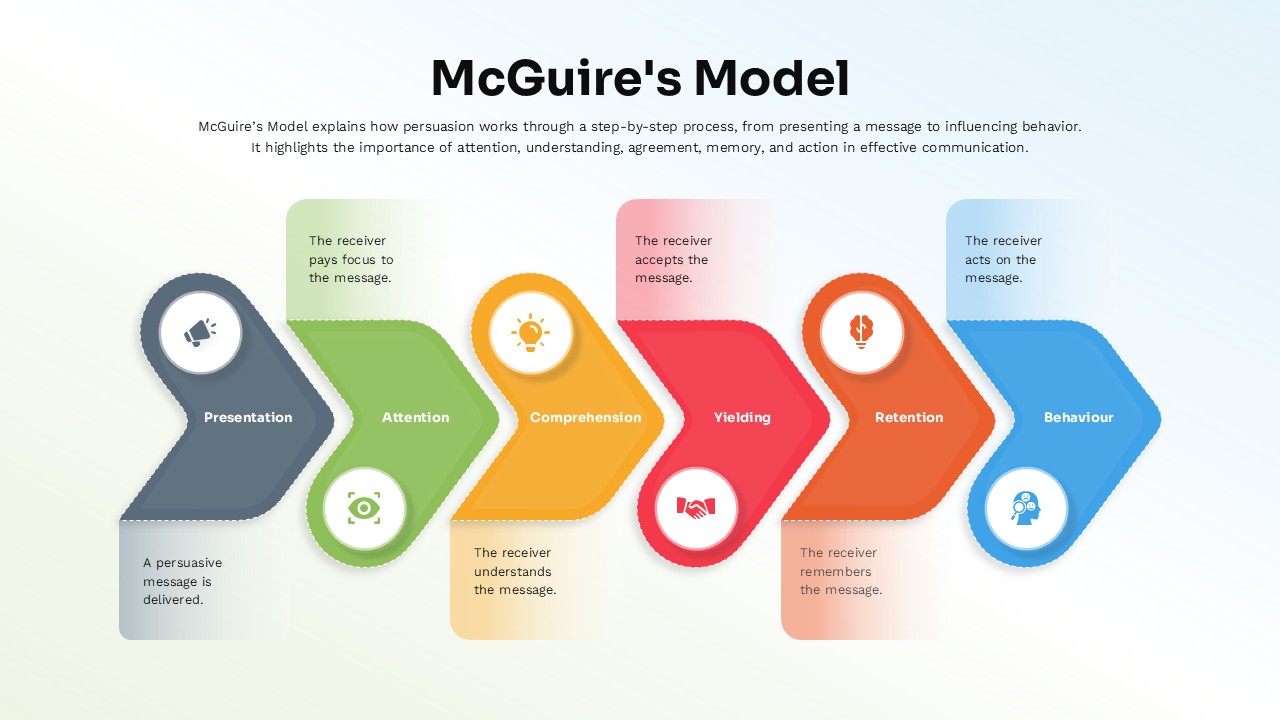
McGuire’s Persuasion Process Flow Diagram Template for PowerPoint & Google Slides
Marketing
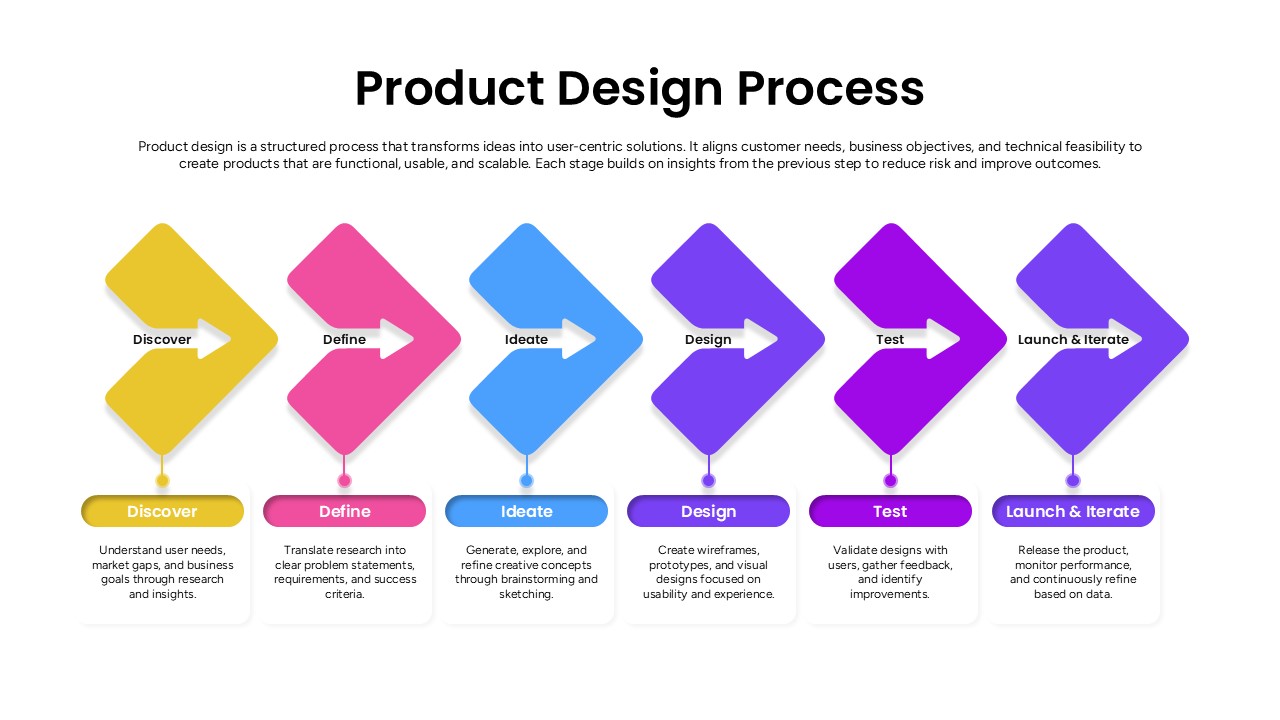
Product Design Process Flow Diagram Template for PowerPoint & Google Slides
Process
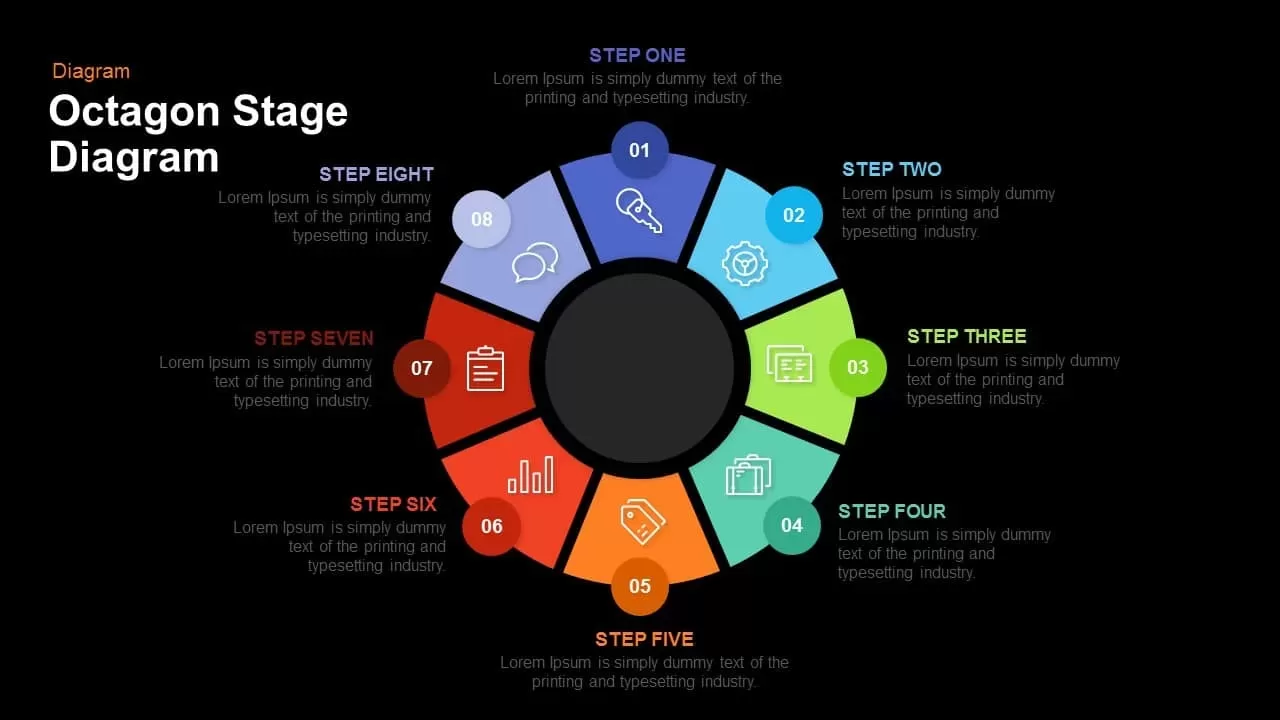
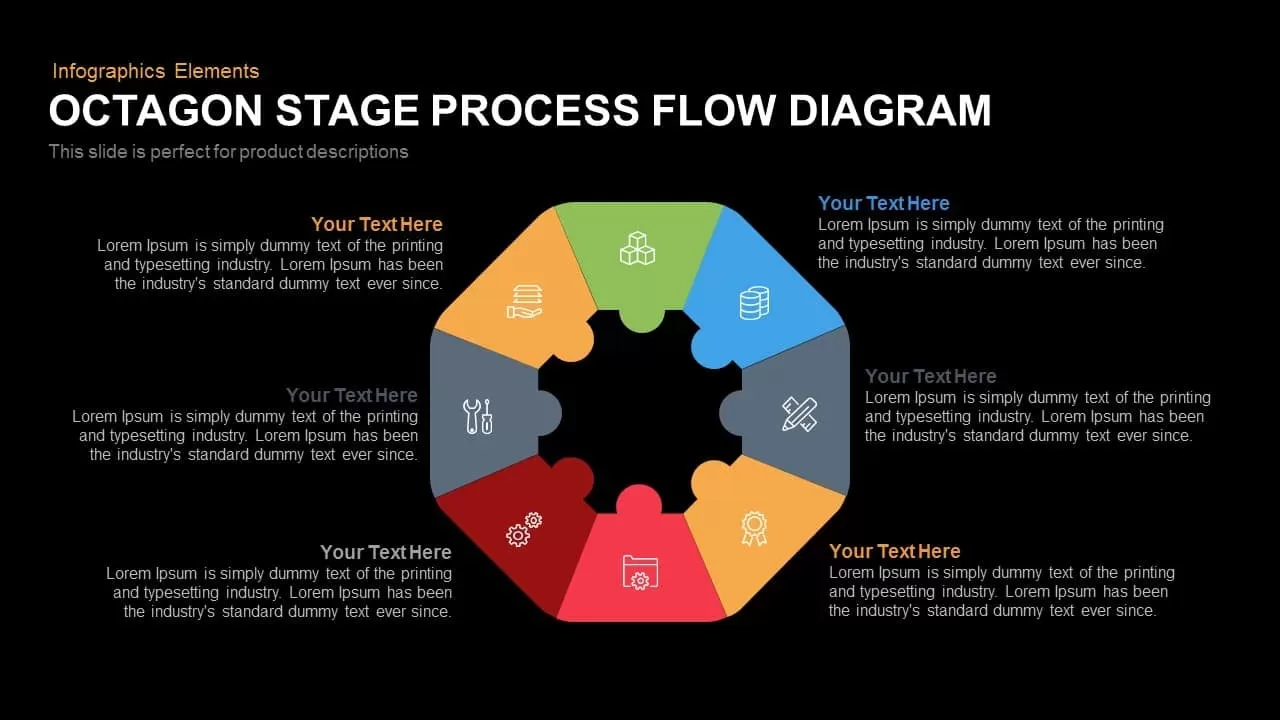
Octagon Stage Process Flow Diagram for PowerPoint & Google Slides
Process
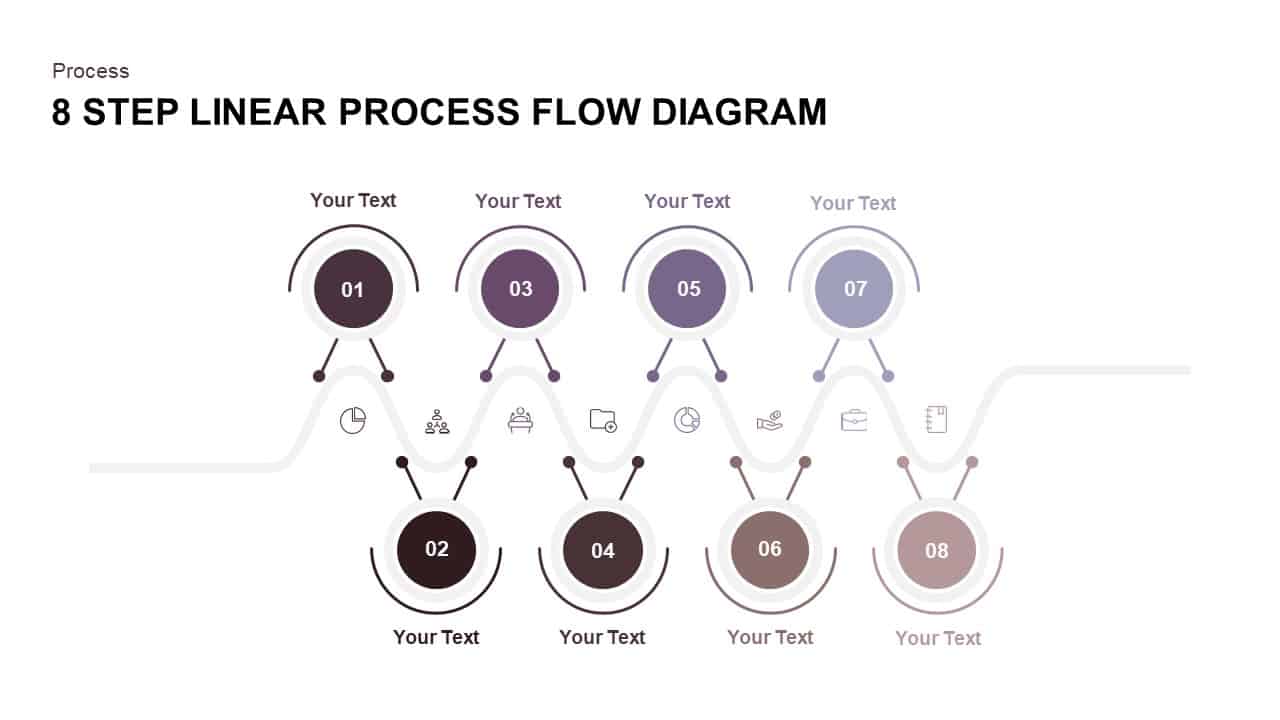
8 Step Linear Process Flow Diagram for PowerPoint & Google Slides
Process
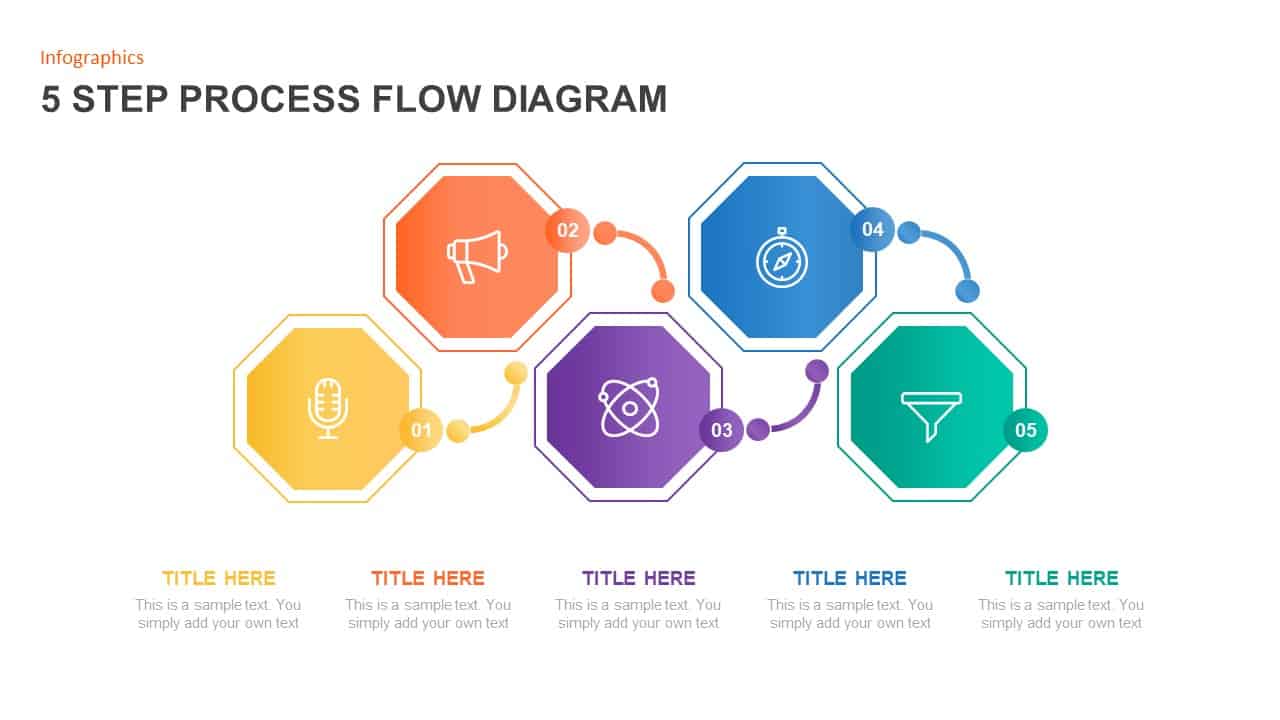
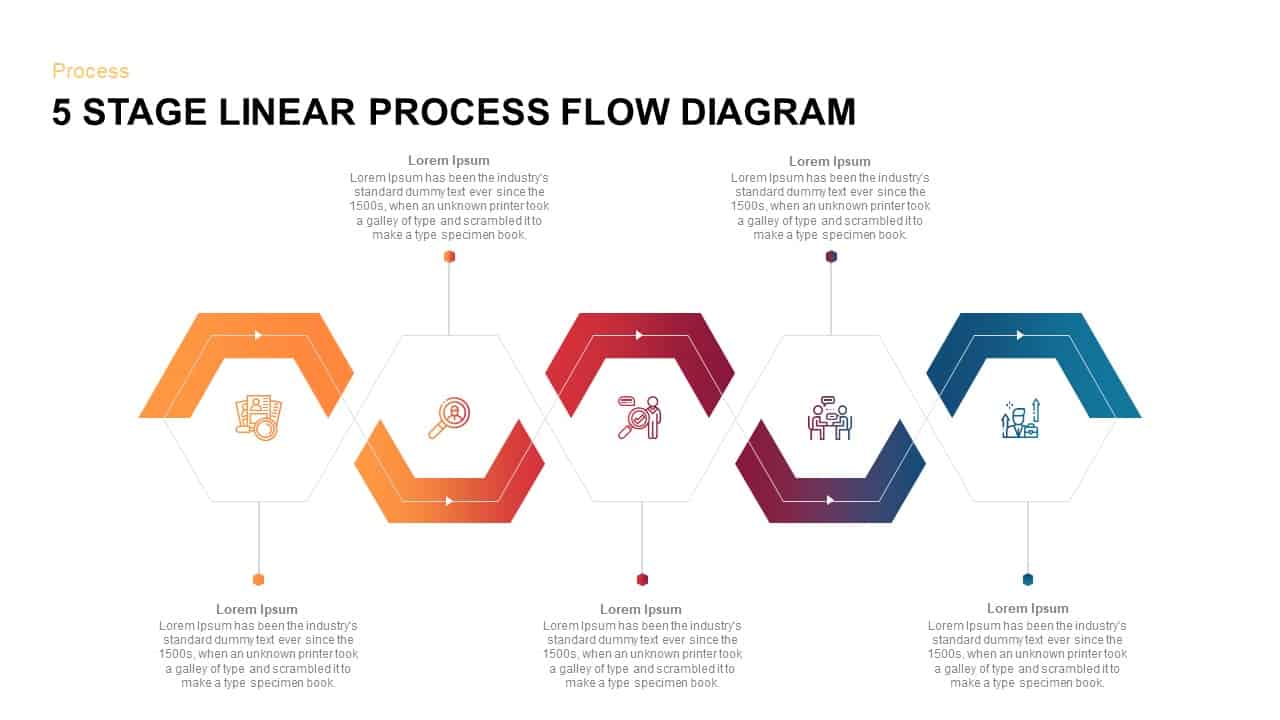
5 Step Process Flow Diagram for PowerPoint & Google Slides
Process

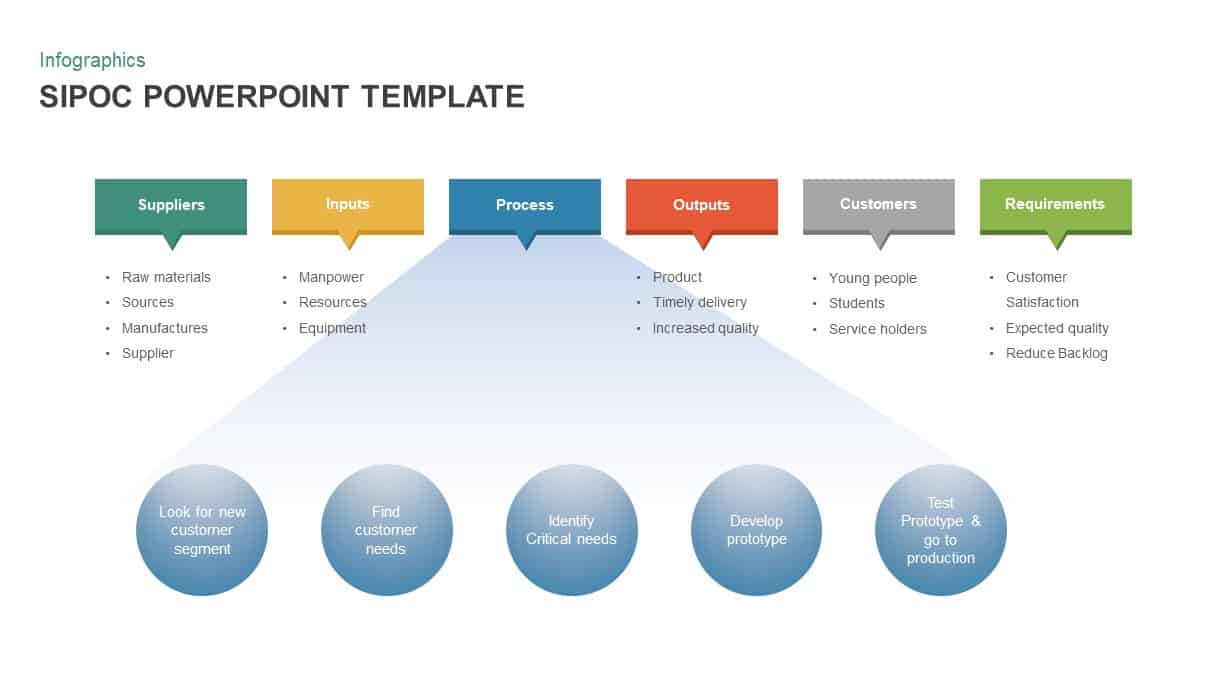
Color-Coded SIPOC Diagram with Process Flow for PowerPoint & Google Slides
Process
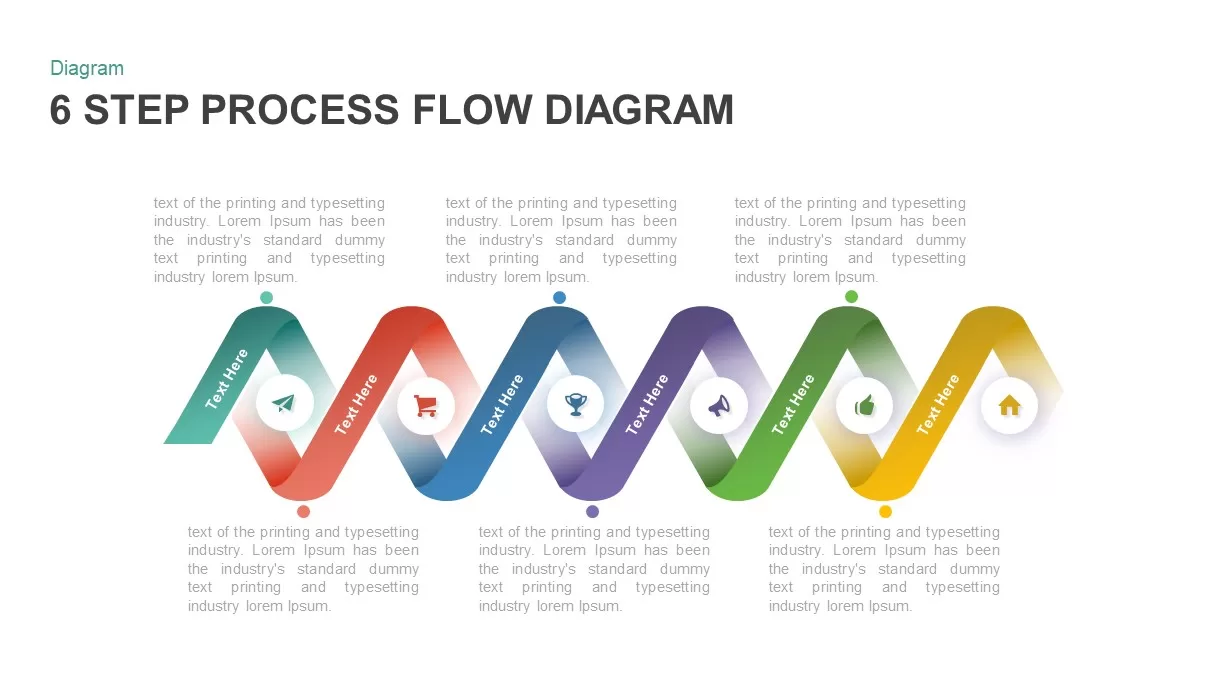
6 Step Process Flow Diagram for PowerPoint & Google Slides
Charts
5 Steps Linear Process Flow Diagram template
Process
Octagon Process Flow template for PowerPoint & Google Slides
Process
5-Stage Arrow Infographics Process Flow Template for PowerPoint & Google Slides
Arrow
Five-Stage Direct Flow Arrow Process Template for PowerPoint & Google Slides
Arrow
Four-Stage Circular Process Flow Template for PowerPoint & Google Slides
Process
Modern 5-Step Process Flow Infographic Template for PowerPoint & Google Slides
Process
Five-Step Process Flow Infographic Template for PowerPoint & Google Slides
Process
Free Colorful Process Flow Infographics Template for PowerPoint & Google Slides
Process
Free
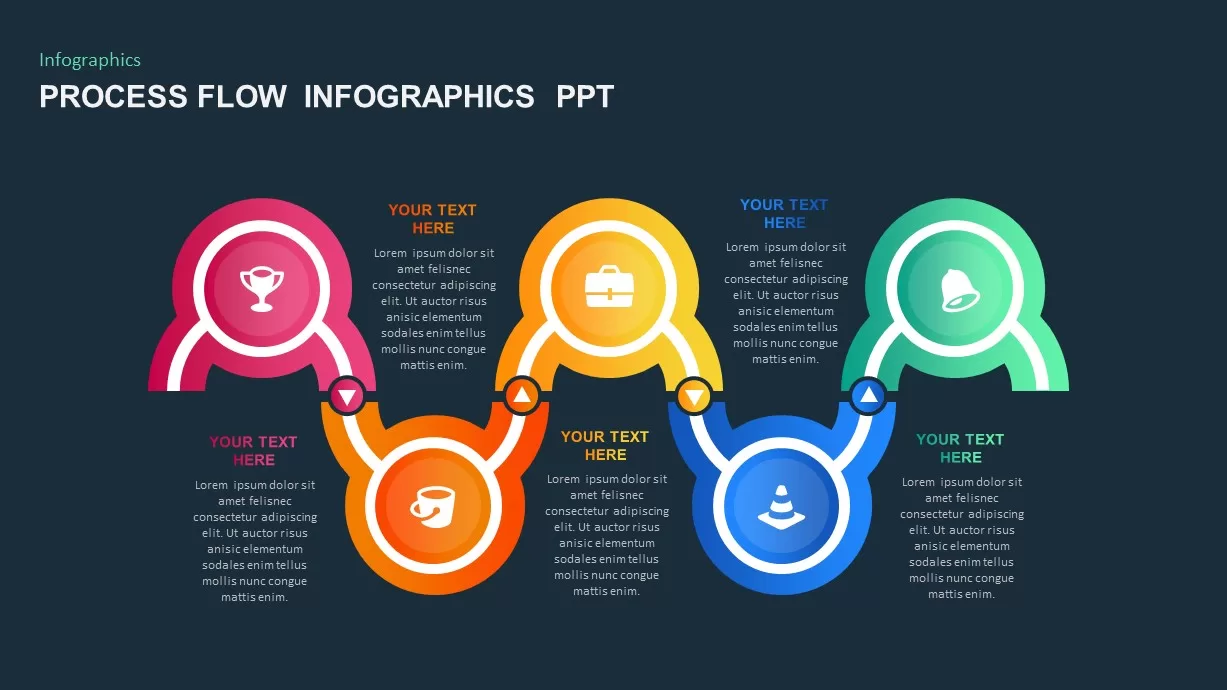
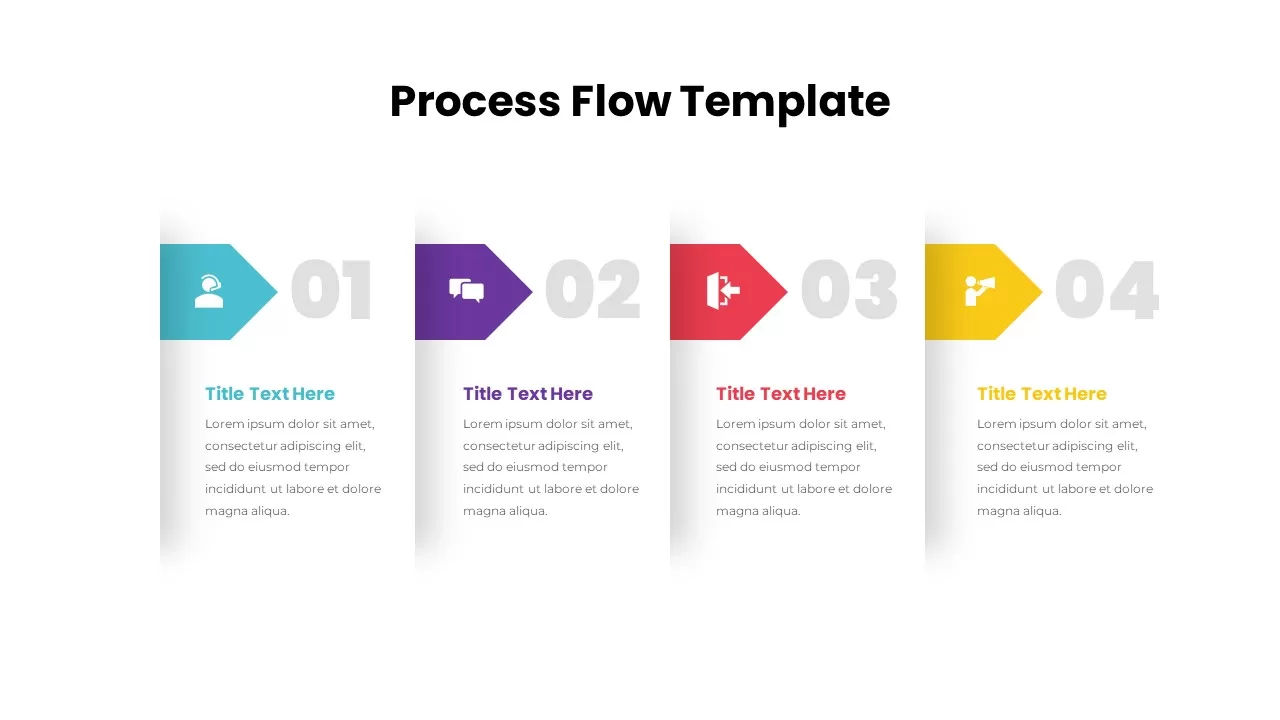
Process Flow Template for PowerPoint & Google Slides
Process
Colorful Process Flow Template for PowerPoint & Google Slides
Process
Process Flow Template for PowerPoint & Google Slides
Process
Free
Process Flow Template for PowerPoint & Google Slides
Process
Free
5 Stage Process Flow Overview template for PowerPoint & Google Slides
Process
Curved Arrow Process Flow Infographic Template for PowerPoint & Google Slides
Process
Curved Arrow Process Flow template for PowerPoint & Google Slides
Process
Circular Arrows Process Flow template for PowerPoint & Google Slides
Process
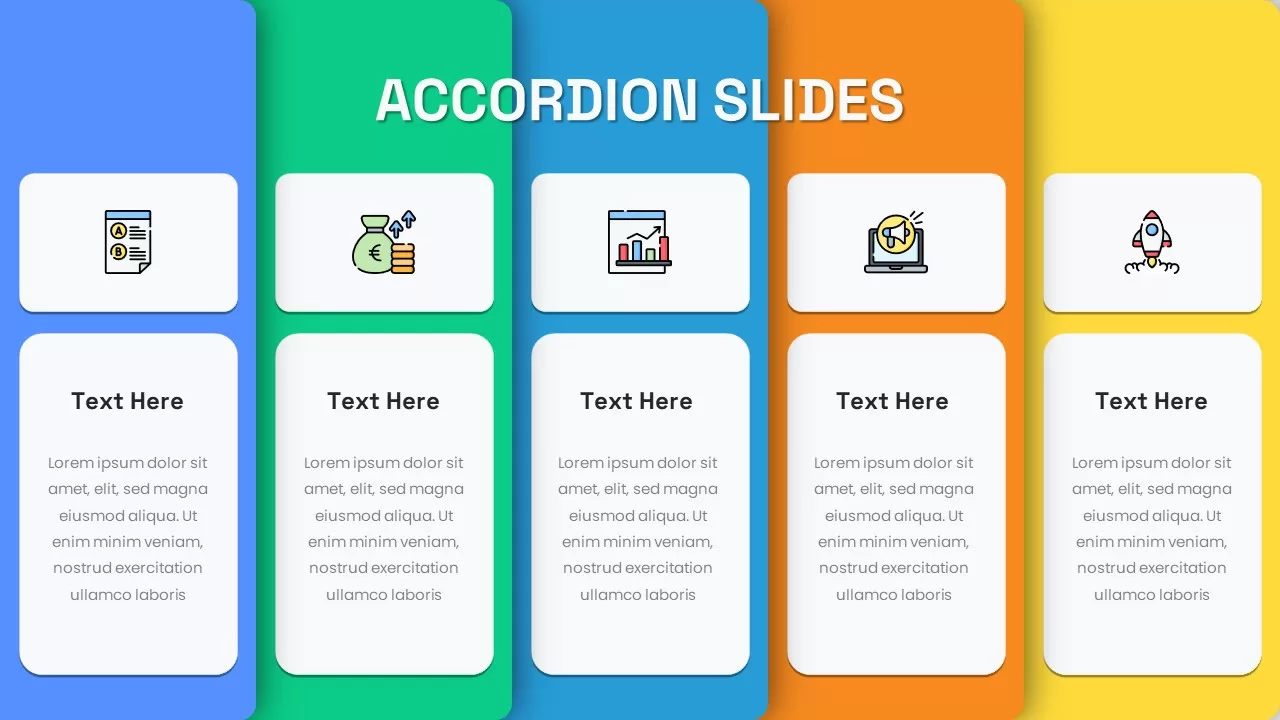
Animated Accordion Process Flow Template for PowerPoint & Google Slides
Process
Conveyor Belt Infographic Process Flow Template for PowerPoint & Google Slides
Process
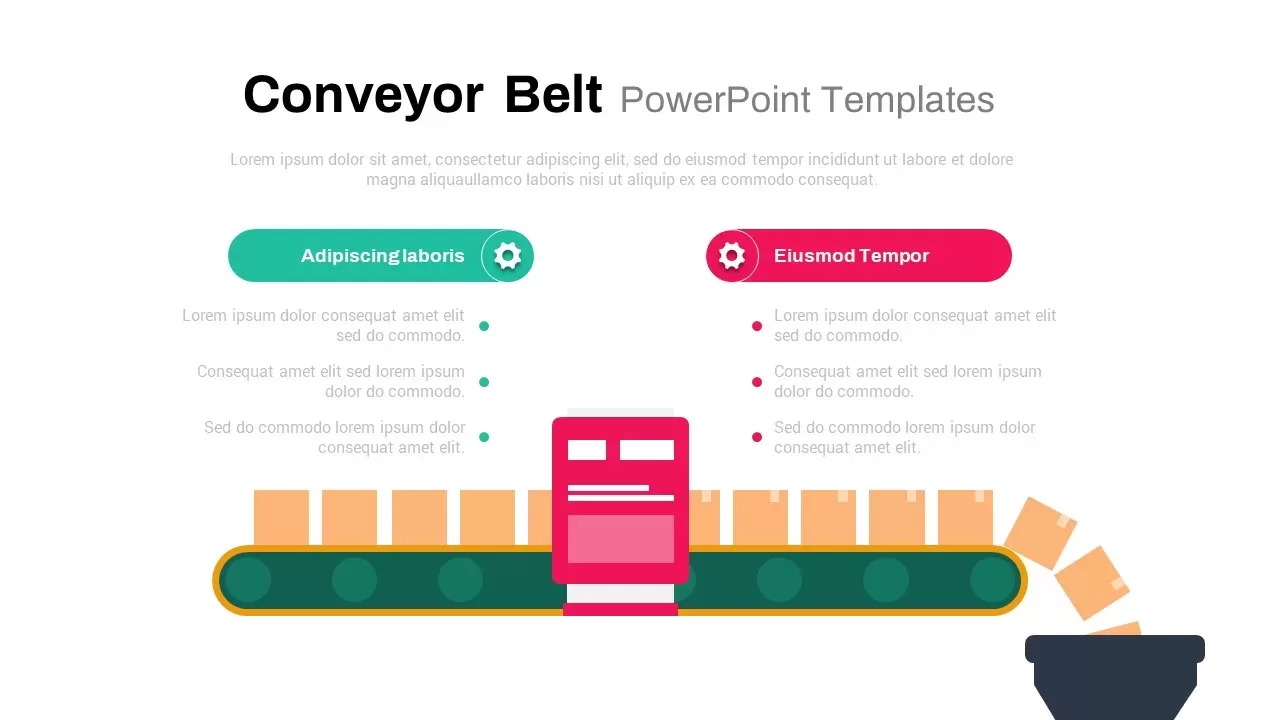
Dynamic Conveyor Belt Process Flow Template for PowerPoint & Google Slides
Process
Comprehensive Hiring Process Flow Chart Template for PowerPoint & Google Slides
Flow Charts
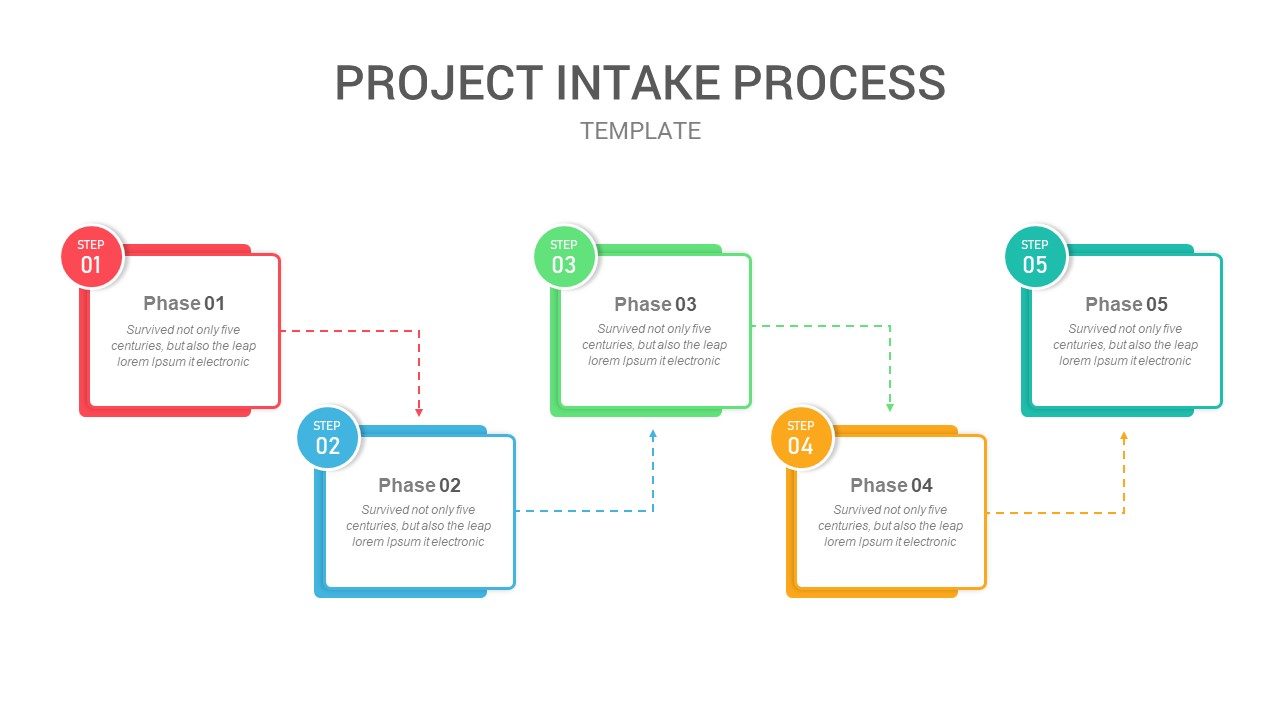
Five-Phase Project Intake Process Flow Template for PowerPoint & Google Slides
Process
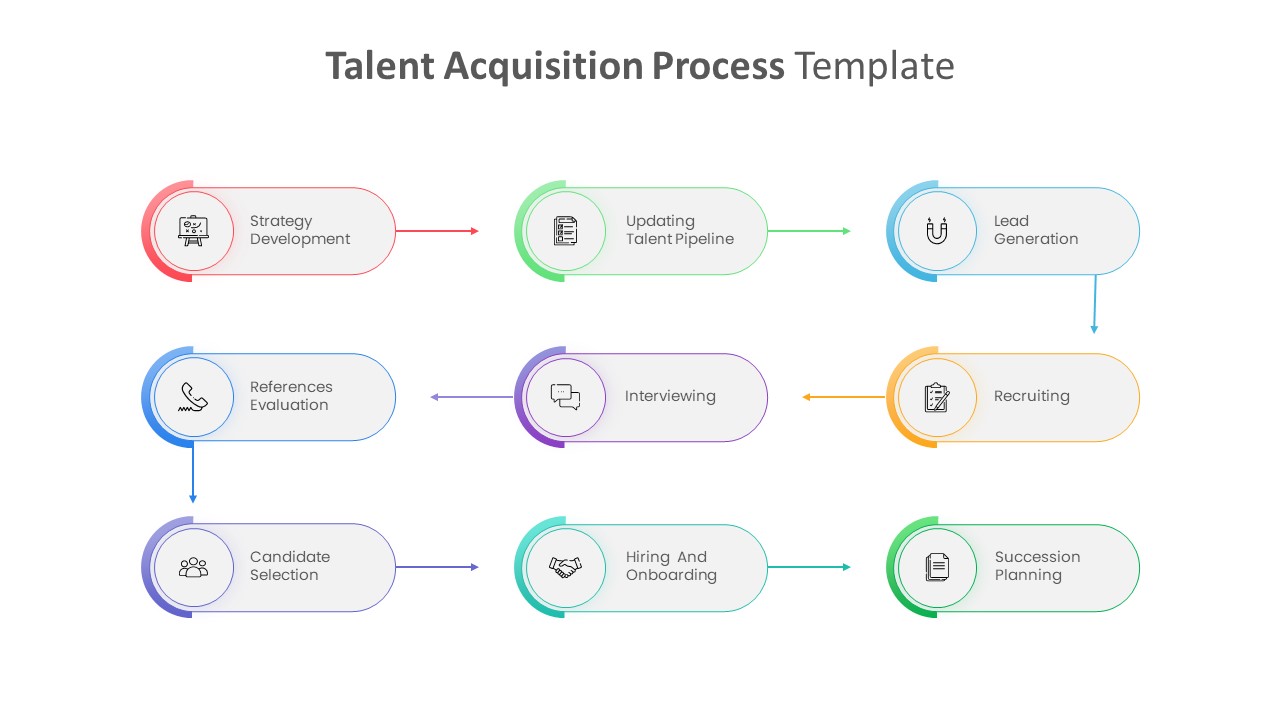
Talent Acquisition Process Flow Template for PowerPoint & Google Slides
Recruitment

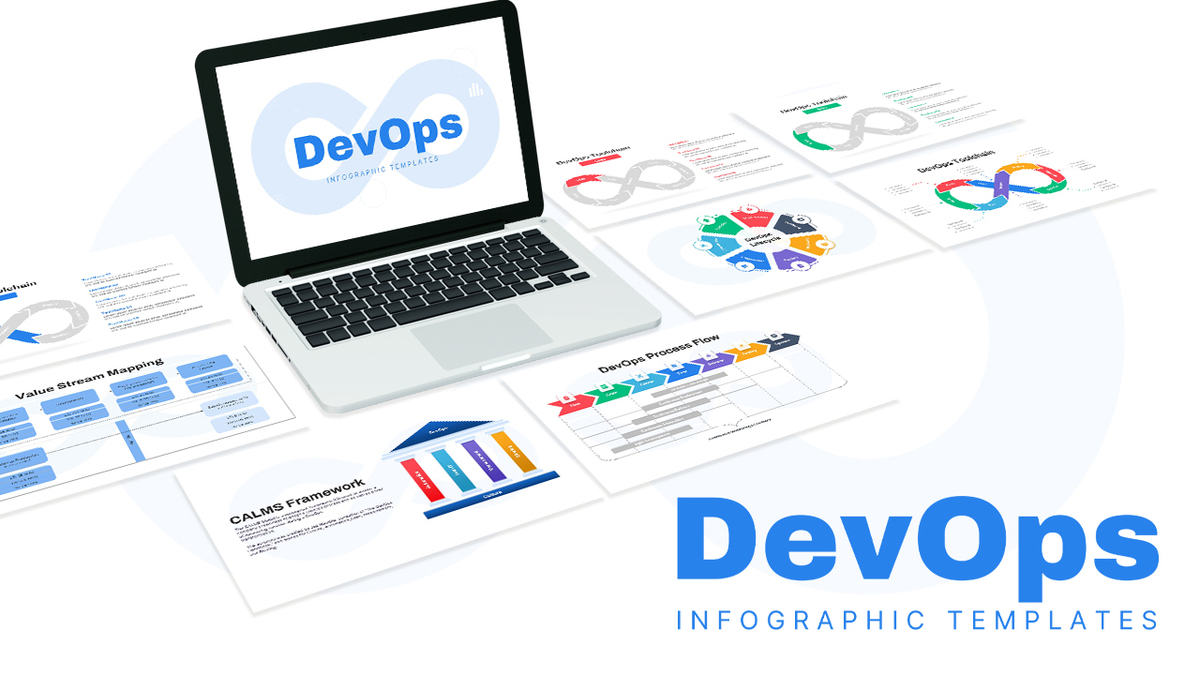
DevOps Infographics & Process Flow Template for PowerPoint & Google Slides
Information Technology
Chevron Process Flow Sequence Slide Template for PowerPoint & Google Slides
Arrow
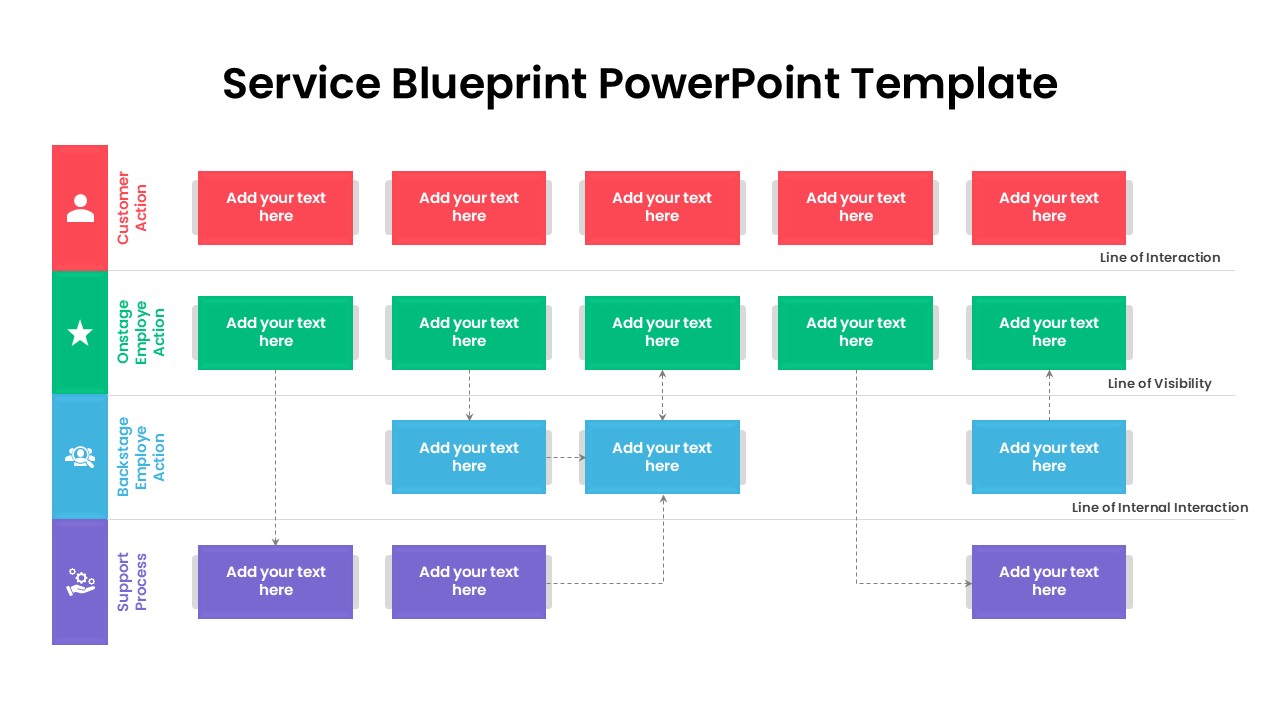
Service Blueprint Process Flow Template for PowerPoint & Google Slides
Process
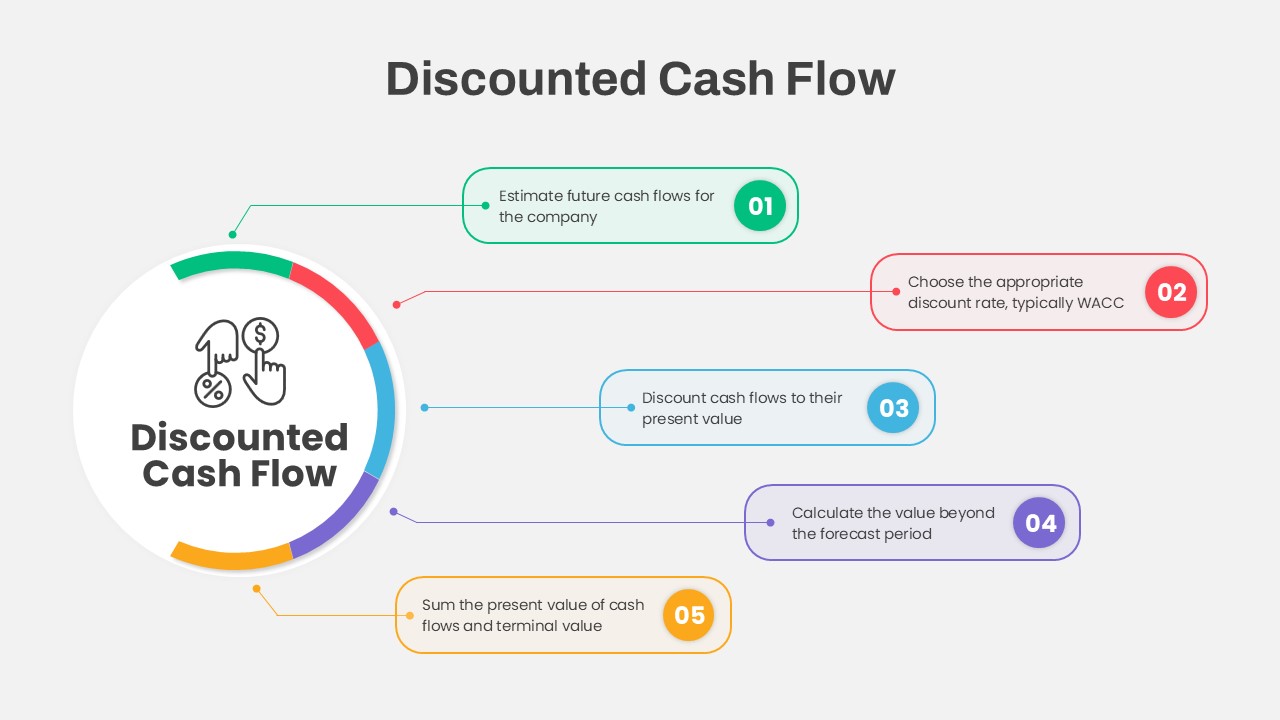
Discounted Cash Flow Five-Step Process Template for PowerPoint & Google Slides
Process
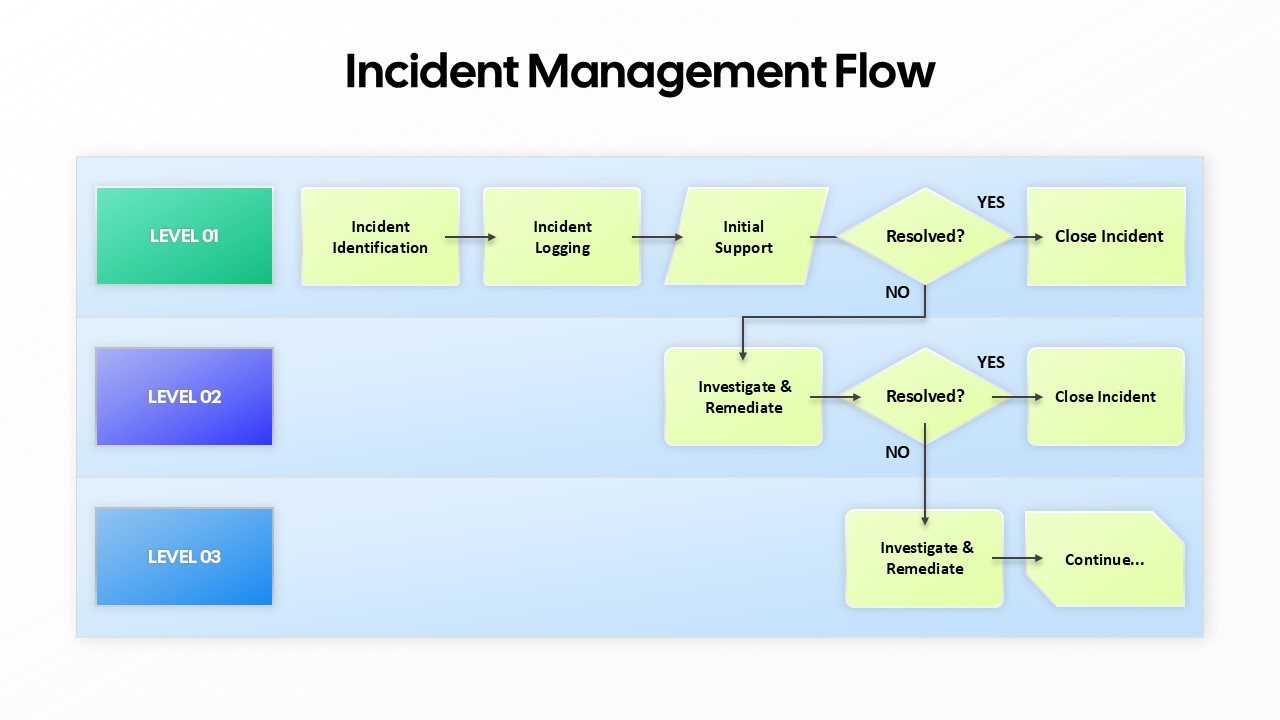
Incident Management Flow Process template for PowerPoint & Google Slides
Flow Charts