Global Production Network Overview Map Template for PowerPoint & Google Slides


Description
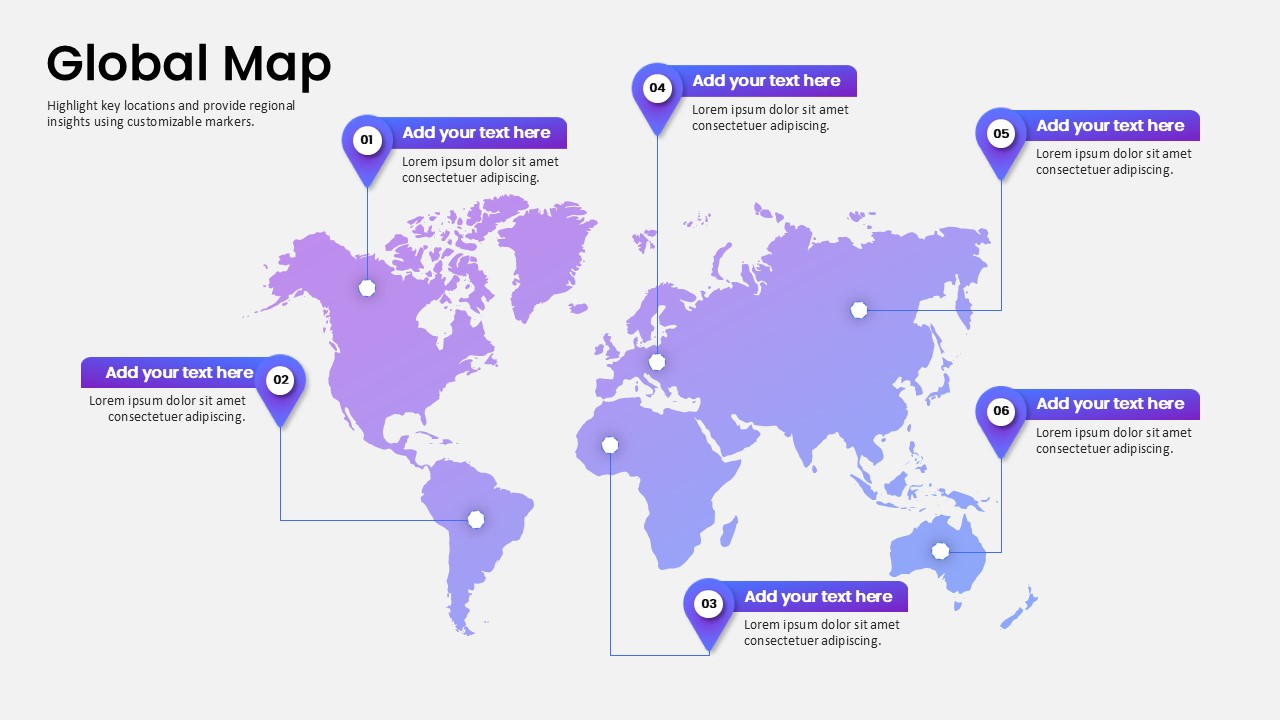
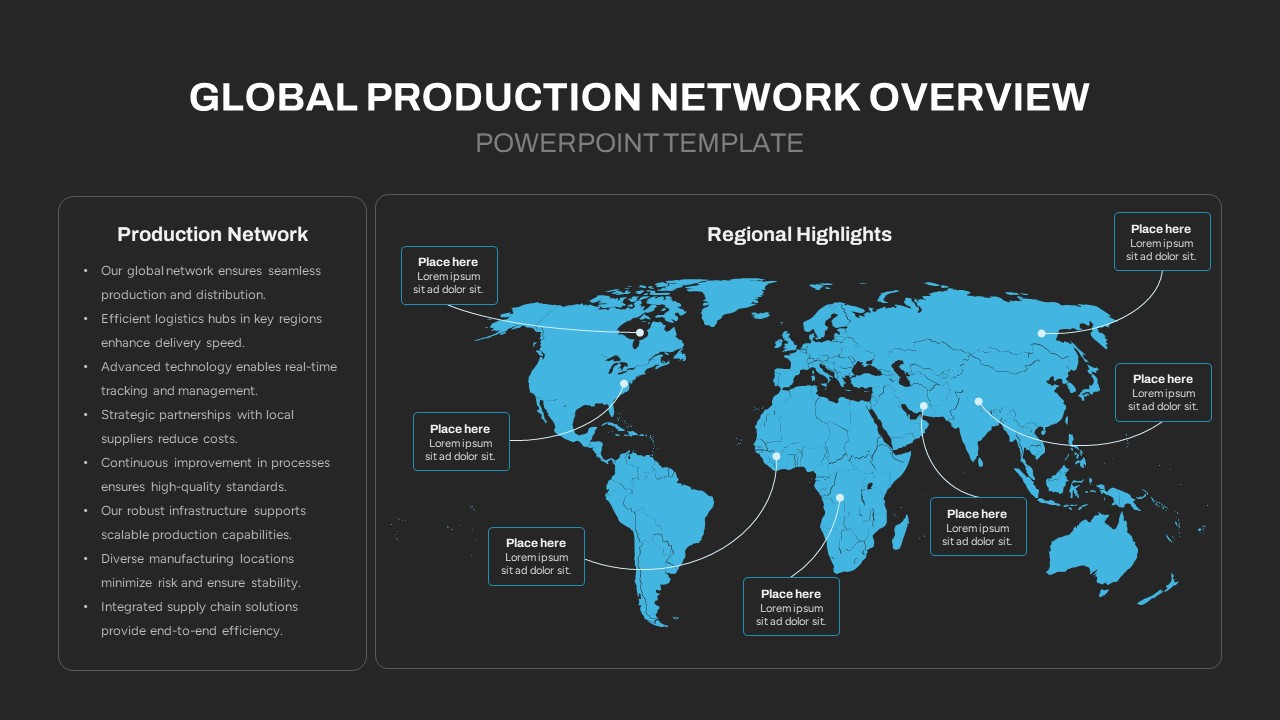
This global production network overview template provides a world map infographic slide to highlight regional manufacturing hubs and distribution centers. A full-bleed blue map forms the backdrop for six customizable callouts, each linked to strategic locations with editable connectors and text placeholders. On the left, a production network summary panel features bullet-style text summarizing key capabilities—seamless distribution, efficient logistics hubs, advanced tracking technology, local supplier partnerships, process improvements, scalable infrastructure, diversified sites, and end-to-end supply-chain integration. The clean white background and minimal design ensure maximum legibility, while vector-based shapes guarantee scalability across resolutions.
Crafted on master slides, this template allows you to quickly swap the map graphic, adjust region markers, and tailor descriptive text without disrupting slide layout. The lightweight design translates flawlessly between PowerPoint and Google Slides, preserving fonts, colors, and connectors. Integrated guide layers facilitate consistent formatting, helping you align brand assets, apply corporate color palettes to callout segments, and update icons with one click. Whether addressing global logistics, manufacturing footprint, or supplier network, the slide accelerates preparation by eliminating manual map editing.
Beyond production network presentations, this slide can support supply-chain risk assessments, market entry strategies, territory planning, and customer service footprint mapping. Use the radial callouts to display sales regions, technical support centers, or distribution corridors. The template’s modular structure also lends itself to annual reports, board updates, and investor briefings—any scenario where geographic context and concise regional insights drive strategic decisions. Vector-based map assets ensure crisp visuals in printed reports, while accessibility-friendly text ensures readability for diverse audiences. Hidden guide layers provide troubleshooting support and instructional callouts to accelerate slide adoption.
Who is it for
Supply chain managers, operations directors, logistics coordinators, and network planners will benefit from this template when presenting global distribution strategies, manufacturing footprints, or regional performance reviews.
Other Uses
Repurpose this map slide for sales territory planning, market expansion analysis, risk mapping, supplier network visualization, or customer support zone mapping to maintain consistent visual storytelling across presentations.
Login to download this file

Item ID
SB04374
Related Templates

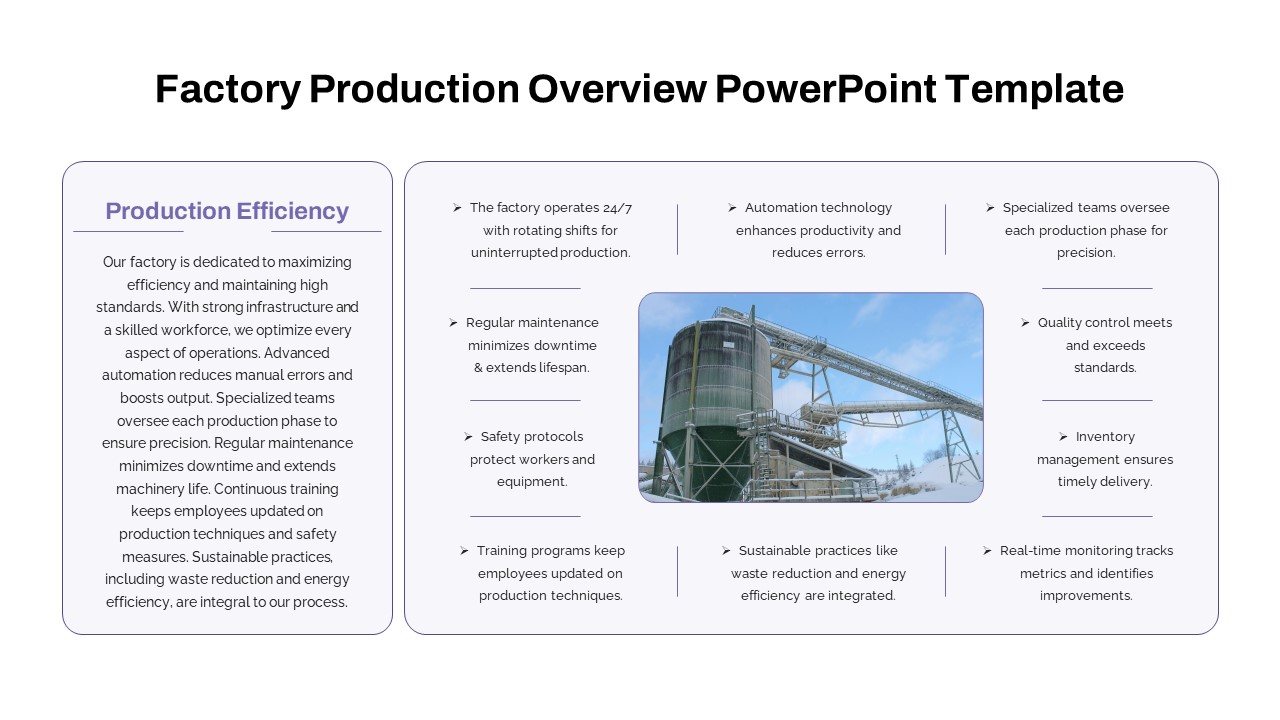
Factory Production Overview Template for PowerPoint & Google Slides
Business Report
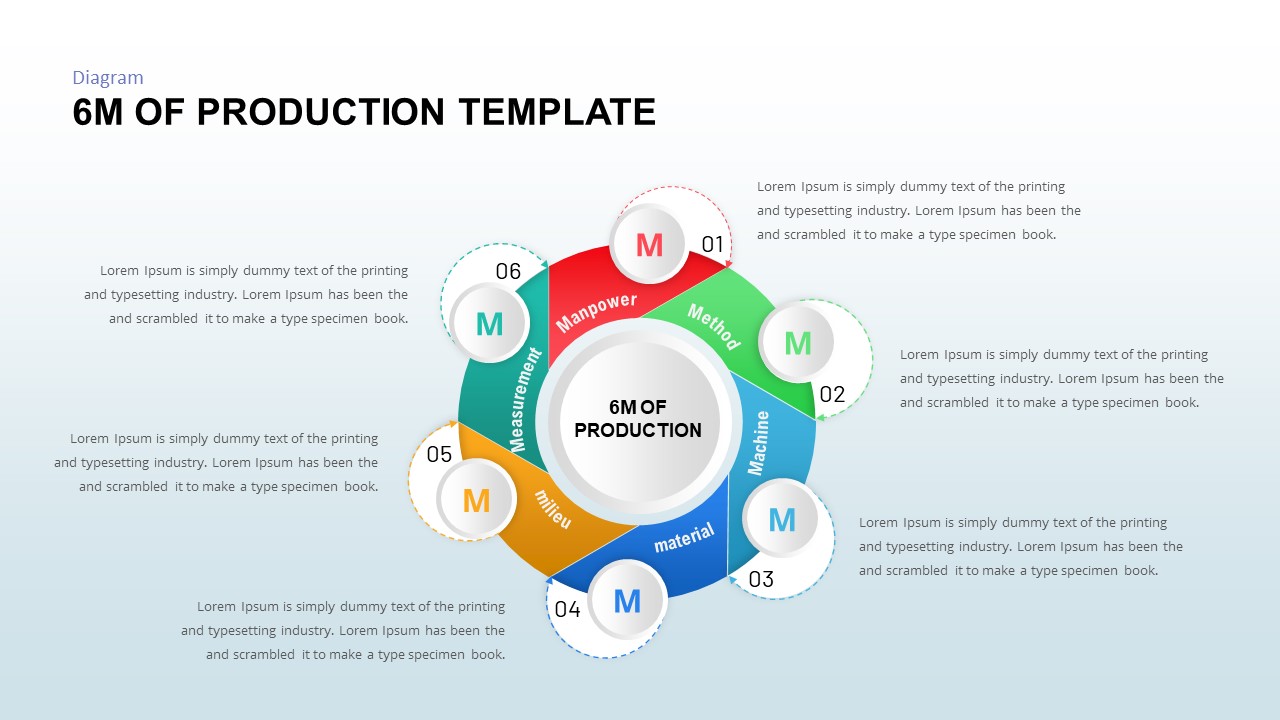
6M of Production Template for PowerPoint & Google Slides
Business Plan
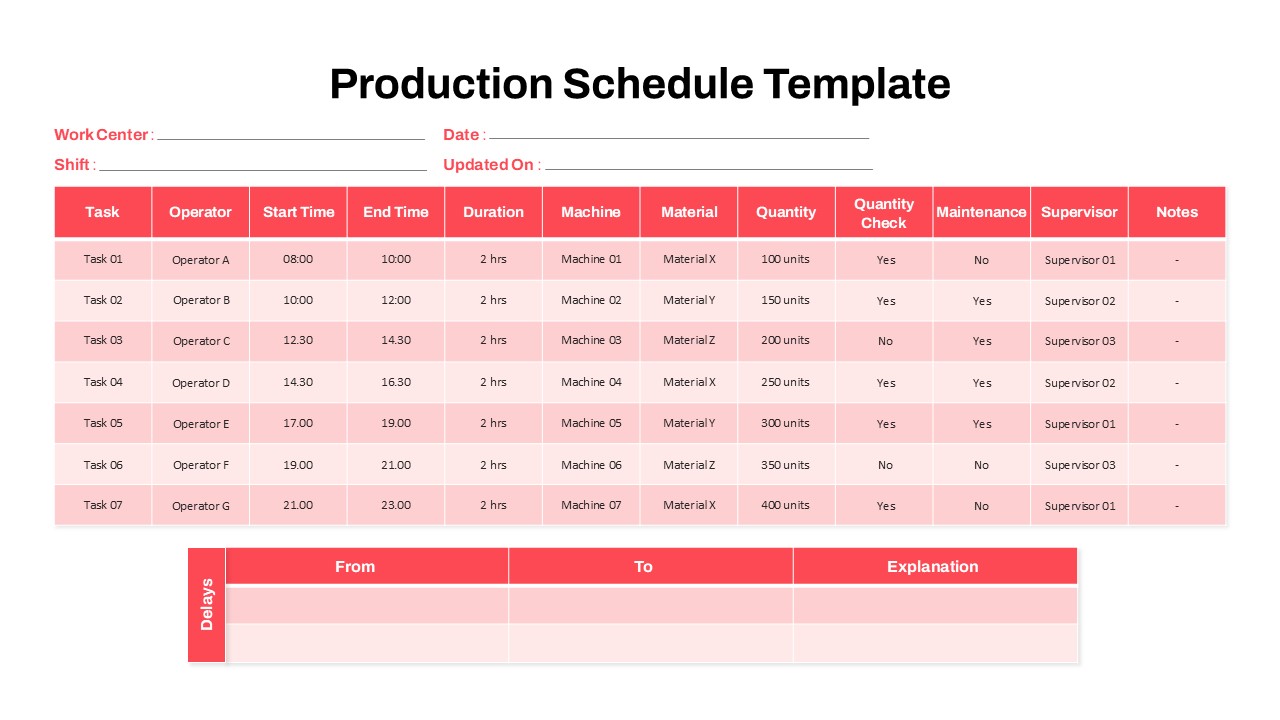
Production Schedule with Delay Tracking Template for PowerPoint & Google Slides
Project Status
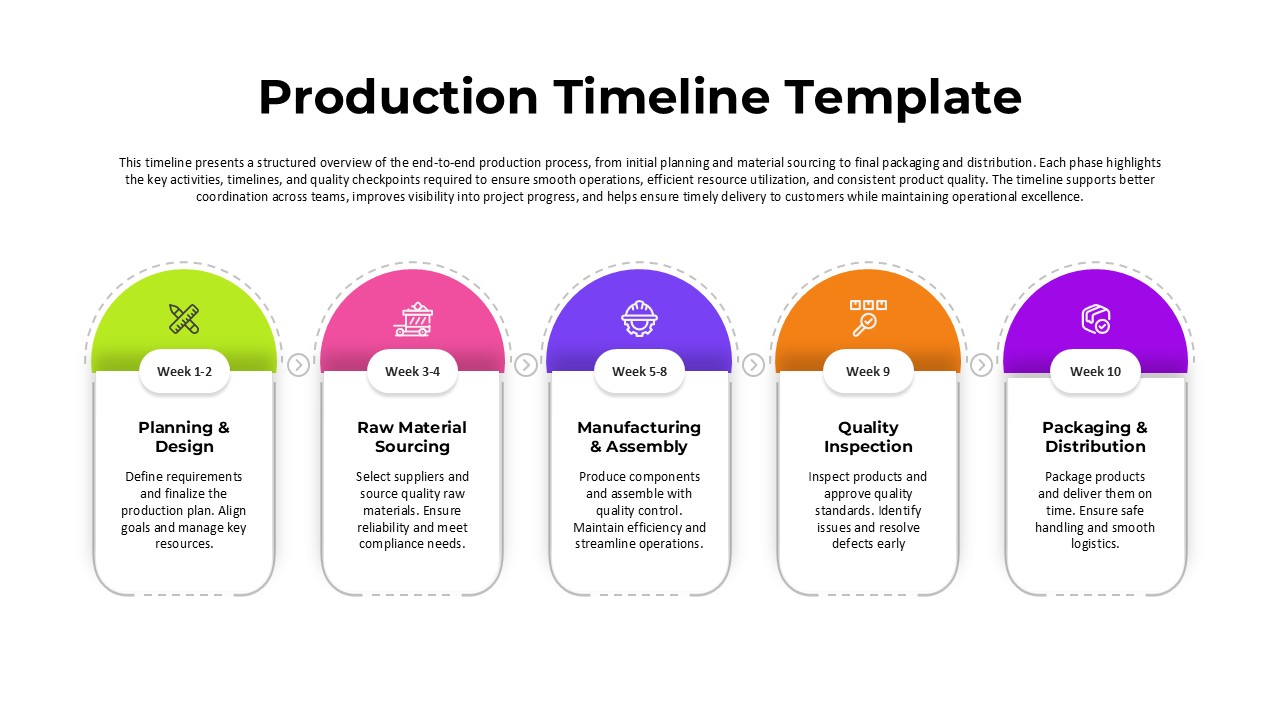
Production Timeline Template for PowerPoint & Google Slides
Timeline

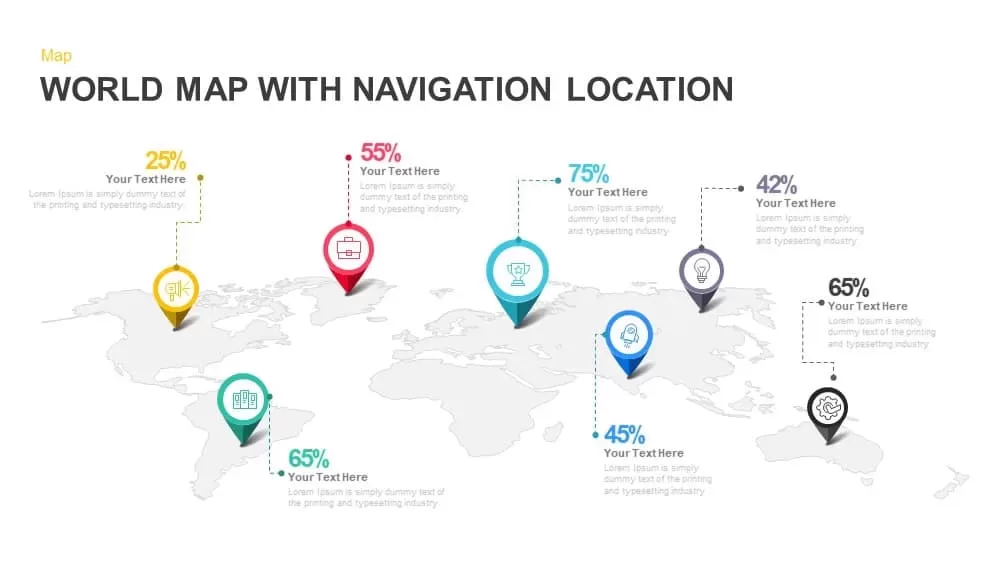
Global Map with Location Markers Template for PowerPoint & Google Slides
World Maps
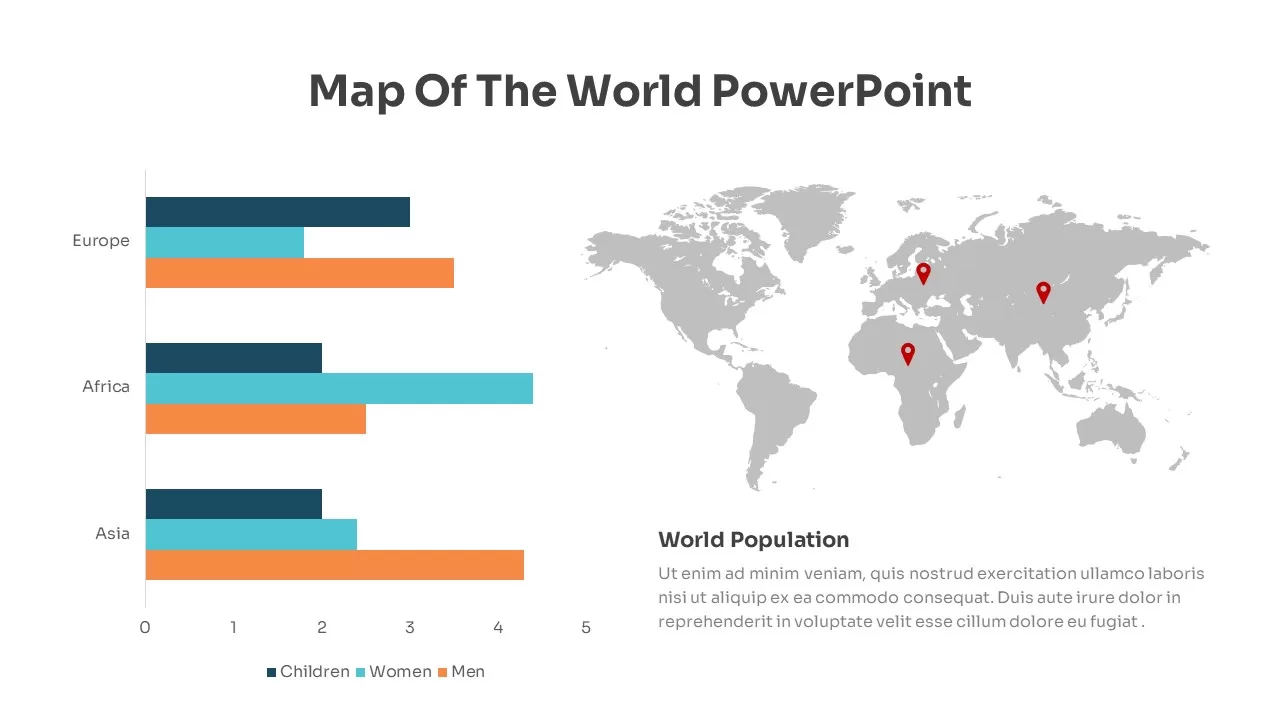
Global Population Demographics & Map Template for PowerPoint & Google Slides
Bar/Column
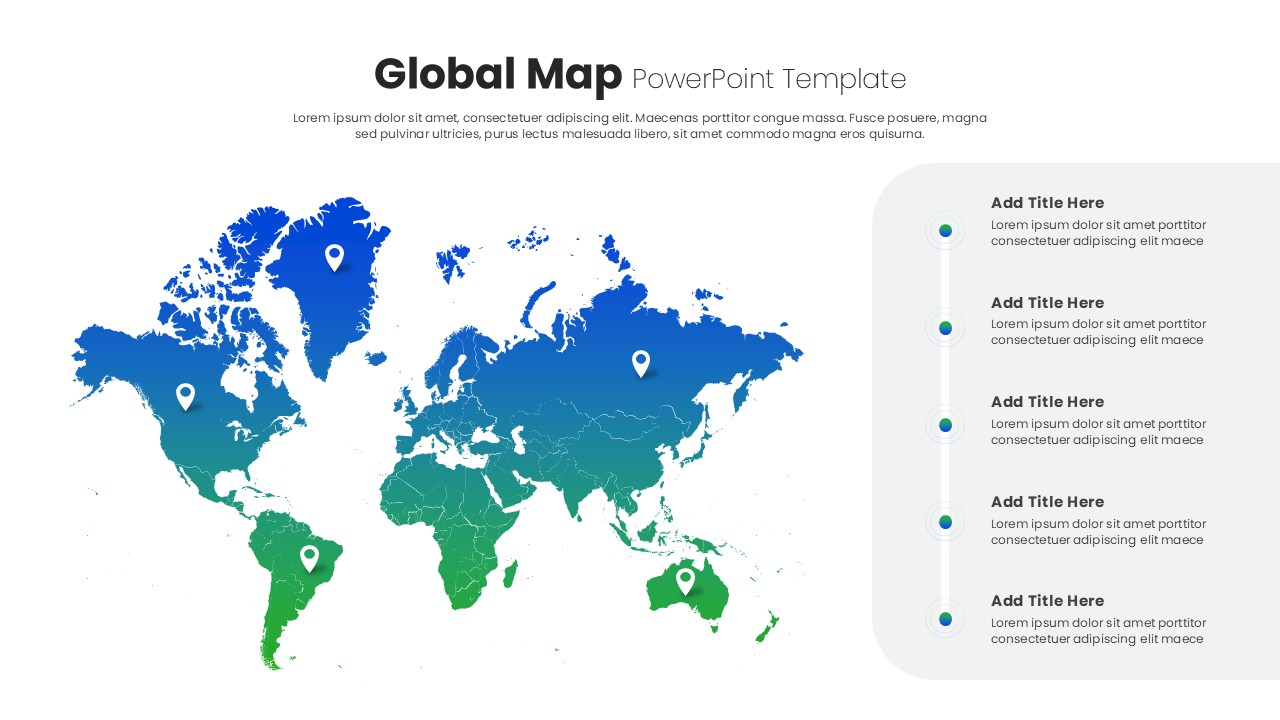
Free Global Market Distribution Map Template for PowerPoint & Google Slides
World Maps
Free
Global Map Highlighting Key Locations template for PowerPoint & Google Slides
World Maps
Global Map with Pinpoint Markers template for PowerPoint & Google Slides
Business
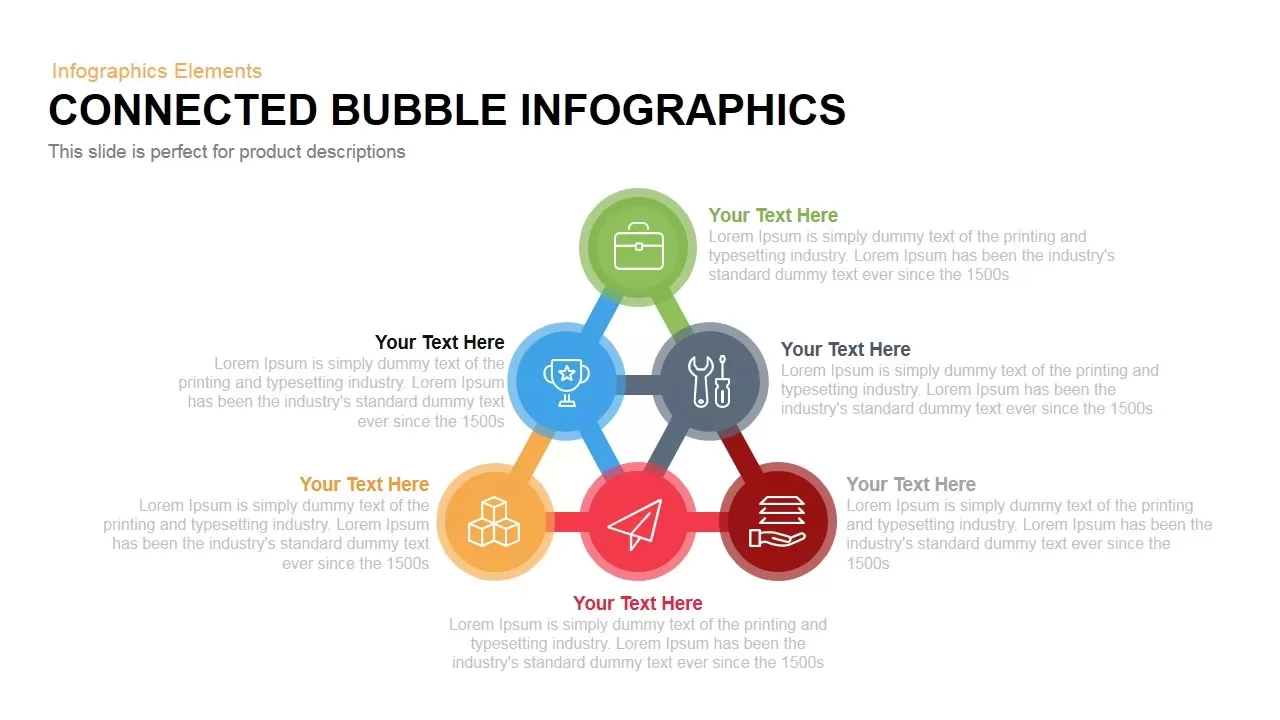
Connected Bubble Network Infographic Template for PowerPoint & Google Slides
Circular
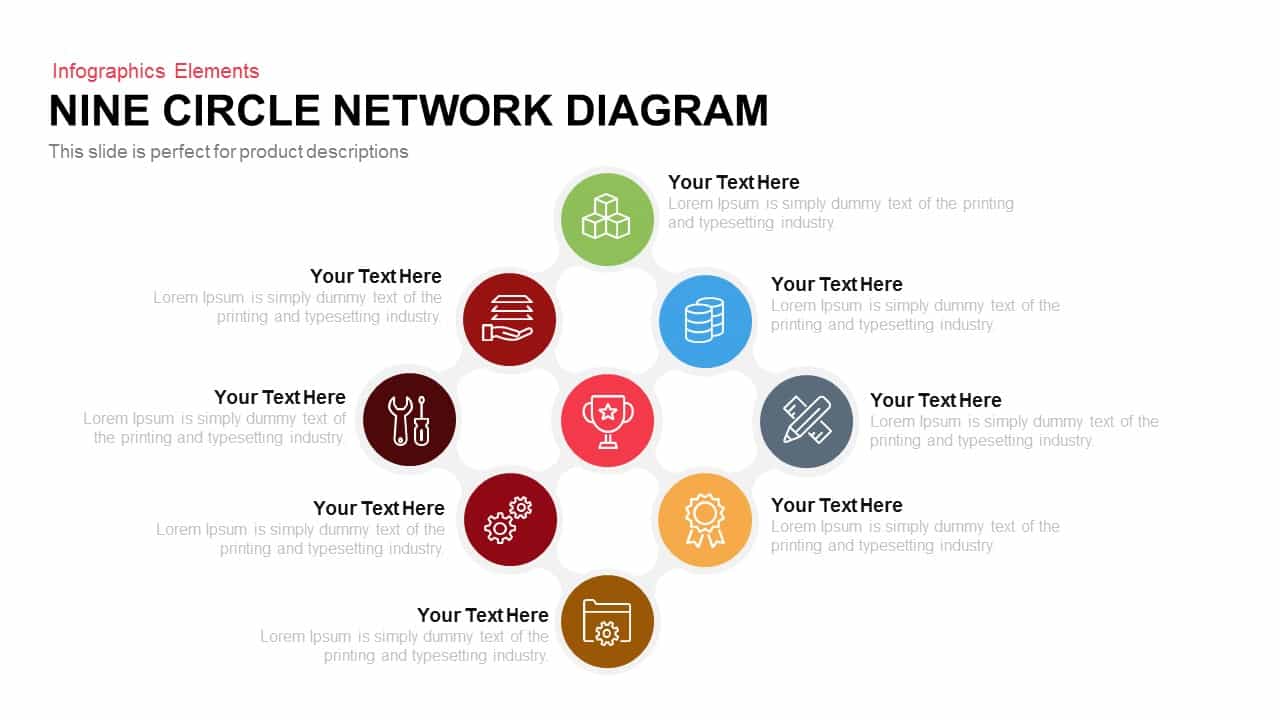
Modern Nine Circle Network Diagram Template for PowerPoint & Google Slides
Circular
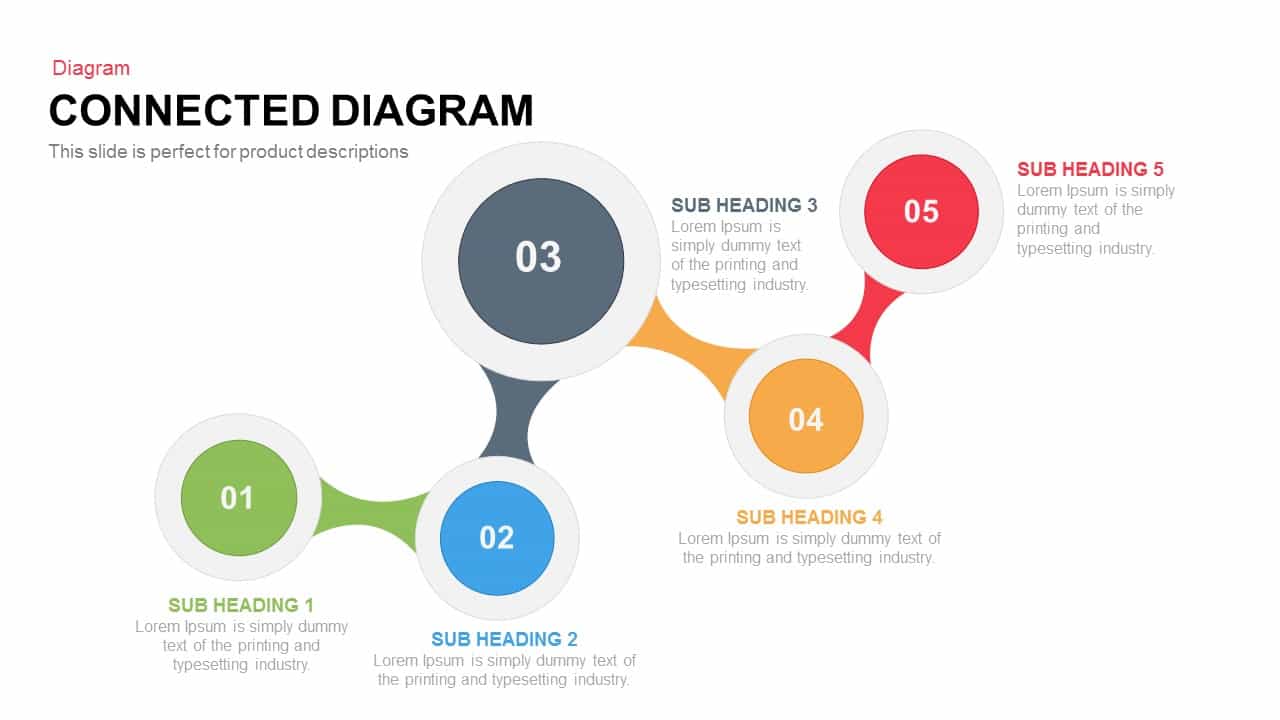
Interactive Connected Network Diagram Template for PowerPoint & Google Slides
Process
Social Media Mind Network Infographic Template for PowerPoint & Google Slides
Digital Marketing
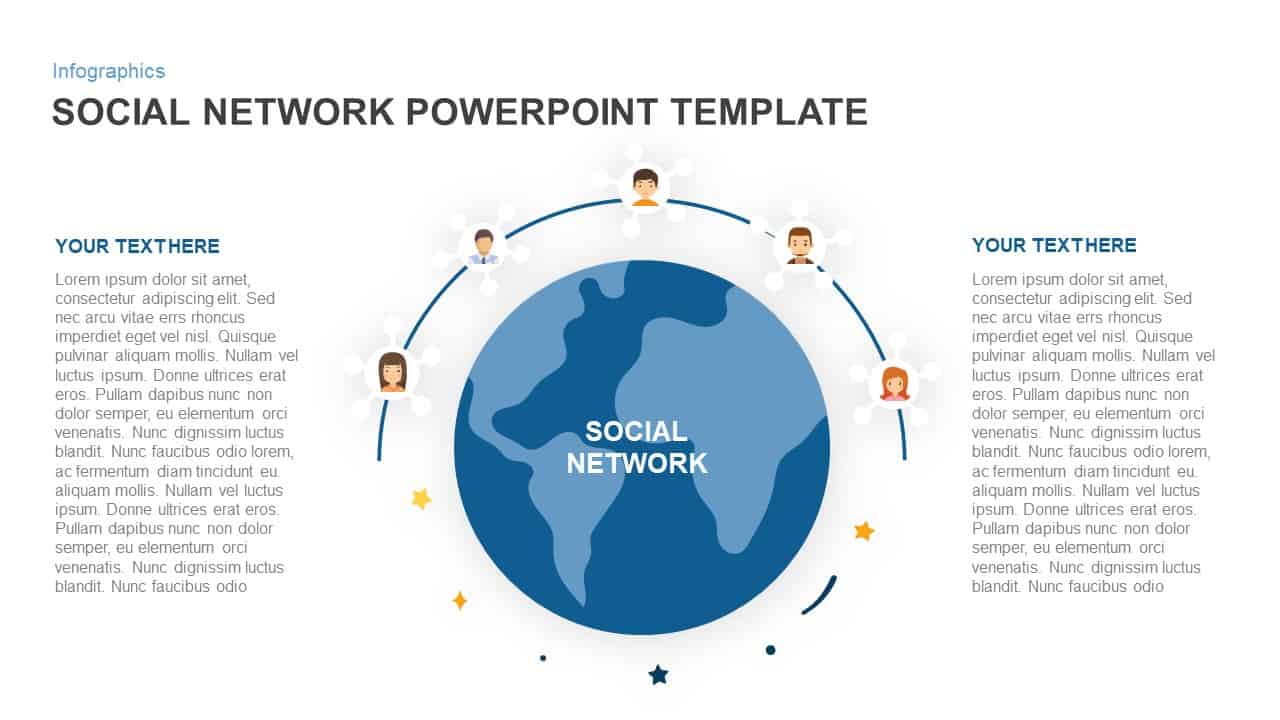
Social Network Connectivity Infographic Template for PowerPoint & Google Slides
Infographics
Social Network Infographic Diagram Template for PowerPoint & Google Slides
Digital Marketing
Social Media Network Infographic Template for PowerPoint & Google Slides
Circular
Network Diagram Elements and Icons Pack Template for PowerPoint & Google Slides
Information Technology
Neural Network Brain Infographic Template for PowerPoint & Google Slides
Process
Social Media Community Network Slide Template for PowerPoint & Google Slides
Circular
Free Big Data Network Visualization Template for PowerPoint & Google Slides
Circular
Free
Quarterly Network Volume Analysis Template for PowerPoint & Google Slides
Business Report
5Cs of Network Effect Circular Diagram Template for PowerPoint & Google Slides
Circular
Recurrent Neural Network Architecture Template for PowerPoint & Google Slides
AI
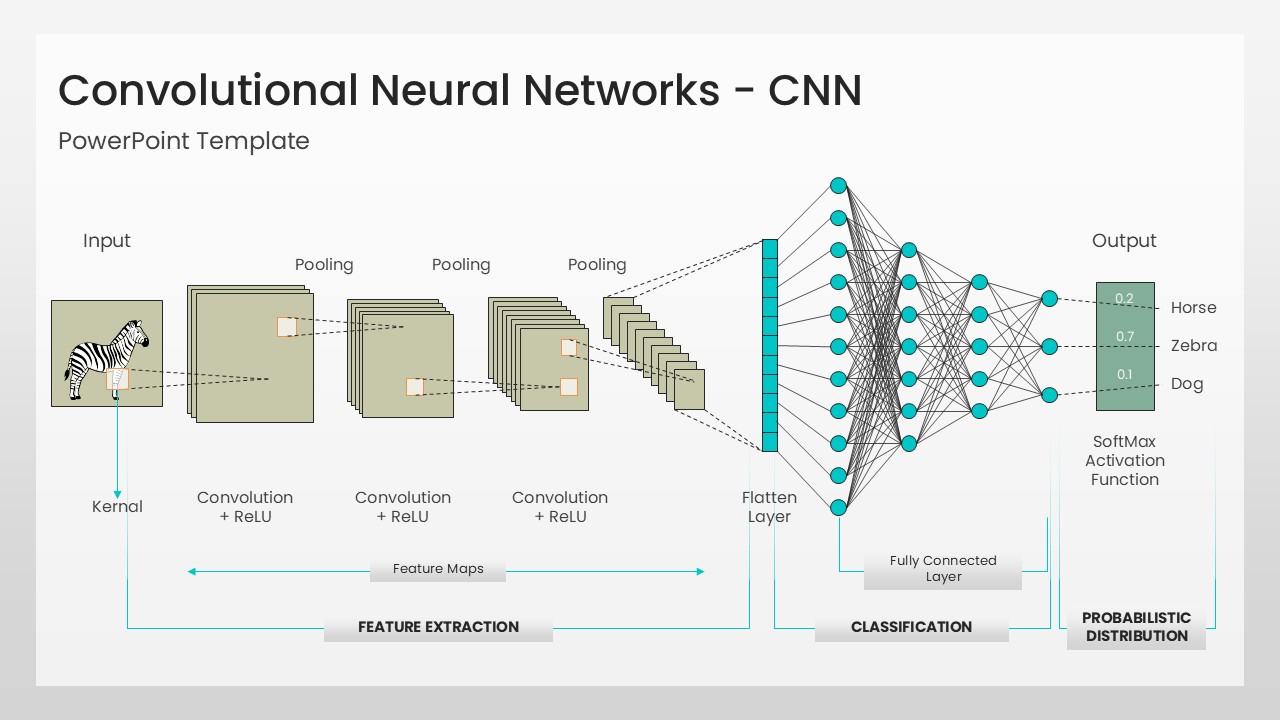
Convolutional Neural Network Architecture Template for PowerPoint & Google Slides
Machine Learning
Network Effects Template for PowerPoint & Google Slides
Software Development
Social Media Network Hub Diagram Slide for PowerPoint & Google Slides
Process
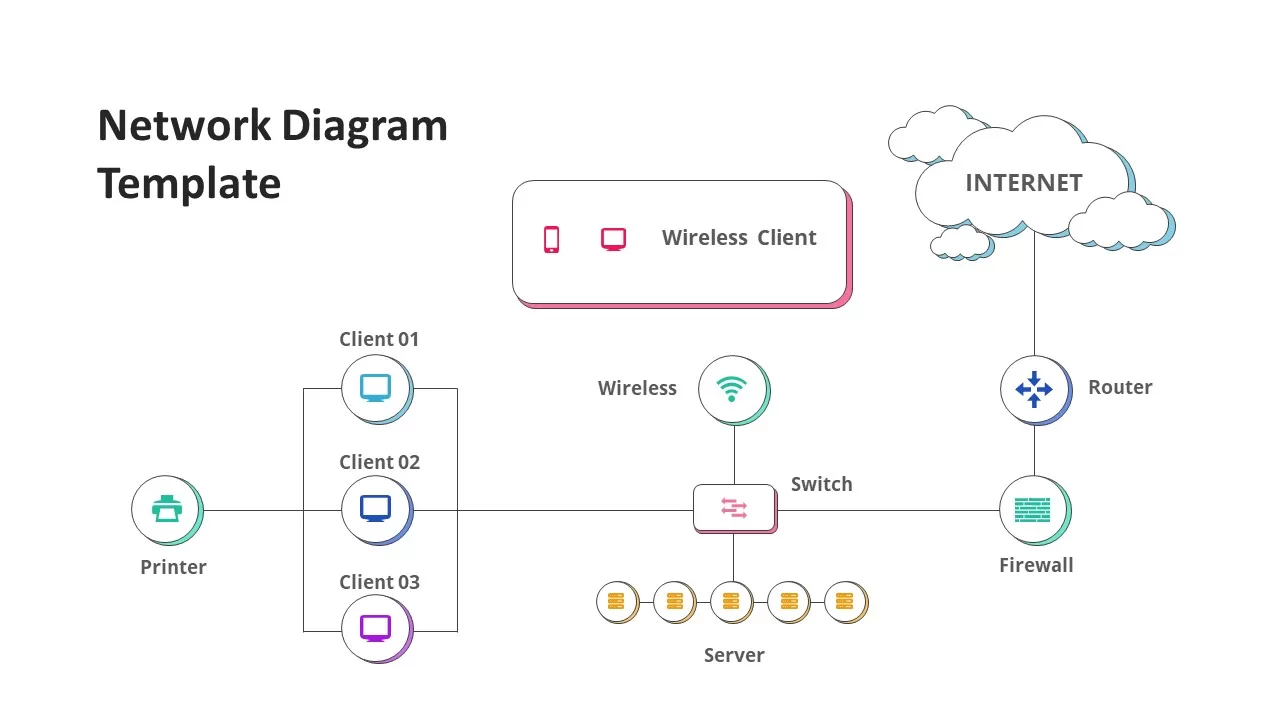
Network Diagram Infographics for PowerPoint & Google Slides
Technology
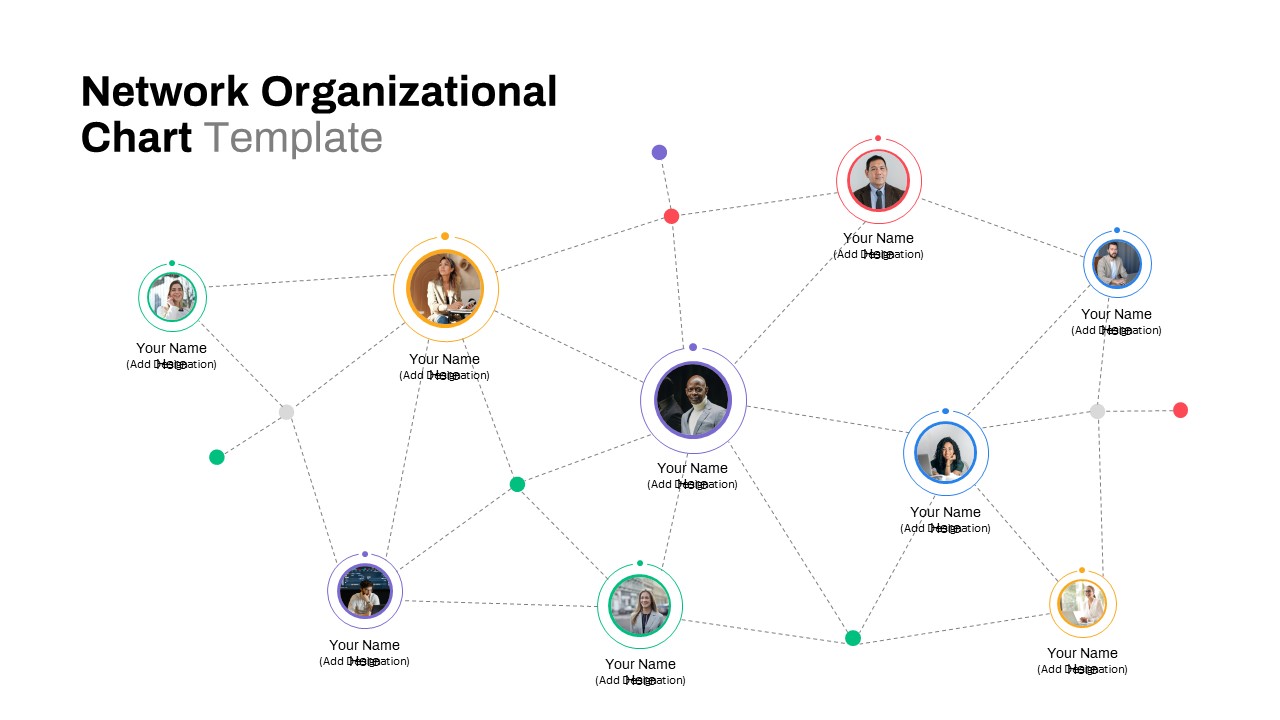
Network Organizational Chart for PowerPoint & Google Slides
Business
Cybersecurity Network Theme for PowerPoint & Google Slides
Information Technology
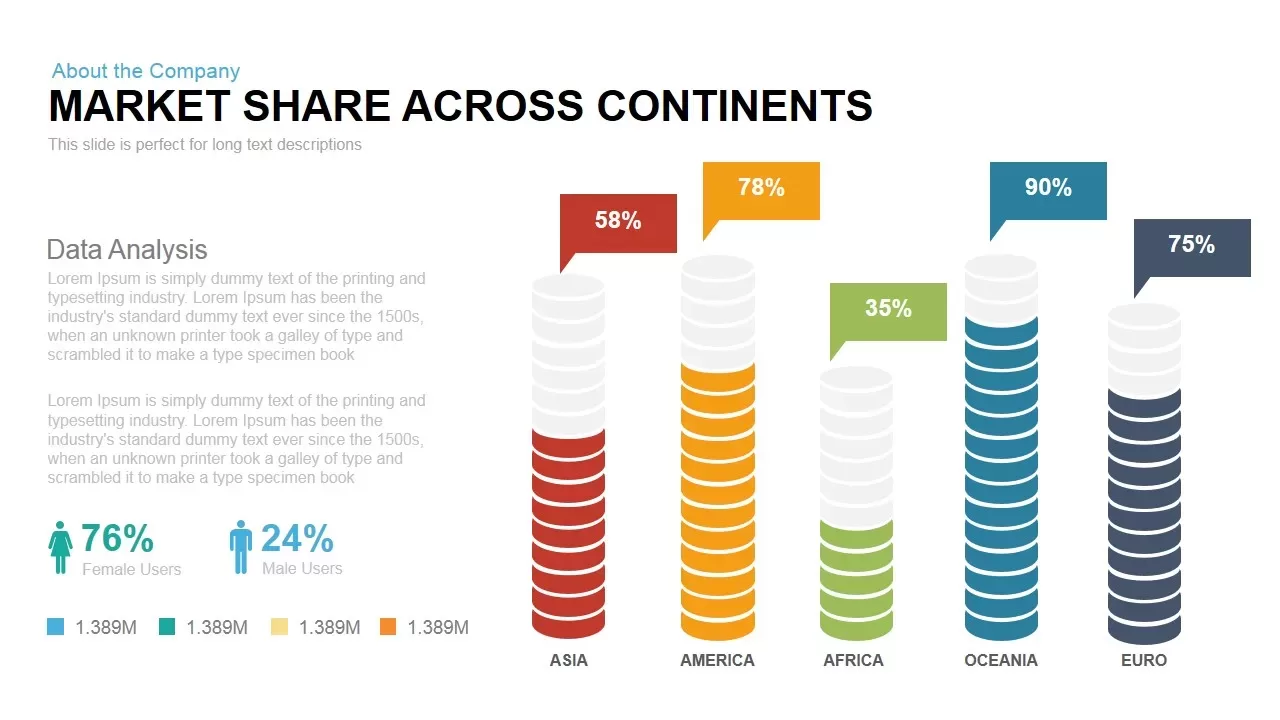
Global Market Share Cylinder Chart Template for PowerPoint & Google Slides
Bar/Column
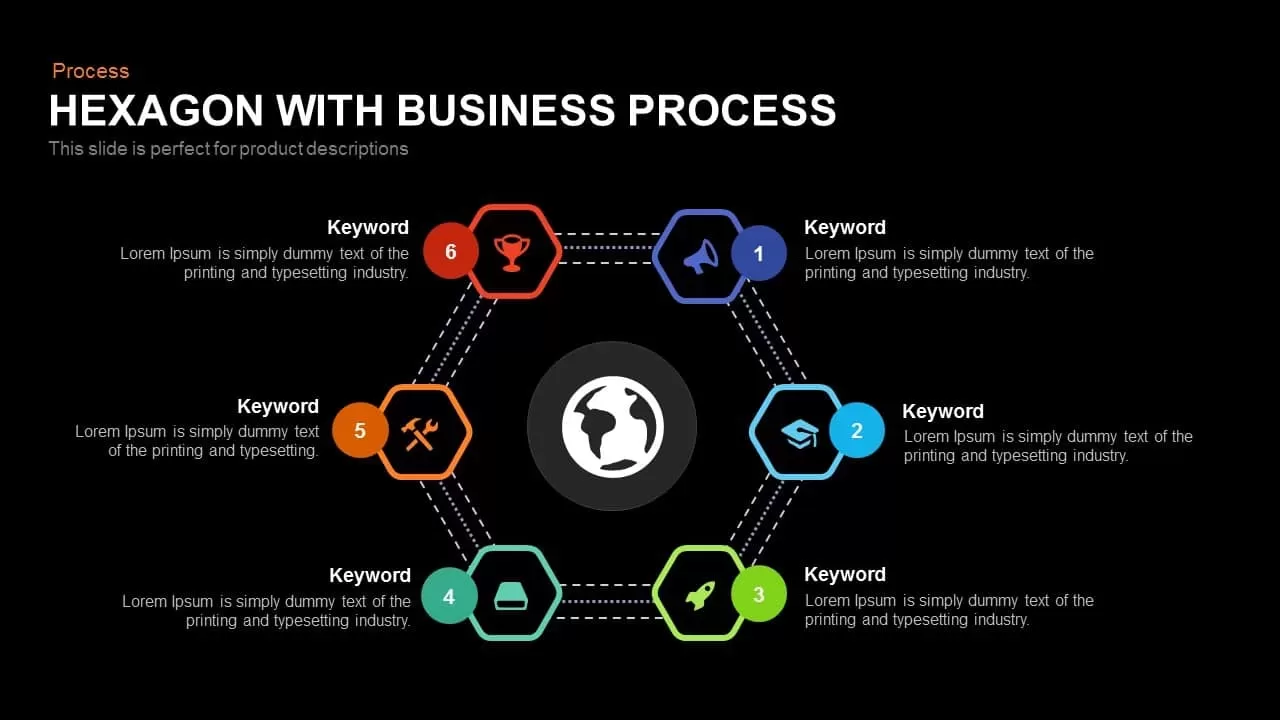
Global Hexagon Six-Step Business Process Template for PowerPoint & Google Slides
Process
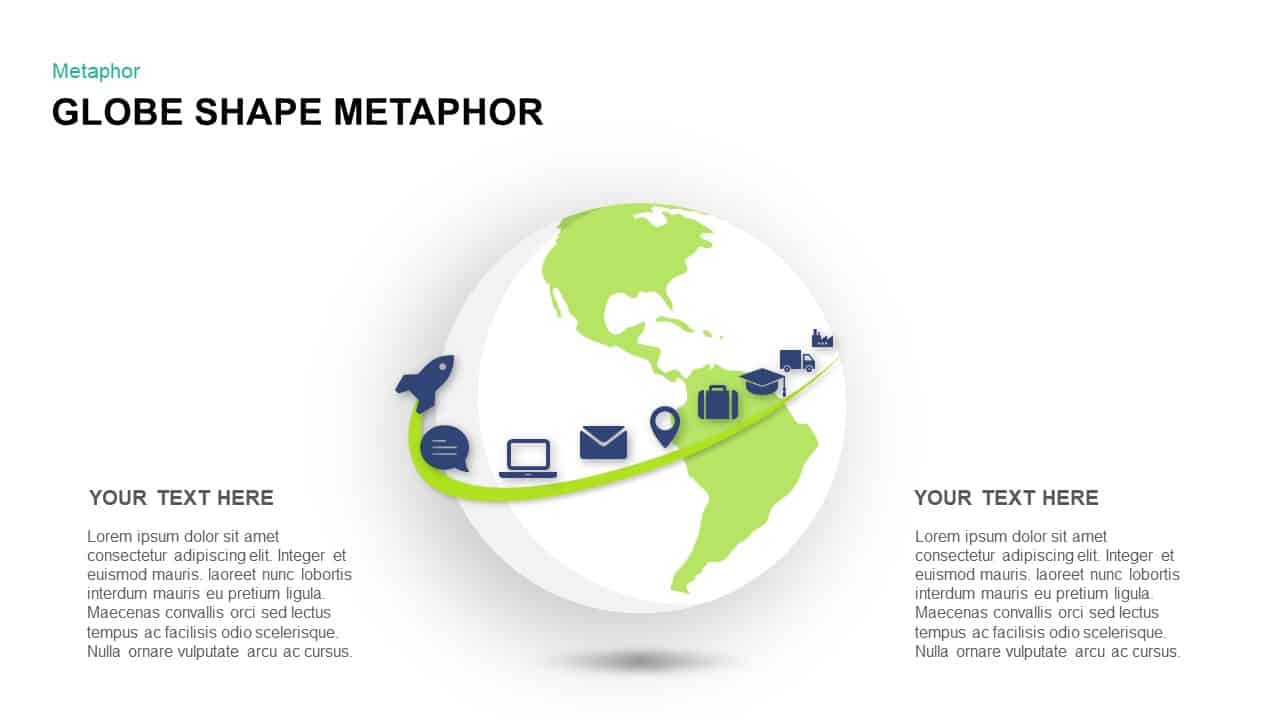
Global Business Pathway Metaphor Template for PowerPoint & Google Slides
Opportunities Challenges
Statistics & Global Metrics Infographic Template for PowerPoint & Google Slides
Bar/Column
Free Global Warming Infographic Comparison Template for PowerPoint & Google Slides
Comparison Chart
Free

Modern Global Travel Presentation Template for PowerPoint & Google Slides
Decks
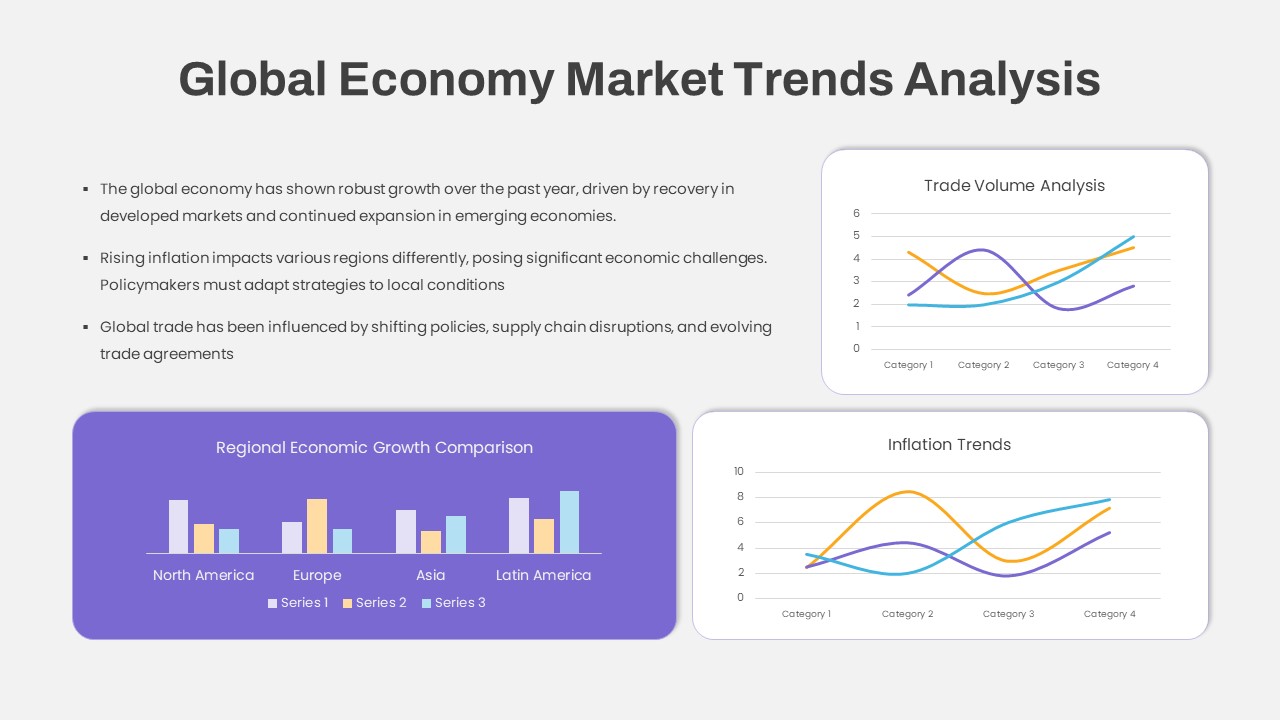
Global Economy Market Trends Analysis Template for PowerPoint & Google Slides
Comparison Chart
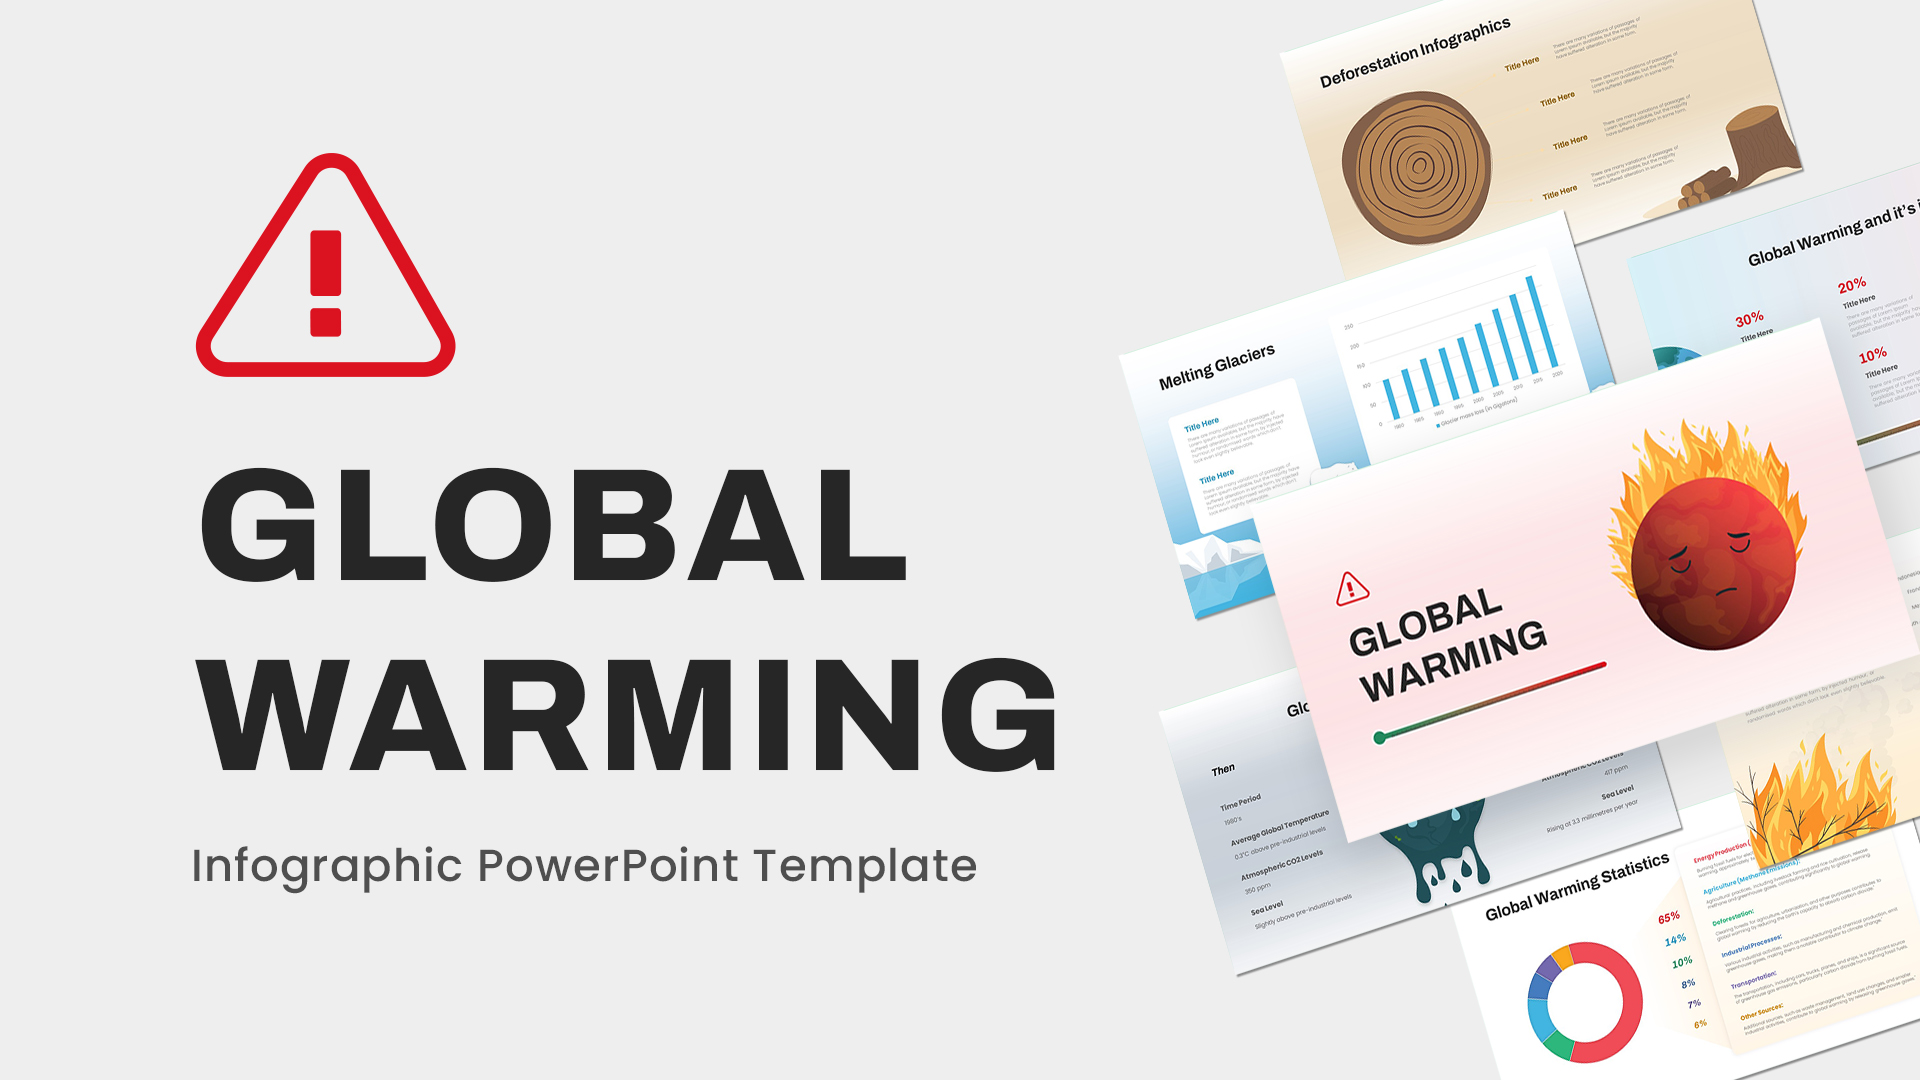
Free Dynamic Global Warming Presentation Template for PowerPoint & Google Slides
Pitch Deck
Free
Global Health Initiatives Presentation Template for PowerPoint & Google Slides
Health
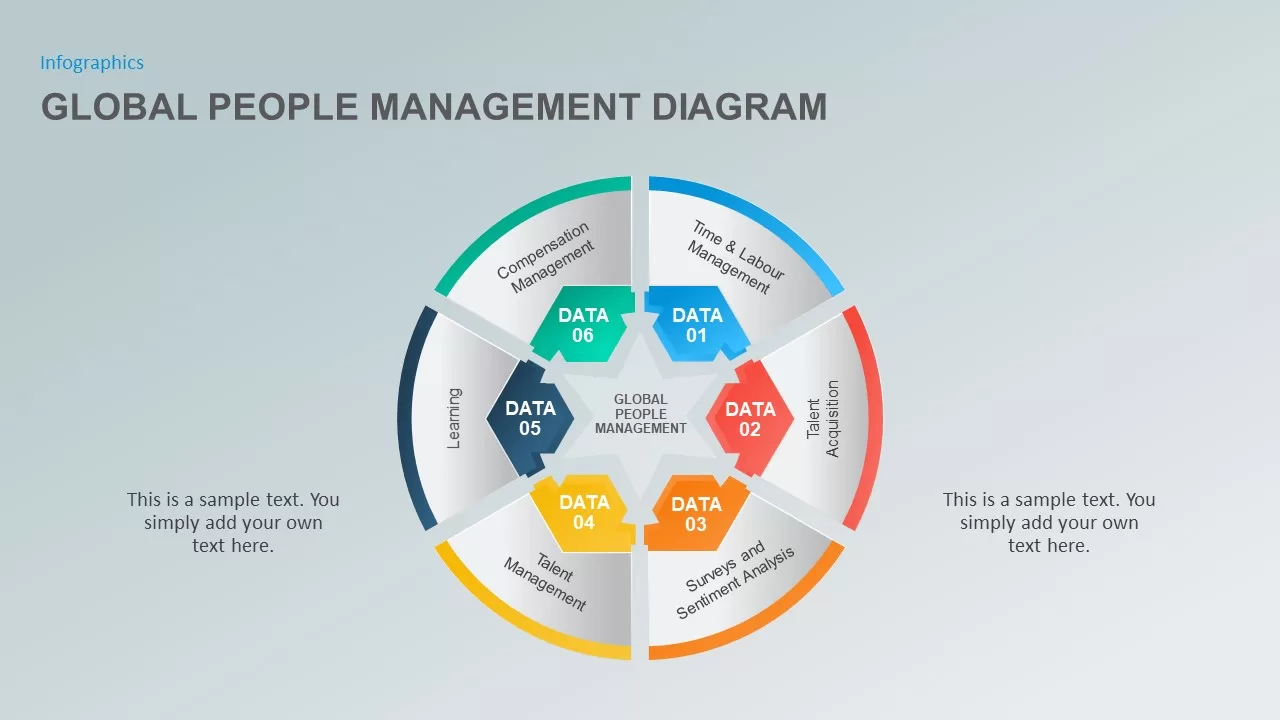
The Global People Management Diagram for PowerPoint & Google Slides
Business Models
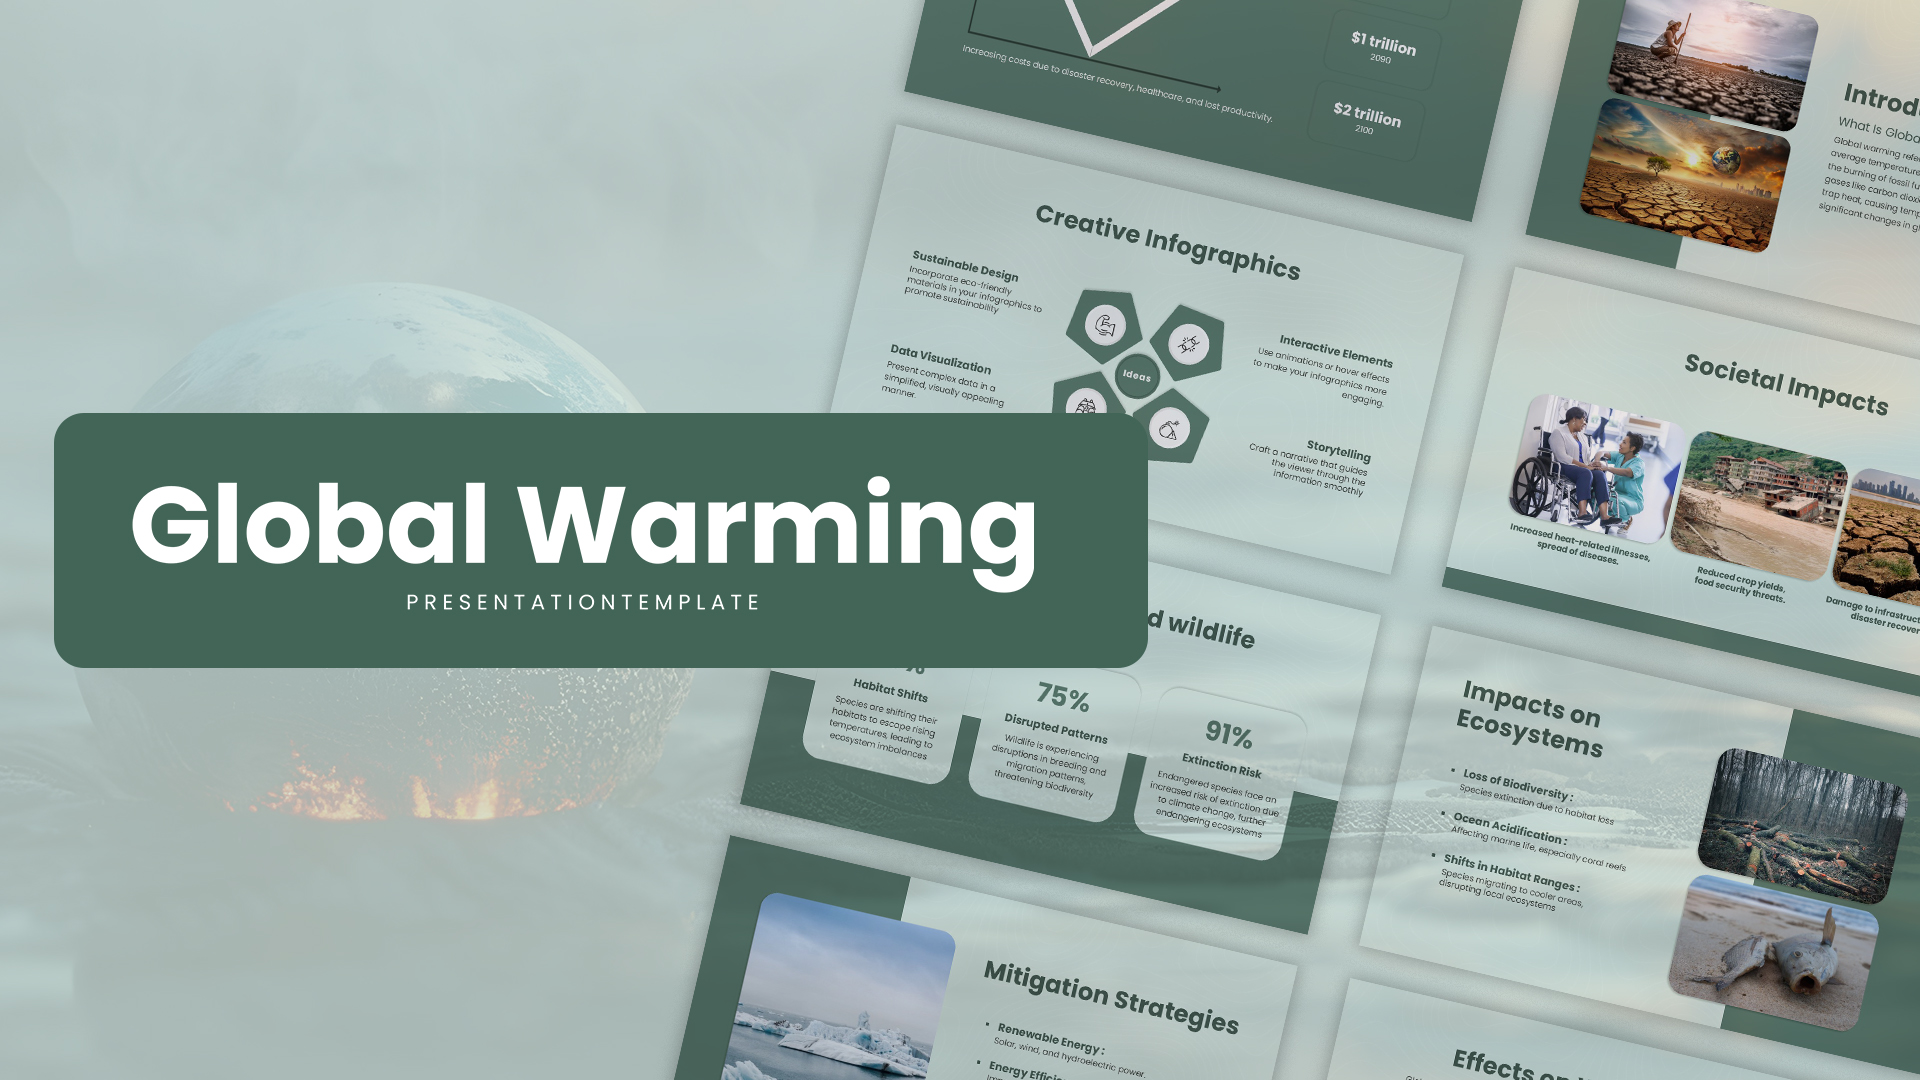
Global Warming Infographic for PowerPoint & Google Slides
Infographics
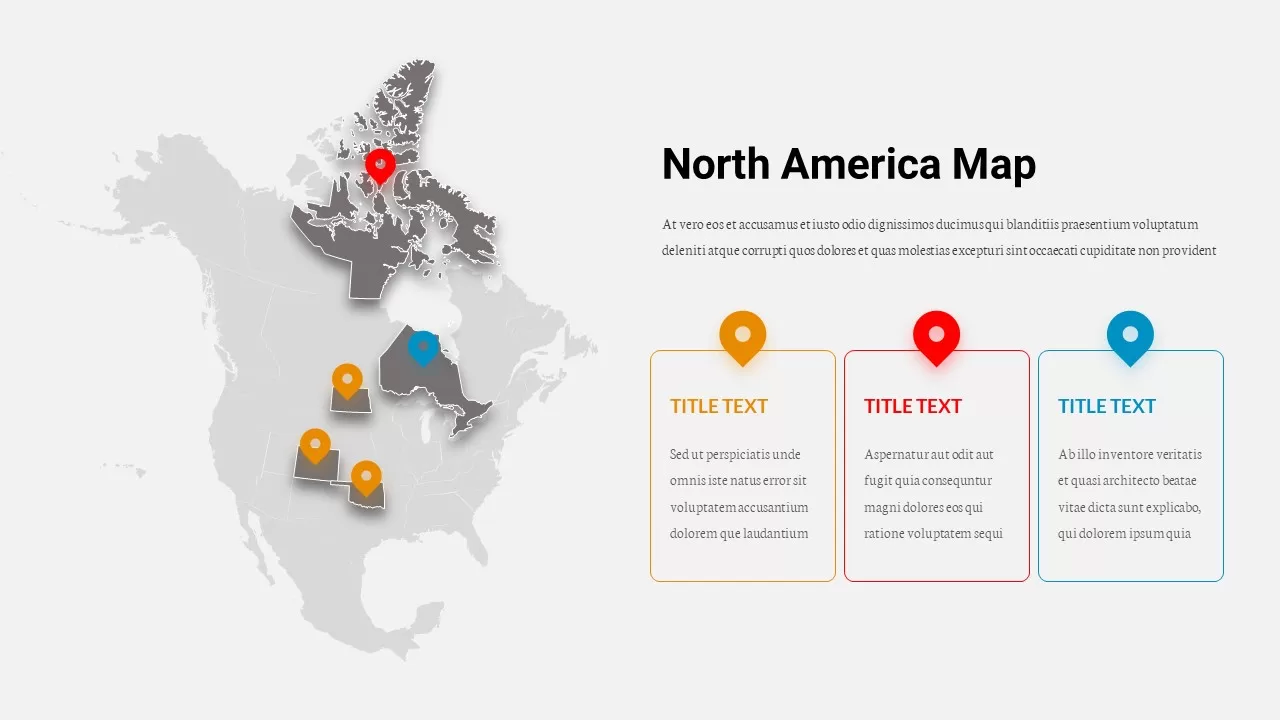
North America Location Pin Map Overview Template for PowerPoint & Google Slides
World Maps
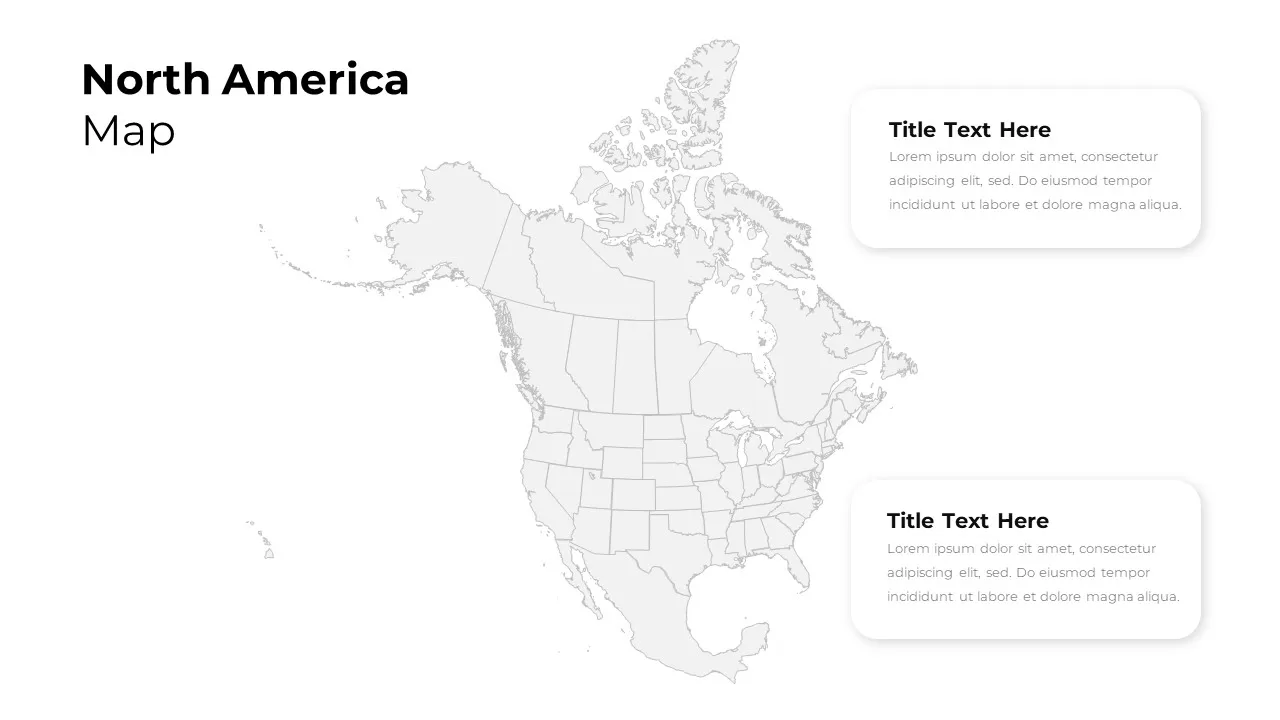
North America Regional Map Overview Template for PowerPoint & Google Slides
World Maps
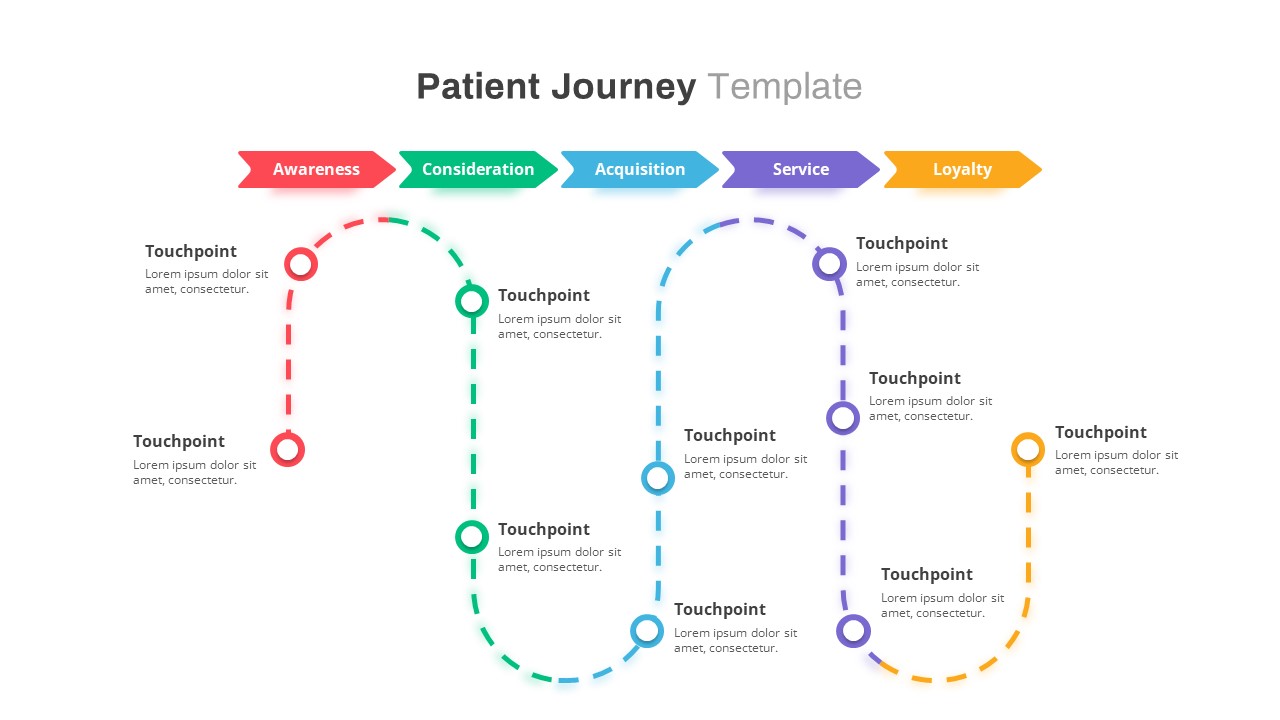
Healthcare Patient Journey Map Overview Template for PowerPoint & Google Slides
Health
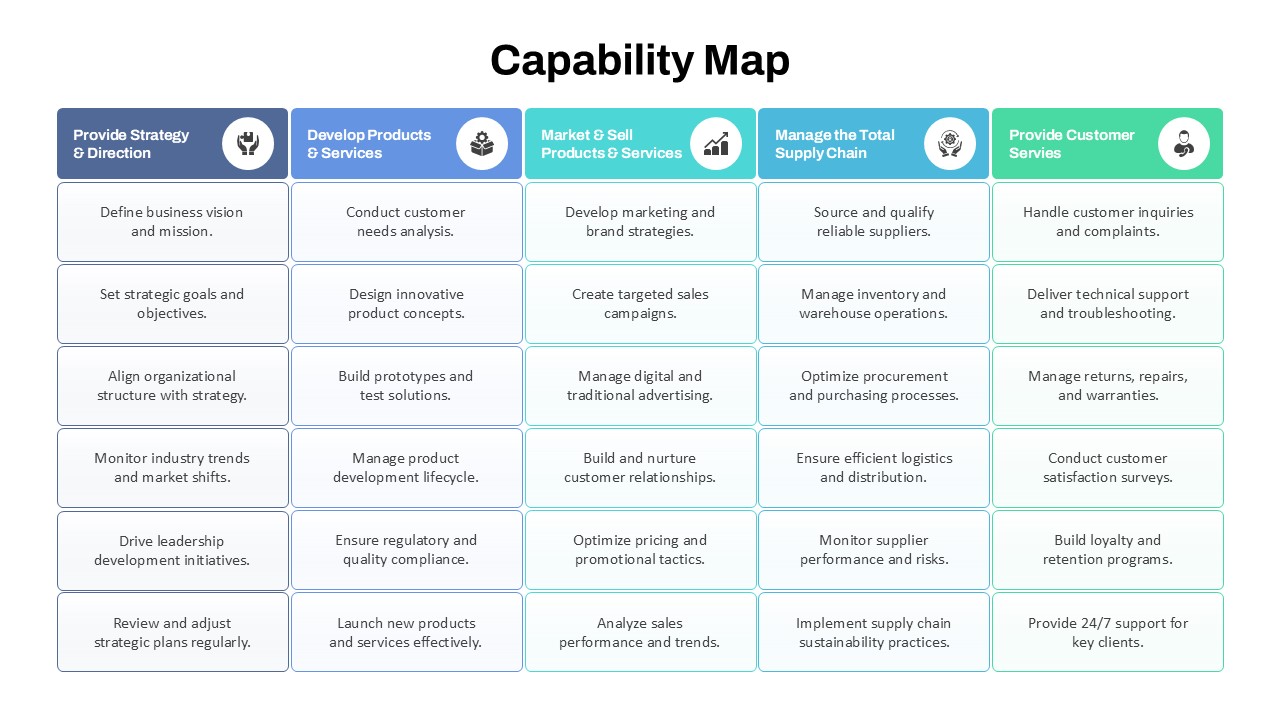
Capability Map Overview Template for PowerPoint & Google Slides
Business Strategy

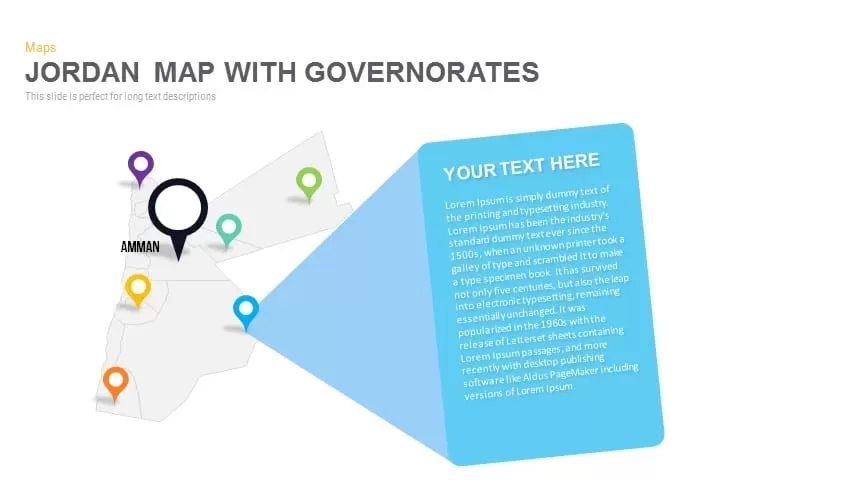
Jordan Map with Governorates Overview for PowerPoint & Google Slides
World Maps
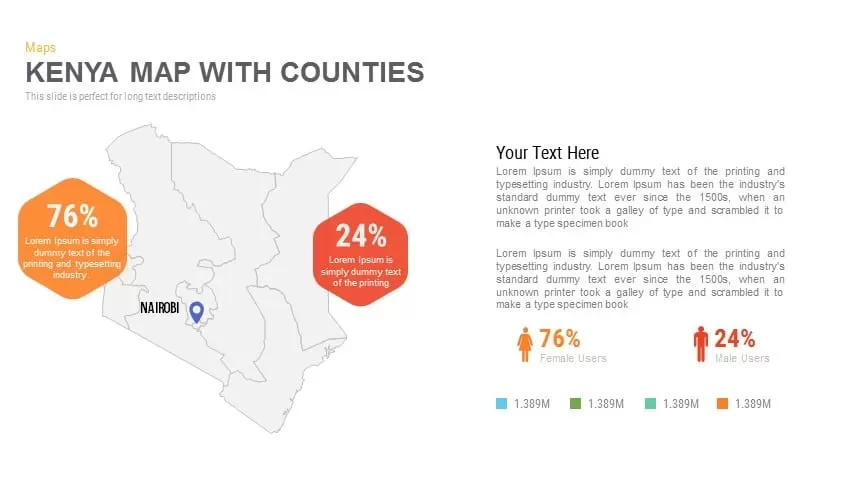
Kenya Map with Counties Overview for PowerPoint & Google Slides
World Maps
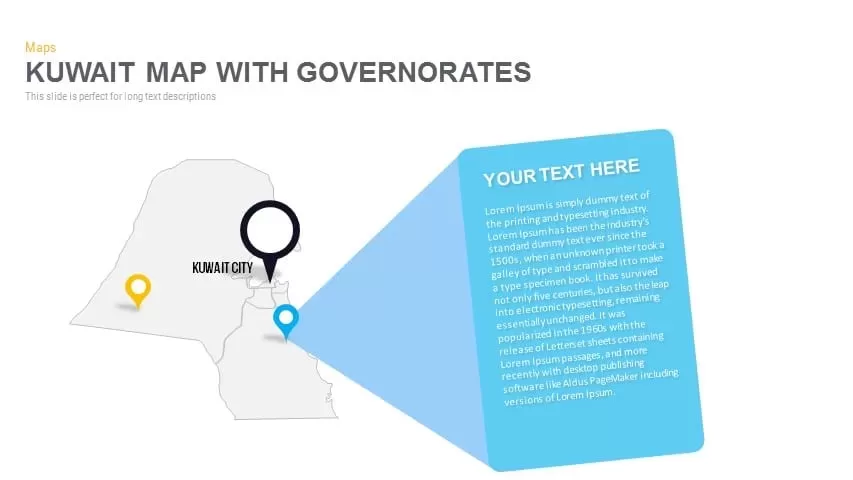
Kuwait Map with Governorates Overview for PowerPoint & Google Slides
World Maps
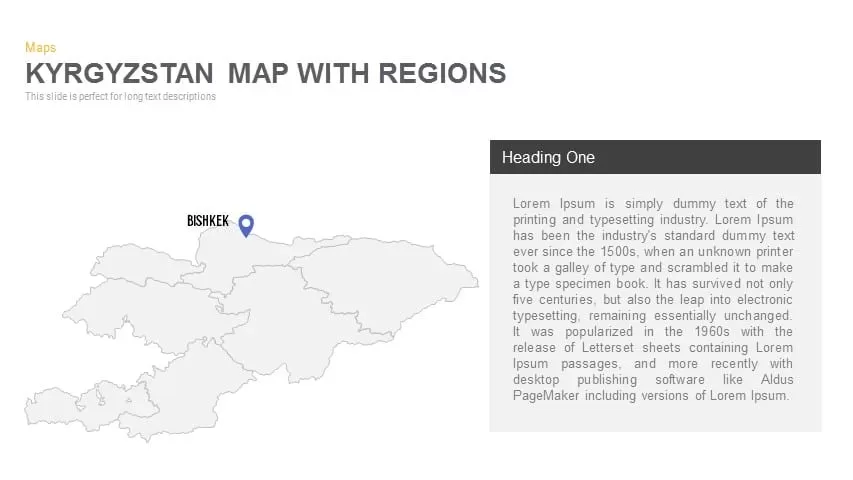
Kyrgyzstan Map with Regions Overview for PowerPoint & Google Slides
World Maps
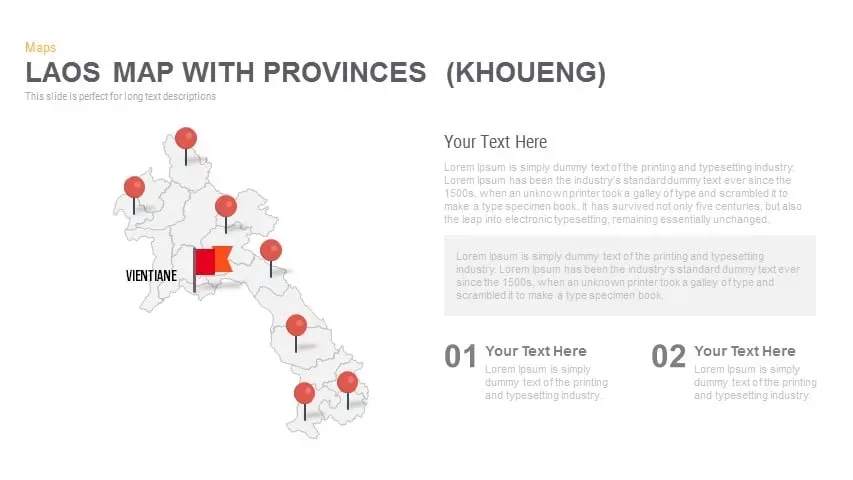
Laos Map with Provinces (Khoueng) Overview for PowerPoint & Google Slides
World Maps
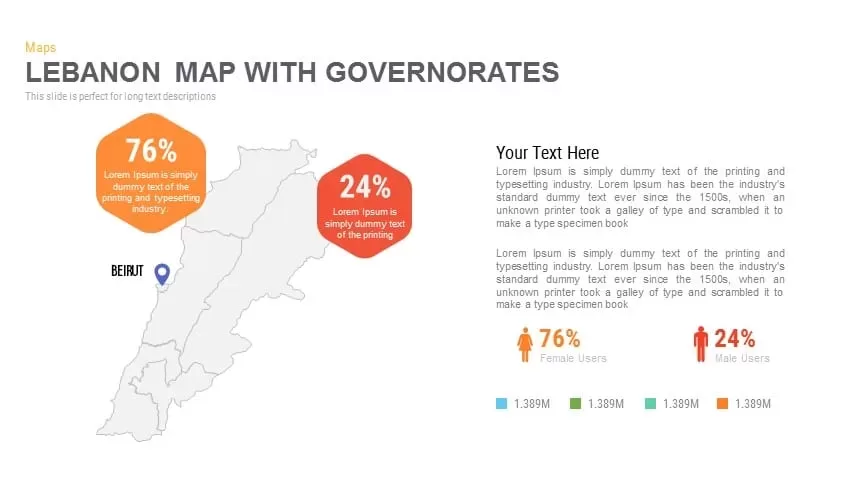
Lebanon Map with Governorates Overview for PowerPoint & Google Slides
World Maps
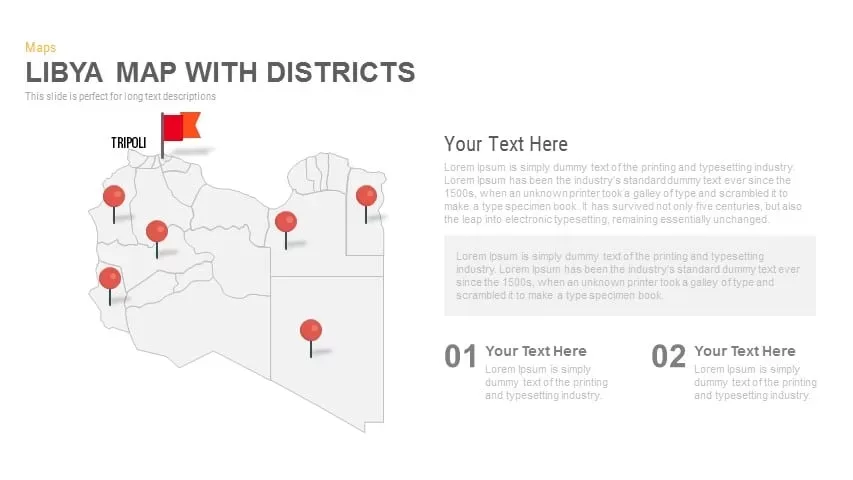
Libya Map with Districts Overview for PowerPoint & Google Slides
World Maps
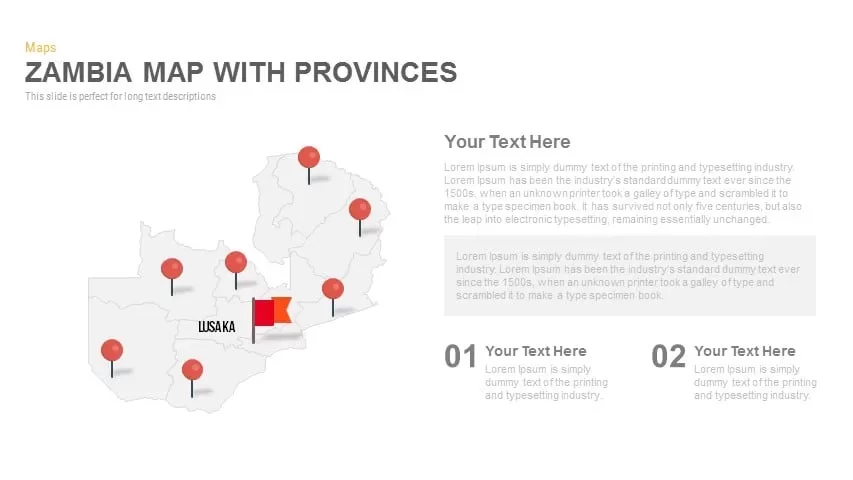
Zambia Map with Provinces Overview for PowerPoint & Google Slides
World Maps
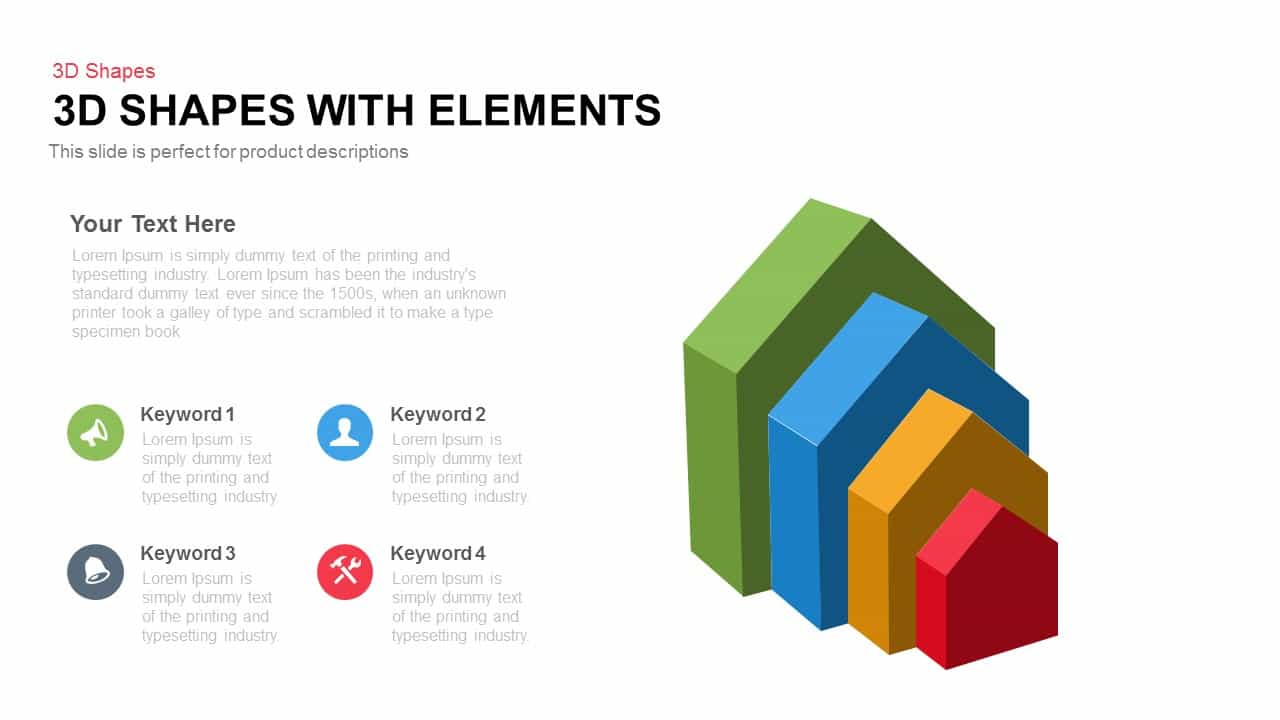
3D Shapes Overview template for PowerPoint & Google Slides
Process
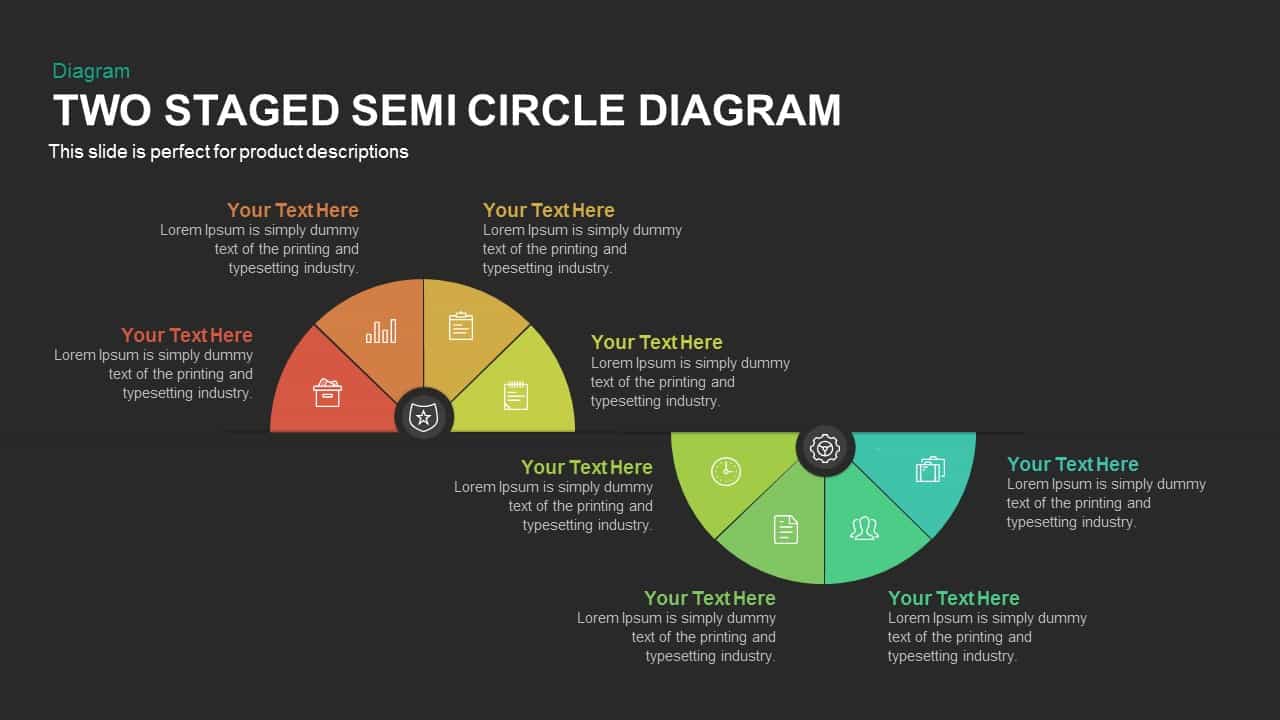
Two-Stage Semi-Circle Diagram Overview Template for PowerPoint & Google Slides
Circular
Business Presentation Overview template for PowerPoint & Google Slides
Company Profile
Free
Comparison Chart Overview template for PowerPoint & Google Slides
Comparison Chart
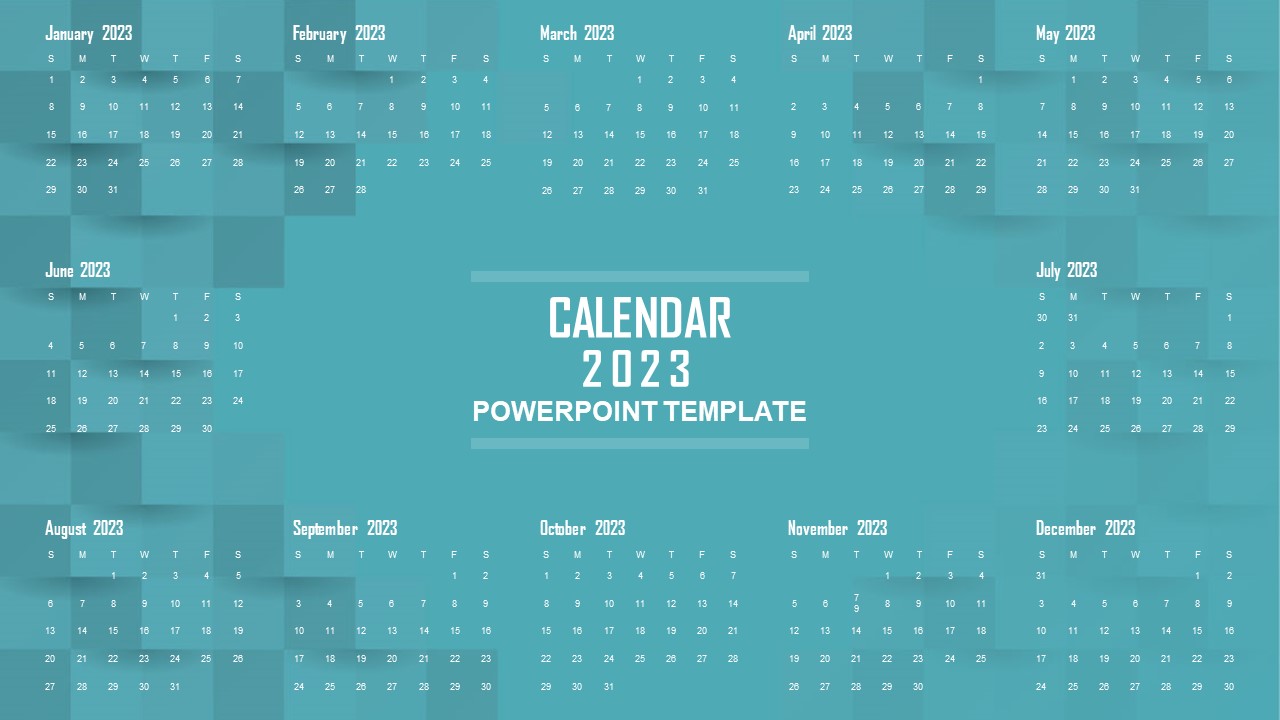
Elegant 2023 Annual Calendar Overview Template for PowerPoint & Google Slides
Timeline
Home School Overview template for PowerPoint & Google Slides
Company Profile
Sales Meeting Overview template for PowerPoint & Google Slides
Pitch Deck
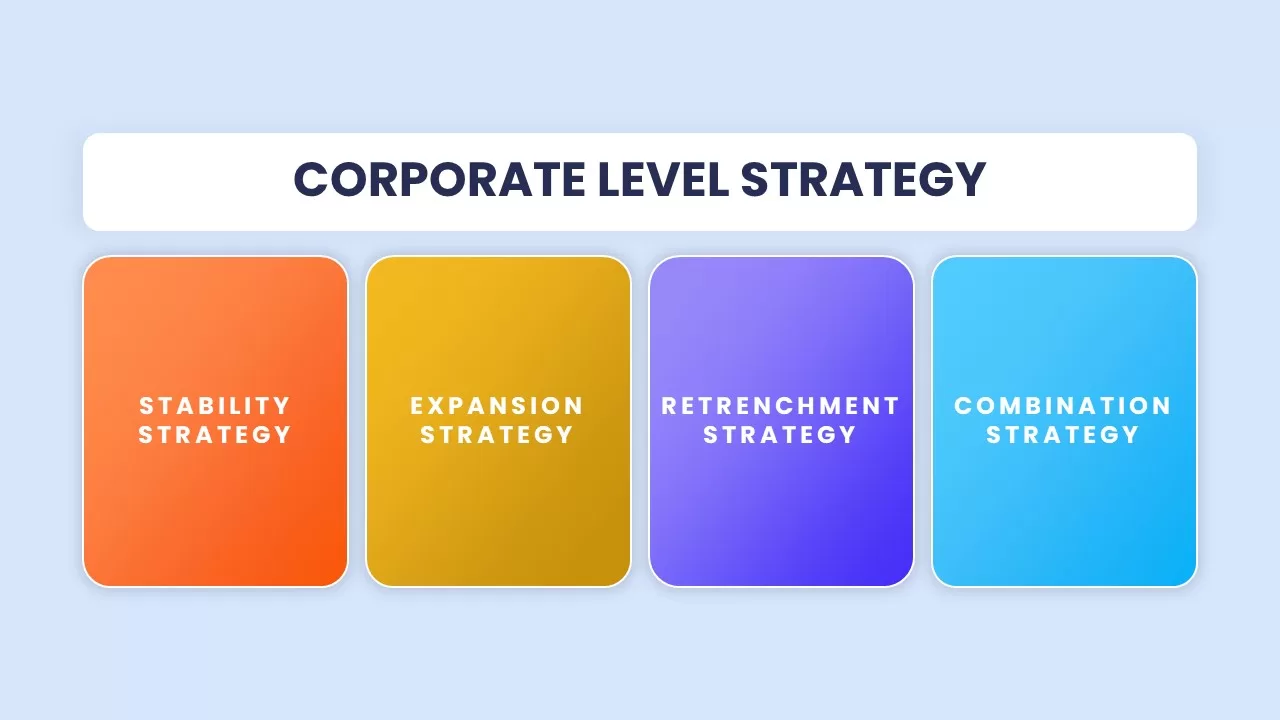
Corporate Level Strategy Overview template for PowerPoint & Google Slides
Business Strategy
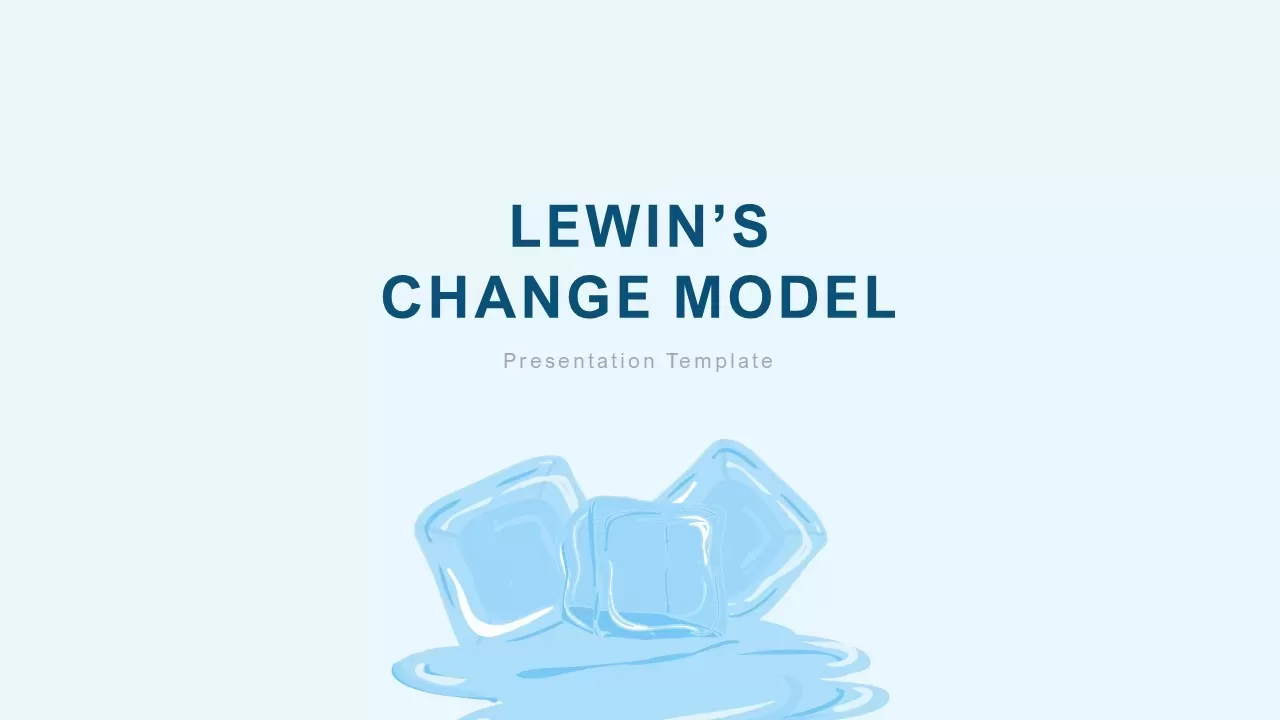
Lewin’s Change Model Overview Template for PowerPoint & Google Slides
Gap
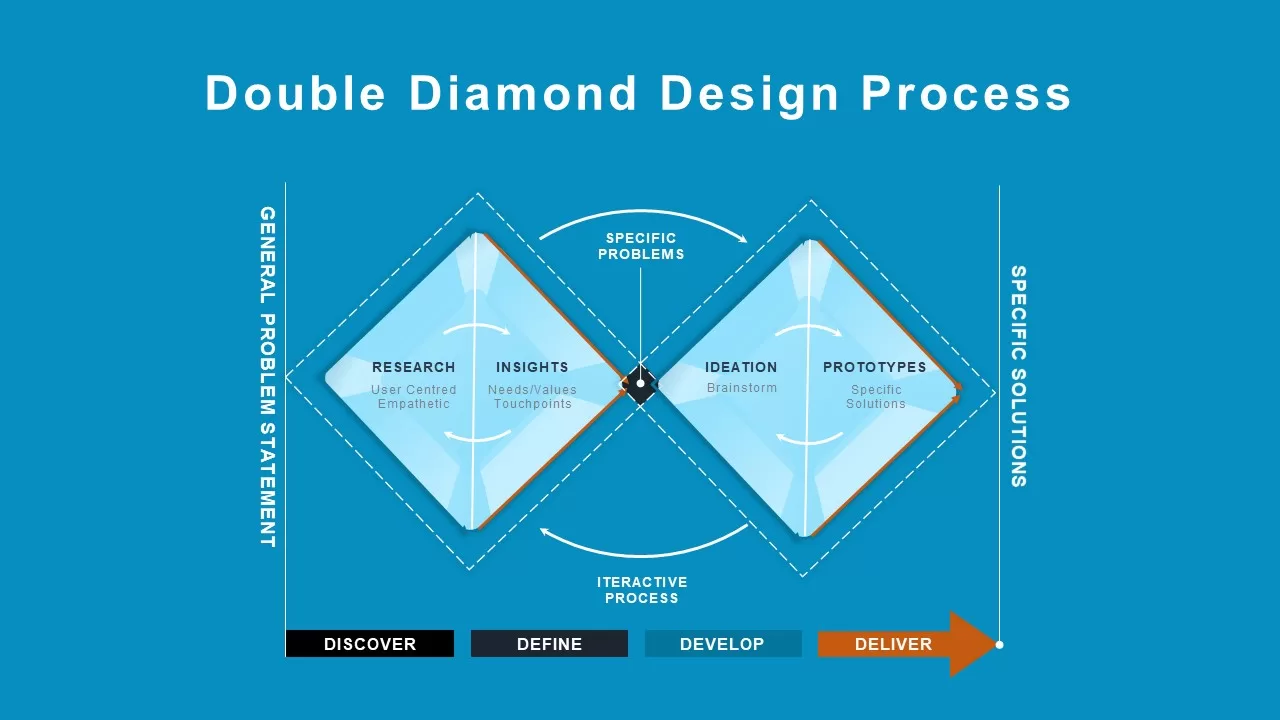
Double Diamond Design Process Overview Template for PowerPoint & Google Slides
Process
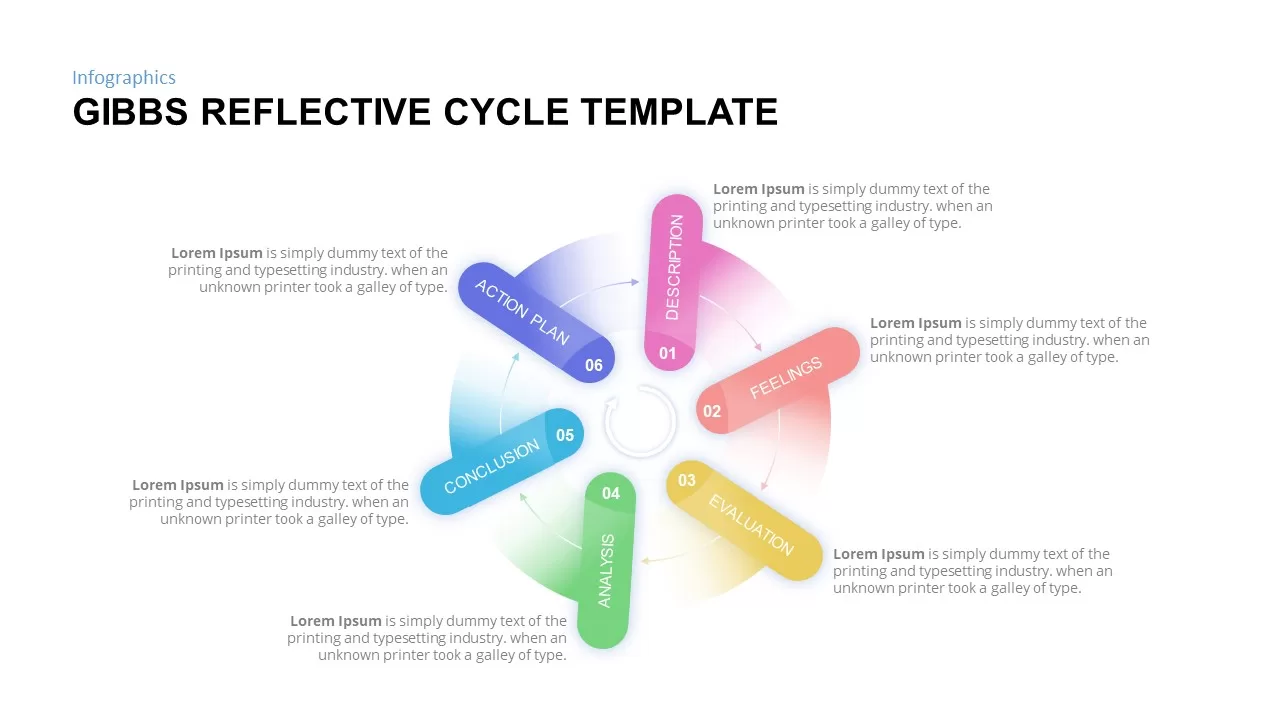
Gibbs Reflective Cycle Overview Template for PowerPoint & Google Slides
Process
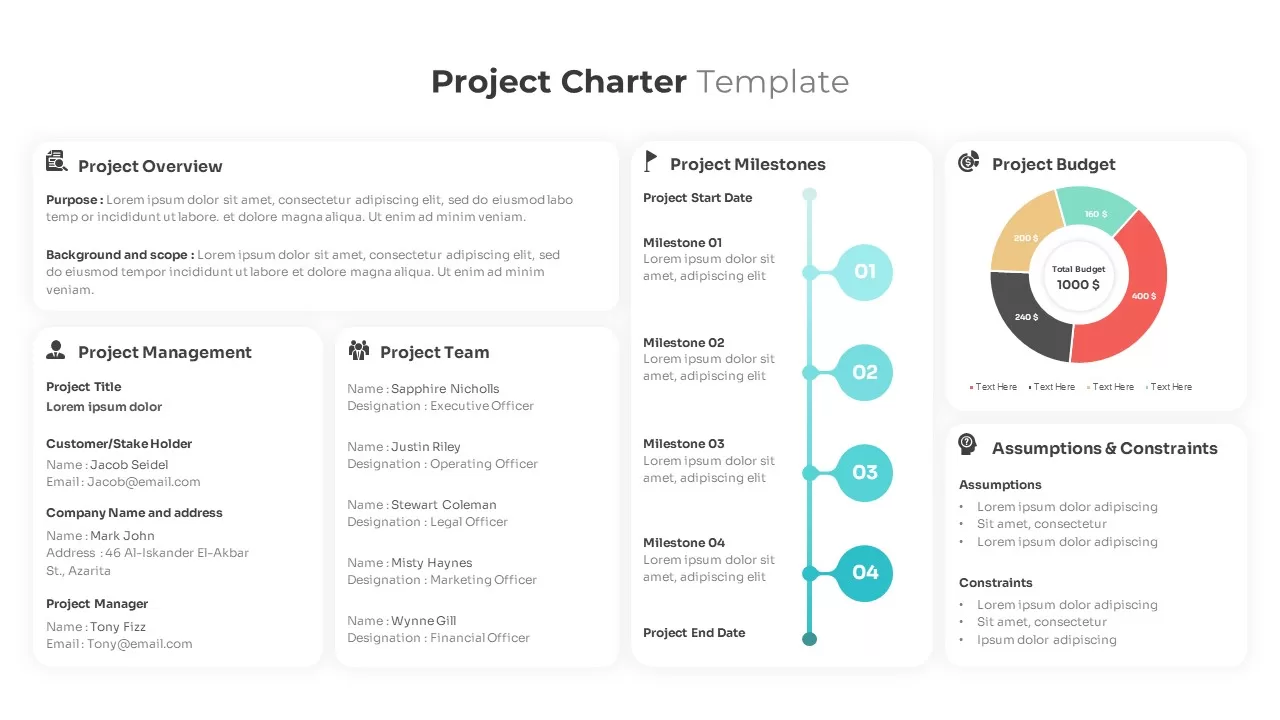
Project Charter Overview template for PowerPoint & Google Slides
Business Plan
Modern Technology Solutions Overview template for PowerPoint & Google Slides
Information Technology
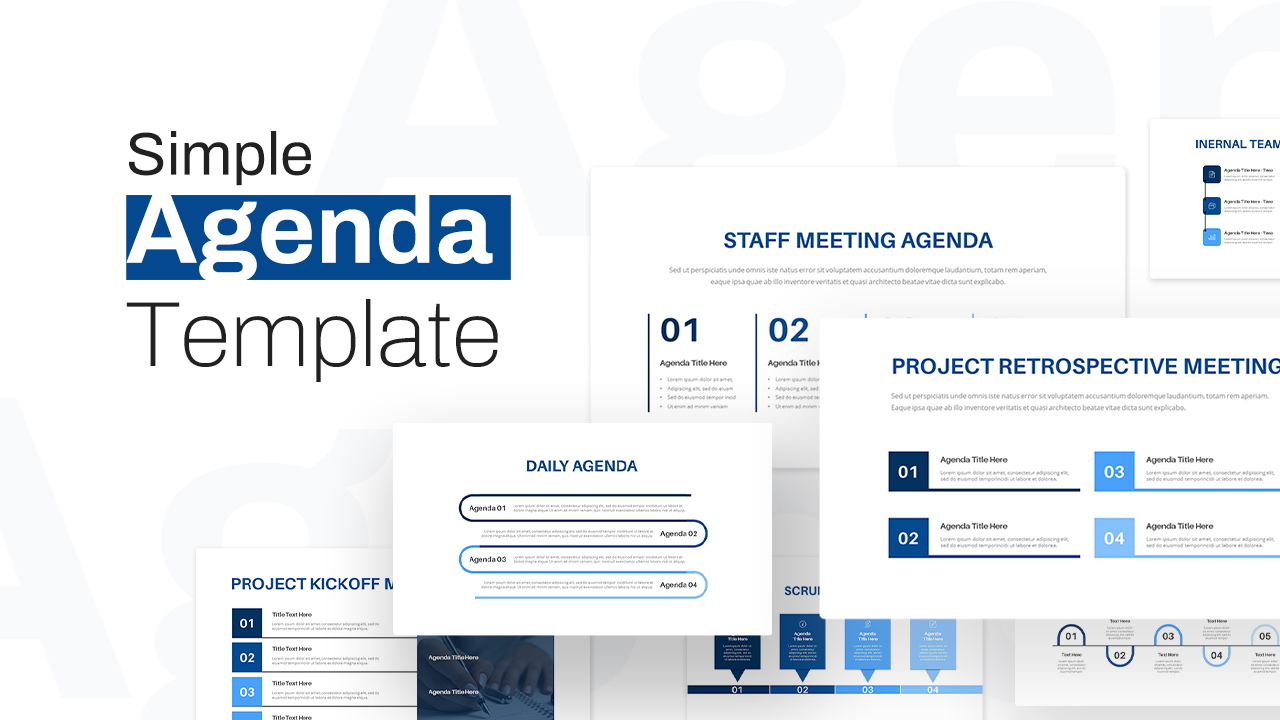
Simple Agenda Slide Deck Overview Template for PowerPoint & Google Slides
Agenda
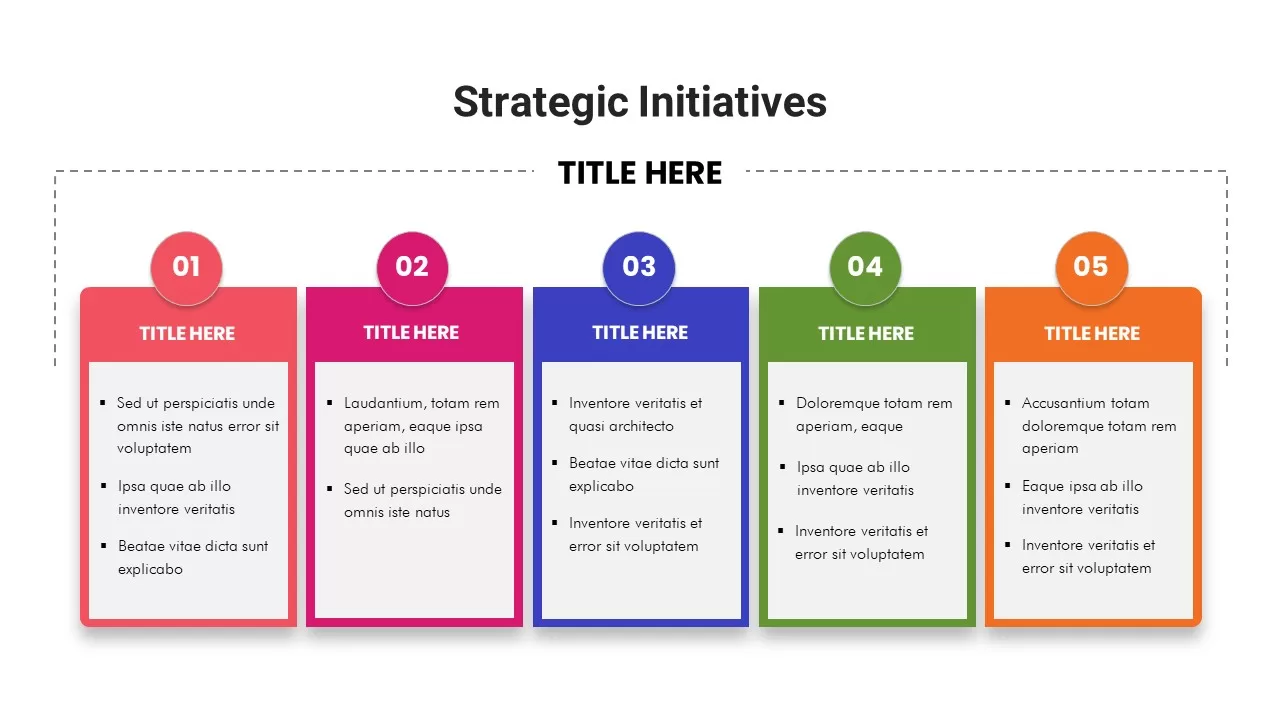
Strategic Initiatives Overview template for PowerPoint & Google Slides
Business Strategy
Aviation Airline Industry Overview template for PowerPoint & Google Slides
Business
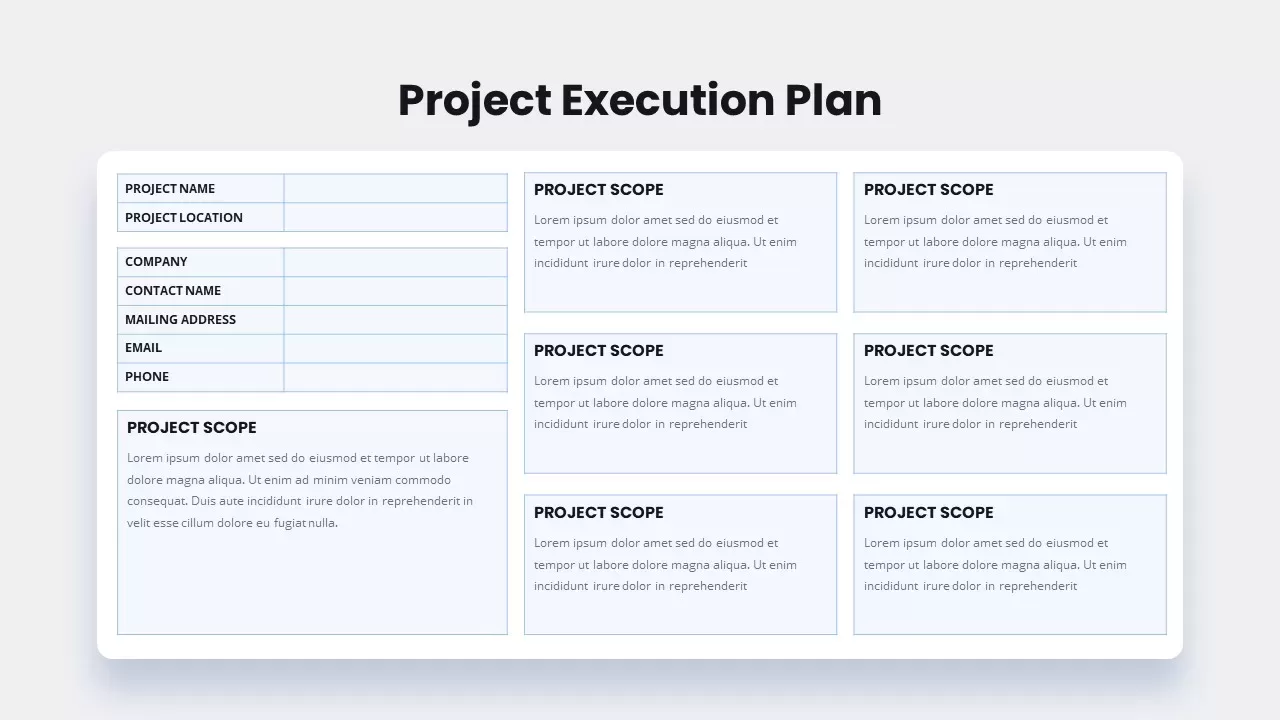
Project Execution Plan Overview Template for PowerPoint & Google Slides
Business Proposal
Social Media Listening Overview Slide Template for PowerPoint & Google Slides
Customer Experience
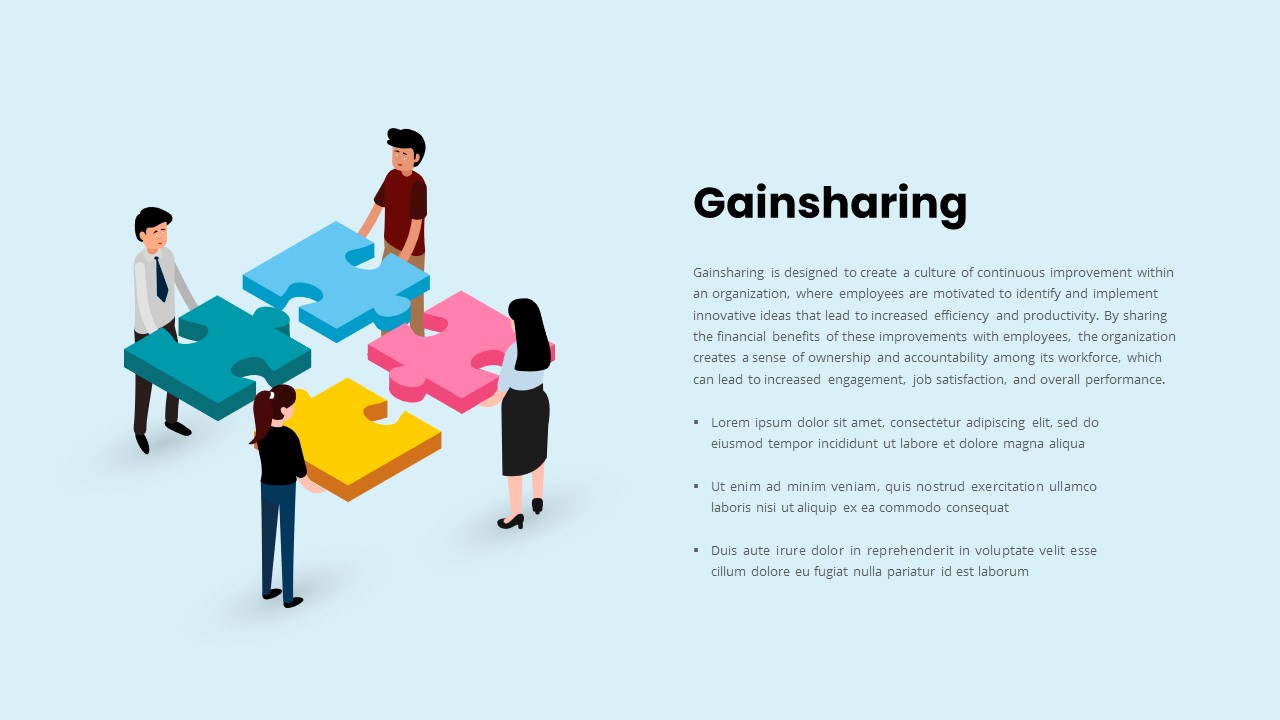
Gainsharing Culture Overview template for PowerPoint & Google Slides
Employee Performance
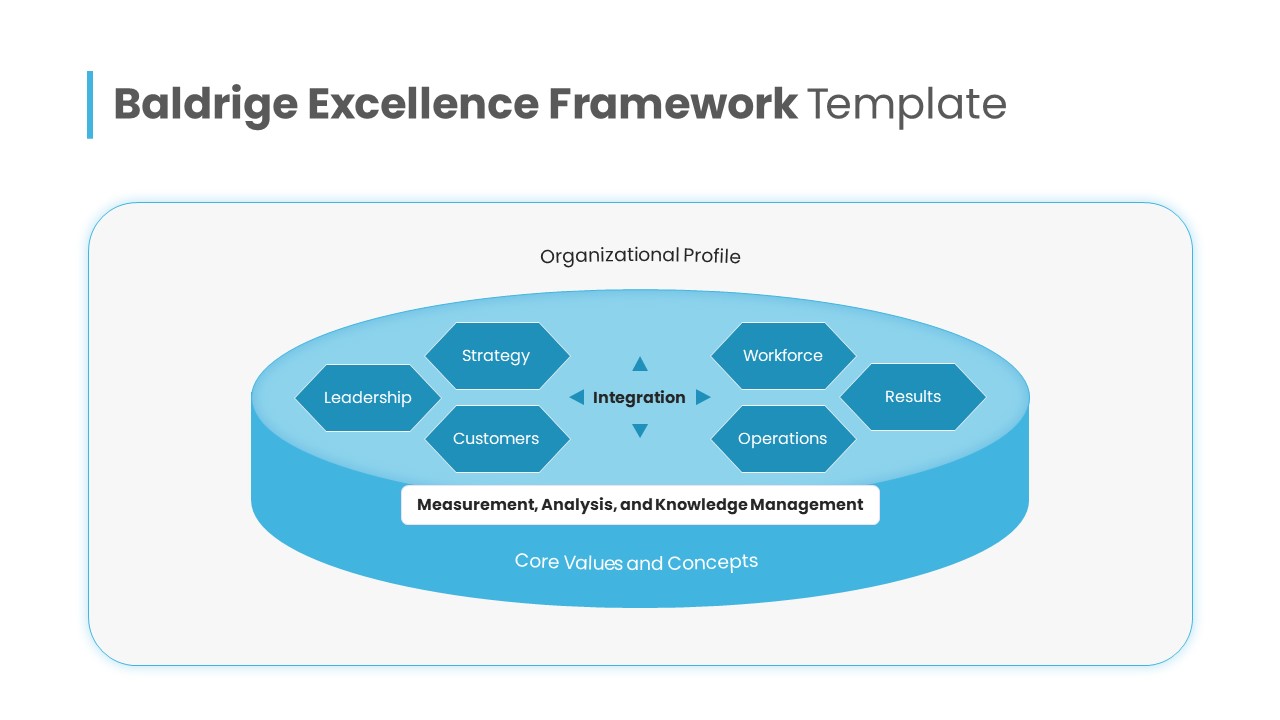
Baldrige Excellence Framework Overview Template for PowerPoint & Google Slides
Leadership

Modern Construction Project Overview Template for PowerPoint & Google Slides
Pitch Deck
Presentation Magazine Company Overview Template for PowerPoint & Google Slides
Company Profile
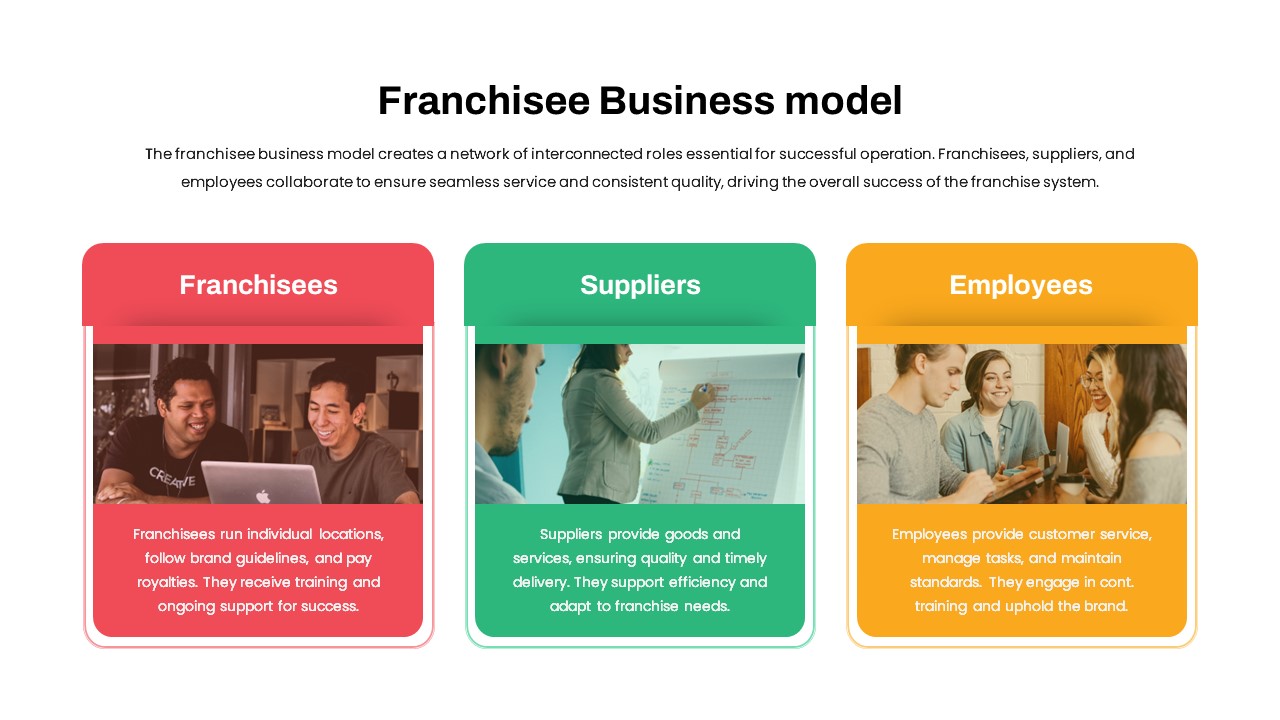
Franchisee Business Model Overview Template for PowerPoint & Google Slides
Business Models
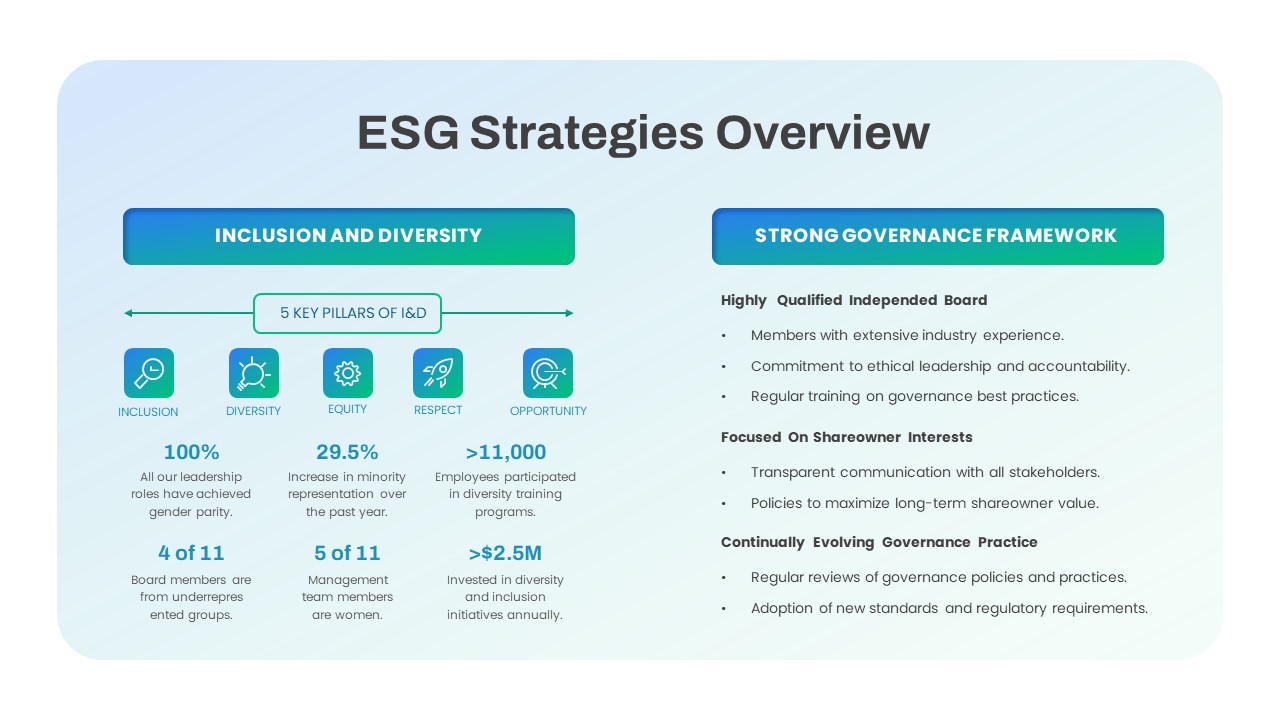
Comprehensive ESG Strategies Overview Template for PowerPoint & Google Slides
Infographics
Market Validation Metrics Overview Template for PowerPoint & Google Slides
Business
Marketing Advertising Types Overview Template for PowerPoint & Google Slides
Advertising
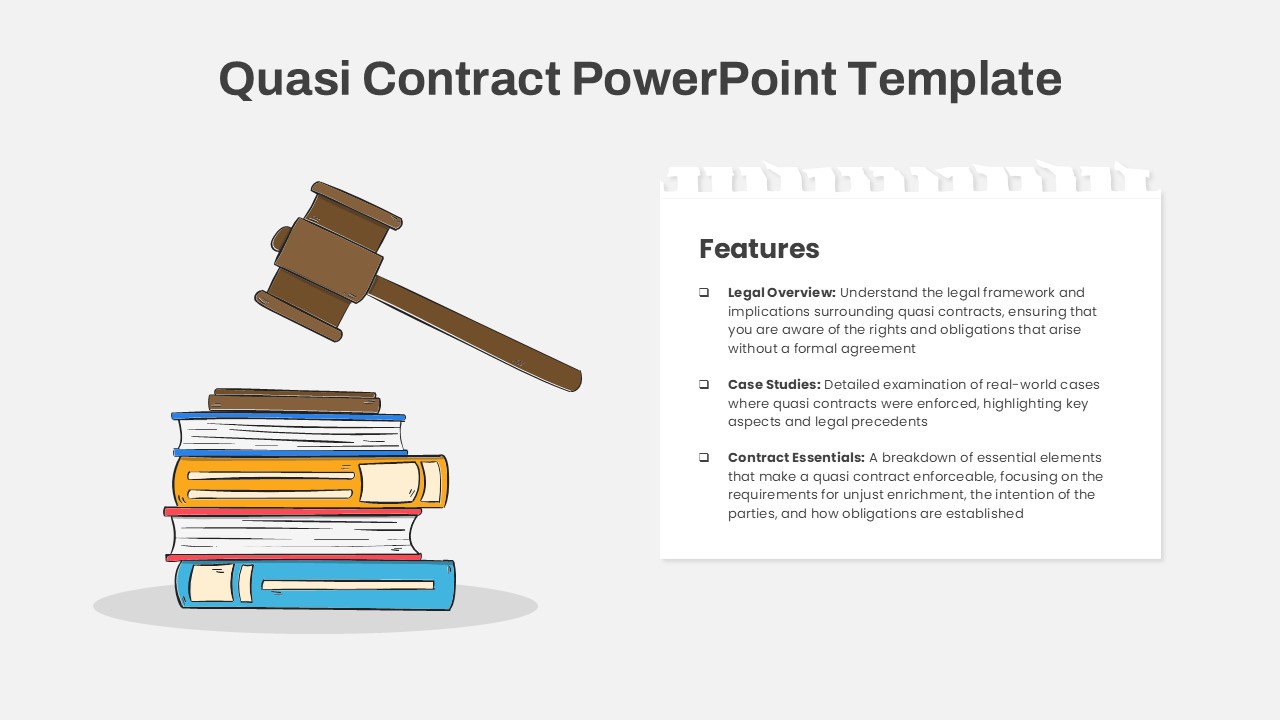
Quasi Contract Gavel & Books Overview Template for PowerPoint & Google Slides
Business Requirements
Drone Delivery Systems Overview Slide Template for PowerPoint & Google Slides
Business Models
K-Nearest Neighbors Classification Overview template for PowerPoint & Google Slides
Technology
Technical Skills Donut Chart Overview Template for PowerPoint & Google Slides
HR
Customer Profile Overview Template for PowerPoint & Google Slides
Customer Journey
Confusion Matrix Diagram Overview Template for PowerPoint & Google Slides
Comparison
Video Marketing Overview template for PowerPoint & Google Slides
Digital Marketing
Team Gantt Chart Overview template for PowerPoint & Google Slides
Project Status
Transactional Leadership Overview template for PowerPoint & Google Slides
Process
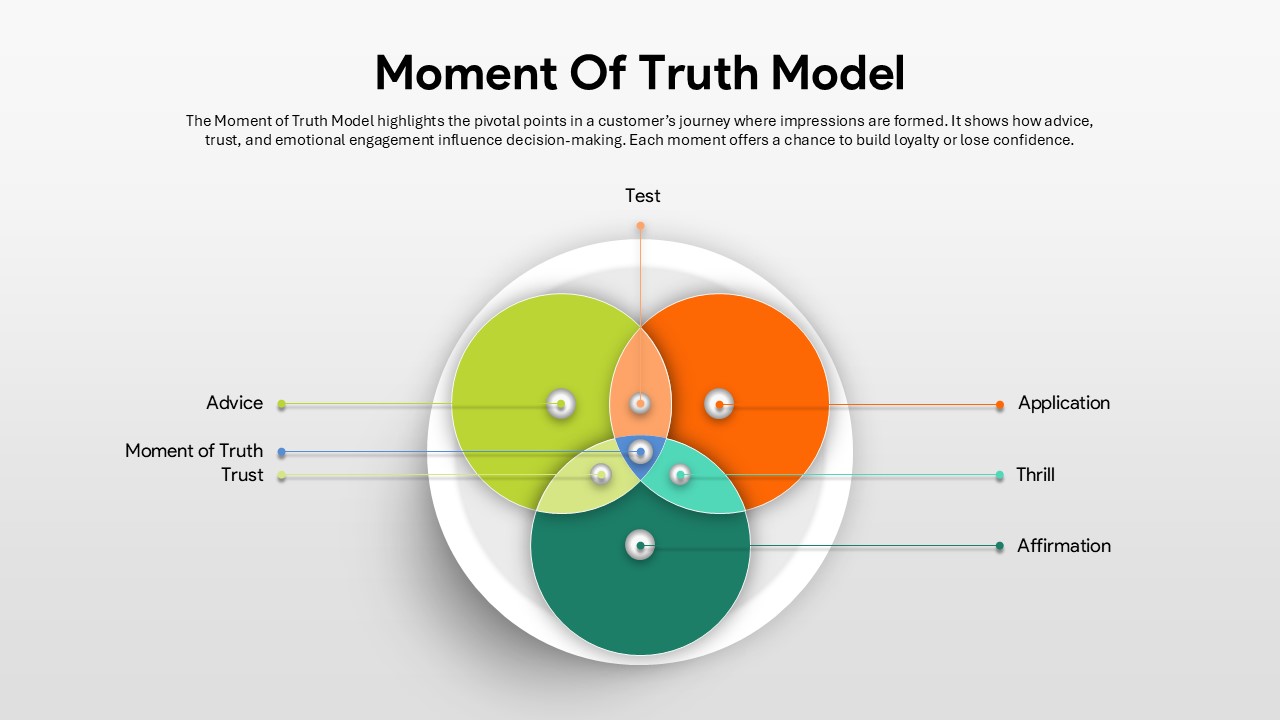
Moment of Truth Model Overview template for PowerPoint & Google Slides
Process
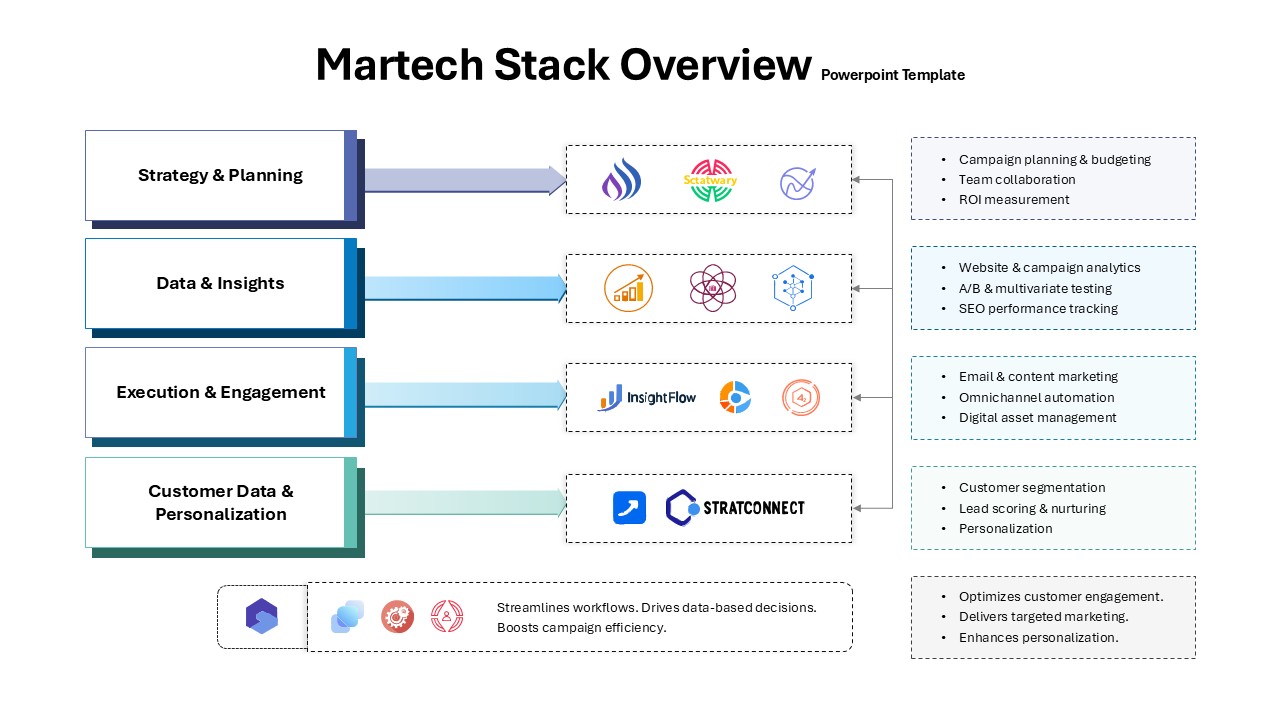
Martech Stack Overview Template for PowerPoint & Google Slides
Information Technology
Artificial General Intelligence Overview Template for PowerPoint & Google Slides
AI
Social Media Marketing Overview Template for PowerPoint & Google Slides
Advertising
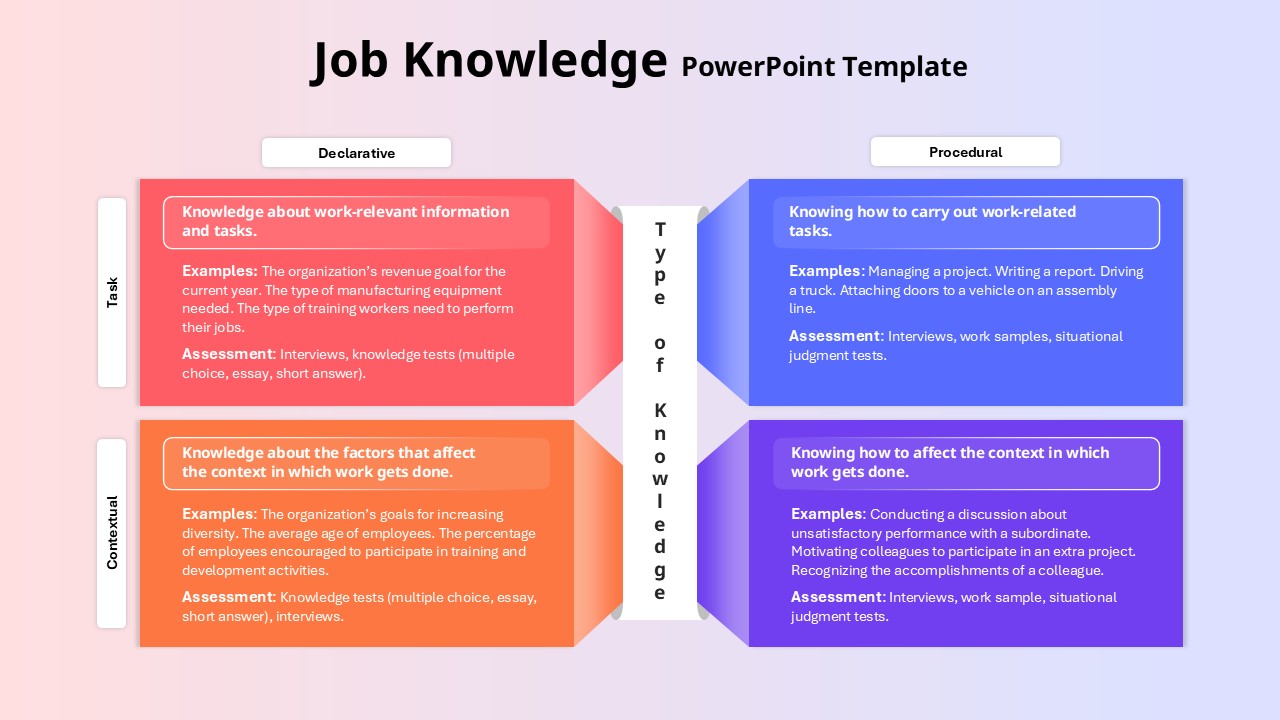
Job Knowledge Overview template for PowerPoint & Google Slides
Business
Networking Security overview template for PowerPoint & Google Slides
Technology
Candidate Nurturing Strategy Overview template for PowerPoint & Google Slides
Recruitment
Pediatric Health Services Overview Template for PowerPoint & Google Slides
Health
Static Gantt Chart Overview template for PowerPoint & Google Slides
Project Status
Fall Theme Business Overview template for PowerPoint & Google Slides
Decks
Machine Learning Overview Slide Template for PowerPoint & Google Slides
Machine Learning
Machine Learning Pipeline Overview Template for PowerPoint & Google Slides
Machine Learning
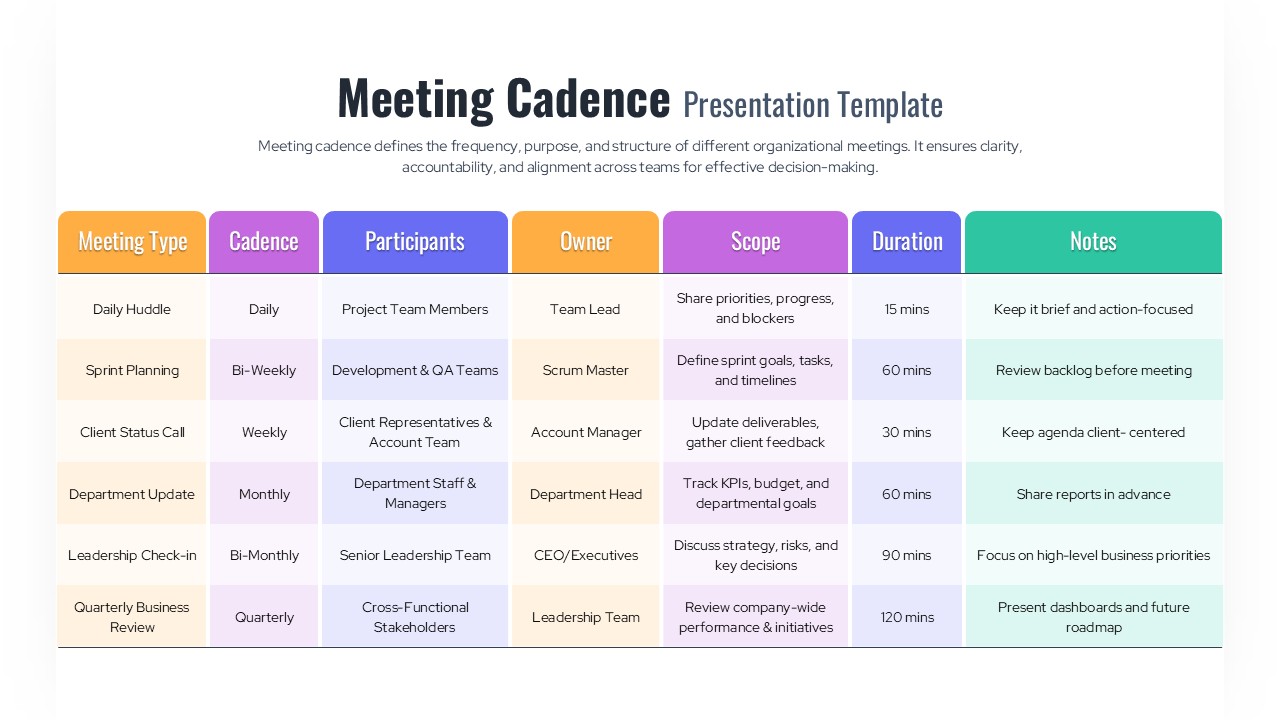
Meeting Cadence Schedule Overview Template for PowerPoint & Google Slides
Leadership