Geotargeting Diagram Template for PowerPoint & Google Slides

Description
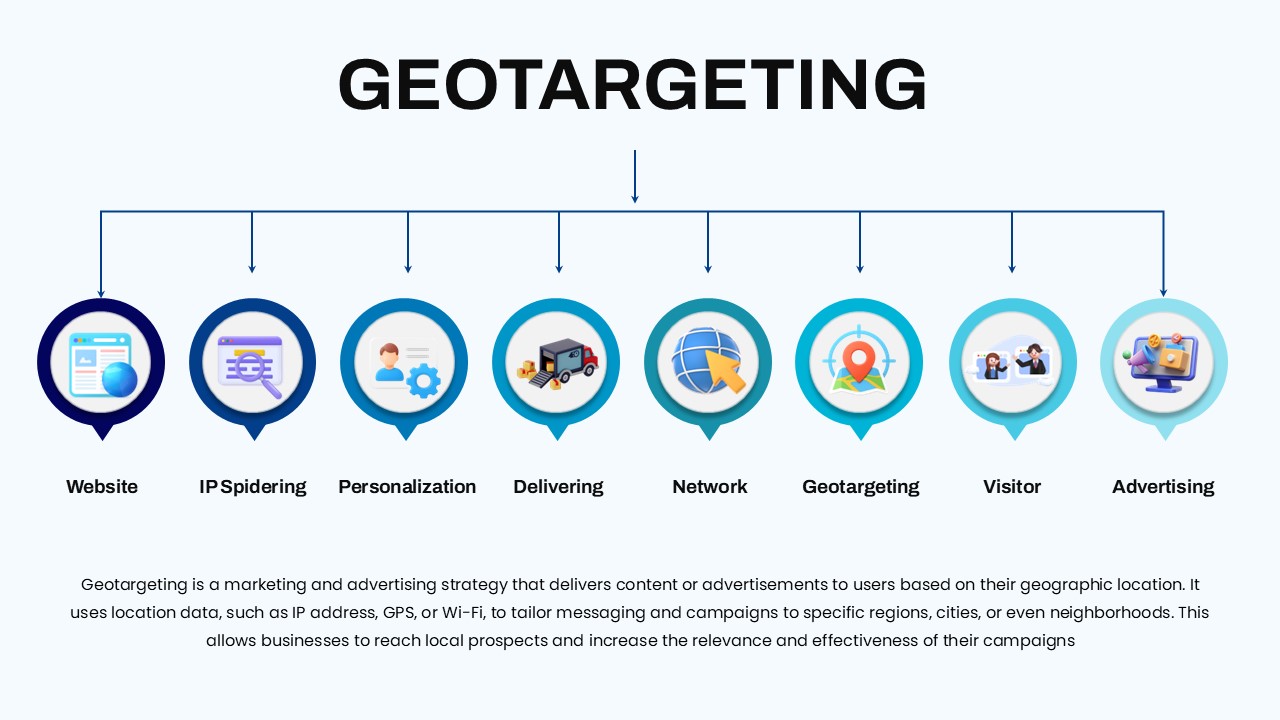
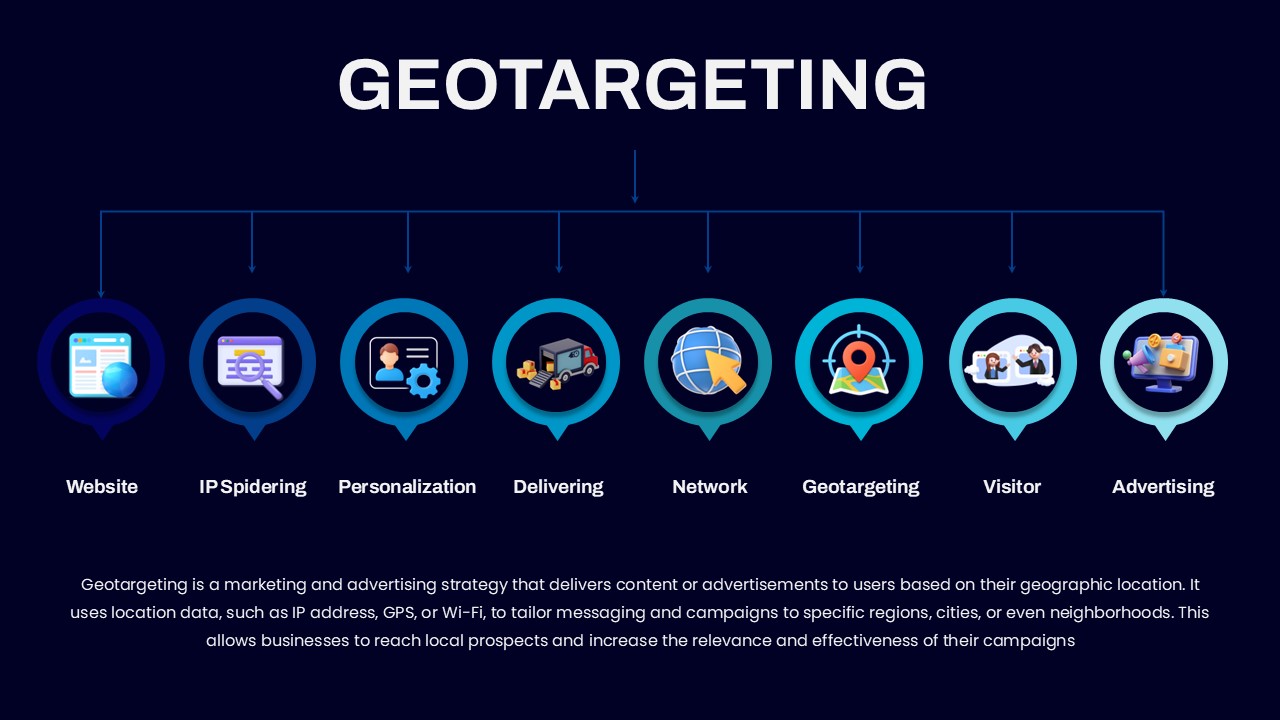
Leverage this geotargeting hub and spoke diagram slide to illustrate location-based marketing strategies with clarity and impact. The slide features a bold “Geotargeting” title connected via a central stem to a horizontal line that branches into eight circular icon placeholders, each representing steps such as website, IP spidering, personalization, delivery, network reach, core geotargeting, visitor insights, and advertising modules. The minimalist design employs vibrant gradient rings and clean vector icons against ample white space, ensuring your content stands out and resonates with audiences.
Customize each icon and label to reflect your unique campaign process—swap placeholder graphics for custom artwork, edit text captions, or adjust ring colors within the editable theme to match corporate branding guidelines. The modular layout and master slide support allow you to easily reposition elements, add new nodes, or streamline the visual flow without compromising slide consistency. Use the provided arrows and connectors to maintain a logical narrative as you guide stakeholders through your geotargeting workflow.
Ideal for marketing presentations, sales pitches, and executive reviews, this slide empowers teams to showcase the mechanics of geotargeting, from initial data collection to targeted ad delivery. Whether you’re outlining key performance indicators, demonstrating technical setup, or mapping customer journey segments by region, the adaptable structure accommodates a wide range of content needs. Fully optimized for PowerPoint and Google Slides, the design preserves high-resolution clarity and supports collaborative editing, eliminating formatting headaches and version control issues. Incorporate this diagram into your next deck to drive strategic discussions, align cross-functional teams, and convey complex geotargeting concepts with minimal effort.
Who is it for
Marketing teams, digital strategists, and advertising agencies can use this slide to plan and present location-based campaigns with precision. Product managers, business analysts, and sales leaders will benefit from its clear visualization of geotargeting workflows and customer segmentation by region.
Other Uses
Apart from geotargeting, adapt this hub & spoke layout to visualize website architecture, network topologies, or personalization feature maps. Use the circular icons to depict service delivery stages, customer journey touchpoints, or cross-functional team structures.
Login to download this file

Item ID
SB05316
Related Templates

Snake Diagram Pack of 8 Slides template for PowerPoint & Google Slides
Process
Gear Process Diagram PowerPoint Template for PowerPoint & Google Slides
Process
Sales Process Workflow Funnel Diagram PowerPoint Template for PowerPoint & Google Slides
Funnel
Puzzle Diagram PowerPoint Template for PowerPoint & Google Slides
Process
Transportation Logistics PowerPoint Diagram template for PowerPoint & Google Slides
Process
Emoji Scale PowerPoint Diagram for PowerPoint & Google Slides
Infographics
4 Step Problem Solving PowerPoint Diagram for PowerPoint & Google Slides
Process
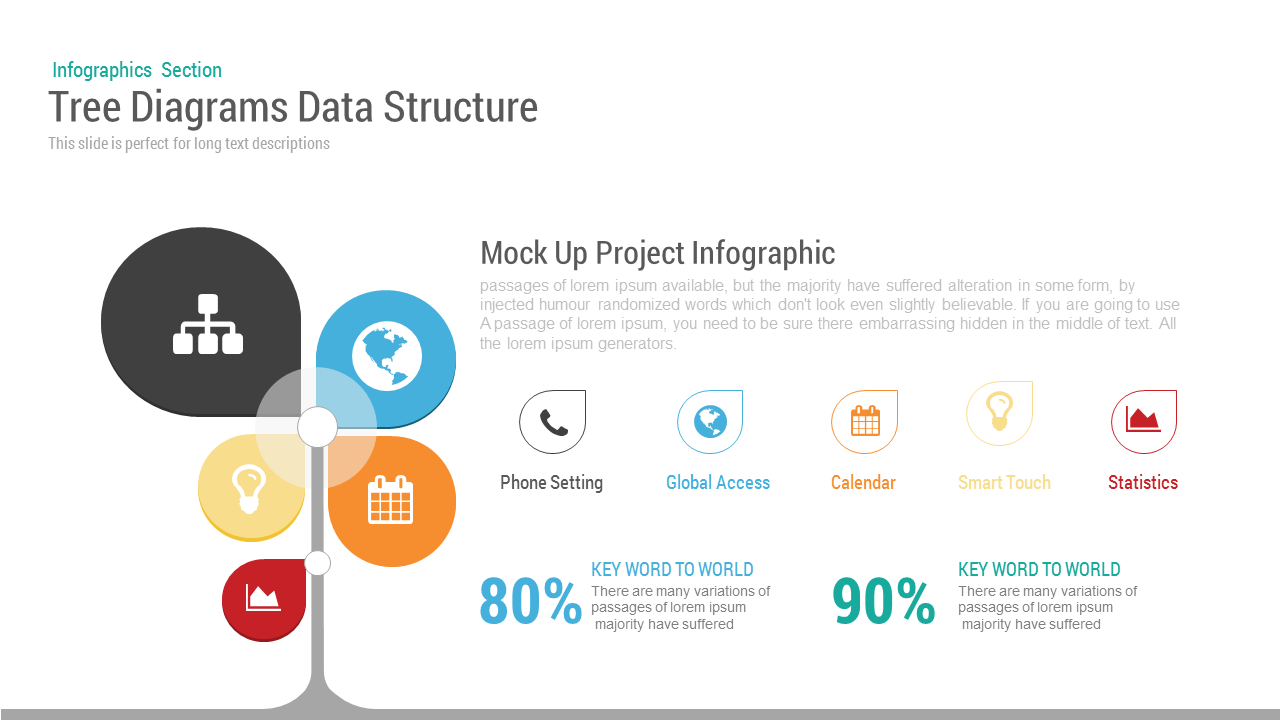
Tree Diagram template for PowerPoint & Google Slides
Decision Tree
Modern Circle SWOT Analysis Diagram Template for PowerPoint & Google Slides
SWOT
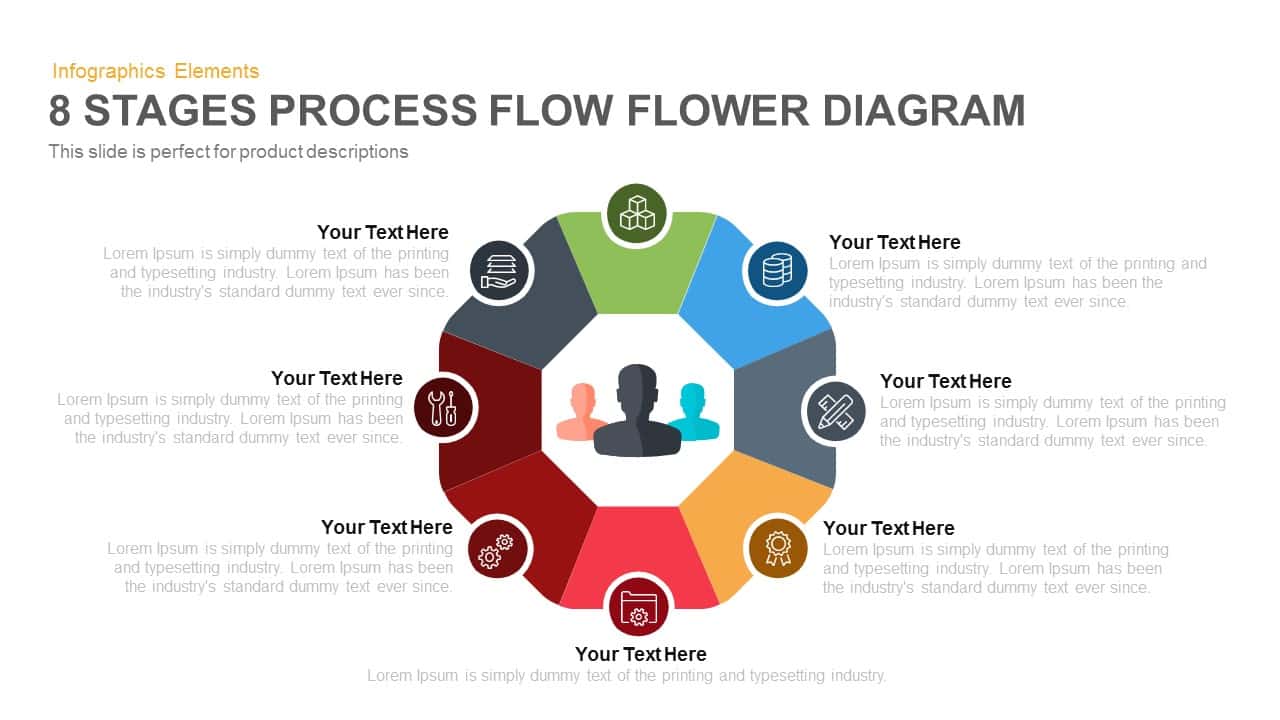
8-Stage Process Flow Flower Diagram Template for PowerPoint & Google Slides
Infographics
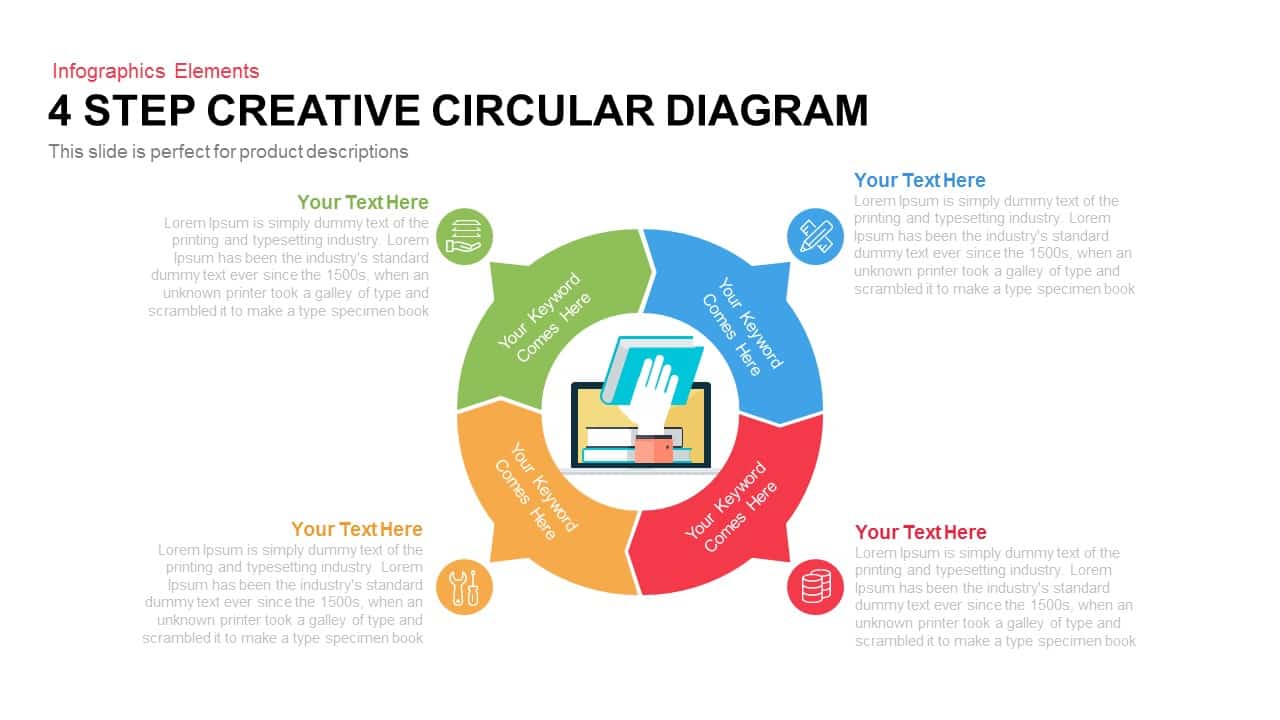
4 Step Creative Circular Diagram Template for PowerPoint & Google Slides
Infographics
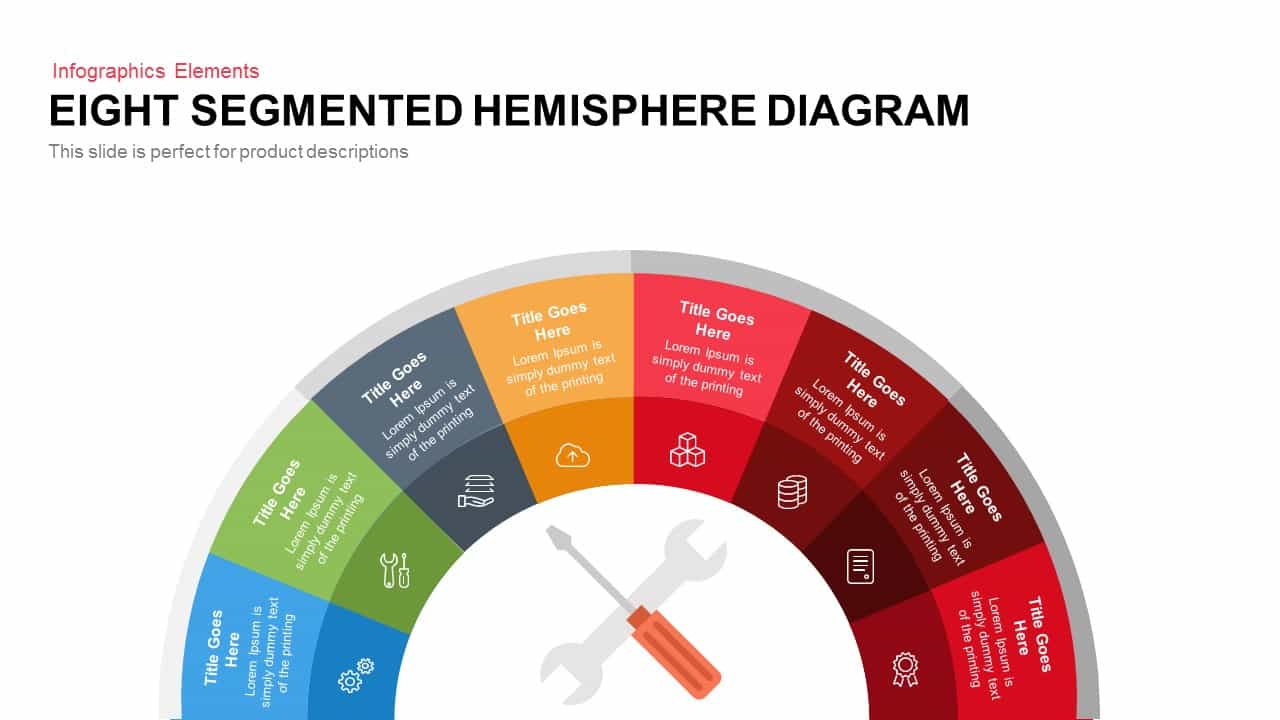
Eight Segmented Hemisphere Diagram Template for PowerPoint & Google Slides
Process
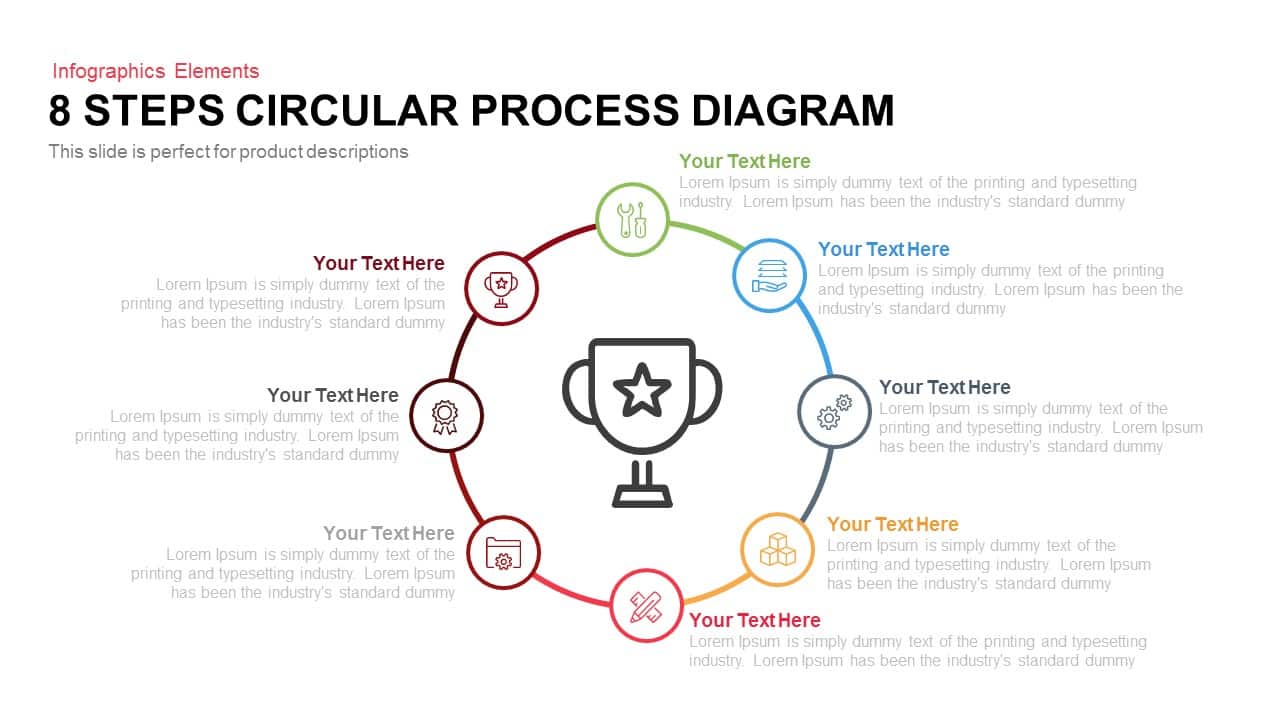
8 Steps Circular Process Diagram Template for PowerPoint & Google Slides
Process
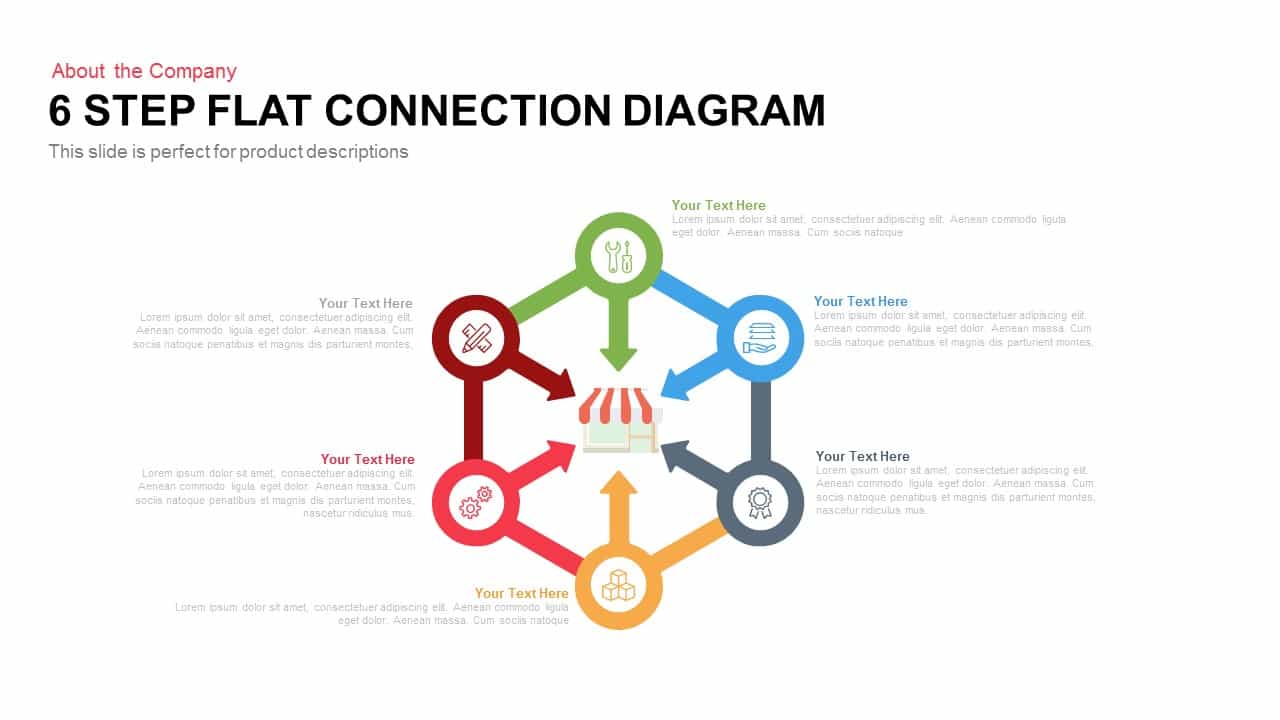
6 Step Flat Connection Diagram template for PowerPoint & Google Slides
Circular
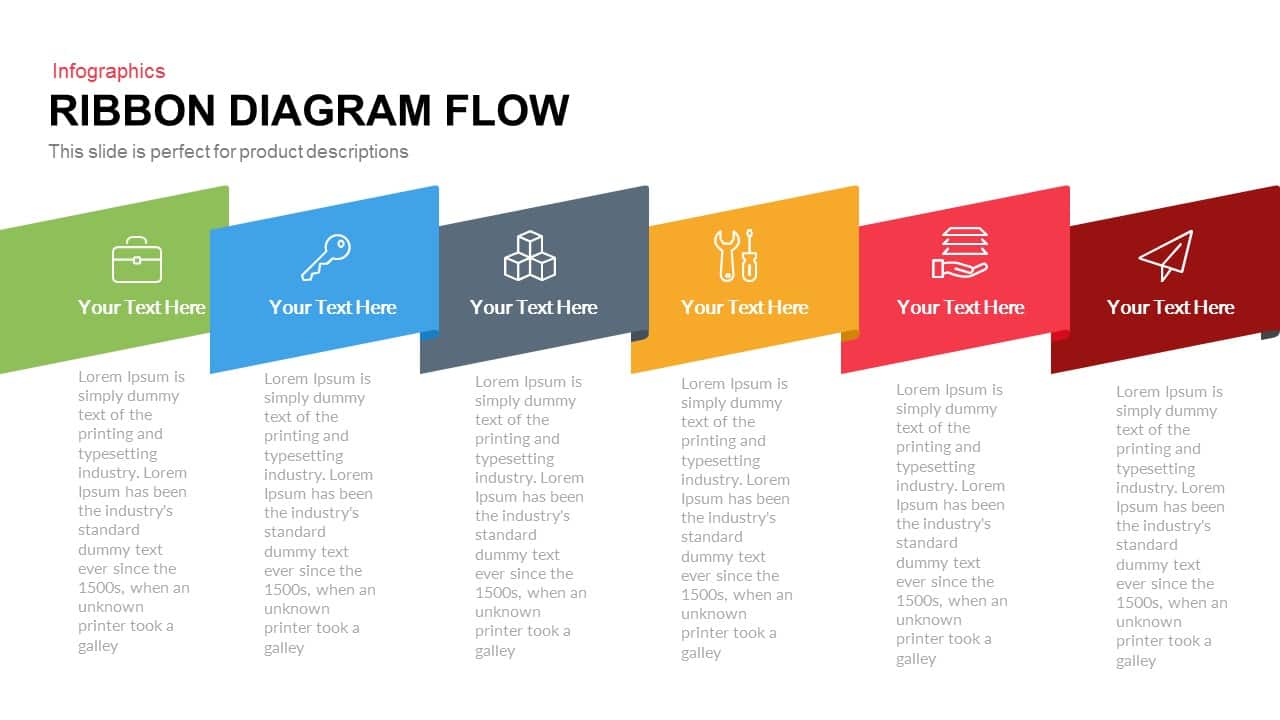
Ribbon Diagram Flow template for PowerPoint & Google Slides
Process
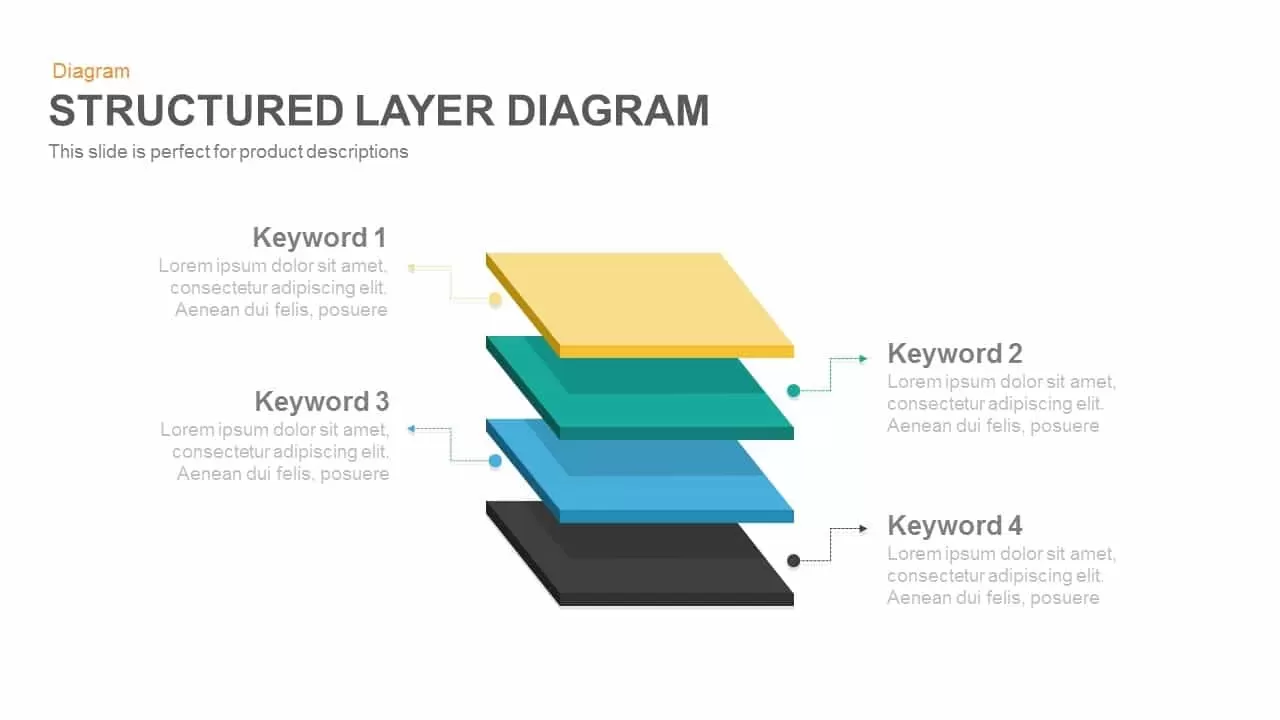
Professional Structured 3D Layer Diagram Template for PowerPoint & Google Slides
Process
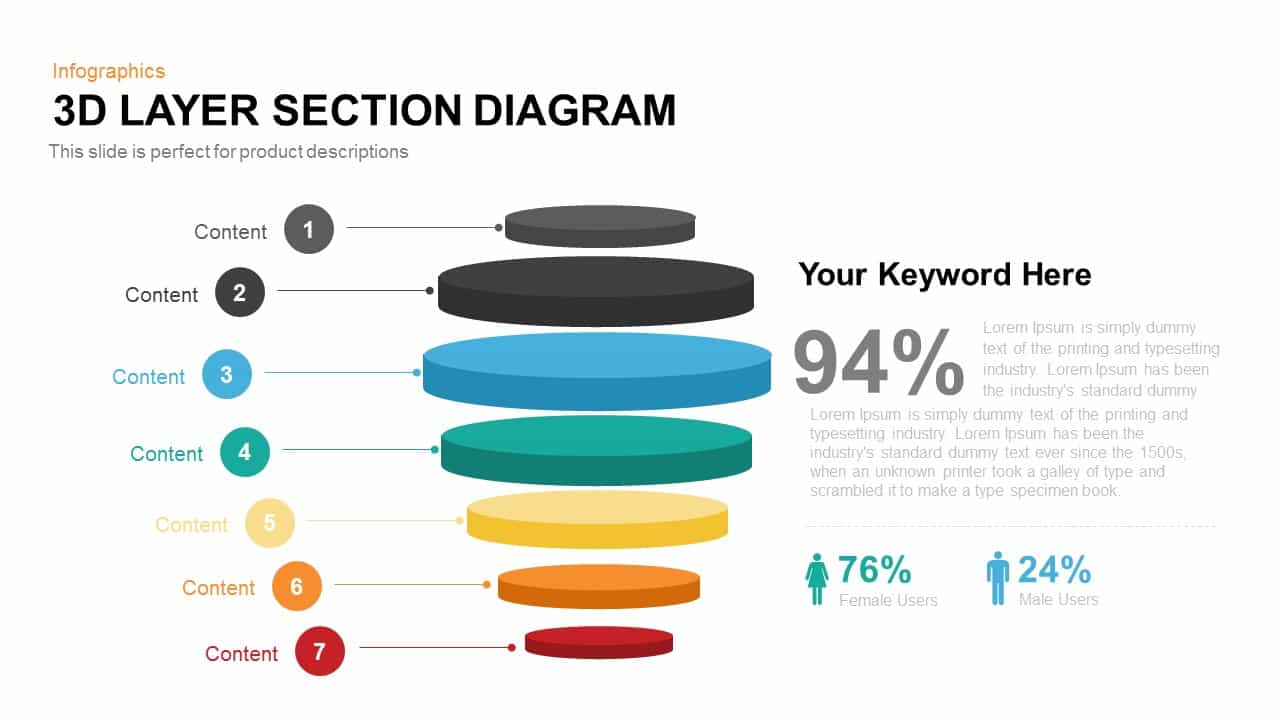
Modern 3D Layer Section Diagram Template for PowerPoint & Google Slides
Circular
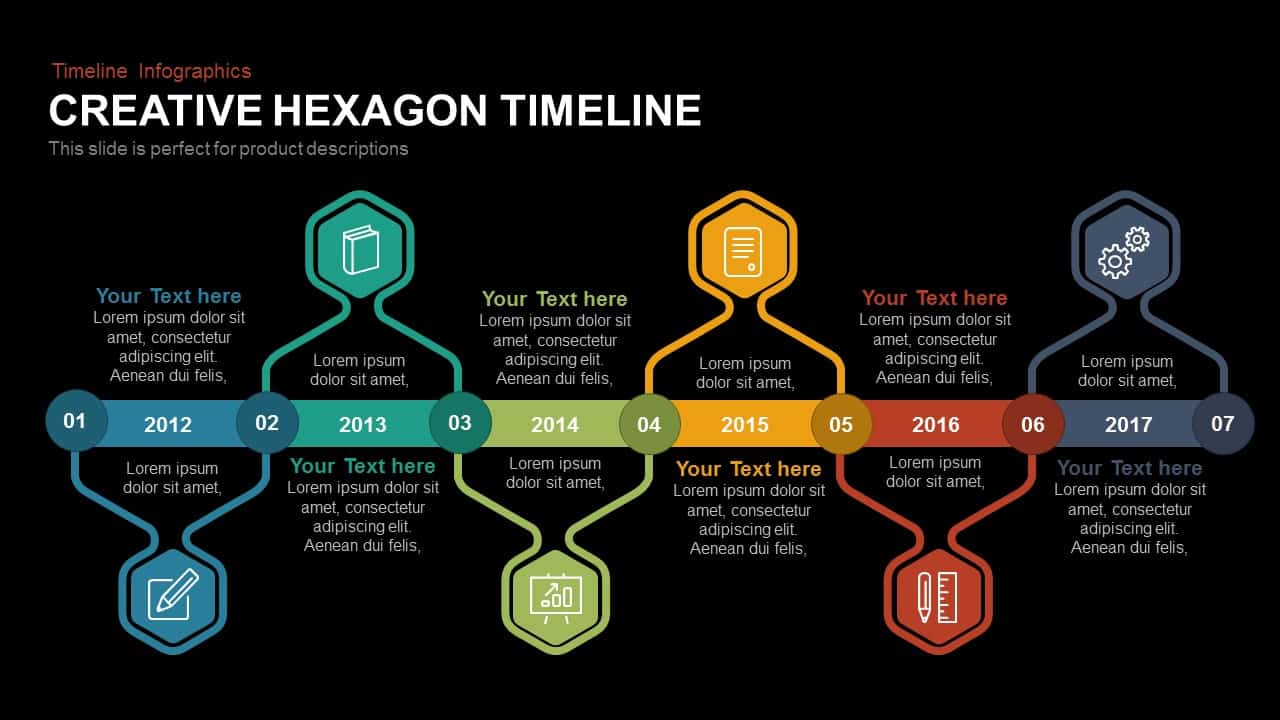
Annual Creative Hexagon Timeline Diagram Template for PowerPoint & Google Slides
Timeline
Six Section Circular Infographic Diagram Template for PowerPoint & Google Slides
Circular
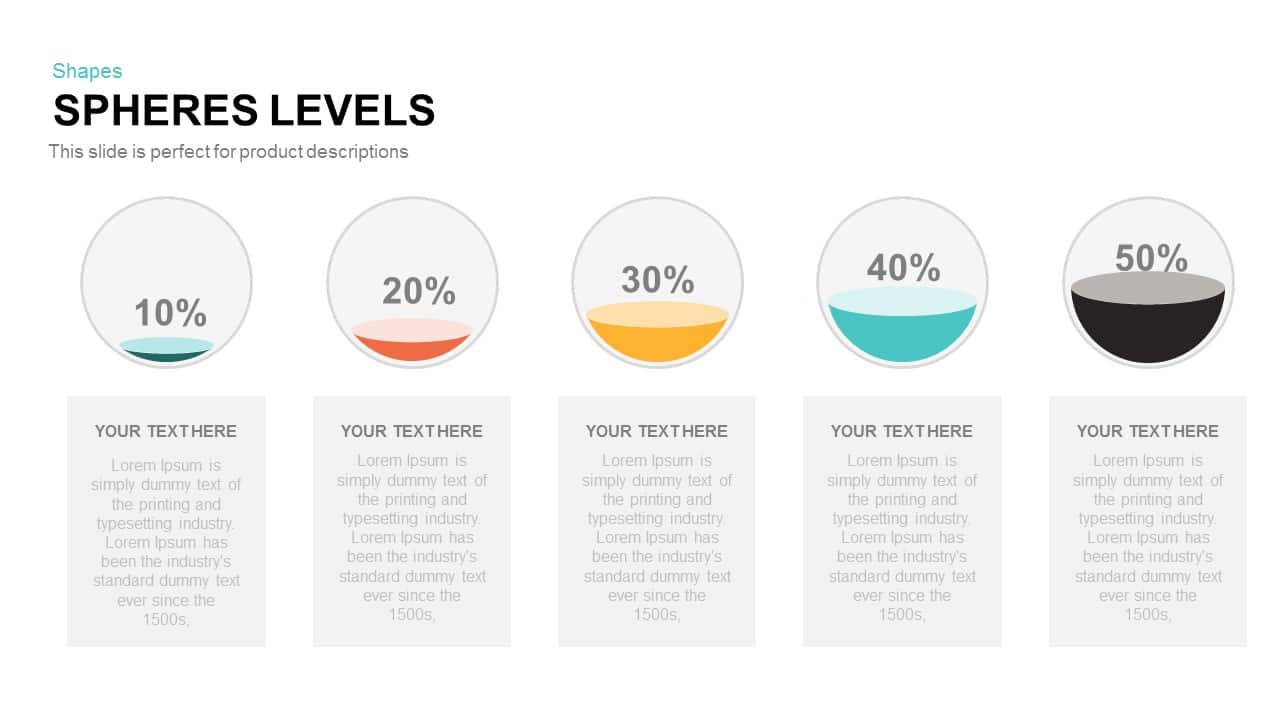
Five-Level Sphere Indicators Diagram template for PowerPoint & Google Slides
Infographics
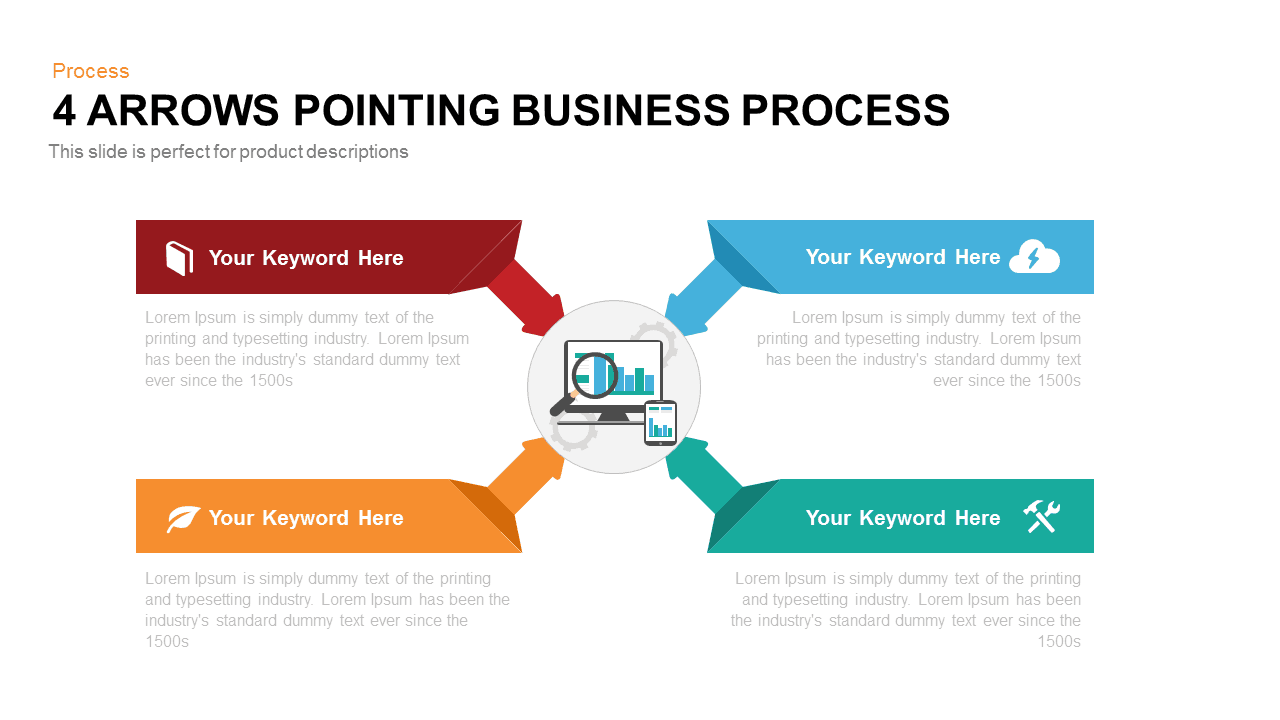
Four Arrows Business Process Diagram template for PowerPoint & Google Slides
Process

Cause and Effect Diagram Infographic Template for PowerPoint & Google Slides
Bar/Column
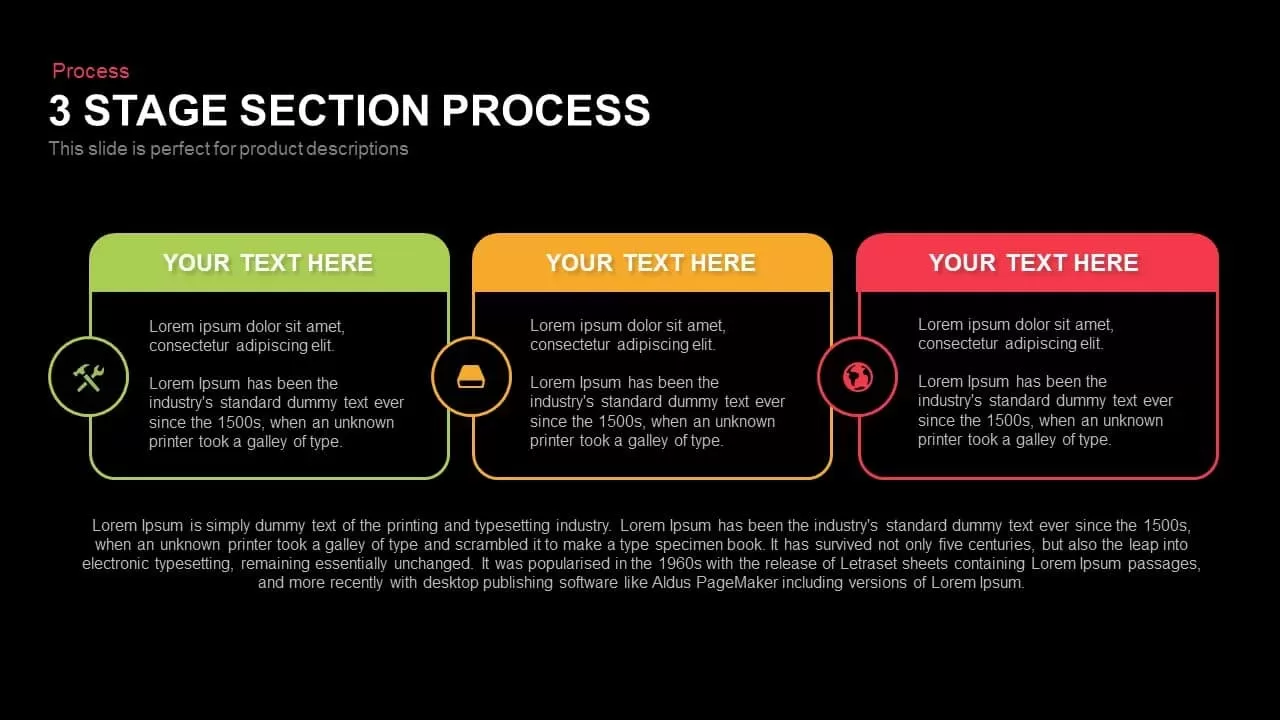
3 Stage Section Process Diagram Template for PowerPoint & Google Slides
Process

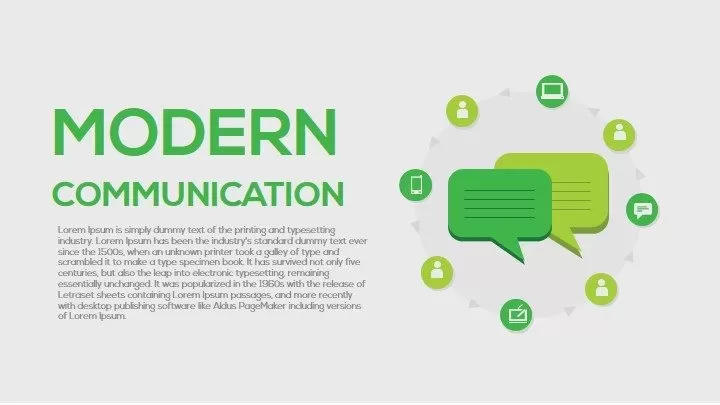
Modern Communication Process Diagram Template for PowerPoint & Google Slides
Process

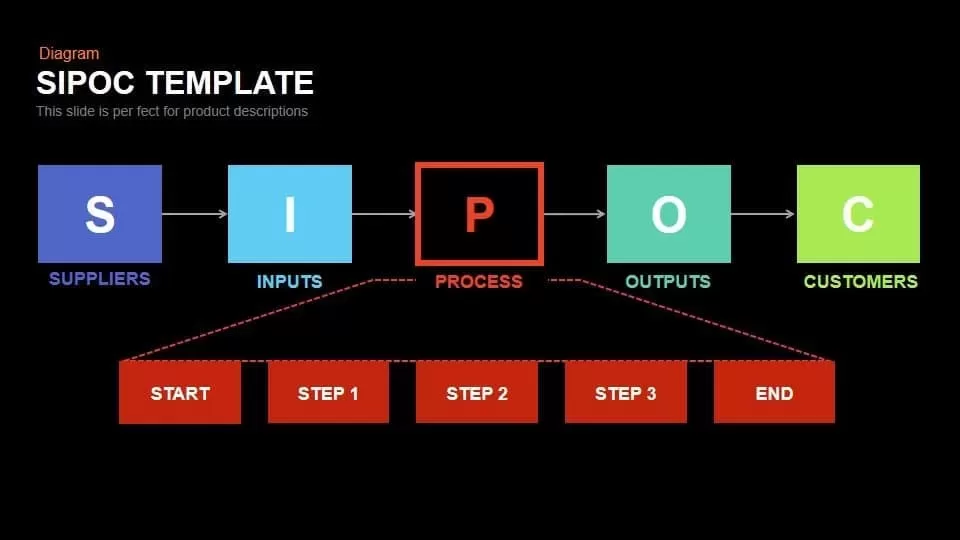
SIPOC Diagram with Process Breakdown Template for PowerPoint & Google Slides
Process
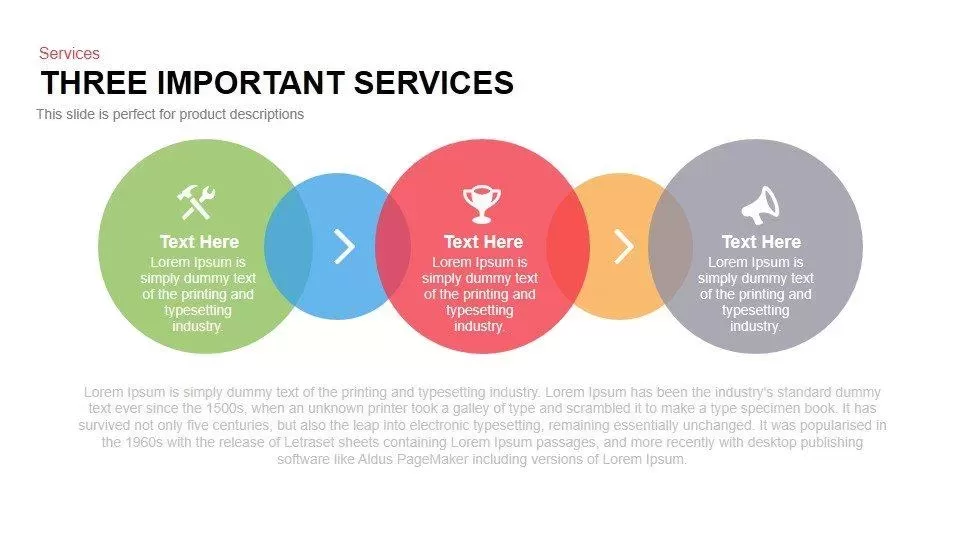
Three Important Services Flow Diagram Template for PowerPoint & Google Slides
Process
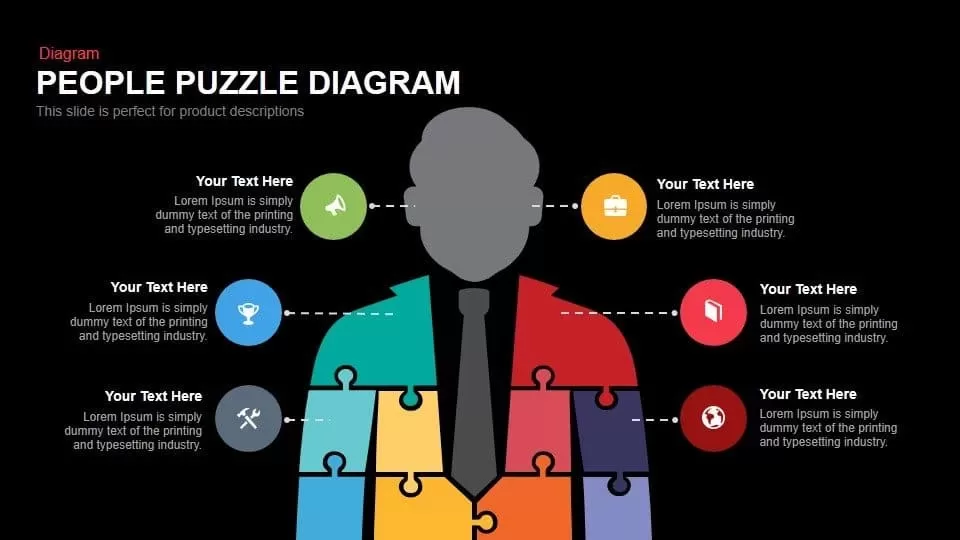
People Puzzle Diagram for Team Roles Template for PowerPoint & Google Slides
Org Chart
Product Shipping Metaphor Diagram Template for PowerPoint & Google Slides
Process
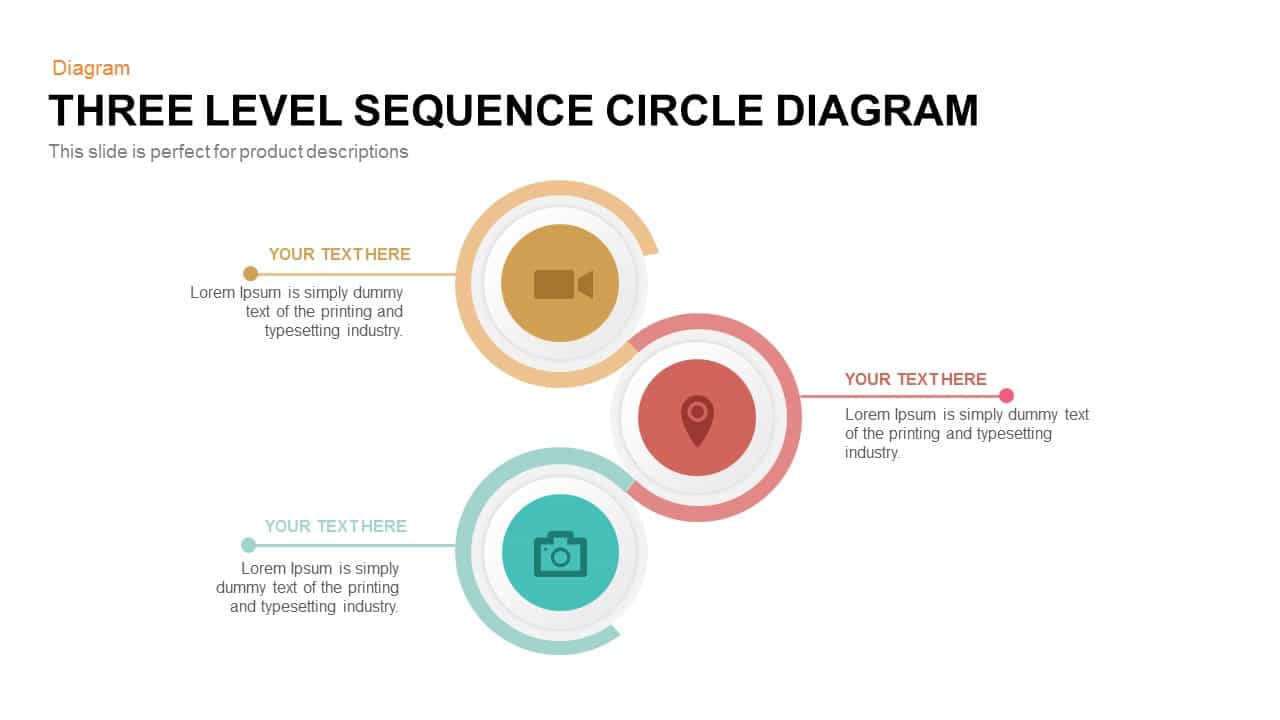
Three-Level Sequence Circle Diagram Template for PowerPoint & Google Slides
Circular
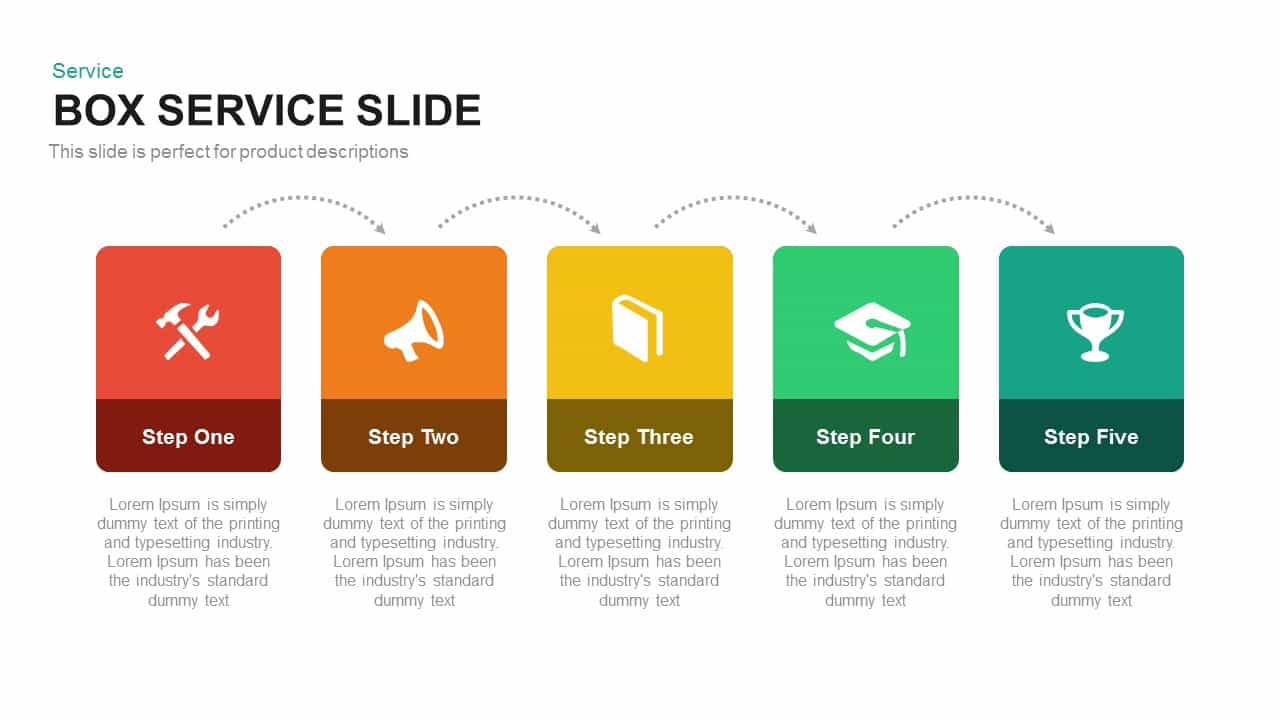
Professional Box Service Diagram Template for PowerPoint & Google Slides
Comparison
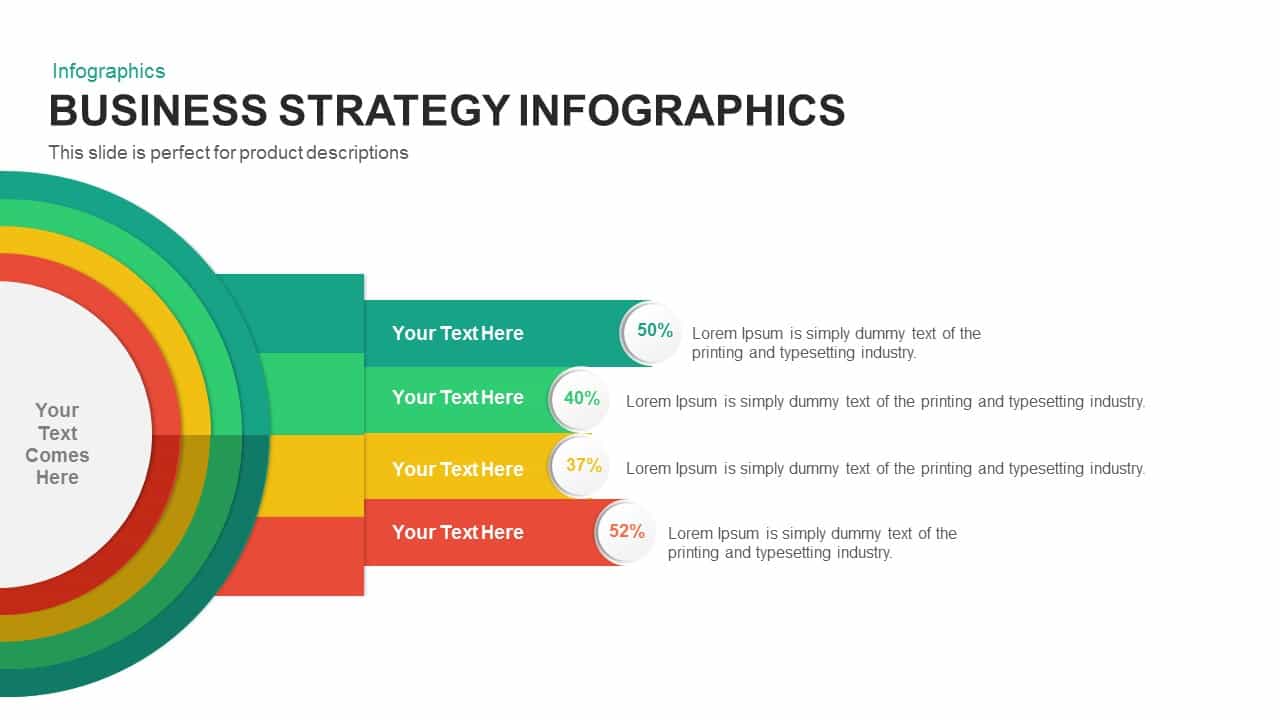
Business Strategy Infographics Diagram Template for PowerPoint & Google Slides
Business Strategy
Four-Circle Hub and Spoke Diagram Template for PowerPoint & Google Slides
Process

3D Segmented Spheres Diagram template for PowerPoint & Google Slides
Infographics
Six-Section Star Infographic Diagram Template for PowerPoint & Google Slides
Circular

Five-Level Staged Pyramid Diagram Template for PowerPoint & Google Slides
Pyramid
8-Step Puzzle Circular Diagram Template for PowerPoint & Google Slides
Circular
Marketing Risk Management Gear Diagram Template for PowerPoint & Google Slides
Risk Management
DevOps Infinity Loop Process Diagram Template for PowerPoint & Google Slides
Process
PESO Model Marketing Diagram Template for PowerPoint & Google Slides
Digital Marketing
Free Color-Coded Fishbone Diagram Template for PowerPoint & Google Slides
Project
Free
10-Point Gradient Agenda Flow Diagram Template for PowerPoint & Google Slides
Agenda
Five-Stage Slanted Timeline Diagram Template for PowerPoint & Google Slides
Timeline
Six-Stage Clockwise Circular Diagram Template for PowerPoint & Google Slides
Circular
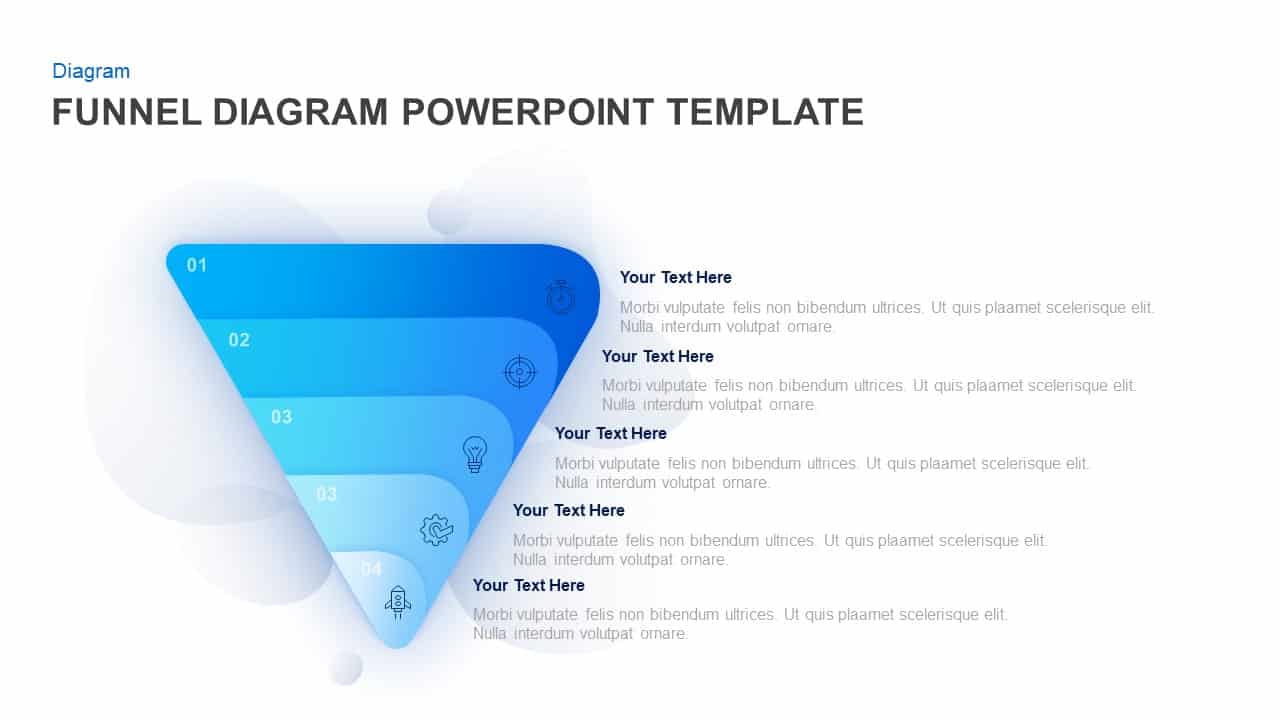
Five-Step Gradient Blue Funnel Diagram Template for PowerPoint & Google Slides
Funnel
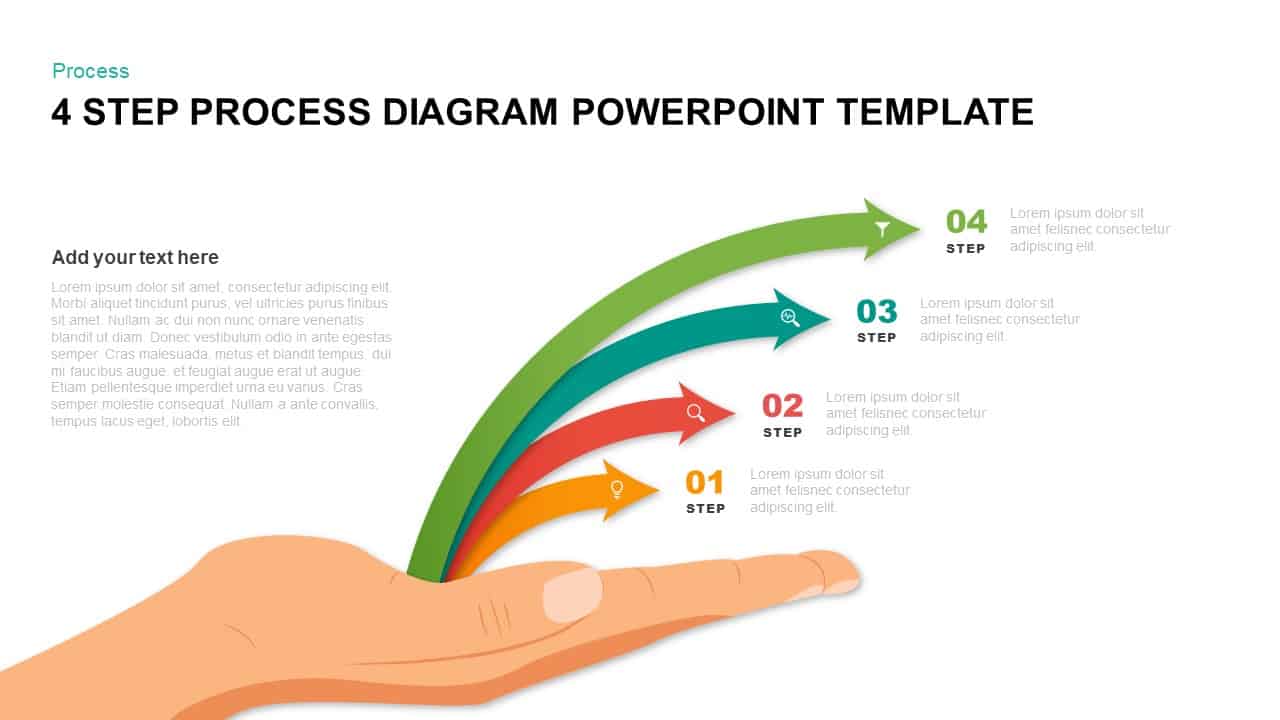
Hand-Held Four-Step Process Diagram Template for PowerPoint & Google Slides
Process
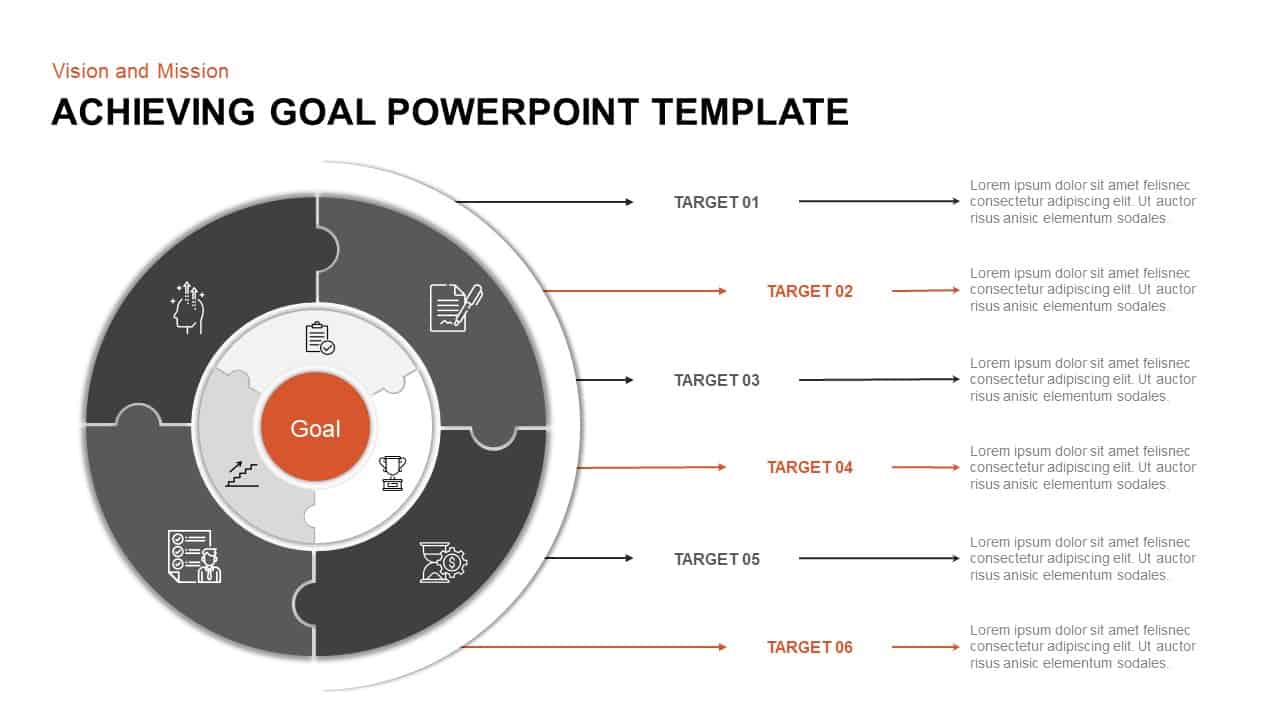
Puzzle Diagram for Goal Achievement Template for PowerPoint & Google Slides
Circular
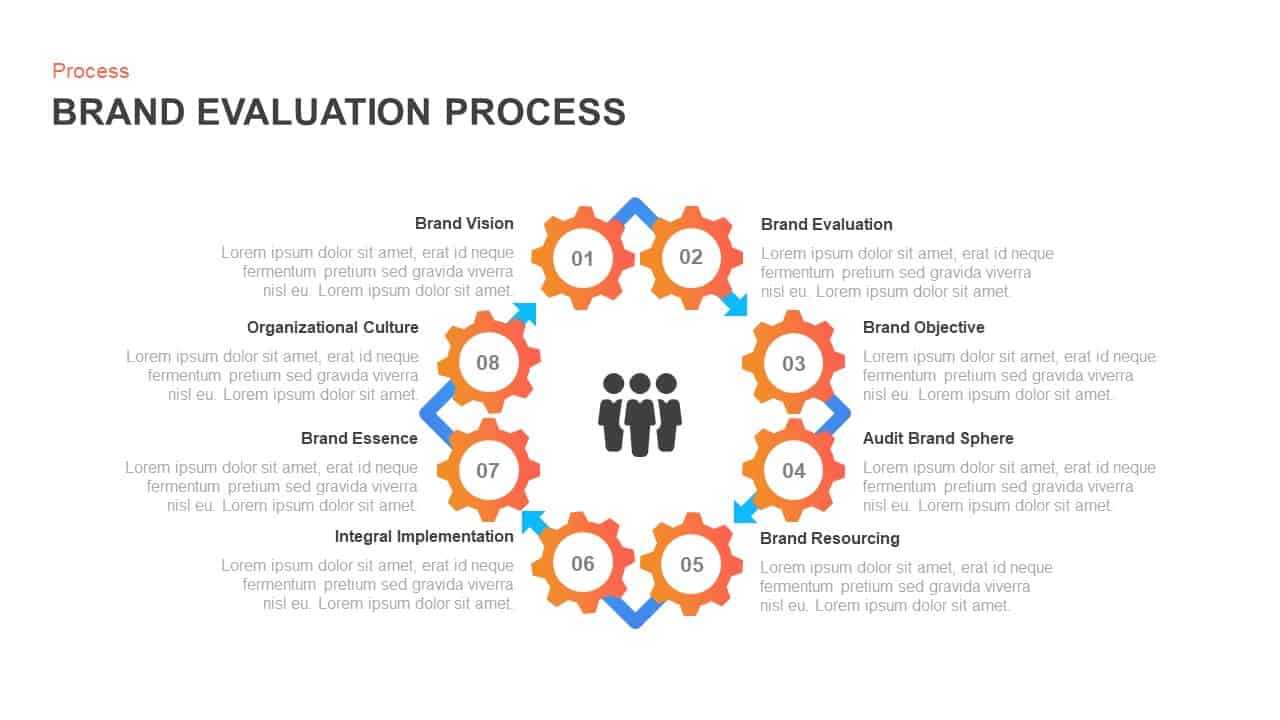
8-Stage Brand Evaluation Process Diagram Template for PowerPoint & Google Slides
Process
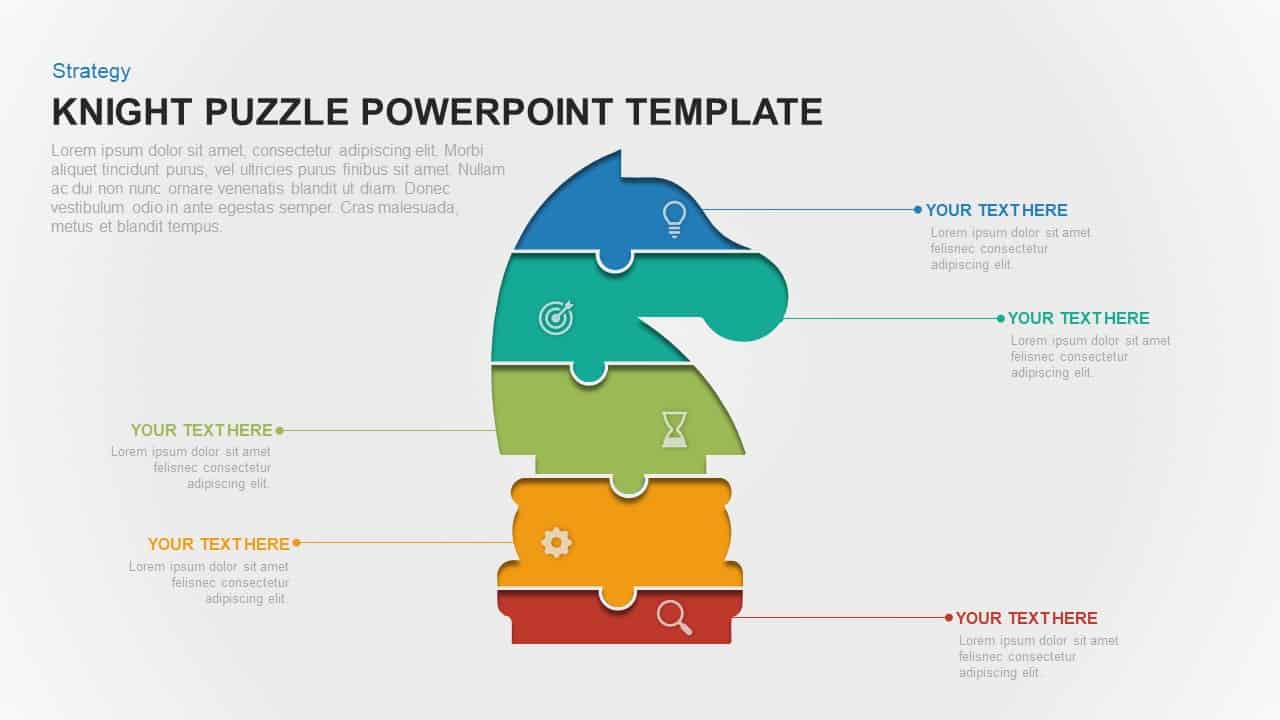
Knight Puzzle Strategy Diagram Template for PowerPoint & Google Slides
Process
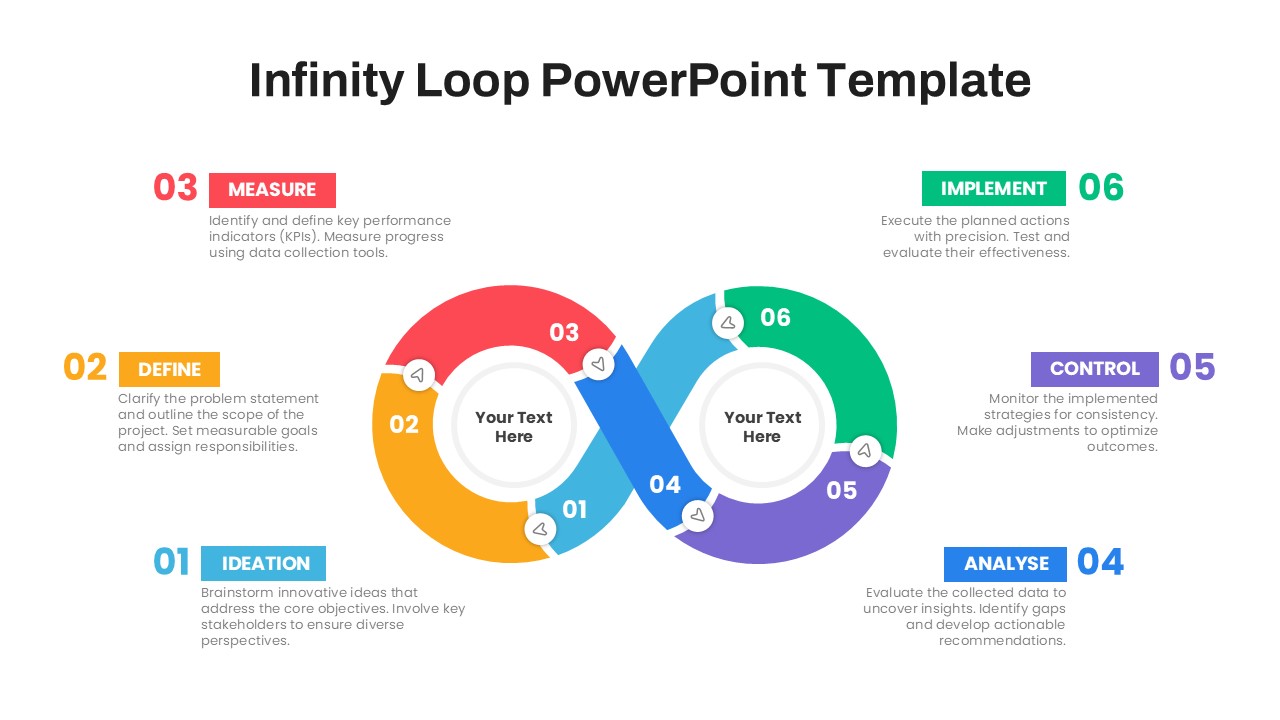
Six-Step Infinity Loop Process Diagram Template for PowerPoint & Google Slides
Process
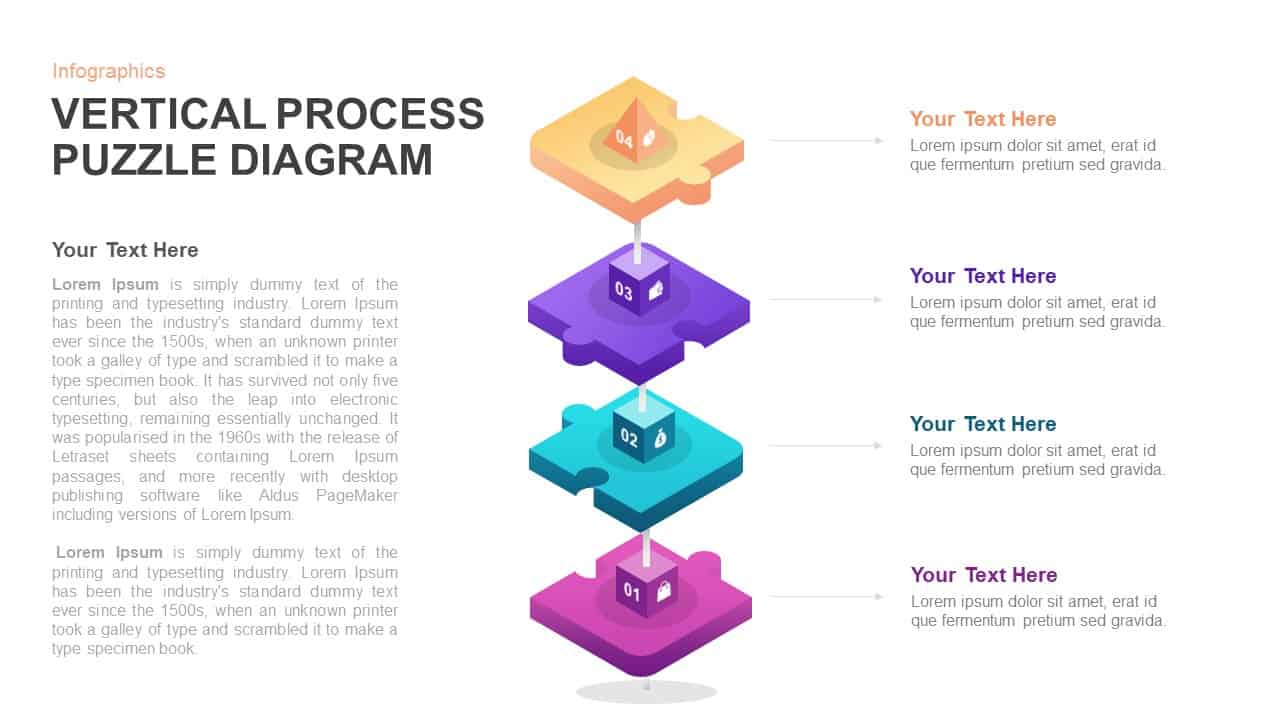
Vertical 4-Step Puzzle Process Diagram Template for PowerPoint & Google Slides
Process
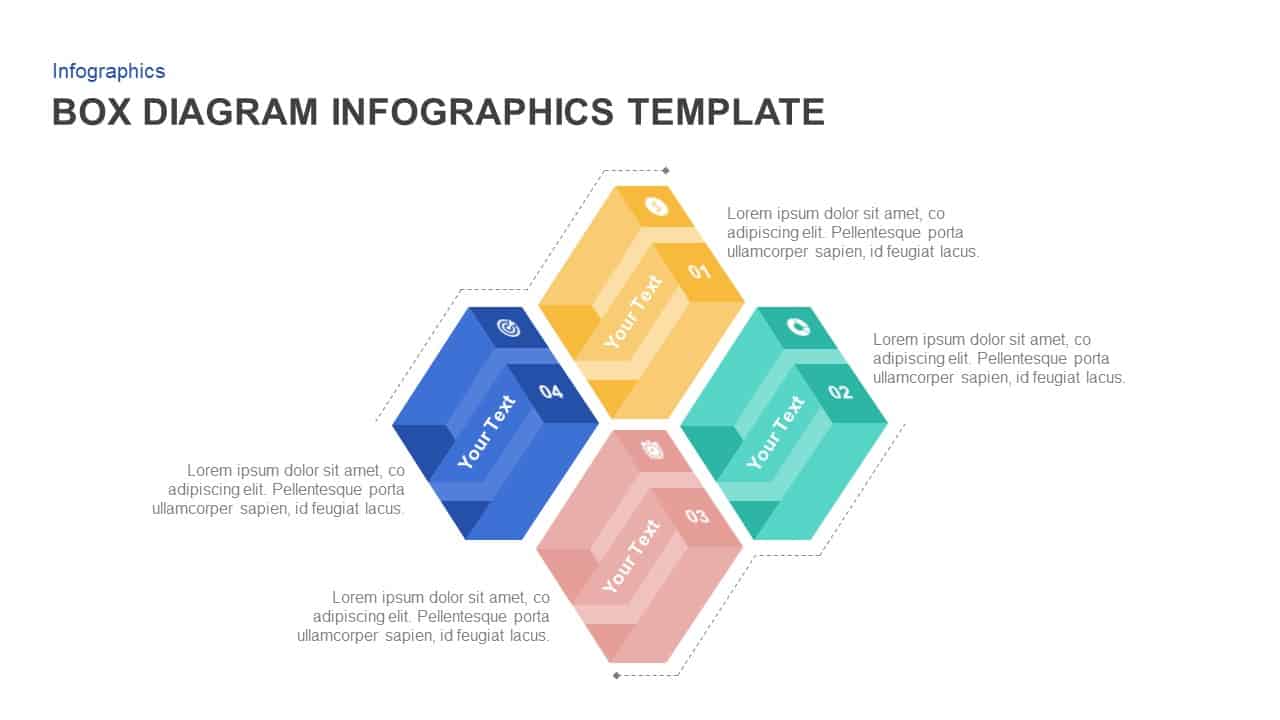
Box Diagram Infographics template for PowerPoint & Google Slides
Business
6-Part Circular Gear Infographic Diagram Template for PowerPoint & Google Slides
Process

5S Lean Methodology Circular Diagram Template for PowerPoint & Google Slides
Process
MUDA Seven Types of Waste Diagram Template for PowerPoint & Google Slides
Circular
8-Step Circular Diagram Infographics Template for PowerPoint & Google Slides
Circular
3D Triangle Diagram Infographic Template for PowerPoint & Google Slides
Pyramid
Communication Cycle Process Diagram template for PowerPoint & Google Slides
Business
Fishbone Process Diagram template for PowerPoint & Google Slides
Infographics
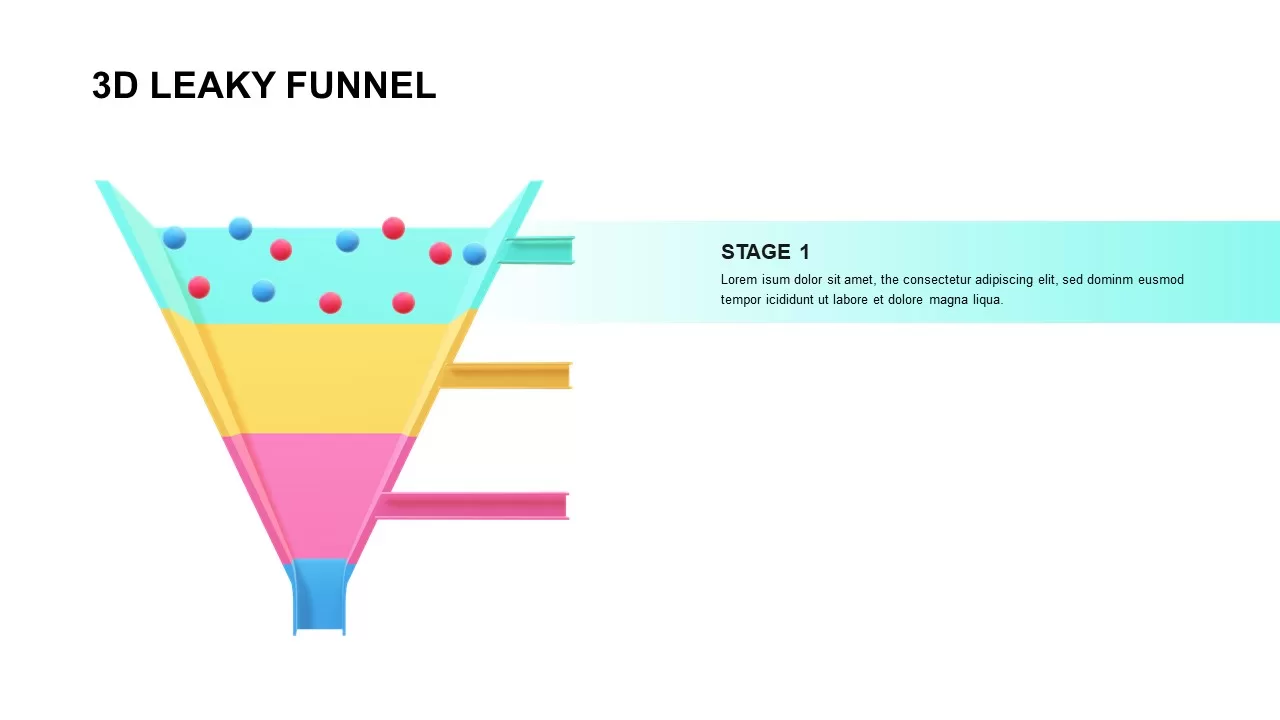
3D Leaky Funnel Diagram template for PowerPoint & Google Slides
Funnel
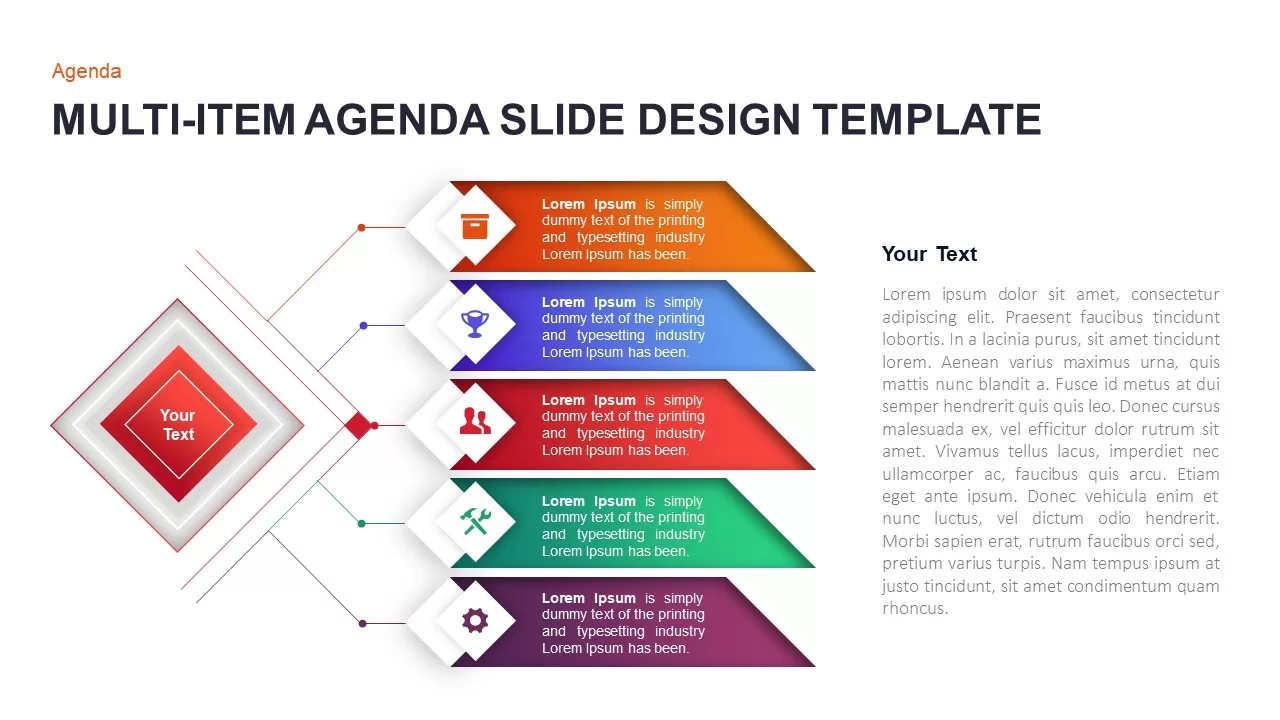
Multi-Item Agenda Hub-and-Spoke Diagram Template for PowerPoint & Google Slides
Agenda
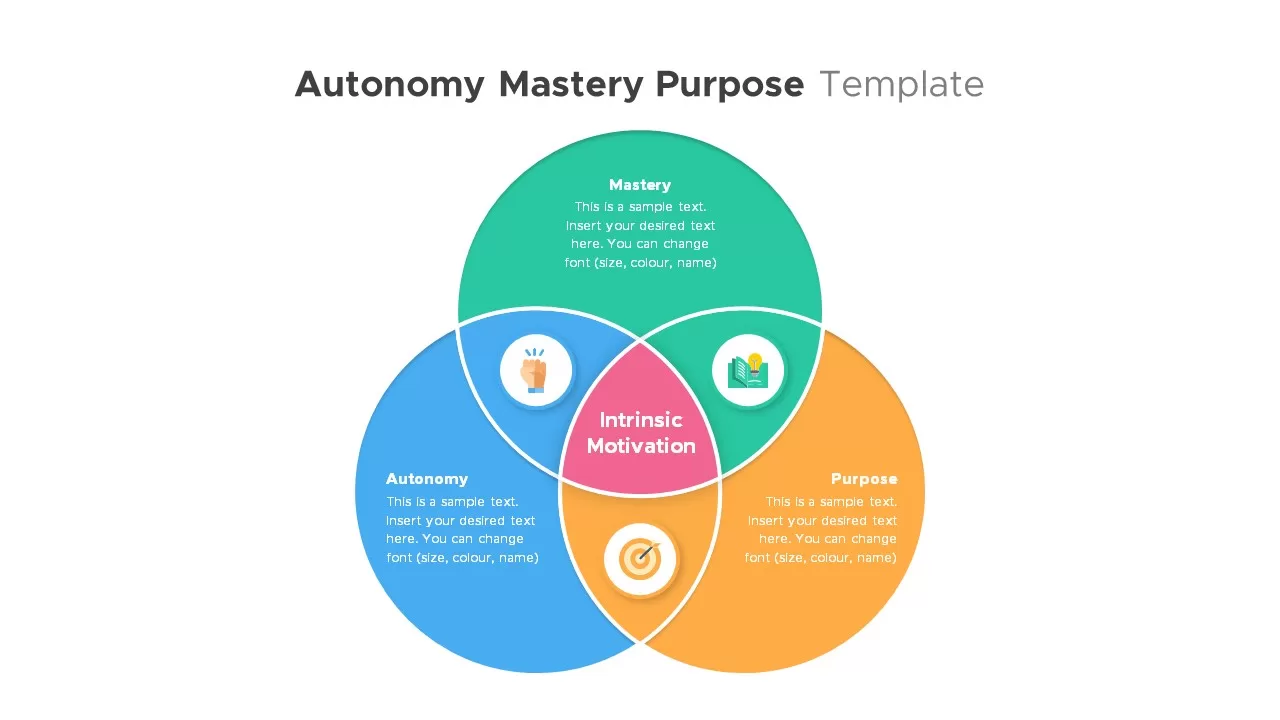
Autonomy, Mastery & Purpose Venn Diagram Template for PowerPoint & Google Slides
Circular
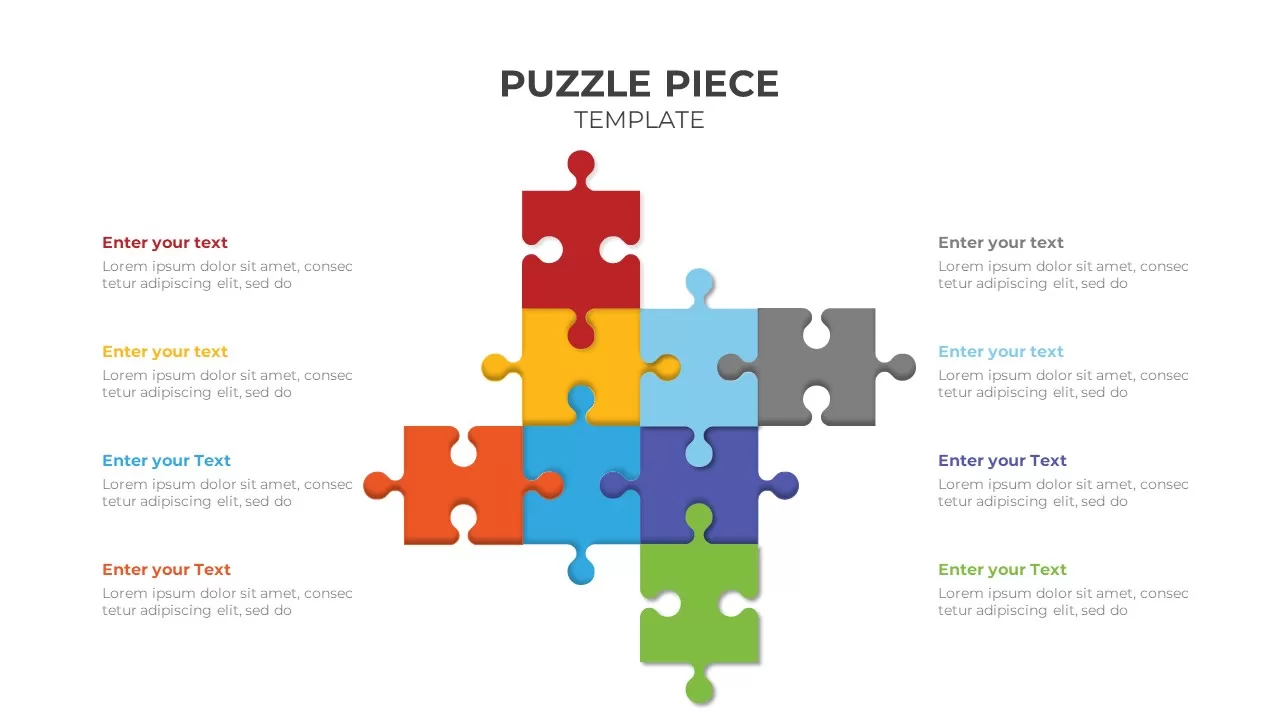
Colorful Eight-Piece Puzzle Diagram Template for PowerPoint & Google Slides
Process
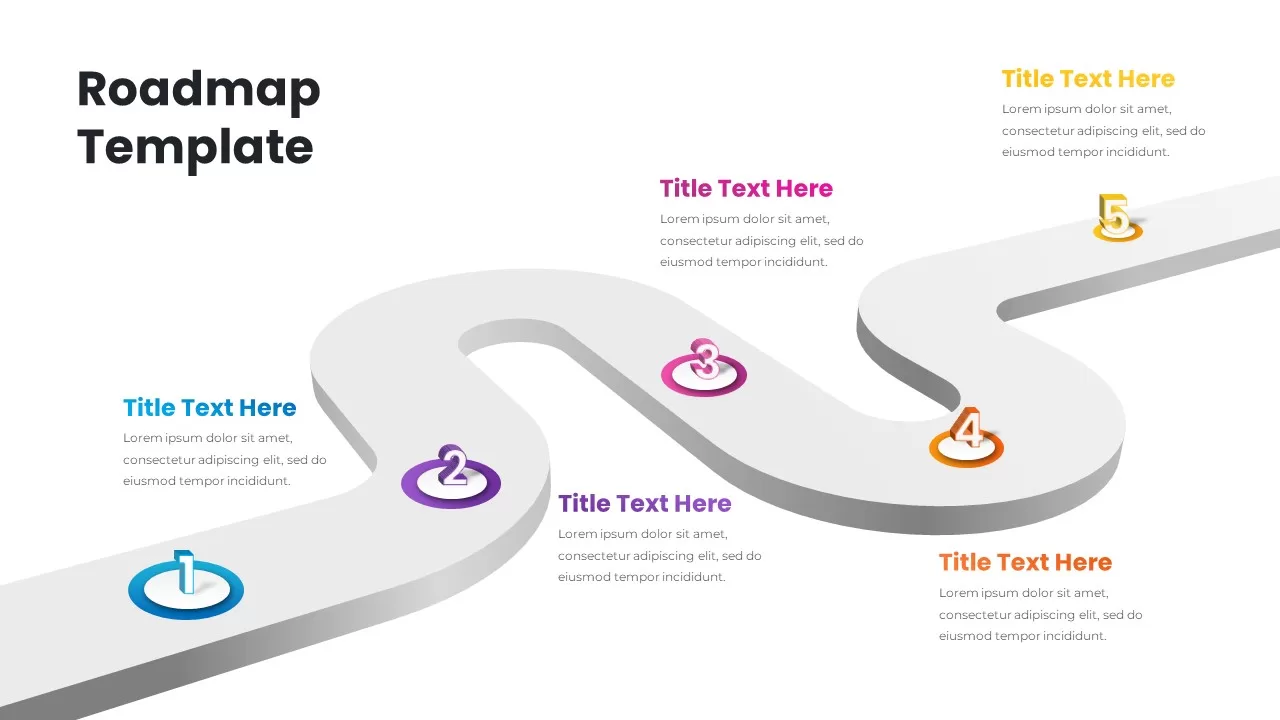
3D Five-Step Roadmap Diagram Slide Layout Template for PowerPoint & Google Slides
Roadmap
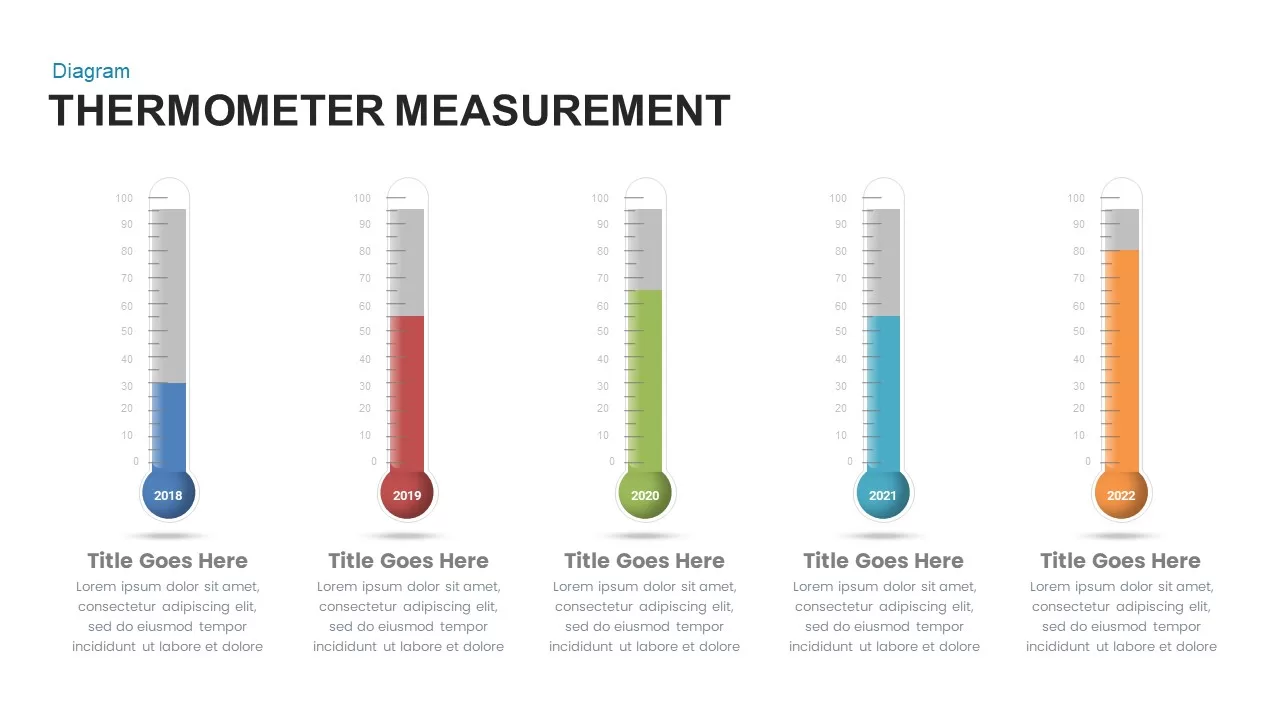
Thermometer Measurement Timeline Diagram Template for PowerPoint & Google Slides
Timeline
Three-Step Curved Arrow Process Diagram Template for PowerPoint & Google Slides
Arrow
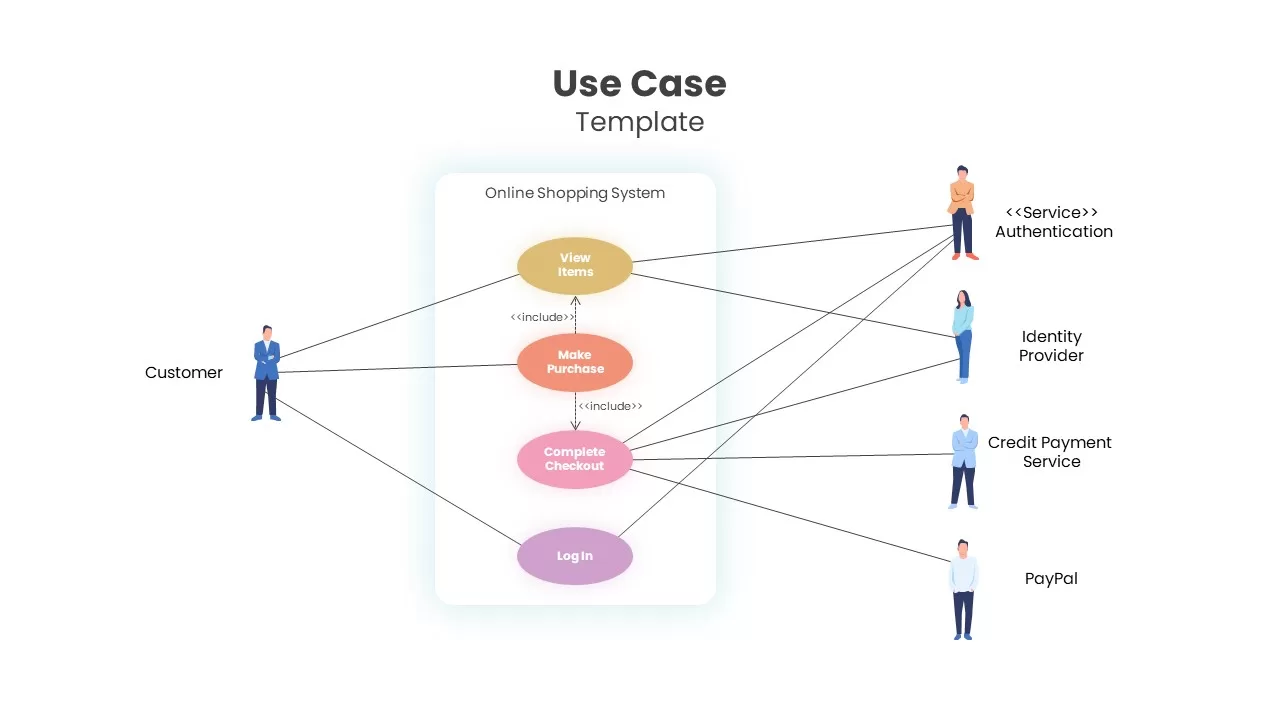
Online Shopping Use Case Diagram Template for PowerPoint & Google Slides
Software Development
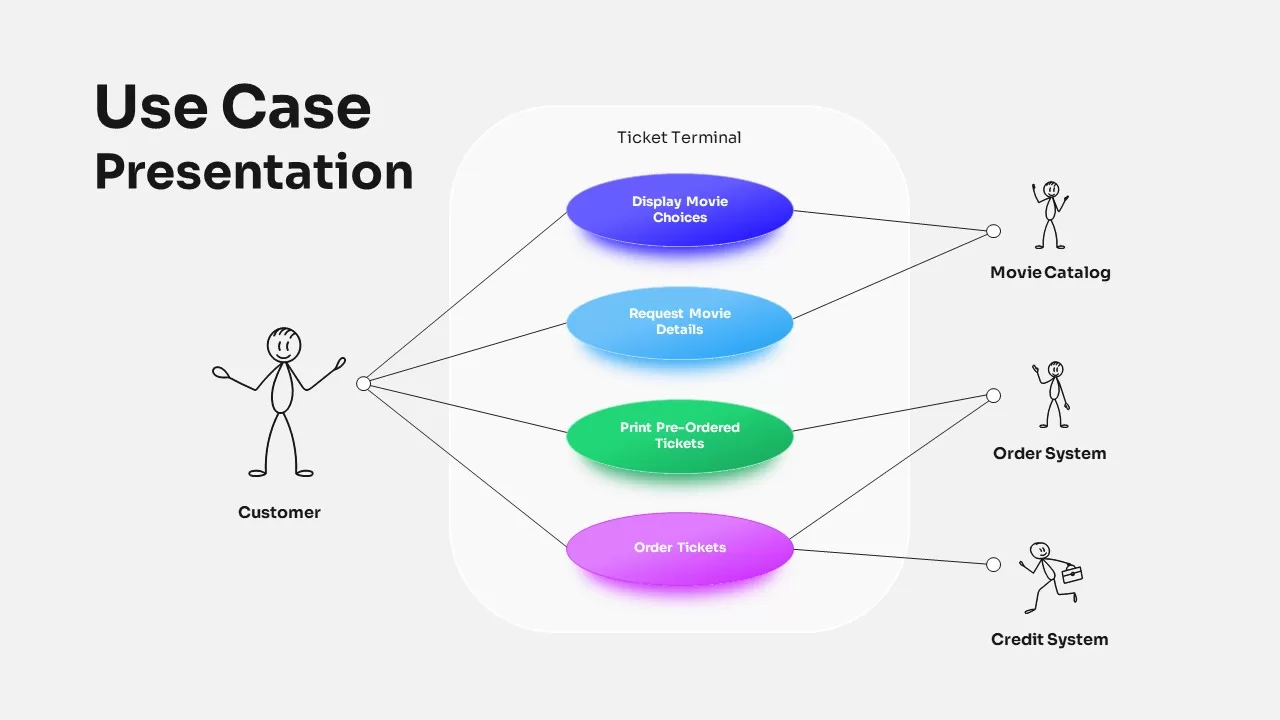
Cinema Ticketing Use Case Diagram Template for PowerPoint & Google Slides
Software Development
Chain Link Process Infographic Diagram Template for PowerPoint & Google Slides
Process
10-Step Circular Process Diagram Template for PowerPoint & Google Slides
Process
Herzberg’s Two Factor Theory Diagram Template for PowerPoint & Google Slides
Comparison
Sales Playbook Process Steps Diagram Template for PowerPoint & Google Slides
Marketing
Juggling Responsibilities Diagram Template for PowerPoint & Google Slides
Circular
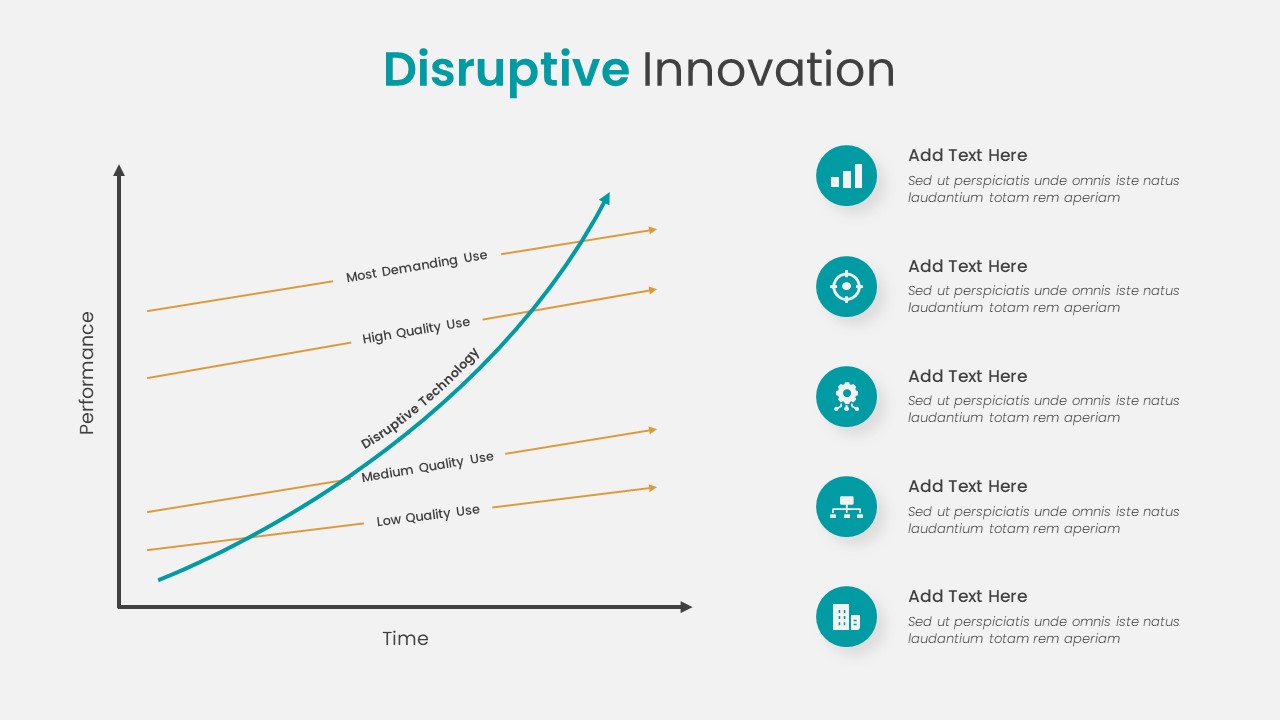
Disruptive Innovation Framework Diagram Template for PowerPoint & Google Slides
Comparison Chart
Simple Flowchart Process Diagram Template for PowerPoint & Google Slides
Flow Charts
Release Management Cycle Circular Diagram Template for PowerPoint & Google Slides
Software Development
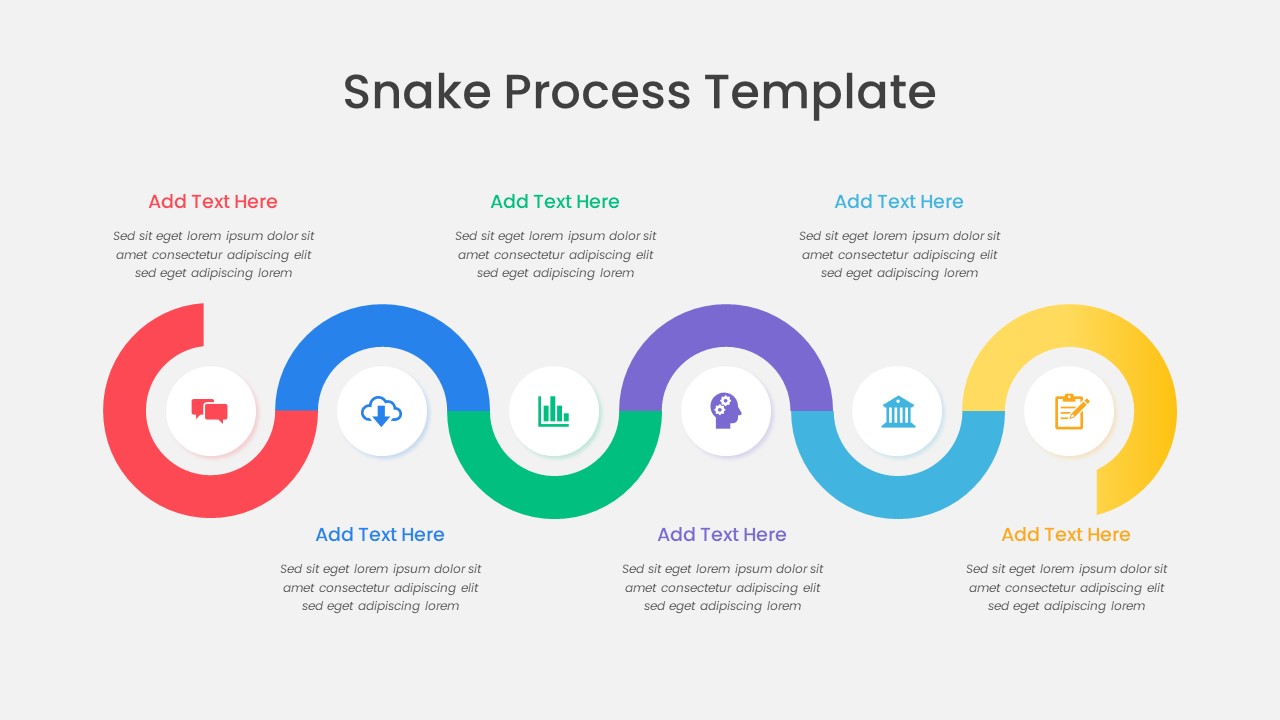
Colorful Snake Process Diagram Template for PowerPoint & Google Slides
Process
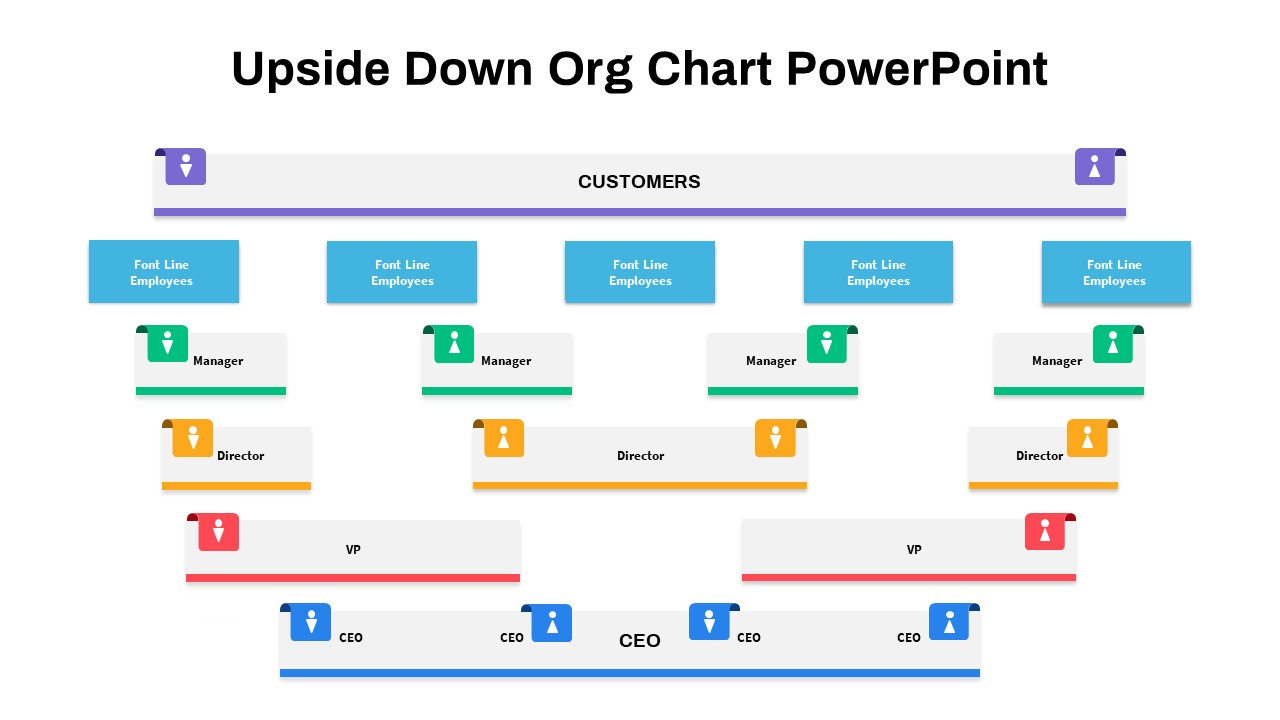
Upside-Down Organizational Chart Diagram Template for PowerPoint & Google Slides
Org Chart
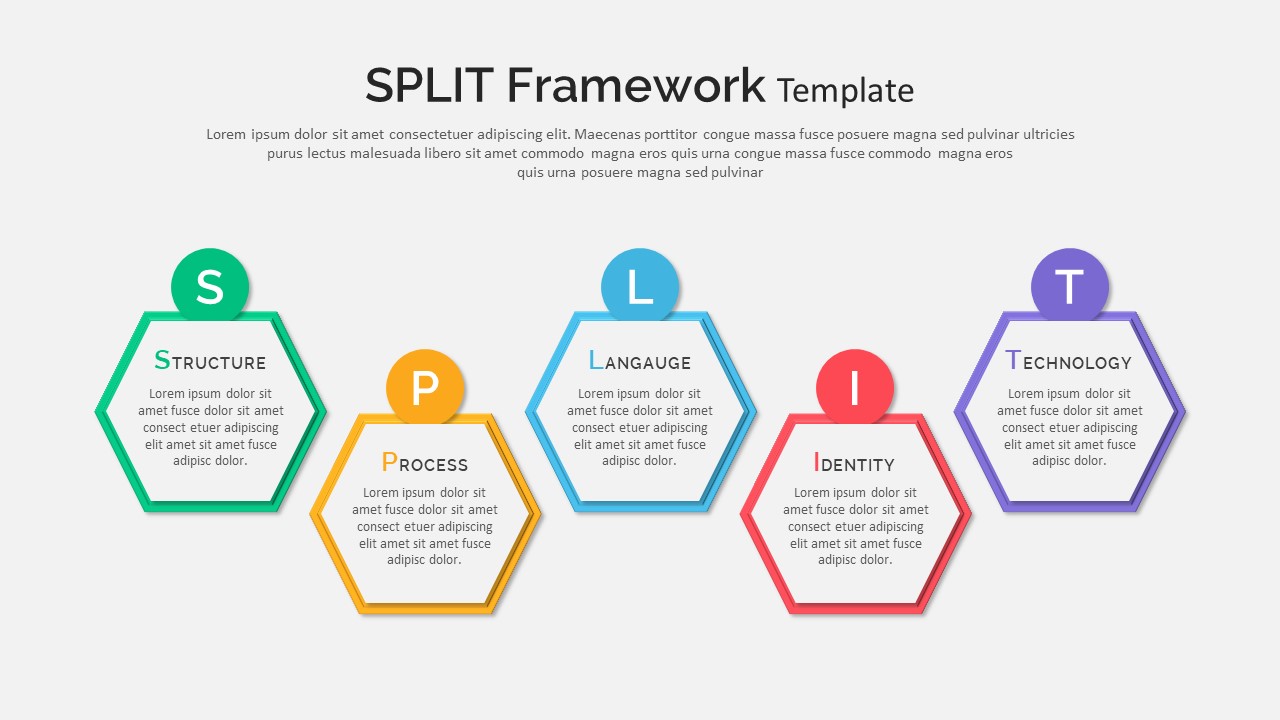
Split Framework Hexagon Diagram Slide Template for PowerPoint & Google Slides
Process
Free Root Cause Analysis Fishbone Diagram Template for PowerPoint & Google Slides
Process
Free
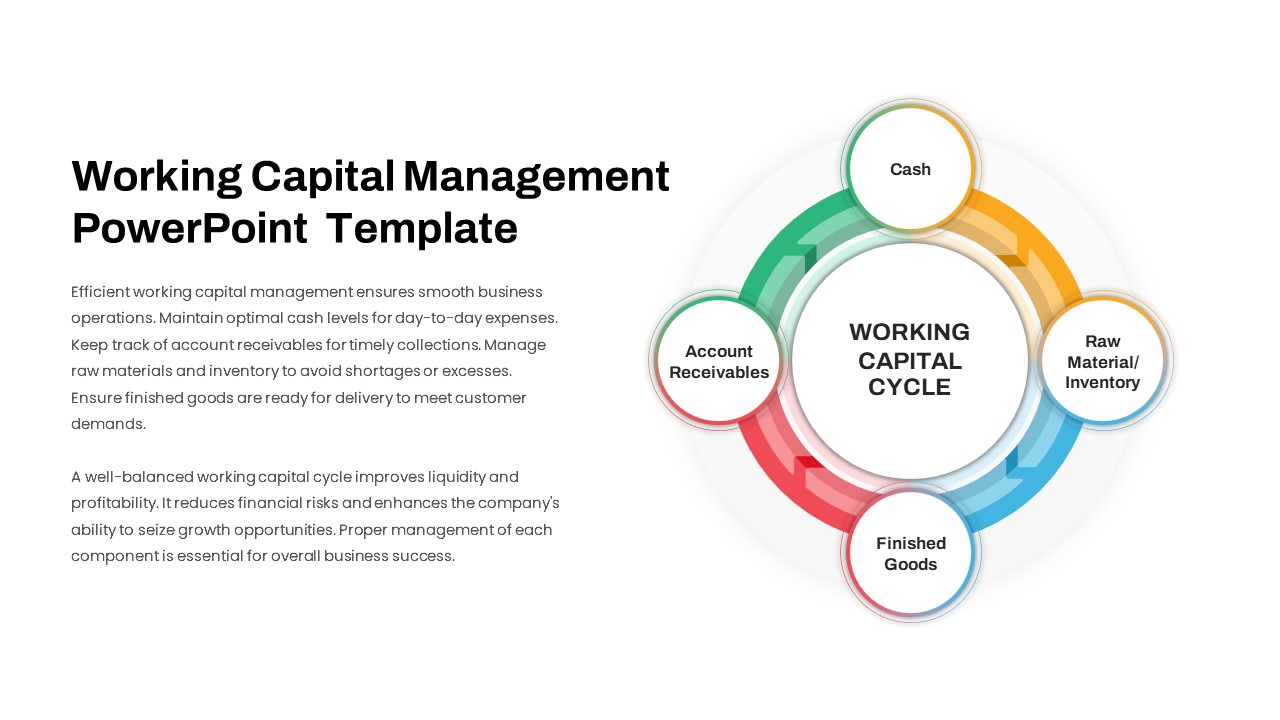
Working Capital Cycle Diagram Template for PowerPoint & Google Slides
Circular
Category Creation Triangle Diagram Template for PowerPoint & Google Slides
Business Strategy
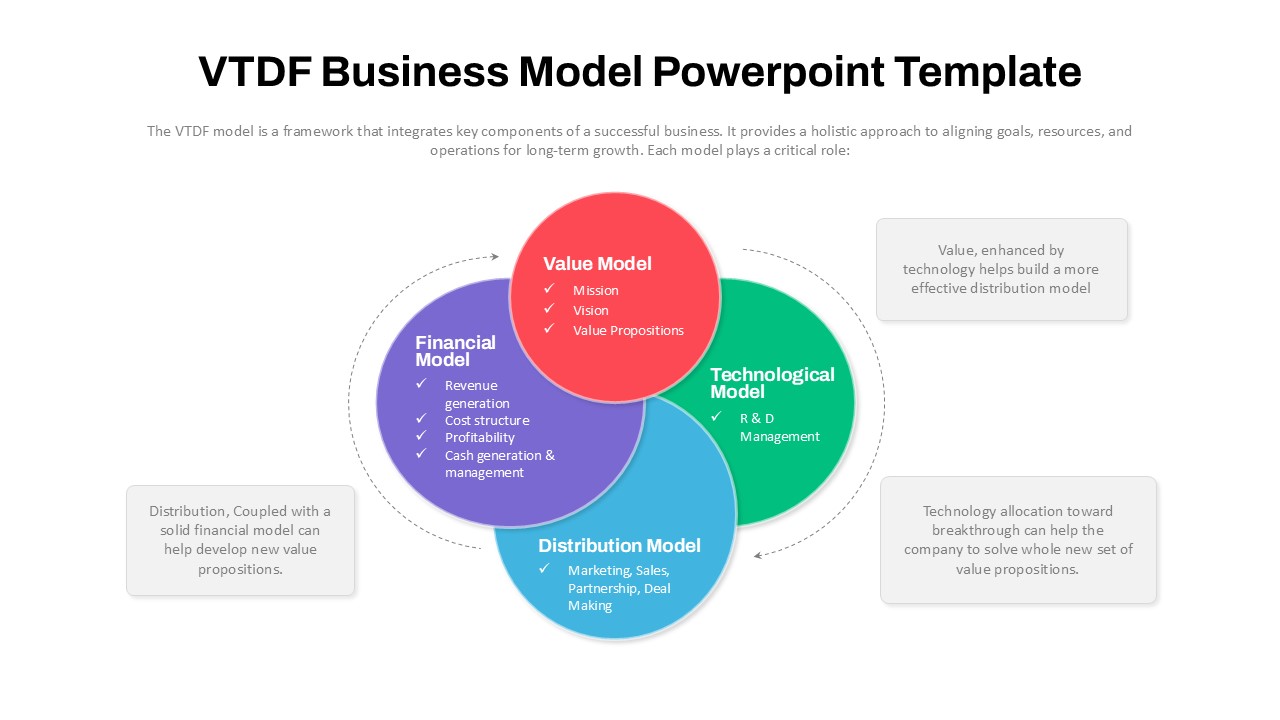
VTDF Business Model Framework Diagram Template for PowerPoint & Google Slides
Business Models
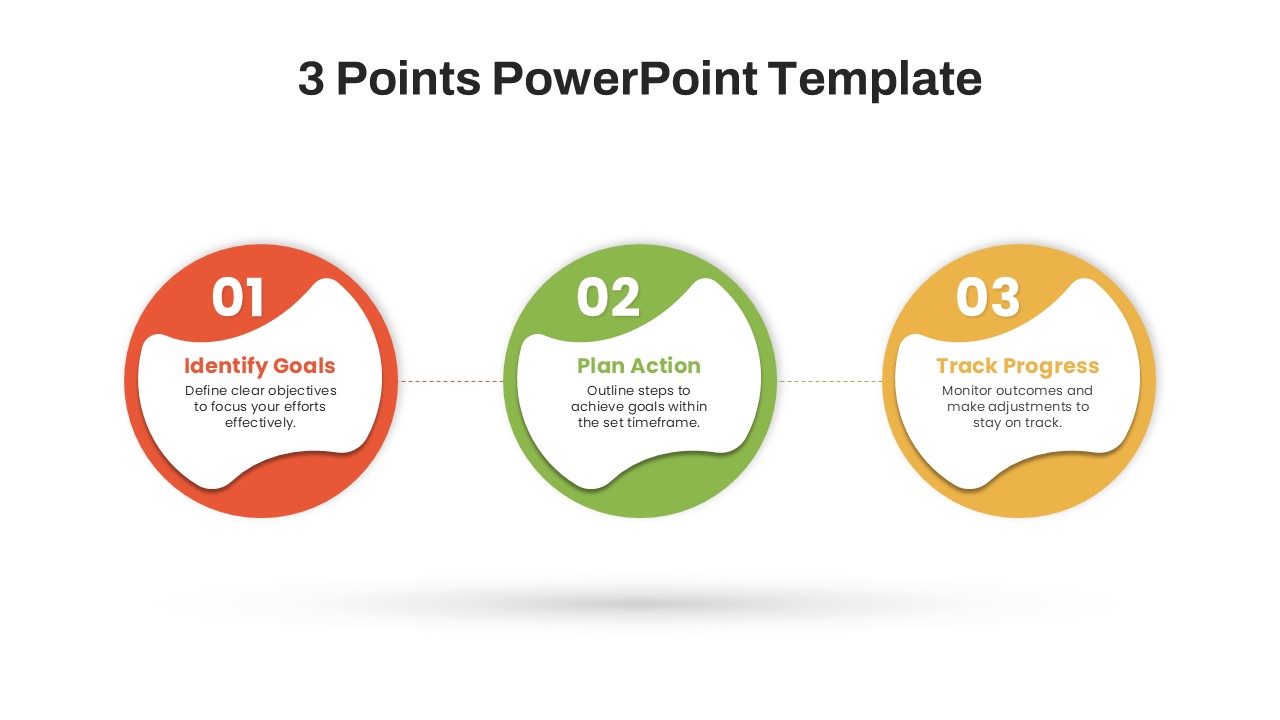
Modern Three-Point Process Diagram Template for PowerPoint & Google Slides
Process
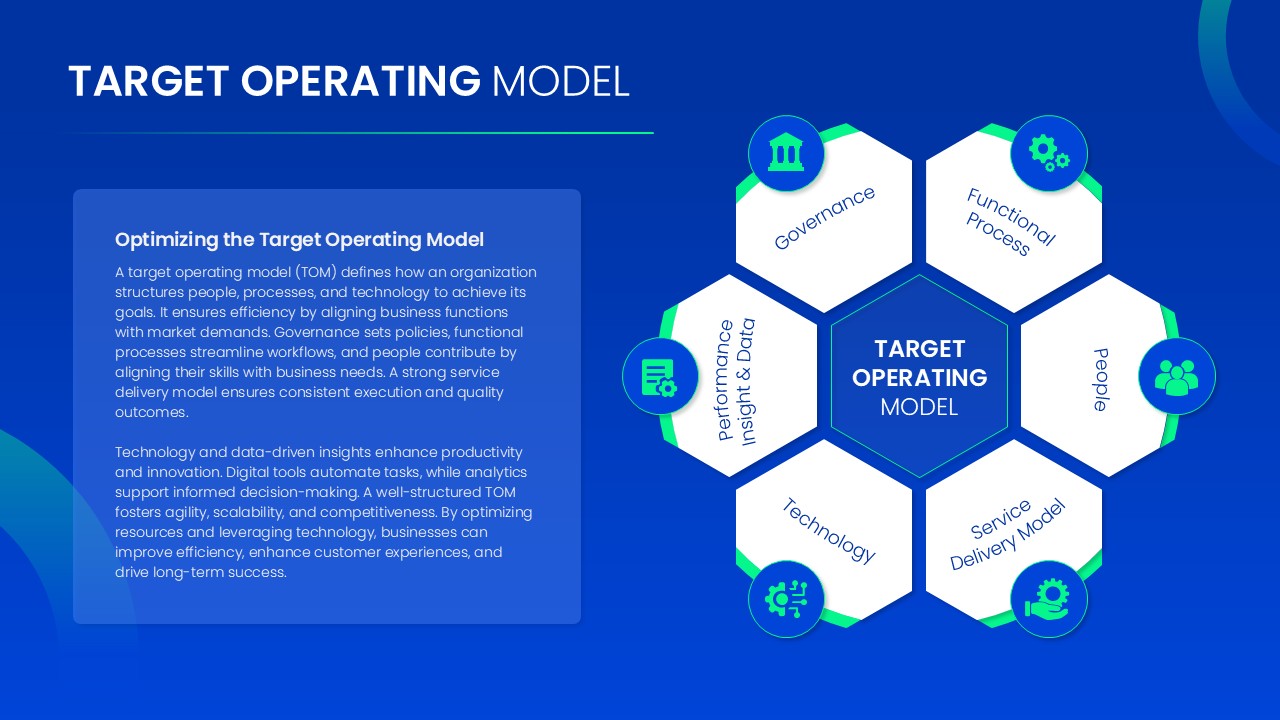
Target Operating Model Diagram Template for PowerPoint & Google Slides
Business Strategy
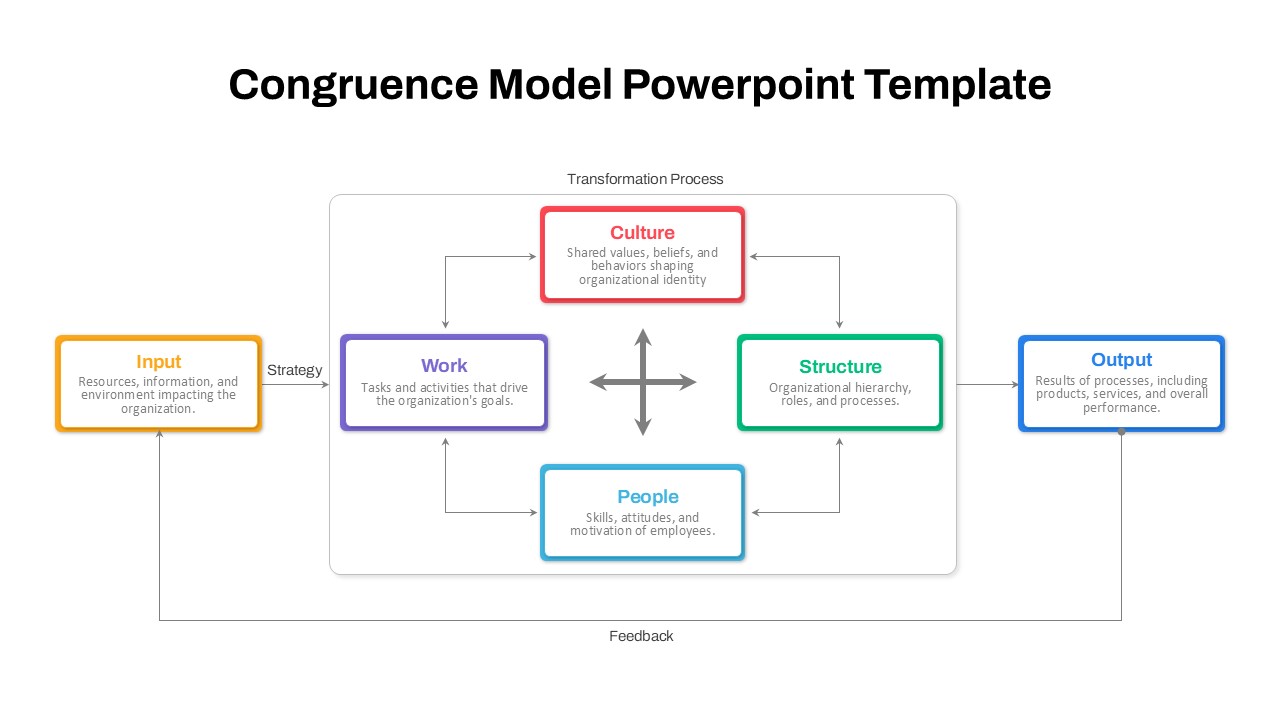
Organizational Congruence Model Diagram Template for PowerPoint & Google Slides
Process
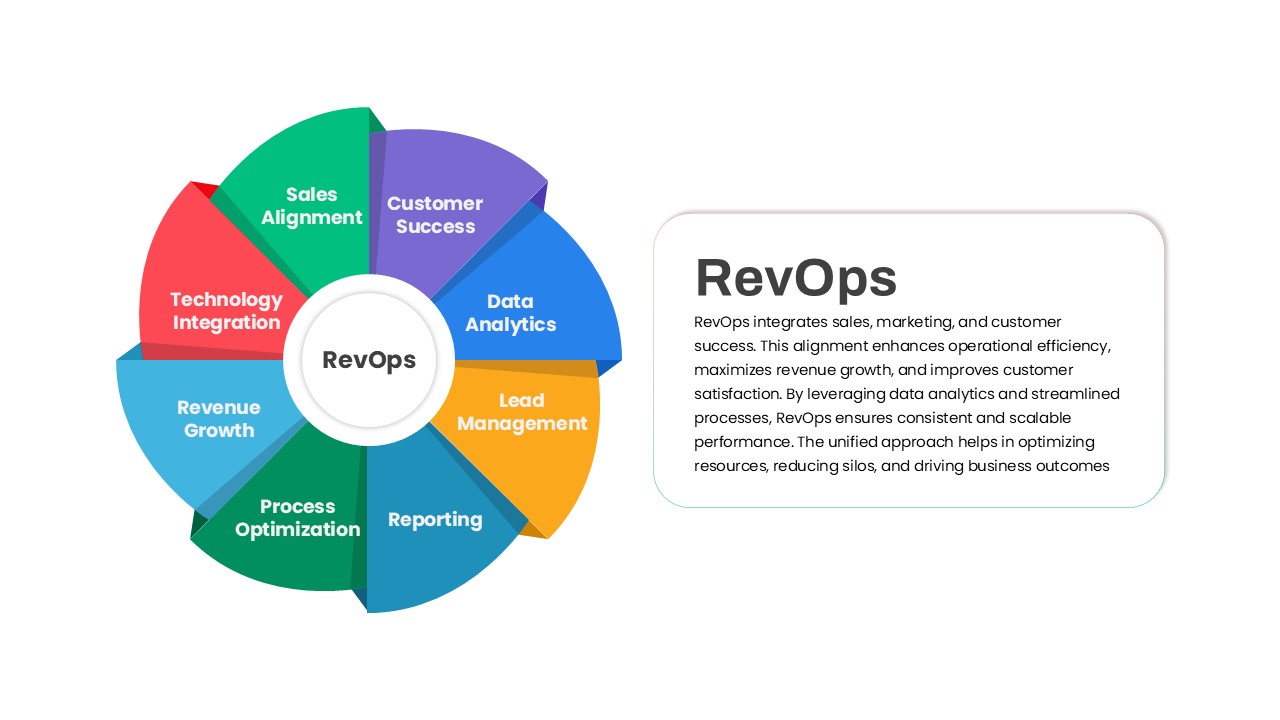
RevOps Revenue Operations Diagram Template for PowerPoint & Google Slides
Revenue
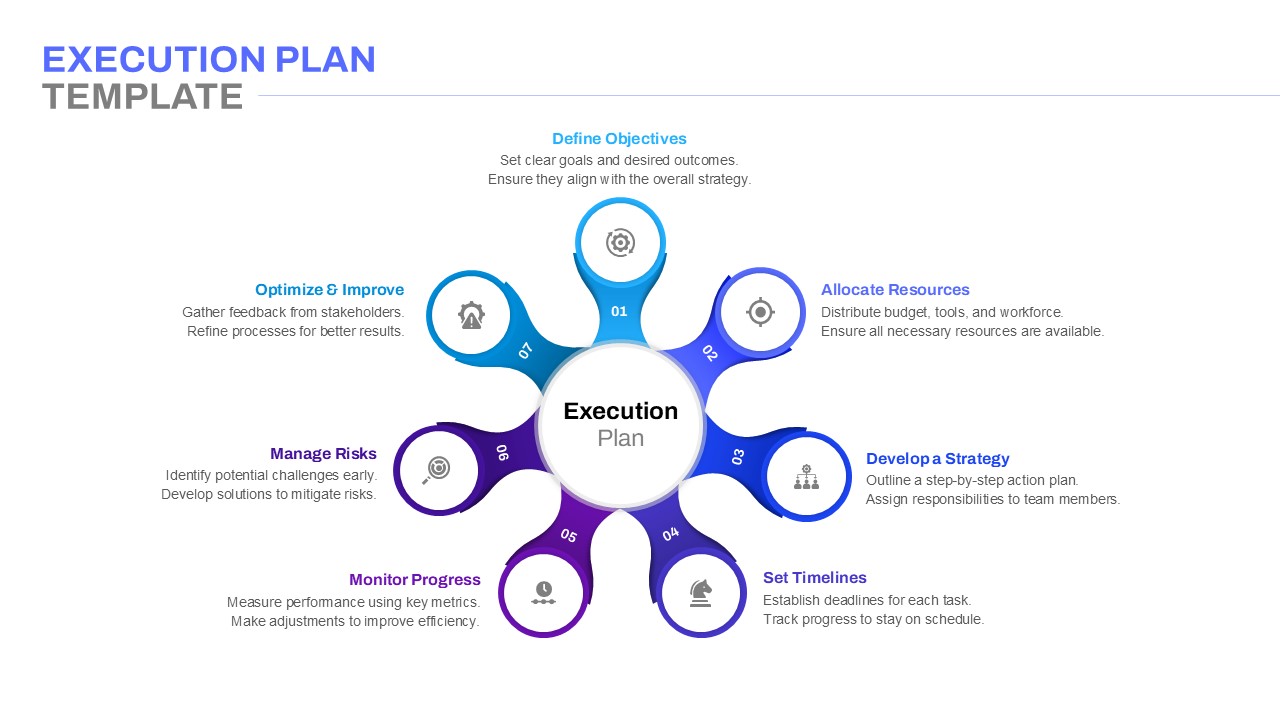
Execution Plan Timeline Diagram Template for PowerPoint & Google Slides
Timeline
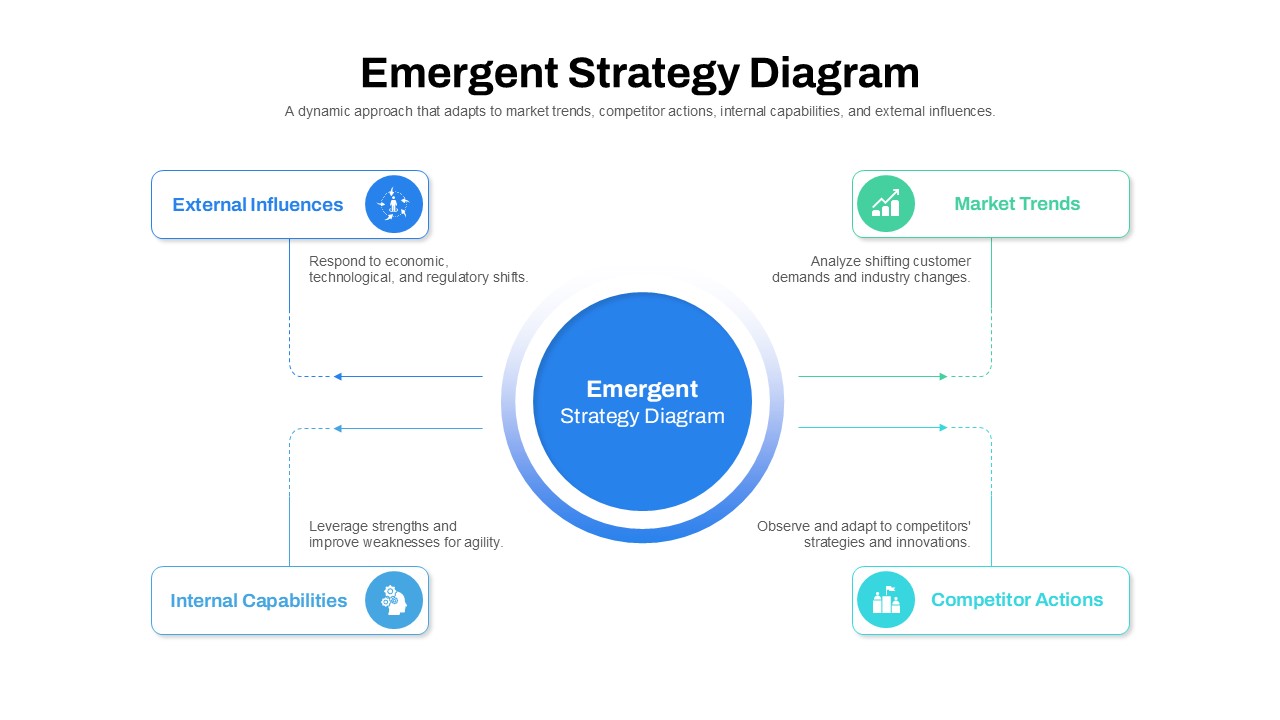
Emergent Strategy Diagram Framework Template for PowerPoint & Google Slides
Process
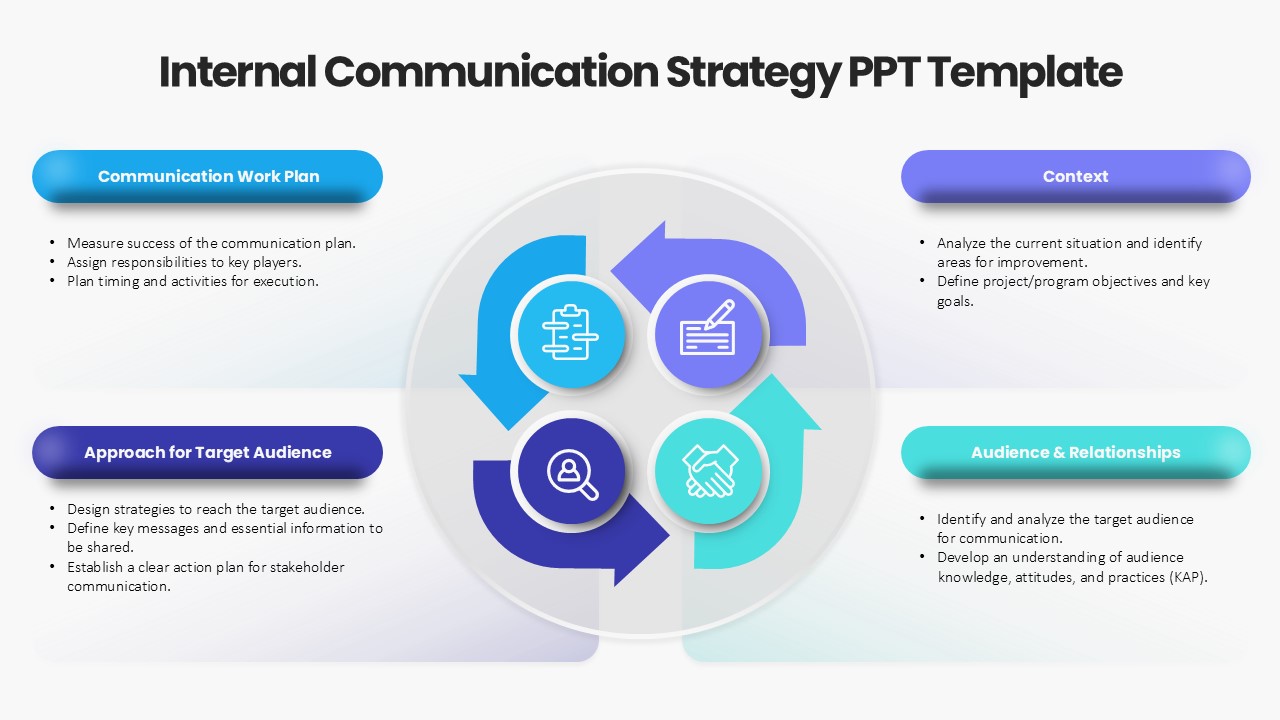
Internal Communication Strategy Diagram Template for PowerPoint & Google Slides
Process
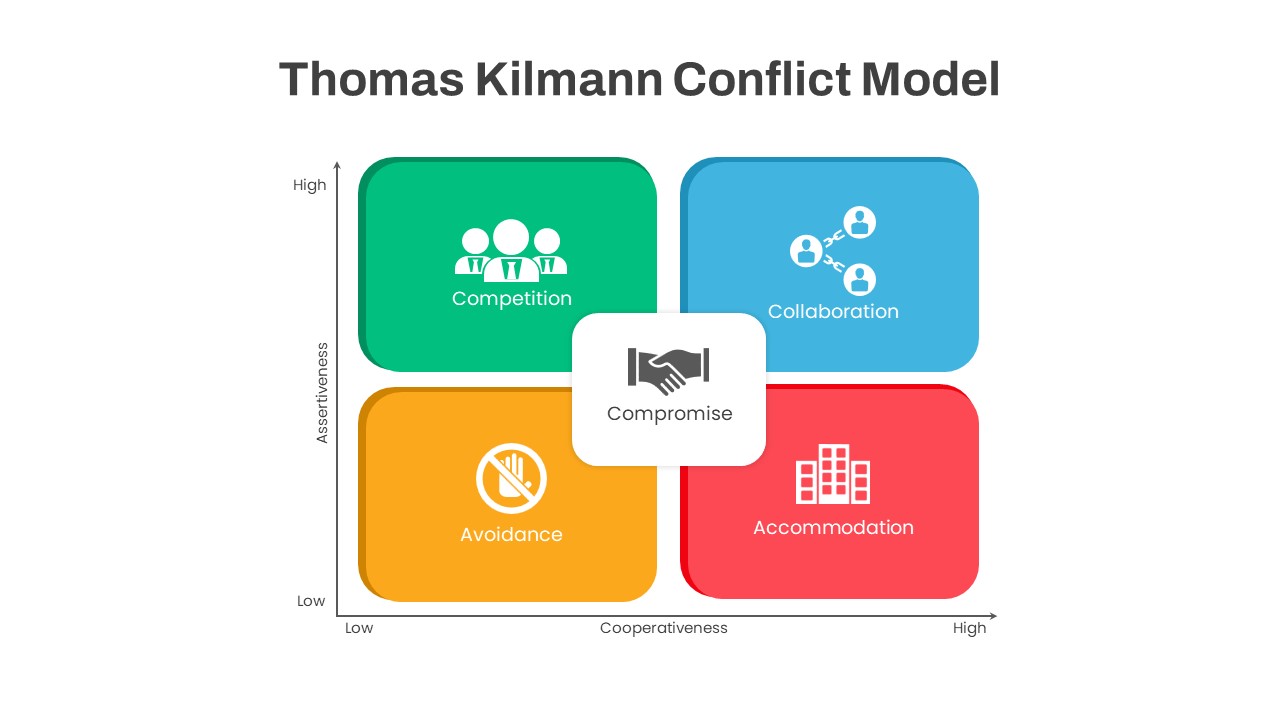
Thomas Kilmann Conflict Model Diagram Template for PowerPoint & Google Slides
Leadership
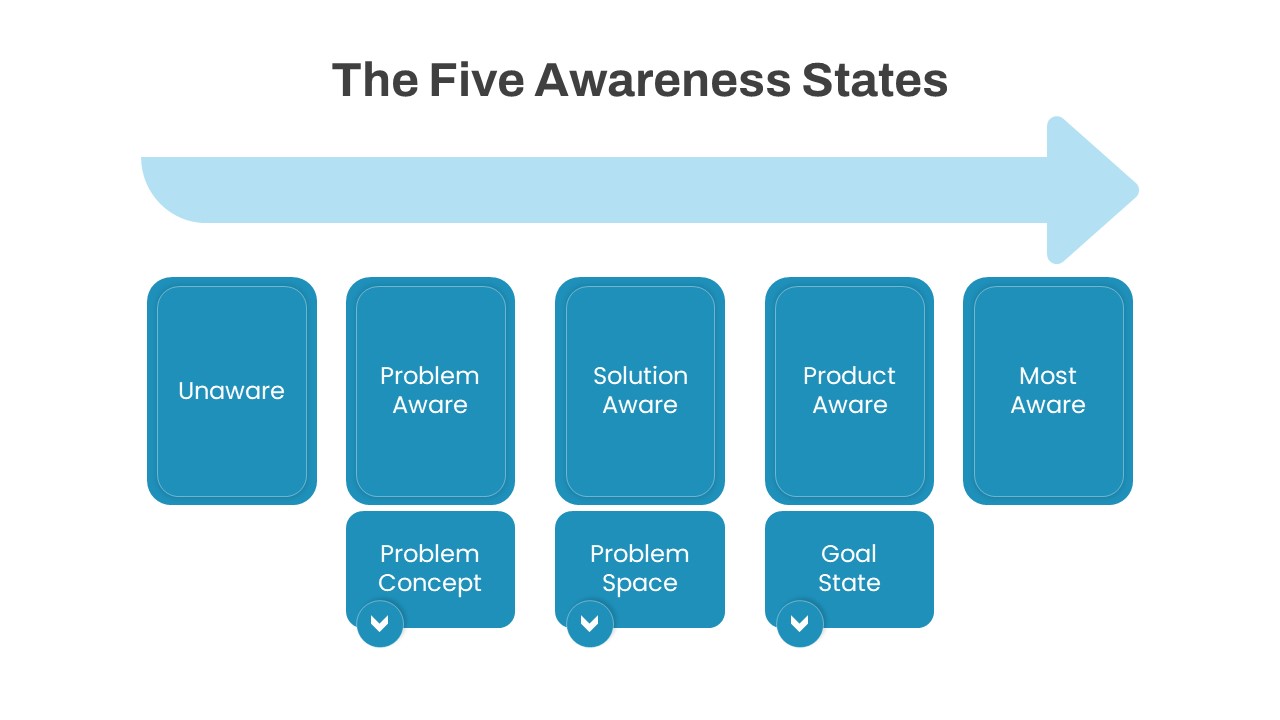
The Five Awareness States diagram template for PowerPoint & Google Slides
Infographics
Market Share Comparison Diagram Template for PowerPoint & Google Slides
Comparison Chart
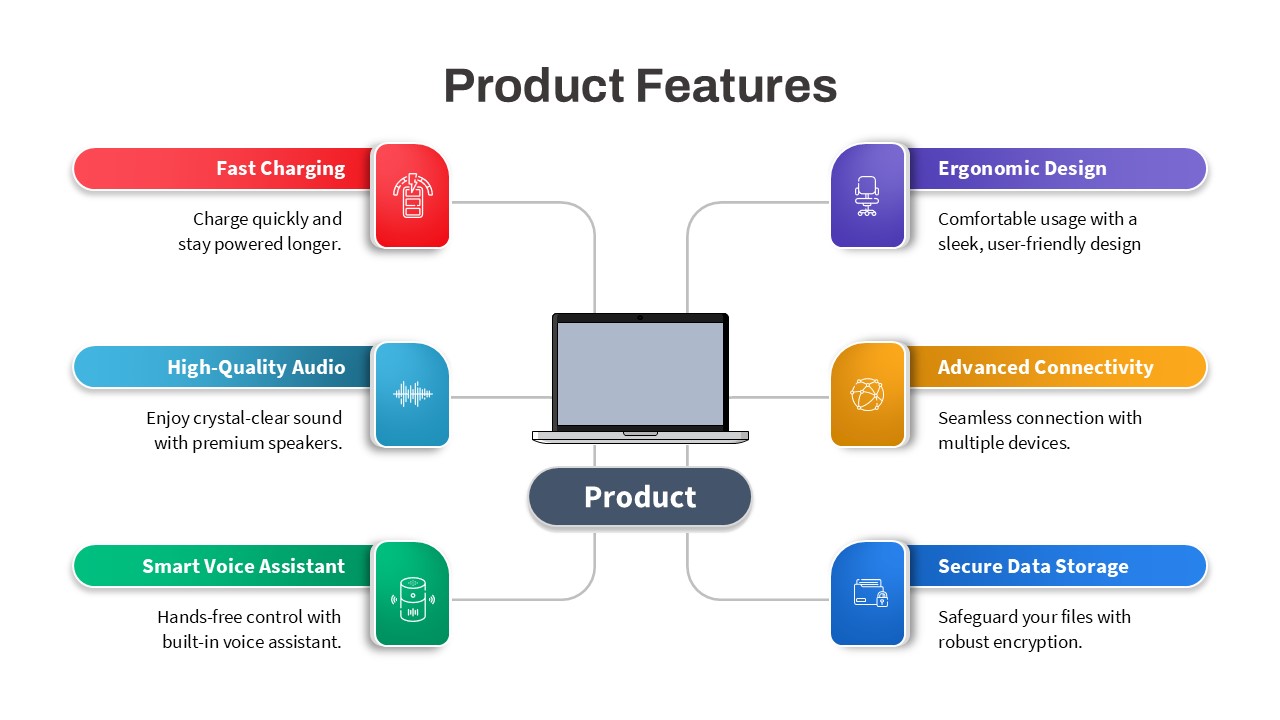
Product Features Diagram Template for PowerPoint & Google Slides
Process

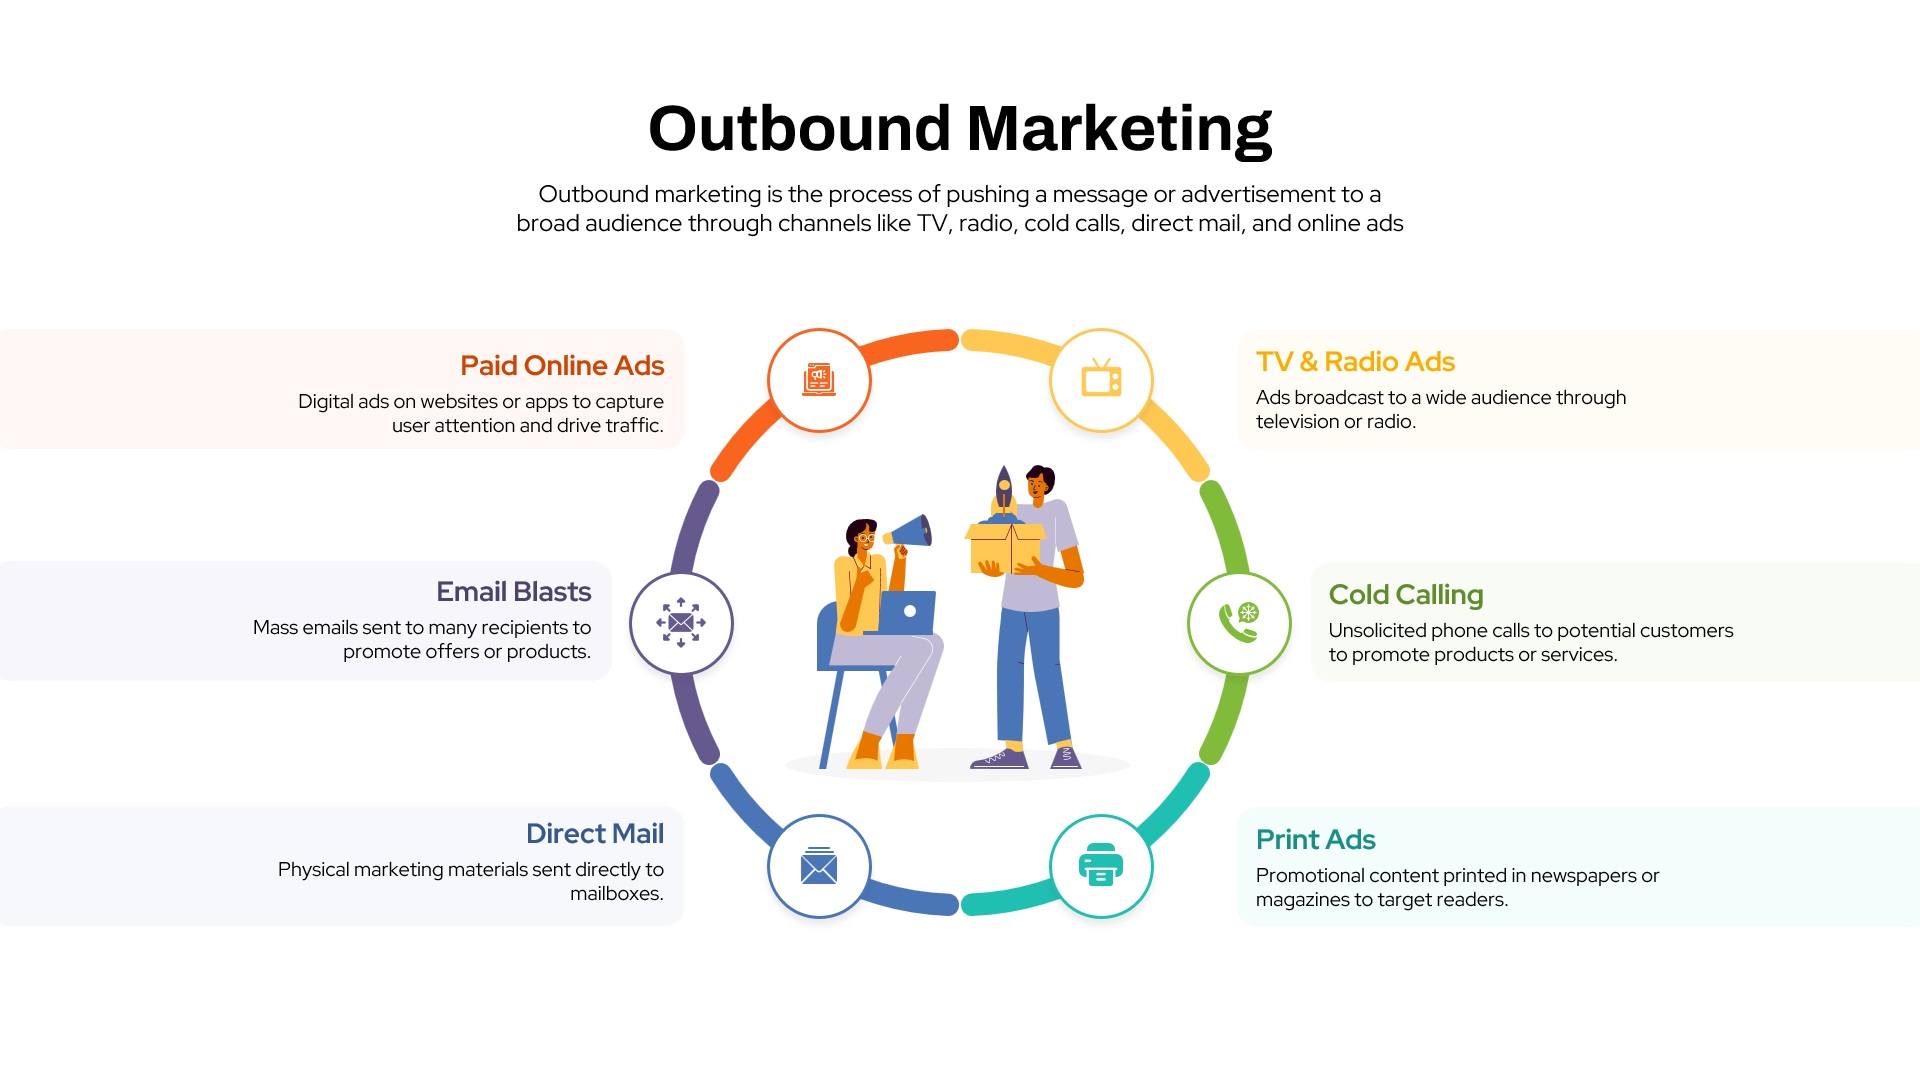
Outbound Marketing Circular Diagram Template for PowerPoint & Google Slides
Advertising
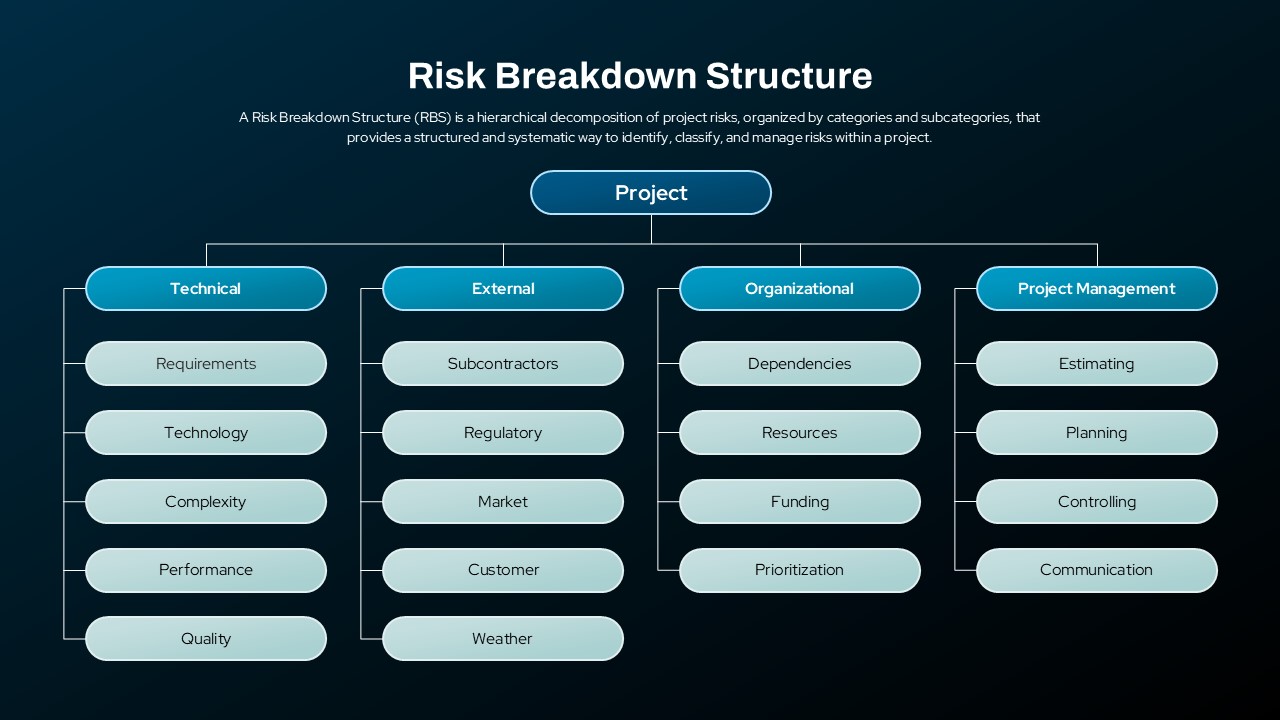
Risk Breakdown Structure Diagram Template for PowerPoint & Google Slides
Org Chart
Flywheel Growth Cycle Diagram Template for PowerPoint & Google Slides
Circular
Q-Learning Process Flow Diagram Template for PowerPoint & Google Slides
Process
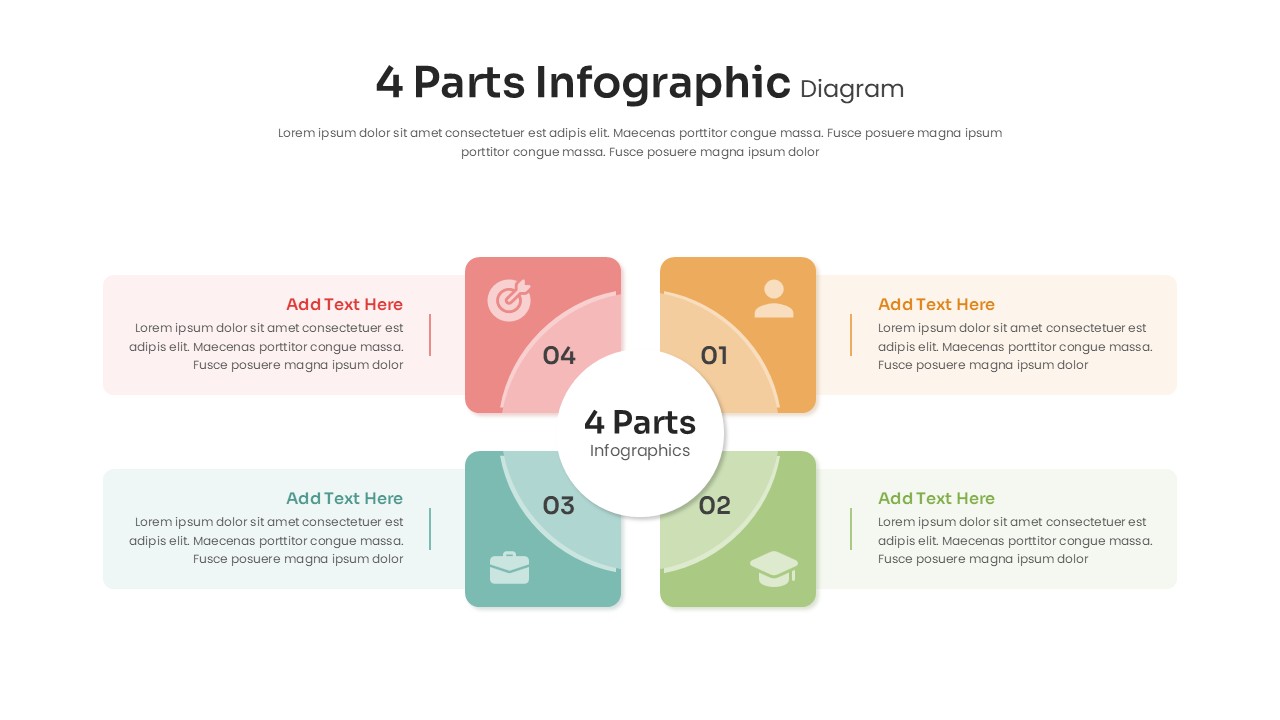
4 Parts Infographic Diagram Template for PowerPoint & Google Slides
Process
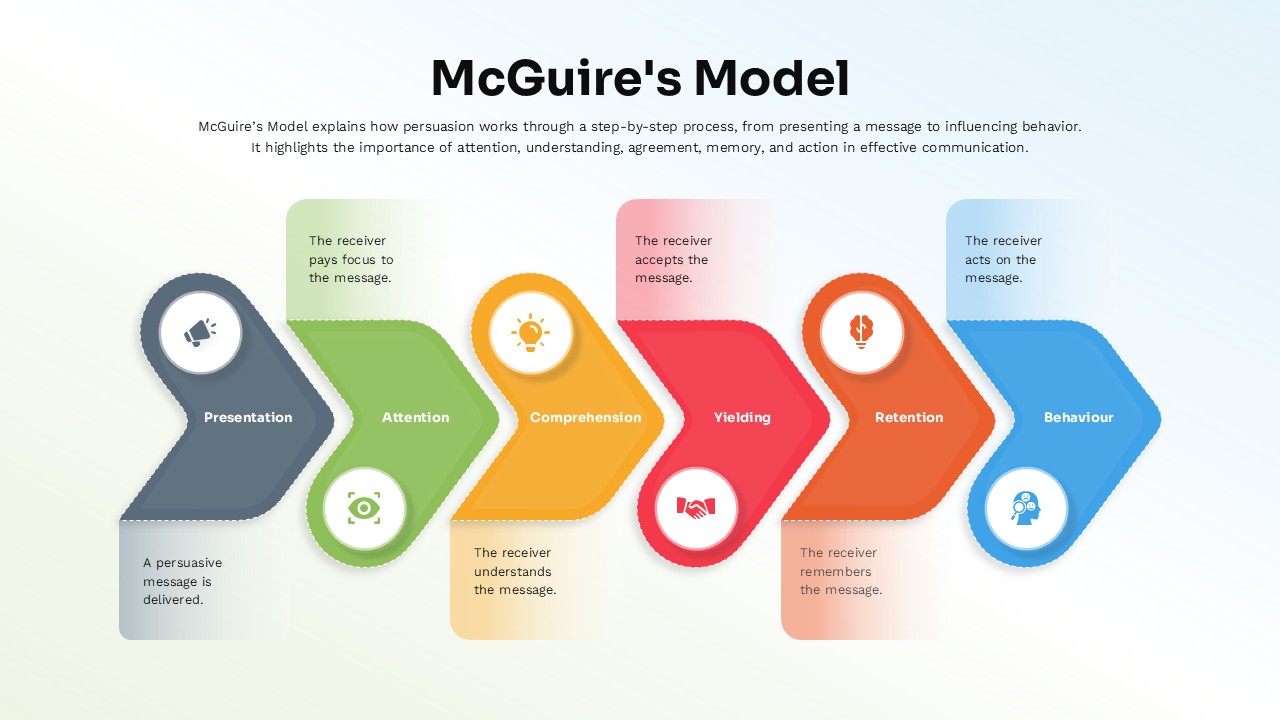
McGuire’s Persuasion Process Flow Diagram Template for PowerPoint & Google Slides
Marketing
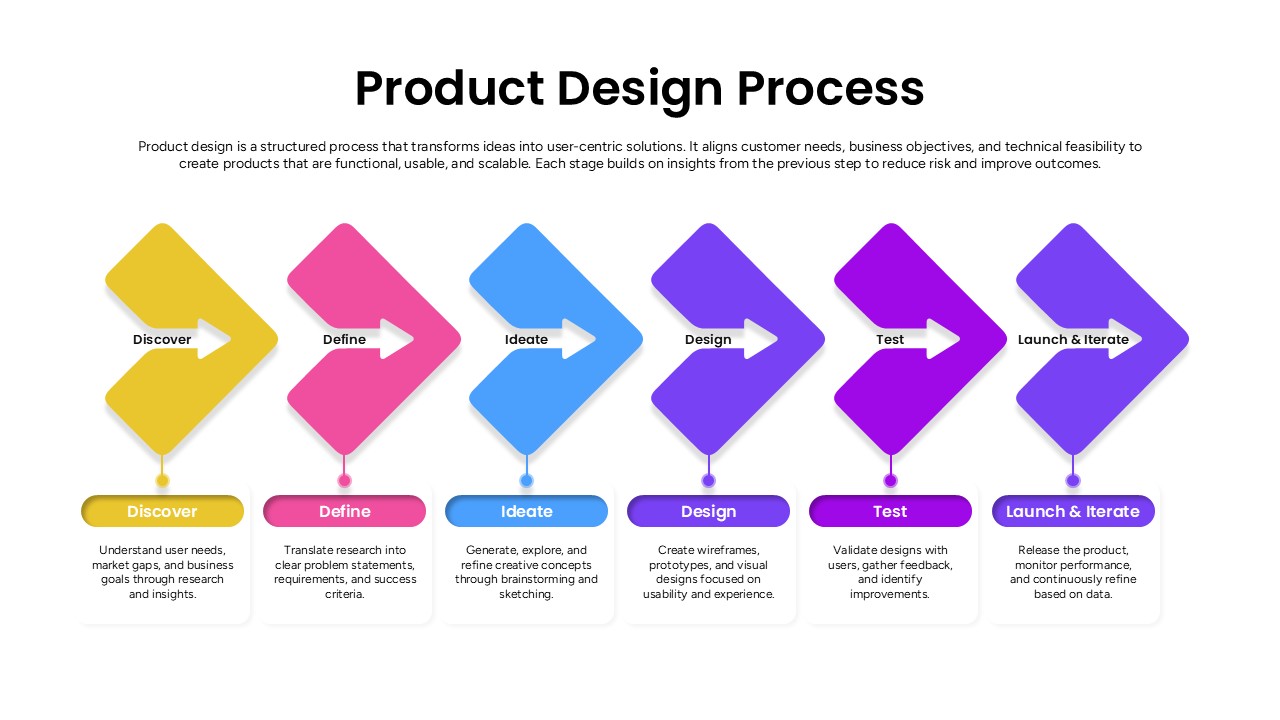
Product Design Process Flow Diagram Template for PowerPoint & Google Slides
Process