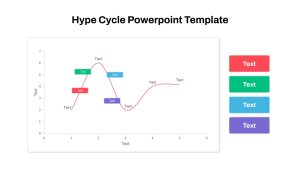
Gartner Hype Cycle Adoption Curve Diagram Template for PowerPoint & Google Slides


Description
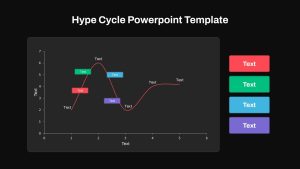
Harness the power of this versatile Gartner Hype Cycle Diagram slide to illustrate technology or product maturity stages with clarity and engagement. Featuring a smooth red curve that maps five distinct phases—from Innovation Trigger and Peak of Inflated Expectations to Trough of Disillusionment, Slope of Enlightenment, and Plateau of Productivity—this slide includes editable, color-coded callouts in red, green, teal, and purple for labeling each stage. Rounded legend callouts on the right side support quick visual reference, and axis labels can be renamed to suit any data dimension. A clean white background, minimalist axis labels, and subtle shadows deliver a modern, professional look.
Built on master slides in PowerPoint and Google Slides, this diagram offers full customization: adjust curve thickness, redefine axis scales, and swap callout colors or positions to align with your brand palette. Edit placeholder text for each phase, insert icons, or modify marker shapes to highlight critical insights. The slide’s intuitive structure supports grouping, alignment, and rapid reordering of callouts, ensuring consistent spacing and style across your deck. Adjust typography, font sizes, and colors globally via slide master, ensuring seamless updates and brand consistency. Replace callout backgrounds with gradient or flat fill options to match your design aesthetic. With full-resolution integrity and cross-platform compatibility, this asset eliminates formatting issues during remote presentations, client meetings, or printed reports.
Ideal for innovation leaders, technology strategists, product managers, and investors, this Hype Cycle template streamlines the presentation of market forecasts, research findings, and risk analyses. Use it to drive executive briefings, stakeholder updates, training workshops, or thought leadership sessions with impactful visuals and structured storytelling. Simply duplicate, resize, or reorder callouts to adapt the diagram for adoption studies, trend analyses, or lifecycle comparisons across industries.
Who is it for
Innovation leaders, technology strategists, product managers, and investors will find this Hype Cycle slide invaluable for communicating technology adoption stages, market readiness, and risk analyses. R&D teams, marketing managers, and executive presenters can leverage its clear visual narrative to drive strategic decision-making.
Other Uses
Repurpose this diagram for product lifecycle mapping, market forecast presentations, performance trend analyses, stakeholder education, or research whitepapers. Adapt callouts to show KPI milestones, sales cycle stages, training roadmaps, or change management workflows.
Login to download this file

Item ID
SB04467
Related Templates

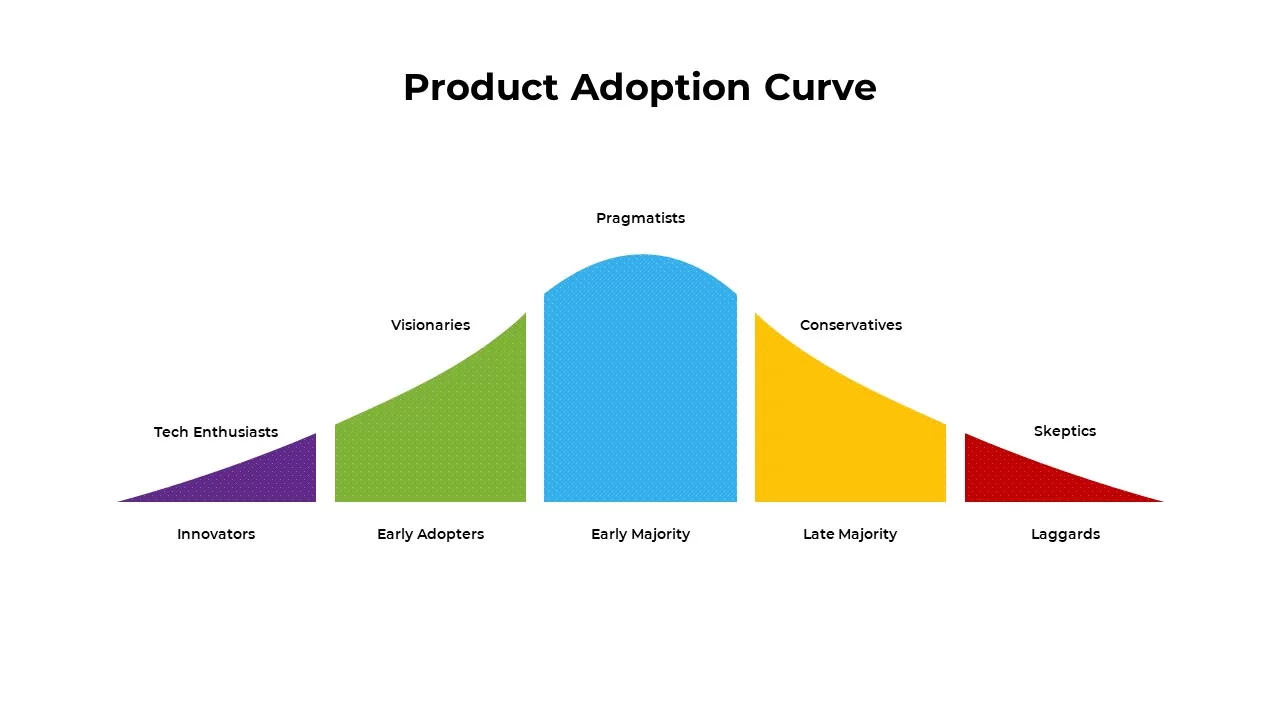
Product Adoption Curve Template for PowerPoint & Google Slides
Process
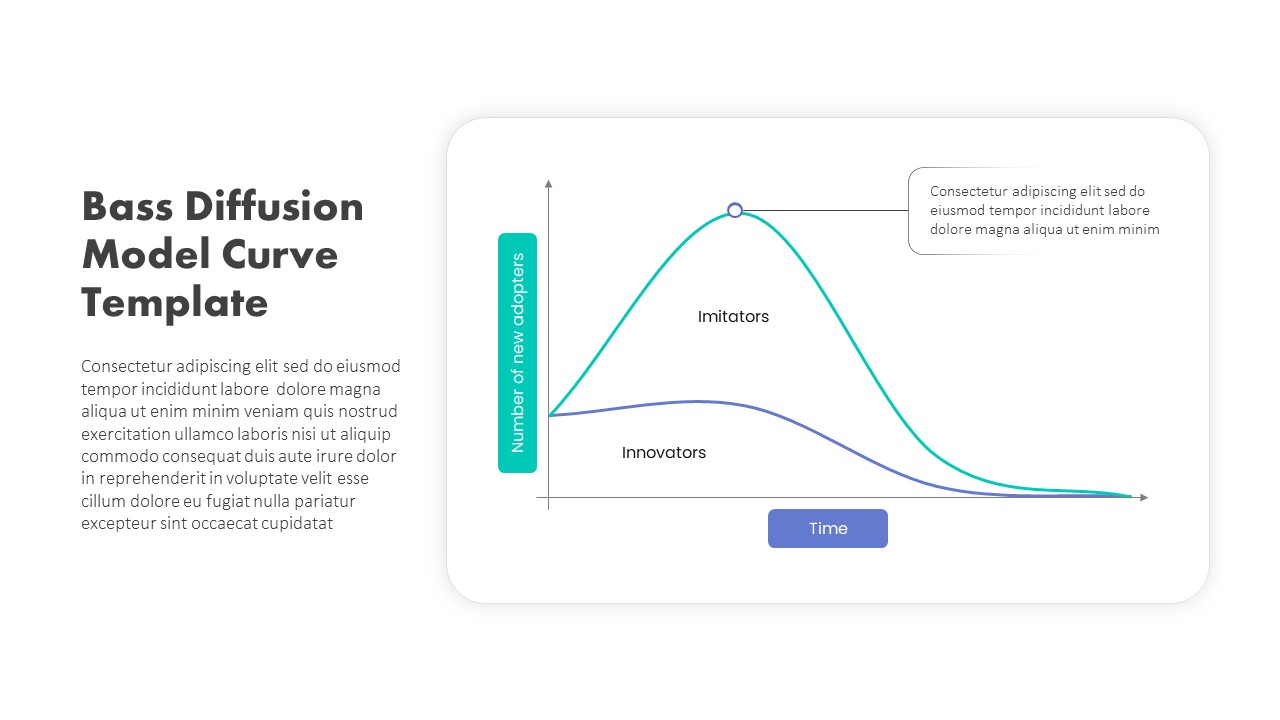
Bass Diffusion Model Curve for Adoption Template for PowerPoint & Google Slides
Comparison Chart

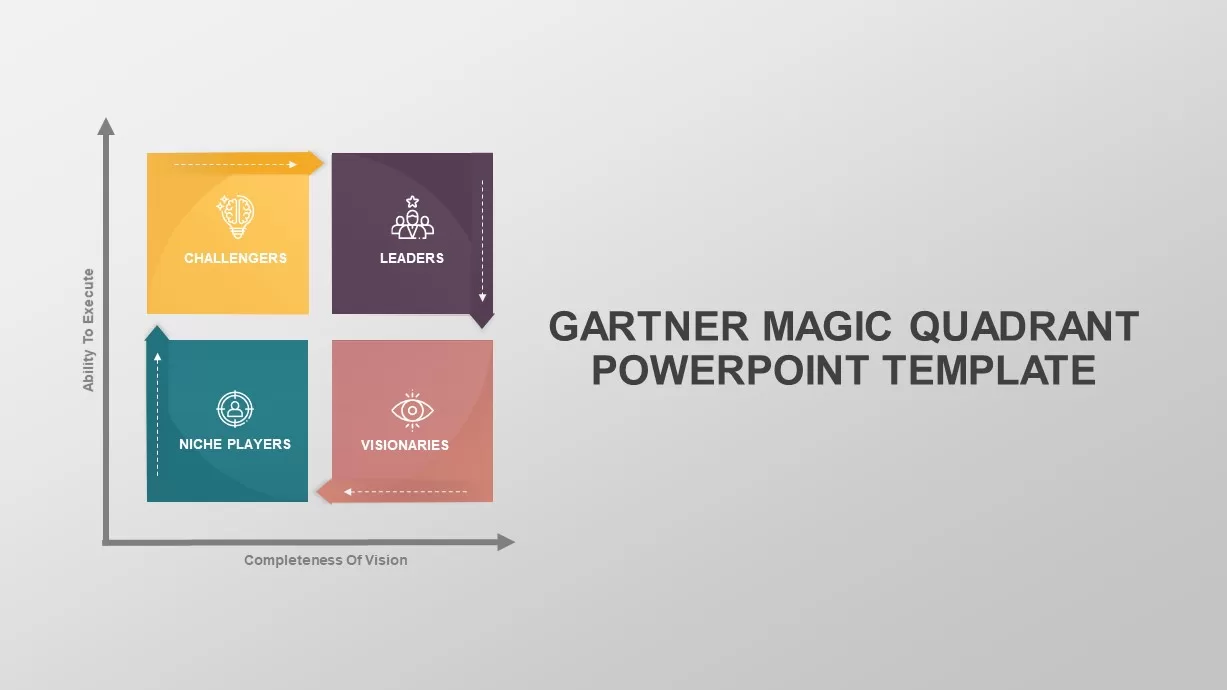
Gartner Magic Quadrant Analysis Template for PowerPoint & Google Slides
Business
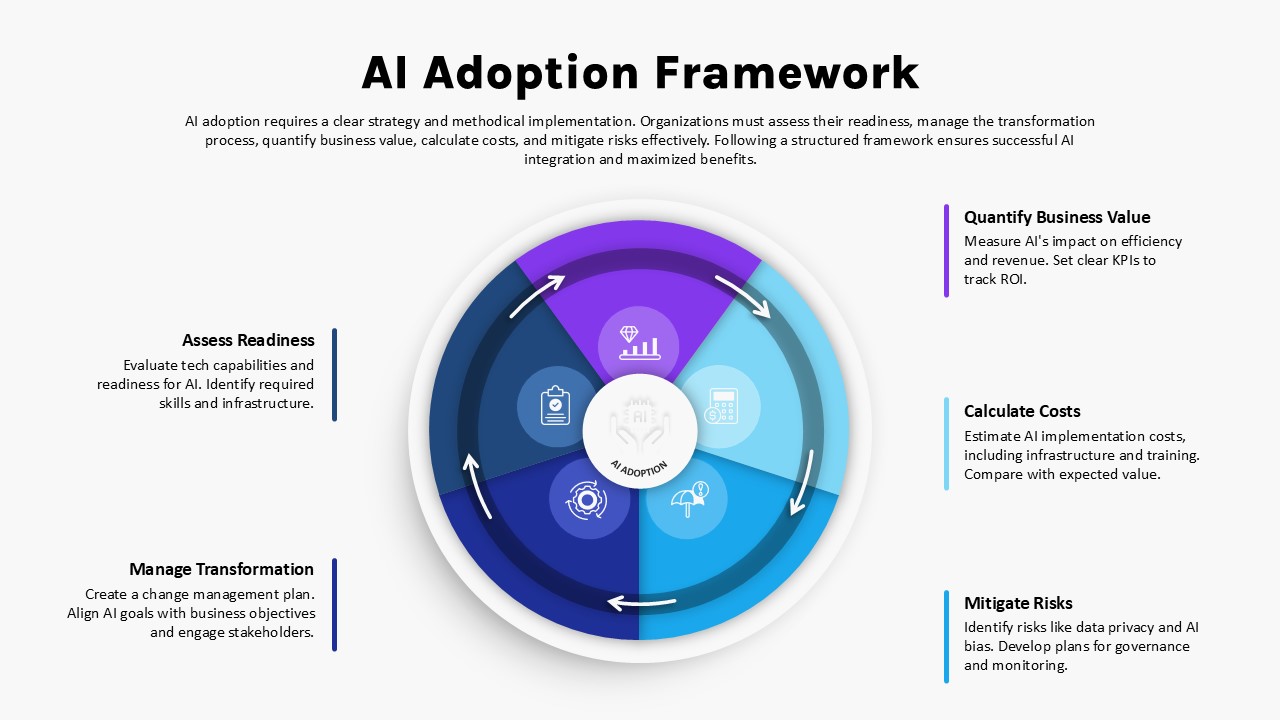
AI Adoption Framework Circular Diagram Template for PowerPoint & Google Slides
AI
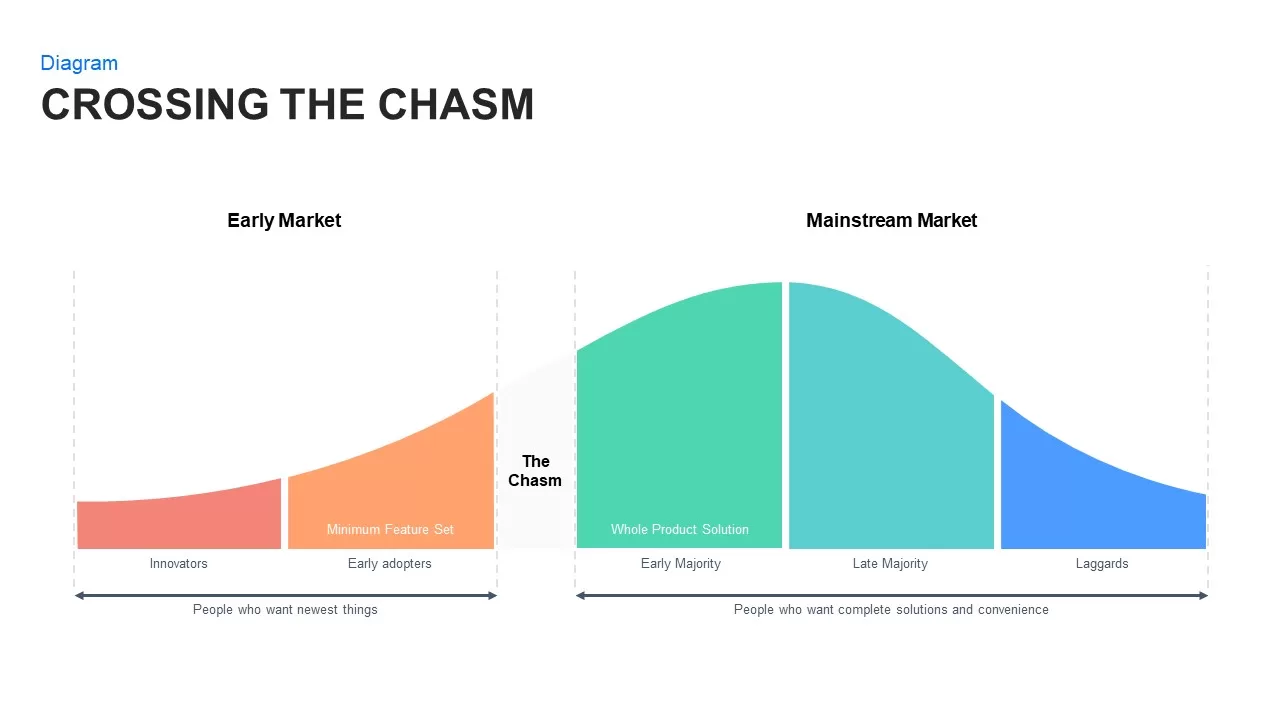
Crossing the Chasm: Technology Adoption Lifecycle template for PowerPoint & Google Slides
Business Strategy
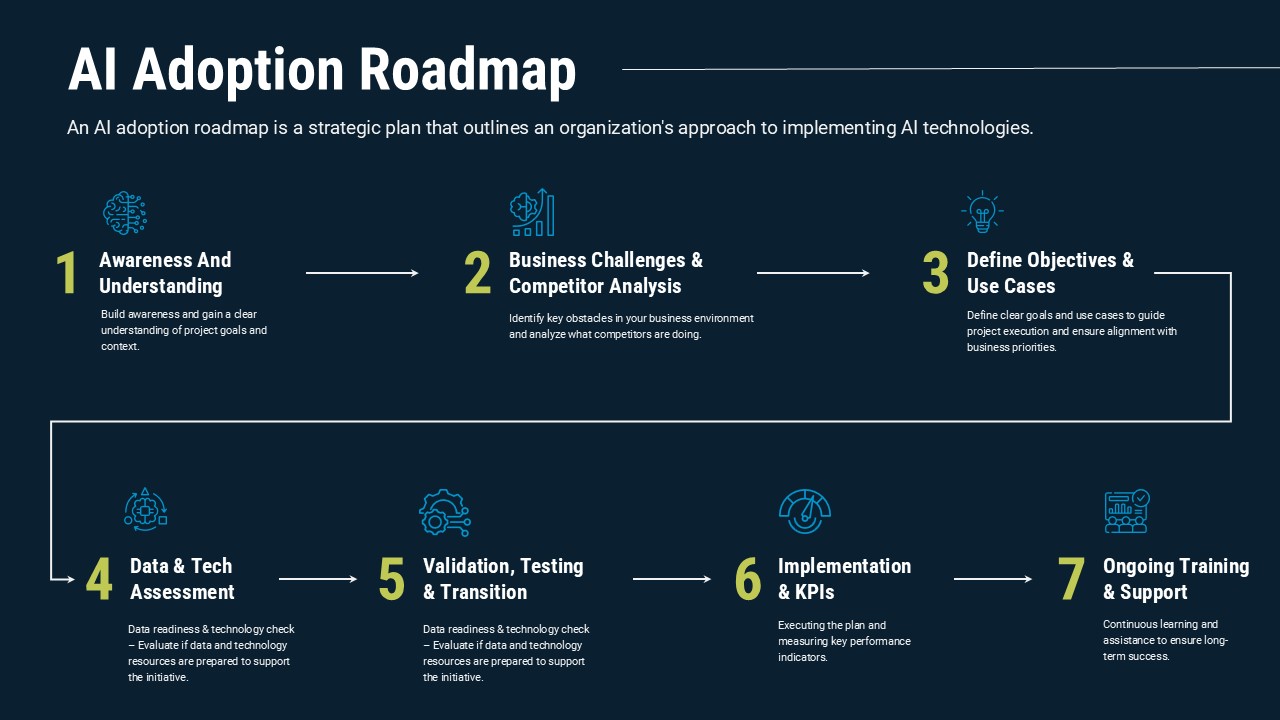
AI Adoption Roadmap template for PowerPoint & Google Slides
Technology
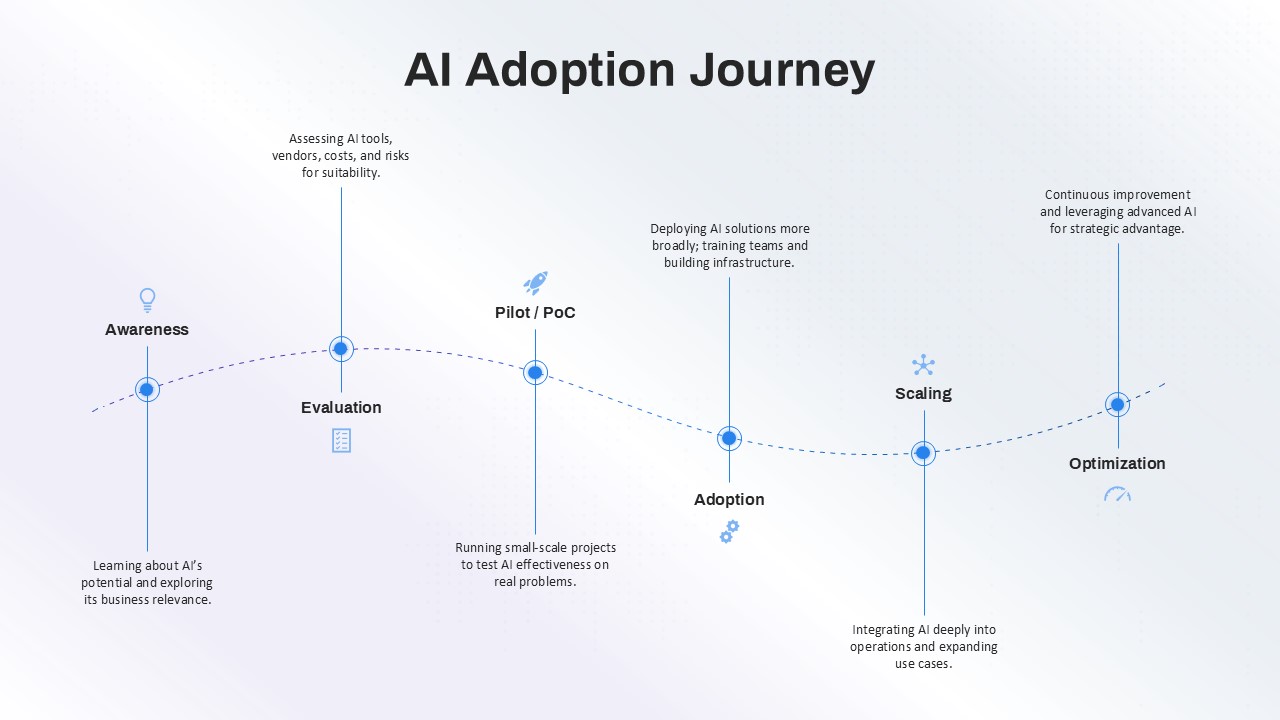
AI Adoption Journey template for PowerPoint & Google Slides
AI
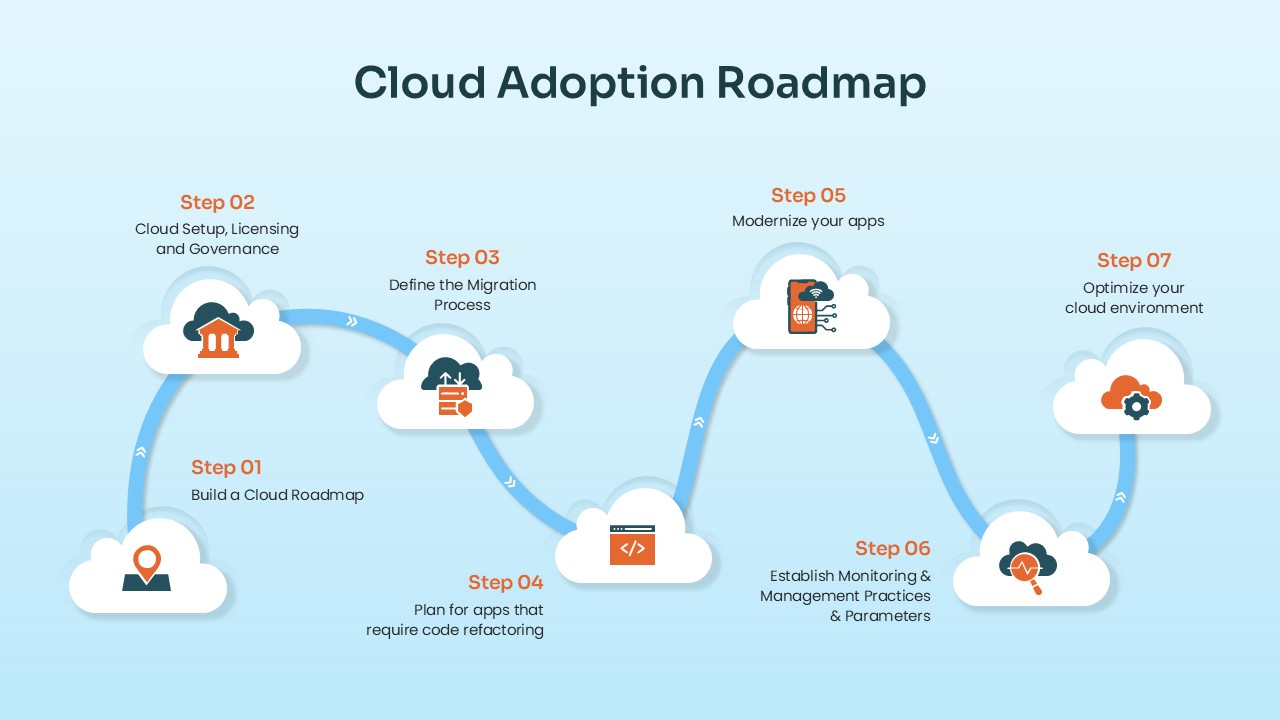
Cloud Adoption Roadmap Steps template for PowerPoint & Google Slides
Cloud Computing
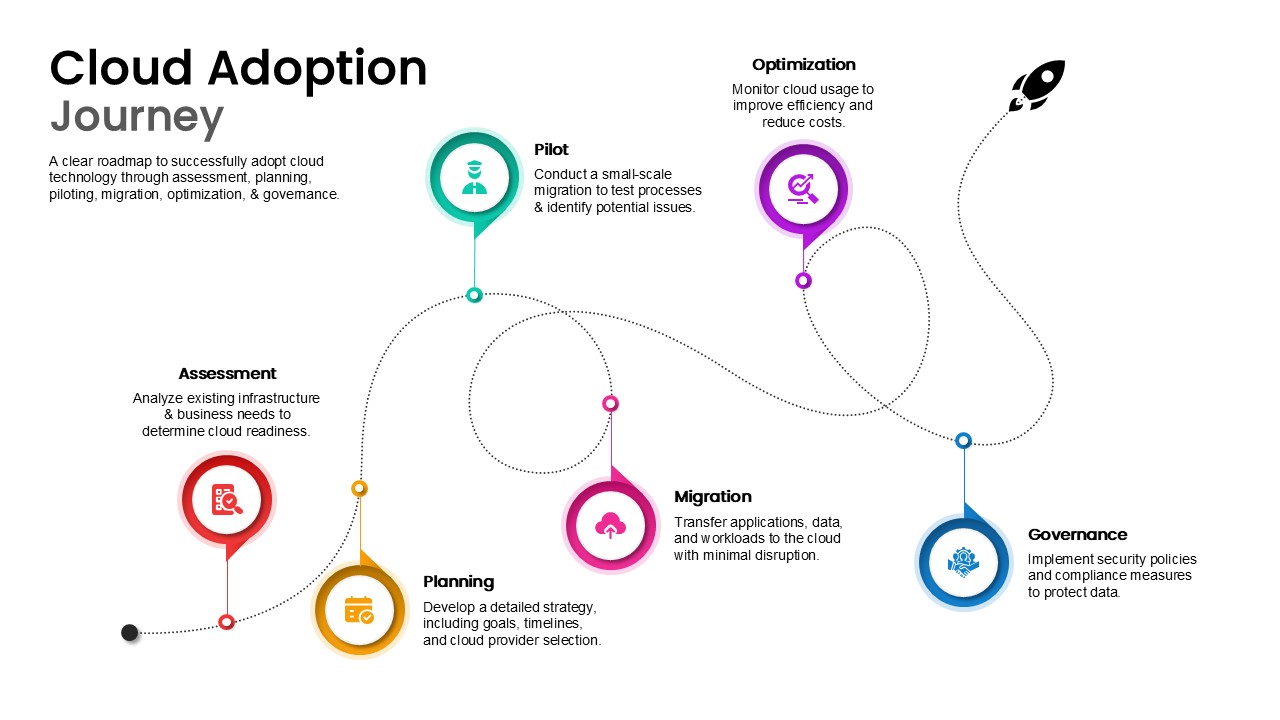
Cloud Adoption Journey Roadmap Template for PowerPoint & Google Slides
Cloud Computing
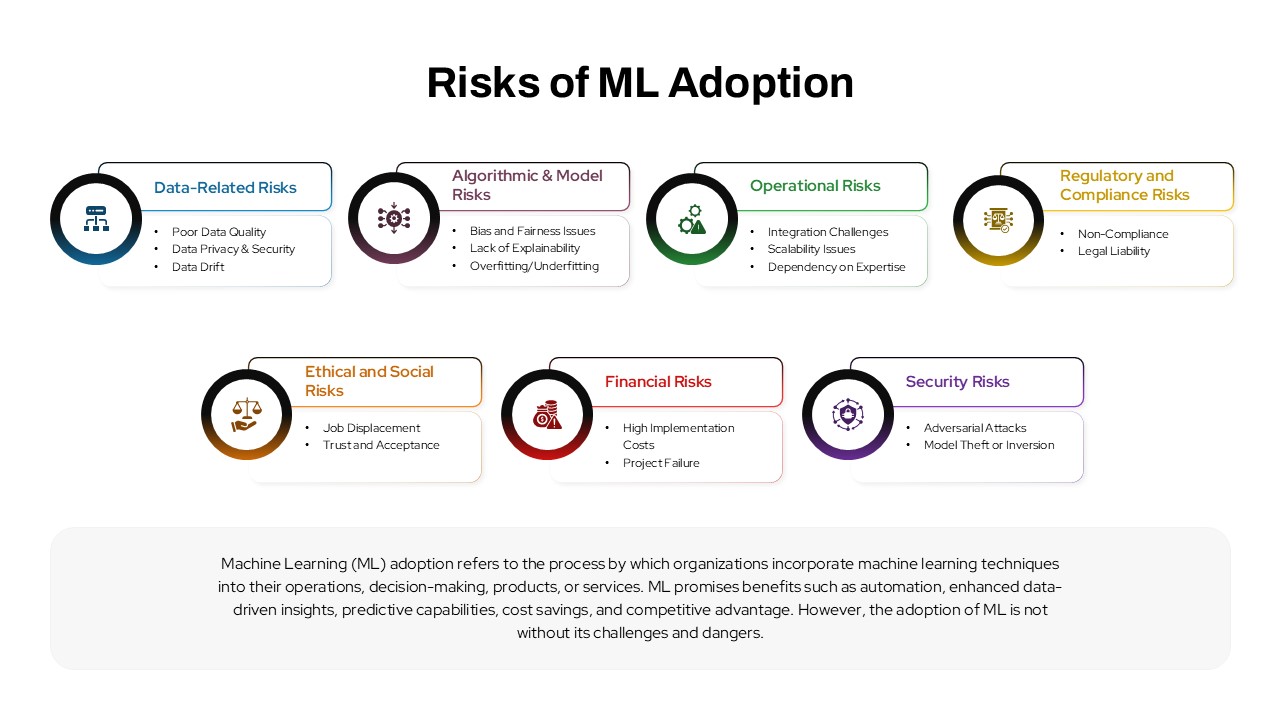
Risks of ML Adoption template for PowerPoint & Google Slides
Information Technology
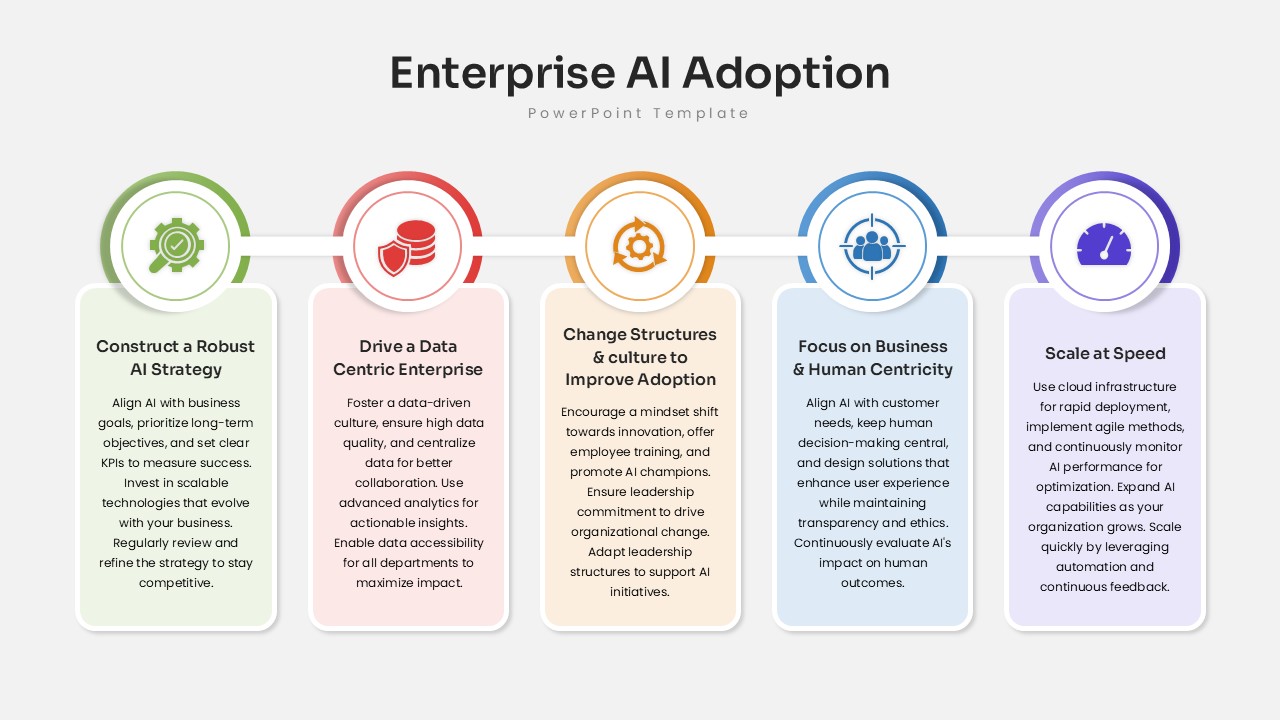
Enterprise AI Adoption Framework Template for PowerPoint & Google Slides
AI
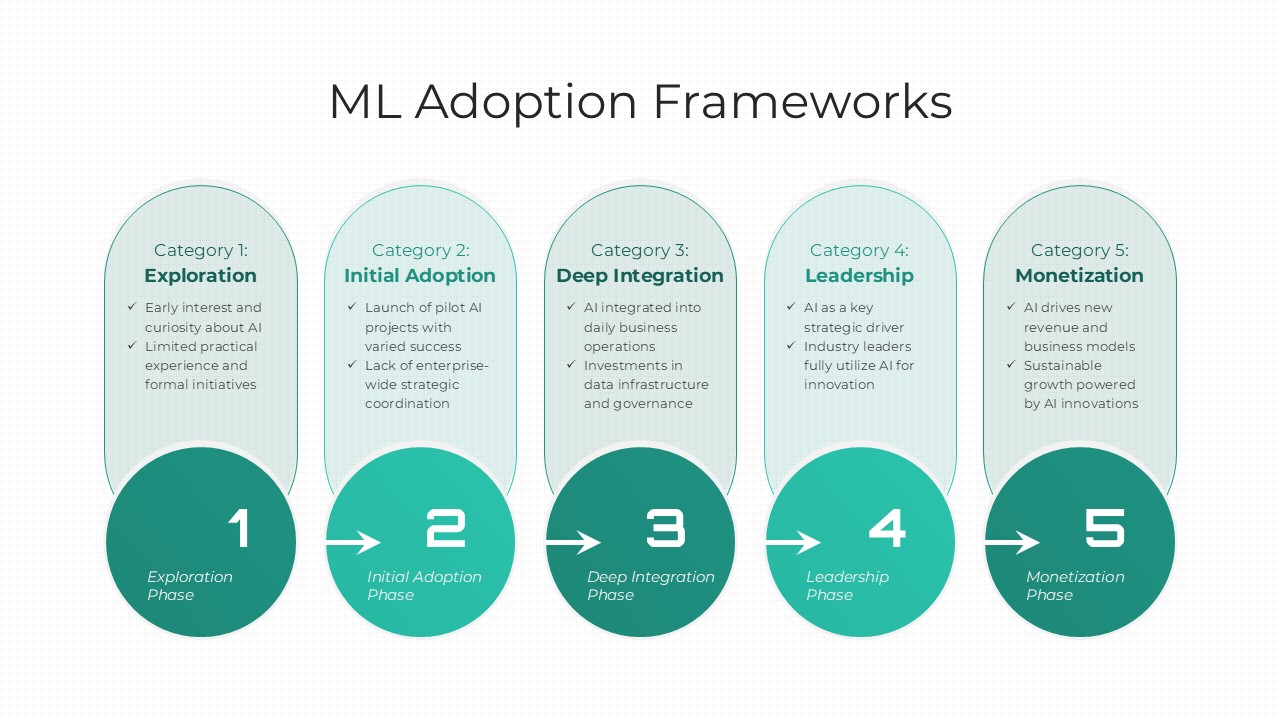
ML Adoption Framework template for PowerPoint & Google Slides
Technology
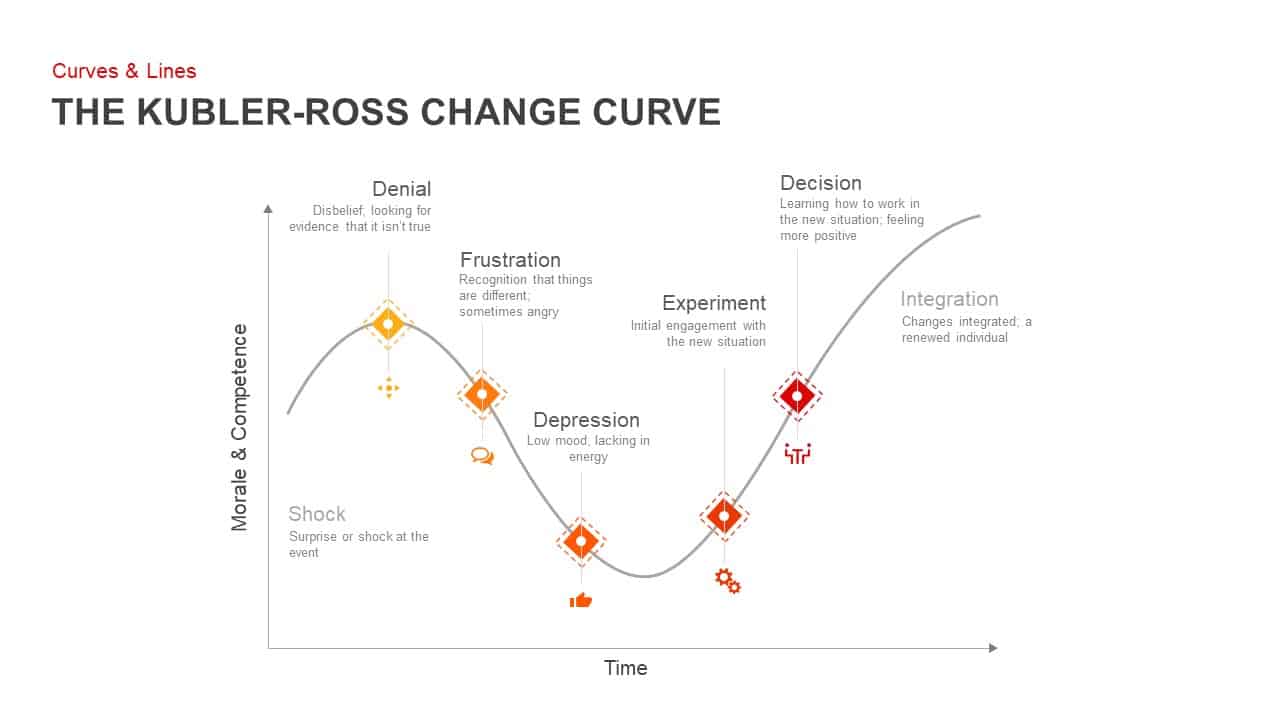
Kubler-Ross Change Curve Diagram Template for PowerPoint & Google Slides
Timeline
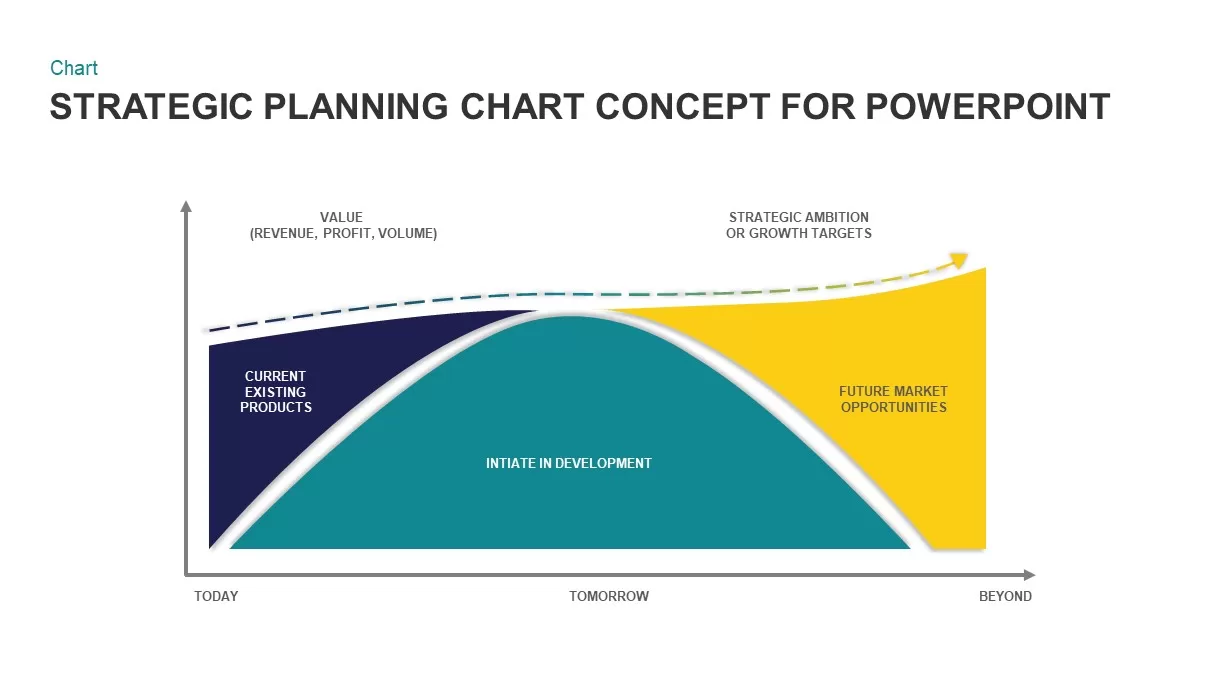
Strategic Planning Curve Diagram Template for PowerPoint & Google Slides
Charts
Snake Shaped Curve Diagram template for PowerPoint & Google Slides
Business
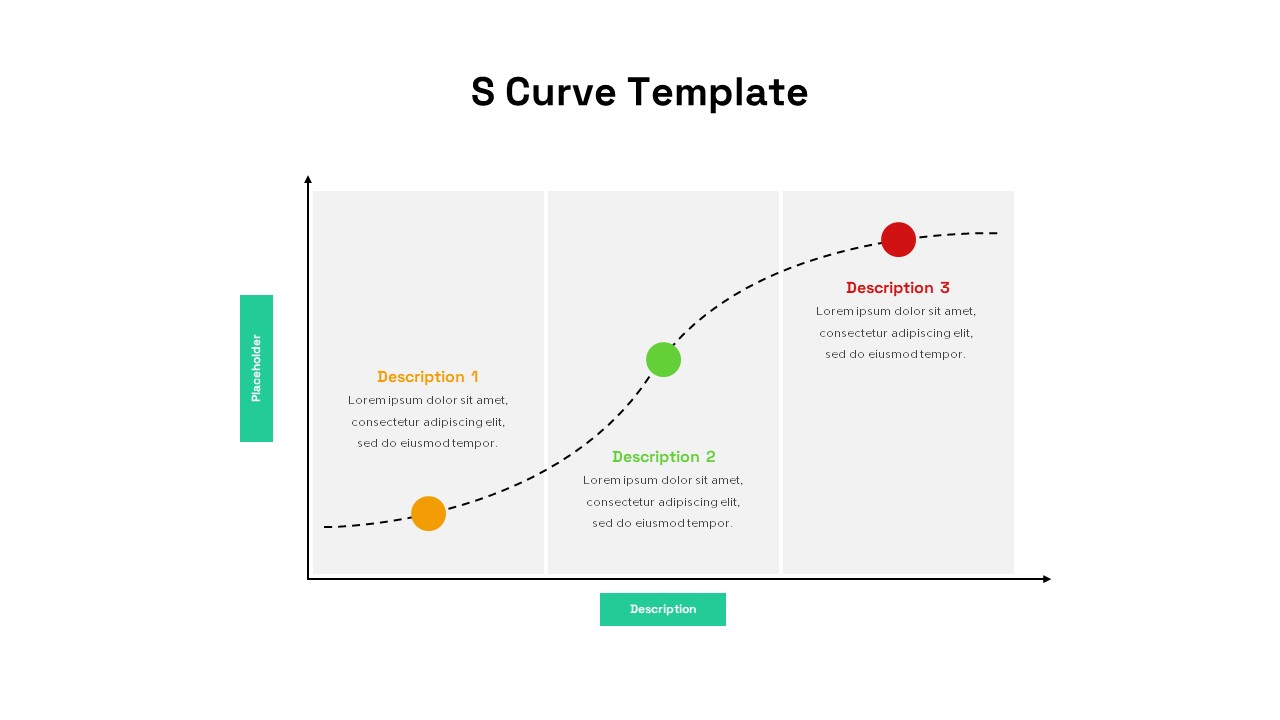
S-Curve Progression Framework Diagram Template for PowerPoint & Google Slides
Charts
Three-Stage S Curve Growth Diagram Template for PowerPoint & Google Slides
Process
Experience Curve Analysis Diagram Template for PowerPoint & Google Slides
Business Strategy
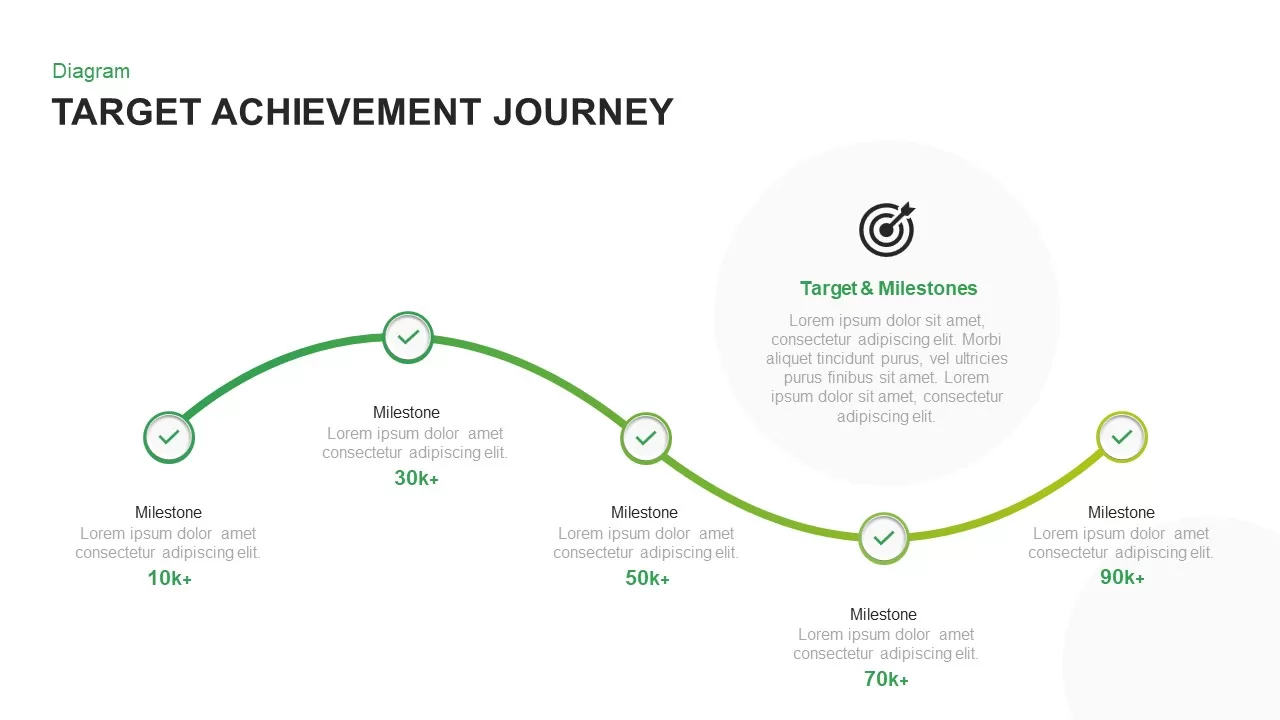
Target Achievement Milestone Curve Template for PowerPoint & Google Slides
Roadmap
Greiner’s Growth Model Curve template for PowerPoint & Google Slides
Infographics
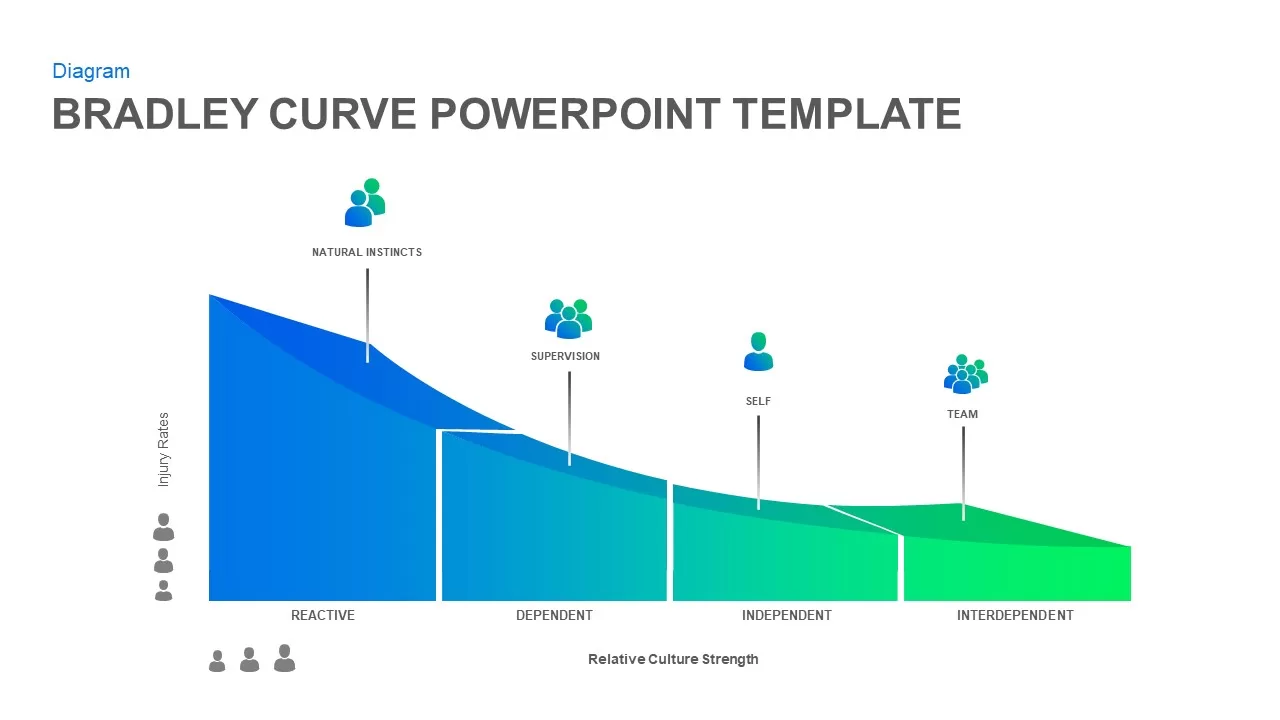
Bradley Curve Infographic Template for PowerPoint & Google Slides
Infographics
8-Bell Curve Infographic Slide Template for PowerPoint & Google Slides
Comparison Chart
Growth Curve Line Chart Visualization Template for PowerPoint & Google Slides
Charts
Economies of Scale Cost Curve Comparison Template for PowerPoint & Google Slides
Comparison Chart
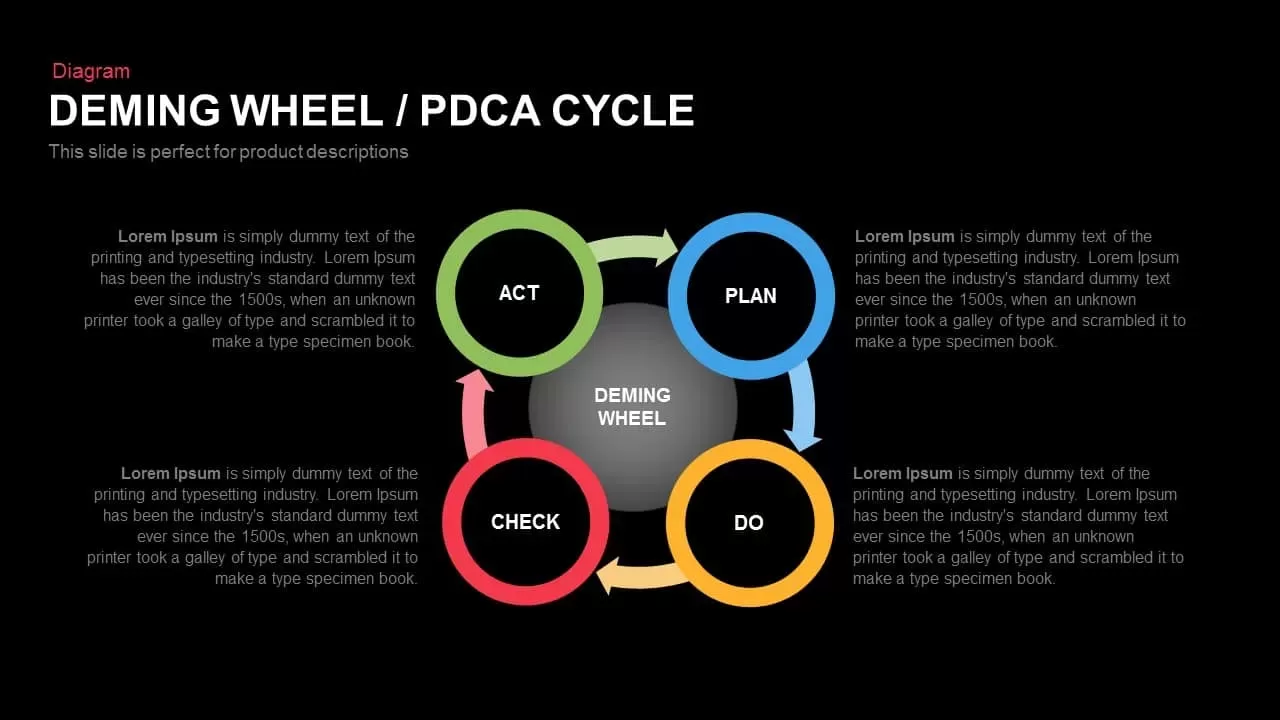
Deming Wheel PDCA Cycle Diagram Template for PowerPoint & Google Slides
Business Plan
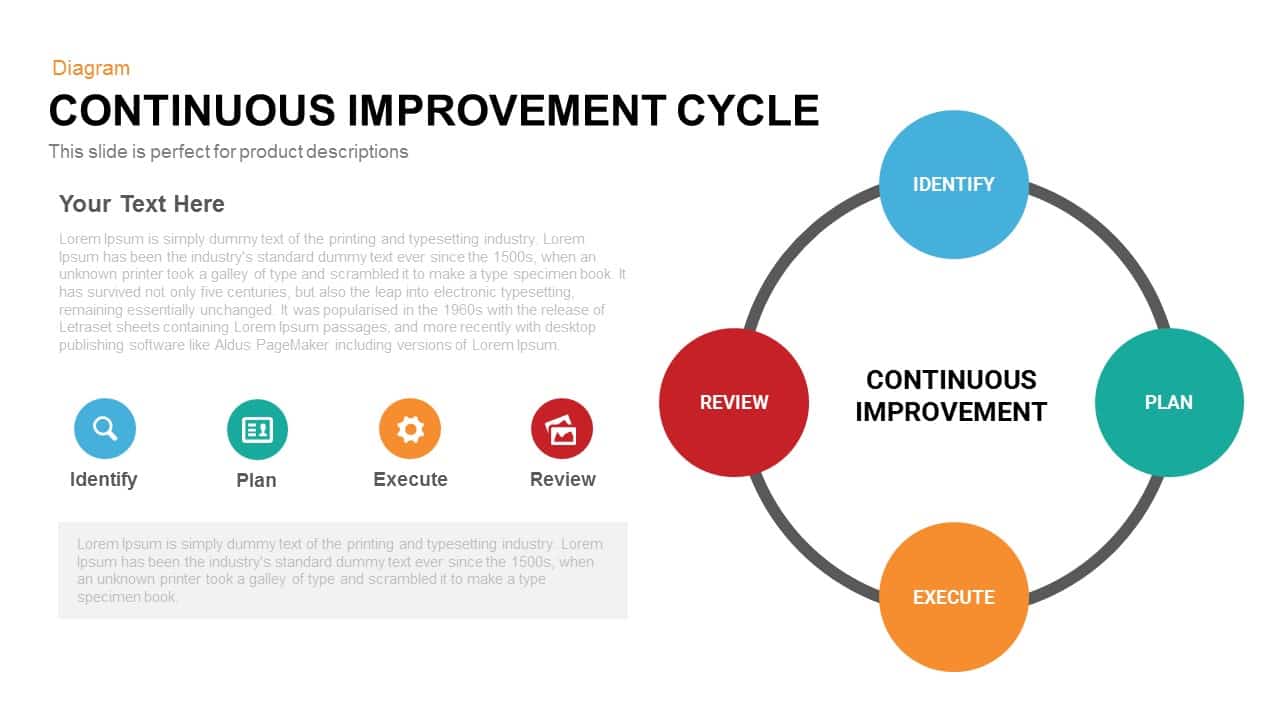
Continuous Improvement Cycle Diagram Template for PowerPoint & Google Slides
Circular
Modern Five-Stage Cycle Process Diagram Template for PowerPoint & Google Slides
Process
Six-Stage Circular Cycle Diagram Template for PowerPoint & Google Slides
Process
Four-Point Arrow Cycle Diagram Template for PowerPoint & Google Slides
Arrow

Data-Driven Marketing Cycle Diagram Template for PowerPoint & Google Slides
Customer Journey
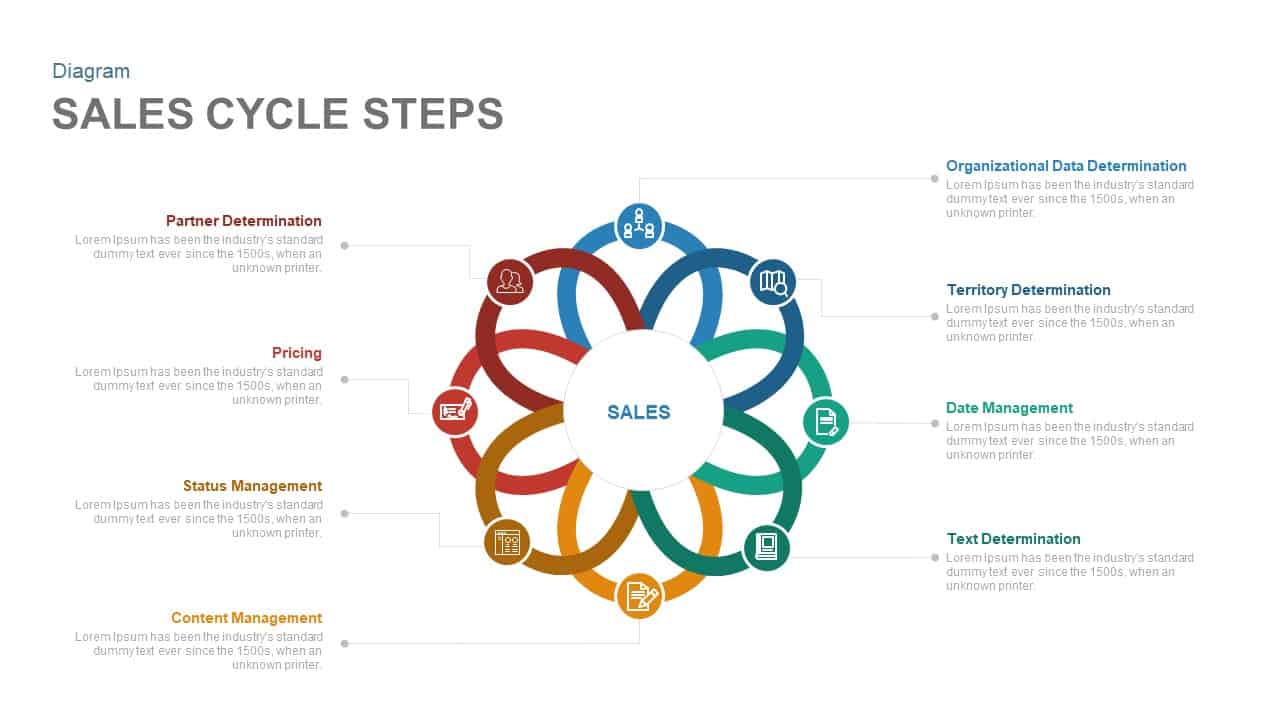
Eight-Step Sales Cycle Diagram Template for PowerPoint & Google Slides
Process
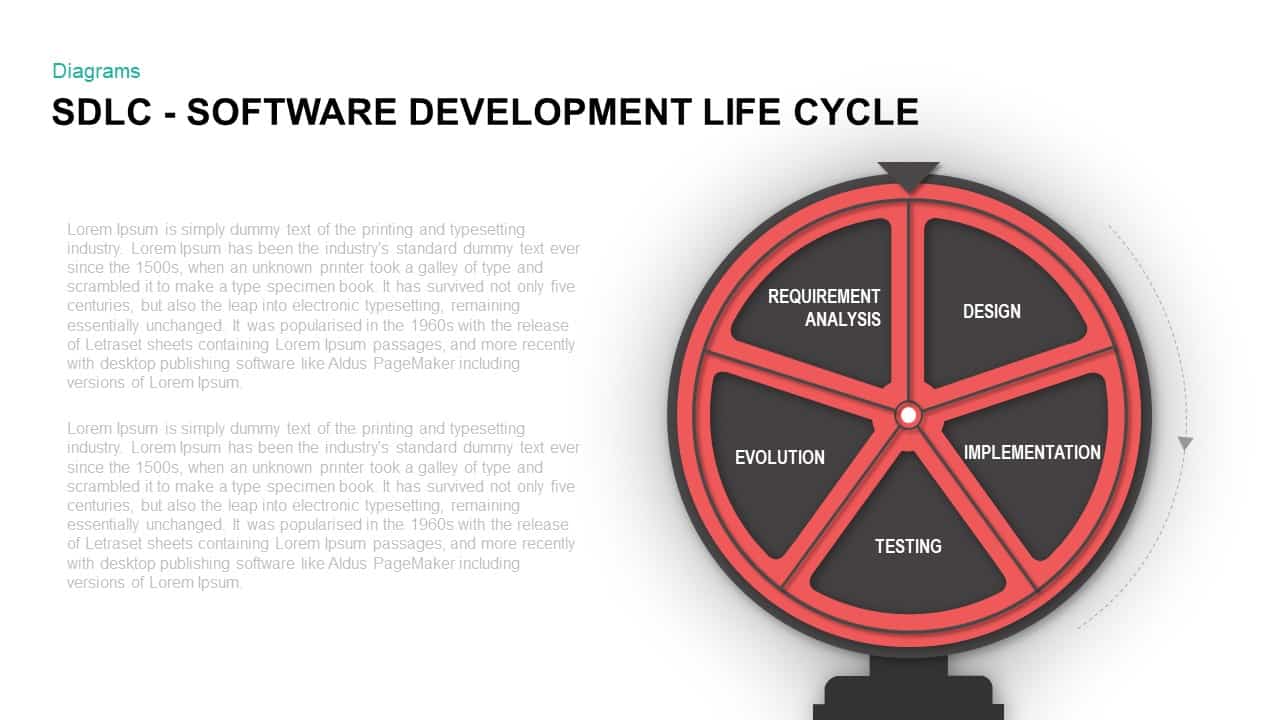
Software Development Life Cycle Diagram Template for PowerPoint & Google Slides
Circular
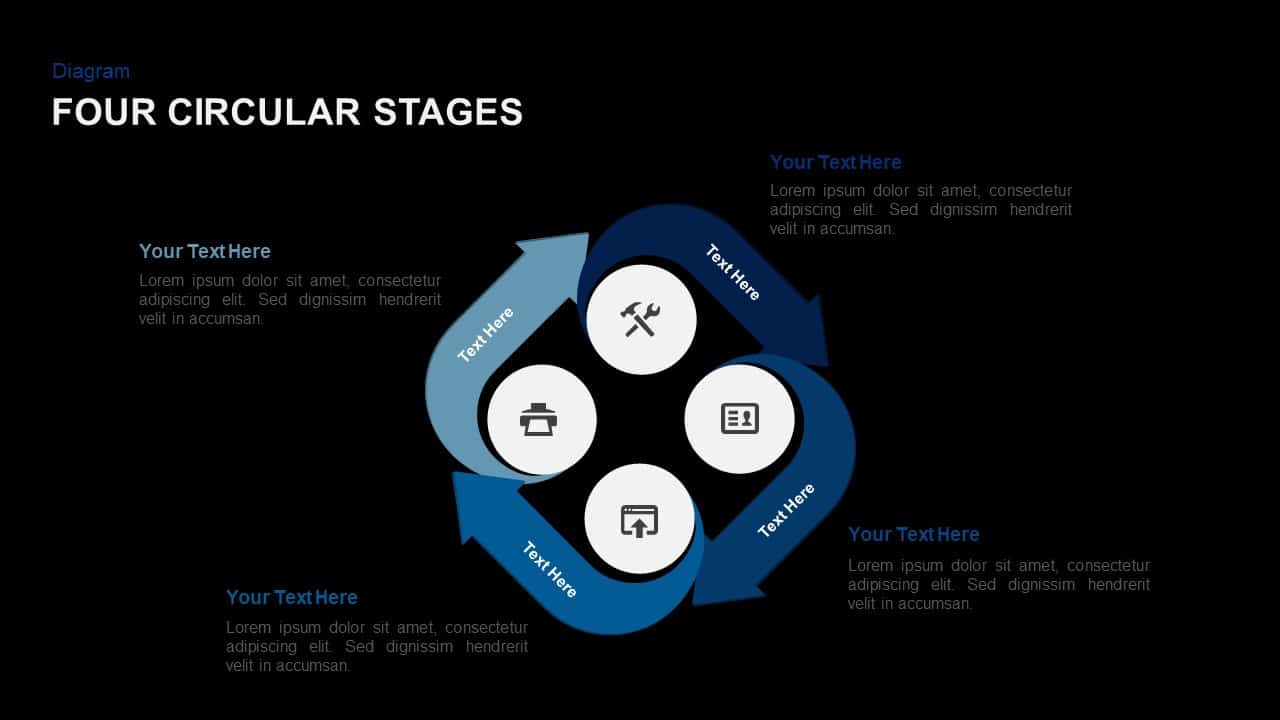
3, 4 & 5 Circular Stages Cycle Diagram Deck Template for PowerPoint & Google Slides
Circular
Four-Stage Cycle Process Diagram Template for PowerPoint & Google Slides
Process
Data Migration Life Cycle Curved Diagram Template for PowerPoint & Google Slides
Process
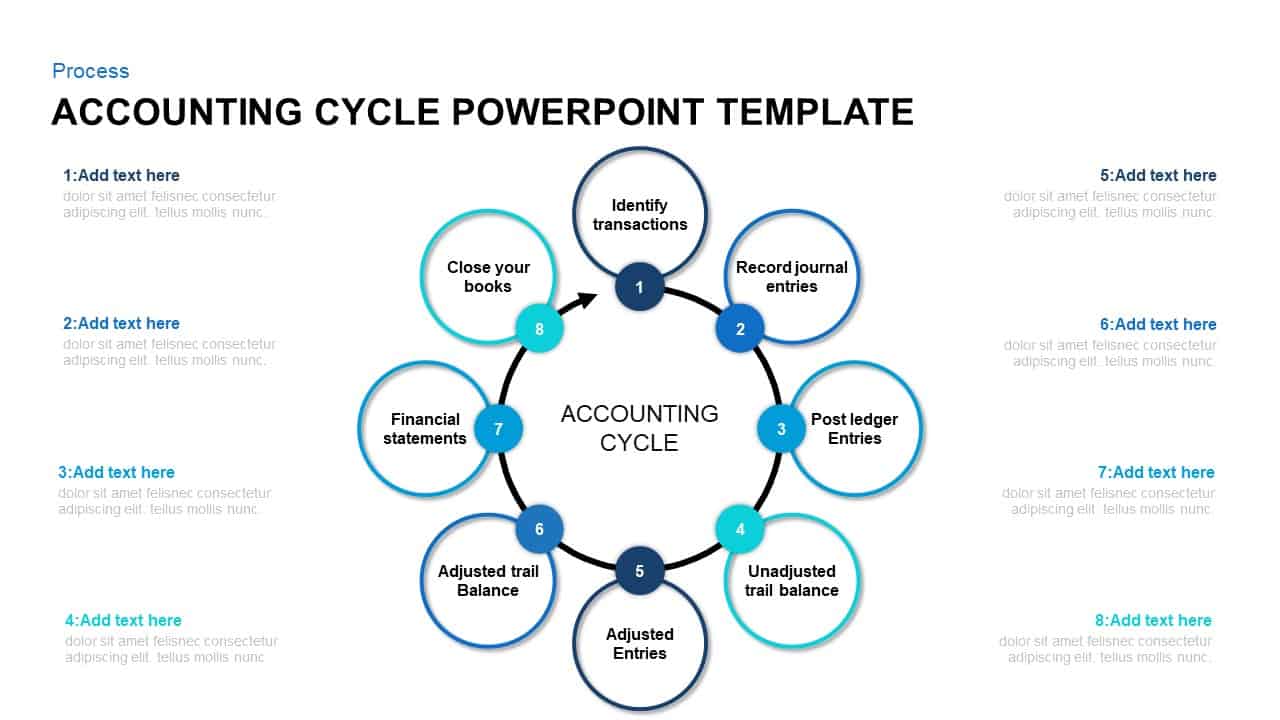
8-Step Circular Accounting Cycle Diagram Template for PowerPoint & Google Slides
Accounting
Multi-Style Project Life Cycle Diagram Template for PowerPoint & Google Slides
Process
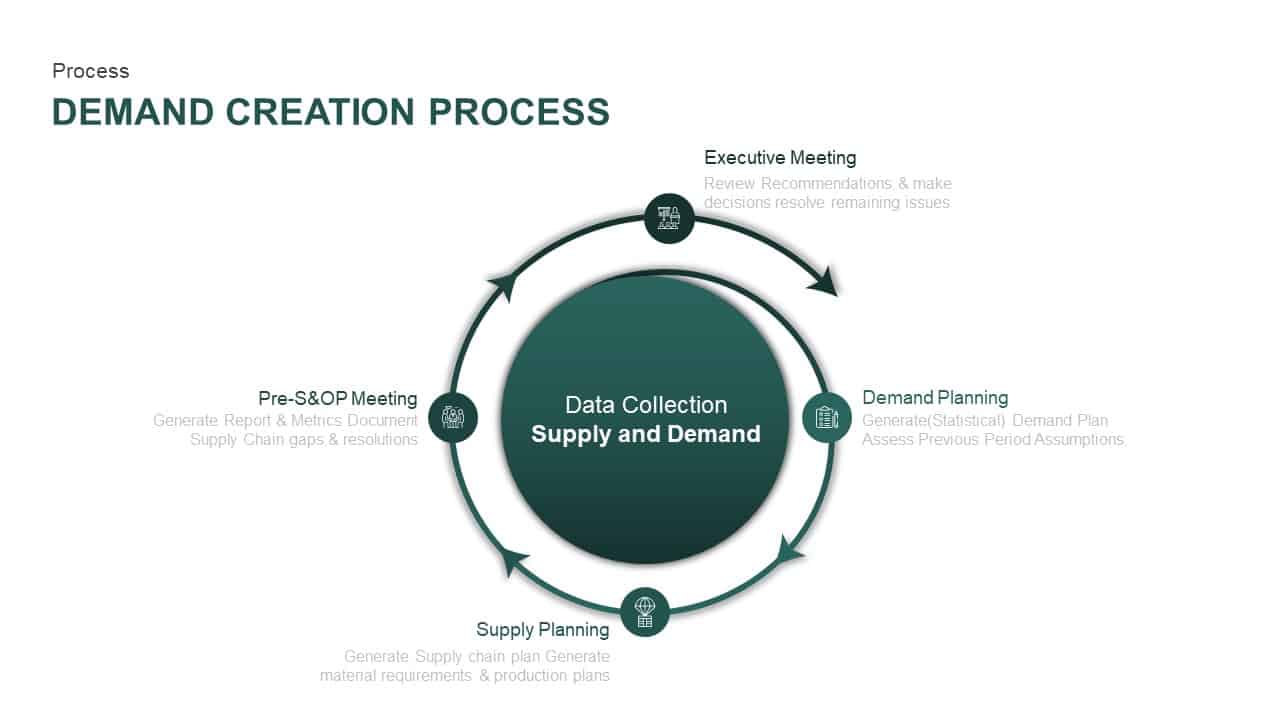
Supply and Demand Creation Cycle Diagram Template for PowerPoint & Google Slides
Process
Modern 6-Step Cycle Diagram Slide Deck Template for PowerPoint & Google Slides
Process
Corporate Product Life Cycle Diagram Template for PowerPoint & Google Slides
Process
Enterprise Risk Management Cycle Diagram Template for PowerPoint & Google Slides
Process
4MAT Learning Cycle Circular Diagram Template for PowerPoint & Google Slides
Circular
4-Step Circular PDCA Cycle Diagram Template for PowerPoint & Google Slides
Process
Continuous Improvement Cycle Diagram Template for PowerPoint & Google Slides
Process
7-Step Virtuous Economy Cycle Diagram Template for PowerPoint & Google Slides
Process
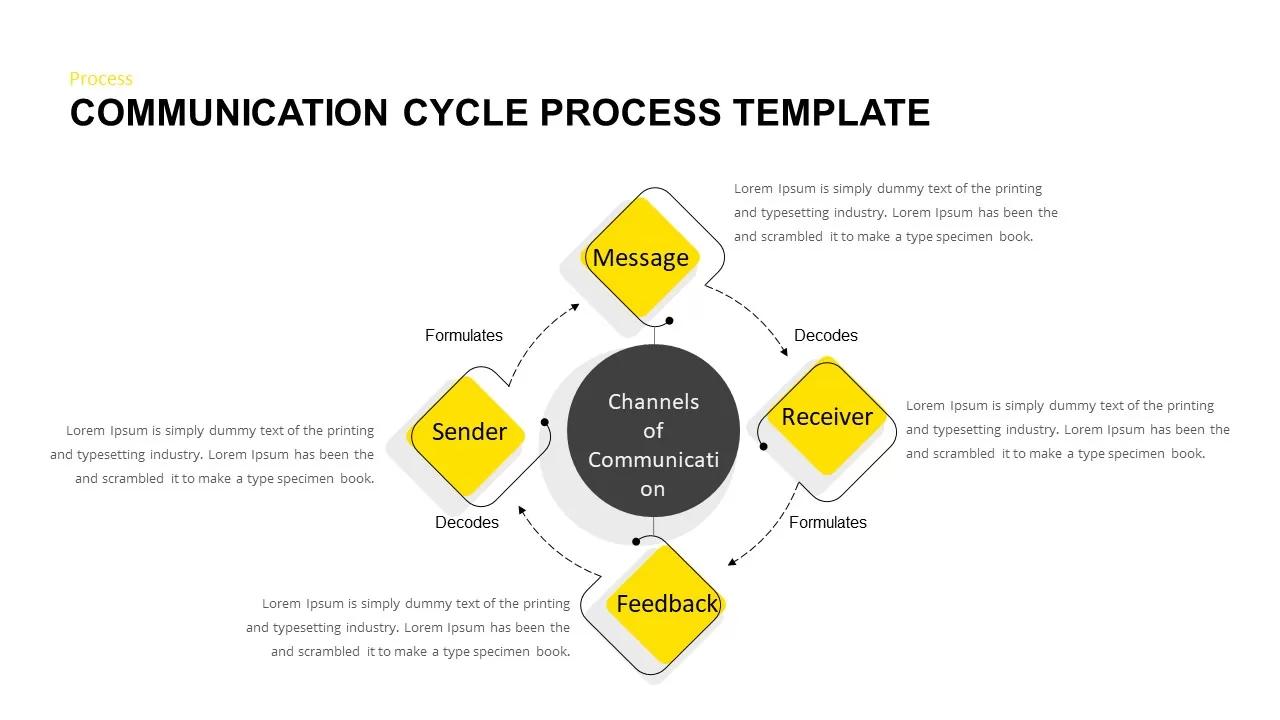
Communication Cycle Process Diagram template for PowerPoint & Google Slides
Business
Concentric Circular Arrow Cycle Diagram Template for PowerPoint & Google Slides
Process
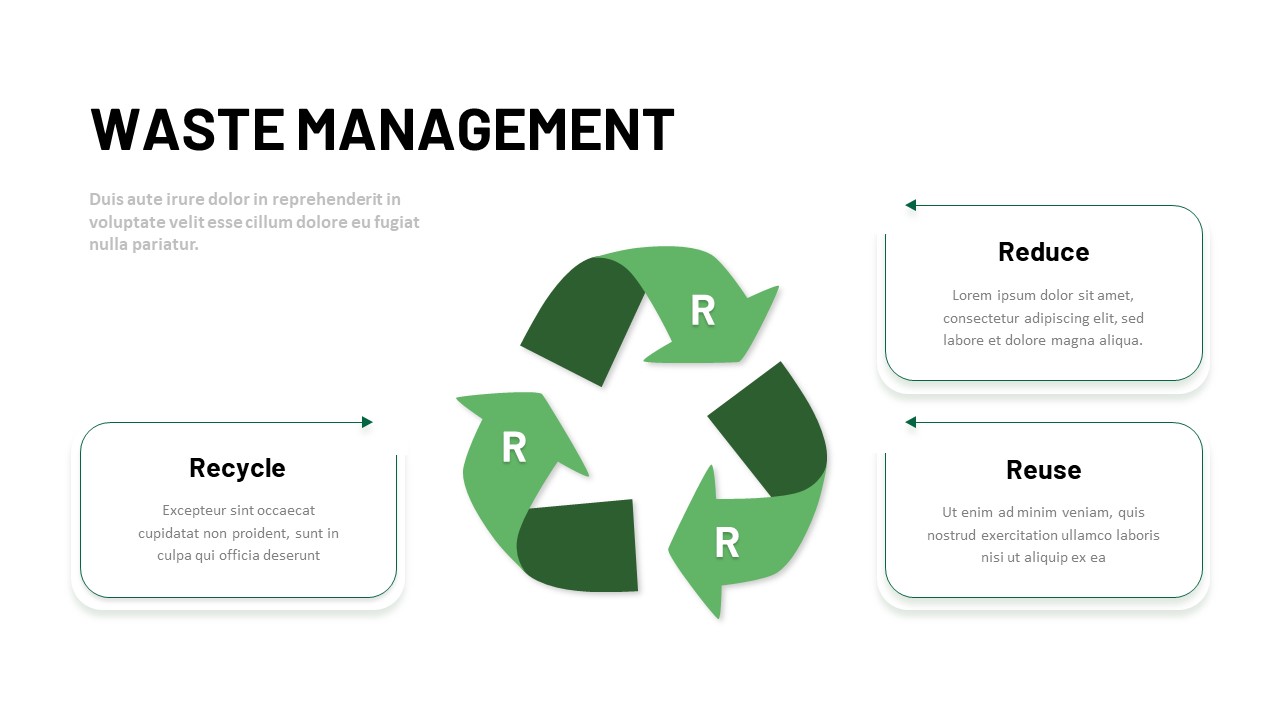
3R Waste Management Cycle Diagram Template for PowerPoint & Google Slides
Circular
Release Management Cycle Circular Diagram Template for PowerPoint & Google Slides
Software Development
Business Process Analysis Cycle Diagram Template for PowerPoint & Google Slides
Business Strategy
Free Time Management Clock Cycle Diagram Template for PowerPoint & Google Slides
Process
Free
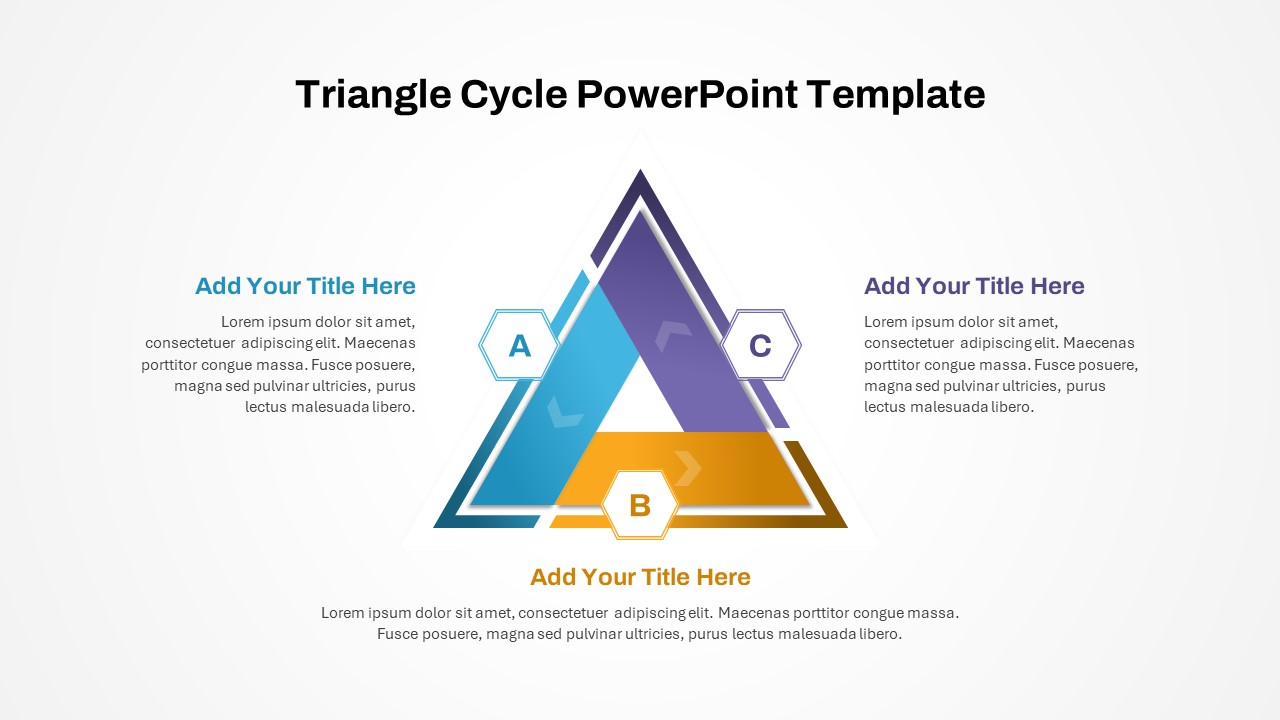
Three-Phase Triangle Cycle Diagram Template for PowerPoint & Google Slides
Infographics
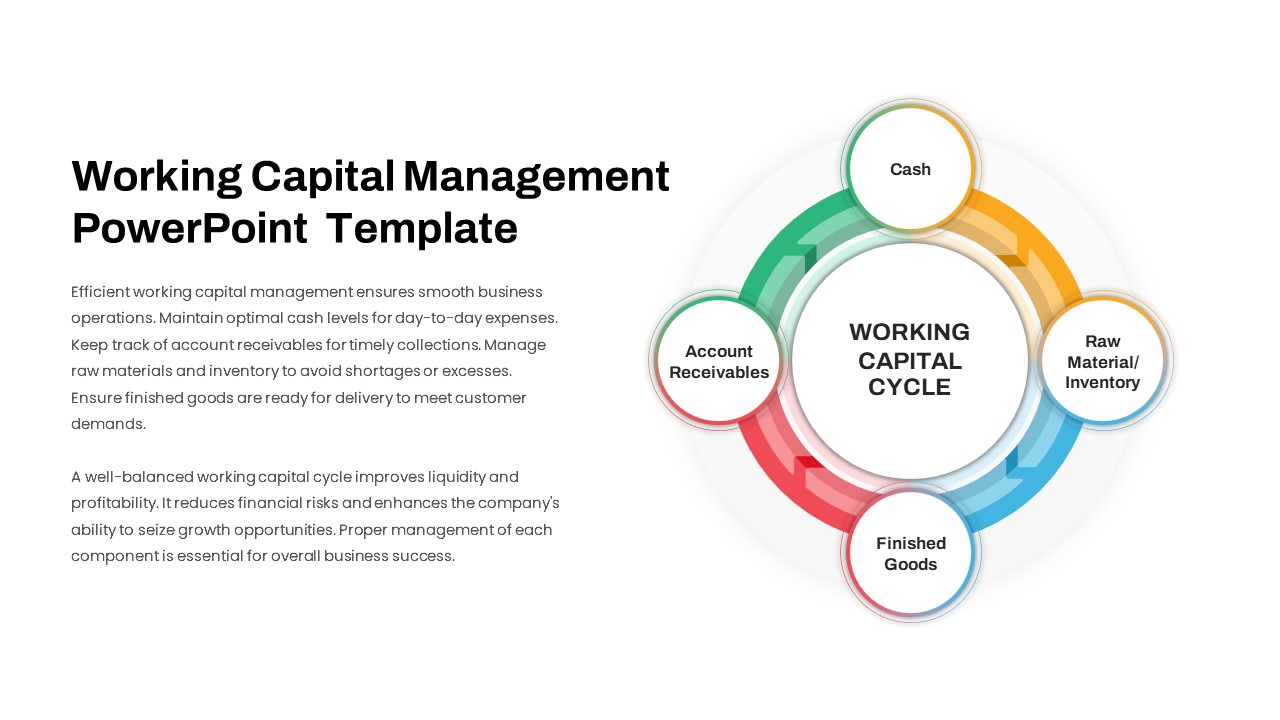
Working Capital Cycle Diagram Template for PowerPoint & Google Slides
Circular
Colorful Startup Financing Cycle Diagram Template for PowerPoint & Google Slides
Finance
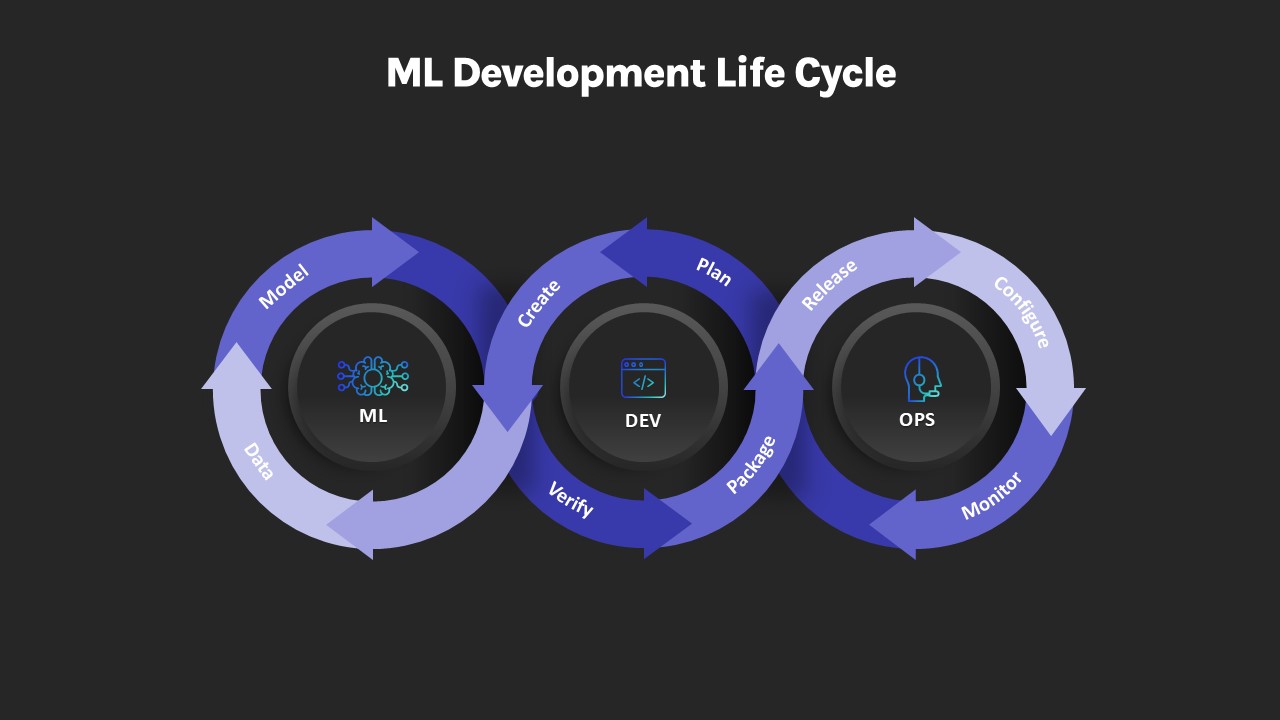
ML Development Life Cycle Diagram Template for PowerPoint & Google Slides
Machine Learning
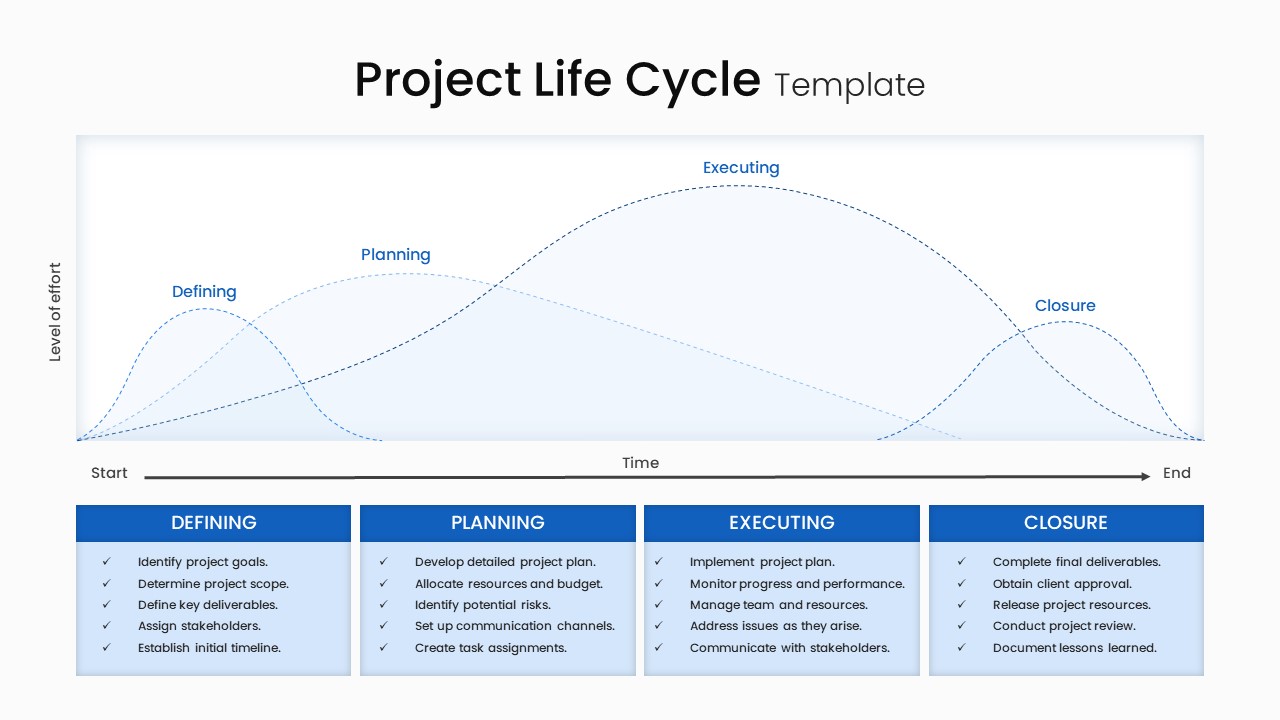
Project Life Cycle Workflow Diagram Template for PowerPoint & Google Slides
Process
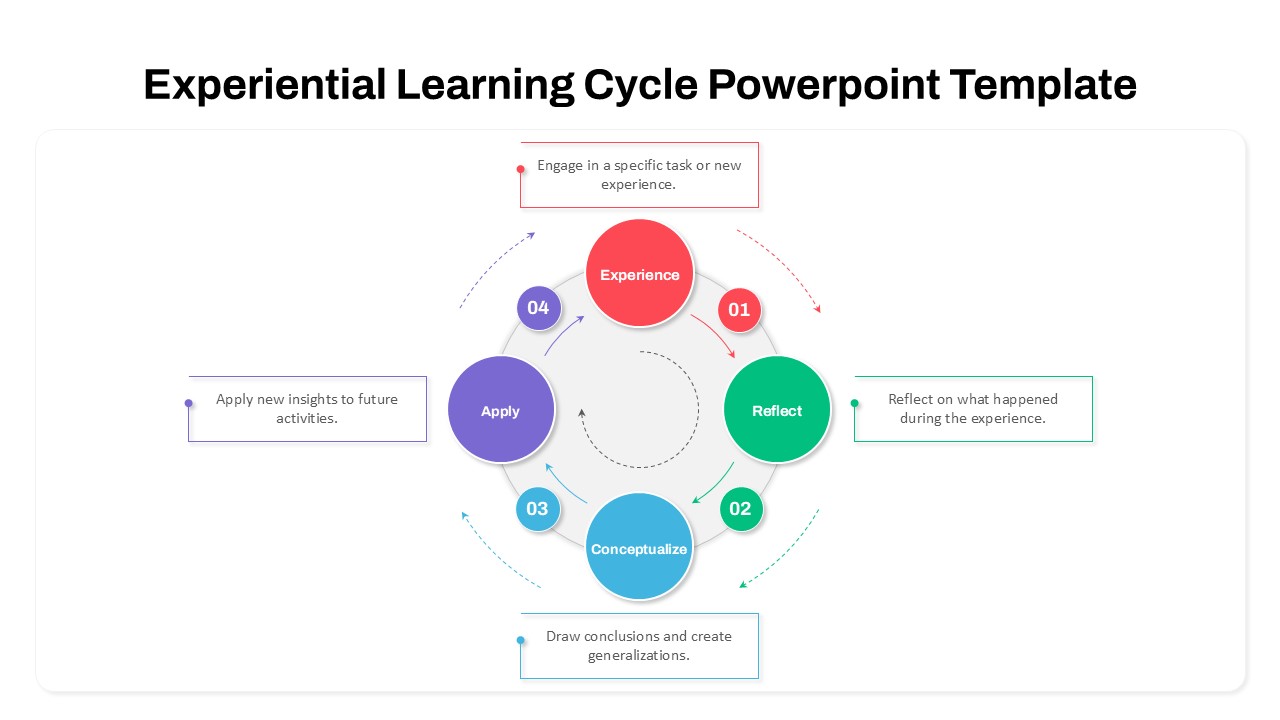
Experiential Learning Cycle Diagram Template for PowerPoint & Google Slides
Circular
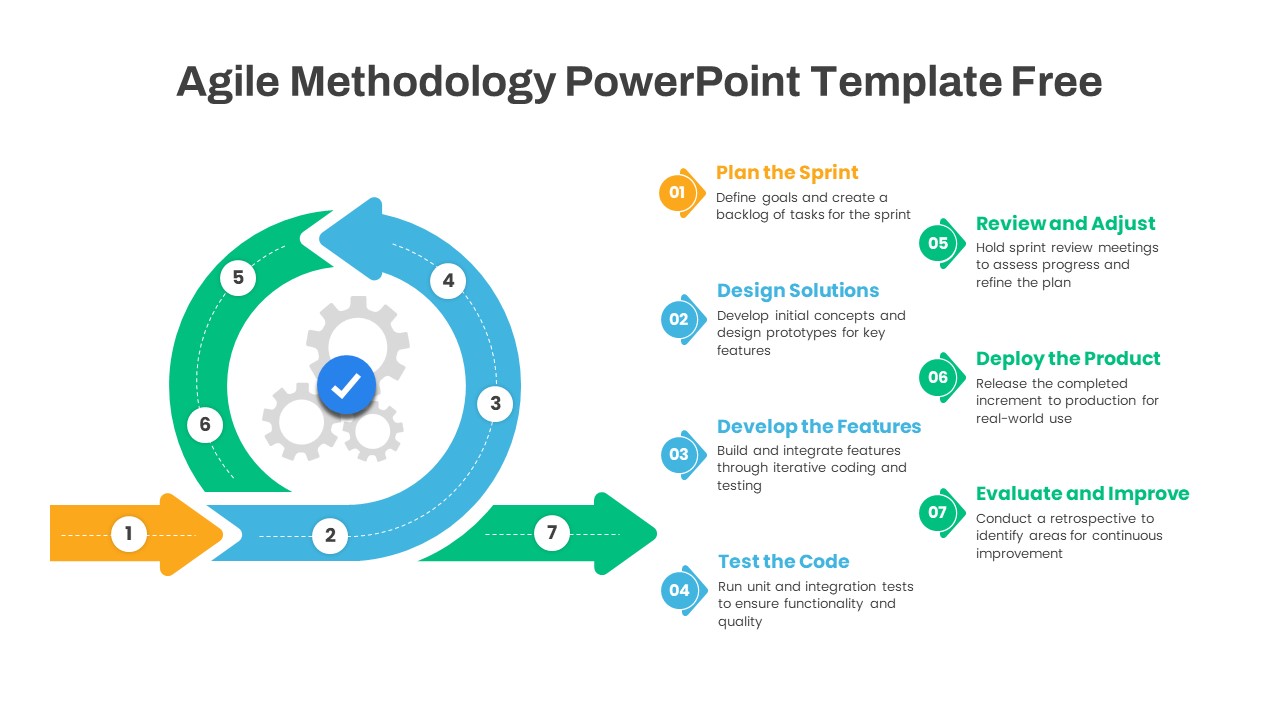
Agile Methodology Cycle Diagram Template for PowerPoint & Google Slides
Project
Free
Change Management Process Cycle Diagram Template for PowerPoint & Google Slides
Process
Flywheel Growth Cycle Diagram Template for PowerPoint & Google Slides
Circular
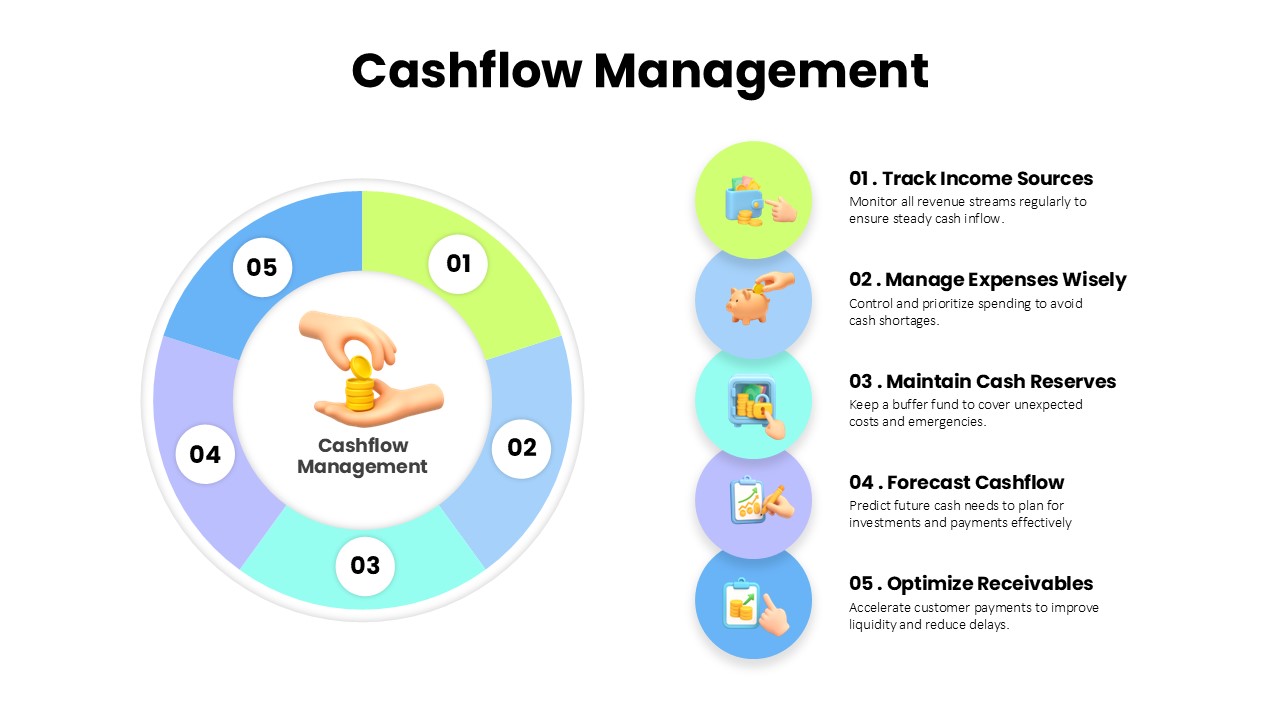
Cashflow Management Cycle Diagram Template for PowerPoint & Google Slides
Finance
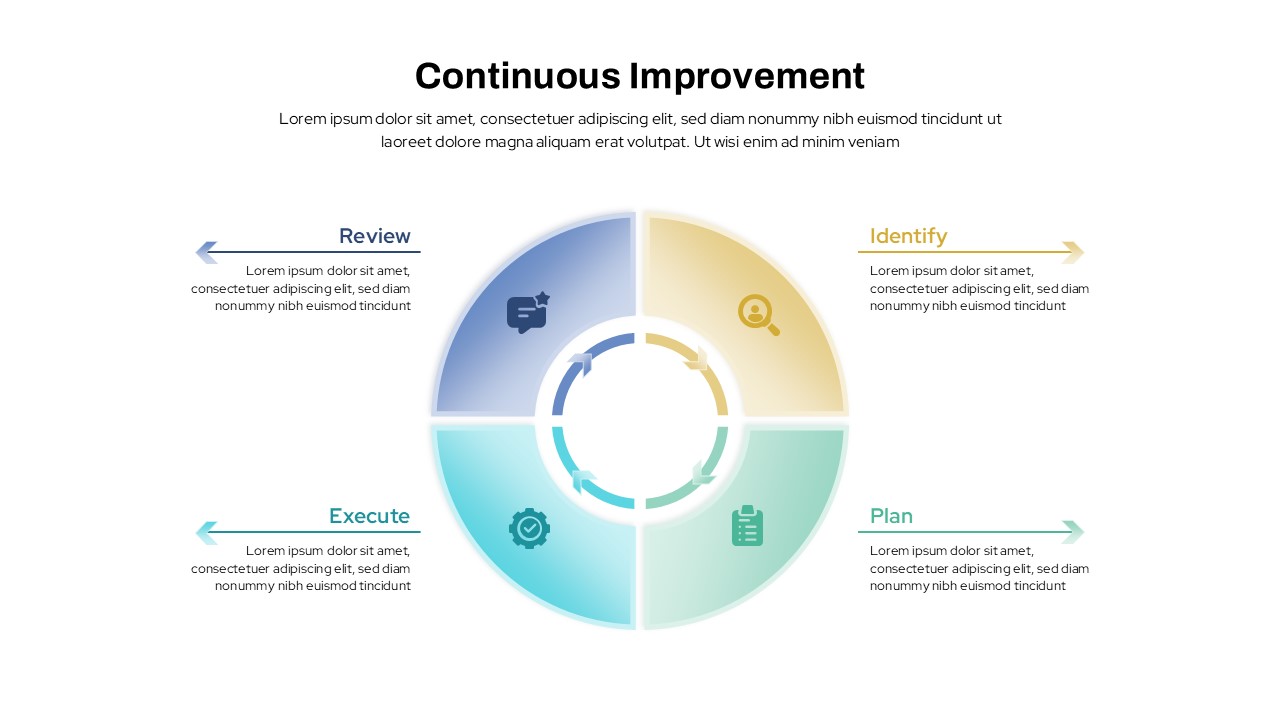
Continuous Improvement Cycle Diagram Template for PowerPoint & Google Slides
Process
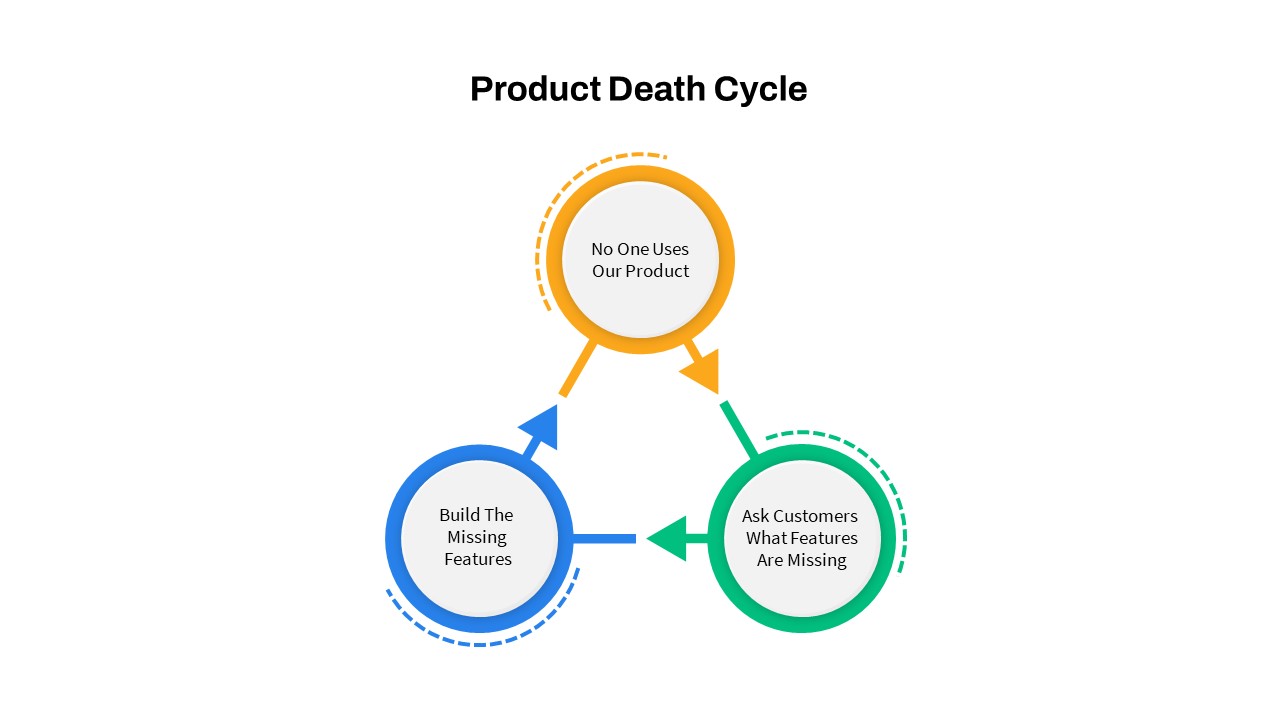
Product Death Cycle Diagram Slide for PowerPoint & Google Slides
Circular
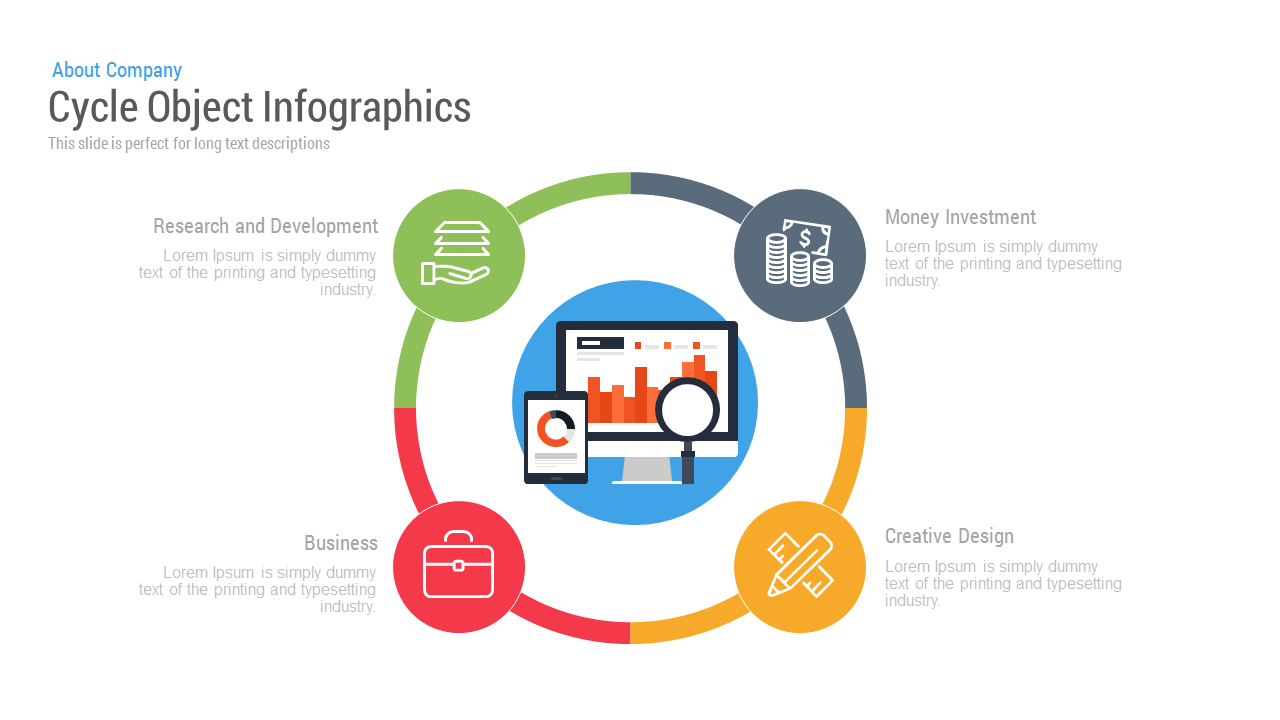
Free Cycle Object Infographics template for PowerPoint & Google Slides
Process
Free
Performance Review Process Management Cycle template for PowerPoint & Google Slides
Employee Performance
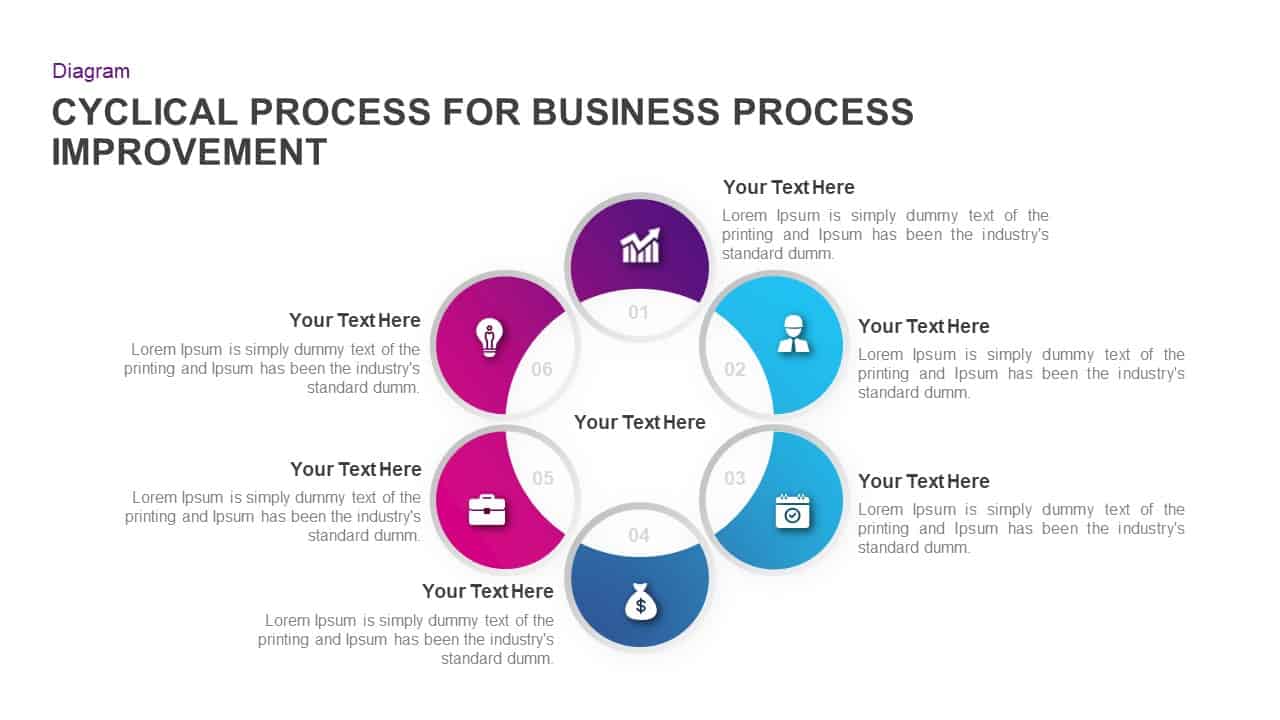
Business Process Improvement Cycle Template for PowerPoint & Google Slides
Process
Product Life Cycle Infographics template for PowerPoint & Google Slides
Business
Water Cycle Process Infographic Template for PowerPoint & Google Slides
Process
Four-Stage Process Cycle Variations Pack Template for PowerPoint & Google Slides
Process
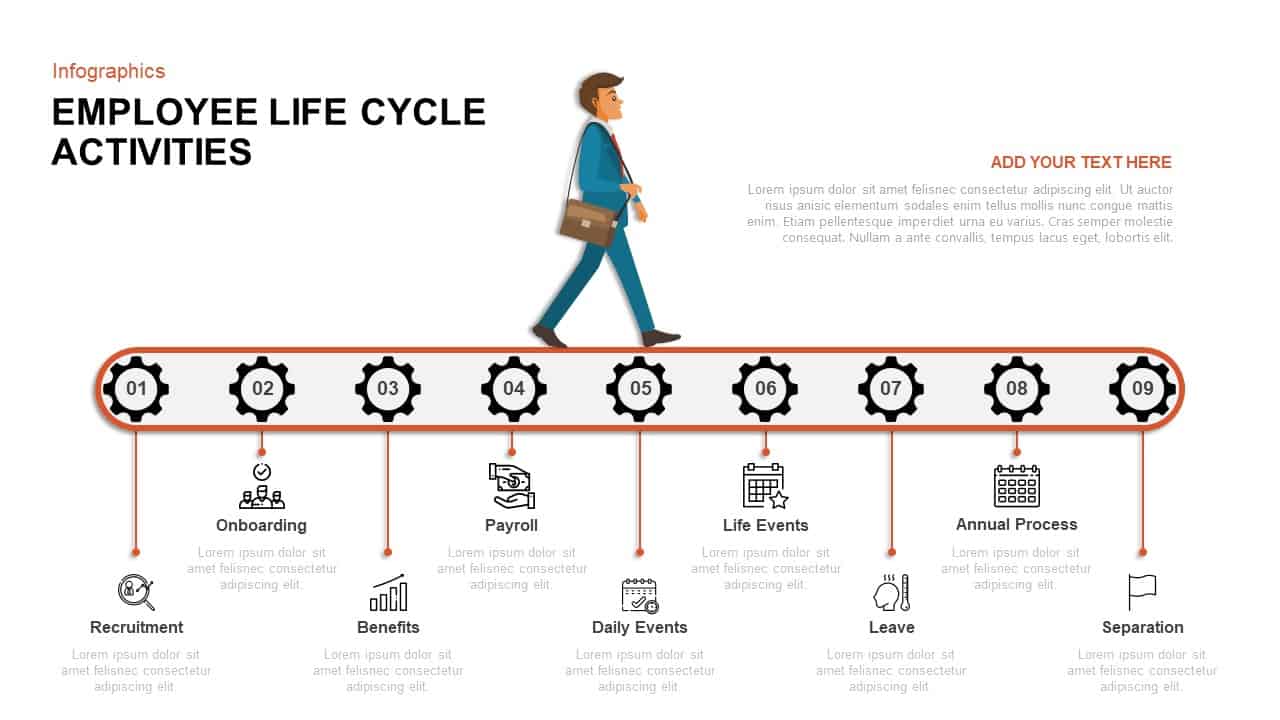
Employee Life Cycle Activities Template for PowerPoint & Google Slides
Timeline
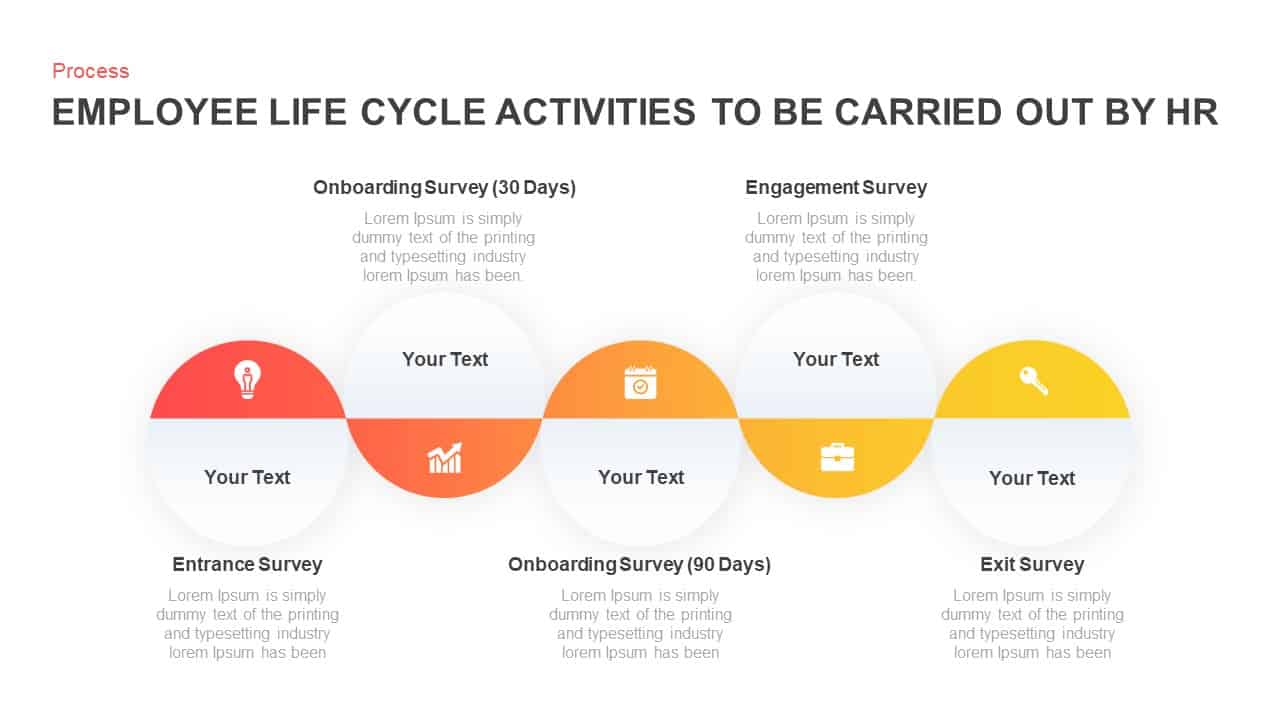
Employee Life Cycle Activities Process Template for PowerPoint & Google Slides
Employee Performance
Business Process Improvement Cycle Template for PowerPoint & Google Slides
Circular
Strategic ADL Matrix by Industry Life Cycle & Position Template for PowerPoint & Google Slides
Business Strategy
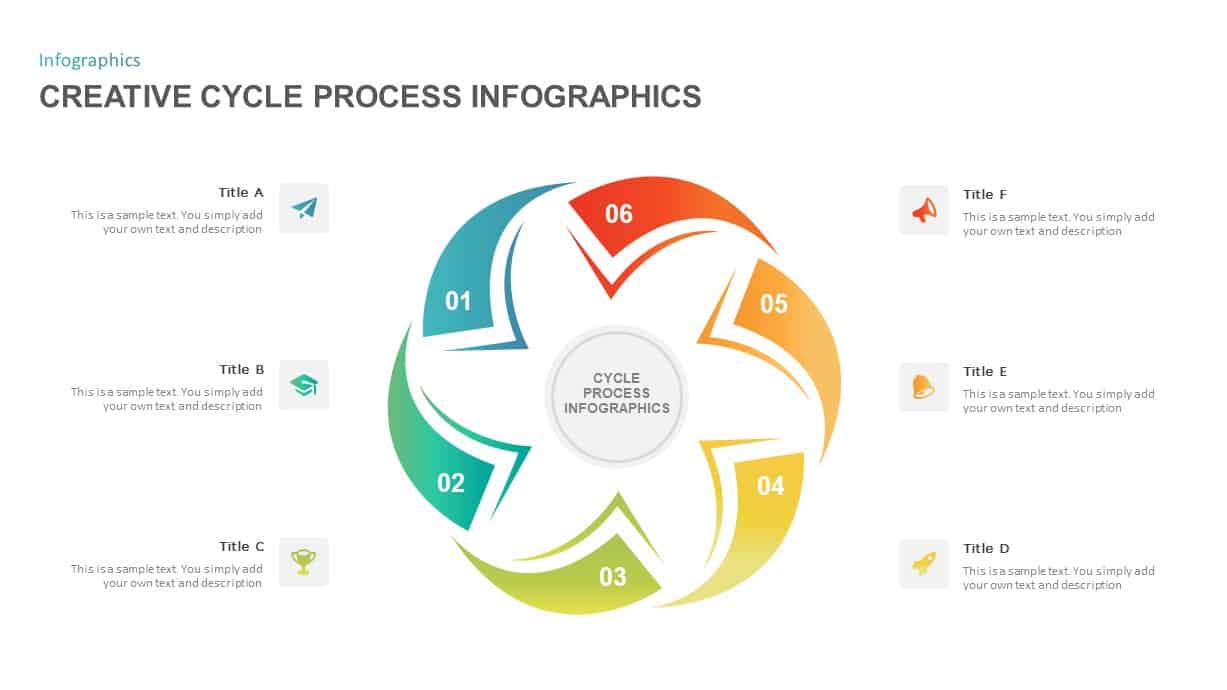
Creative Cycle Process Infographics Template for PowerPoint & Google Slides
Process
Plan Do Check Act PDCA Cycle Infographic Template for PowerPoint & Google Slides
Process
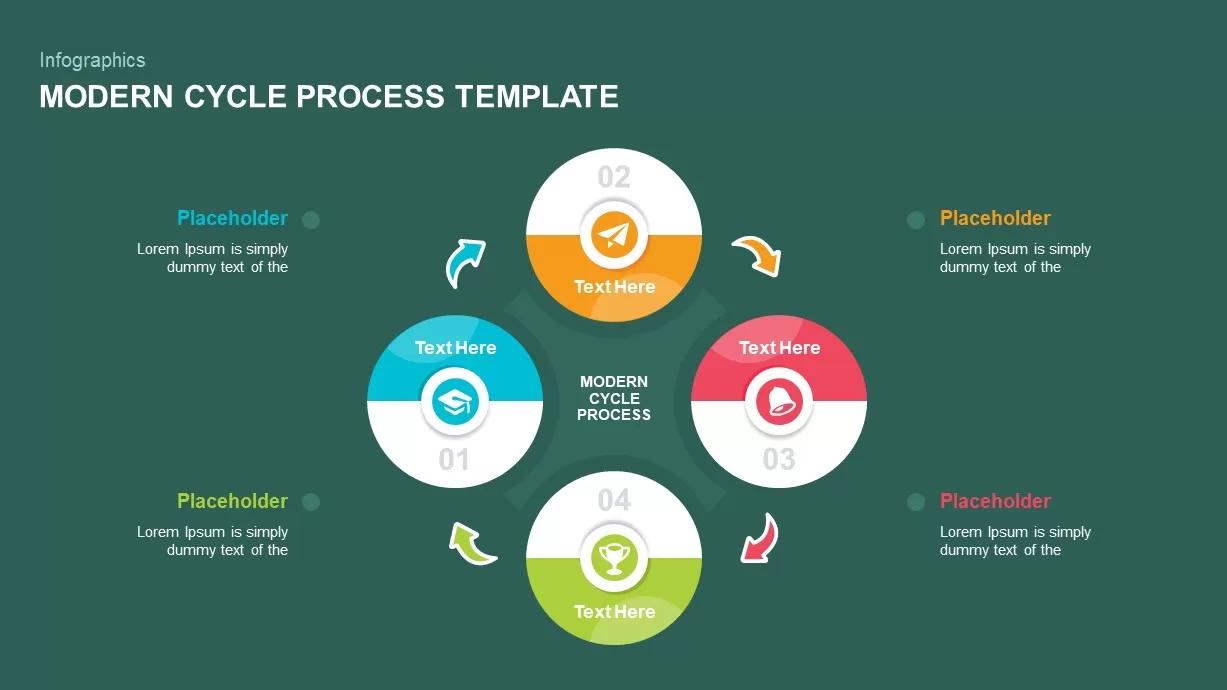
Modern Cycle Process Template for PowerPoint & Google Slides
Business Proposal
Gibbs Reflective Cycle Overview Template for PowerPoint & Google Slides
Process
Dual-Stage Circular Arrow Cycle Template for PowerPoint & Google Slides
Process
Three-Segment Circular Arrow Cycle Template for PowerPoint & Google Slides
Circular
Four-Segment Circular Arrow Cycle Template for PowerPoint & Google Slides
Circular
Six-Segment Circular Arrow Cycle Template for PowerPoint & Google Slides
Circular
PDCA Cycle Infographic with Four Stages Template for PowerPoint & Google Slides
Process
PDCA Plan Do Check Act Cycle Infographic Template for PowerPoint & Google Slides
Process
PDCA Four-Stage Cycle Infographic Template for PowerPoint & Google Slides
Process
Robotics Process Cycle Infographic Template for PowerPoint & Google Slides
Process
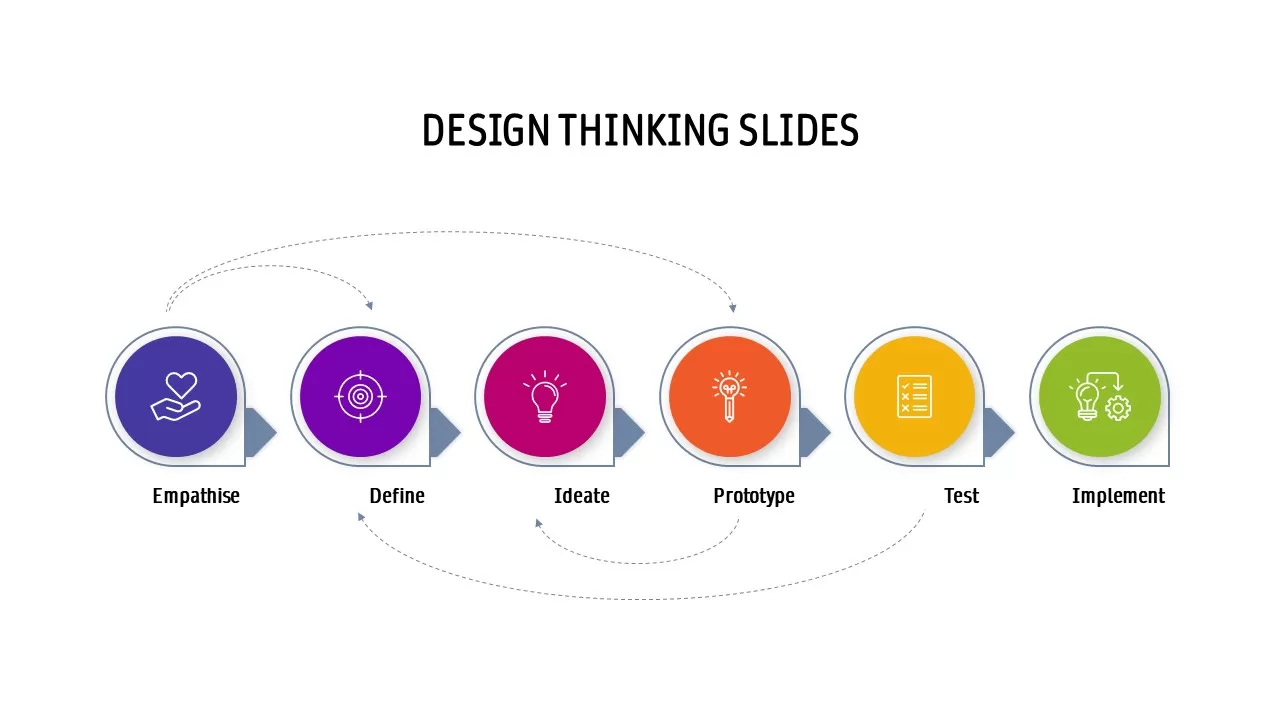
Design Thinking Process Cycle Slide Template for PowerPoint & Google Slides
Process
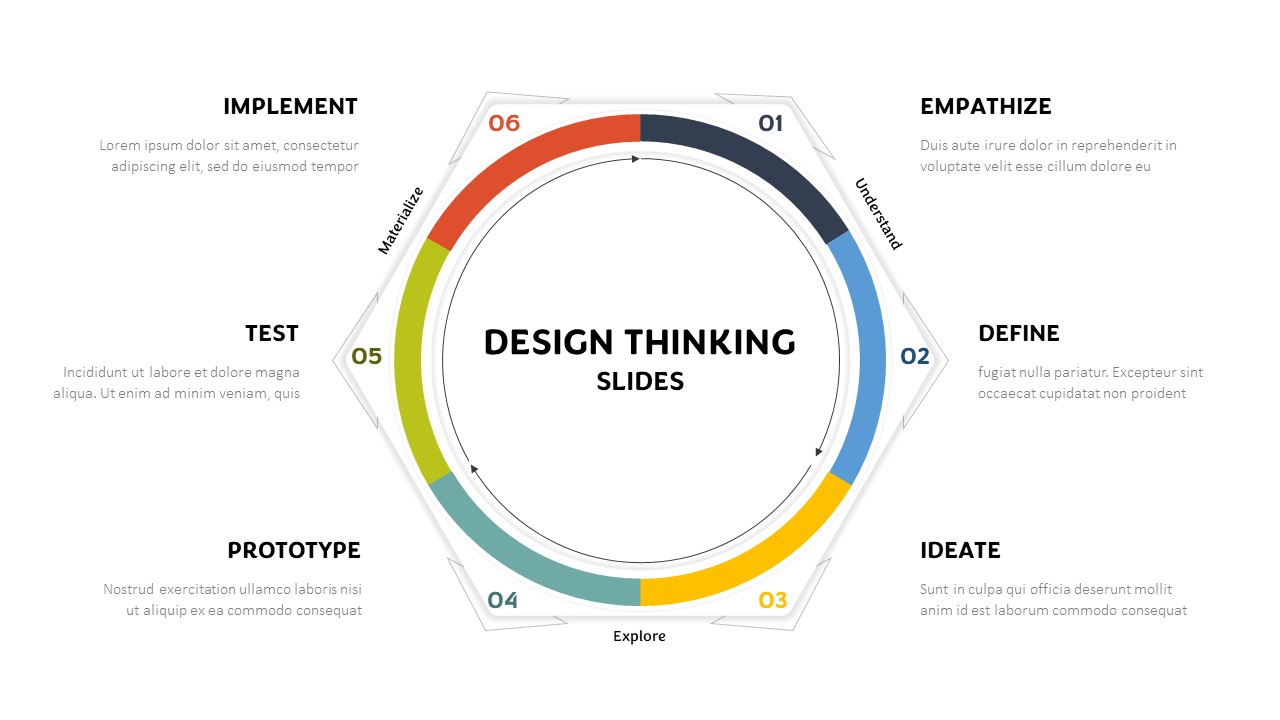
Hexagonal Design Thinking Cycle Template for PowerPoint & Google Slides
Process
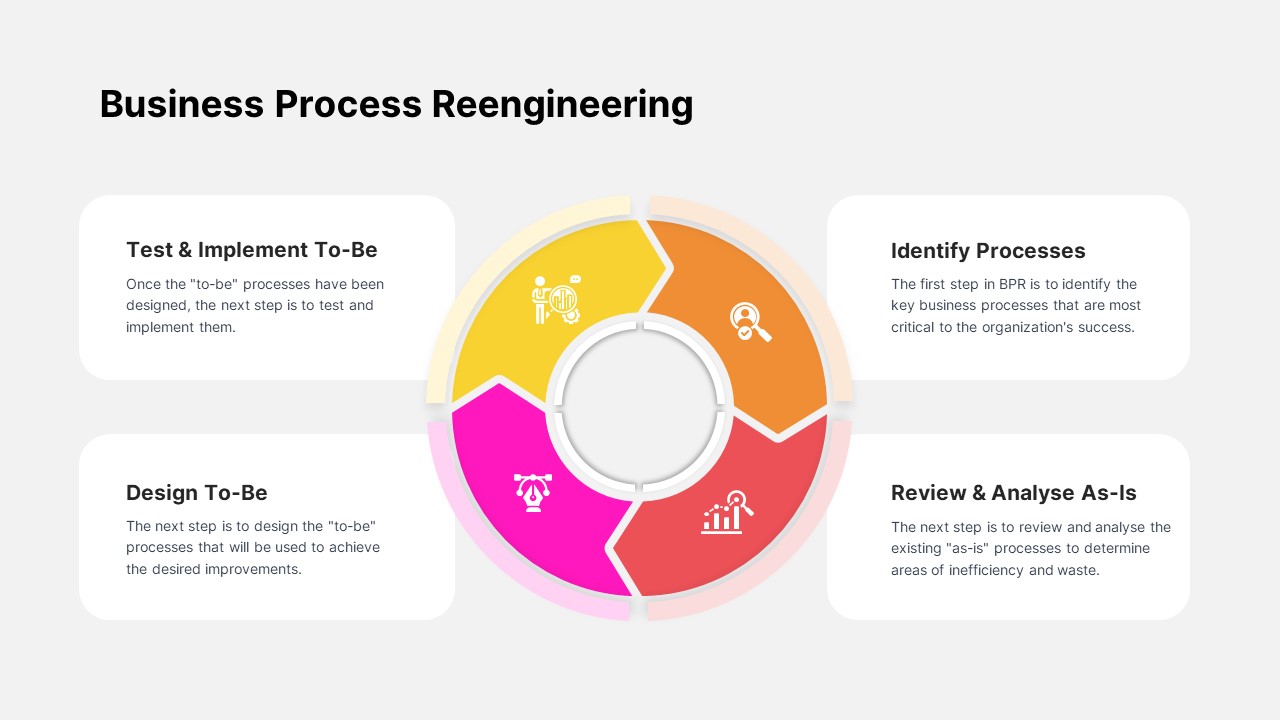
Business Process Reengineering Cycle Template for PowerPoint & Google Slides
Circular
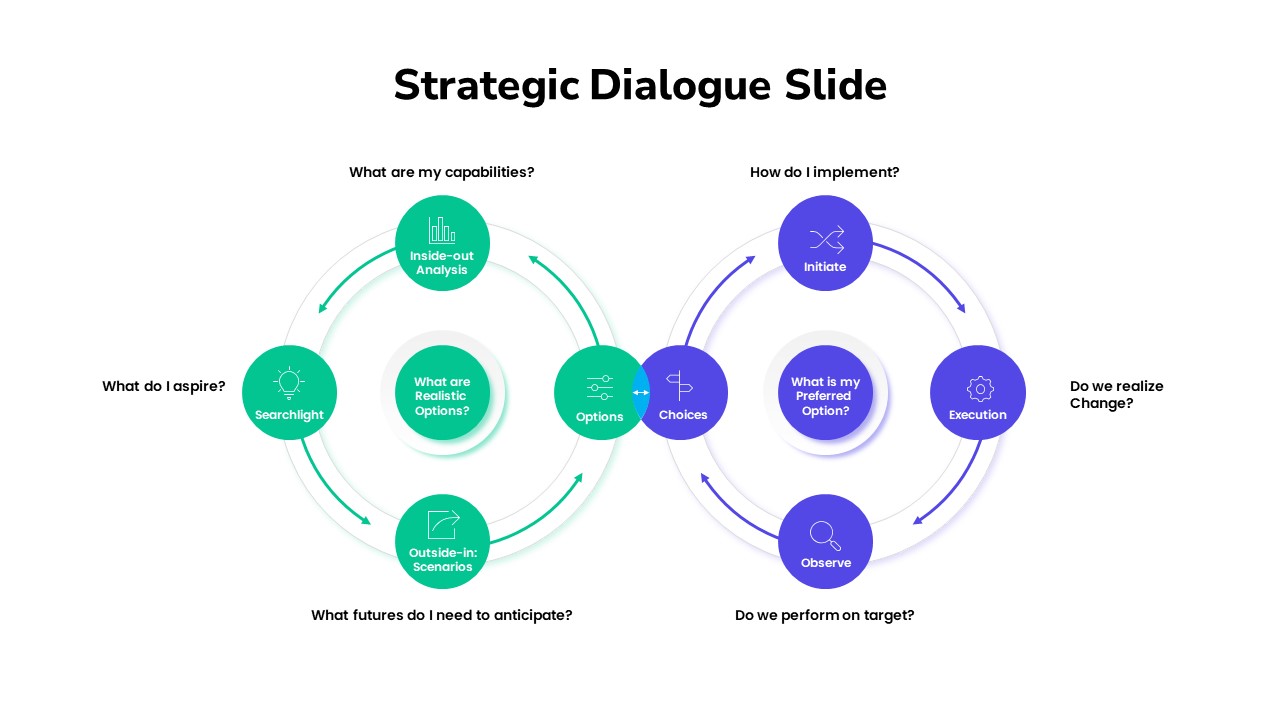
Strategic Dialogue Model Cycle Template for PowerPoint & Google Slides
Circular
3R Waste Management Cycle Overview template for PowerPoint & Google Slides
Process
Iterative Strategic Planning Cycle Template for PowerPoint & Google Slides
Business Strategy
Cycle Chart Template for PowerPoint & Google Slides
Circular
Influencer Marketing Cycle Strategy Template for PowerPoint & Google Slides
Circular
Seeds Growth Cycle Business Model Template for PowerPoint & Google Slides
Process
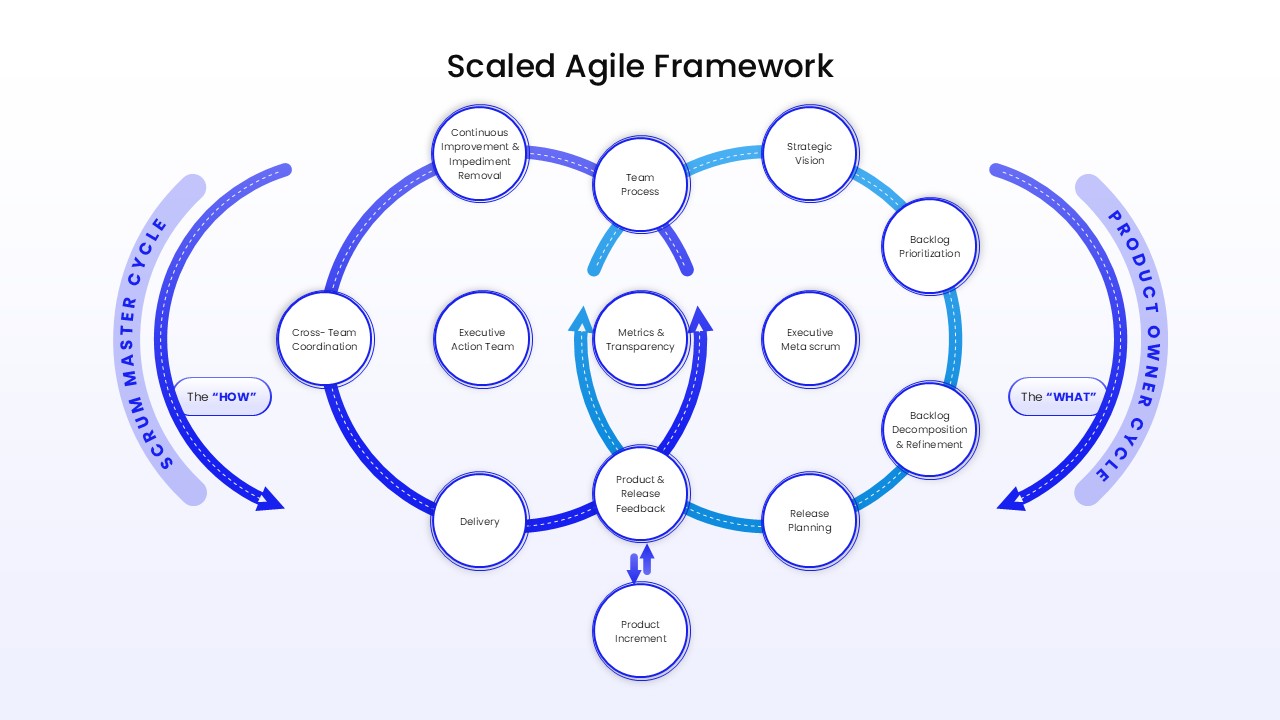
Two-Cycle Scaled Agile Framework Template for PowerPoint & Google Slides
Scrum
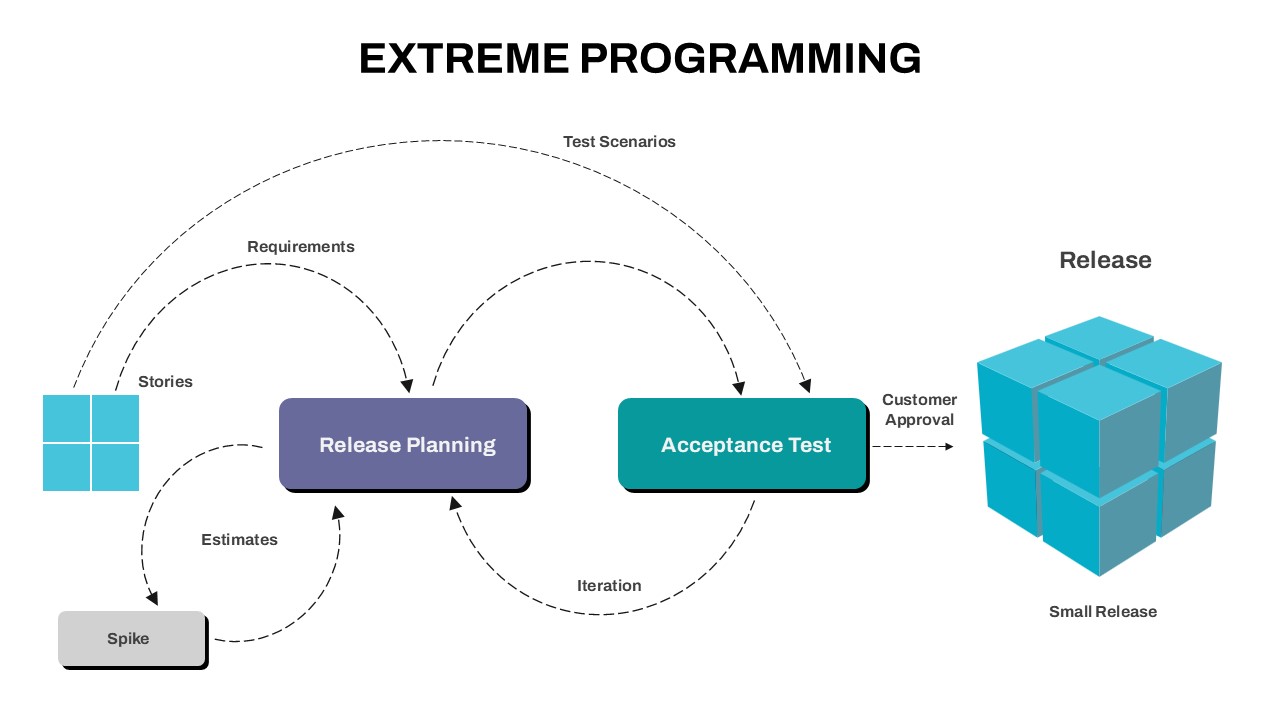
Extreme Programming Process Cycle Template for PowerPoint & Google Slides
Software Development
Modern Cycle Process for PowerPoint & Google Slides
Infographics
Snake Diagram Pack of 8 Slides template for PowerPoint & Google Slides
Process
Puzzle Diagram PowerPoint Template for PowerPoint & Google Slides
Process
Transportation Logistics PowerPoint Diagram template for PowerPoint & Google Slides
Process