Free Stock Market Performance Overview template for PowerPoint & Google Slides
Description
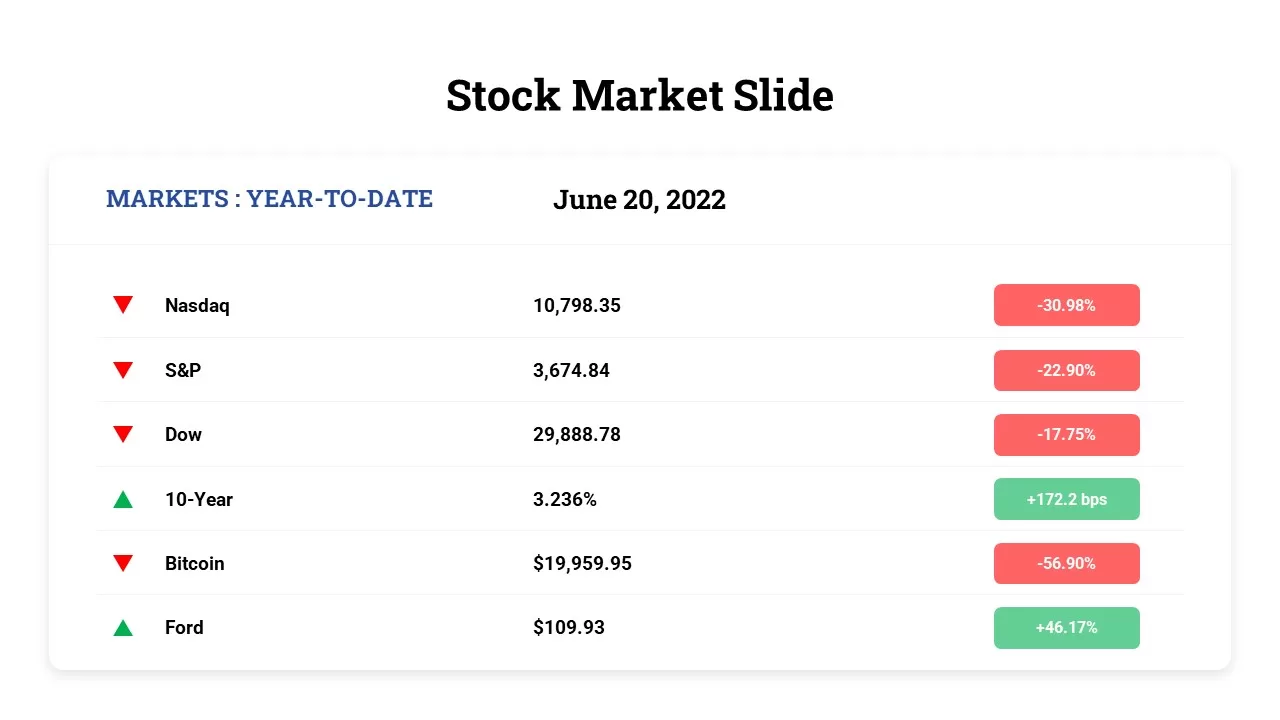
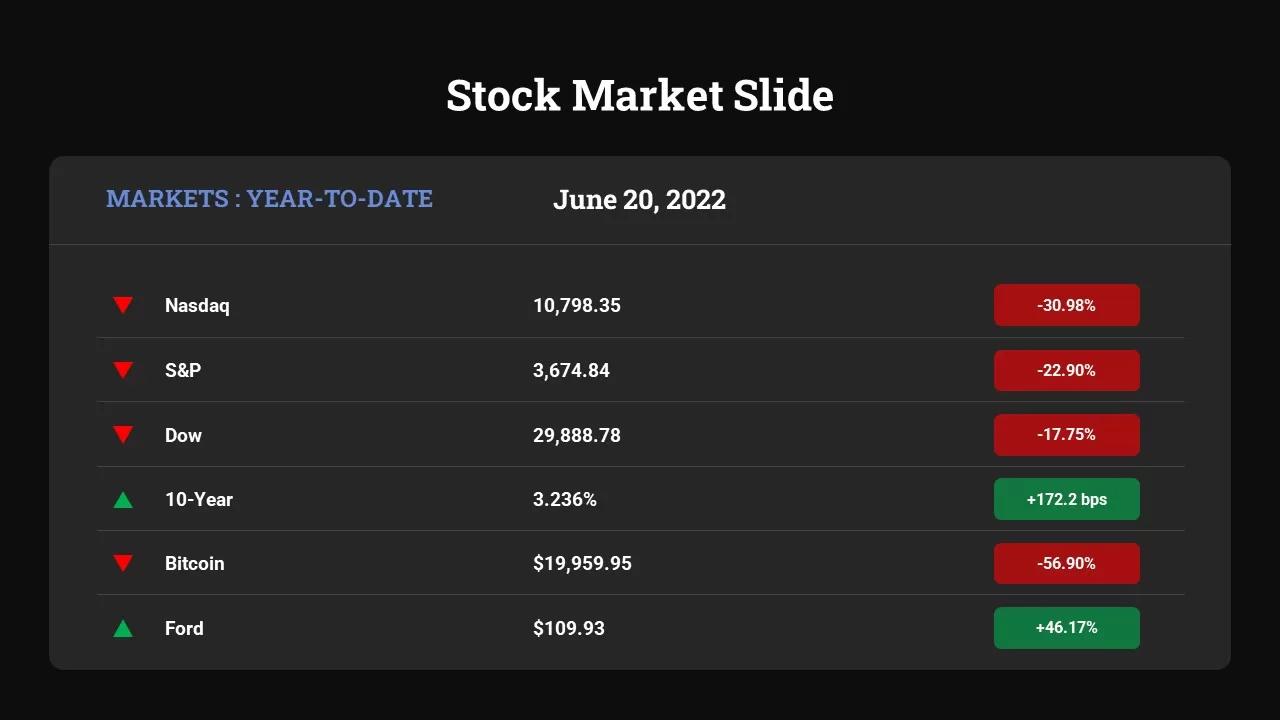
This Stock Market Performance Overview template is a sleek, professional slide designed to visually represent year-to-date stock market trends and data. With a focus on key metrics such as Nasdaq, S&P, Dow, Bitcoin, and other financial indicators, this slide helps display market movements at a glance. Using color-coded elements, it clearly differentiates gains and losses, providing a clear, easy-to-understand layout for financial presentations. The slide showcases percentage changes, market indexes, and financial results in an attractive, easy-to-read format, making it ideal for presenting market performance in board meetings, investment briefings, or financial reports.
The modern design and user-friendly structure allow you to seamlessly display complex data without overwhelming your audience. Whether you’re tracking the performance of major indexes or highlighting specific stocks like Ford or Bitcoin, this template enables you to share vital information with clarity and impact.
Perfect for financial analysts, stock traders, investment advisors, and corporate executives, this template ensures your financial presentations are engaging, insightful, and professional.
Who is it for
This template is designed for financial analysts, investment professionals, stock traders, and corporate executives. It is ideal for anyone looking to present financial performance, market trends, or investment data in a clear and visually compelling way.
Other Uses
Beyond stock market analysis, this template can also be used for presenting other financial data, including quarterly or yearly performance reviews, business forecasts, risk analysis, and investment strategy evaluations. It can be adapted for use in educational settings, workshops, or financial consulting presentations.
Login to download this file

Item ID
SB02640
Related Templates

Bull and Bear Stock Market Dashboard Template for PowerPoint & Google Slides
Infographics
Neon Dark Stock Market Analysis Template for PowerPoint & Google Slides
Pitch Deck
Free
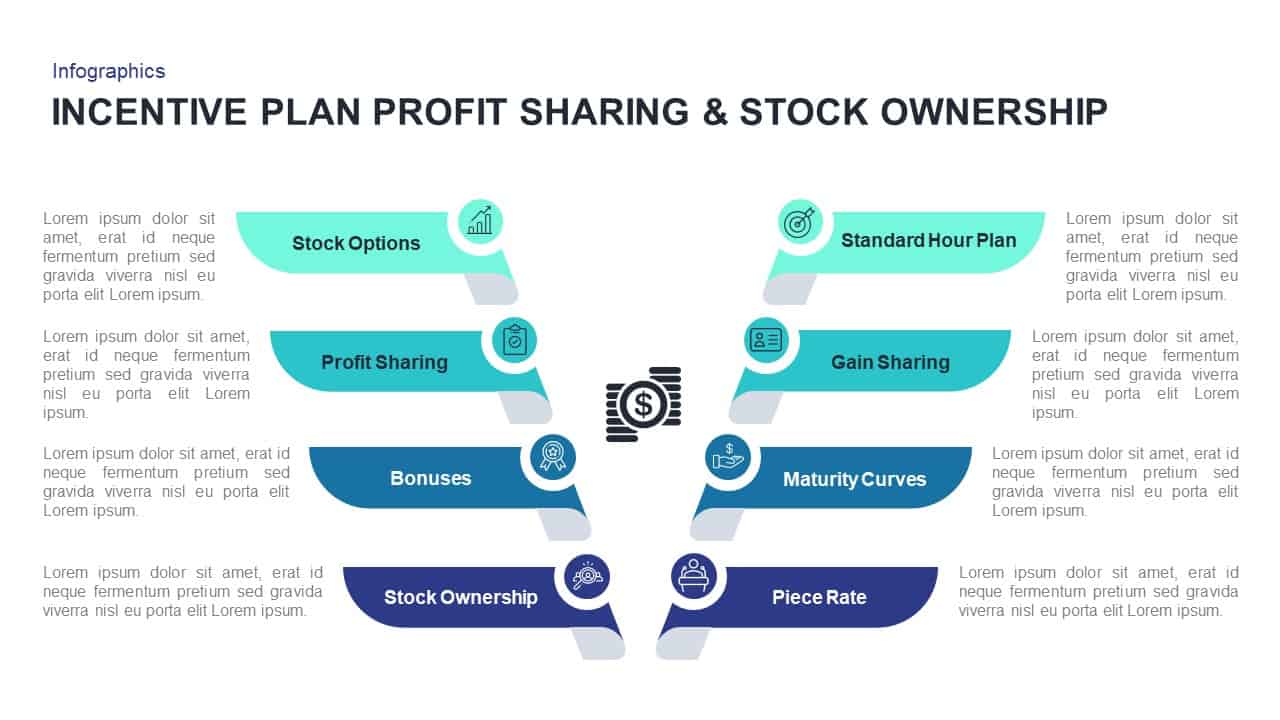
Profit Sharing & Stock Ownership Template for PowerPoint & Google Slides
Process
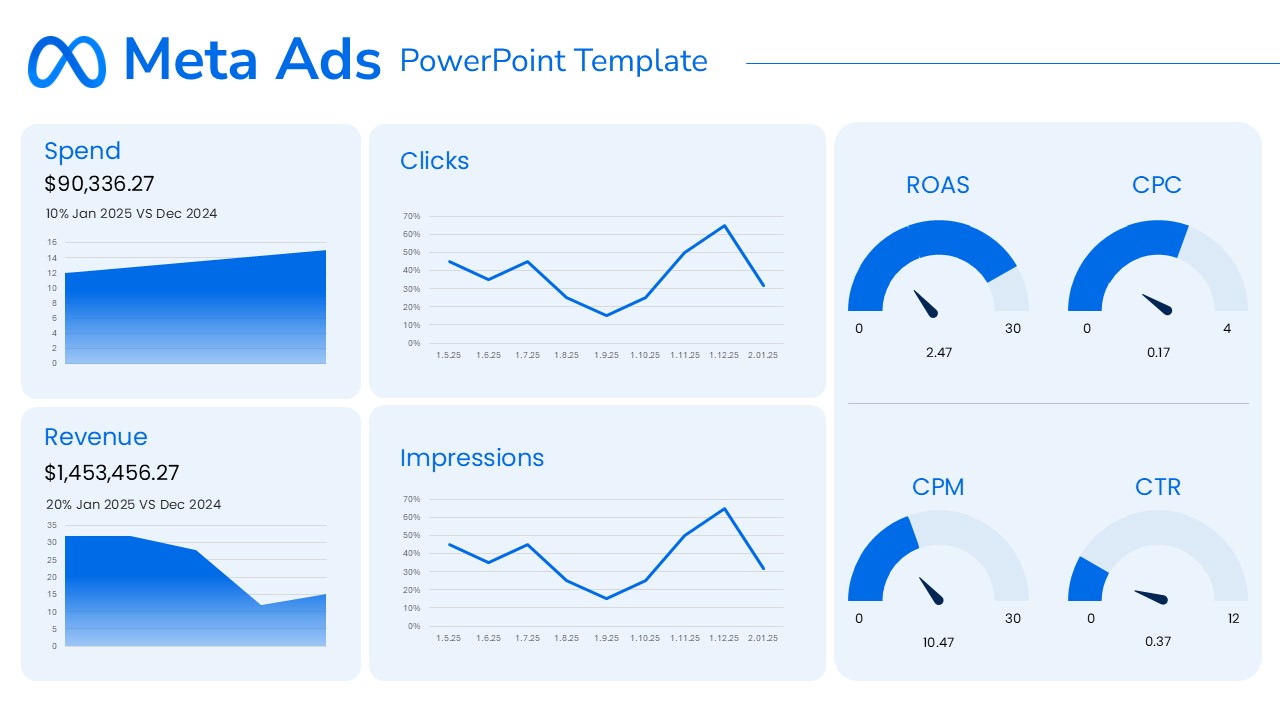
Meta Ads Performance Overview template for PowerPoint & Google Slides
Advertising
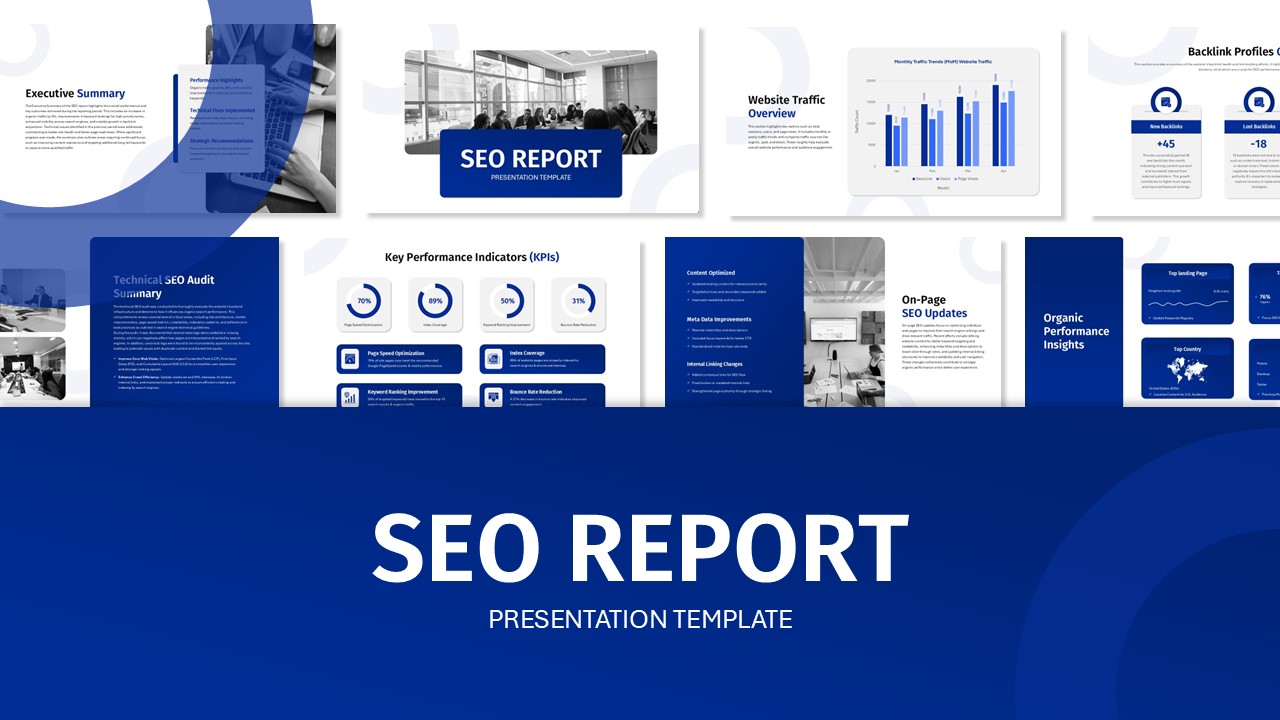
SEO Performance Report Overview template for PowerPoint & Google Slides
Digital Marketing
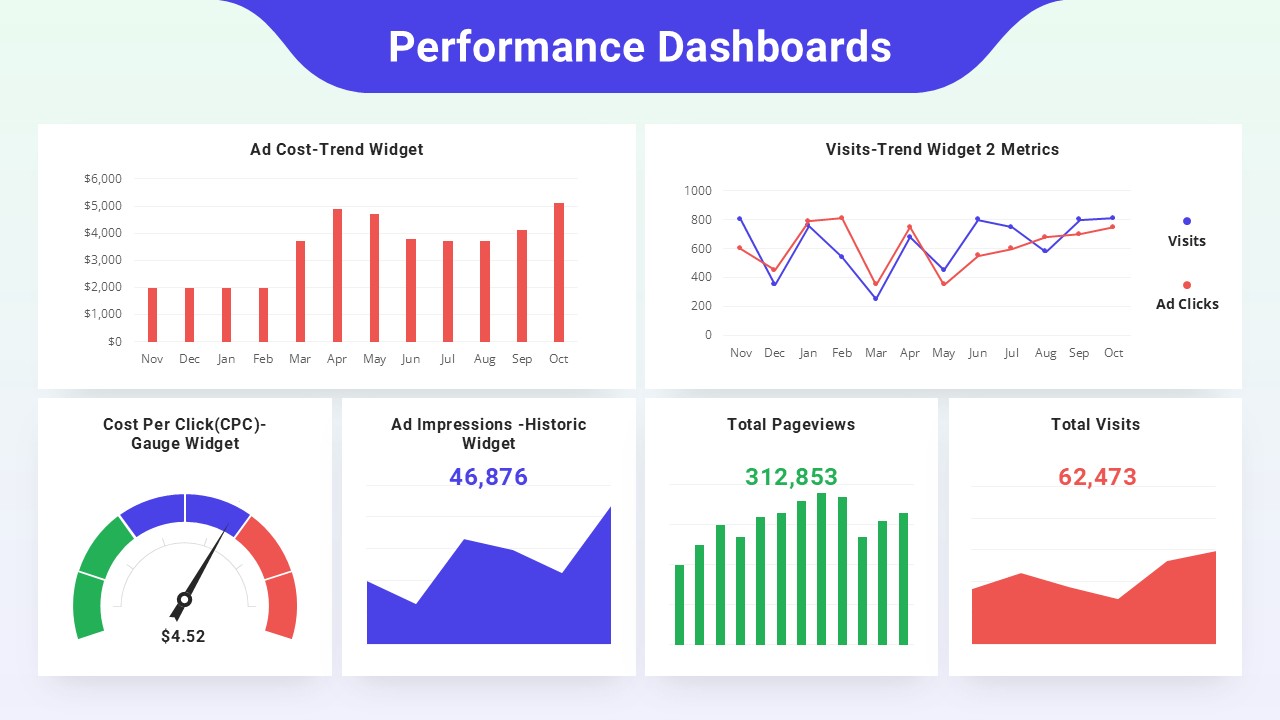
Performance Dashboards Overview Template for PowerPoint & Google Slides
Business Report
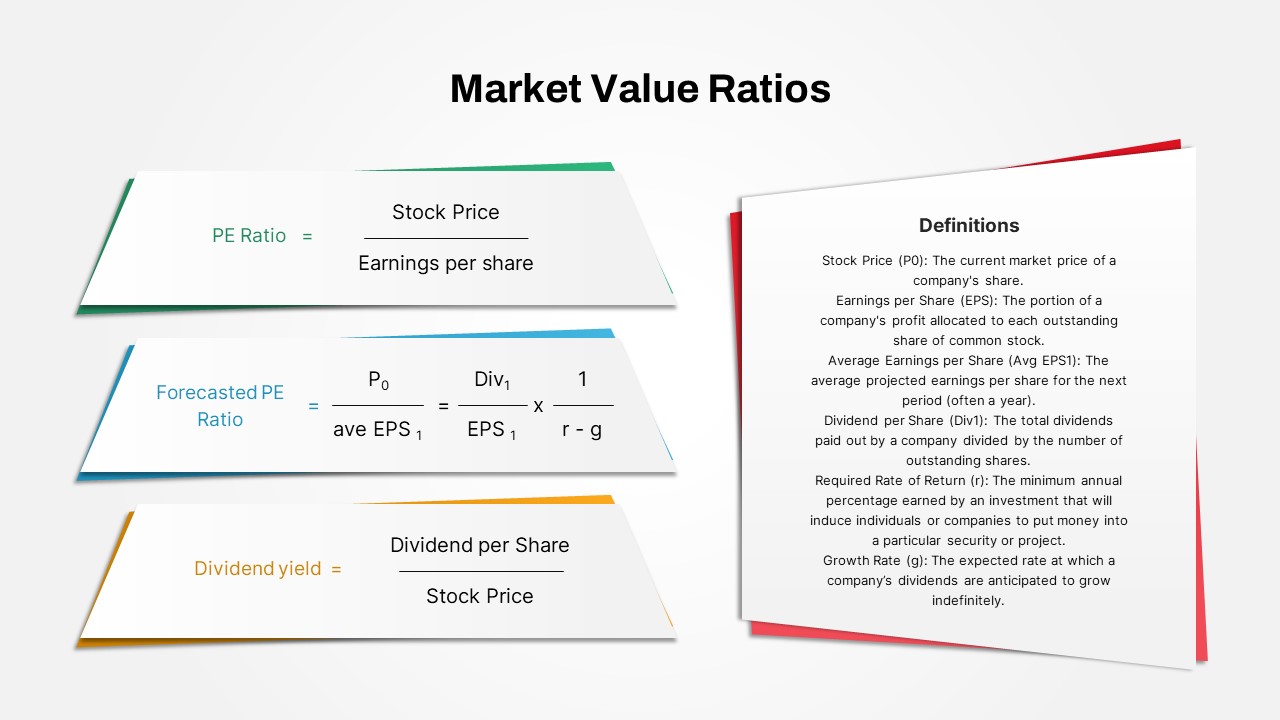
Market Value Ratios Formula Overview Template for PowerPoint & Google Slides
Business Report
Market Validation Metrics Overview Template for PowerPoint & Google Slides
Business
Google Ads Optimization & Performance Infographic Template for PowerPoint & Google Slides
Digital Marketing
Profit Performance Trend Chart Template for PowerPoint & Google Slides
Finance
Sales vs Budget Performance Chart Template for PowerPoint & Google Slides
Bar/Column

Website Performance Dashboard template for PowerPoint & Google Slides
Charts
Sales Performance Dashboard template for PowerPoint & Google Slides
Business Report
Performance Review Process Management Cycle template for PowerPoint & Google Slides
Employee Performance
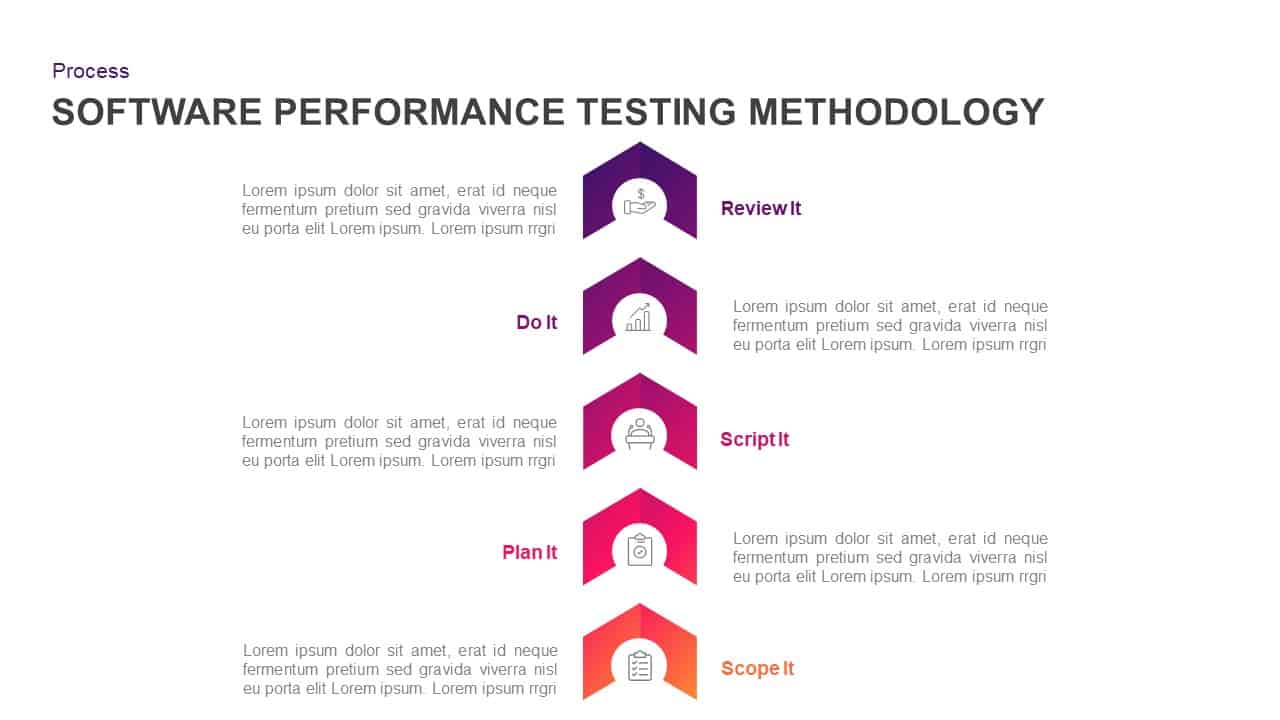
Software Performance Testing Methodology Template for PowerPoint & Google Slides
Process
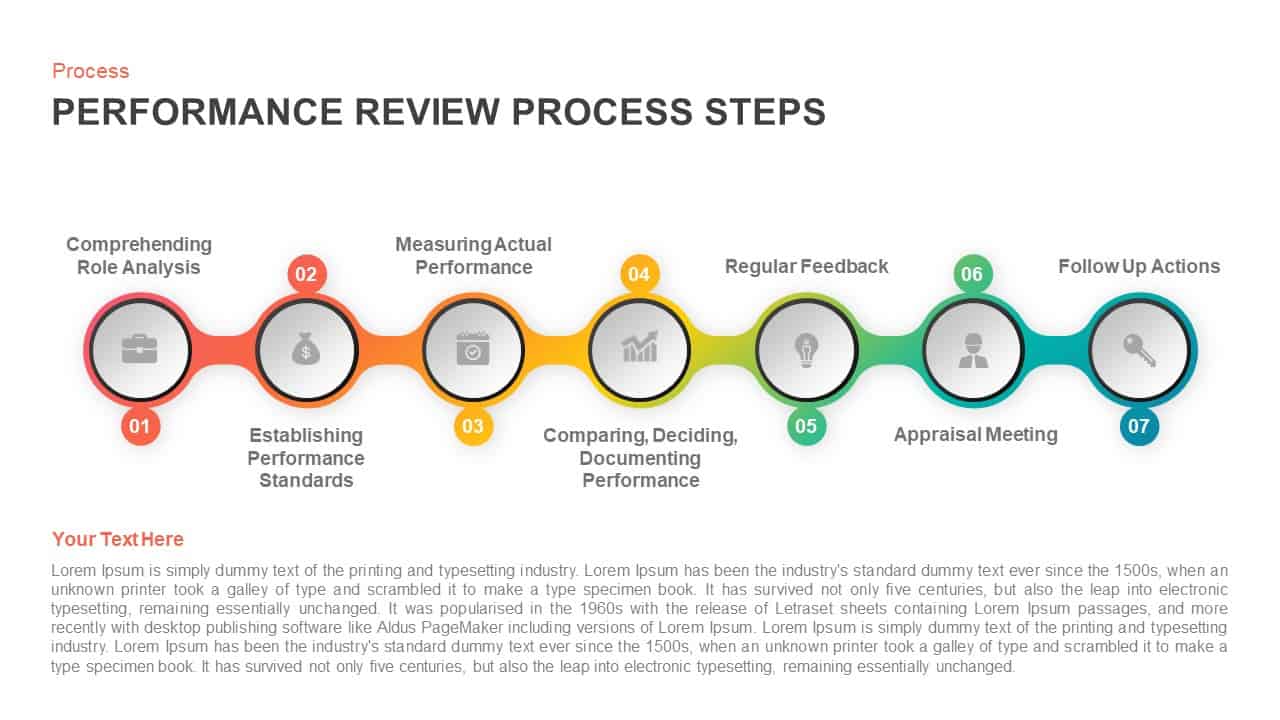
Performance Review Process Steps Template for PowerPoint & Google Slides
Employee Performance
Social Media Performance Dashboard Template for PowerPoint & Google Slides
Bar/Column
Professional Sales Performance Report Template for PowerPoint & Google Slides
Business Report
Performance Review Progress Management Template for PowerPoint & Google Slides
Process
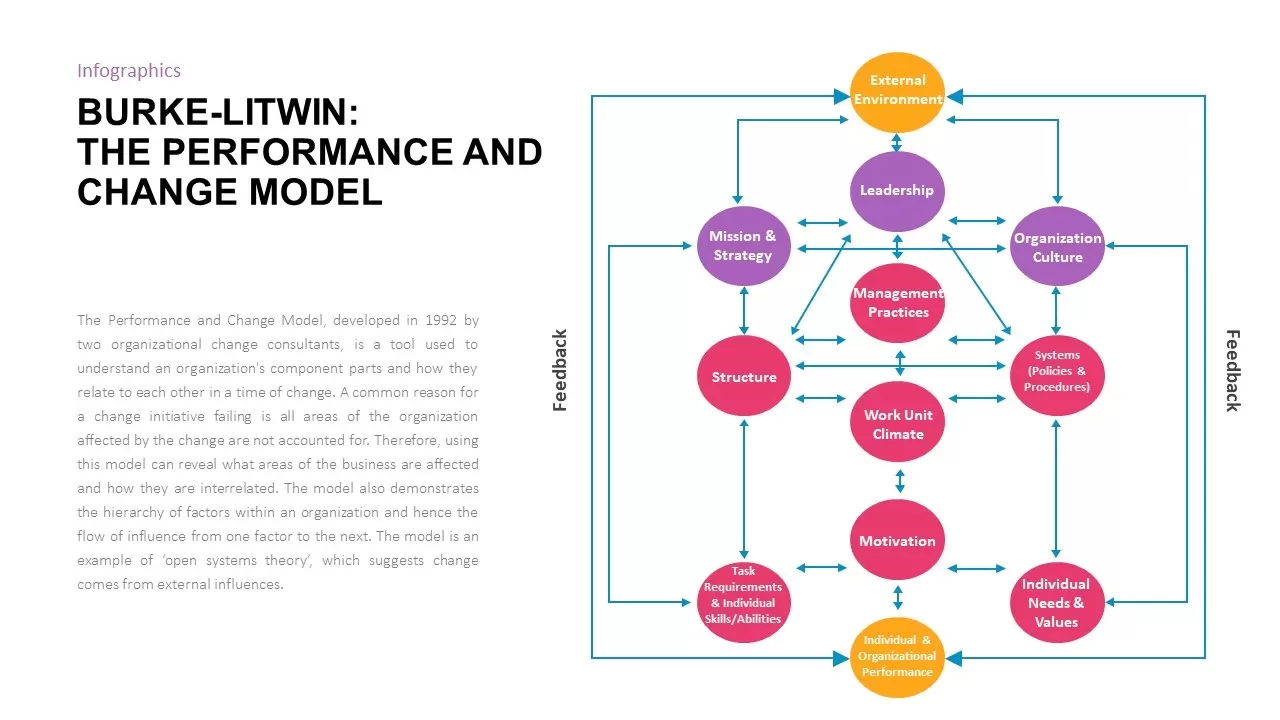
Burke-Litwin Performance and Change Model template for PowerPoint & Google Slides
Infographics
Corporate Performance Management Template for PowerPoint & Google Slides
Pitch Deck
Performance KPI Dashboard Slide Template for PowerPoint & Google Slides
Business Report
9-Box Matrix for Performance & Potential Template for PowerPoint & Google Slides
Employee Performance
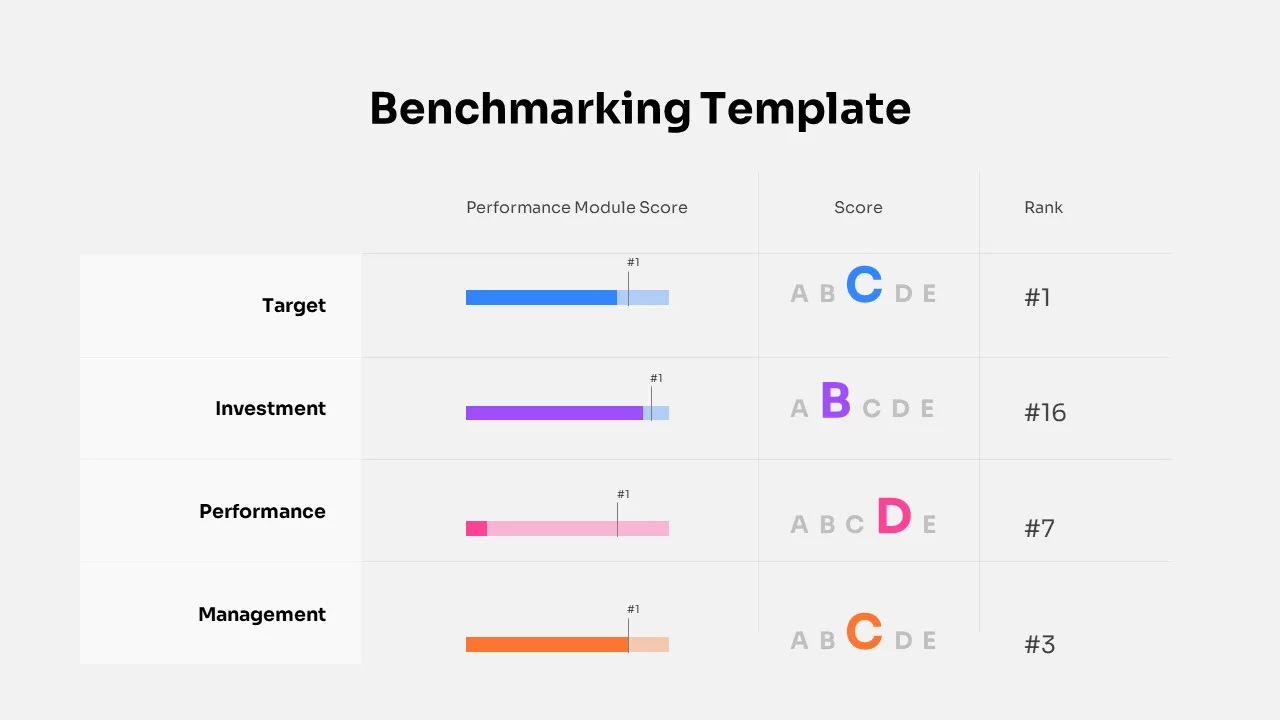
Benchmarking Performance Score Template for PowerPoint & Google Slides
Comparison Chart
Website Performance Monitoring Dashboard Template for PowerPoint & Google Slides
Business Report
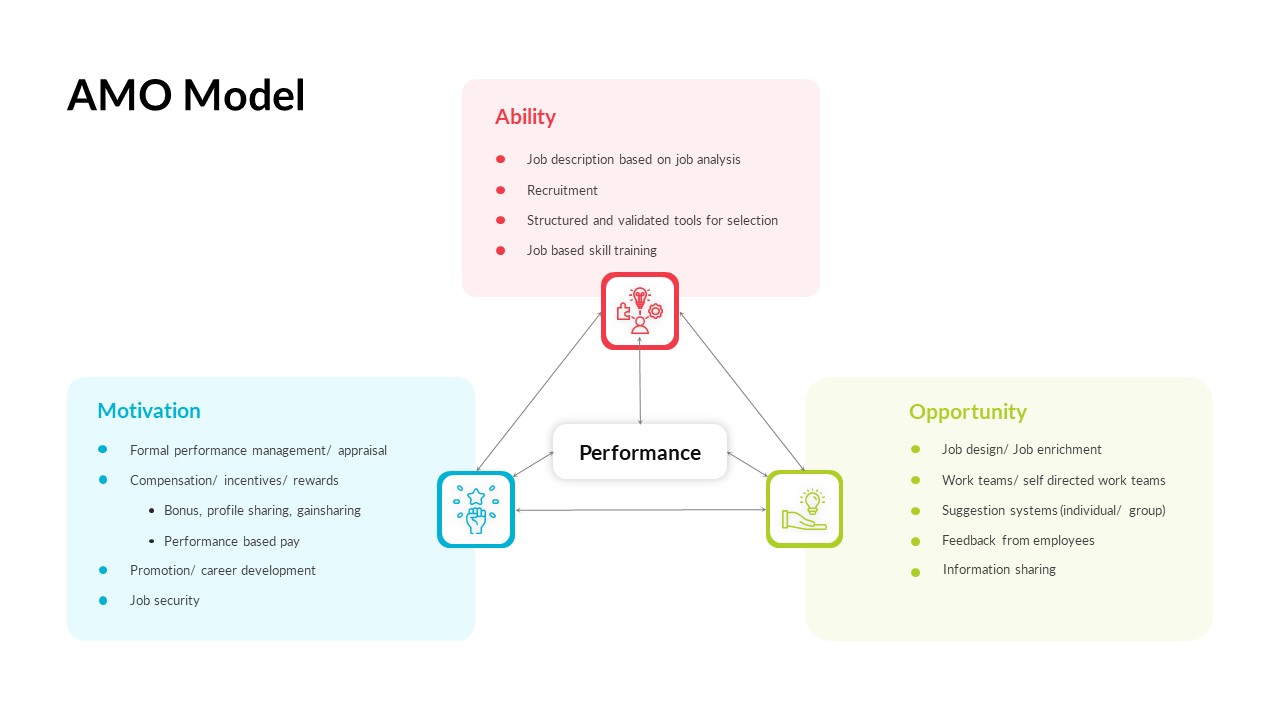
AMO Performance Model Feedback Diagram Template for PowerPoint & Google Slides
Employee Performance
Hits and Misses Performance Comparison Template for PowerPoint & Google Slides
Comparison
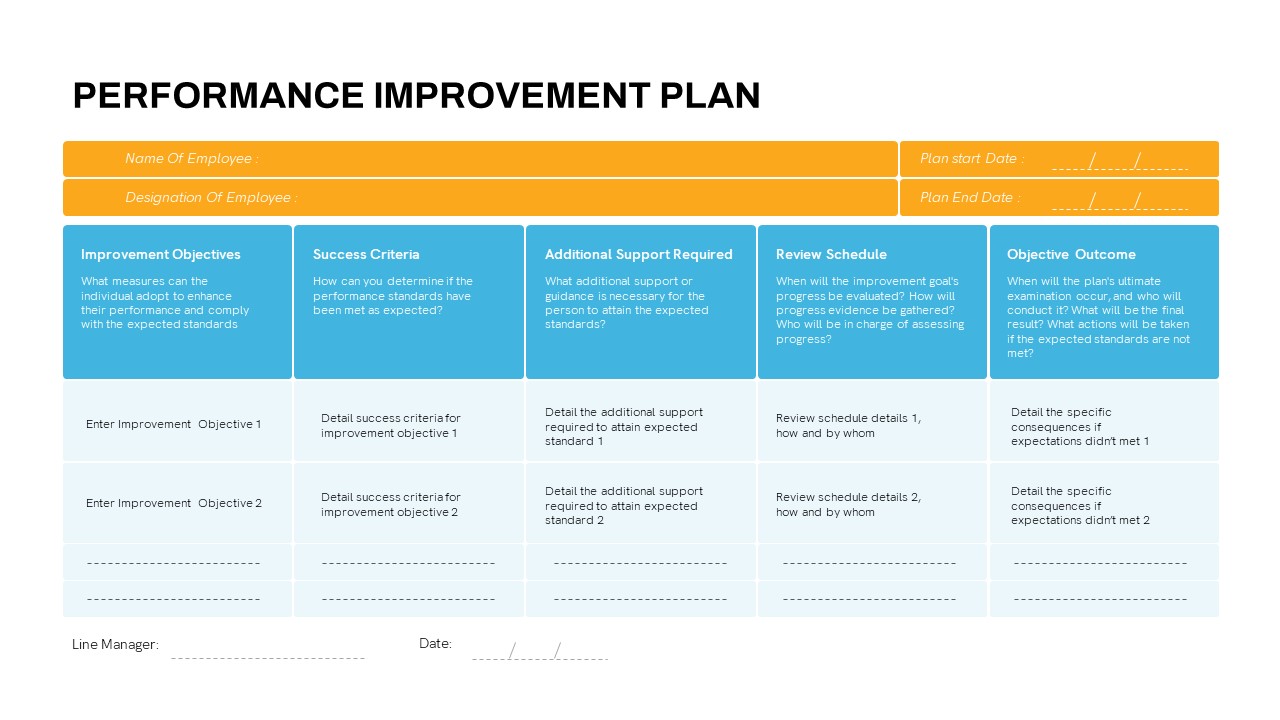
Detailed Performance Improvement Plan Template for PowerPoint & Google Slides
Employee Performance
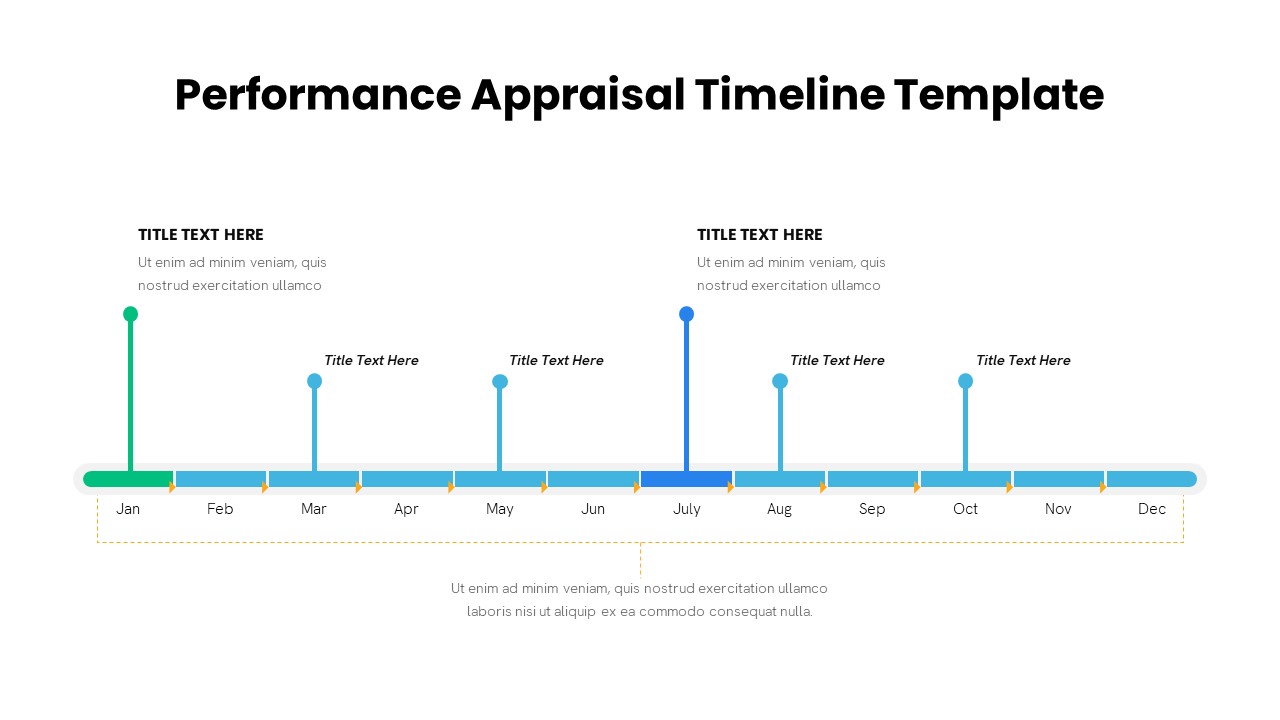
Performance Appraisal Timeline Diagram Template for PowerPoint & Google Slides
Timeline
DevOps KPI Dashboard Performance Metrics Template for PowerPoint & Google Slides
Software Development
Monthly Sales Performance Dashboard Template for PowerPoint & Google Slides
Charts
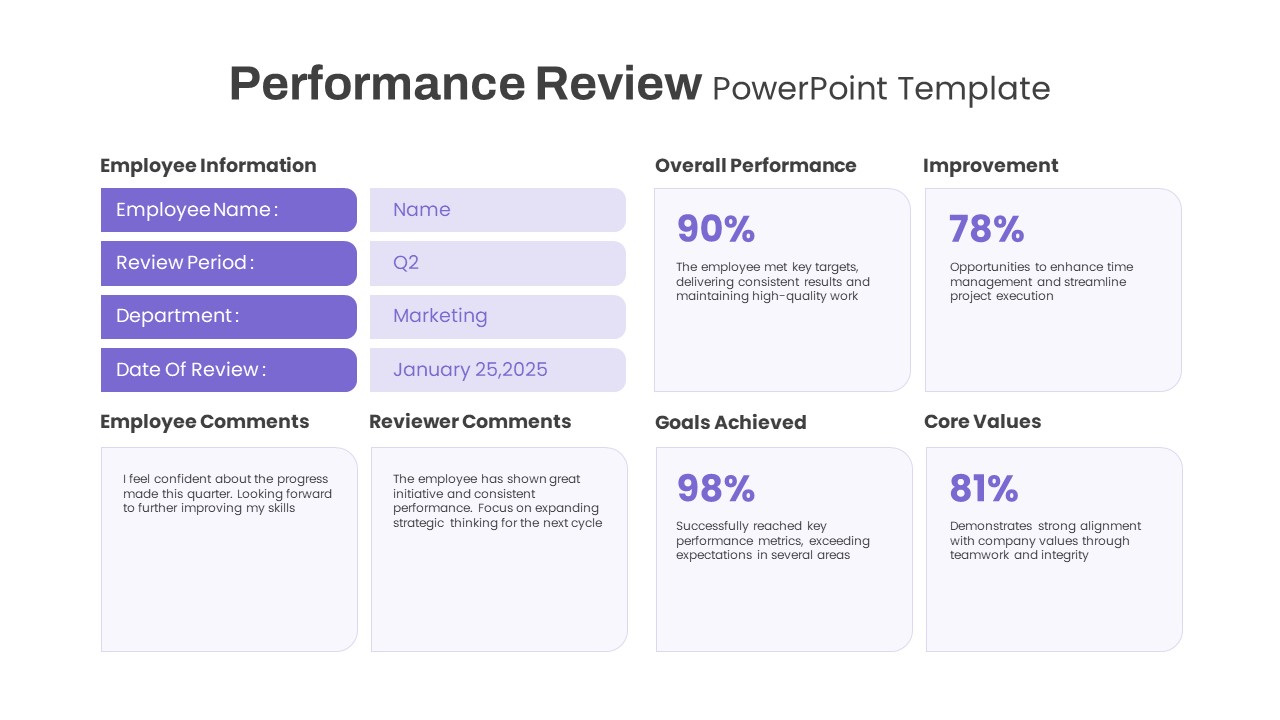
Performance Review template for PowerPoint & Google Slides
Employee Performance
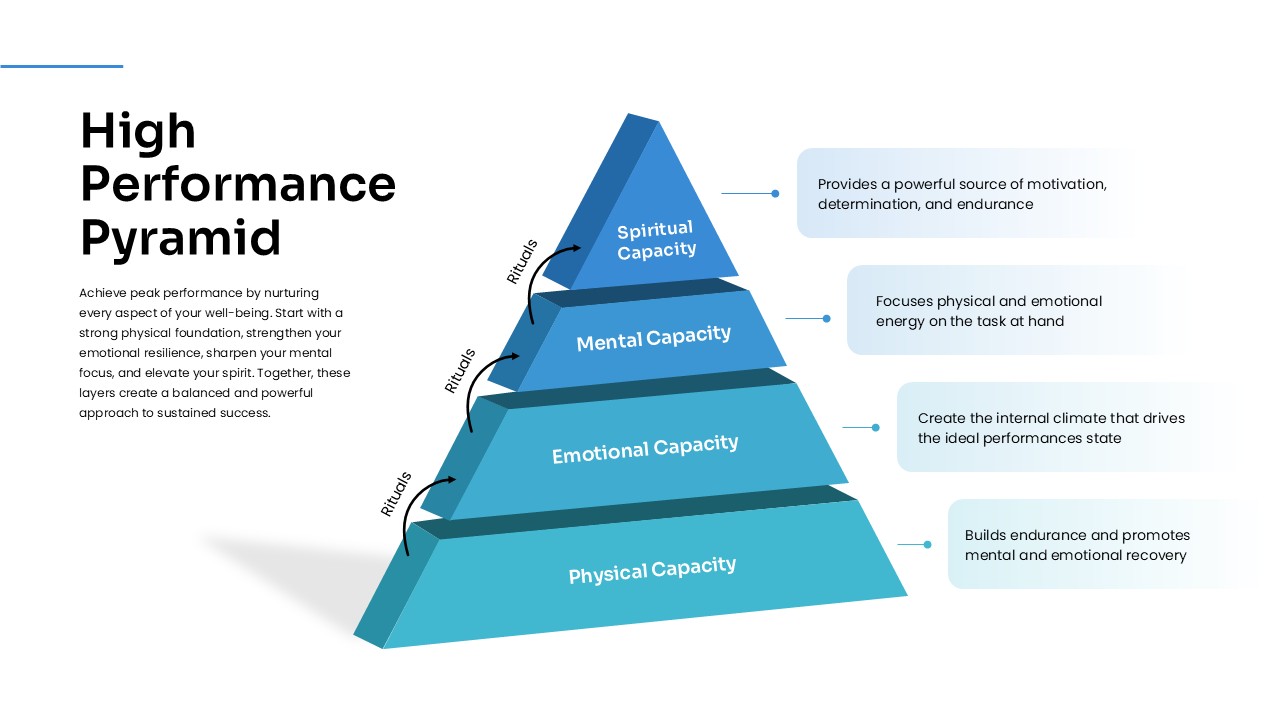
High Performance Pyramid Diagram Template for PowerPoint & Google Slides
Pyramid
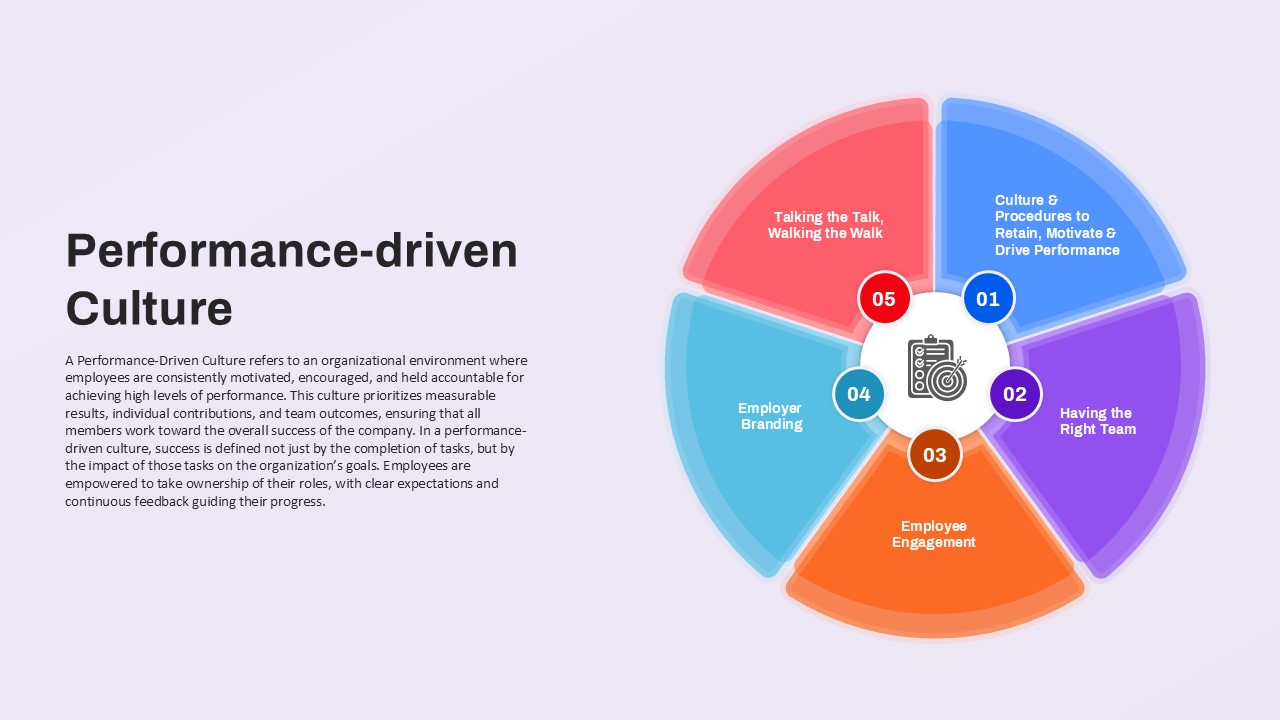
Performance-driven Culture framework template for PowerPoint & Google Slides
Leadership
Employee Performance Metrics Dashboard Template for PowerPoint & Google Slides
Employee Performance
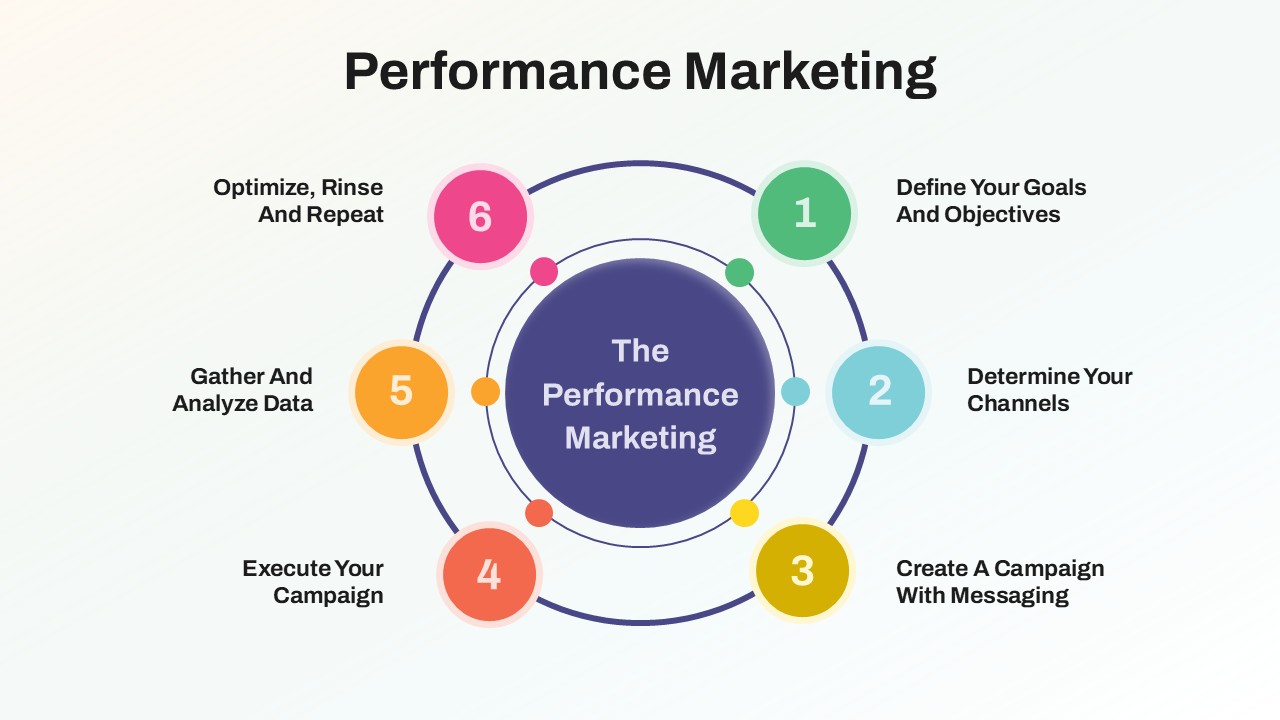
Performance Marketing Strategy template for PowerPoint & Google Slides
Digital Marketing
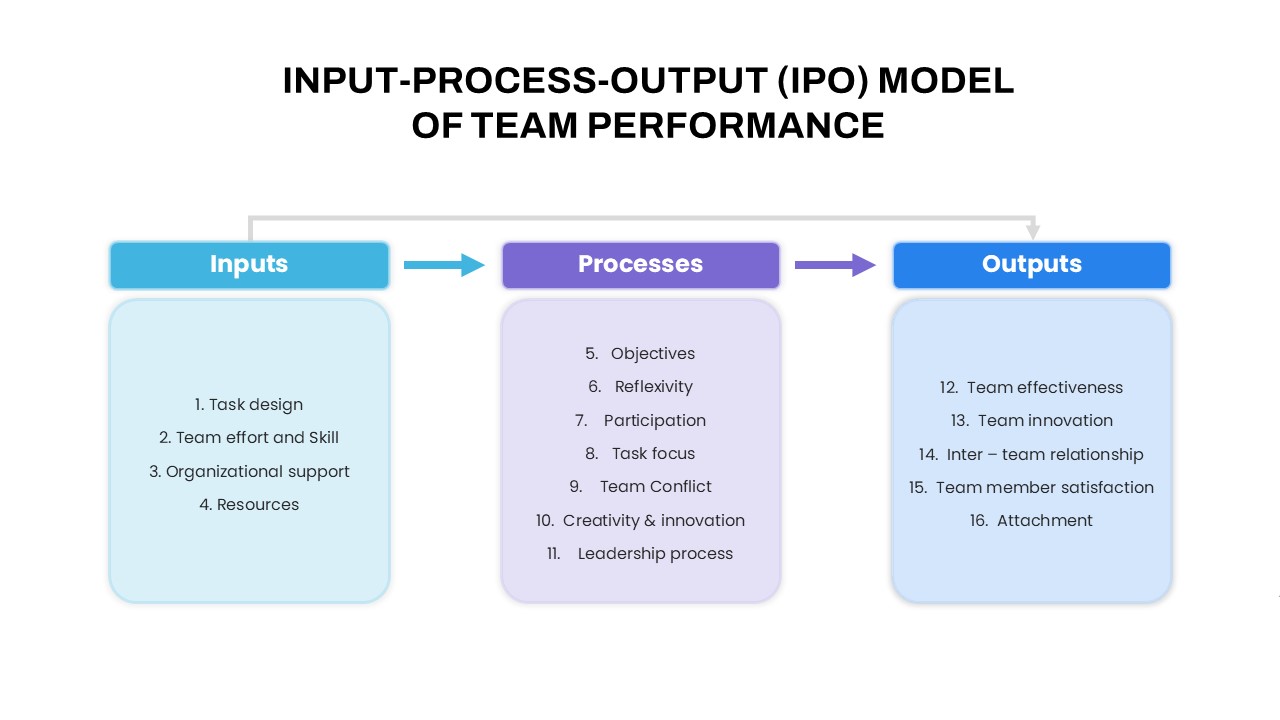
IPO Model of Team Performance for PowerPoint & Google Slides
Process
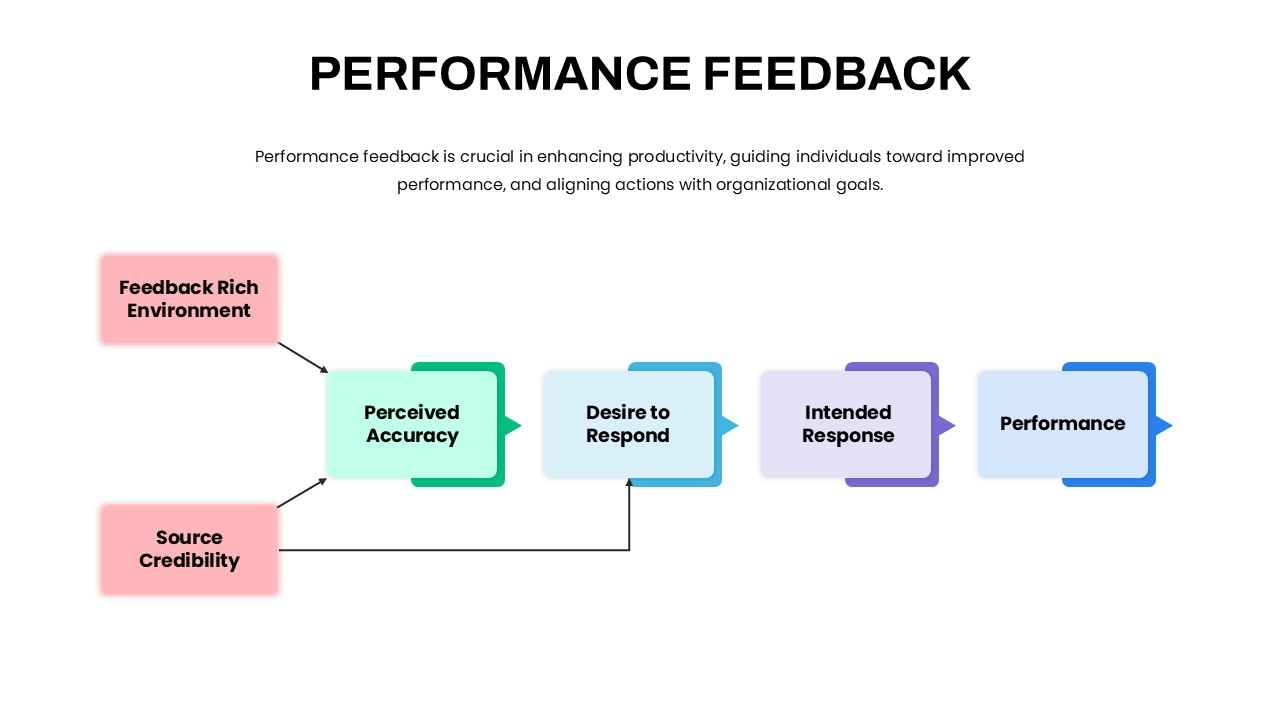
Performance Feedback Model for PowerPoint & Google Slides
Employee Performance
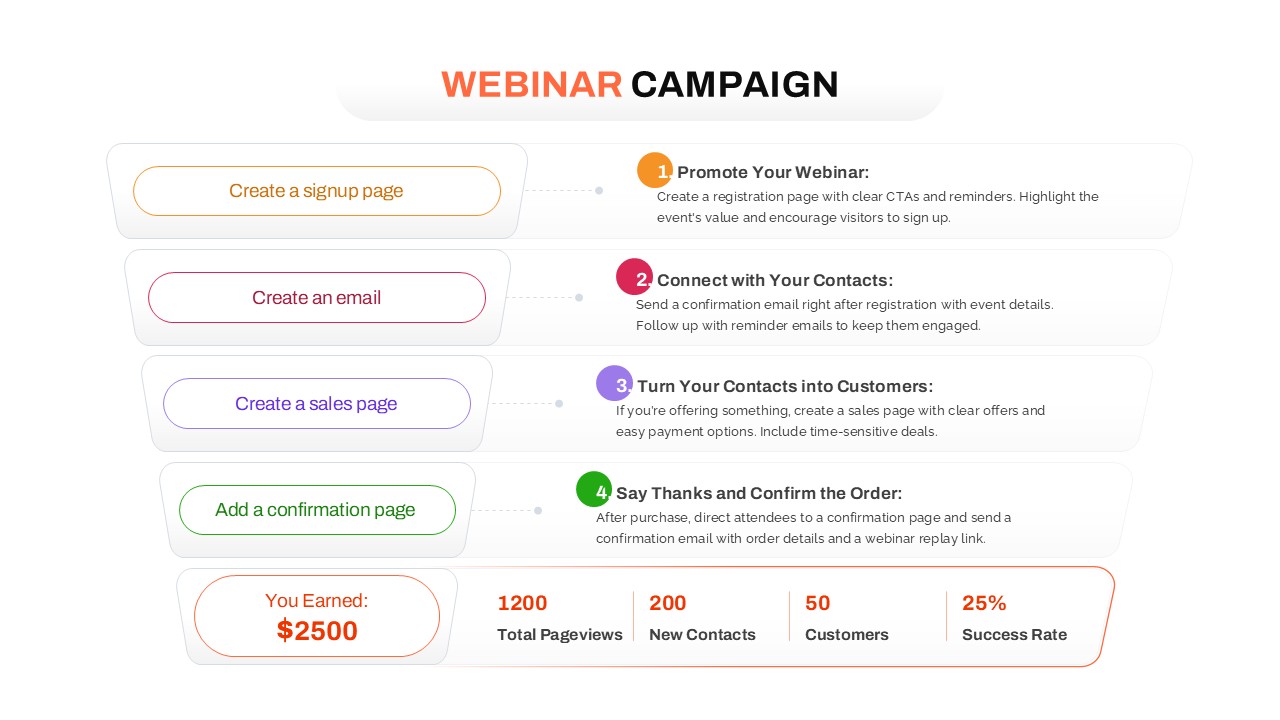
Webinar Campaign Steps and Performance for PowerPoint & Google Slides
Advertising
Free Global Market Distribution Map Template for PowerPoint & Google Slides
World Maps
Free
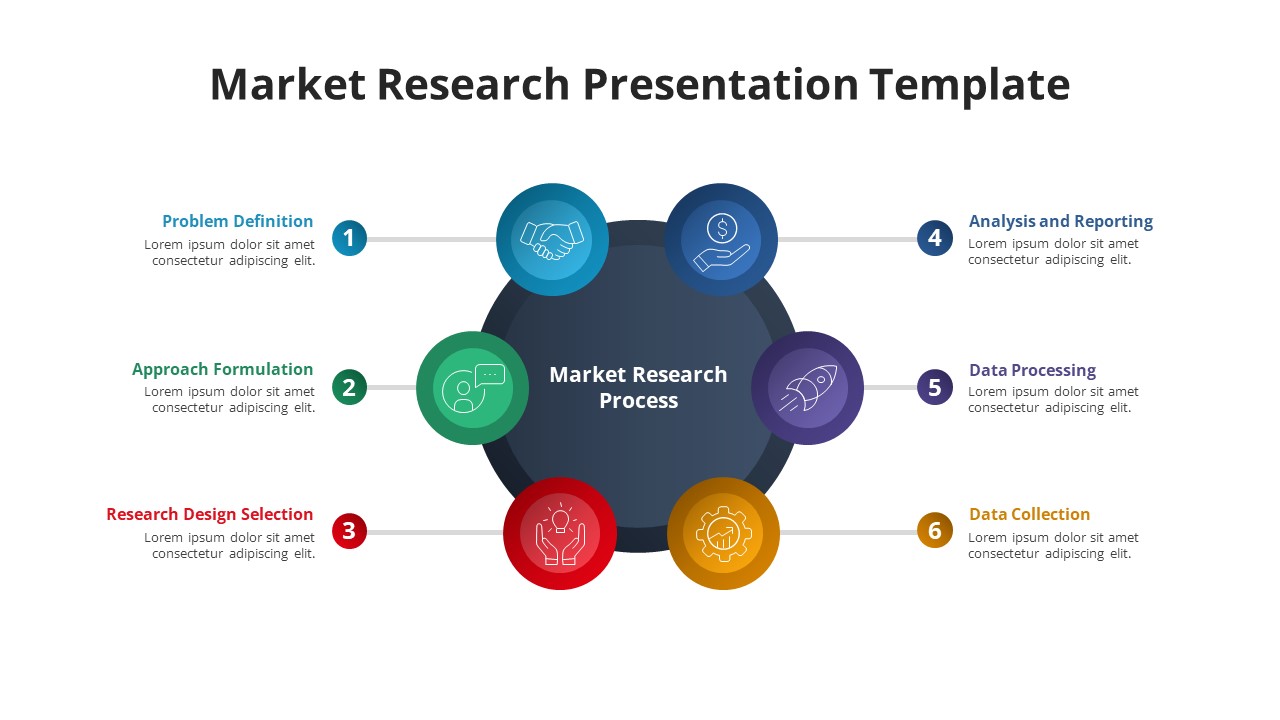
Free Six-Phase Market Research Process Template for PowerPoint & Google Slides
Process
Free
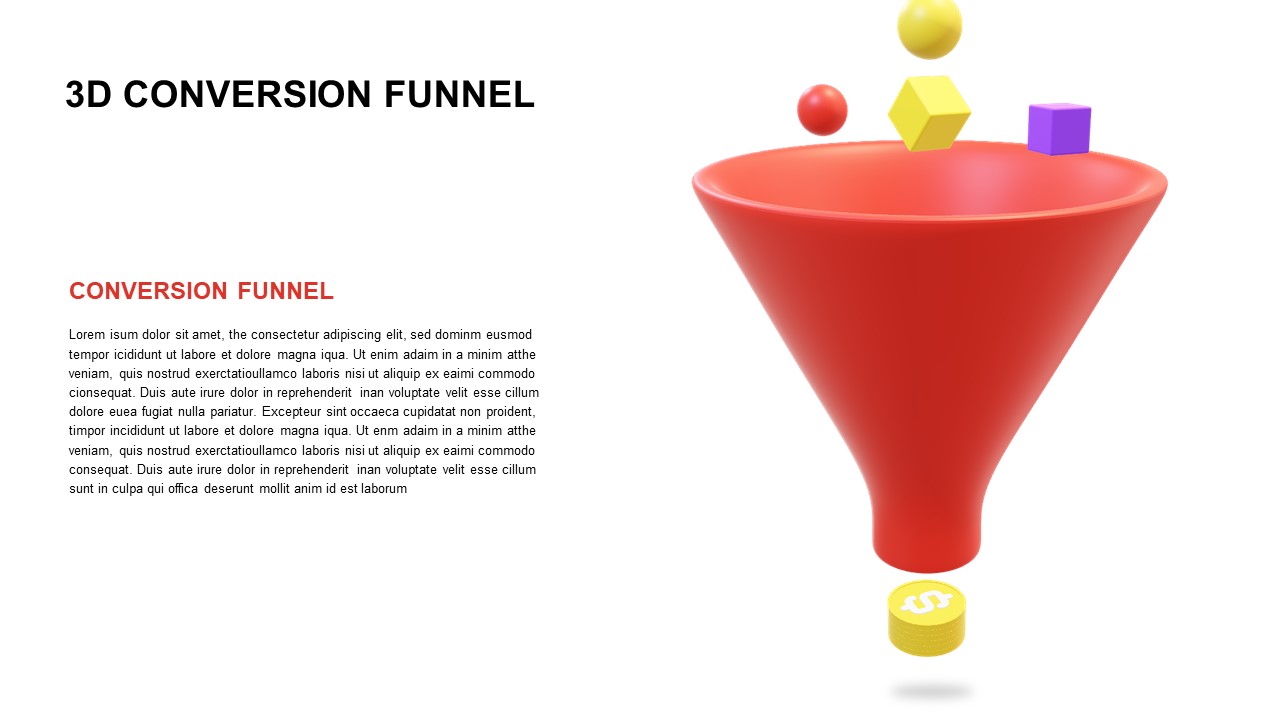
Free 3D Conversion Funnel Overview template for PowerPoint & Google Slides
Funnel
Free
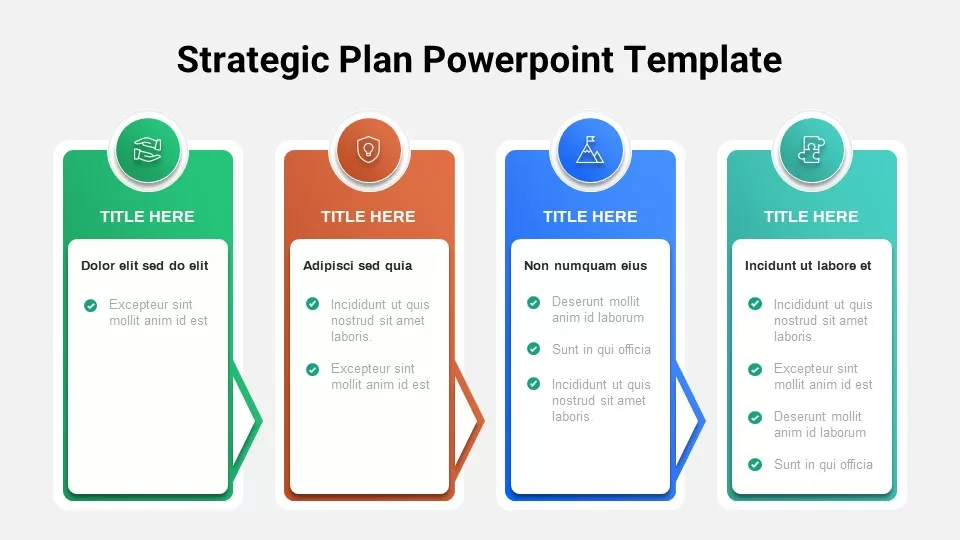
Free Strategic Plan Overview template for PowerPoint & Google Slides
Business Strategy
Free
Free Simple Venn Diagram Overview template for PowerPoint & Google Slides
Comparison Chart
Free
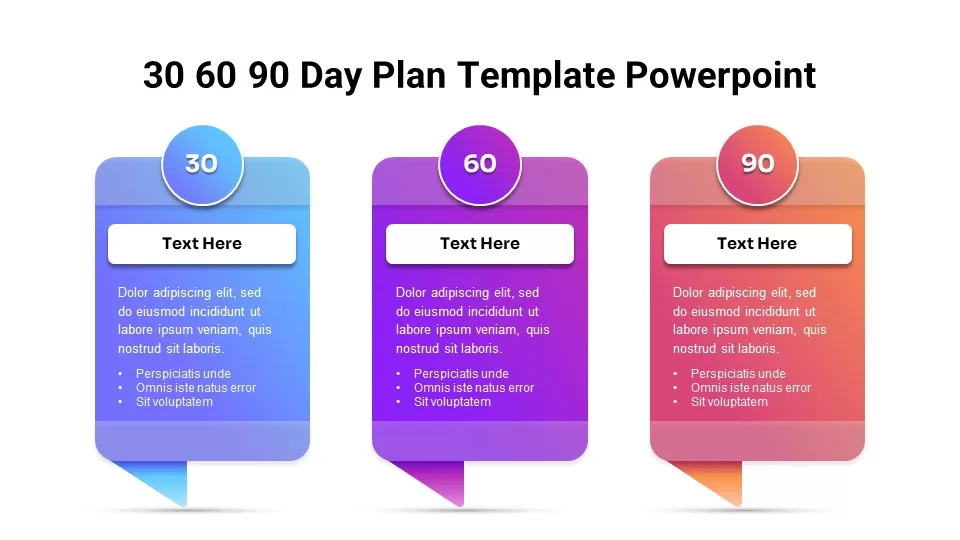
Free 30 60 90 Day Plan Overview template for PowerPoint & Google Slides
Business Plan
Free
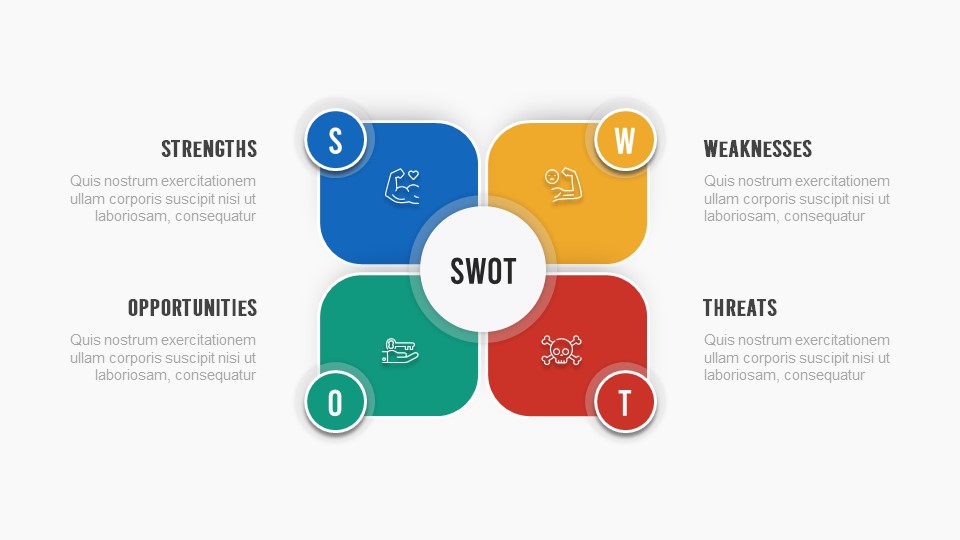
Free SWOT Analysis Overview template for PowerPoint & Google Slides
SWOT
Free
Free TikTok Marketing Analytics Overview Template for PowerPoint & Google Slides
Company Profile
Free
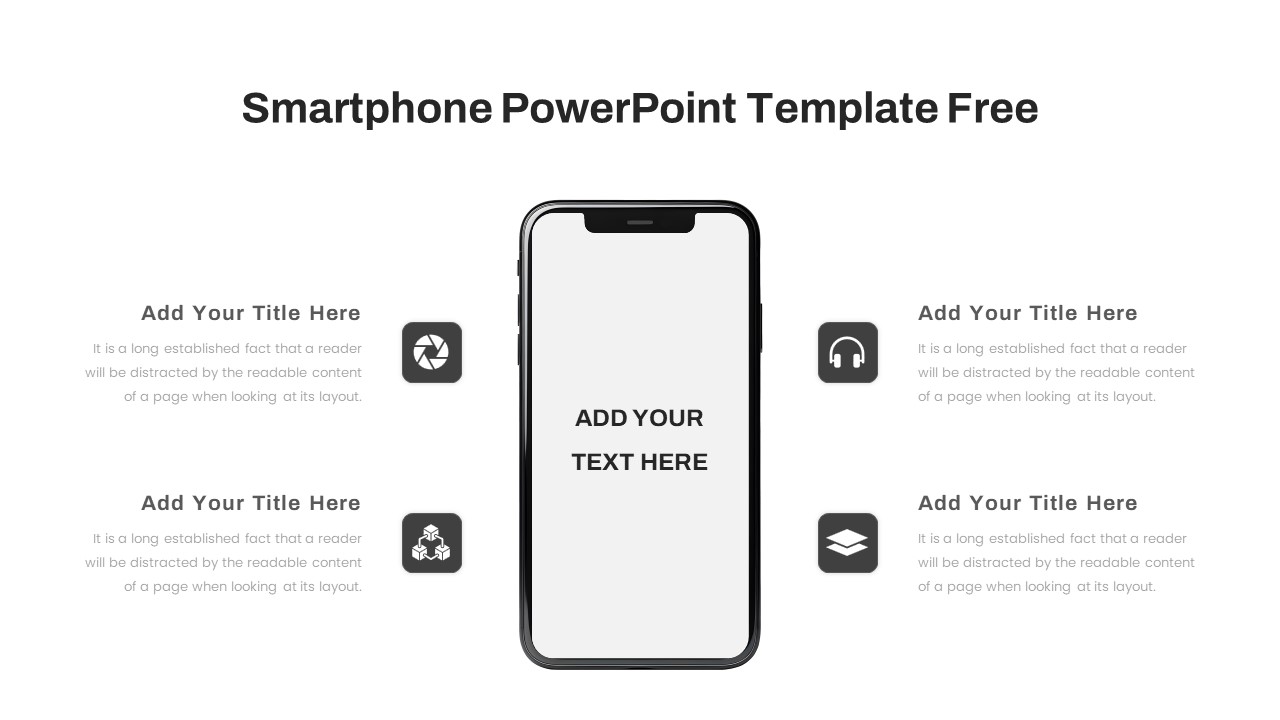
Free Minimal Smartphone Feature Overview Slide for PowerPoint & Google Slides
Information Technology
Free
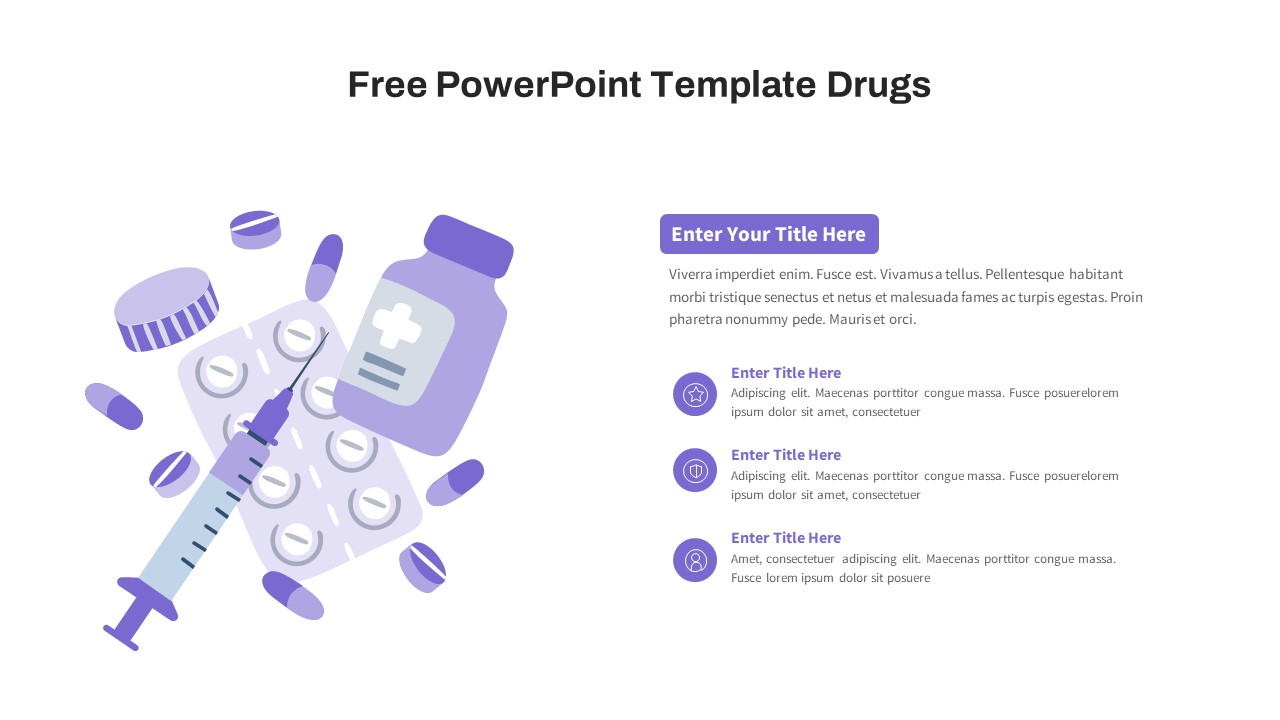
Free Drug and Medication Overview Slide for PowerPoint & Google Slides
Health
Free
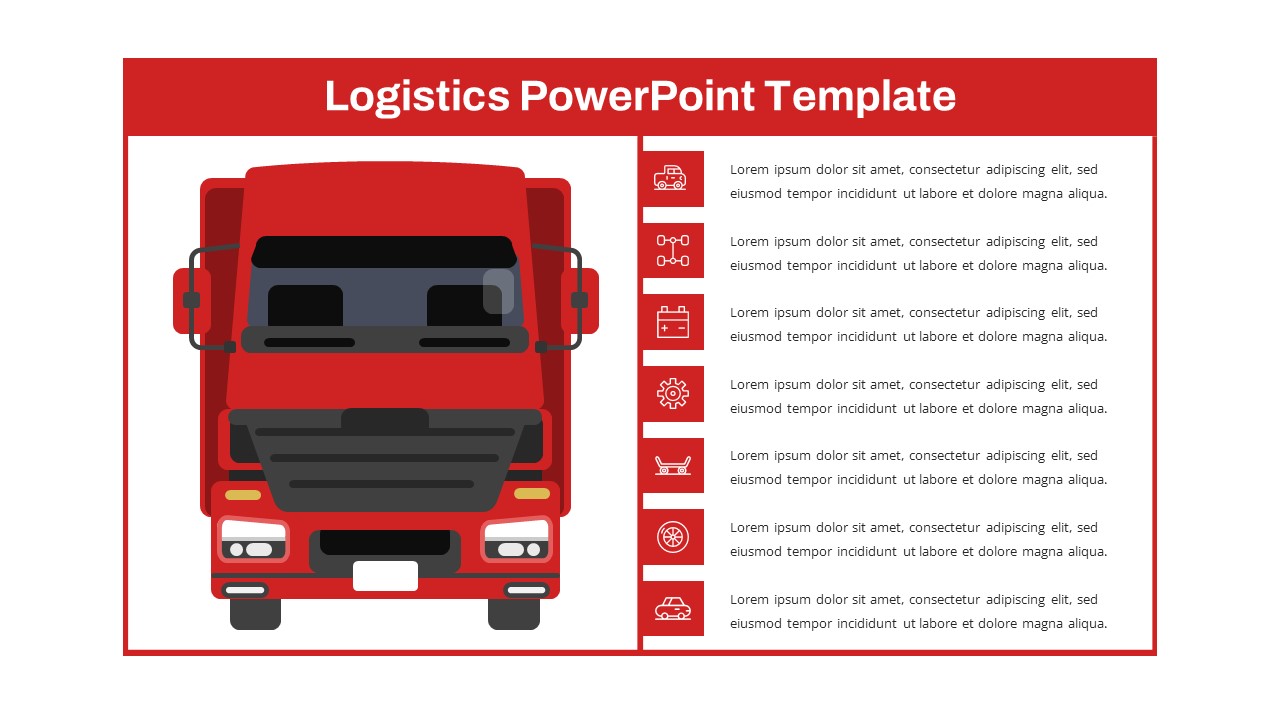
Free Red Truck Logistics Overview Slide for PowerPoint & Google Slides
Infographics
Free
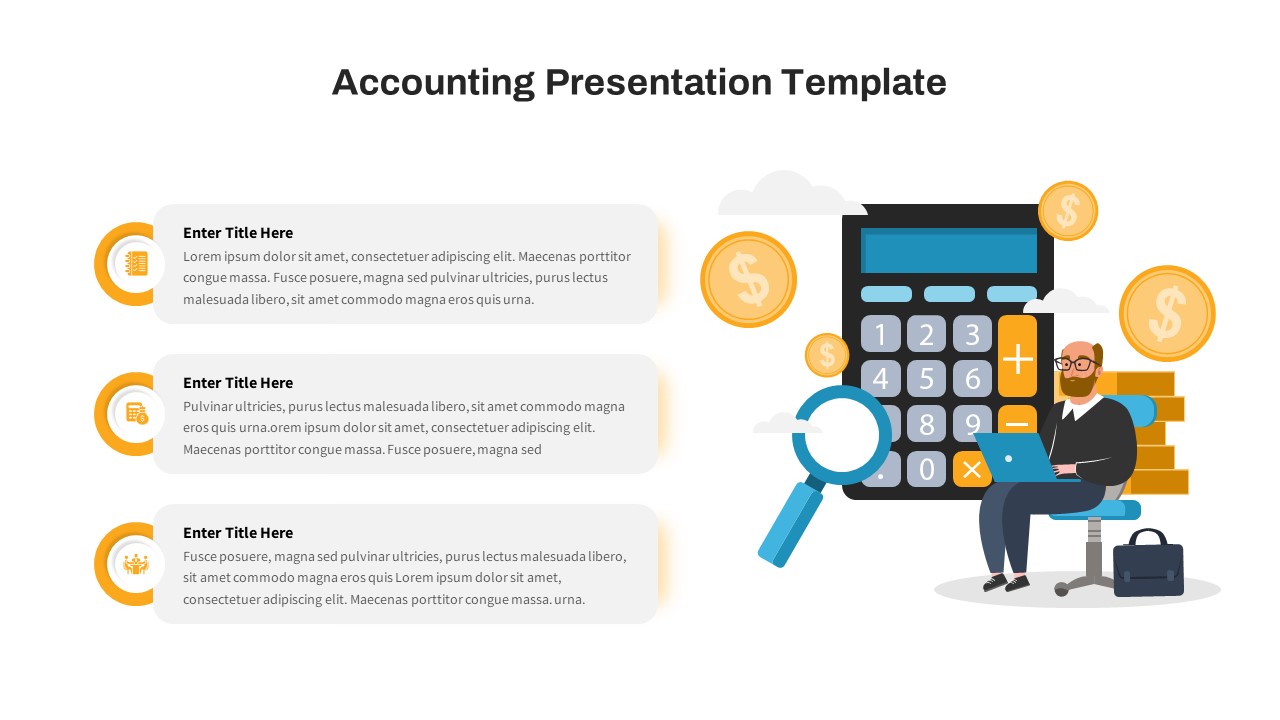
Free Financial Accounting Overview Slide for PowerPoint & Google Slides
Accounting
Free
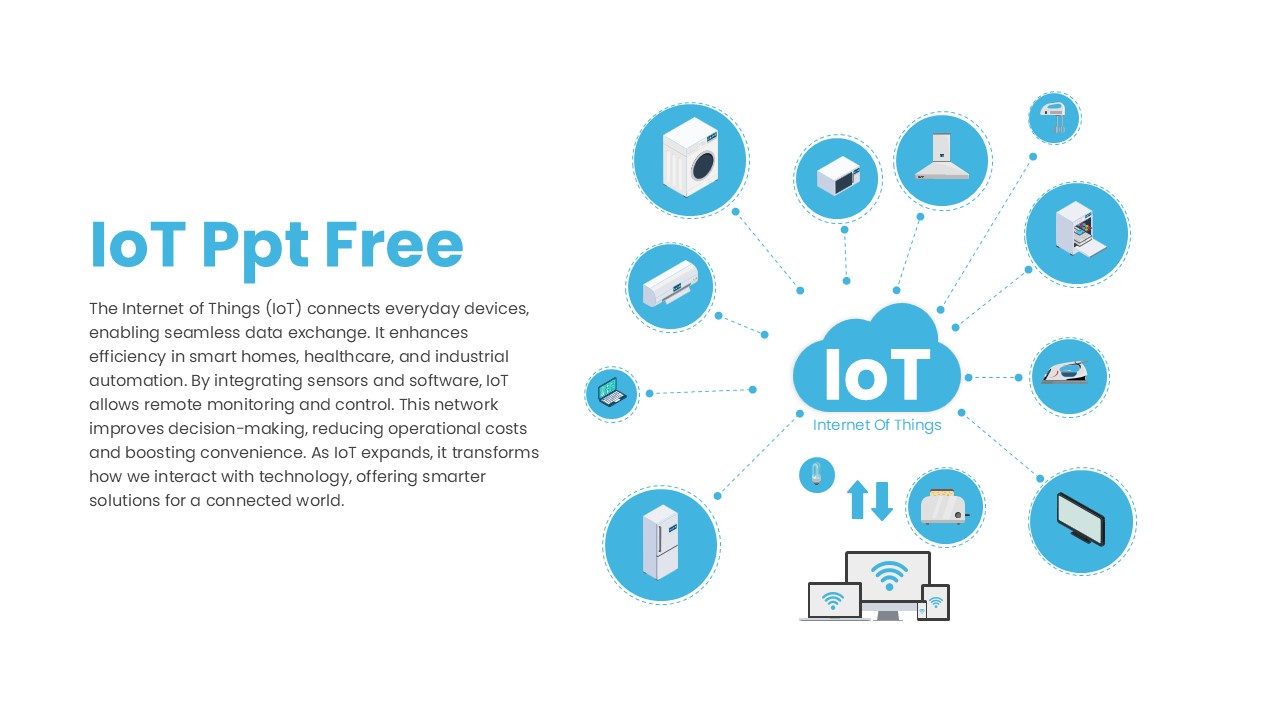
Free IoT Overview for PowerPoint & Google Slides
Technology
Free

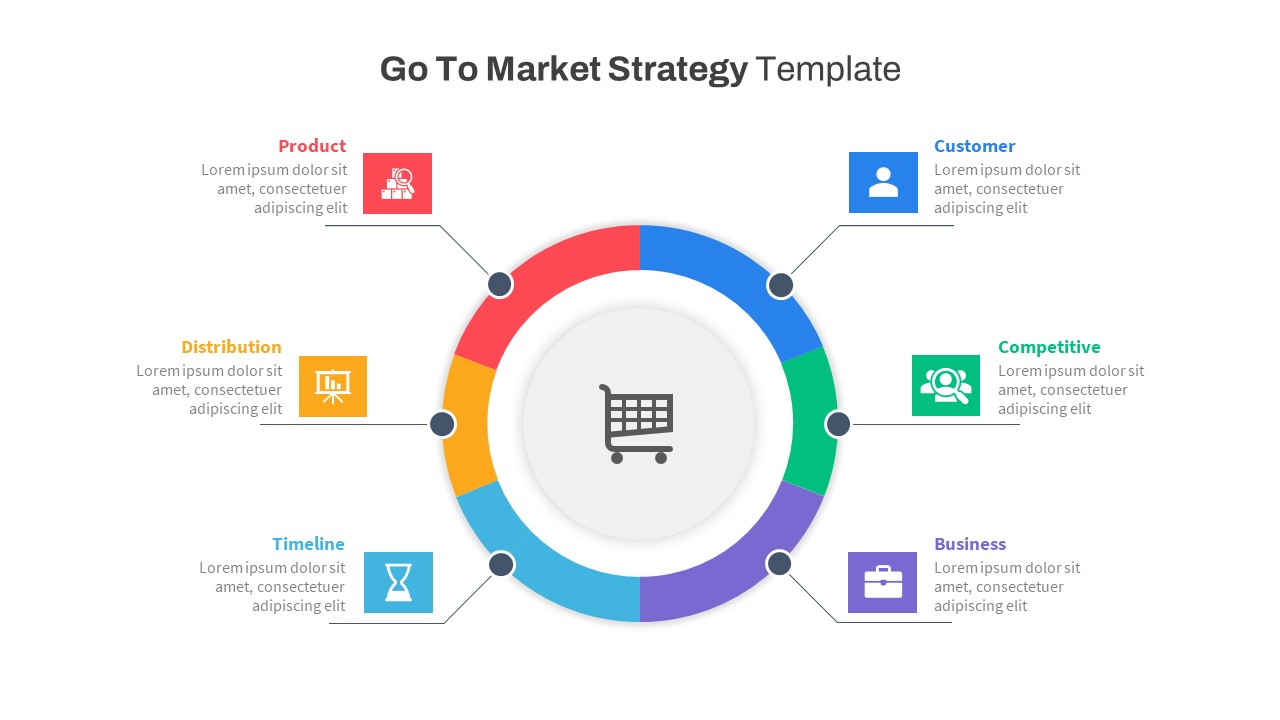
Go-to-Market Strategy PowerPoint Template for PowerPoint & Google Slides
Marketing
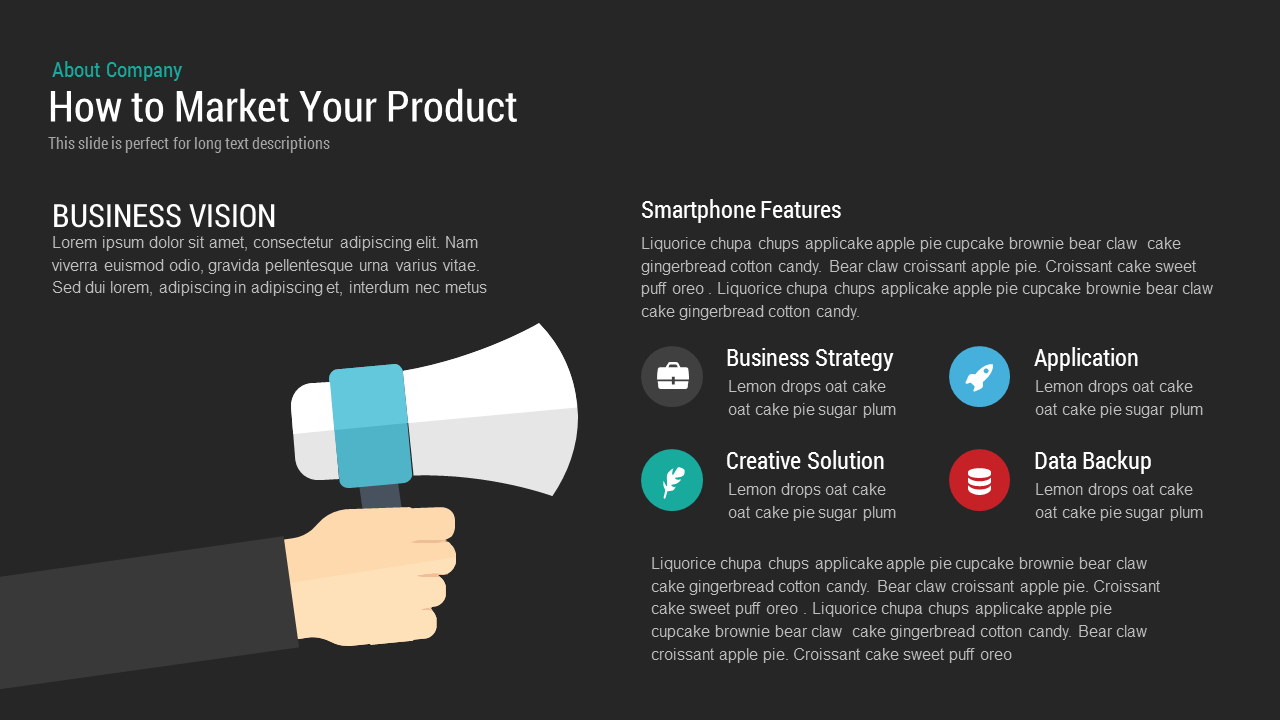
How to Market Your Product template for PowerPoint & Google Slides
Business Strategy
Free
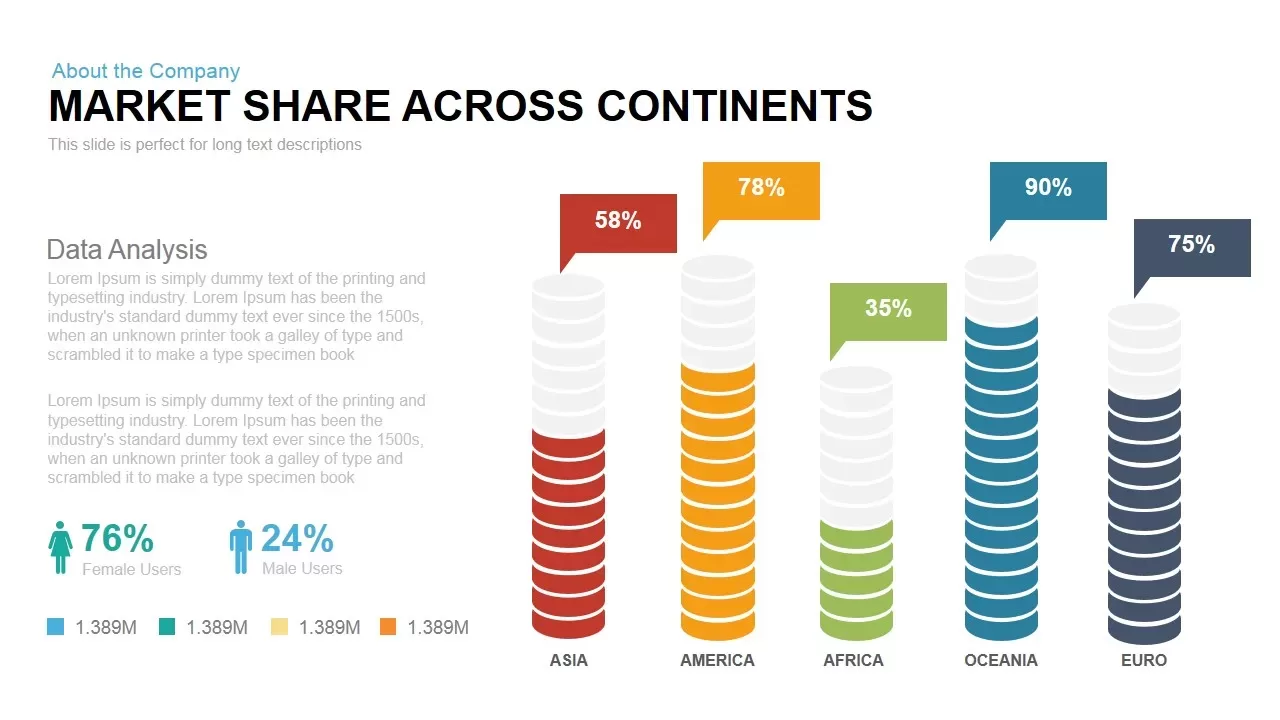
Global Market Share Cylinder Chart Template for PowerPoint & Google Slides
Bar/Column
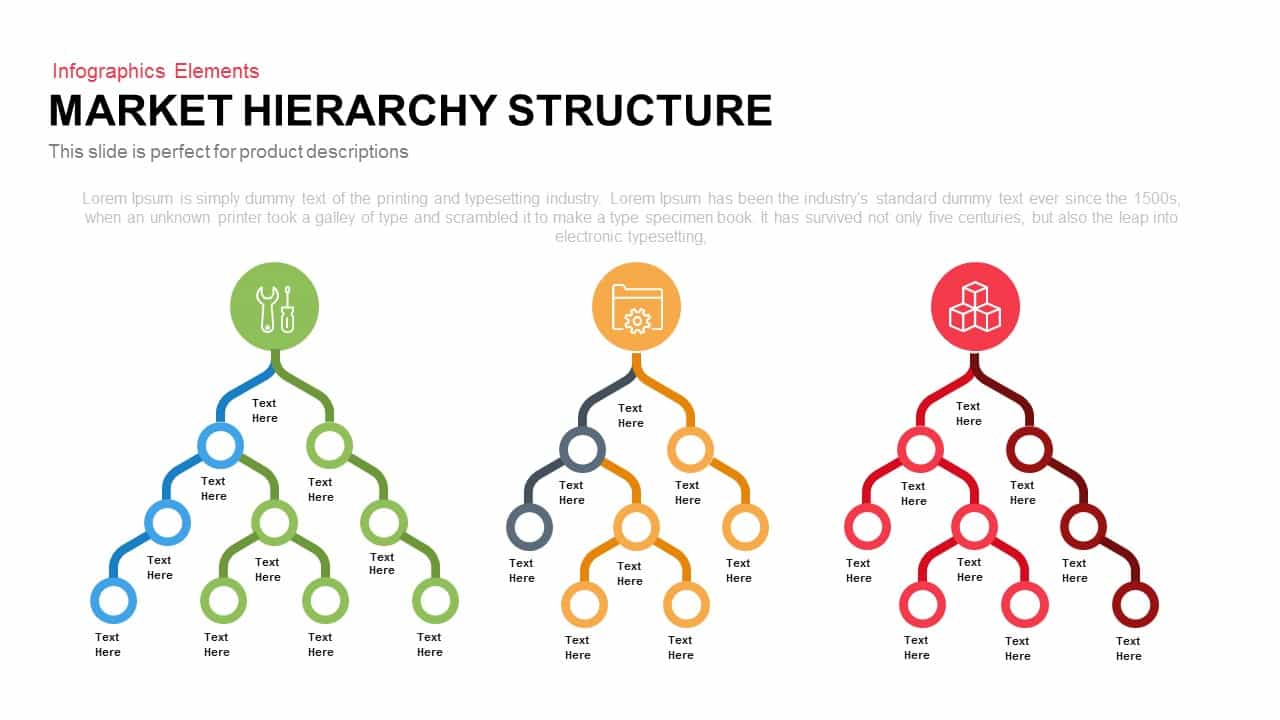
Market Hierarchy Structure Infographic template for PowerPoint & Google Slides
Org Chart
Market Development Matrix Chart Template for PowerPoint & Google Slides
Comparison Chart
Social Media Market Share Pie Charts Template for PowerPoint & Google Slides
Pie/Donut
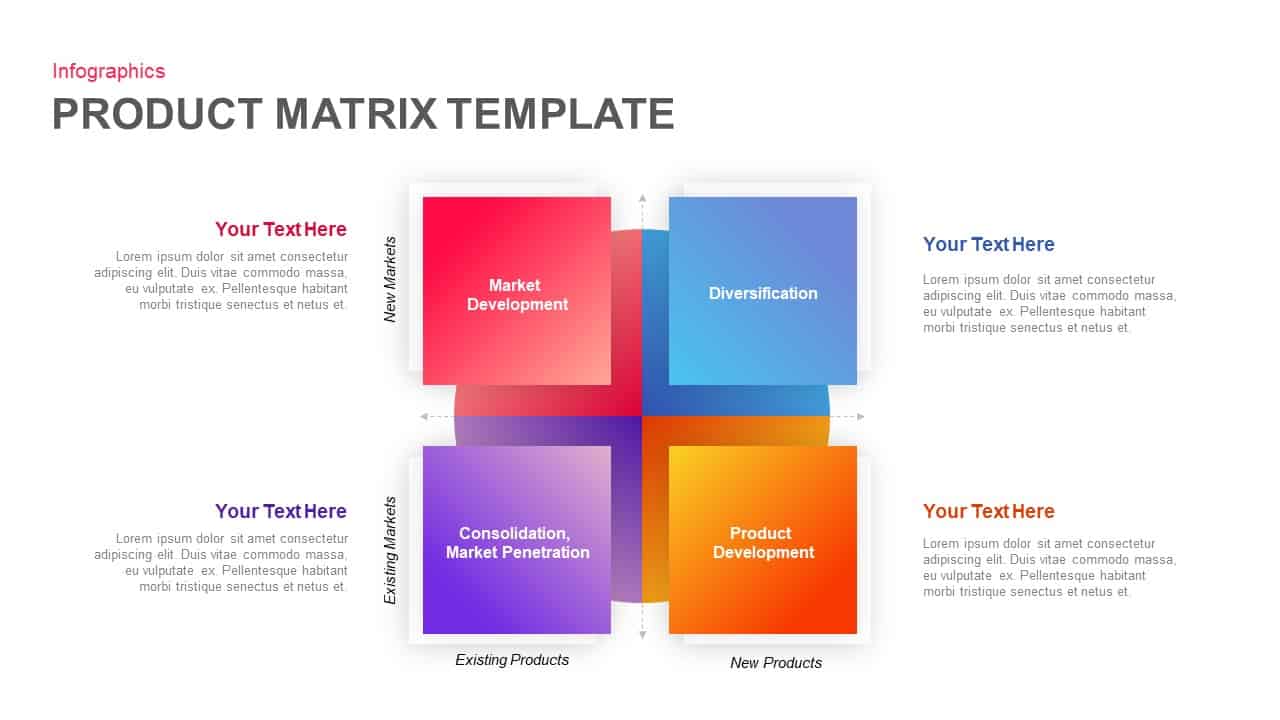
Product Market Expansion Matrix Template for PowerPoint & Google Slides
Business
Car Sales Market Share Pie Chart Template for PowerPoint & Google Slides
BCG
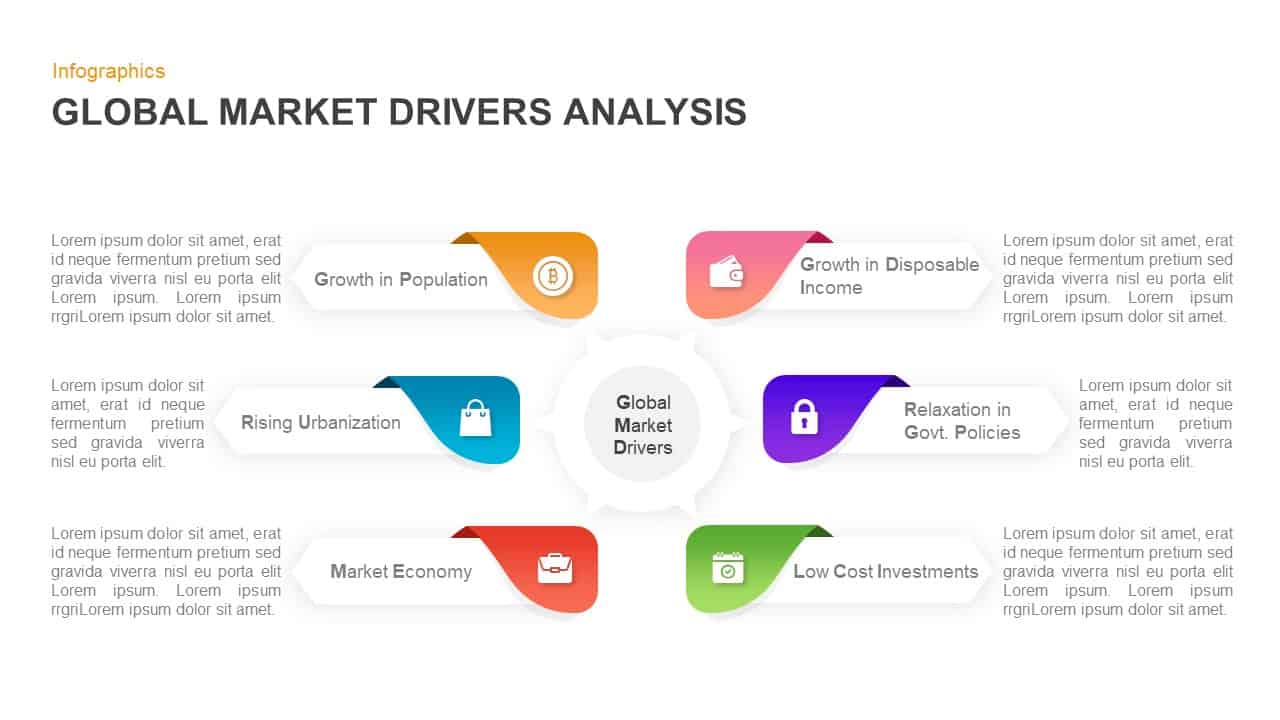
Circular Market Drivers Infographic Template for PowerPoint & Google Slides
Circular

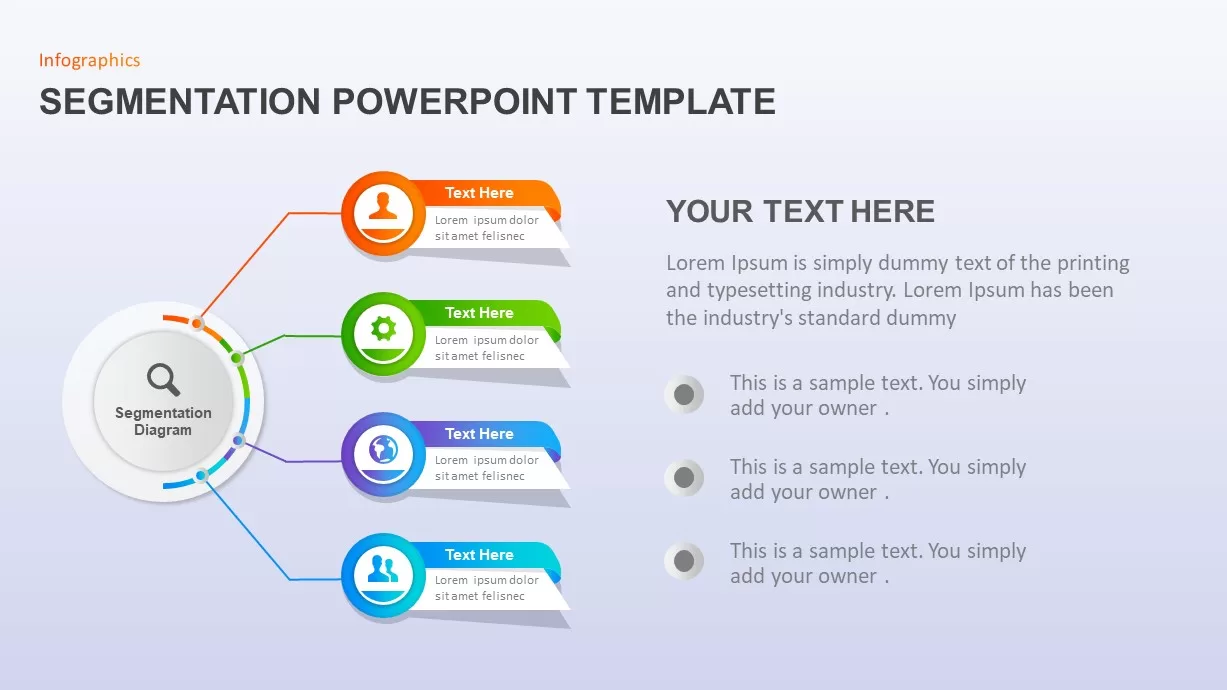
Market Segmentation & STP Infographics Pack Template for PowerPoint & Google Slides
Marketing
Business Case Deck with Market Analysis Template for PowerPoint & Google Slides
Business Report
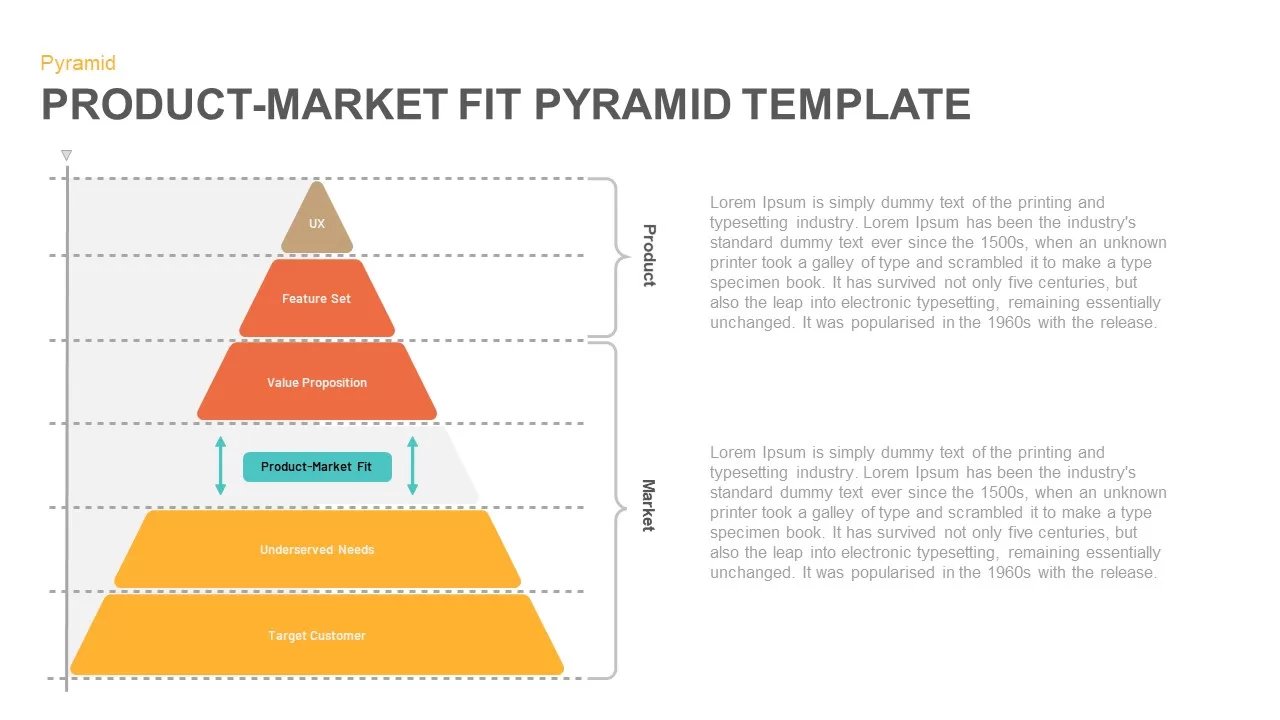
Product-Market Fit Pyramid template for PowerPoint & Google Slides
Pyramid
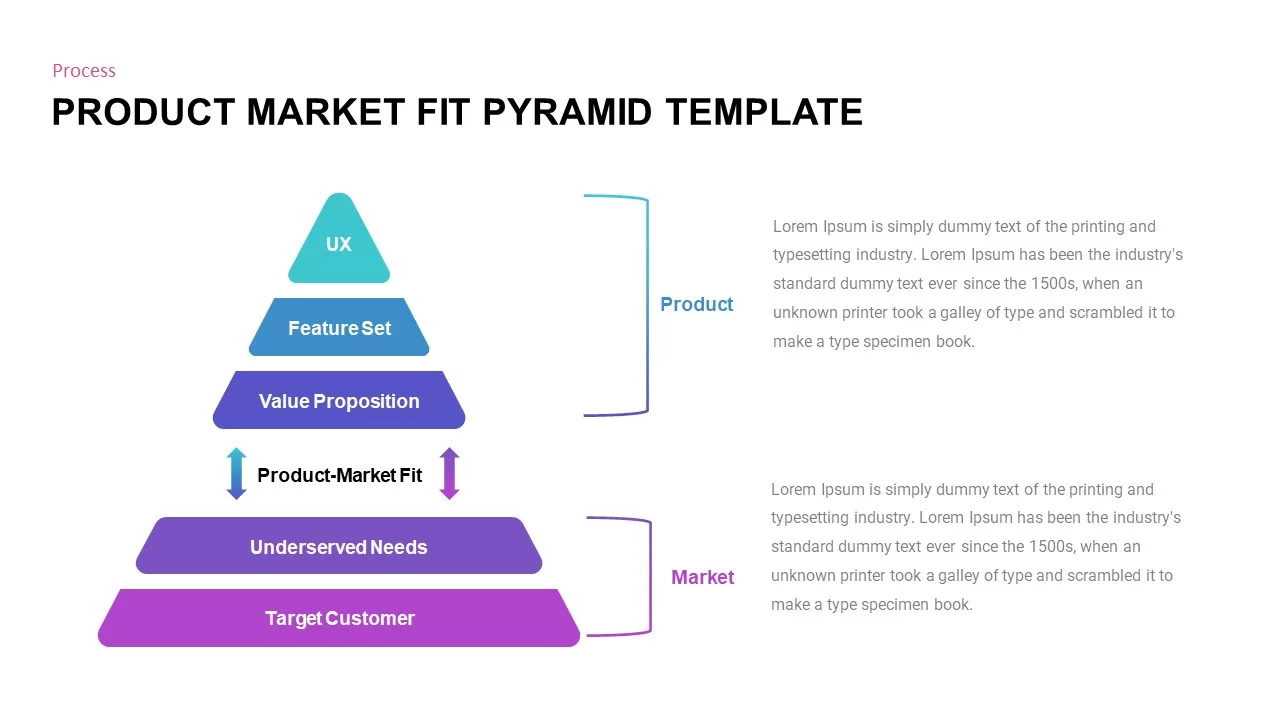
Professional Product Market Fit Pyramid Template for PowerPoint & Google Slides
Pyramid
Business Review Deck with Market Updates Template for PowerPoint & Google Slides
Company Profile
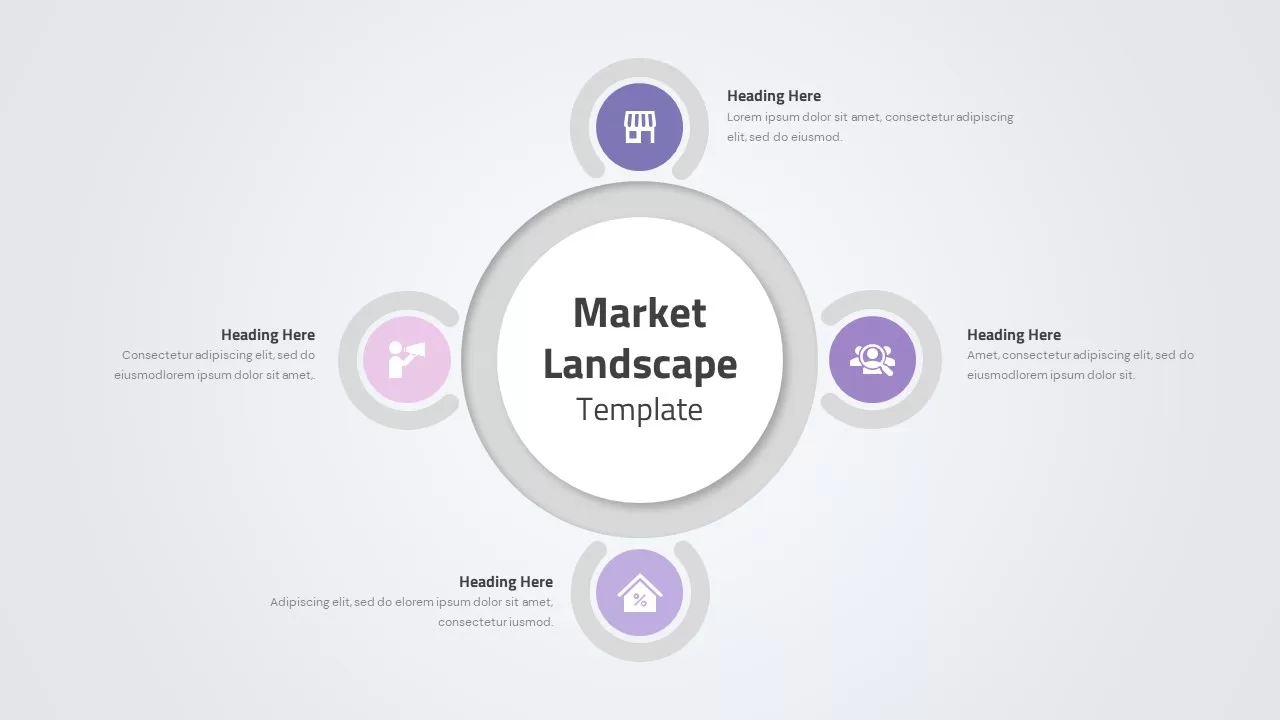
Market Landscape Hub and Spoke Diagram Template for PowerPoint & Google Slides
Infographics
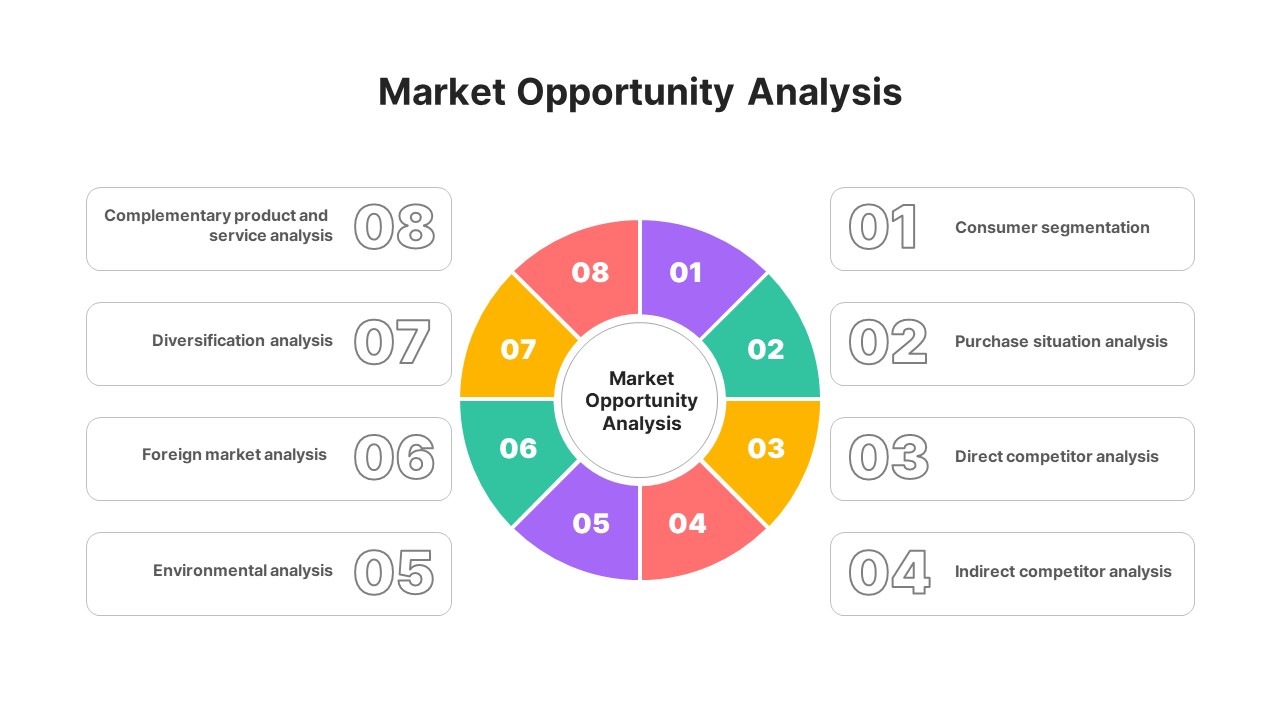
Market Opportunity Analysis Wheel template for PowerPoint & Google Slides
Business Strategy
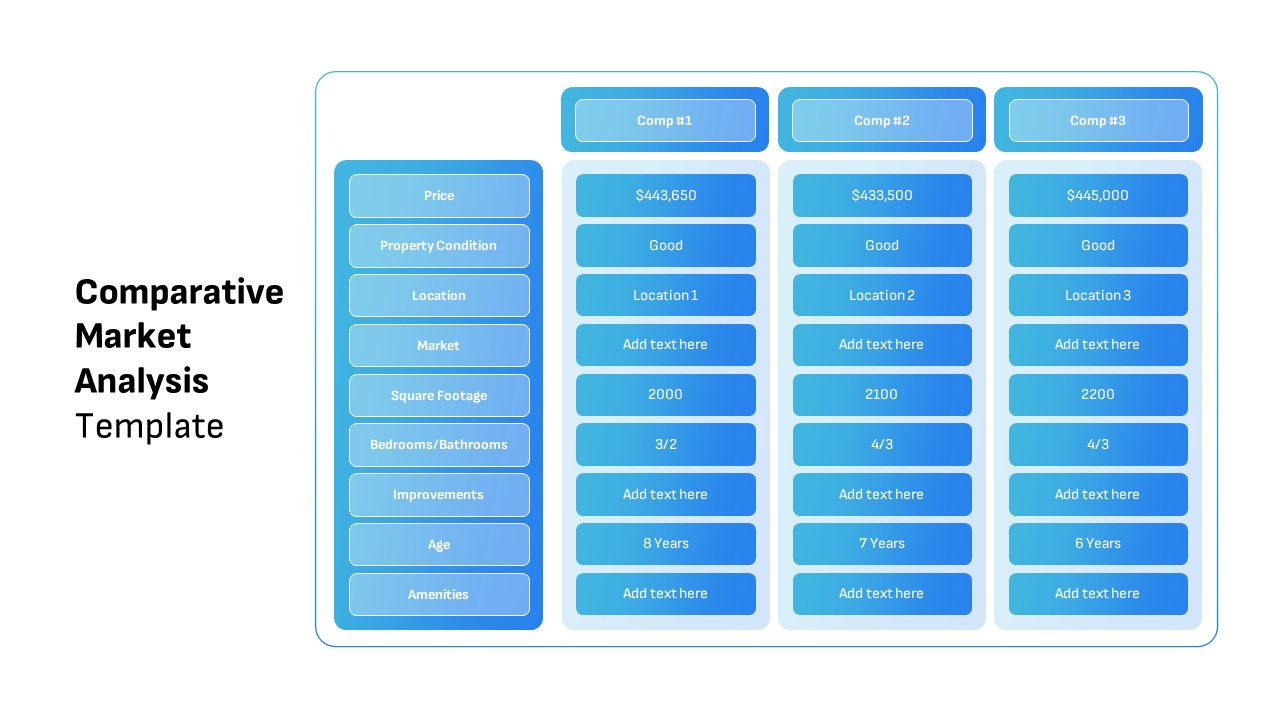
Comparative Market Analysis Template for PowerPoint & Google Slides
Comparison
Circular Go To Market Strategy Template for PowerPoint & Google Slides
Business Strategy
Free
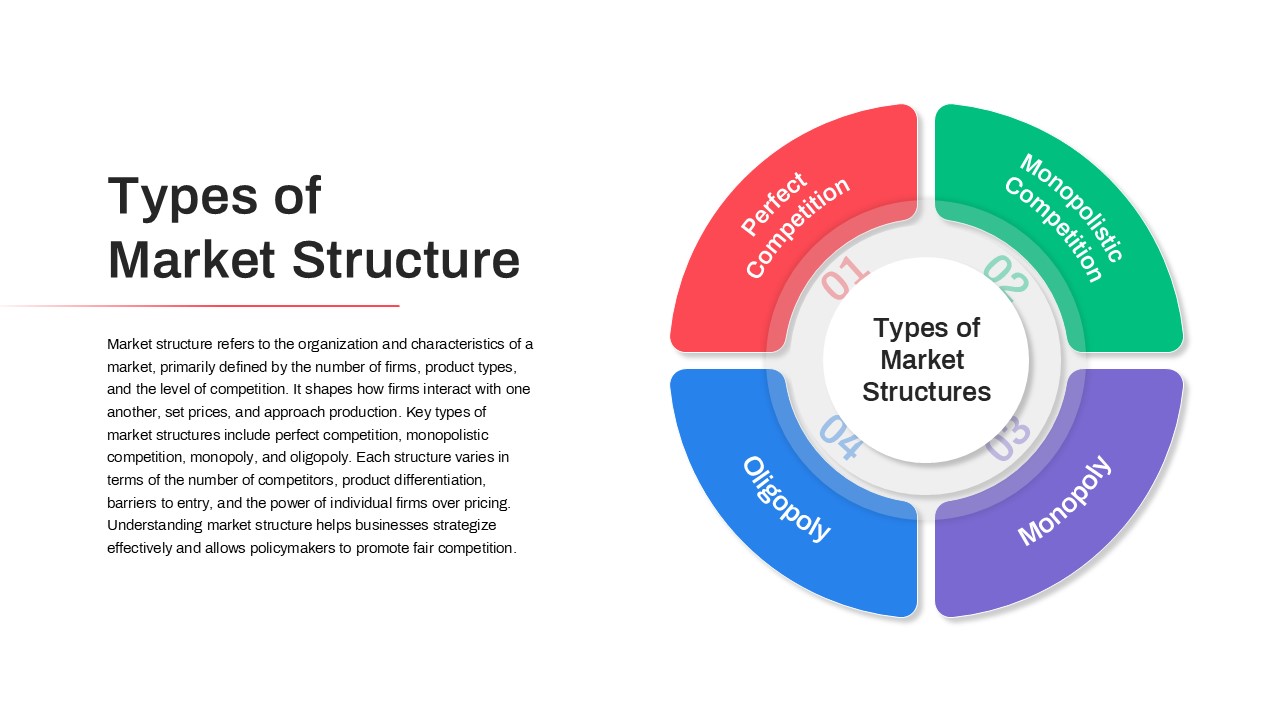
Types of Market Structure Infographic Template for PowerPoint & Google Slides
Comparison
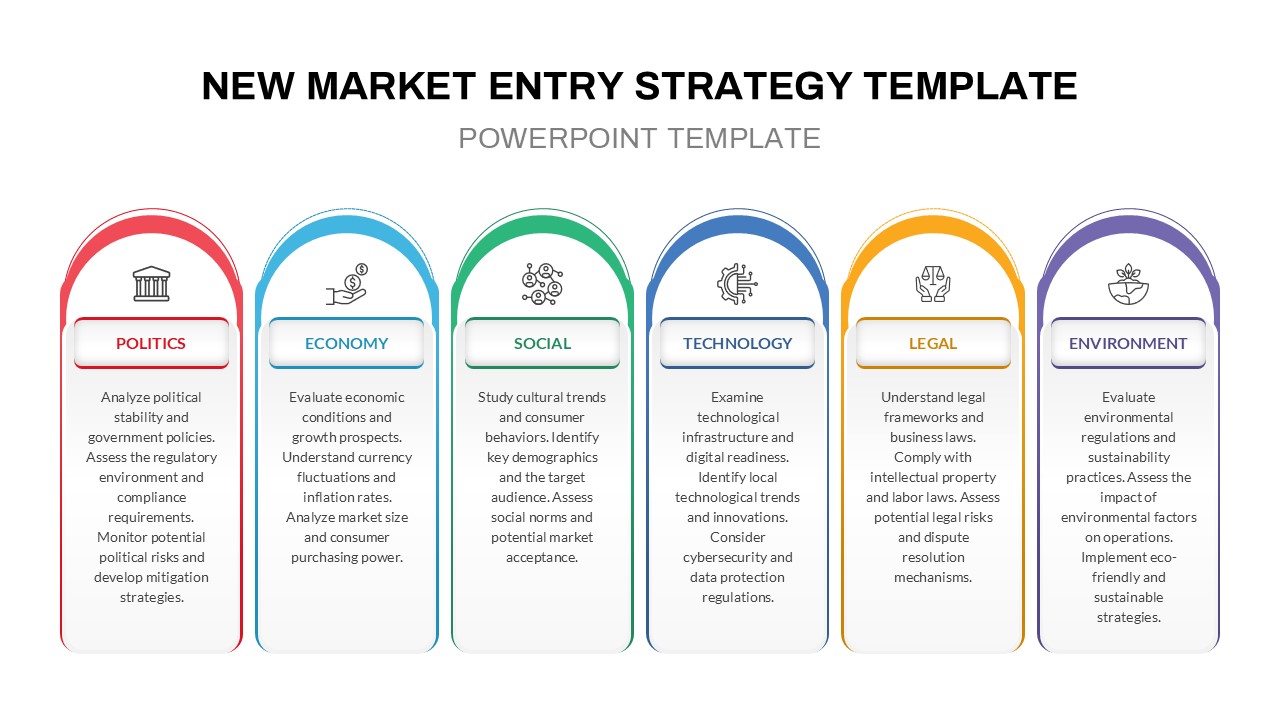
PESTLE Analysis for Market Entry Template for PowerPoint & Google Slides
PEST
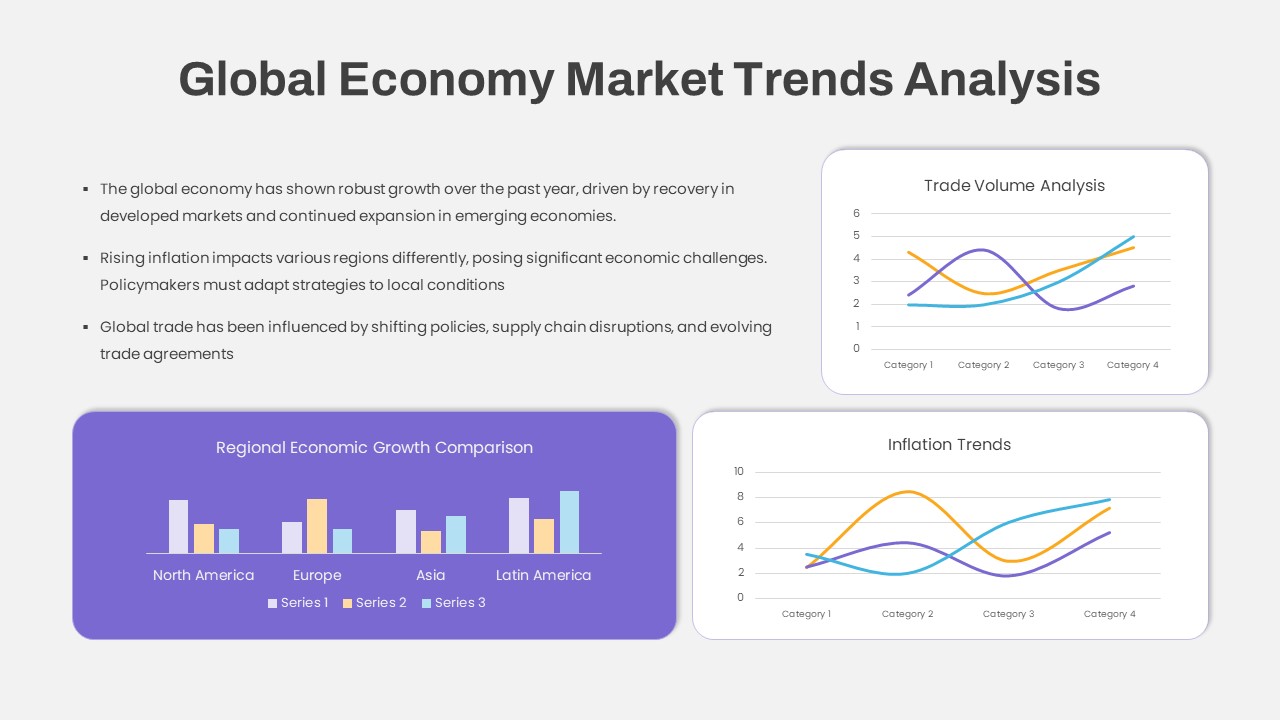
Global Economy Market Trends Analysis Template for PowerPoint & Google Slides
Comparison Chart
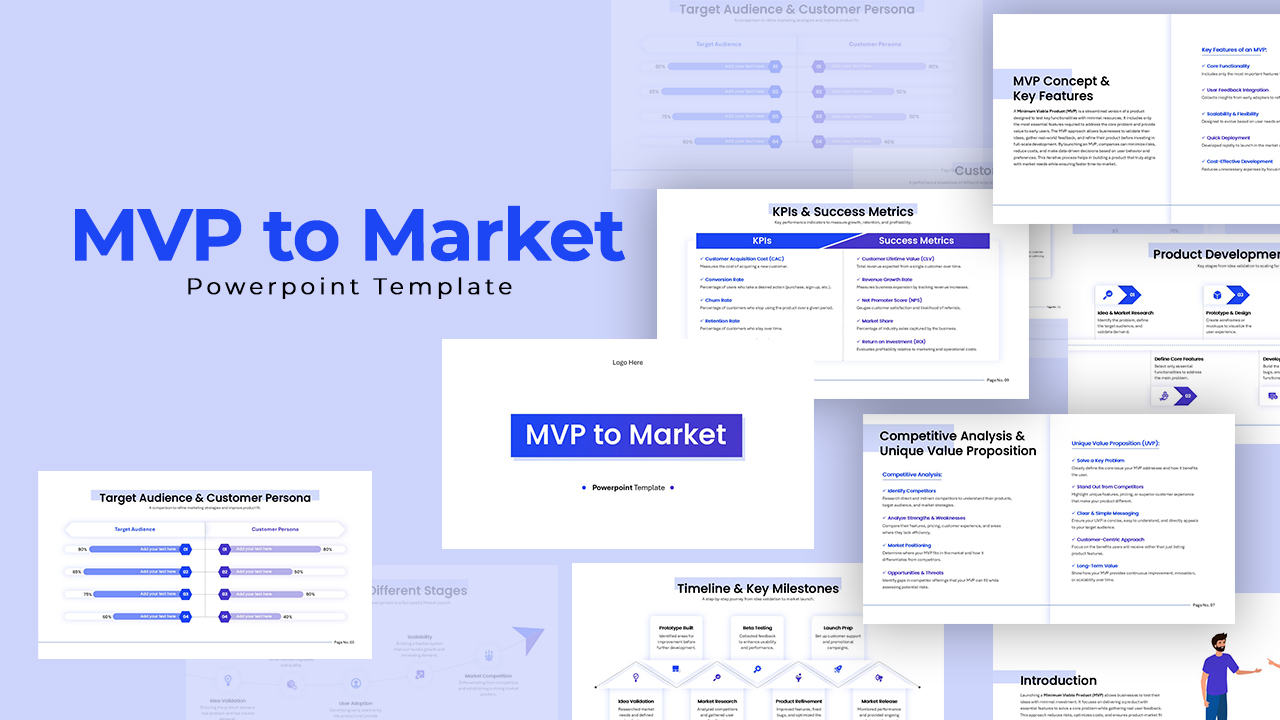
MVP to Market Strategy Pitch Deck Template for PowerPoint & Google Slides
Pitch Deck
Market Share Comparison Diagram Template for PowerPoint & Google Slides
Comparison Chart
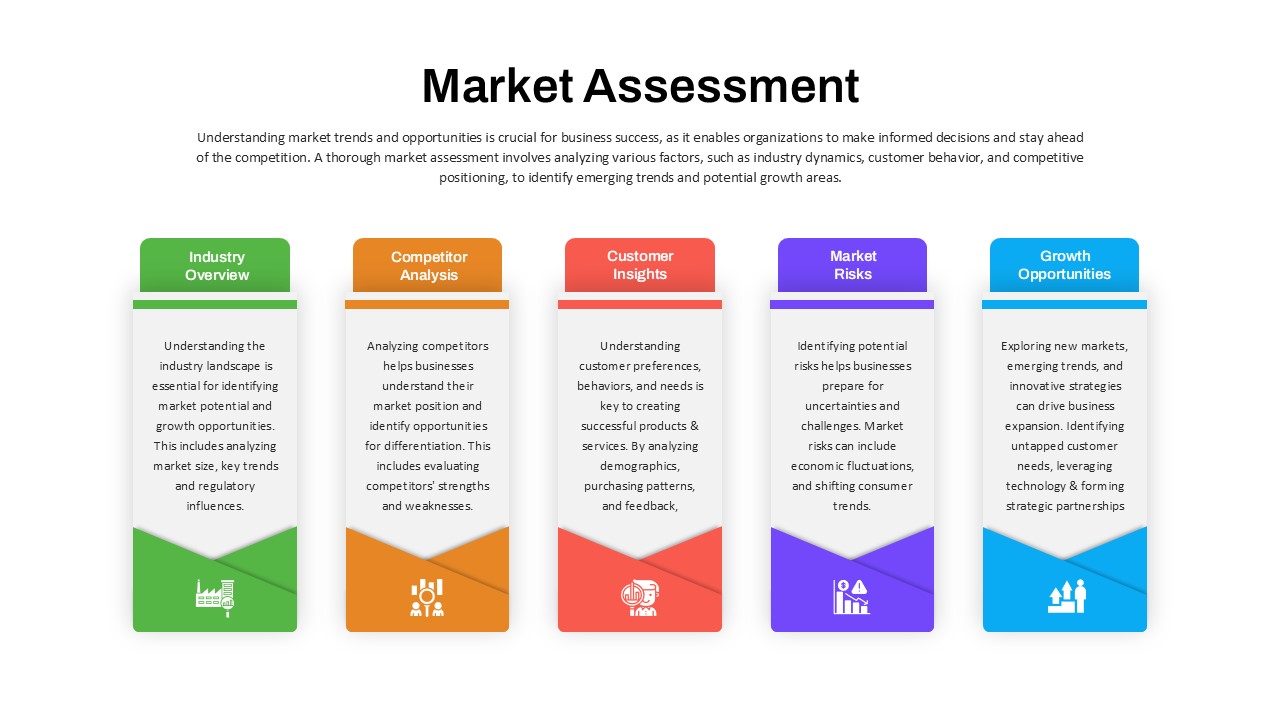
Market Assessment Infographic Slide Template for PowerPoint & Google Slides
Process
Comparison Chart Overview template for PowerPoint & Google Slides
Comparison Chart
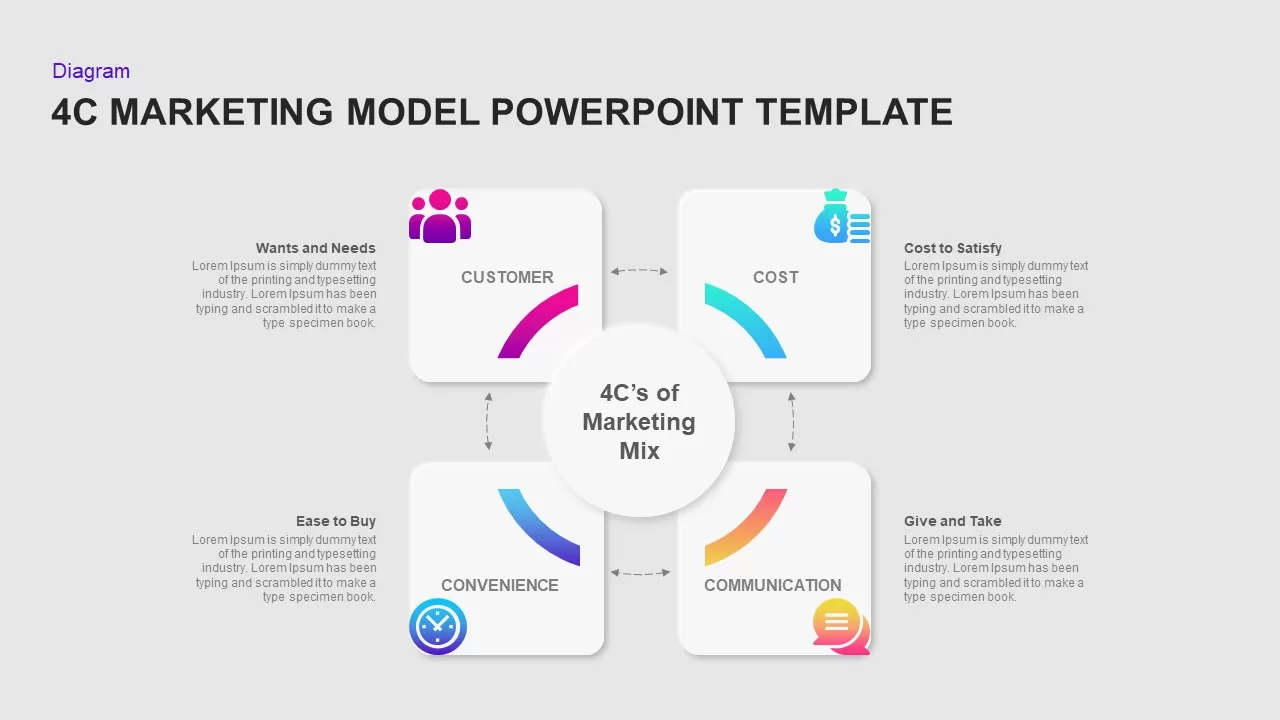
4C Marketing Model Overview Template for PowerPoint & Google Slides
Marketing
Home School Overview template for PowerPoint & Google Slides
Company Profile
Sales Meeting Overview template for PowerPoint & Google Slides
Pitch Deck
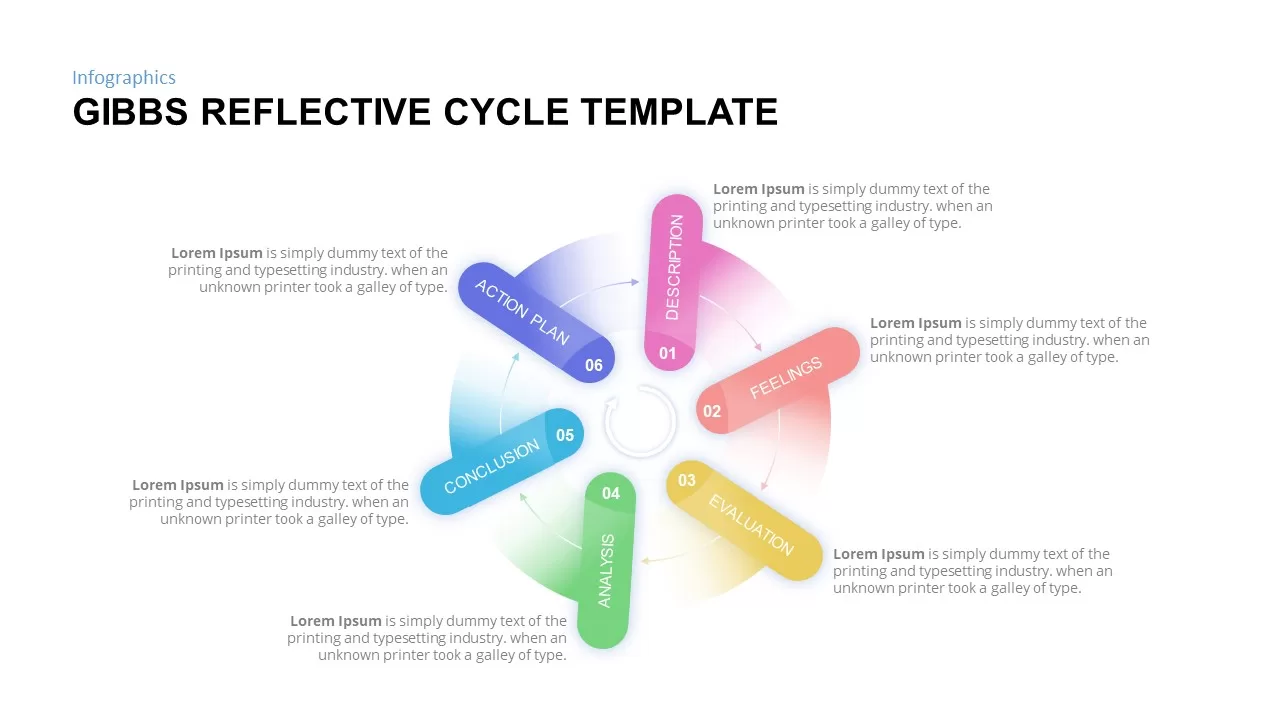
Gibbs Reflective Cycle Overview Template for PowerPoint & Google Slides
Process
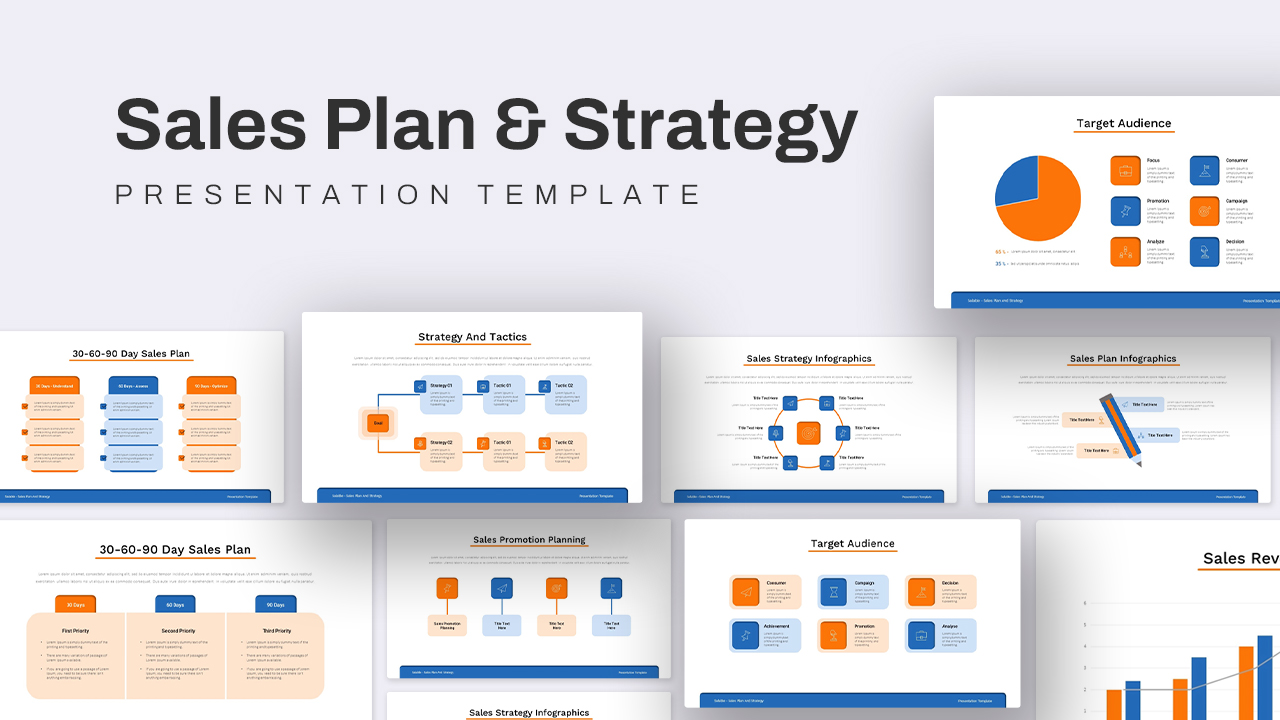
Sales Plan & Strategy Overview template for PowerPoint & Google Slides
Business Strategy
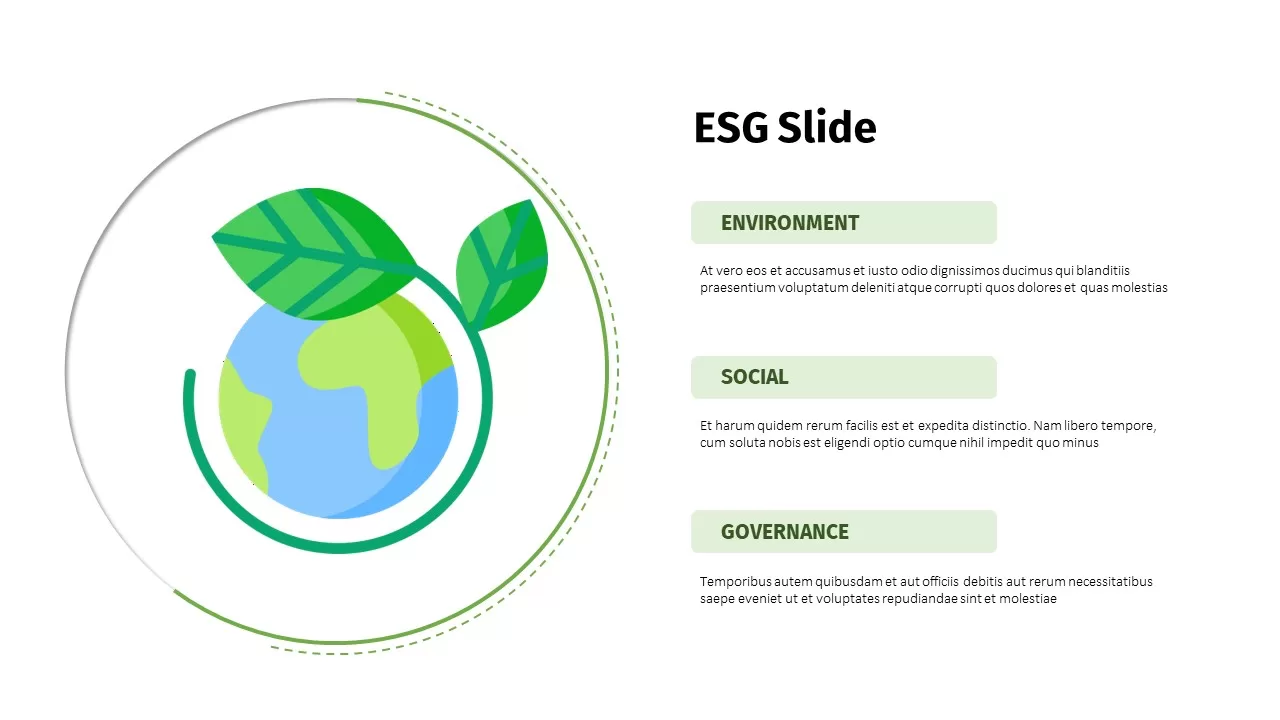
ESG Sustainability Overview Slide Template for PowerPoint & Google Slides
Risk Management
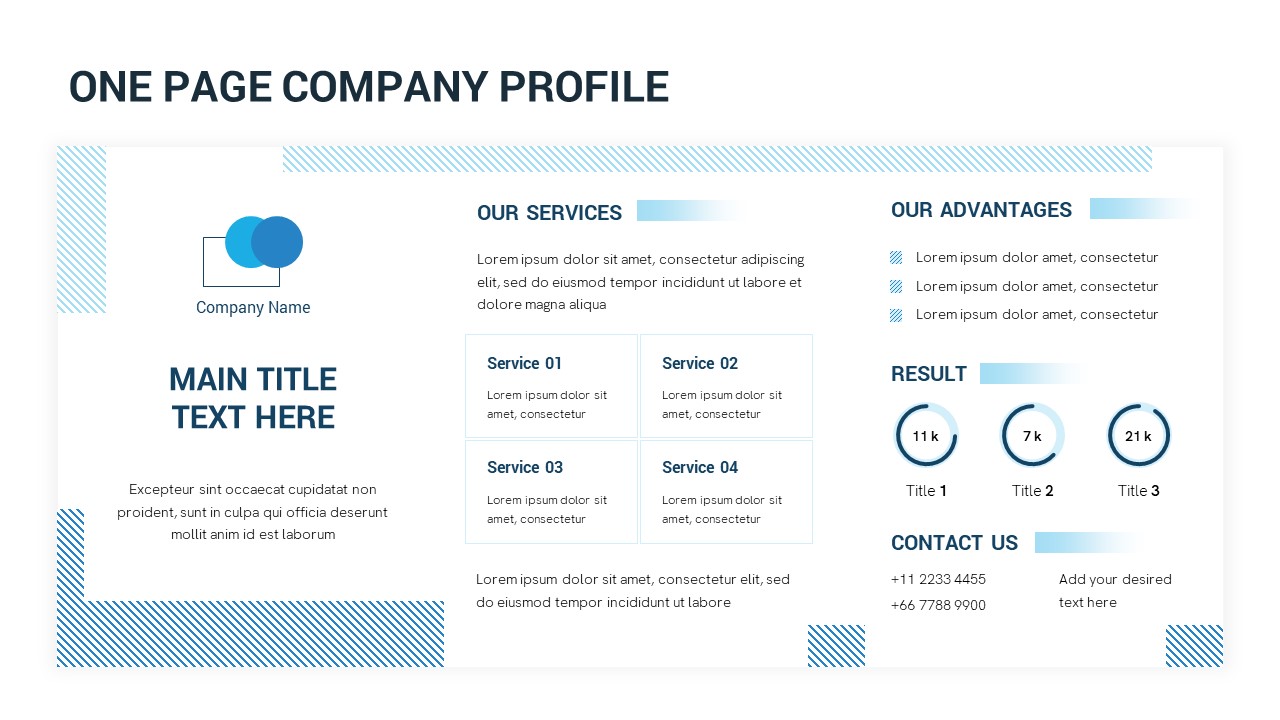
One-Page Company Profile Overview Template for PowerPoint & Google Slides
Company Profile
Blue and Orange Business Overview template for PowerPoint & Google Slides
Decks
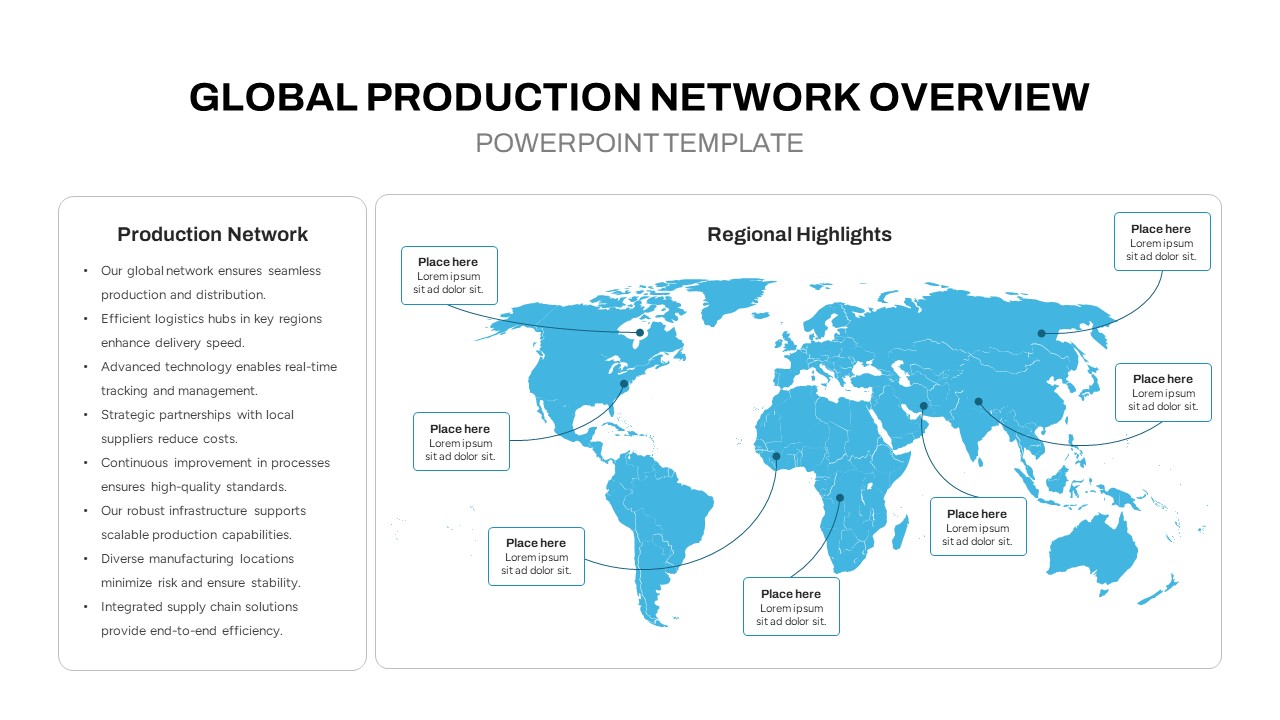
Global Production Network Overview Map Template for PowerPoint & Google Slides
World Maps
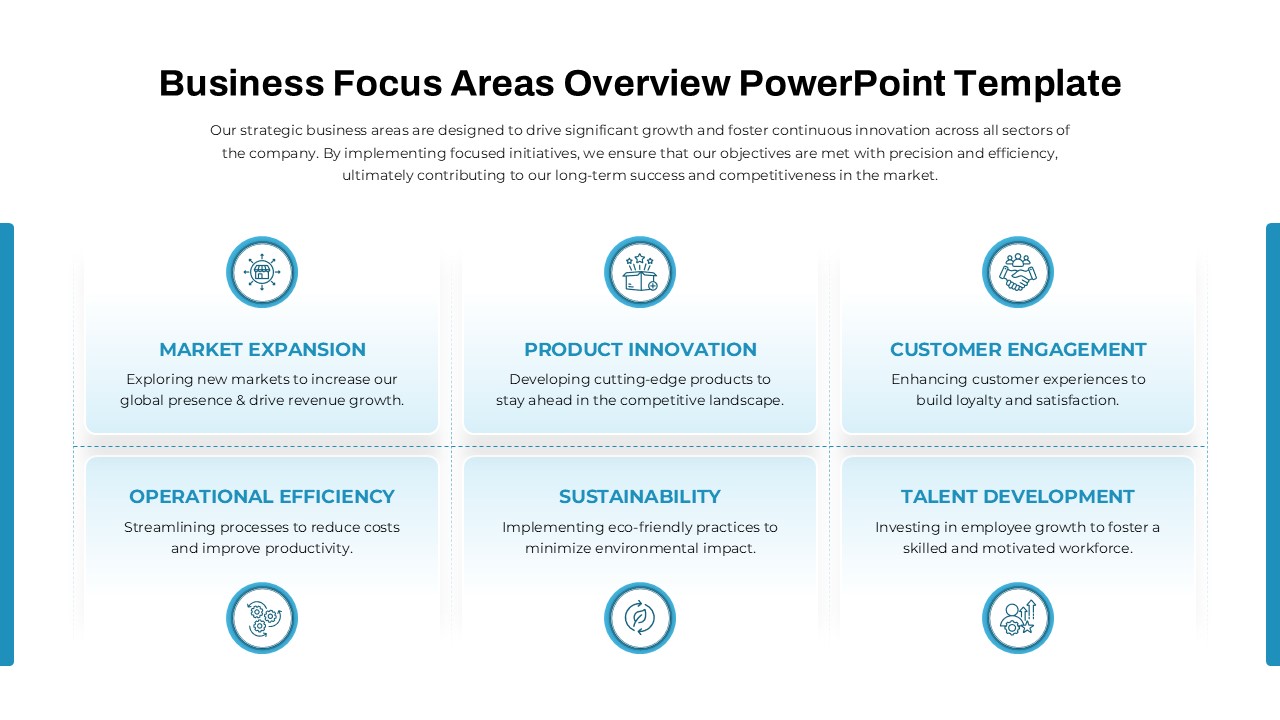
Business Focus Areas Overview Slide Template for PowerPoint & Google Slides
Business
Drone Delivery Systems Overview Slide Template for PowerPoint & Google Slides
Business Models
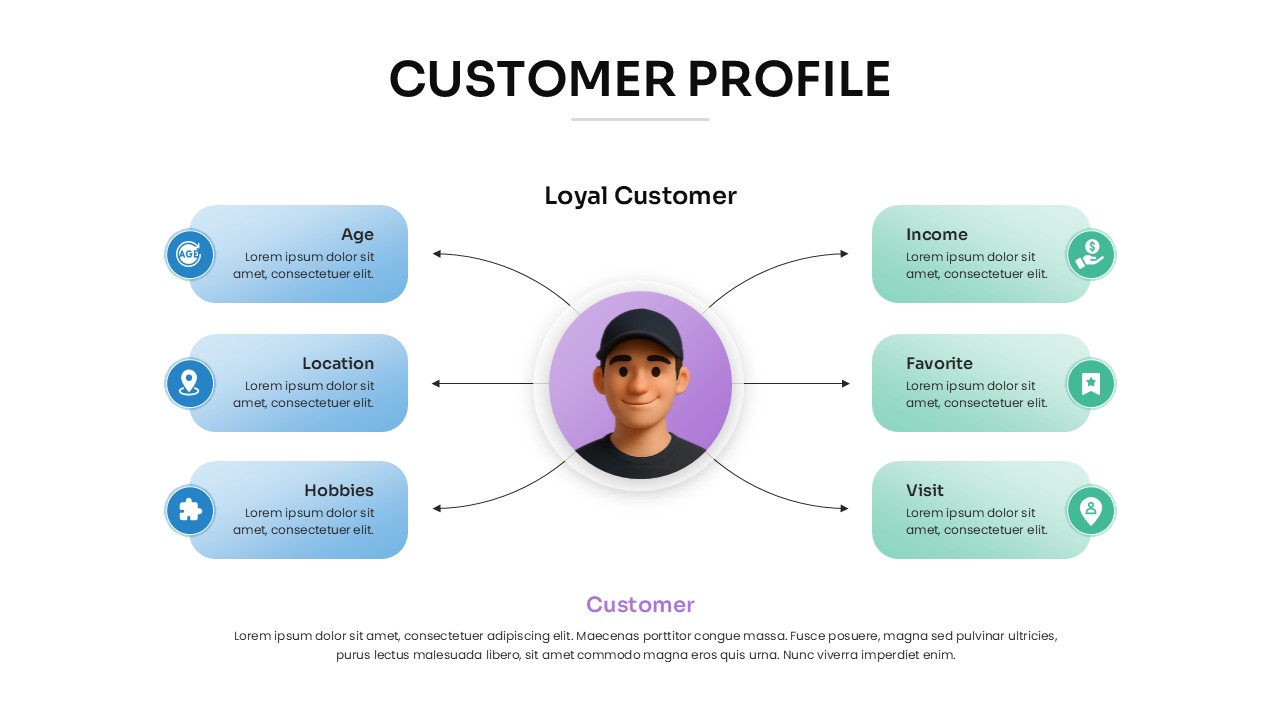
Customer Profile Overview Template for PowerPoint & Google Slides
Customer Journey
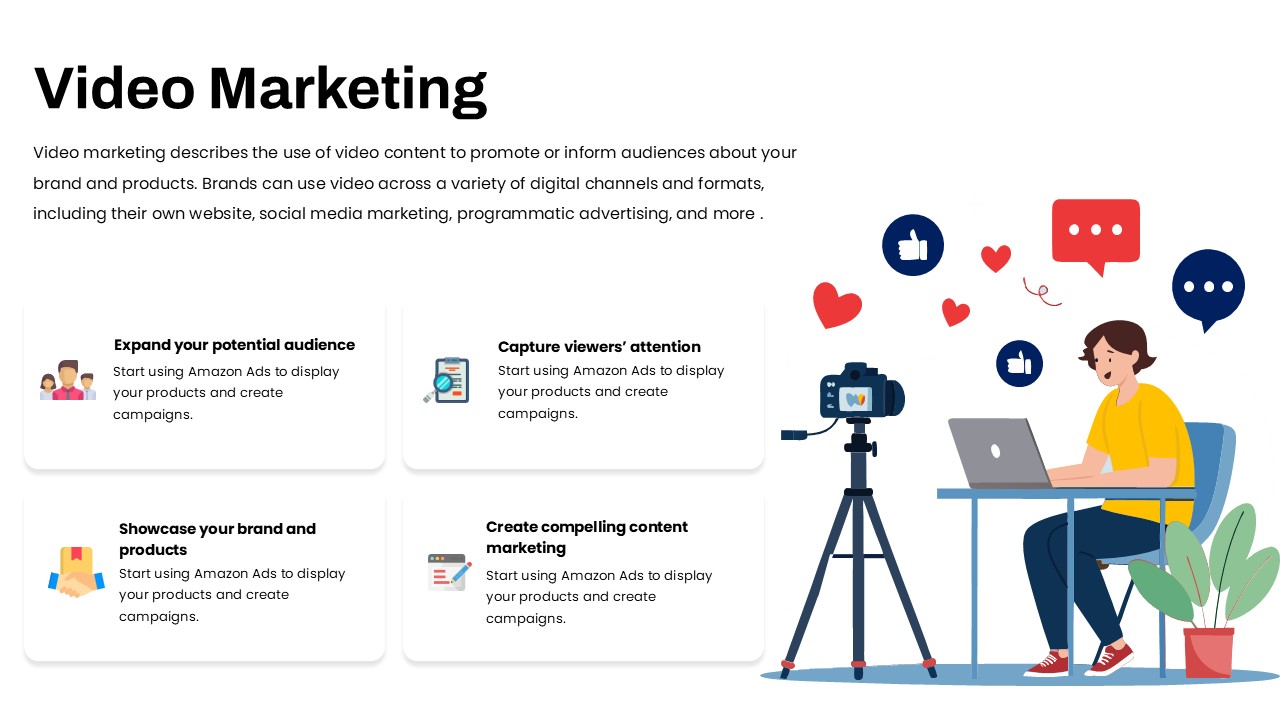
Video Marketing Overview template for PowerPoint & Google Slides
Digital Marketing
Team Gantt Chart Overview template for PowerPoint & Google Slides
Project Status
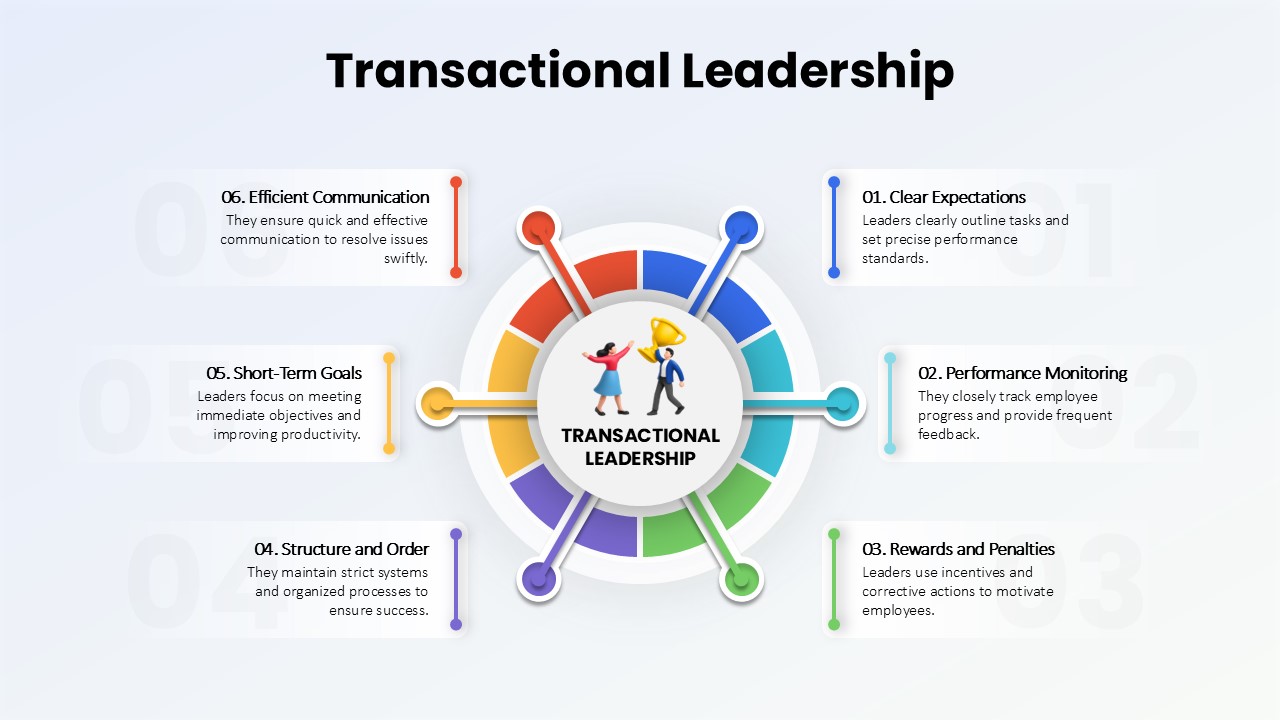
Transactional Leadership Overview template for PowerPoint & Google Slides
Process
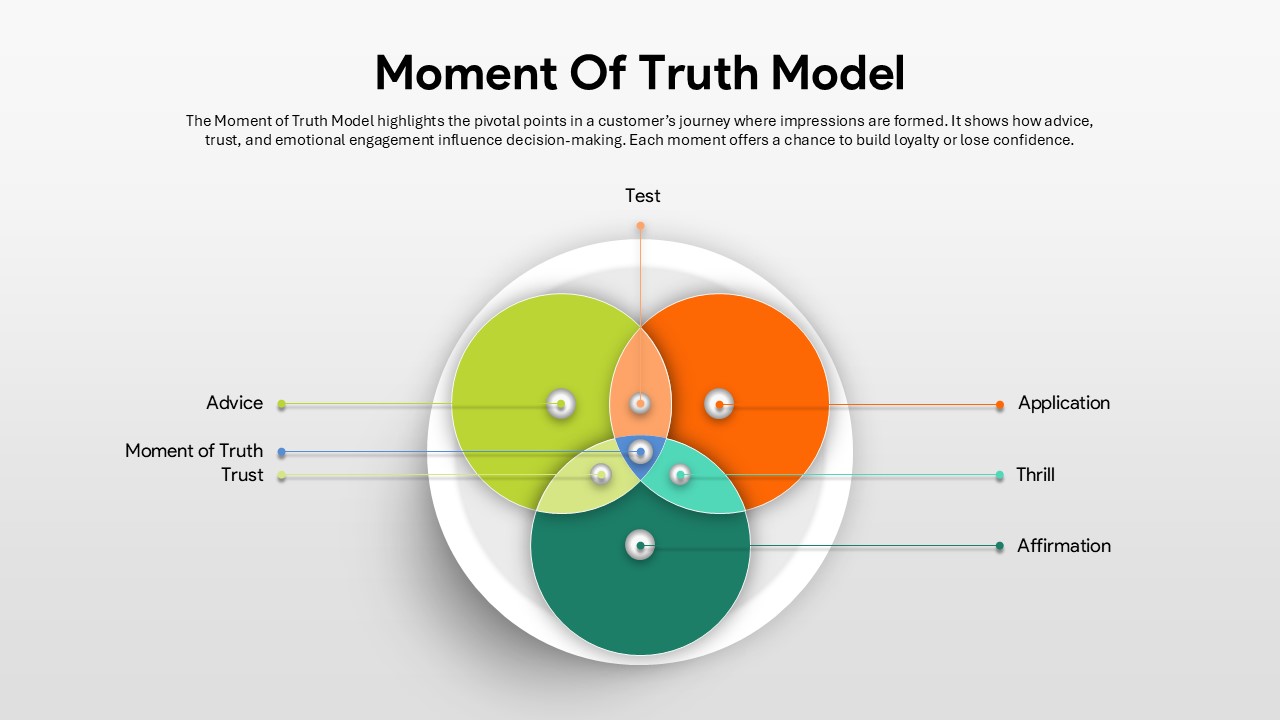
Moment of Truth Model Overview template for PowerPoint & Google Slides
Process
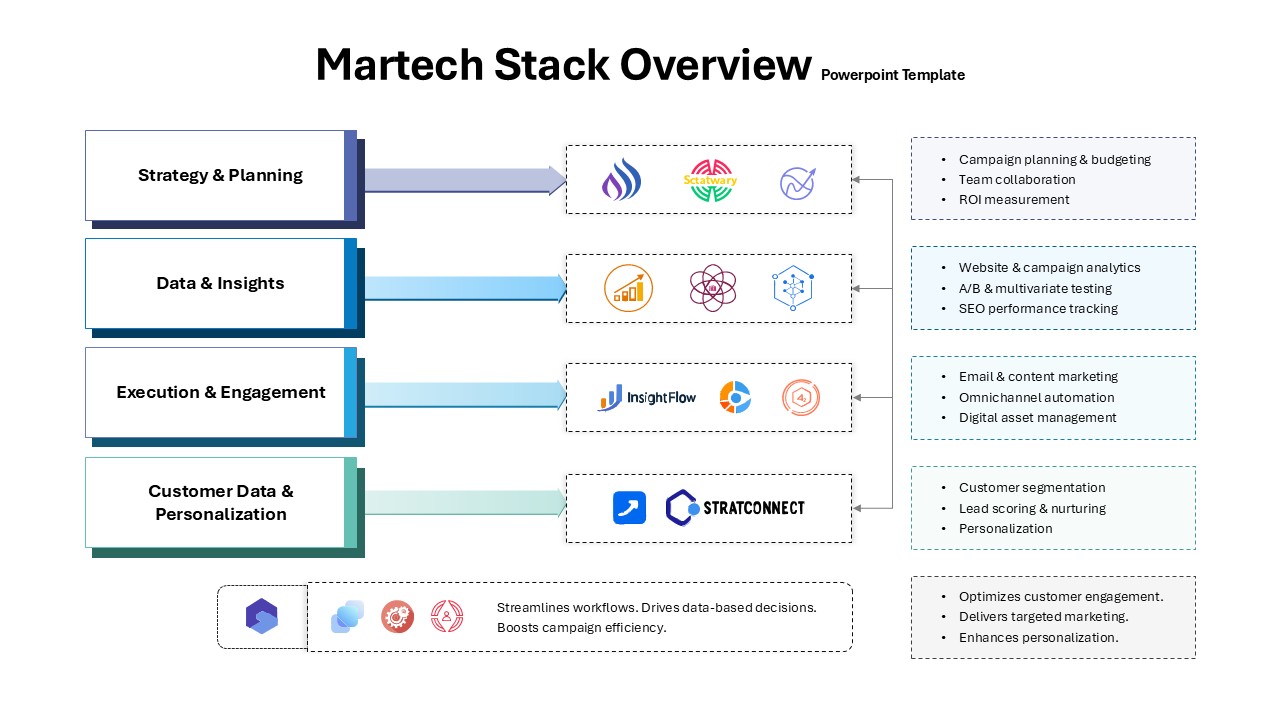
Martech Stack Overview Template for PowerPoint & Google Slides
Information Technology
Social Media Marketing Overview Template for PowerPoint & Google Slides
Advertising
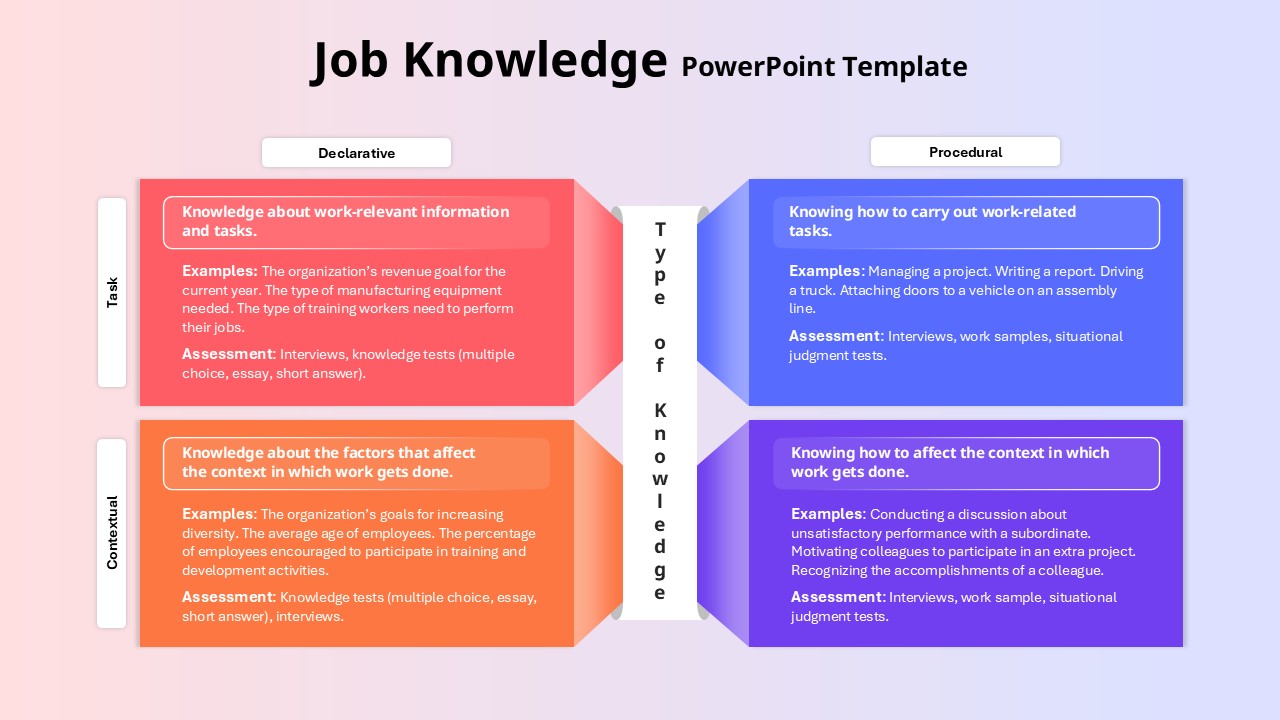
Job Knowledge Overview template for PowerPoint & Google Slides
Business
Networking Security overview template for PowerPoint & Google Slides
Technology
Candidate Nurturing Strategy Overview template for PowerPoint & Google Slides
Recruitment
Account Overview Dashboard template for PowerPoint & Google Slides
Business
Fall Theme Business Overview template for PowerPoint & Google Slides
Decks