Free Root Cause Analysis Fishbone Diagram Template for PowerPoint & Google Slides


Description
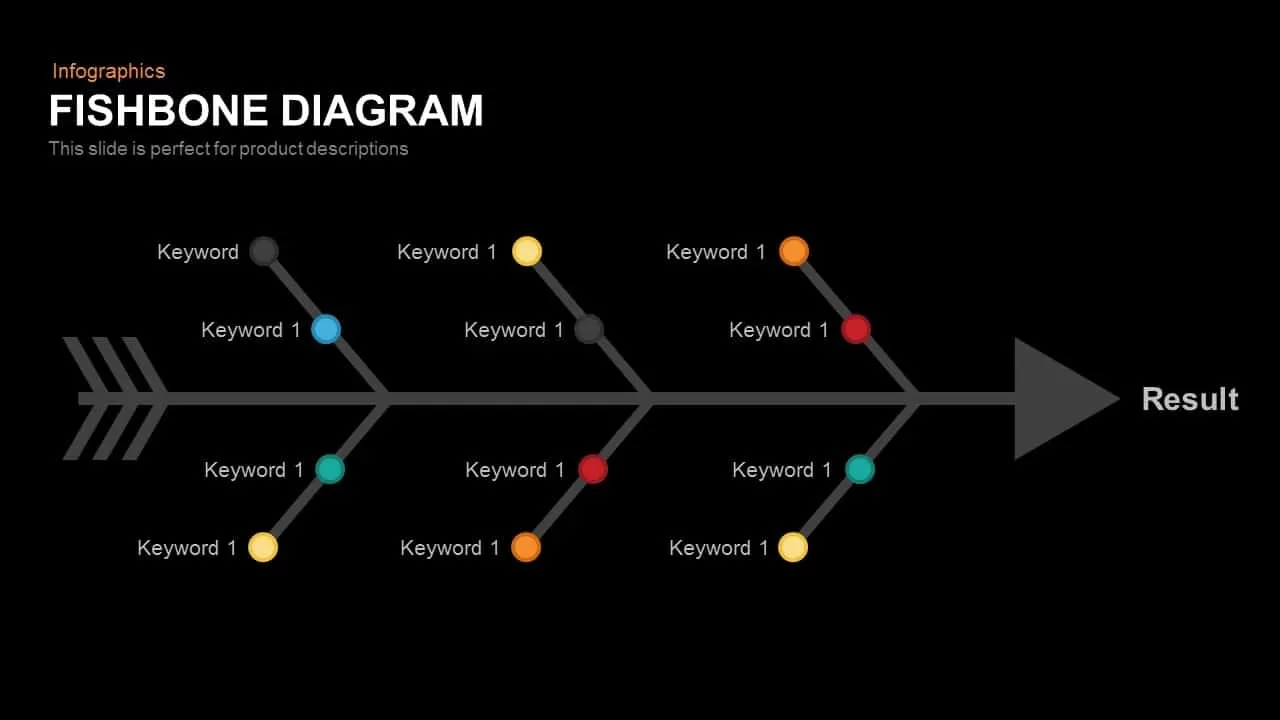
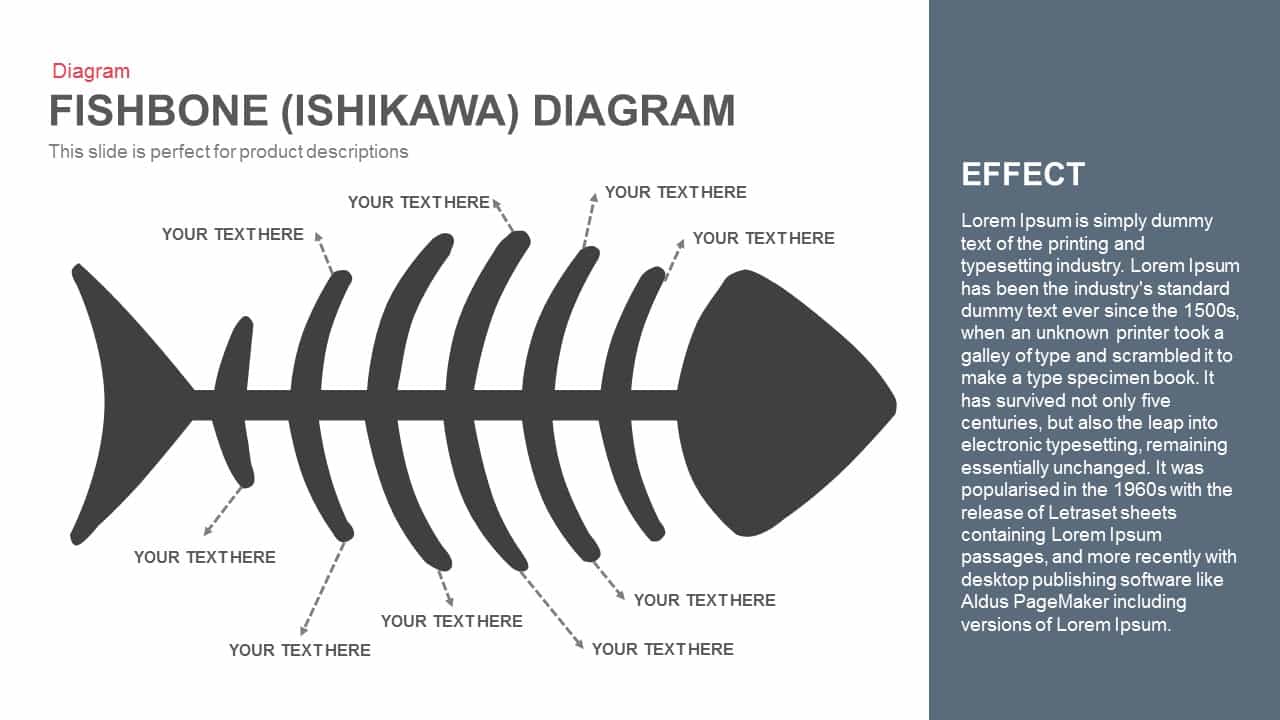
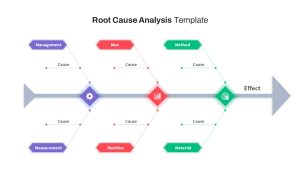
Use this root cause analysis fishbone slide to visually organize underlying factors that contributes to a problem or effect. This fully editable template features a central arrow leading to the “Effect” outcome, with six color-coded branches representing Management, Man, Method, Machine, Measurement, and Material. Each branch begins with a hexagonal icon having a clear label that connects via dotted lines to placeholder text markers where users can insert specific cause statements. The clean white background, subtle drop shadows, and flat modern shapes make it look highly professional.
This slide uses master layouts to quickly customize the colors, fonts, and branch order. Replace icons or adjust text placeholders in seconds without disrupting alignment. The balanced fishbone structure promotes logical analysis by grouping related causes under standardized 6M categories. Optimized for both PowerPoint and Google Slides.
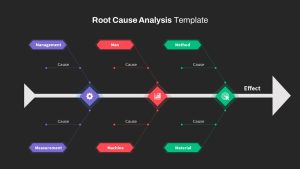
Switch between light and dark backgrounds or apply custom color themes to match brand guidelines effortlessly.
Who is it for
Quality managers, process improvement teams, Six Sigma practitioners, project managers, engineers, and consultants can use this fishbone slide to drive systematic root cause investigations and deliver data-driven solutions.
Other Uses
This slide can also be used for failure mode and effects analysis, risk and compliance audits, 5 Whys workshops, brainstorming sessions, and operational reviews to identify and address underlying issues across functions.
Login to download this file

Item ID
SB03980
Related Templates

5 Why Fishbone Diagram for Root Cause Analysis in PowerPoint & Google Slides
Process
Fishbone Cause Analysis Diagram Template for PowerPoint & Google Slides
Process
Root Cause Analysis PowerPoint & Google Slides Template for Presentations
Business Strategy
Sky and Tree Root Cause Analysis Deck Template for PowerPoint & Google Slides
Opportunities Challenges
Root Cause Analysis Infographic Pack Template for PowerPoint & Google Slides
Process
Fishbone Diagram Cause-and-Effect Template for PowerPoint & Google Slides
Process
Fishbone Cause and Effect Diagram Template for PowerPoint & Google Slides
Process
Underwater Fishbone Cause-Effect Diagram Template for PowerPoint & Google Slides
Process
Fishbone Cause and Effect Infographic Template for PowerPoint & Google Slides
Infographics
Fishbone Diagram Analysis Template for PowerPoint & Google Slides
Flow Charts
Free Color-Coded Fishbone Diagram Template for PowerPoint & Google Slides
Project
Free
Three-Section Fishbone Process Diagram template for PowerPoint & Google Slides
Process
Fishbone RCA Diagram Template for PowerPoint & Google Slides
Business Strategy
Fishbone Diagram Overview template for PowerPoint & Google Slides
Infographics
Fishbone Process Diagram template for PowerPoint & Google Slides
Infographics
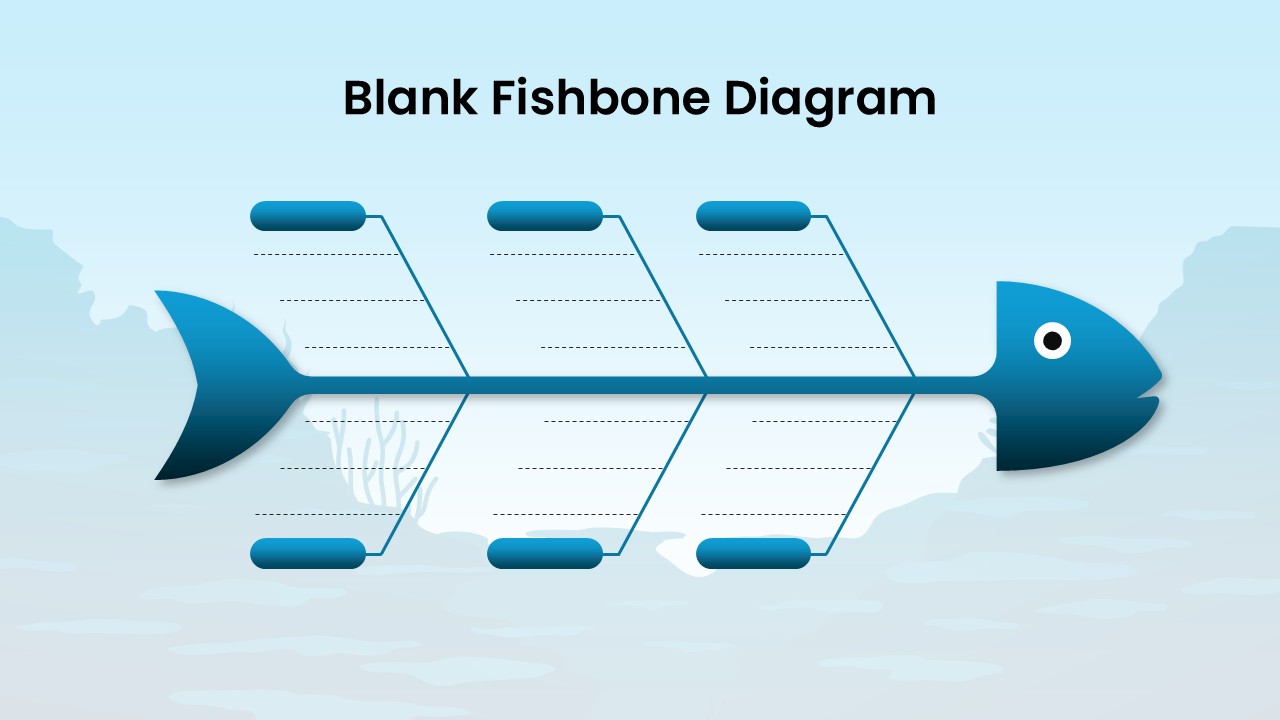
Blank Fishbone Diagram Template for PowerPoint & Google Slides
Process

Cause and Effect Diagram Infographic Template for PowerPoint & Google Slides
Bar/Column
Five-Input Cause and Effect Diagram Template for PowerPoint & Google Slides
Arrow
Fishbone (Ishikawa) Diagram for PowerPoint & Google Slides
Process
Fishbone Timeline Infographic Series Template for PowerPoint & Google Slides
Manufacturing
Free SWOT Analysis template for PowerPoint & Google Slides
SWOT
Free

Free SWOT Analysis Template for PowerPoint & Google Slides
SWOT
Free
Free SWOT Analysis Overview template for PowerPoint & Google Slides
SWOT
Free
Free Competitor Analysis Matrix Template for PowerPoint & Google Slides
Competitor Analysis
Free
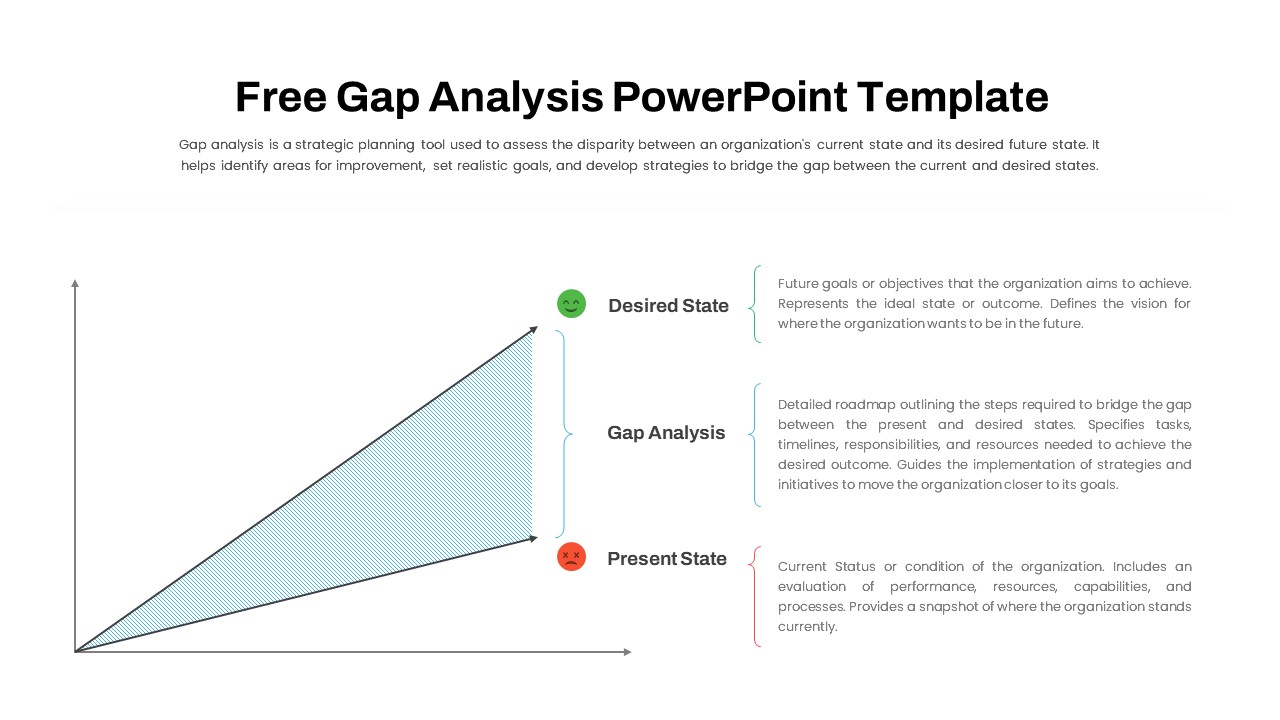
Free Comprehensive Gap Analysis Framework Template for PowerPoint & Google Slides
Opportunities Challenges
Free
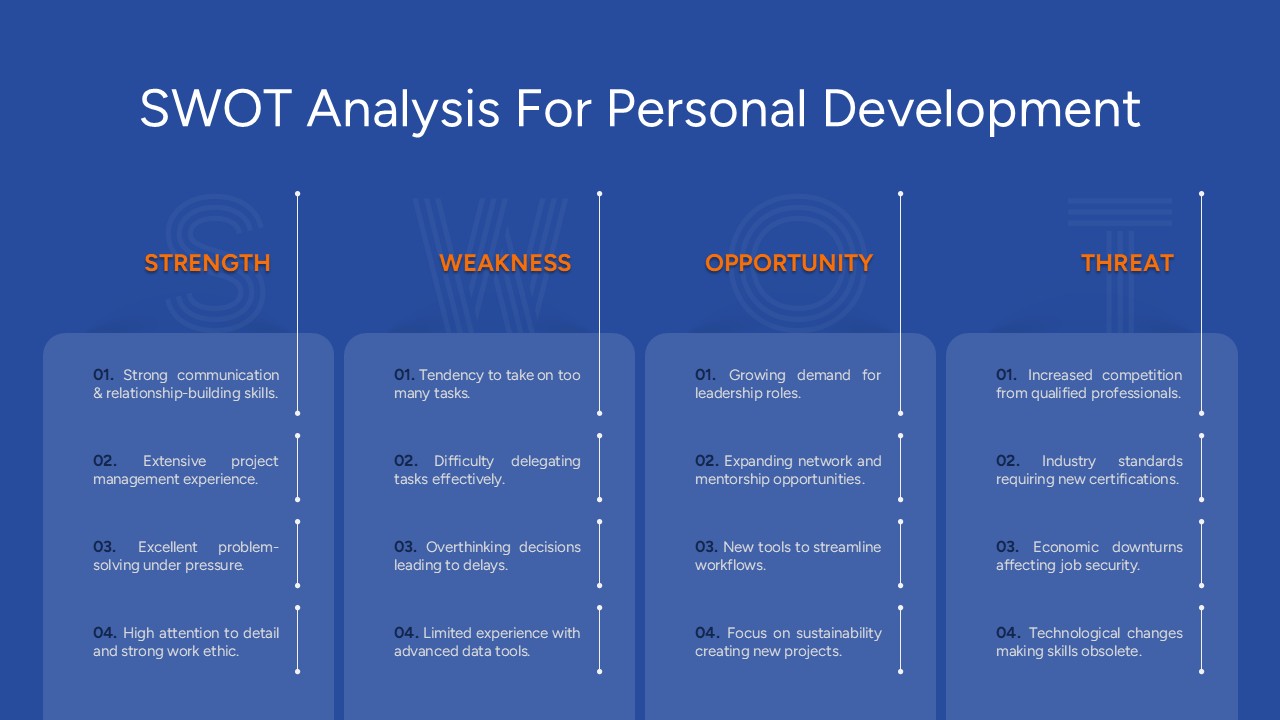
Free SWOT Analysis for Personal Development Template for PowerPoint & Google Slides
SWOT
Free
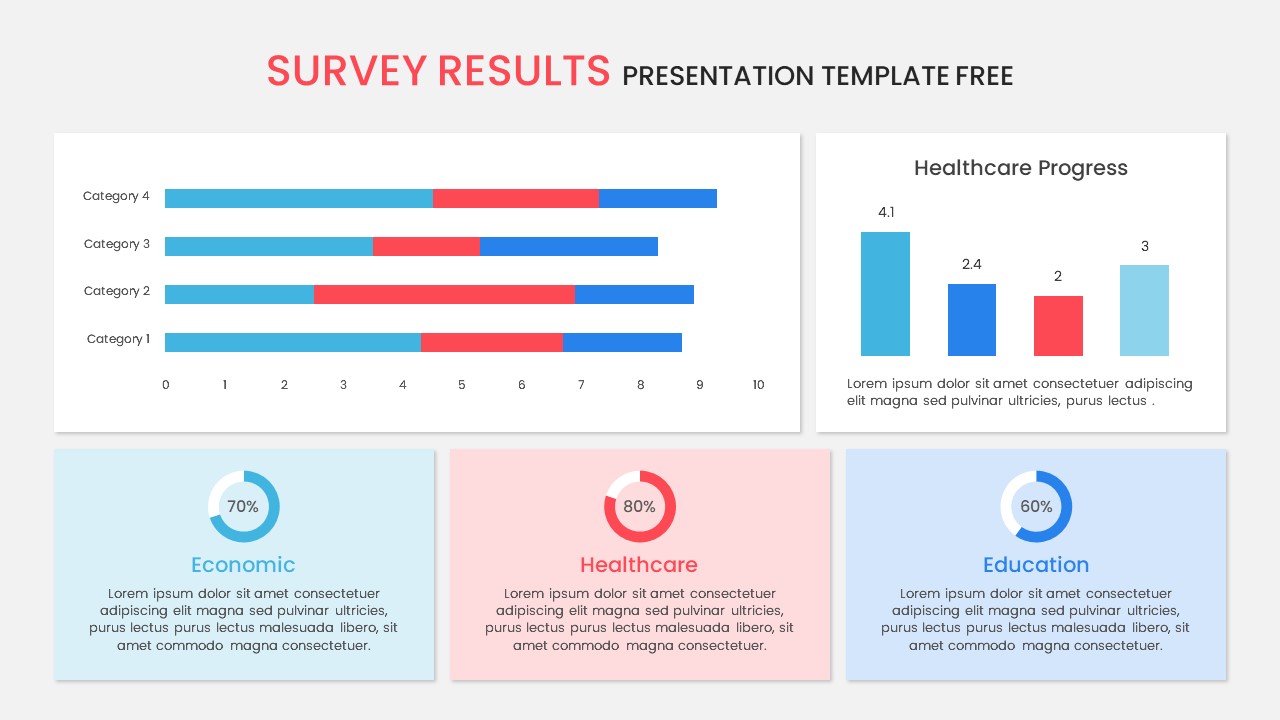
Free Survey Results Analysis Slide for PowerPoint & Google Slides
Business Report
Free
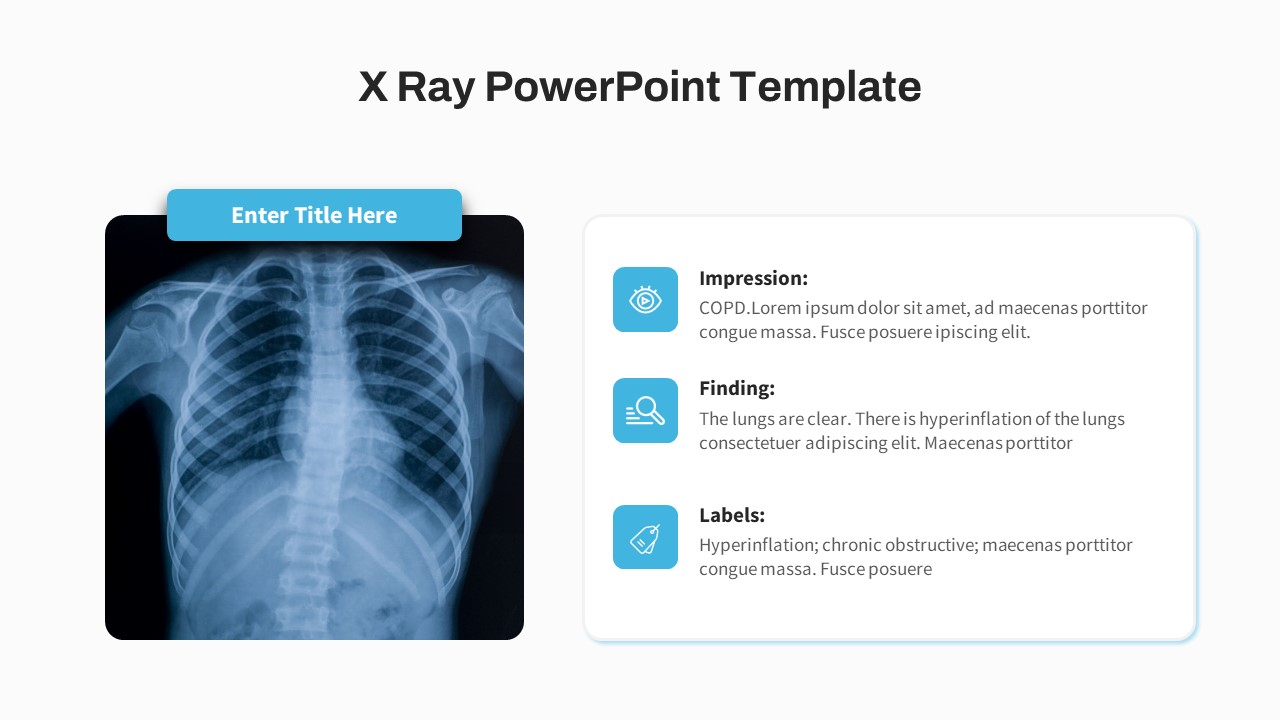
Free Medical X-Ray Analysis Slide for PowerPoint & Google Slides
Health
Free
Modern Circle SWOT Analysis Diagram Template for PowerPoint & Google Slides
SWOT
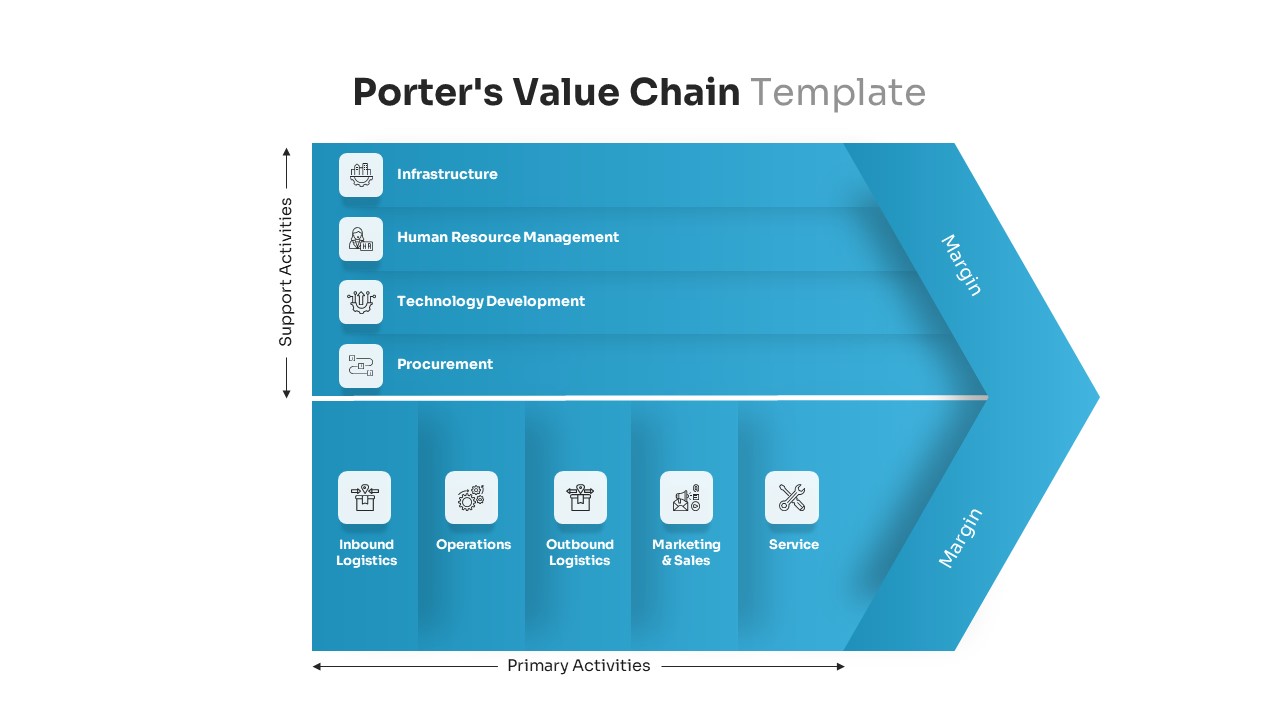
Porter’s Value Chain Analysis Diagram Template for PowerPoint & Google Slides
Business Strategy
Editable Force Field Analysis Diagram Template for PowerPoint & Google Slides
Business Plan
Professional PESTEL Analysis Diagram Template for PowerPoint & Google Slides
PEST
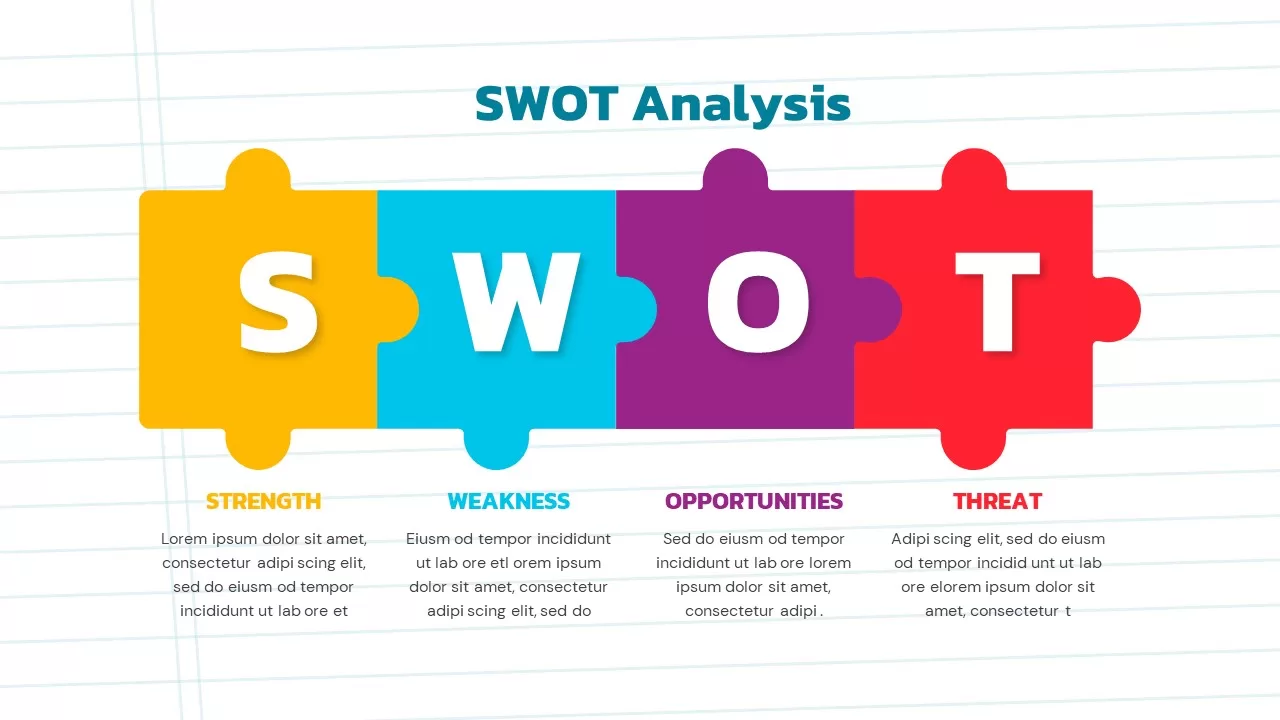
Puzzle-Style SWOT Analysis Table Diagram Template for PowerPoint & Google Slides
SWOT
PEST Analysis Circular Diagram Template for PowerPoint & Google Slides
PEST
PESTLE Analysis Table Layout Diagram Template for PowerPoint & Google Slides
PEST
SWOT Analysis Gear Diagram Slide Template for PowerPoint & Google Slides
SWOT

Interactive Gap Analysis Puzzle Diagram Template for PowerPoint & Google Slides
Gap
Cluster Analysis Infographic Diagram Template for PowerPoint & Google Slides
Business
Four-Quadrant SWOT Analysis Diagram Template for PowerPoint & Google Slides
SWOT
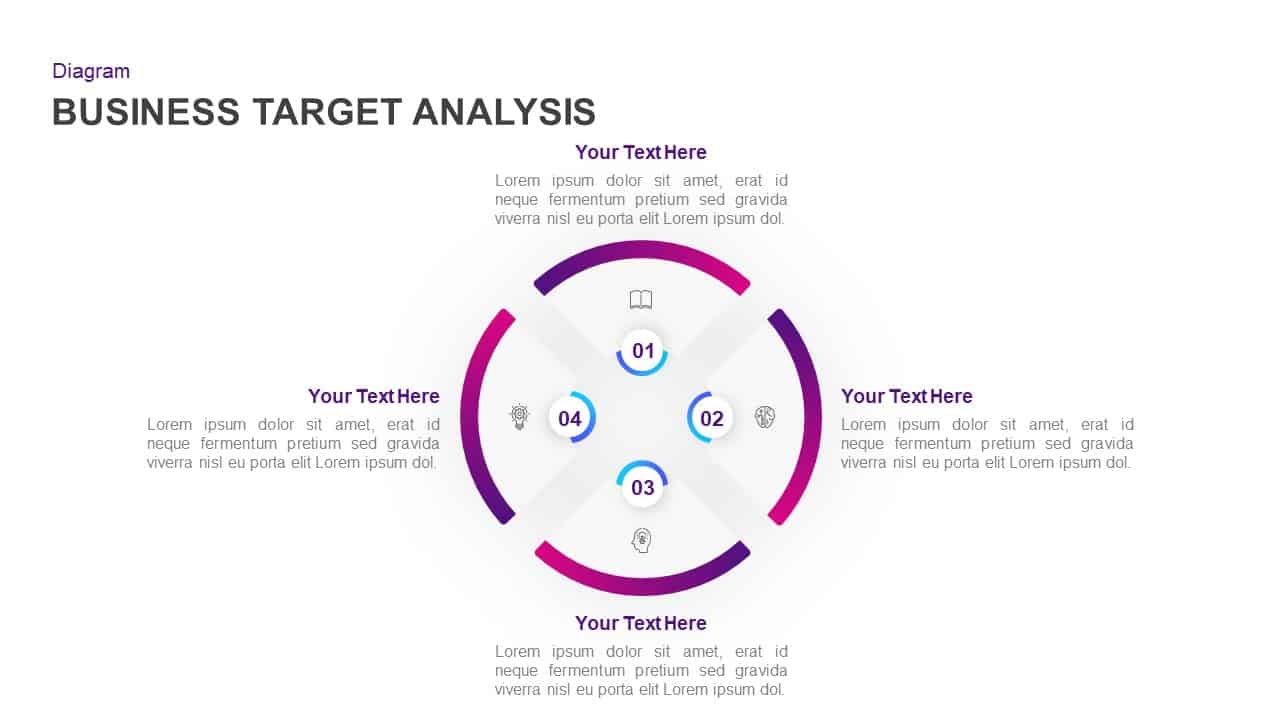
Business Target Analysis Diagram Template for PowerPoint & Google Slides
Circular
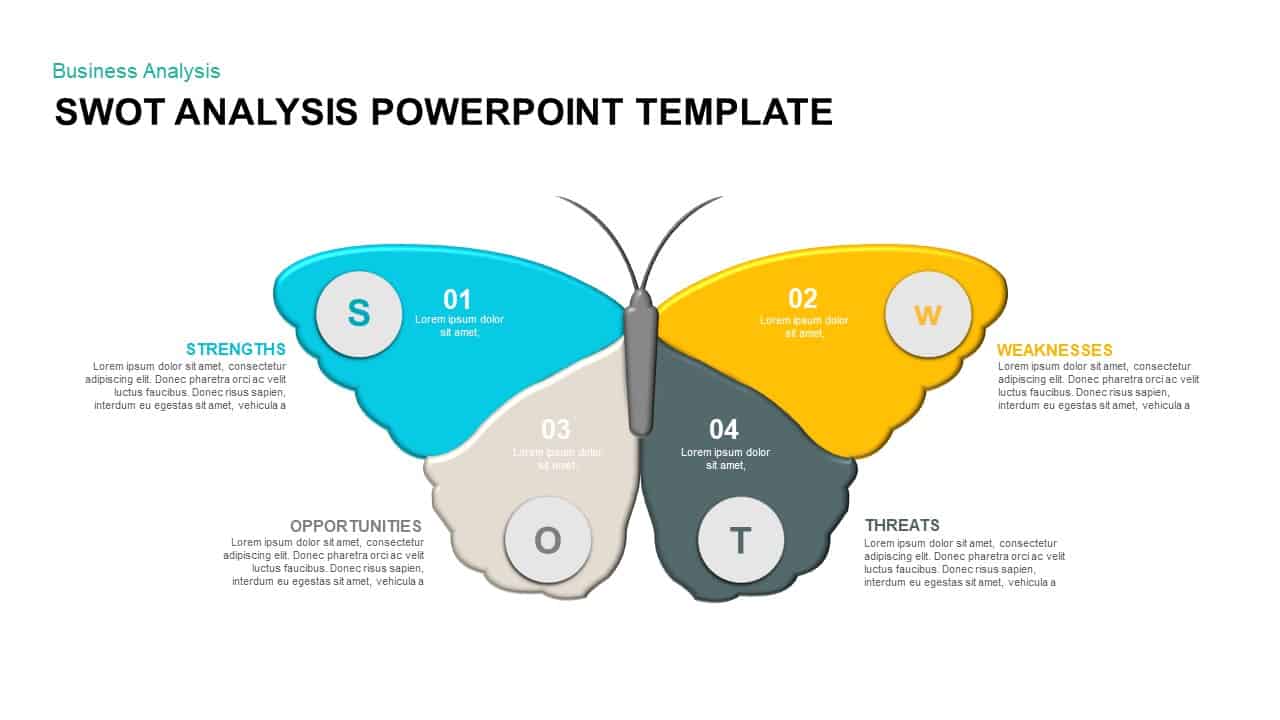
Butterfly SWOT Analysis Diagram Template for PowerPoint & Google Slides
SWOT
Four-Part SWOT Analysis Diagram Template for PowerPoint & Google Slides
SWOT

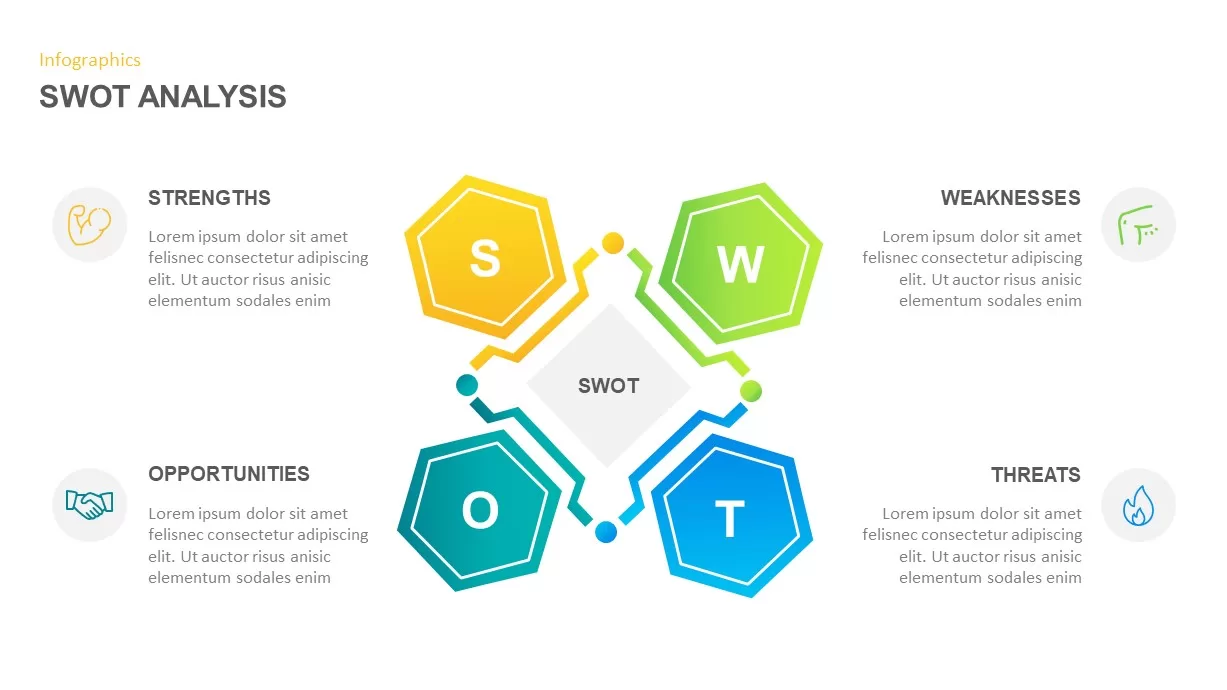
SWOT Analysis Infographic Diagram Template for PowerPoint & Google Slides
SWOT
IQ Scale Analysis Diagram template for PowerPoint & Google Slides
Employee Performance
Puzzle Piece SWOT Analysis Diagram Template for PowerPoint & Google Slides
Opportunities Challenges
Six-Step Business Analysis Diagram template for PowerPoint & Google Slides
Circular
Business Process Analysis Cycle Diagram Template for PowerPoint & Google Slides
Business Strategy
Experience Curve Analysis Diagram Template for PowerPoint & Google Slides
Business Strategy
Cost-Volume-Profit Analysis Diagram Template for PowerPoint & Google Slides
Finance
Colorful SWOT Analysis Diagram Template for PowerPoint & Google Slides
SWOT
Bottleneck Process Analysis Diagram Template for PowerPoint & Google Slides
Process
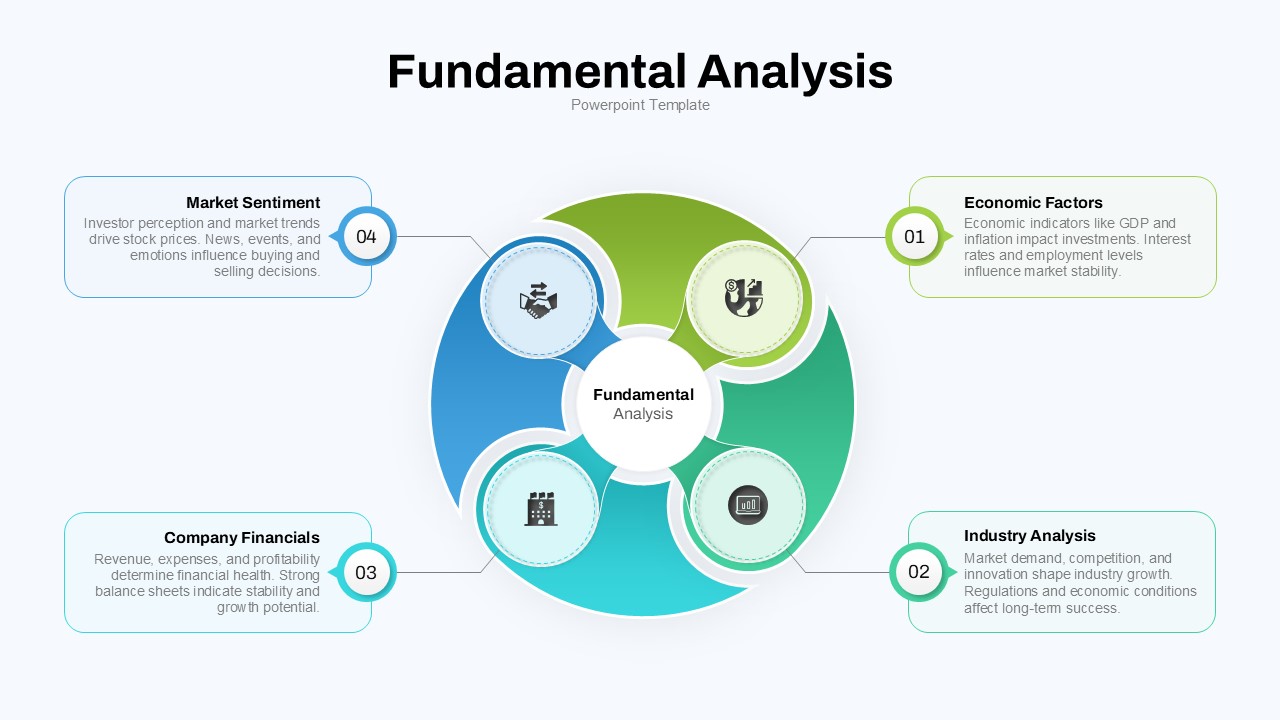
Fundamental Analysis Circular Diagram Template for PowerPoint & Google Slides
Circular
Cultural Web Analysis Circular Diagram Template for PowerPoint & Google Slides
Circular
DESTEP Marketing Analysis Diagram Template for PowerPoint & Google Slides
Circular
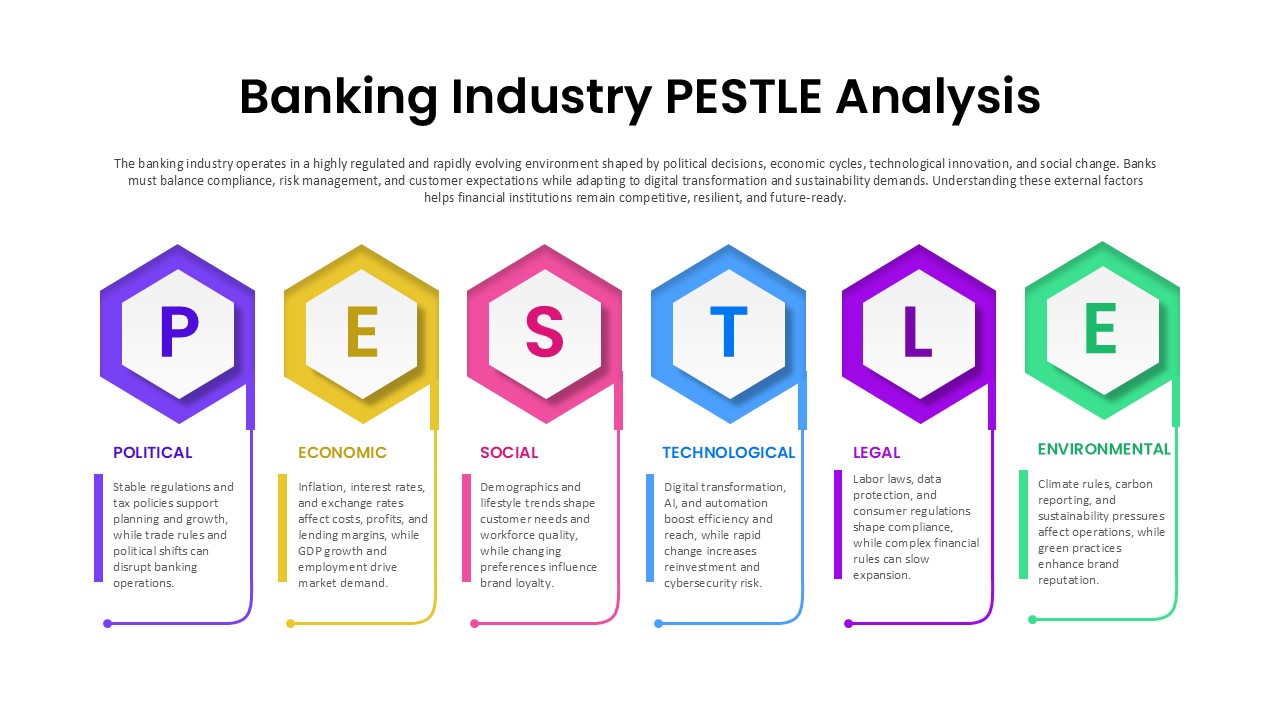
Banking Industry PESTLE Analysis Diagram Template for PowerPoint & Google Slides
PEST
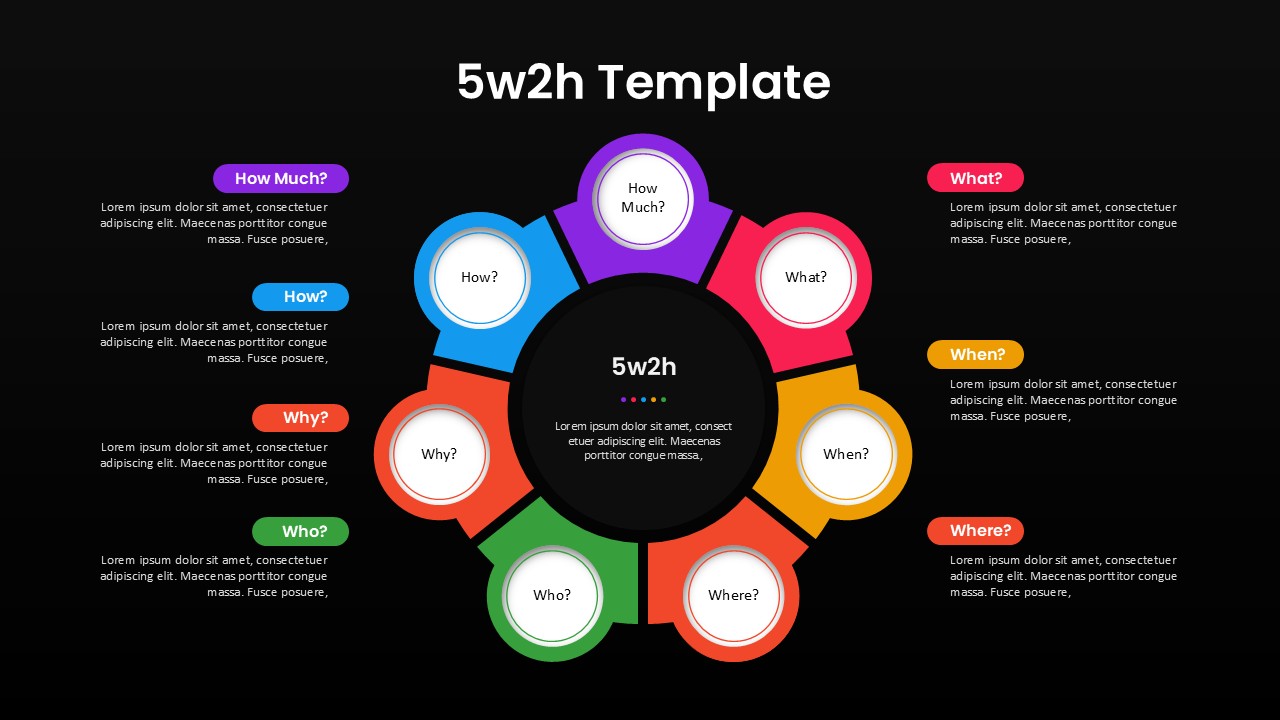
5W2H Analysis Radial Diagram Template for PowerPoint & Google Slides
Decision Tree
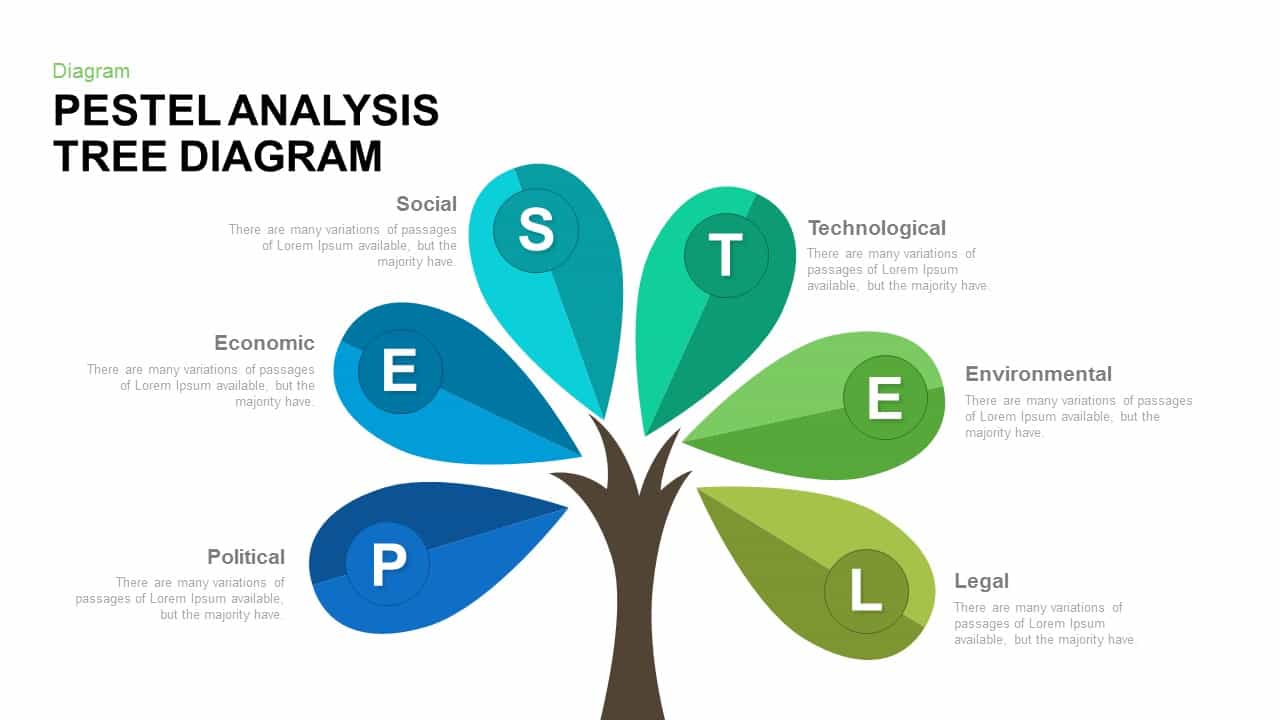
PESTEL Analysis Tree Diagram for PowerPoint & Google Slides
Process
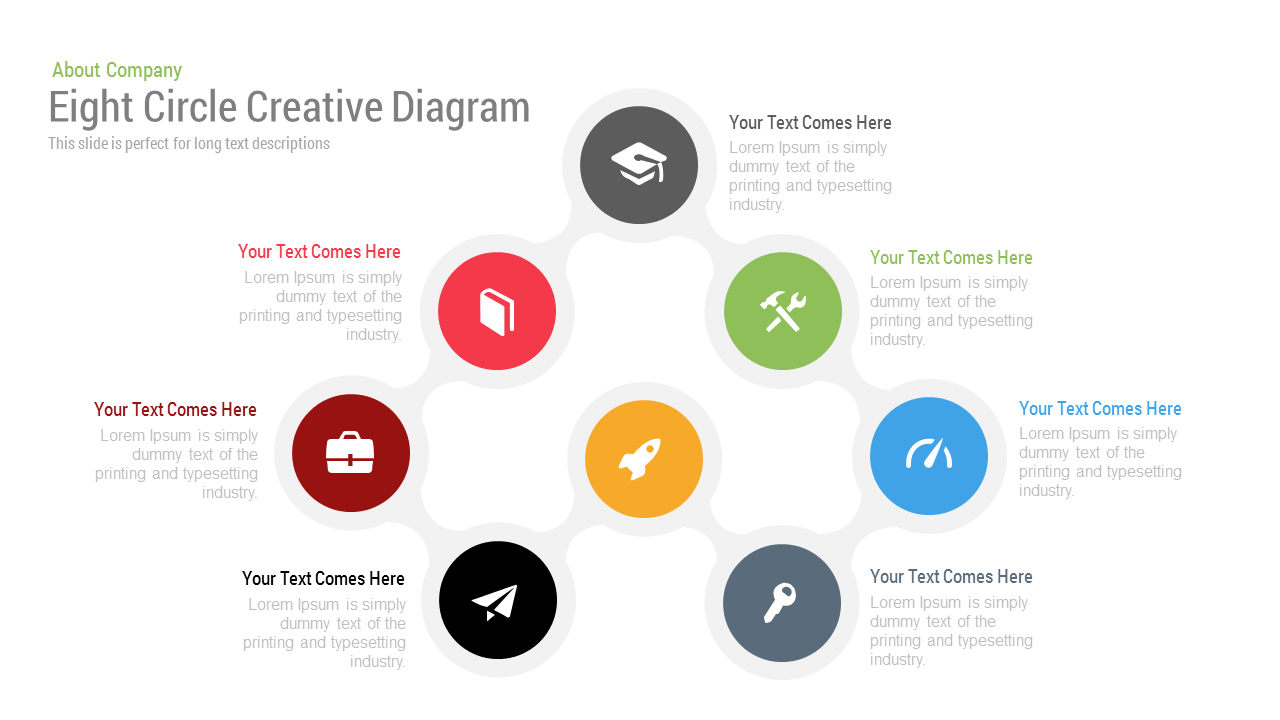
Free Eight Circle Creative Diagram template for PowerPoint & Google Slides
Circular
Free
Free Six Stage Bubble Process Diagram template for PowerPoint & Google Slides
Process
Free
Free Six-Stage Arrow Process Diagram Template for PowerPoint & Google Slides
Process
Free
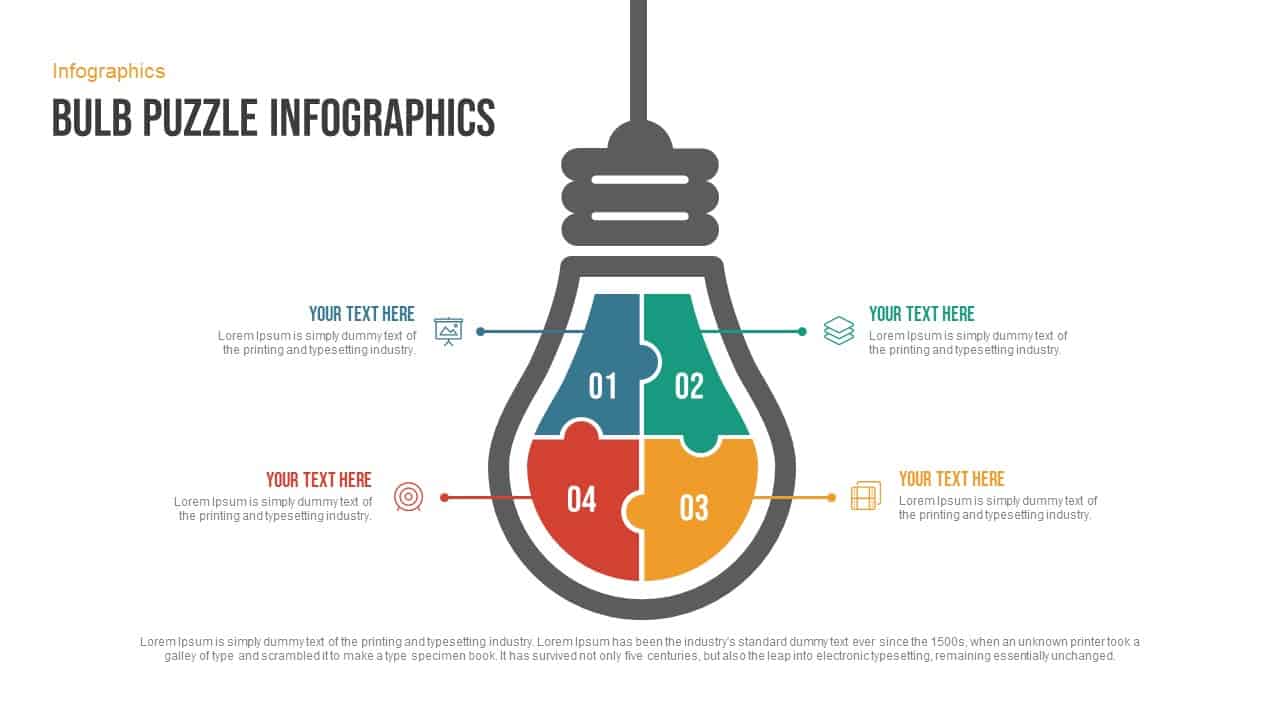
Free Bulb Puzzle Infographics Diagram Template for PowerPoint & Google Slides
Process
Free
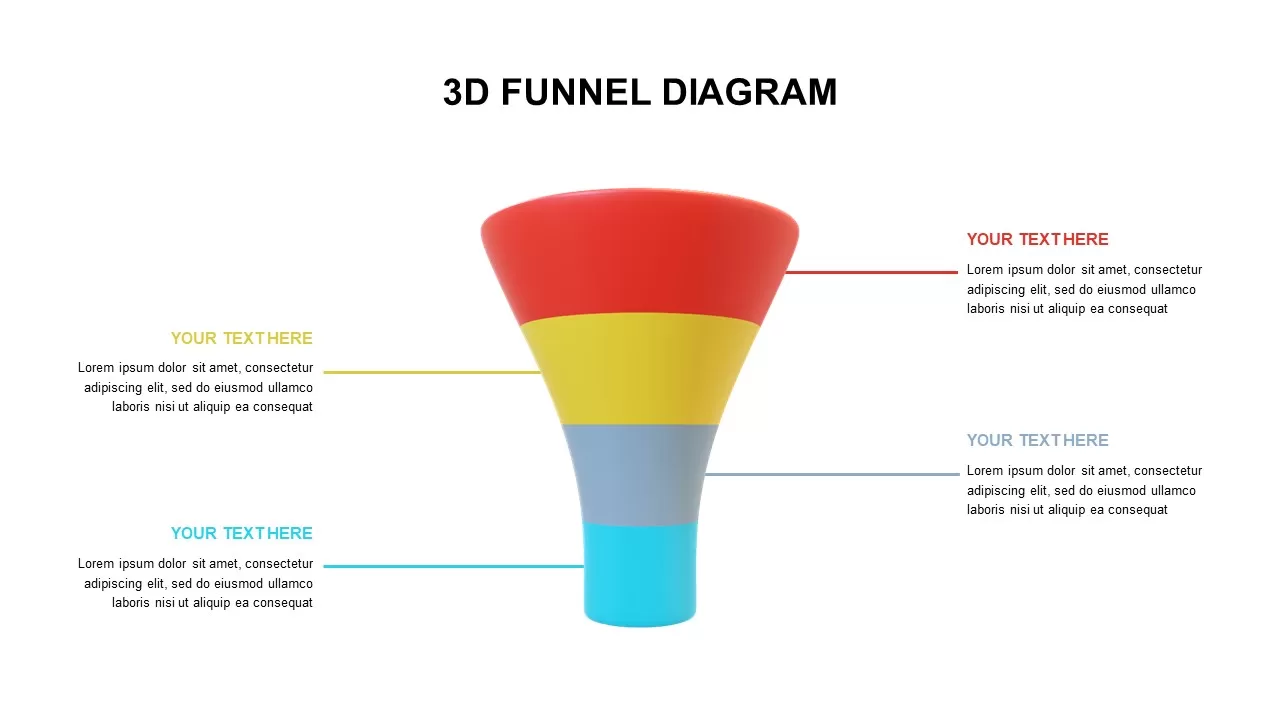
Free 4-Step 3D Funnel Diagram Template for PowerPoint & Google Slides
Funnel
Free
Free Simple Venn Diagram Overview template for PowerPoint & Google Slides
Comparison Chart
Free
Free Venn Diagram template for PowerPoint & Google Slides
Charts
Free
Free Circular Multi-Step Flow Chart Diagram Template for PowerPoint & Google Slides
Flow Charts
Free
Free Curved Arrow Infographic Diagram Template for PowerPoint & Google Slides
Arrow
Free
Free Journey Slide with Four Icons Diagram Template for PowerPoint & Google Slides
Process
Free
Free Animated DNA Infographic Diagram Template for PowerPoint & Google Slides
Infographics
Free
Free Vision and Mission Target Diagram Template for PowerPoint & Google Slides
Vision and Mission
Free
Free Editable Family Tree Genealogy Diagram Template for PowerPoint & Google Slides
Org Chart
Free
Free Brain Function Diagram Infographic Template for PowerPoint & Google Slides
Process
Free
Free Business Development Funnel Diagram Template for PowerPoint & Google Slides
Marketing Funnel
Free
Free UI/UX Process Timeline Diagram Template for PowerPoint & Google Slides
Process
Free
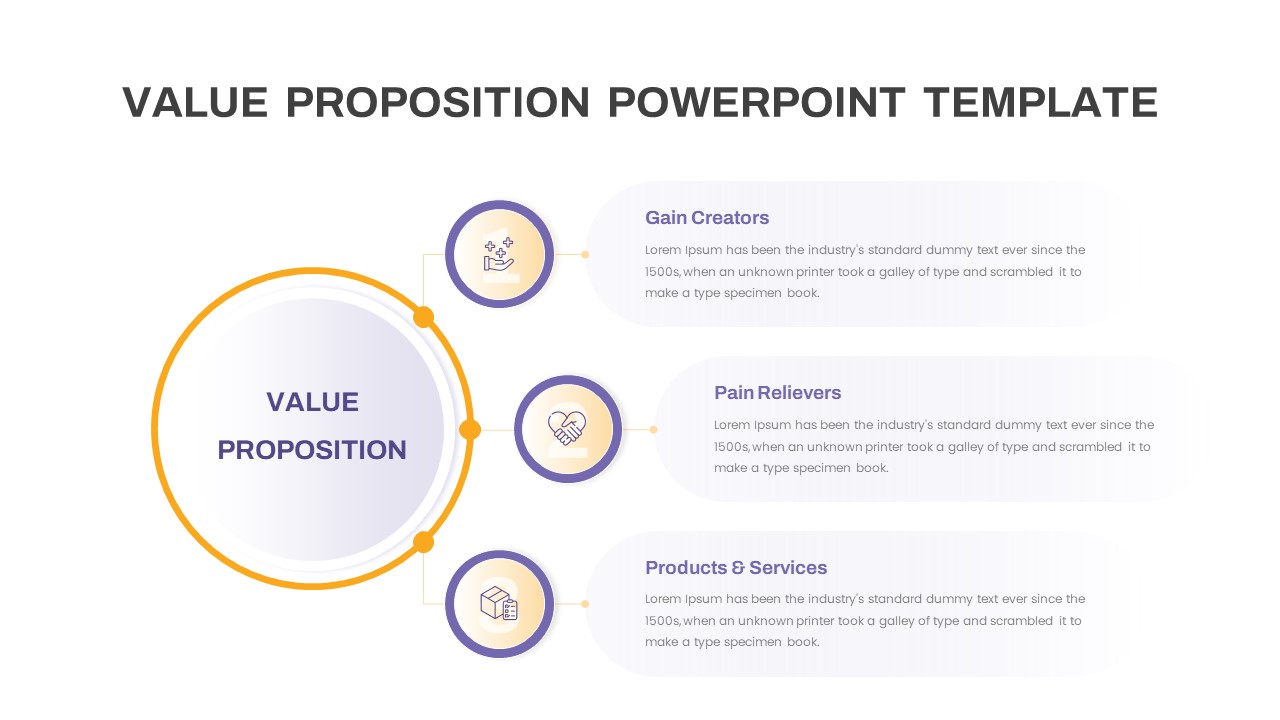
Free Value Proposition Diagram Template for PowerPoint & Google Slides
Business Strategy
Free
Free Time Management Clock Cycle Diagram Template for PowerPoint & Google Slides
Process
Free
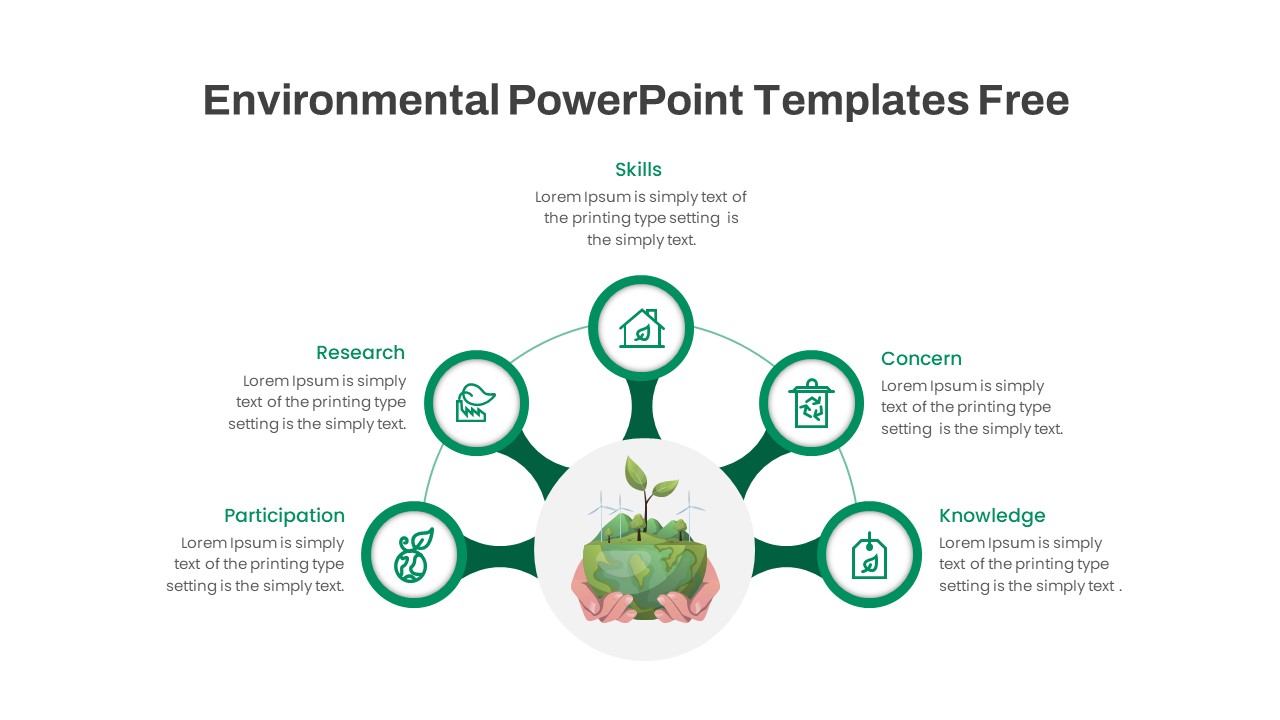
Free Environmental Hub-and-Spoke Diagram Template for PowerPoint & Google Slides
Circular
Free
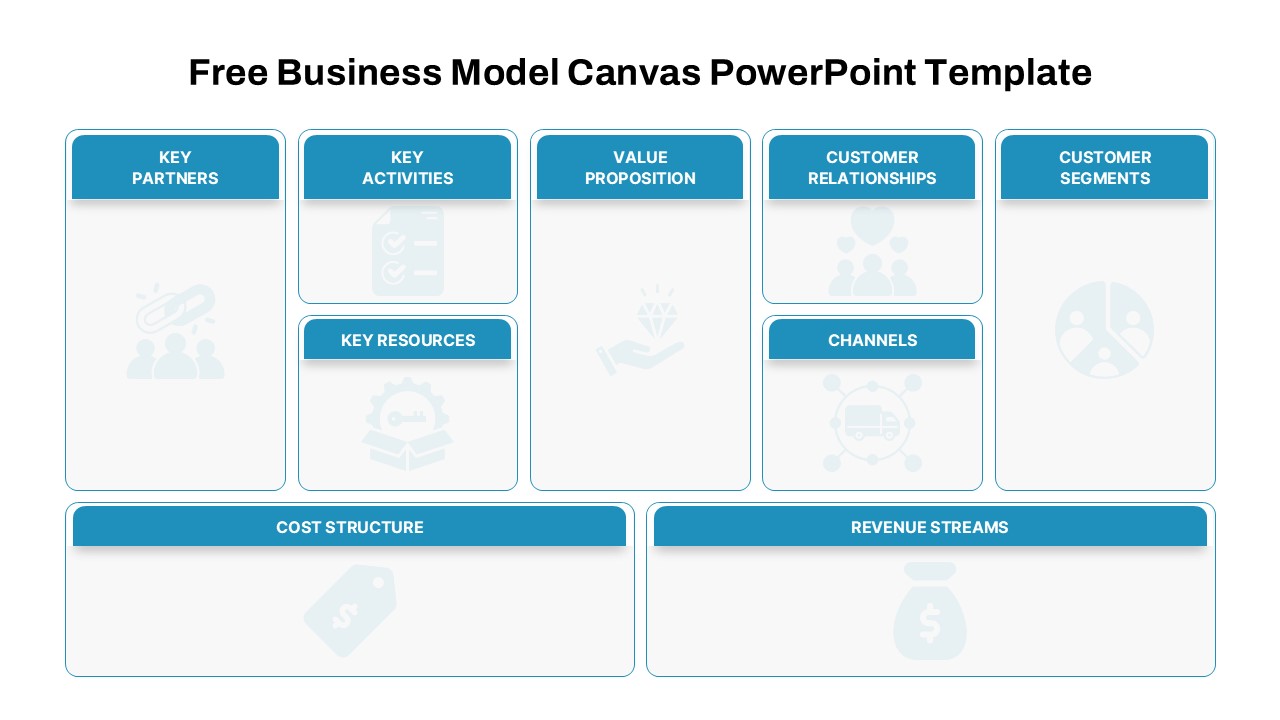
Free Business Model Canvas Diagram Slide Template for PowerPoint & Google Slides
Business Models
Free
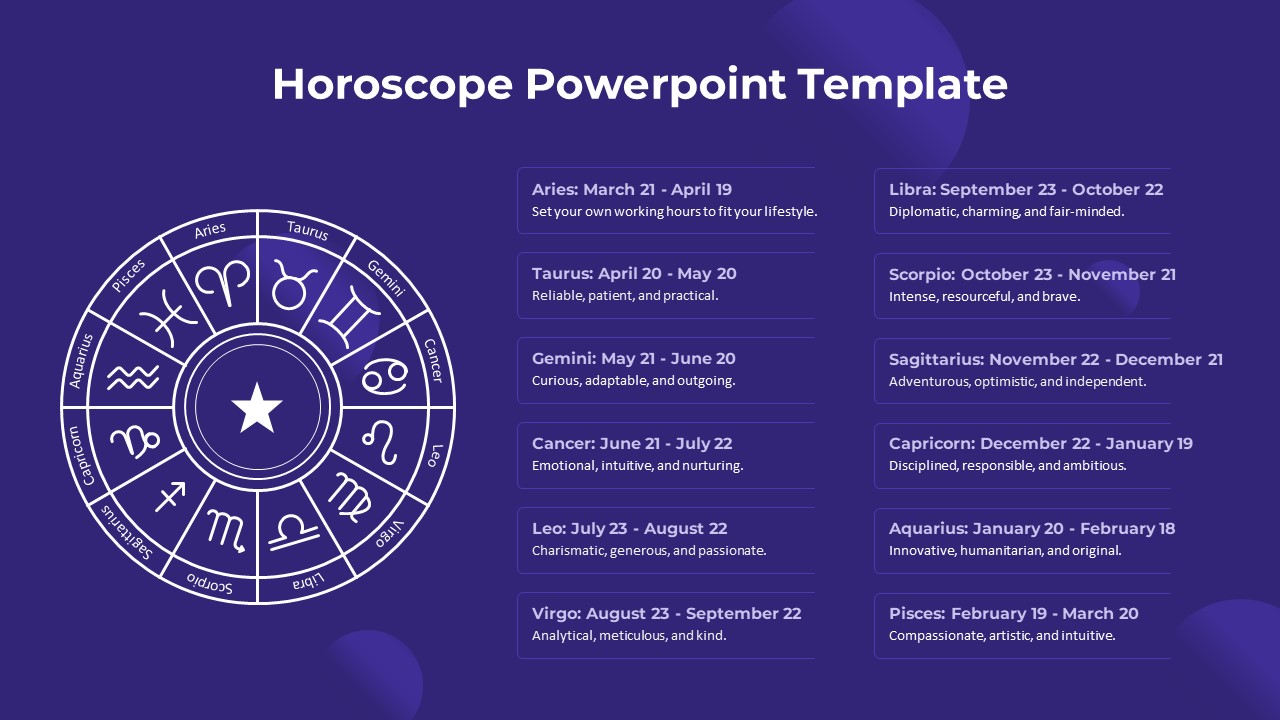
Free Zodiac Horoscope Wheel Diagram Template for PowerPoint & Google Slides
Circular
Free
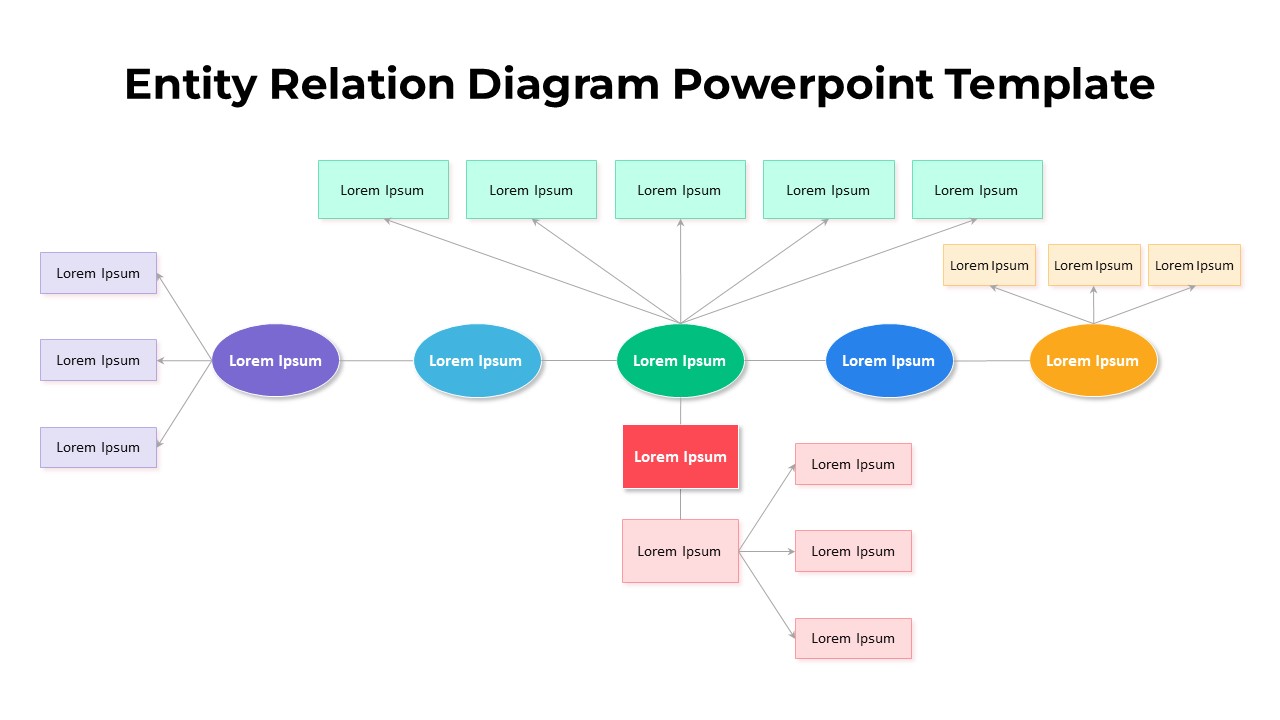
Free Entity Relation Diagram template for PowerPoint & Google Slides
Flow Charts
Free
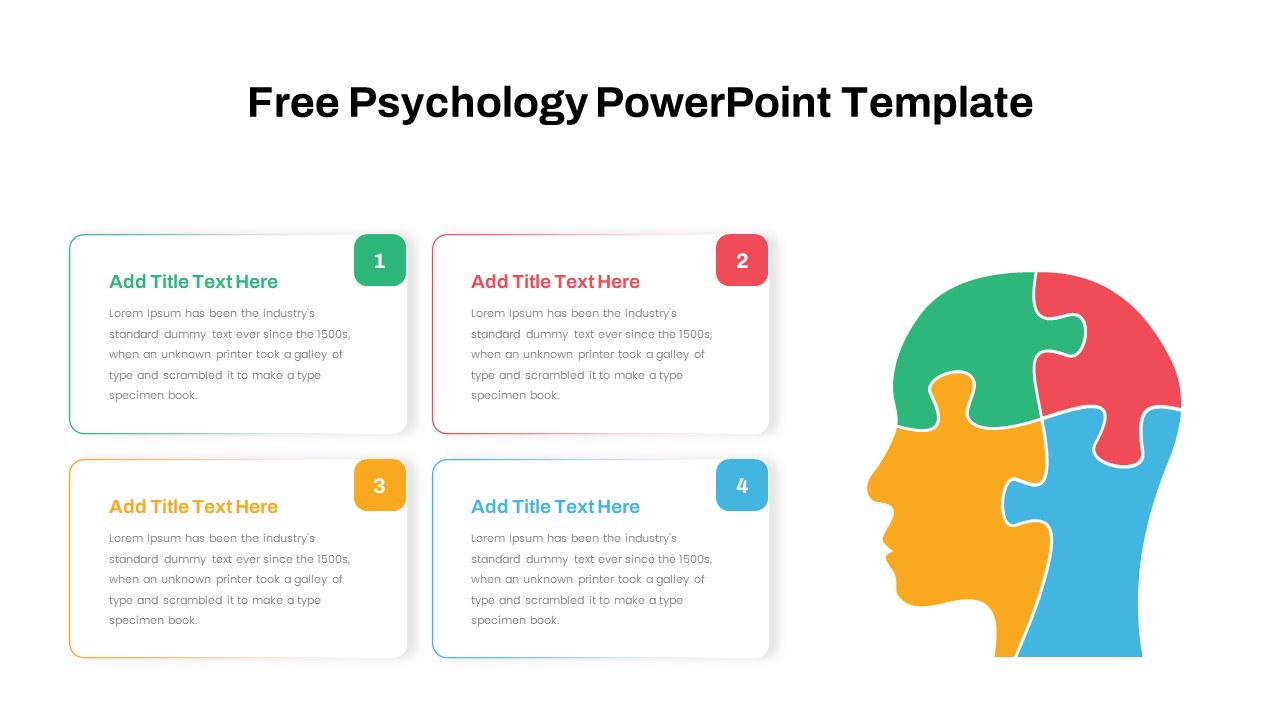
Free Psychology Puzzle Diagram Slide for PowerPoint & Google Slides
Comparison
Free
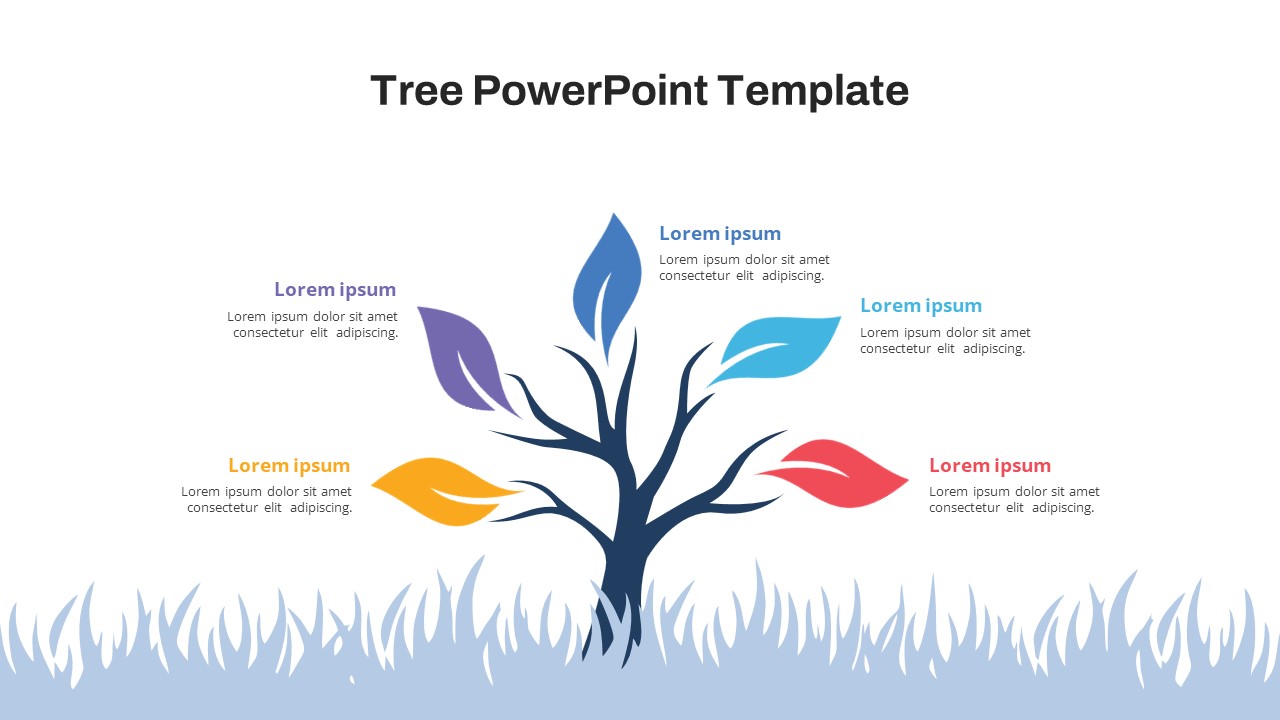
Free Colorful Tree Diagram for Growth & Strategy in PowerPoint & Google Slides
Infographics
Free
PEST Analysis PowerPoint Template for PowerPoint & Google Slides
Business Strategy
Donut Split Analysis template for PowerPoint & Google Slides
Pie/Donut

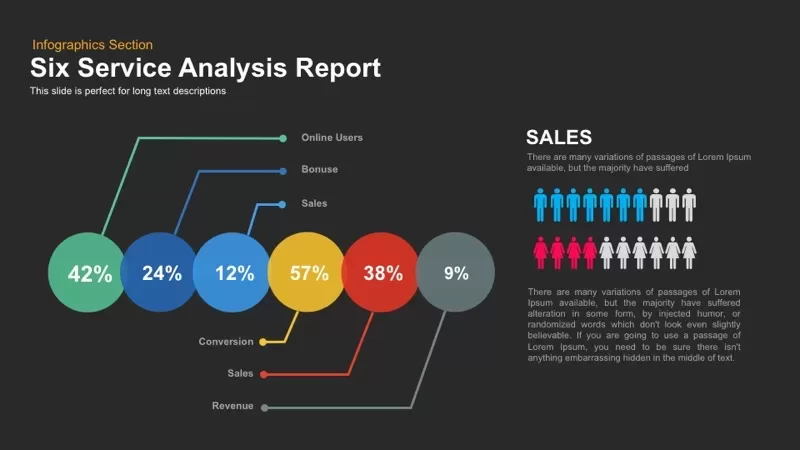
Six Service Analysis Report template for PowerPoint & Google Slides
Infographics
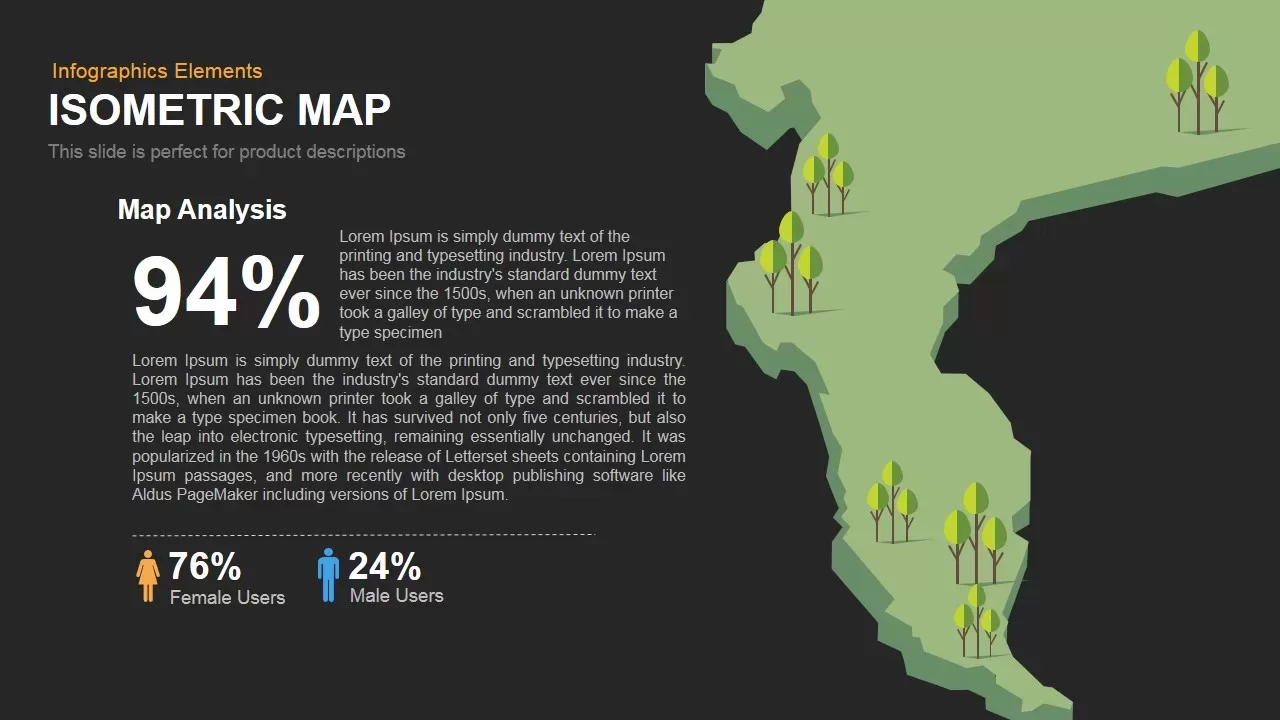
Isometric Map Analysis Slide Template for PowerPoint & Google Slides
World Maps
Pencil Bar Chart Data Analysis Template for PowerPoint & Google Slides
Bar/Column
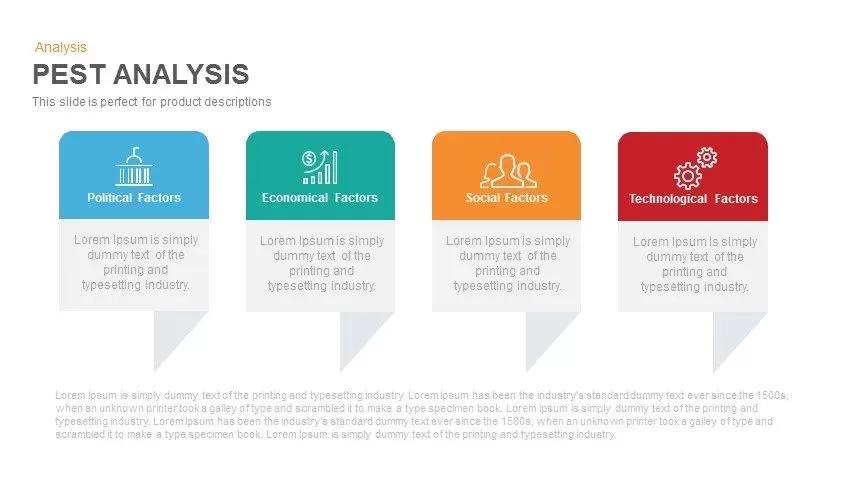
PEST Analysis Template for PowerPoint & Google Slides
PEST
Interactive 3D Puzzle SWOT Analysis Slide Template for PowerPoint & Google Slides
SWOT
Business Case Deck with Market Analysis Template for PowerPoint & Google Slides
Business Report
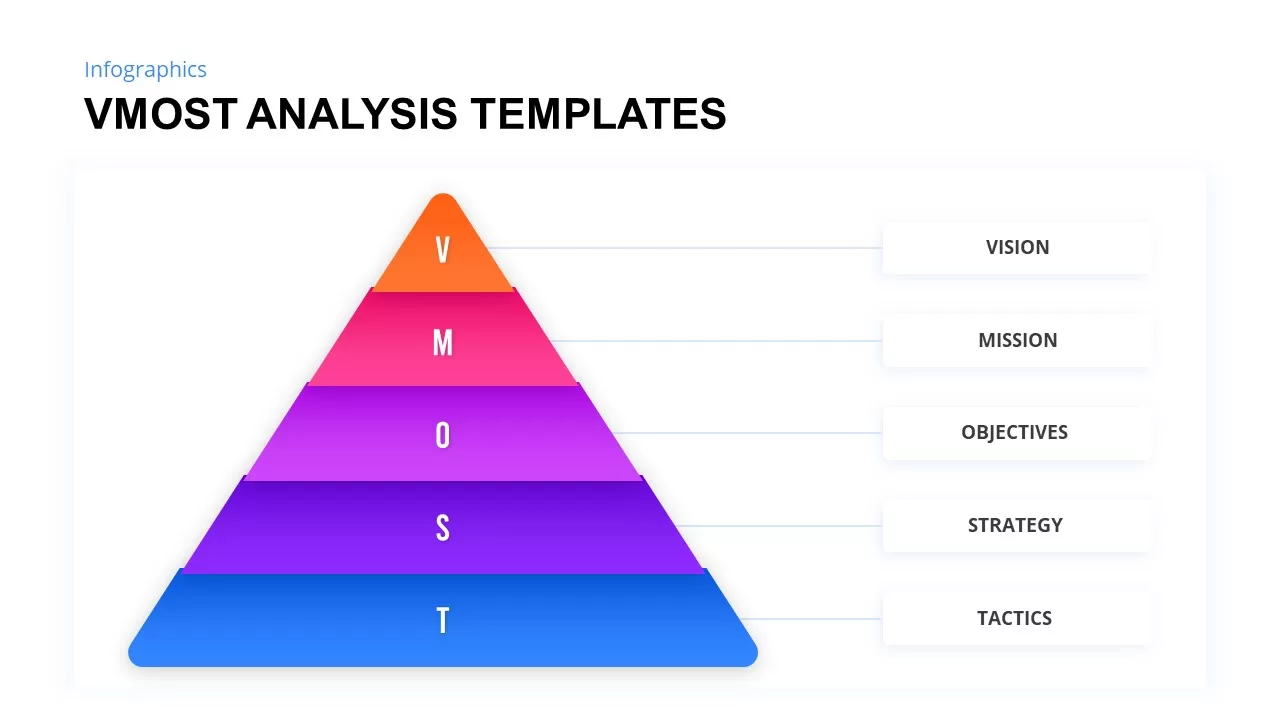
VMOST Analysis Template for PowerPoint & Google Slides
Business Strategy
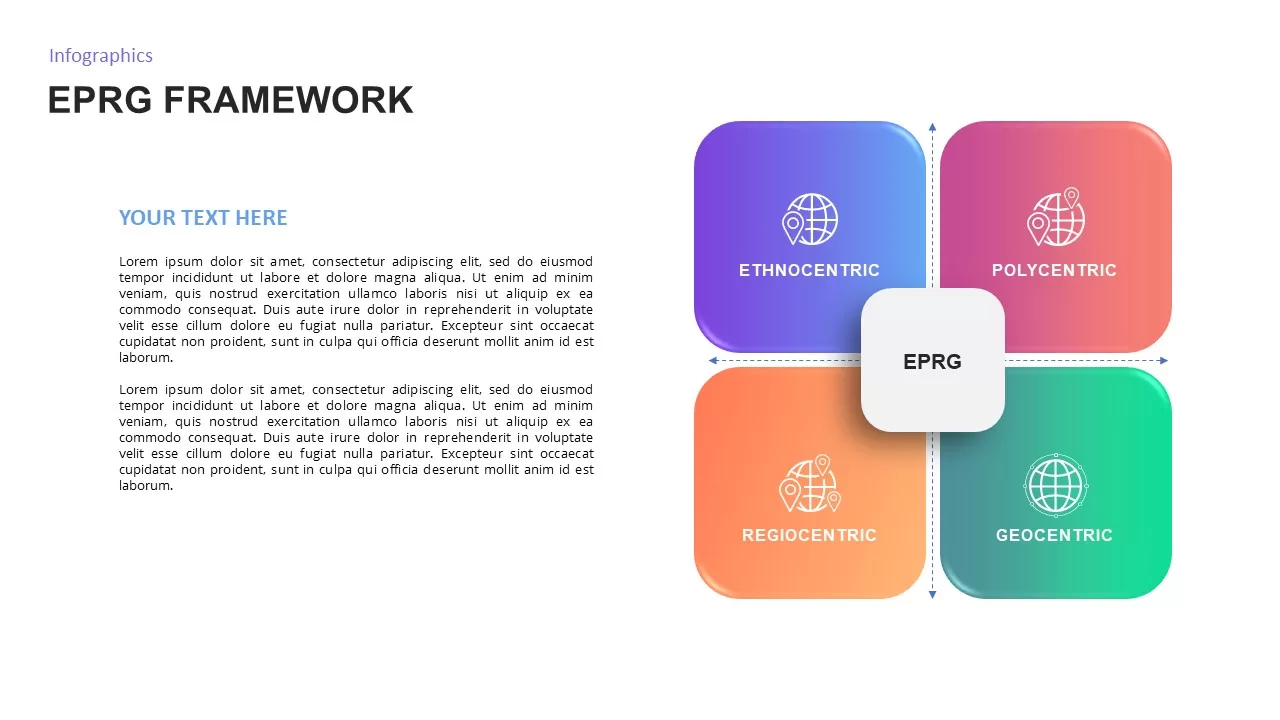
EPRG Framework Analysis template for PowerPoint & Google Slides
Business Strategy
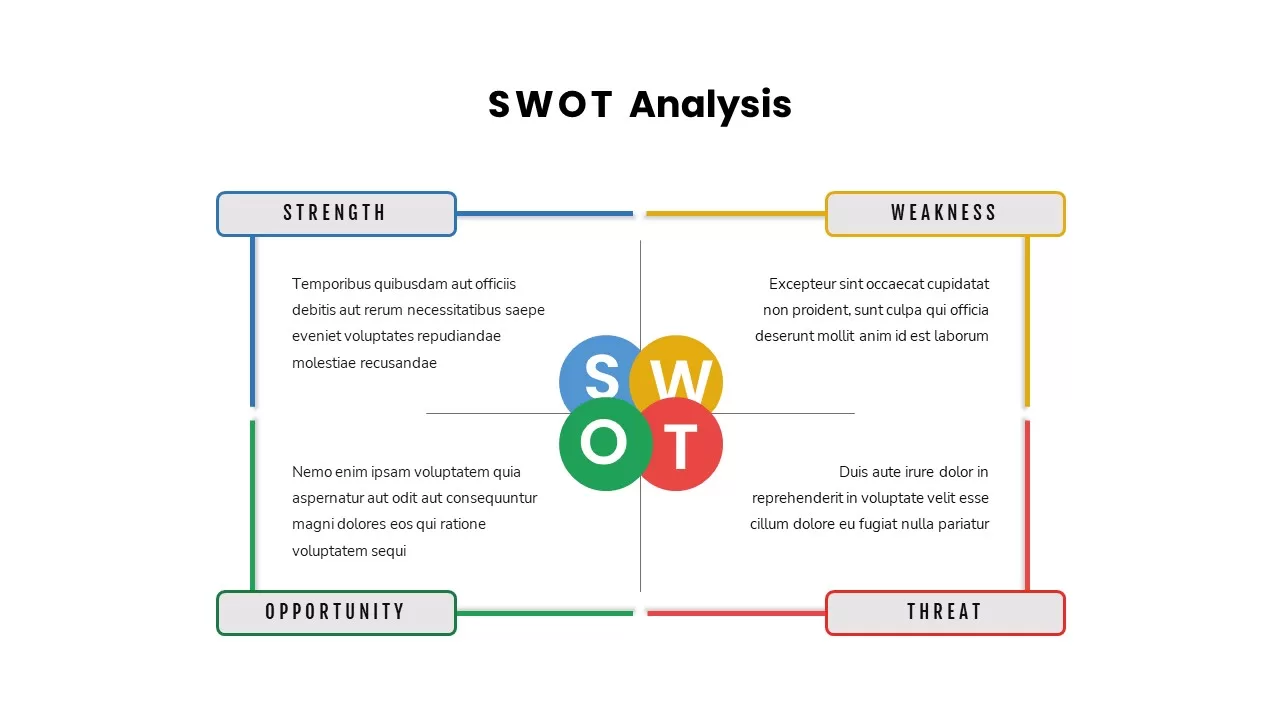
SWOT Analysis Quadrant template for PowerPoint & Google Slides
Business Strategy
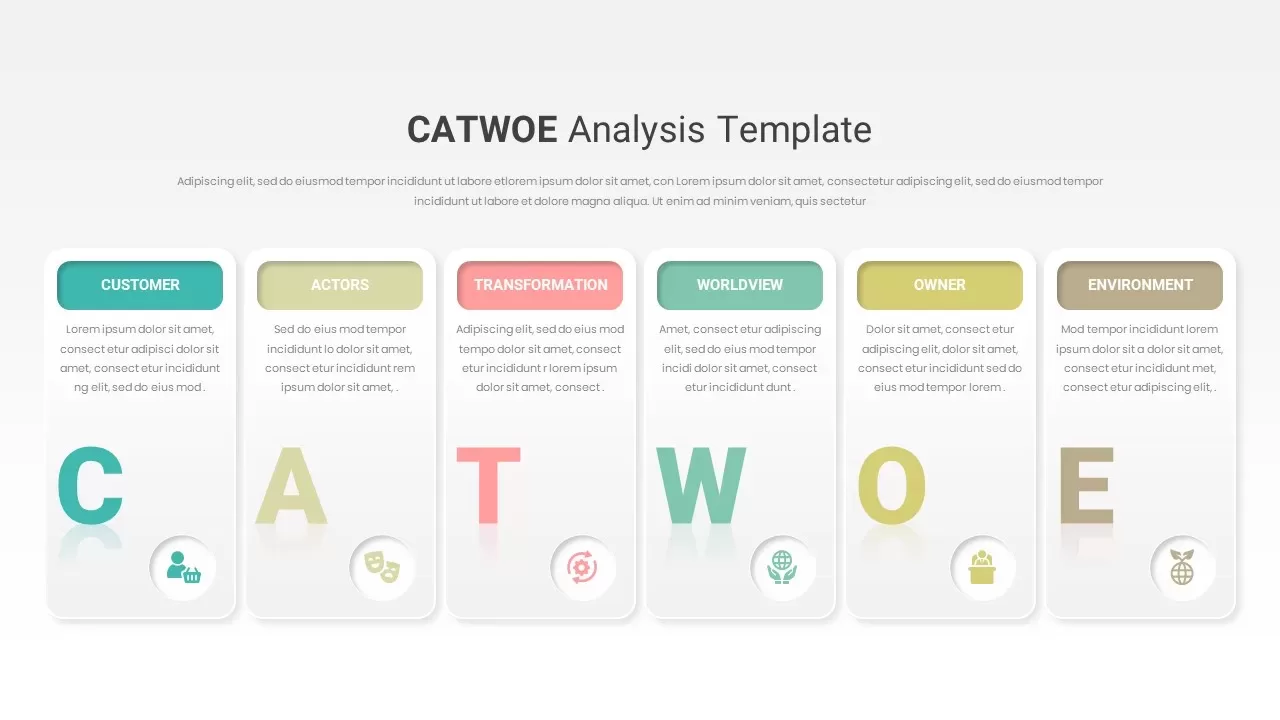
CATWOE Analysis Template for PowerPoint & Google Slides
Process
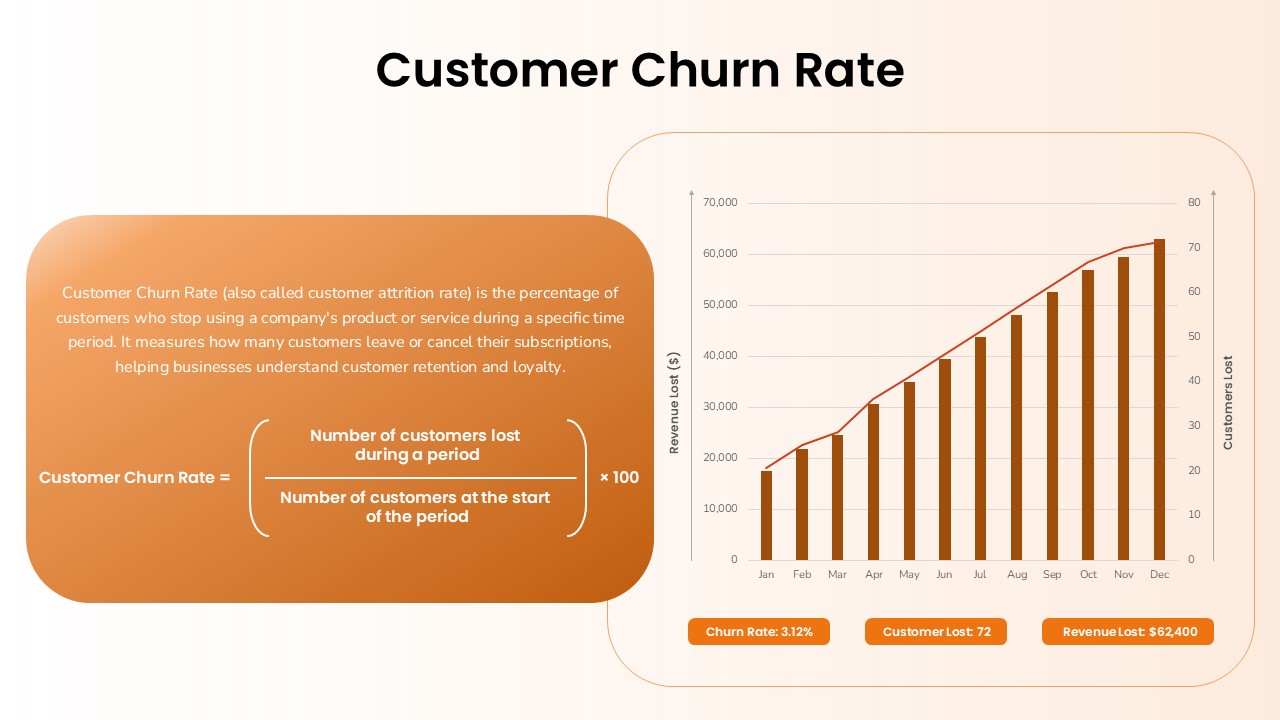
Customer Churn Rate Analysis template for PowerPoint & Google Slides
Business Report
Turnover Analysis Dashboard Template for PowerPoint & Google Slides
Employee Performance
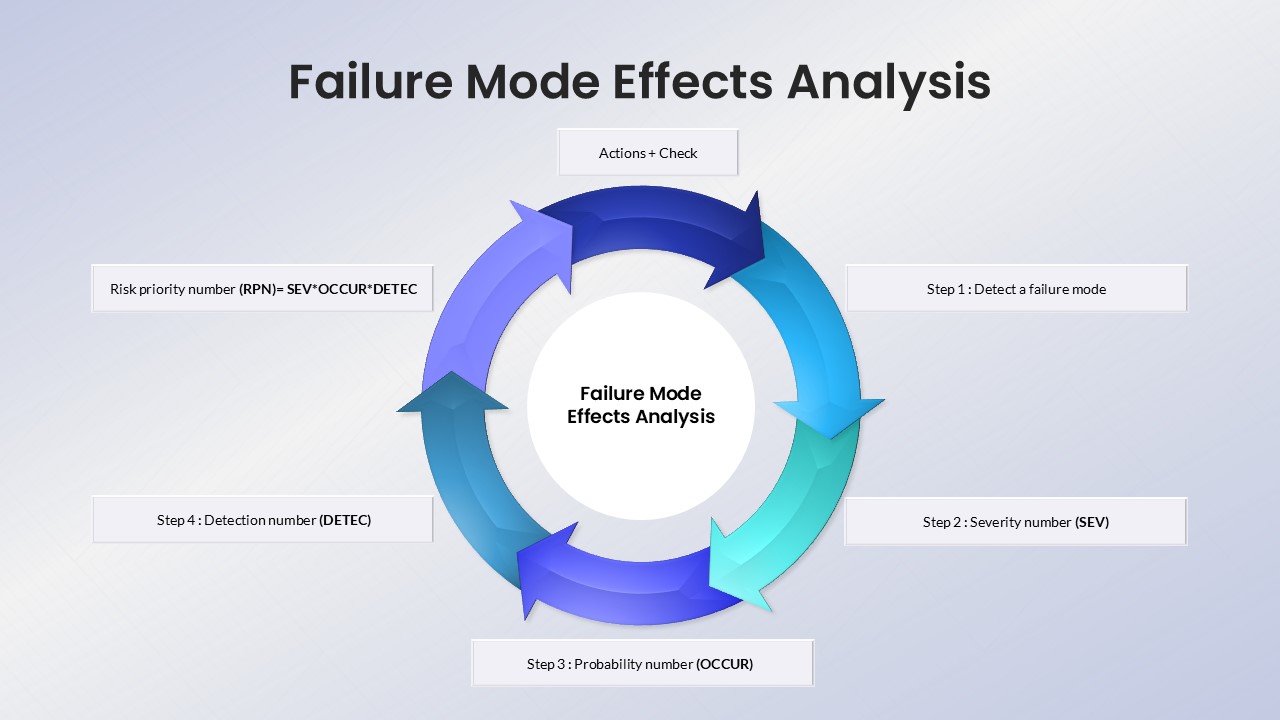
Failure Mode Effects Analysis (FMEA) Slide Template for PowerPoint & Google Slides
Process
Colorful SWOT Analysis Quadrant Template for PowerPoint & Google Slides
SWOT
Personal SWOT Analysis Matrix Cards Template for PowerPoint & Google Slides
SWOT
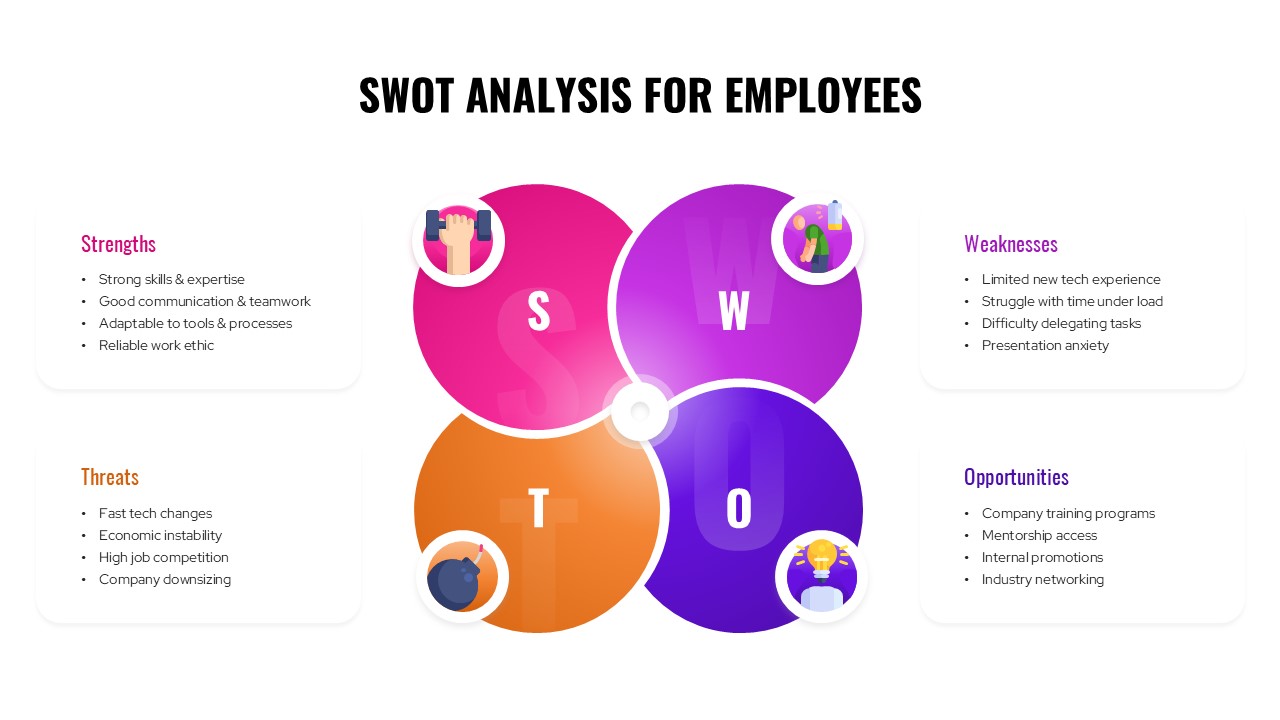
SWOT Analysis For Employees Template for PowerPoint & Google Slides
SWOT
Financial Gap Analysis Framework Template for PowerPoint & Google Slides
Finance