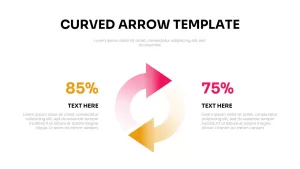
Free Curved Arrow Progress Chart template for PowerPoint & Google Slides


Description
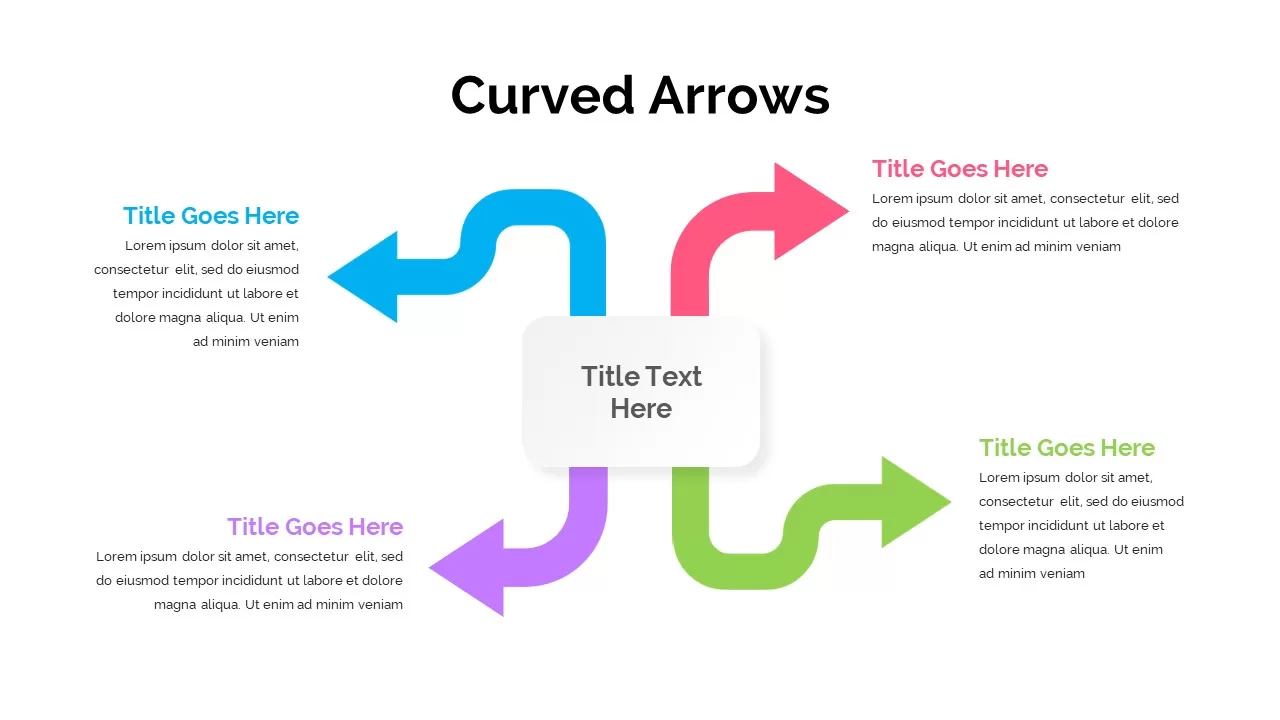
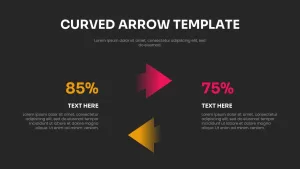
Present dynamic progress or comparison data with this modern Curved Arrow Progress Chart slide. Featuring two bold arrows that flow in a circular motion, this design highlights key percentages or metrics—85% on one side and 75% on the other. The arrows seamlessly transition from a bright pink to a golden yellow gradient, drawing the viewer’s attention to the central comparison. Each section includes space for customizable text, allowing you to present descriptive details or additional data alongside the key statistics. The design combines simplicity and elegance, ensuring that your message is clear and impactful.
This versatile slide is ideal for tracking project milestones, displaying business performance, or comparing different metrics or achievements in a visual format. The modern gradient colors and curved arrow shapes symbolize growth and progress, making this an ideal asset for corporate, marketing, and project management presentations. With intuitive text boxes and the ability to edit the design quickly, it’s easy to adapt this slide to fit your specific needs, whether you’re presenting quarterly results, team goals, or operational benchmarks.
Who is it for
Project managers, business analysts, and marketing leaders will find this slide valuable when showcasing progress or comparing performance metrics. It’s perfect for team leads reporting on key performance indicators (KPIs), sales progress, or operational goals. Entrepreneurs and consultants can also use this design to present business growth and strategy comparisons.
Other Uses
This slide can also be repurposed for visualizing timelines, comparing product features, or mapping out key actions in a project. It is great for use in performance dashboards, sales reports, or product comparison charts. The customizable text fields make it ideal for a wide variety of uses, from status updates to competitor analysis and beyond.
Login to download this file

Item ID
SB02737
Related Templates

Growth Arrow for Progress & Growth template for PowerPoint & Google Slides
Arrow

Free Curved Arrow Infographic Diagram Template for PowerPoint & Google Slides
Arrow
Free
Curved Arrow Process Flow Infographic Template for PowerPoint & Google Slides
Process
Multi-Color Five-Step Curved Arrow Template for PowerPoint & Google Slides
Process
Curved Arrow Process Flow Diagram Template for PowerPoint & Google Slides
Process
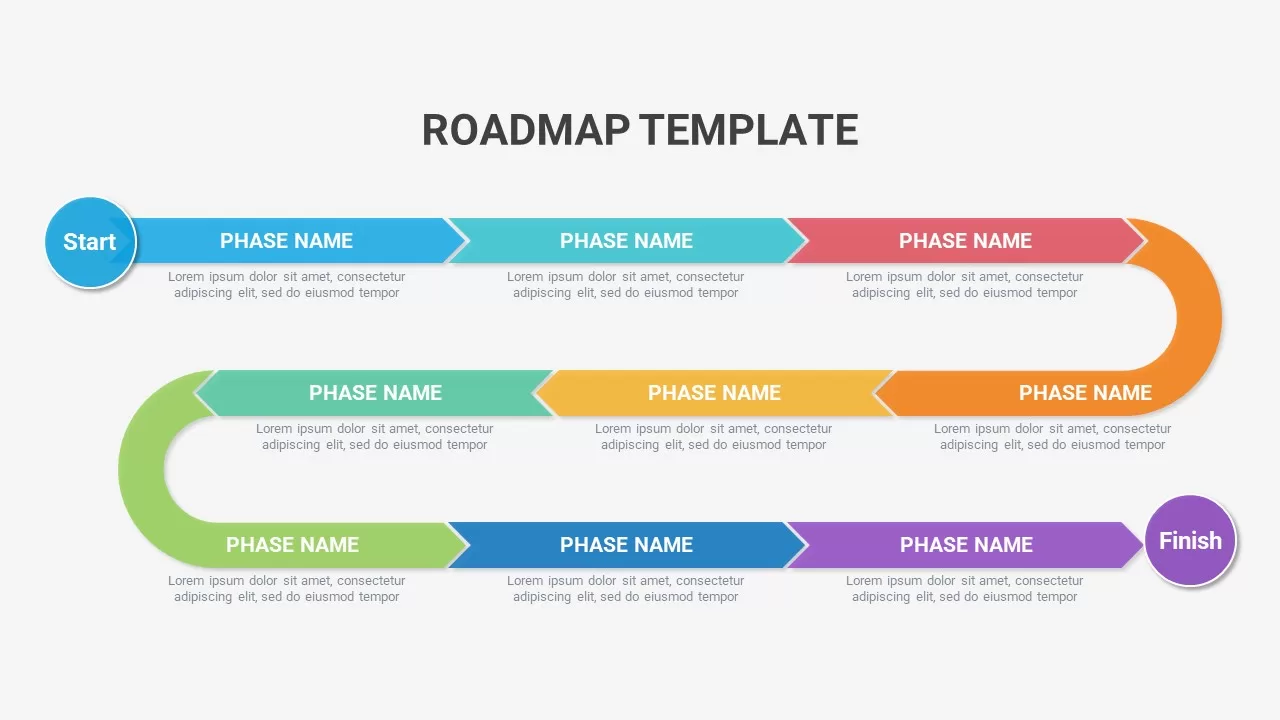
Dynamic Curved Arrow Process Roadmap Template for PowerPoint & Google Slides
Process
Curved Arrow Process Flow Diagram Template for PowerPoint & Google Slides
Arrow
Curved Arrow Flow Diagram template for PowerPoint & Google Slides
Business
5-Step Curved Arrow Infographic Template for PowerPoint & Google Slides
Arrow
3D Curved Arrow Growth Process Slide Template for PowerPoint & Google Slides
Process
Curved Arrow Flow Template for PowerPoint & Google Slides
Process
Four-Step Curved Arrow Process Template for PowerPoint & Google Slides
Process
Three-Path Curved Arrow Infographic Template for PowerPoint & Google Slides
Arrow
Curved Arrow Process Flow template for PowerPoint & Google Slides
Process
Curved Arrow Process Flow template for PowerPoint & Google Slides
Process
Curved Arrow Roadmap template for PowerPoint & Google Slides
Roadmap
Curved Arrow Progression template for PowerPoint & Google Slides
Process
Three-Step Curved Arrow Process Diagram Template for PowerPoint & Google Slides
Arrow
Four-Arrow Curved Hub-and-Spoke Diagram Template for PowerPoint & Google Slides
Arrow
Hand-Drawn Four-Step Curved Arrow Diagram Template for PowerPoint & Google Slides
Arrow
Four-Step Curved Arrow Diagram Template for PowerPoint & Google Slides
Arrow
Progress Chart Slide for PowerPoint & Google Slides
Charts
iPad App Mockup with Progress Metrics Template for PowerPoint & Google Slides
Bar/Column
Success Cloud Progress Infographics Template for PowerPoint & Google Slides
Charts
Strategy Progress Timeline Template for PowerPoint & Google Slides
Process
Performance Review Progress Management Template for PowerPoint & Google Slides
Process
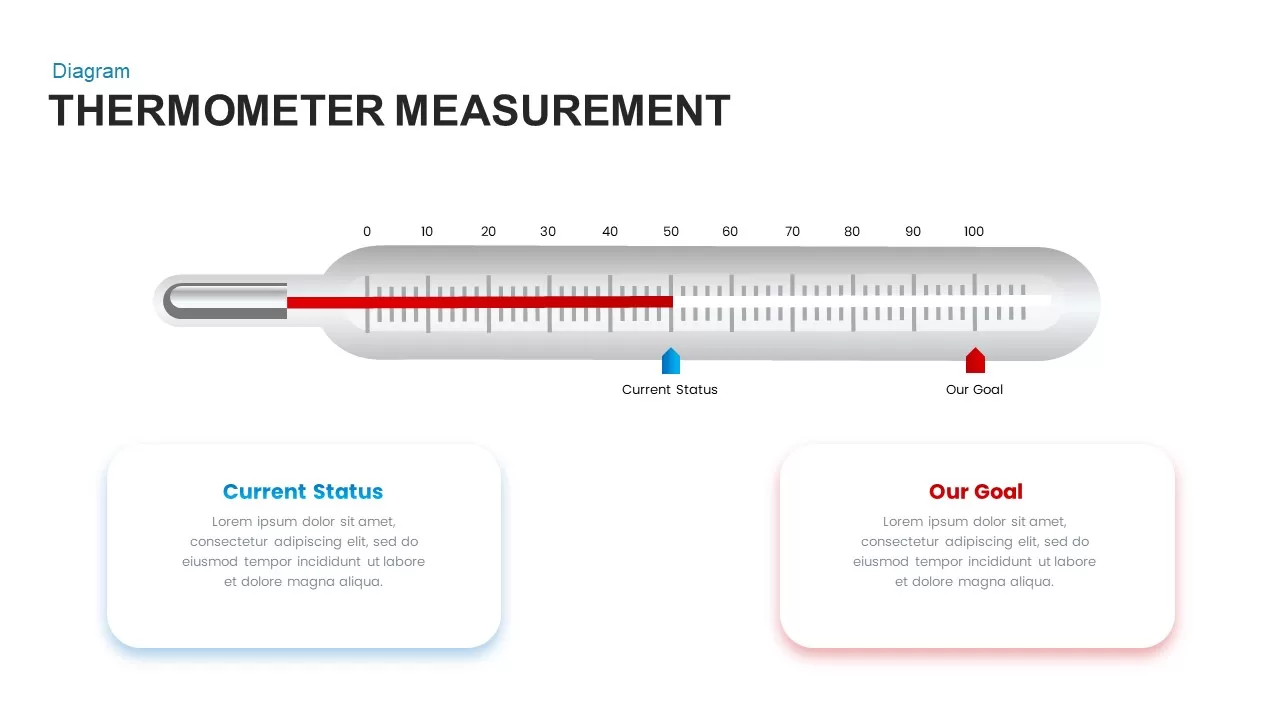
Thermometer Gauge Progress Measurement Template for PowerPoint & Google Slides
Comparison
Dynamic Statistics & Progress Charts Template for PowerPoint & Google Slides
Pie/Donut
Agriculture Infographics Slide with Progress Rings & Metrics Template for PowerPoint & Google Slides
Pie/Donut
Timeline Roadmap with Progress Bar Template for PowerPoint & Google Slides
Timeline
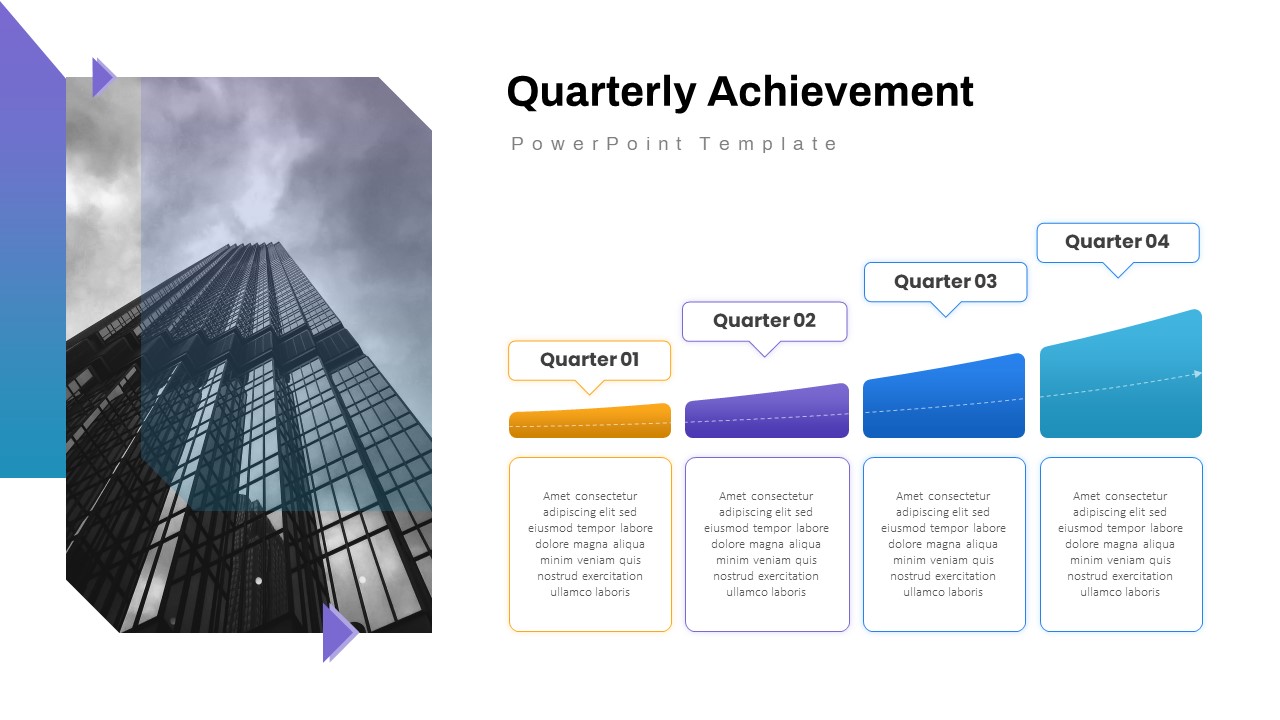
Quarterly Achievement Progress Template for PowerPoint & Google Slides
Accomplishment
Progress Bar and Milestone Visualization Template for PowerPoint & Google Slides
Timeline
Project Progress Dashboard Pie Charts Template for PowerPoint & Google Slides
Project
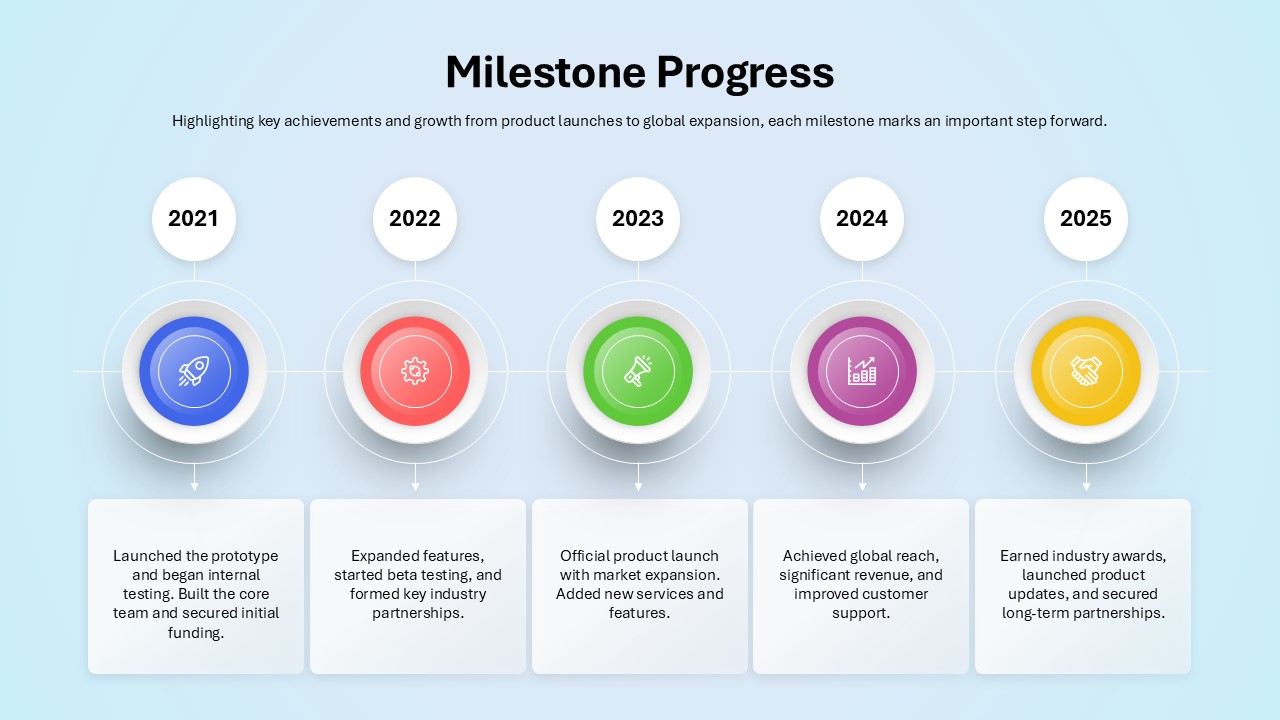
Milestone Progress template for PowerPoint & Google Slides
Business Plan
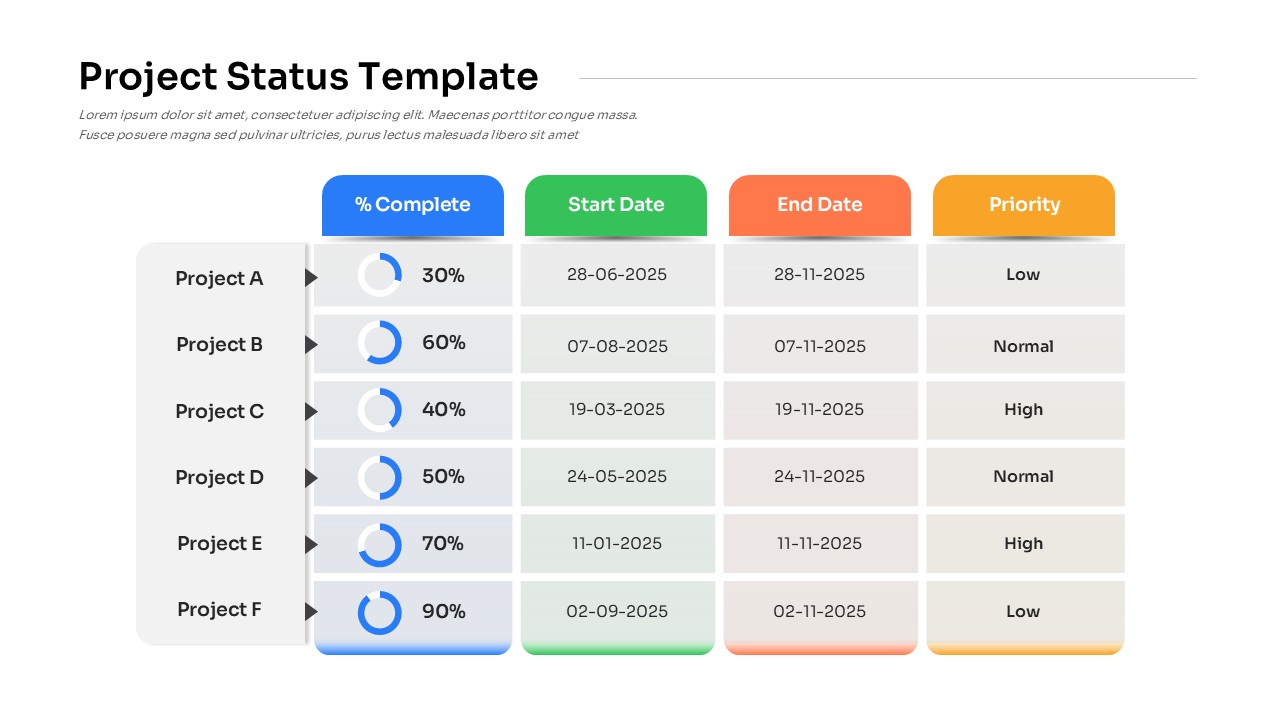
Project Status with Progress & Priority Template for PowerPoint & Google Slides
Table
Progress Bar Graph Layout Design for PowerPoint & Google Slides
Charts
Progress Bar Infographic for PowerPoint & Google Slides
Business
Progress Bar infographic pack for PowerPoint & Google Slides
Business
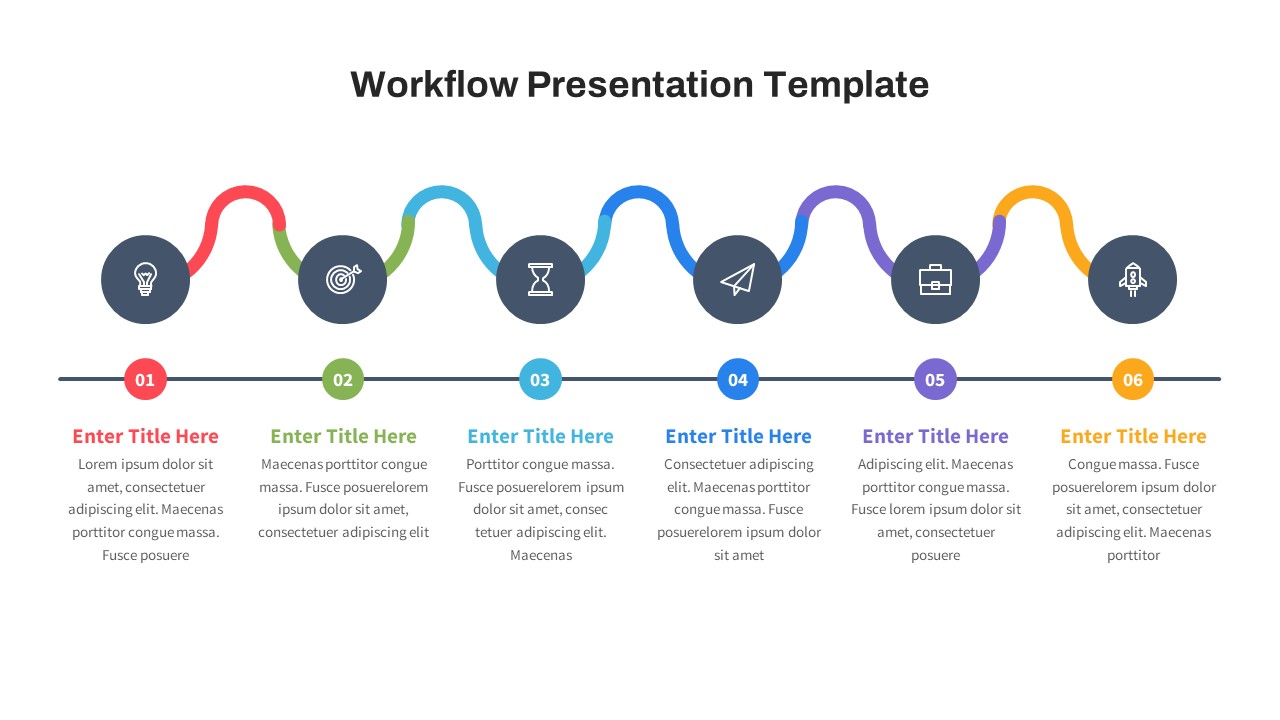
Free 6-Step Curved Workflow Timeline for PowerPoint & Google Slides
Timeline
Free
Multi-Series Curved Line Graph Analytics Template for PowerPoint & Google Slides
Comparison Chart
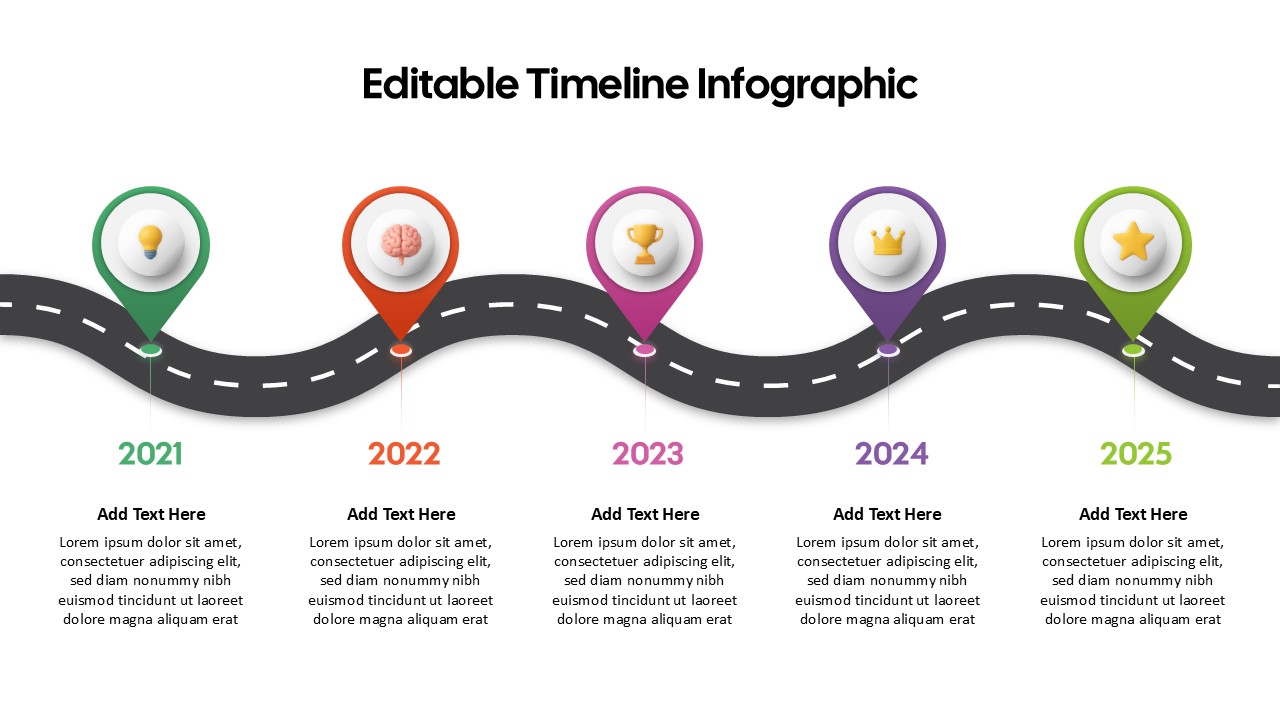
Curved Five-Section Timeline Infographic template for PowerPoint & Google Slides
Timeline
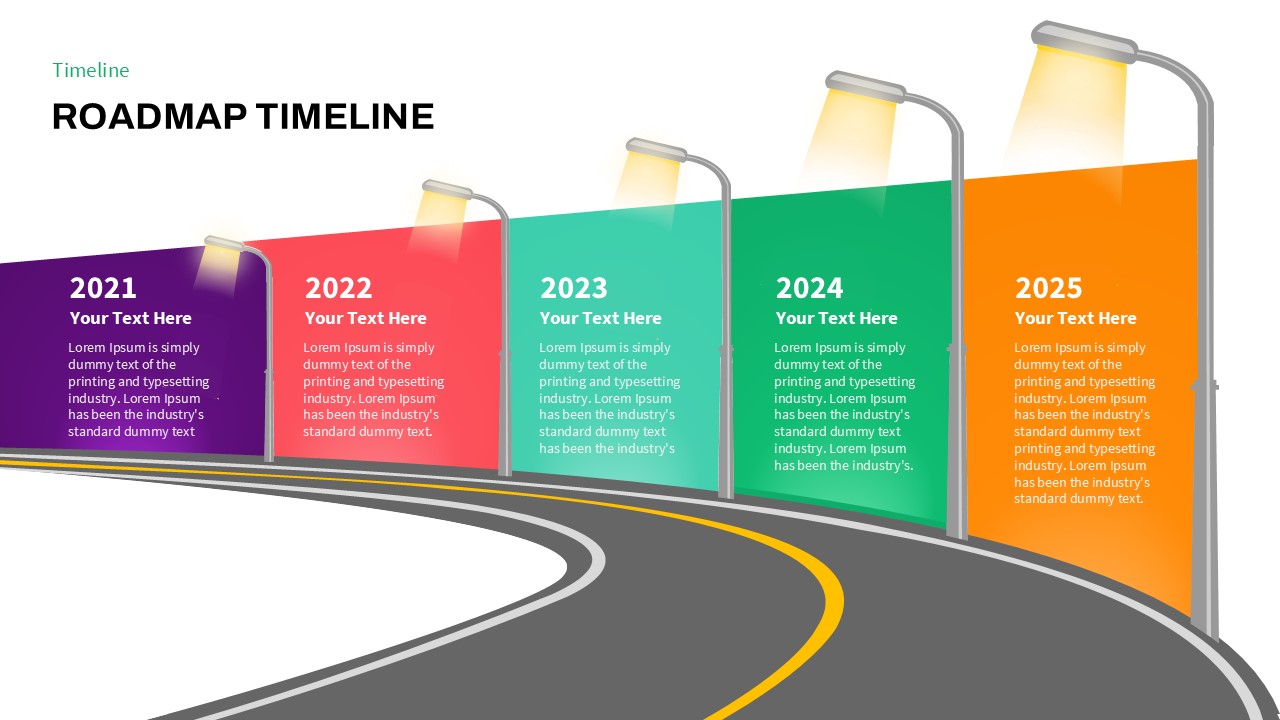
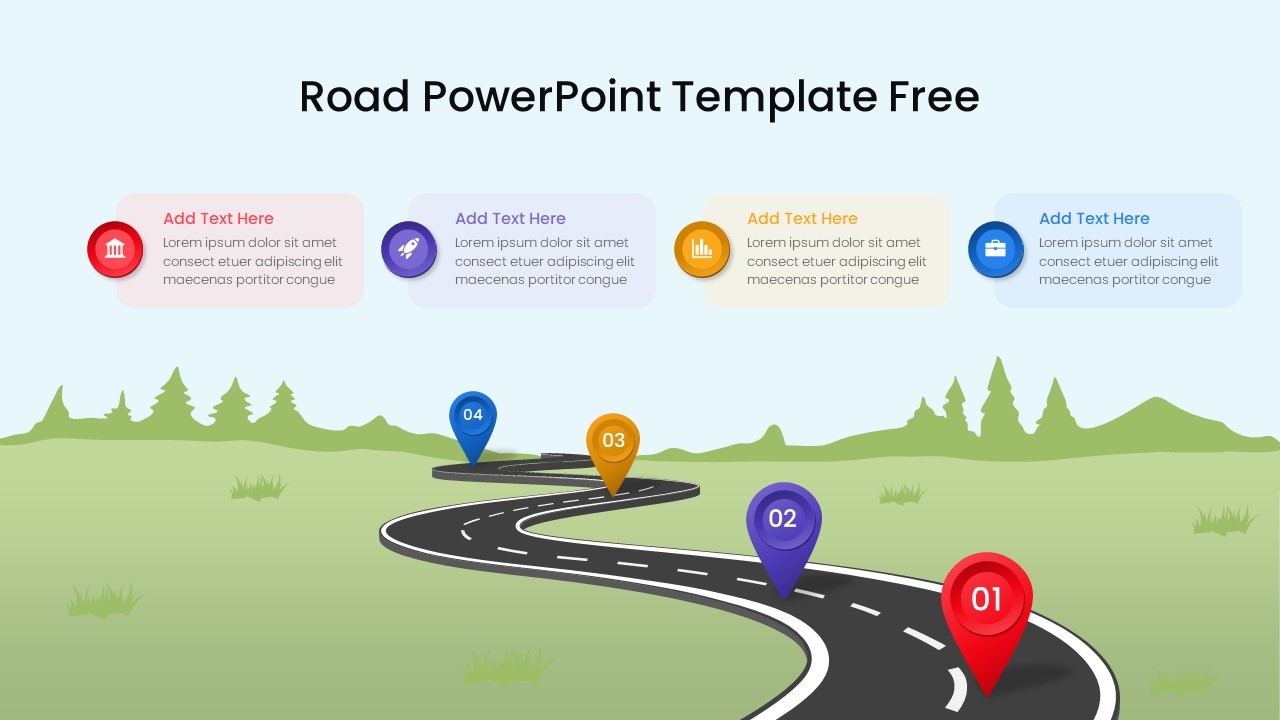
Curved Road Map Timeline Infographic Template for PowerPoint & Google Slides
Roadmap
Curved Road Roadmap Timeline Diagram Template for PowerPoint & Google Slides
Roadmap
Data Migration Life Cycle Curved Diagram Template for PowerPoint & Google Slides
Process
Colorful Curved Roadmap Phases Template for PowerPoint & Google Slides
Roadmap
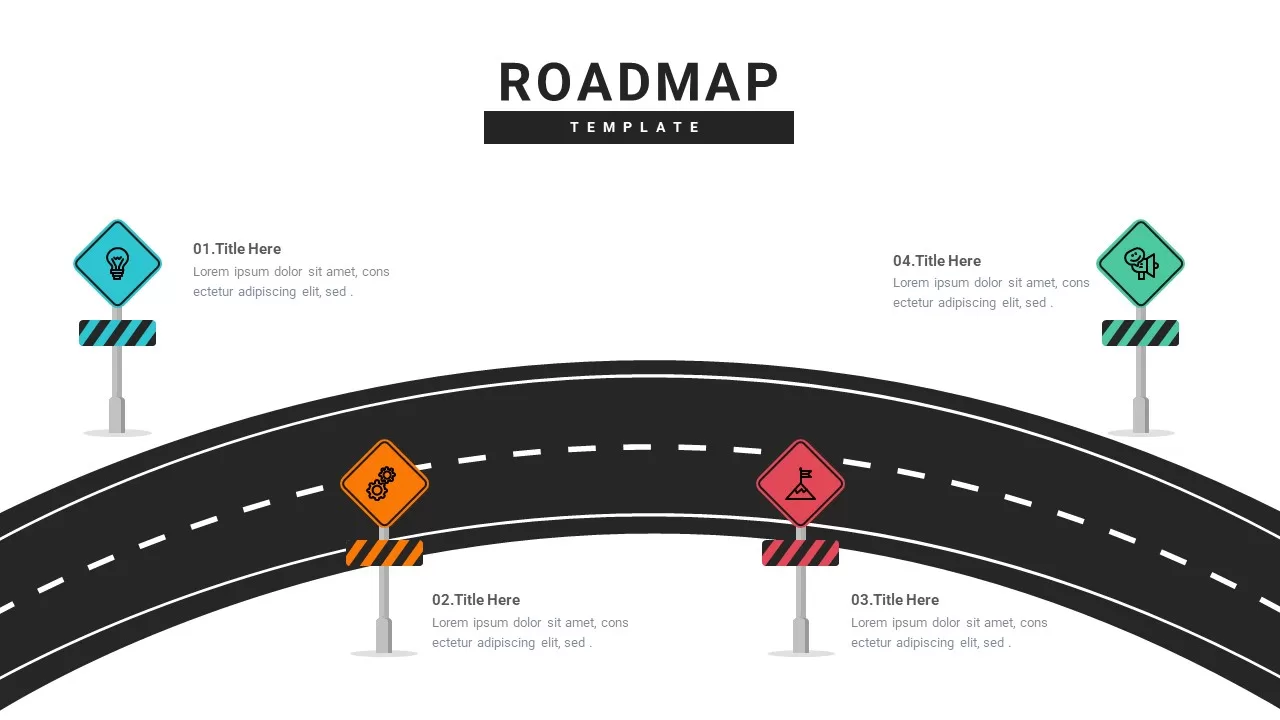
Curved Roadmap with Iconic Signposts Template for PowerPoint & Google Slides
Roadmap
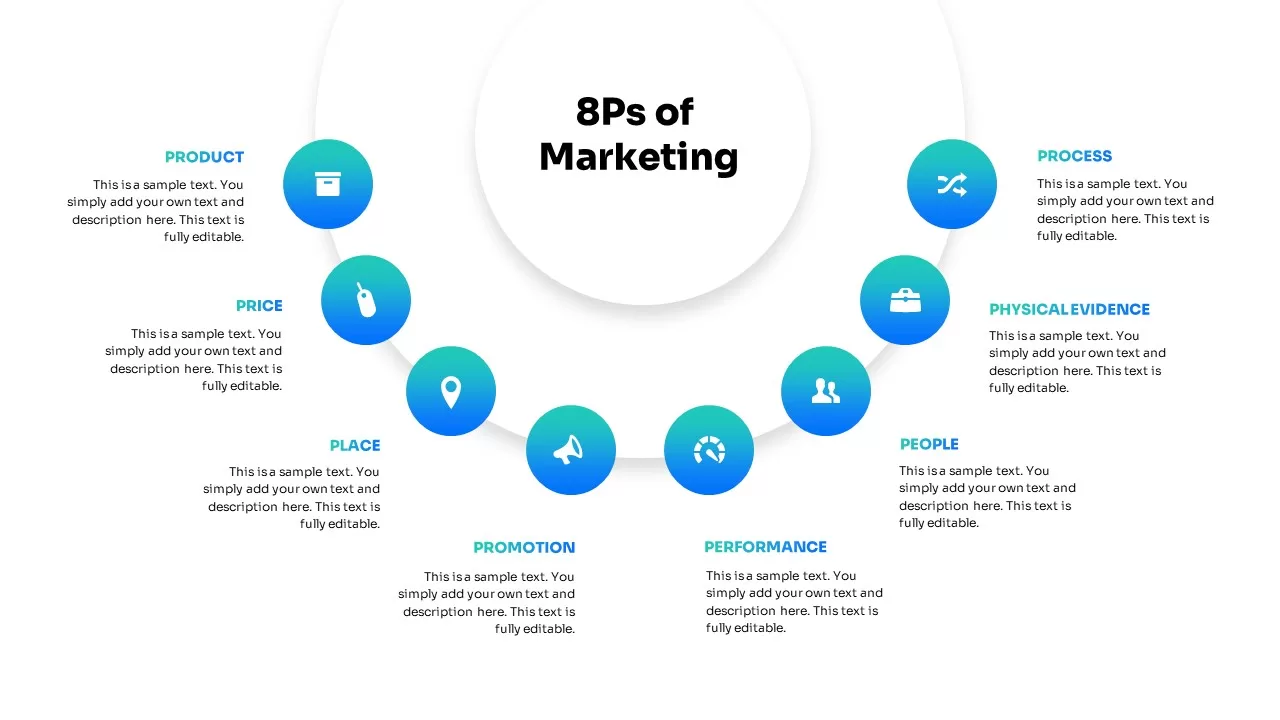
Curved 8Ps of Marketing Diagram Template for PowerPoint & Google Slides
Marketing
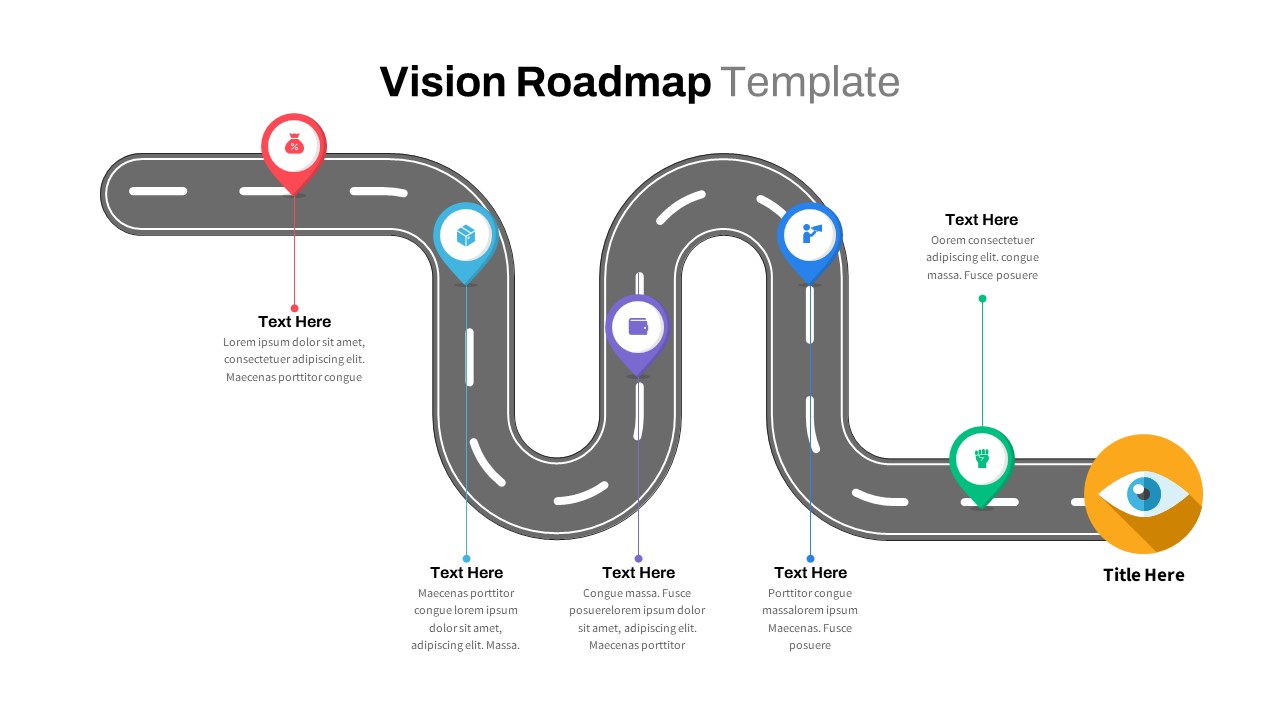
Curved Roadmap Infographic Vision Journey Template for PowerPoint & Google Slides
Business Strategy
Multi-color Curved Timeline Roadmap Template for PowerPoint & Google Slides
Timeline
Curved Road Timeline Infographic Template for PowerPoint & Google Slides
Timeline
Curved Line Graph for PowerPoint & Google Slides
Timeline
Curved Roadmap with Milestones Slide for PowerPoint & Google Slides
Roadmap
Free
Arrow Line Chart Template for PowerPoint & Google Slides
Comparison Chart
Free Six-Stage Arrow Process Diagram Template for PowerPoint & Google Slides
Process
Free

Free Multi-Year Arrow Timeline Infographic Template for PowerPoint & Google Slides
Timeline
Free
Free Professional Gantt Chart Pack – 4 Slides Template for PowerPoint & Google Slides
Gantt Chart
Free
Arrow Infographics template for PowerPoint & Google Slides
Infographics
4 Step Arrow Diagram template for PowerPoint & Google Slides
Arrow
5-Step Arrow Diagram template for PowerPoint & Google Slides
Arrow
3D Arrow Infographics Circular Flow Template for PowerPoint & Google Slides
Arrow
Business Lifecycle Arrow Template for PowerPoint & Google Slides
Infographics
6-Step Arrow Process Diagram Template for PowerPoint & Google Slides
Process
5-Stage Arrow Infographics Process Flow Template for PowerPoint & Google Slides
Arrow
Colorful Arrow Process Diagram Template for PowerPoint & Google Slides
Arrow
Arrow Process Diagram Template for PowerPoint & Google Slides
Process
Five Up Arrow Infographic Diagram Template for PowerPoint & Google Slides
Arrow
3D Sphere Arrow Process Diagram template for PowerPoint & Google Slides
Arrow
Four Swoosh Arrow Infographics template for PowerPoint & Google Slides
Arrow

Arrow Step Infographics Workflow Template for PowerPoint & Google Slides
Arrow
Dynamic Arrow Process Template for PowerPoint & Google Slides
Process
Two Directional Arrow Infographic Template for PowerPoint & Google Slides
Arrow
Eight-Segment 3D Arrow Infographics Template for PowerPoint & Google Slides
Arrow
3D Four-Directional Arrow Infographics Template for PowerPoint & Google Slides
Arrow
Five-Stage Arrow Infographics Timeline Template for PowerPoint & Google Slides
Arrow
Improvement Growth Arrow Metaphor Template for PowerPoint & Google Slides
Bar/Column
Five-Stage Circle Arrow Diagram Template for PowerPoint & Google Slides
Circular
Timeline Arrow Infographics Diagram Template for PowerPoint & Google Slides
Timeline
Seven-Segment Circular Arrow Diagram Template for PowerPoint & Google Slides
Arrow
Six-Process Circular Arrow Diagram Template for PowerPoint & Google Slides
Circular
8 Steps Arrow Process Diagram template for PowerPoint & Google Slides
Process
Four-Section Arrow Infographic Diagram Template for PowerPoint & Google Slides
Arrow

Four-Staged Business Arrow Diagram Template for PowerPoint & Google Slides
Process
Eight Post-It Note Arrow Infographic Template for PowerPoint & Google Slides
Arrow
Five-Stage Cyclic Process Arrow Diagram Template for PowerPoint & Google Slides
Process
Dynamic Growth Arrow Step Infographic Template for PowerPoint & Google Slides
Process
Six-Stage Arrow Timeline Diagram Template for PowerPoint & Google Slides
Timeline
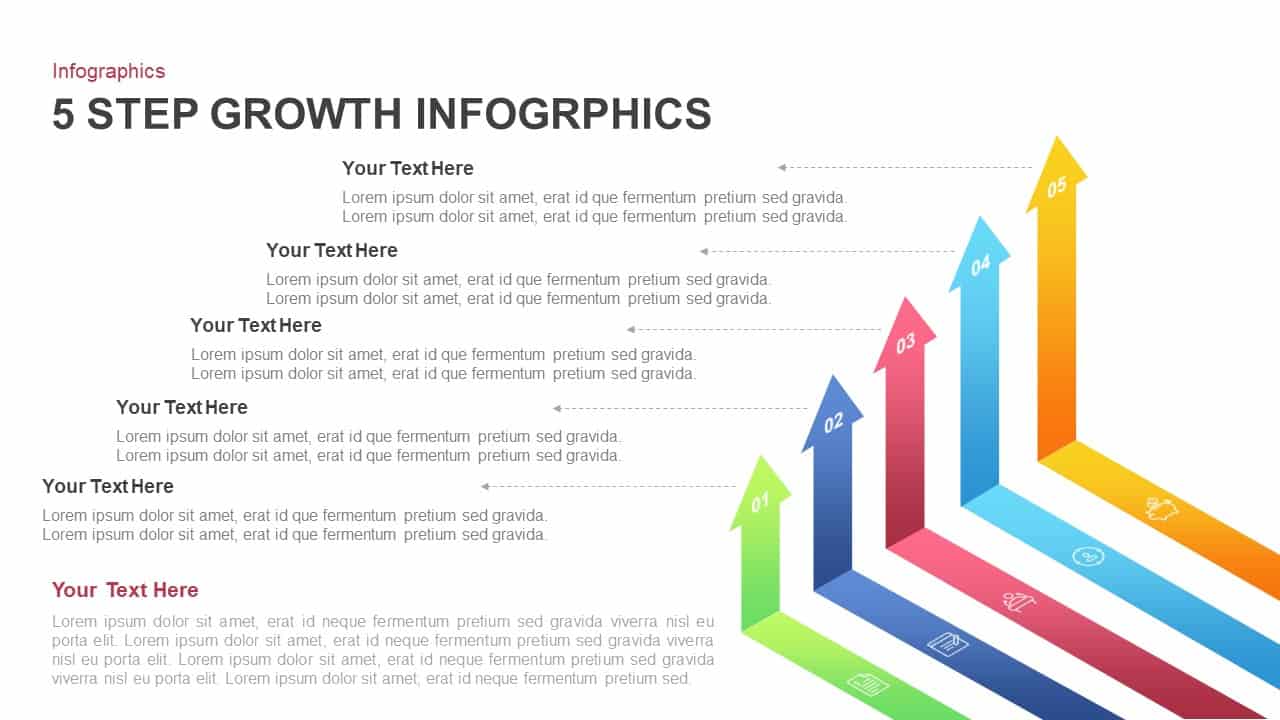
5-Step Growth Arrow Infographics Template for PowerPoint & Google Slides
Arrow
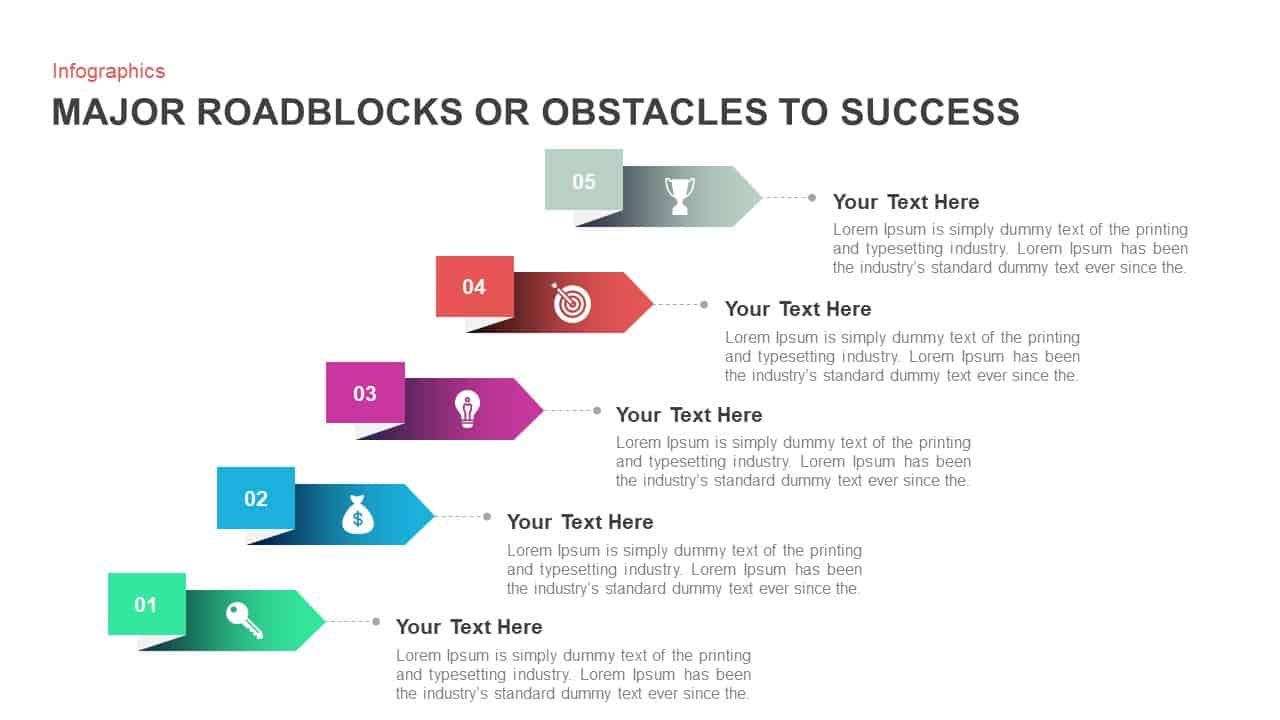
Major Roadblocks to Success Arrow Template for PowerPoint & Google Slides
Arrow
Agile Work Streams Arrow Diagram Template for PowerPoint & Google Slides
Process
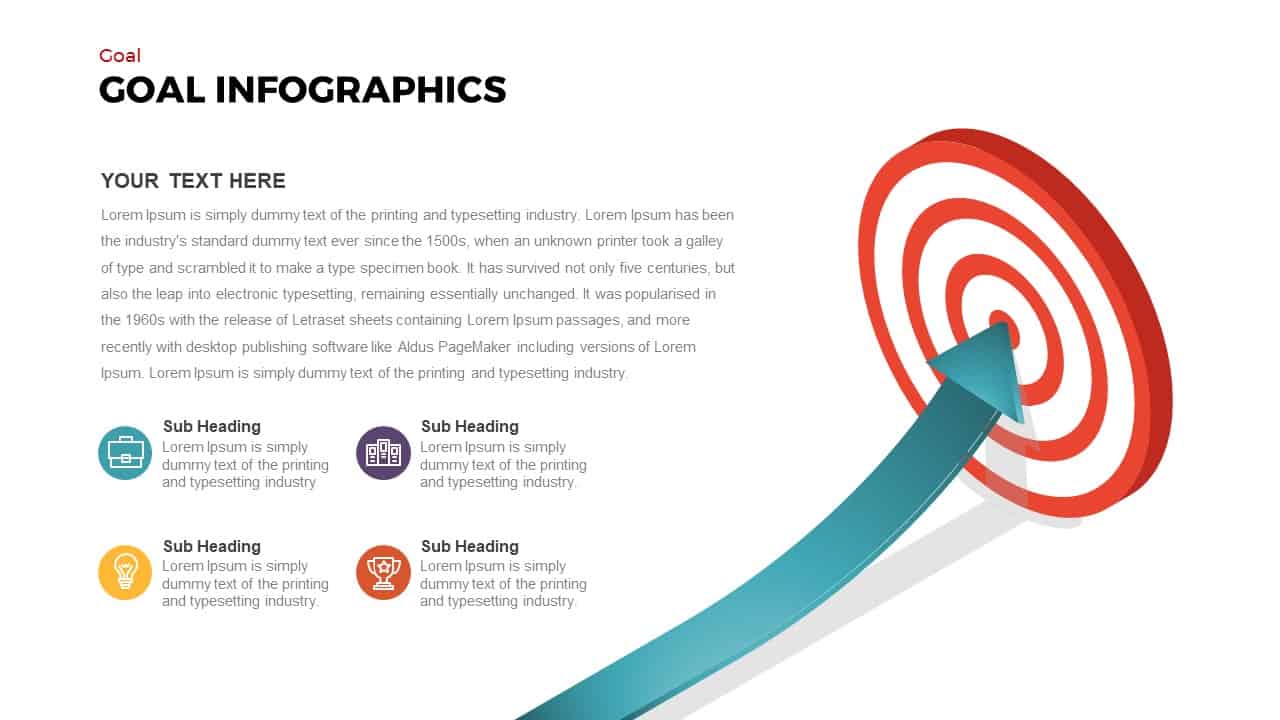
Goal Arrow and Target Infographic Template for PowerPoint & Google Slides
Goals
Dual-Stage Circular Arrow Cycle Template for PowerPoint & Google Slides
Process
Three-Segment Circular Arrow Cycle Template for PowerPoint & Google Slides
Circular
Four-Stage Circle Arrow Infographic Template for PowerPoint & Google Slides
Circular
Six-Segment Circular Arrow Infographic Template for PowerPoint & Google Slides
Circular
Circular Arrow Process Diagram Template for PowerPoint & Google Slides
Circular
Colorful Arrow Methodology Steps Template for PowerPoint & Google Slides
Process
Pentagon Arrow Process Diagram Template for PowerPoint & Google Slides
Process
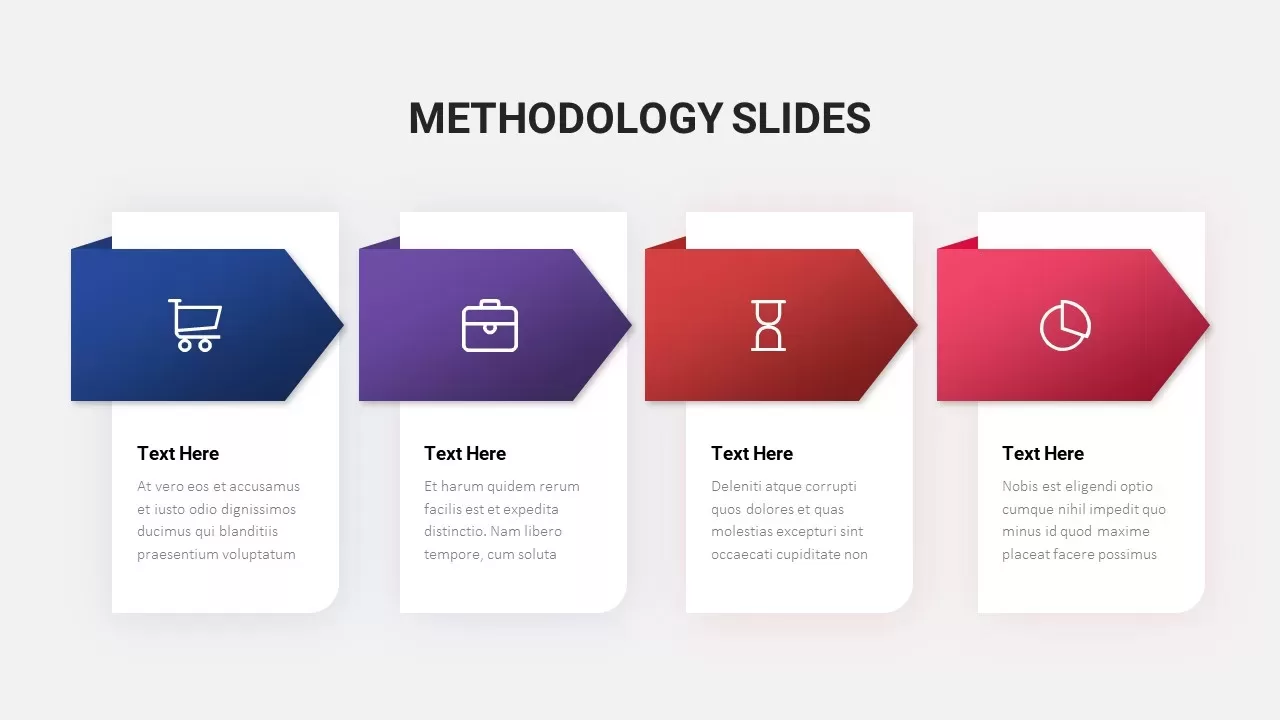
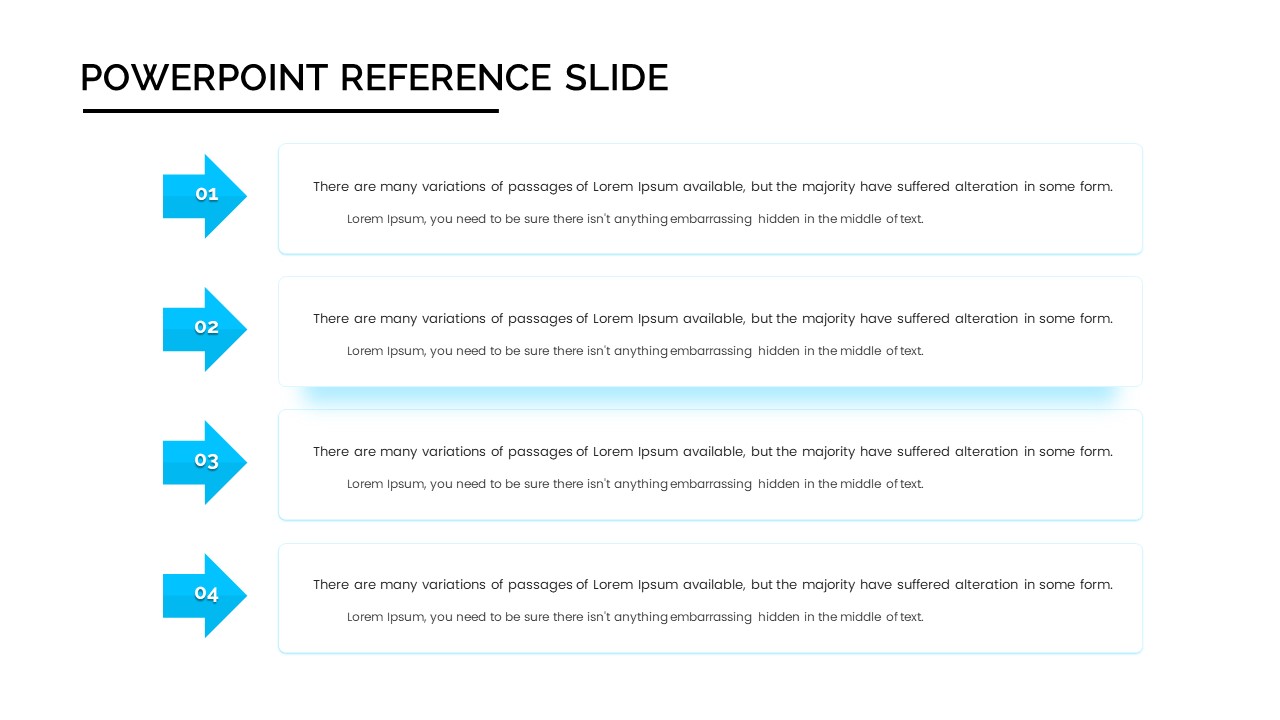
Four-Step Arrow Reference Diagram Slide Template for PowerPoint & Google Slides
Arrow
Bow and Arrow Goal Infographic Slide Template for PowerPoint & Google Slides
Goals
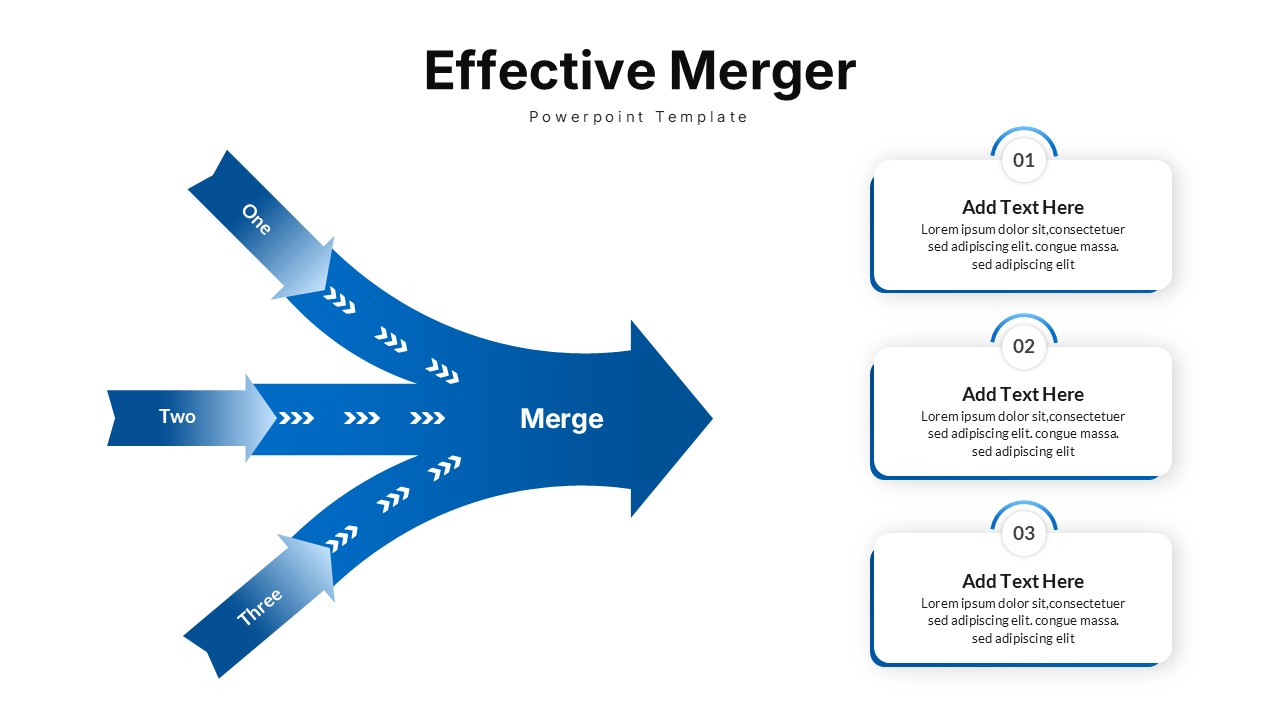
Effective Merger Arrow Diagram Template for PowerPoint & Google Slides
Arrow