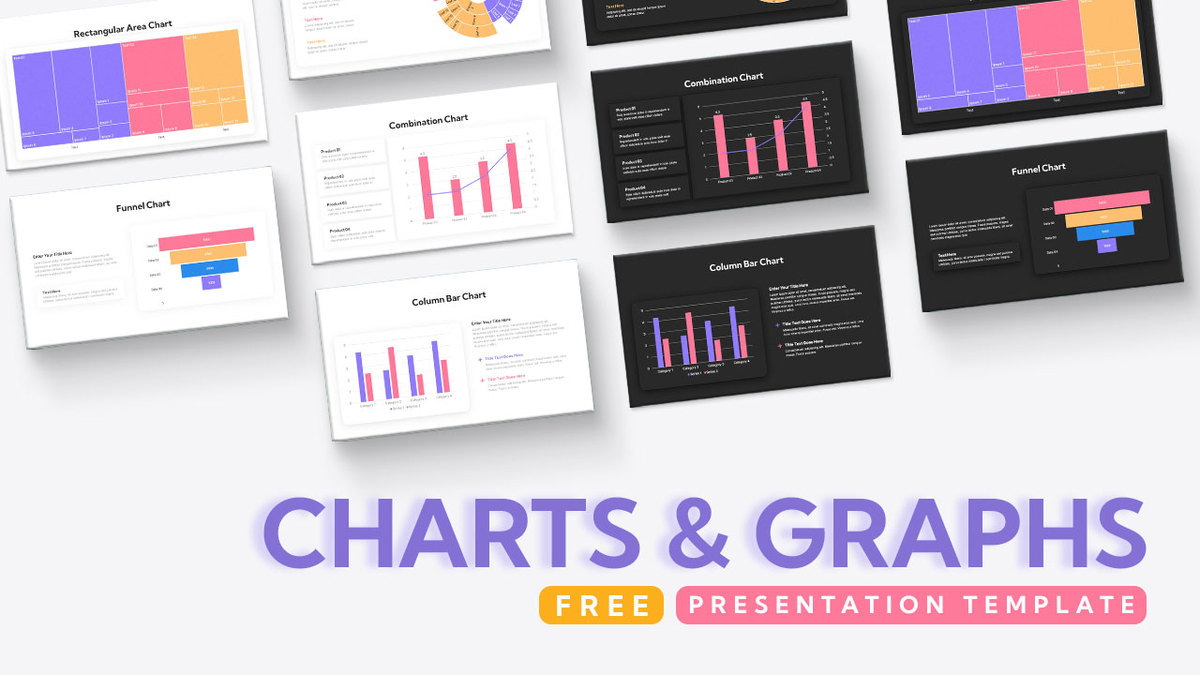
Free Charts & Graphs Presentation Deck Template for PowerPoint & Google Slides


Description
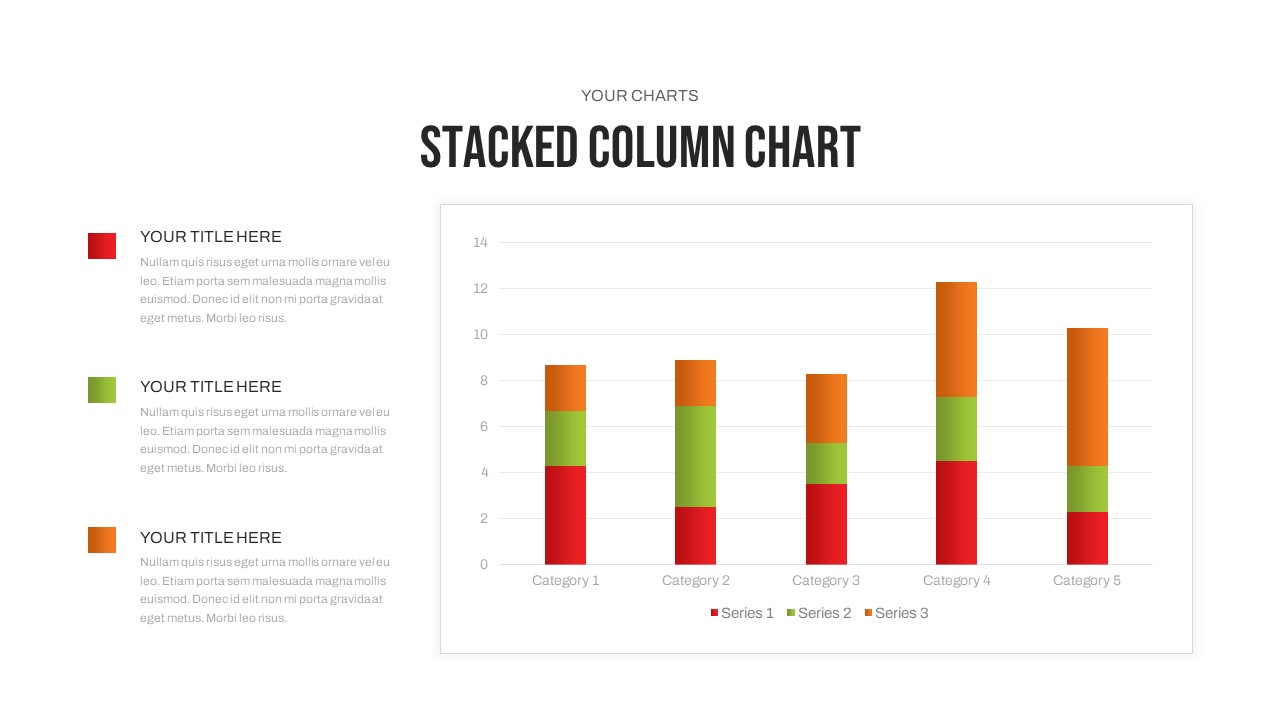
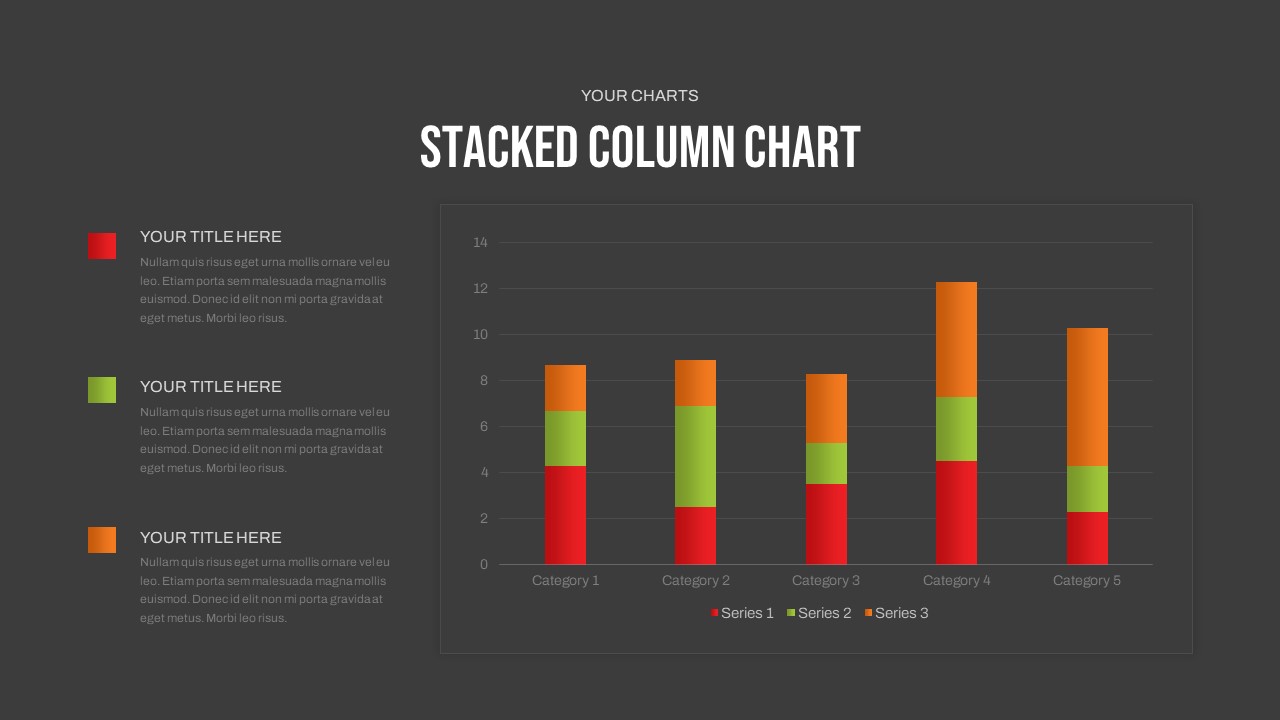
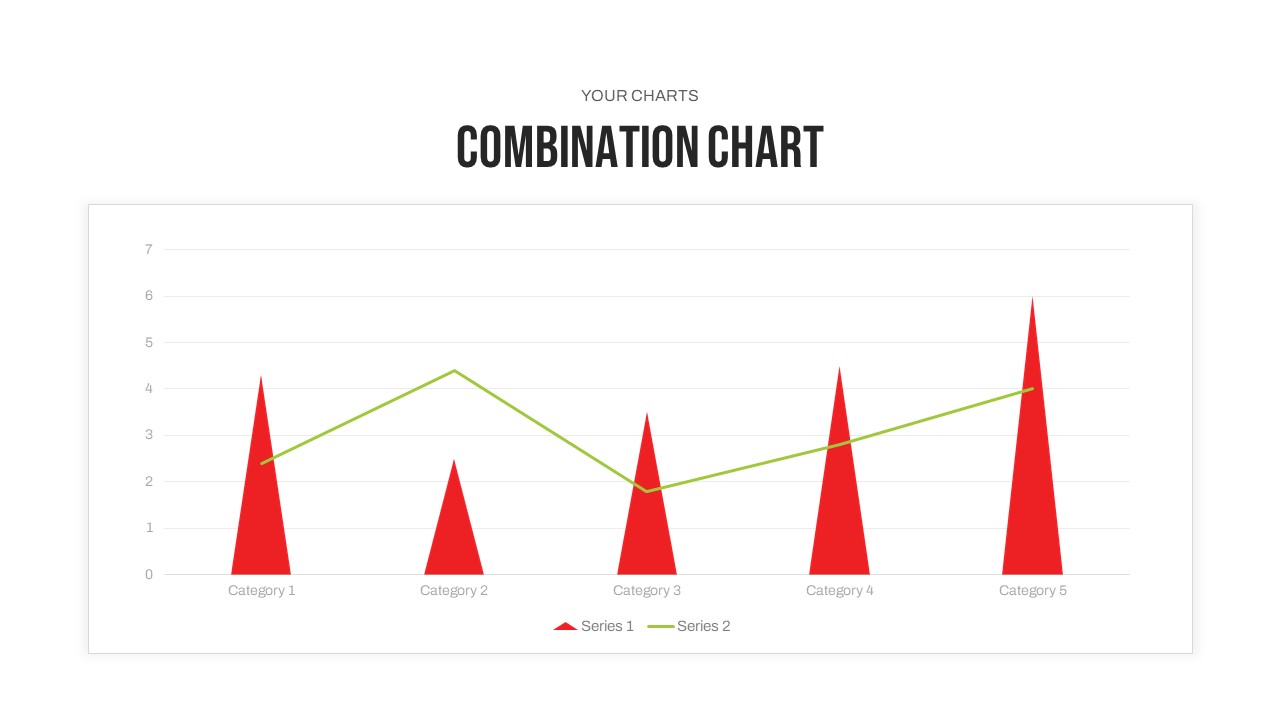
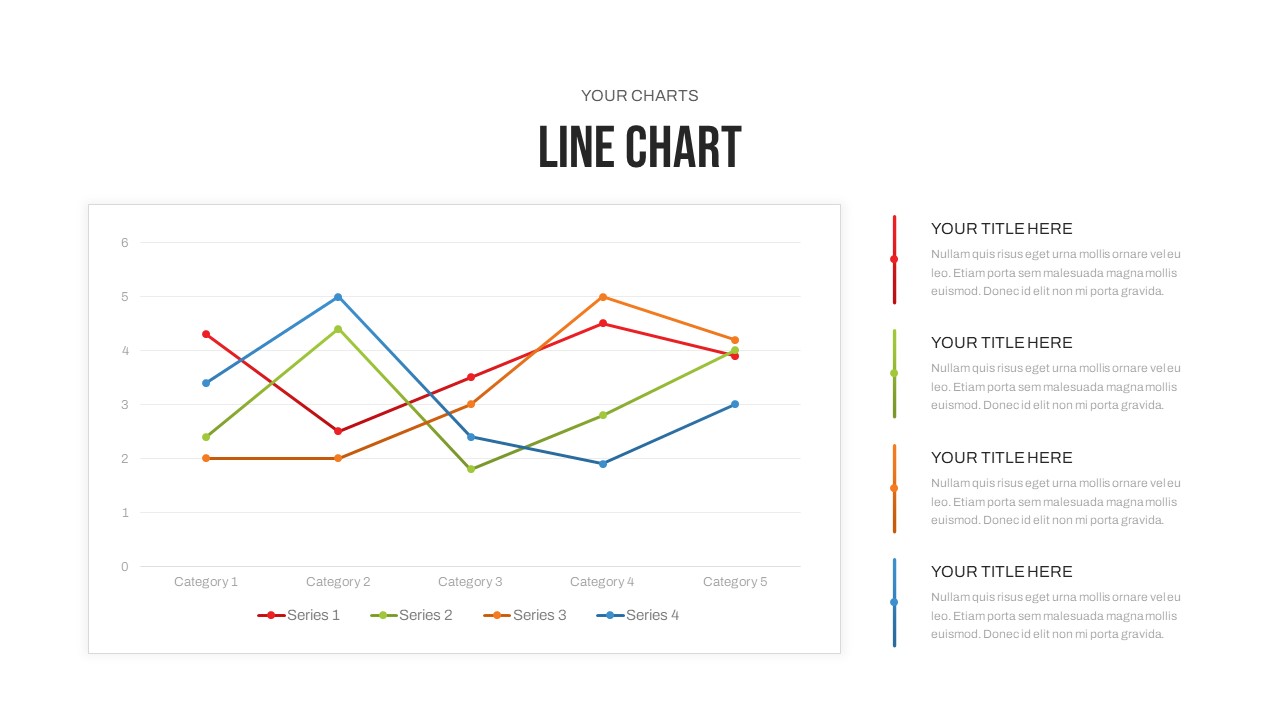
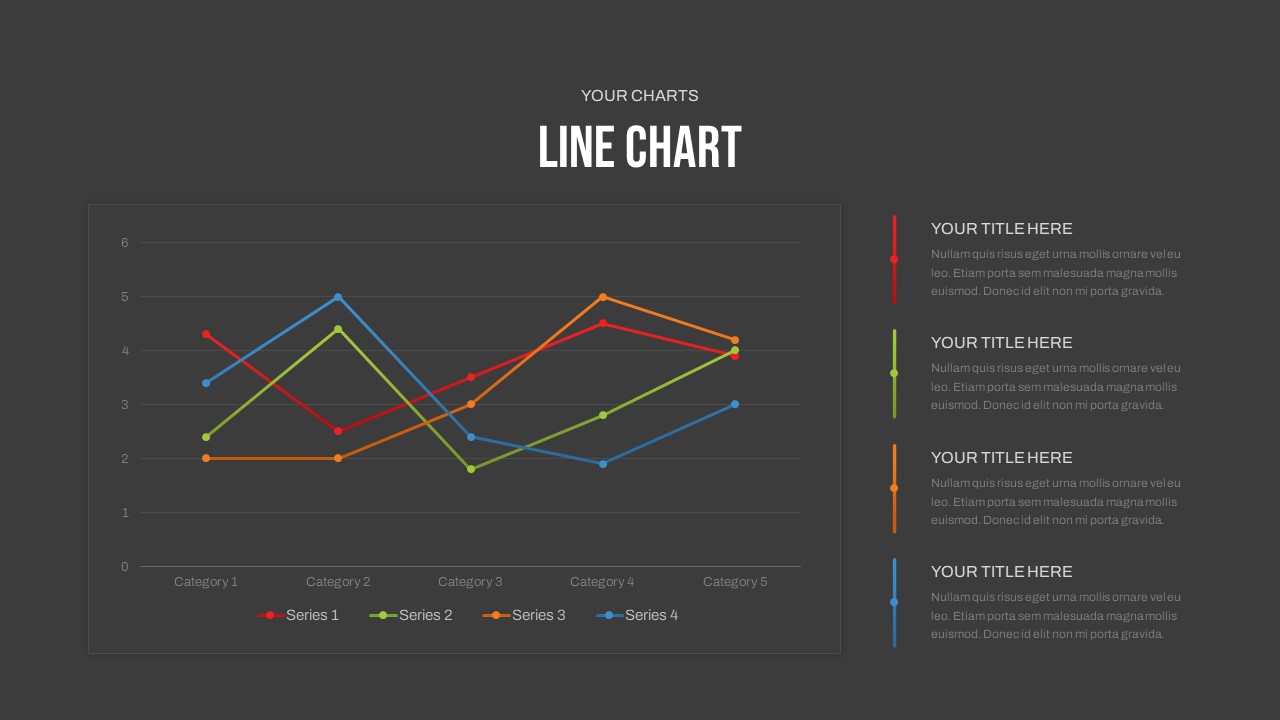
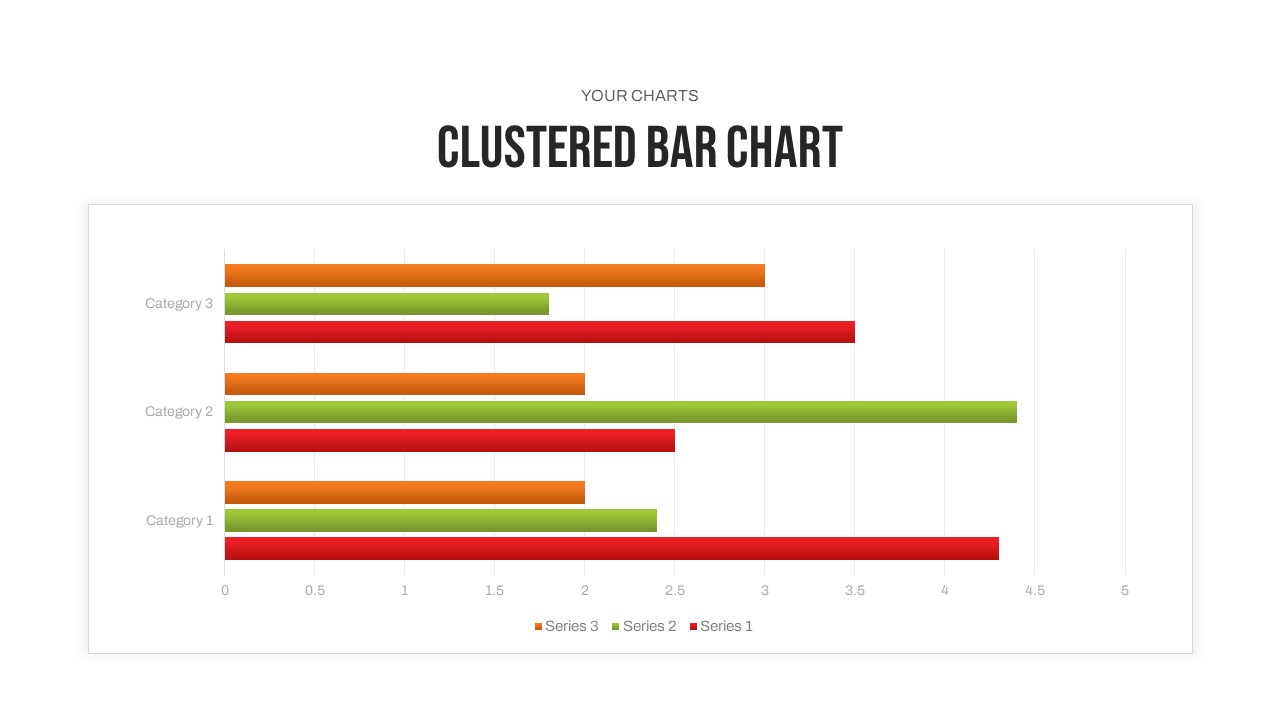
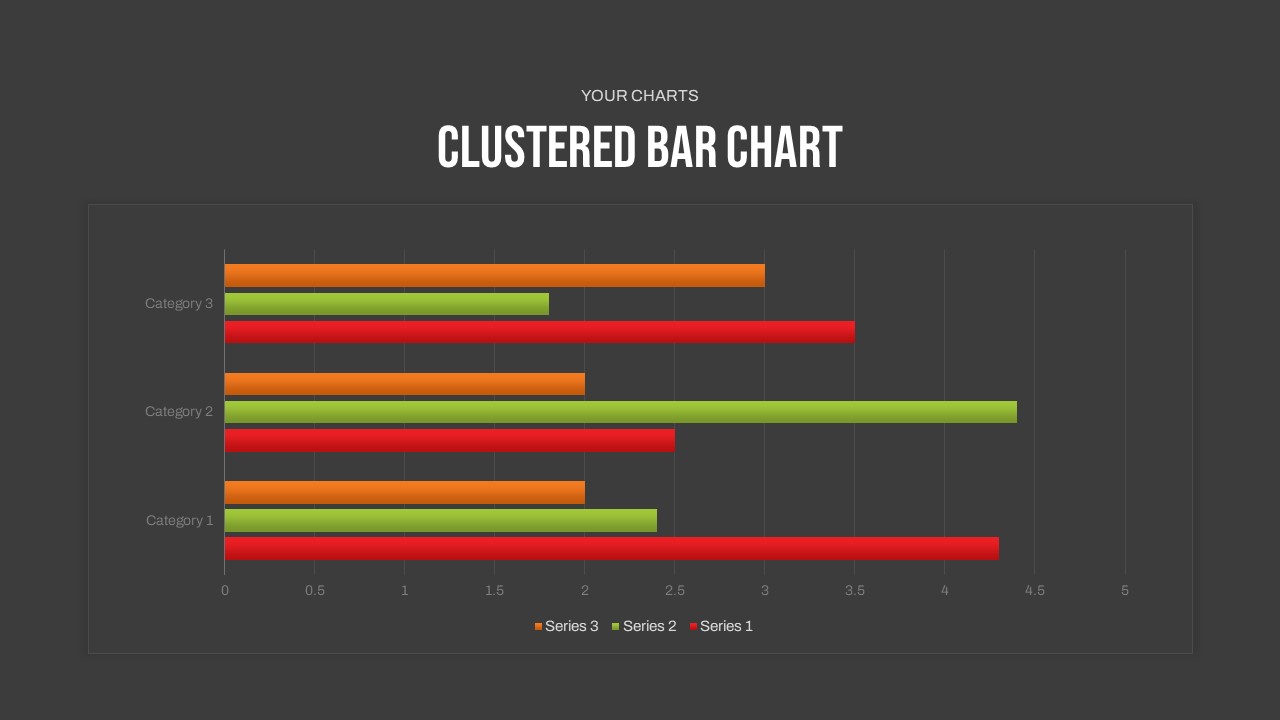
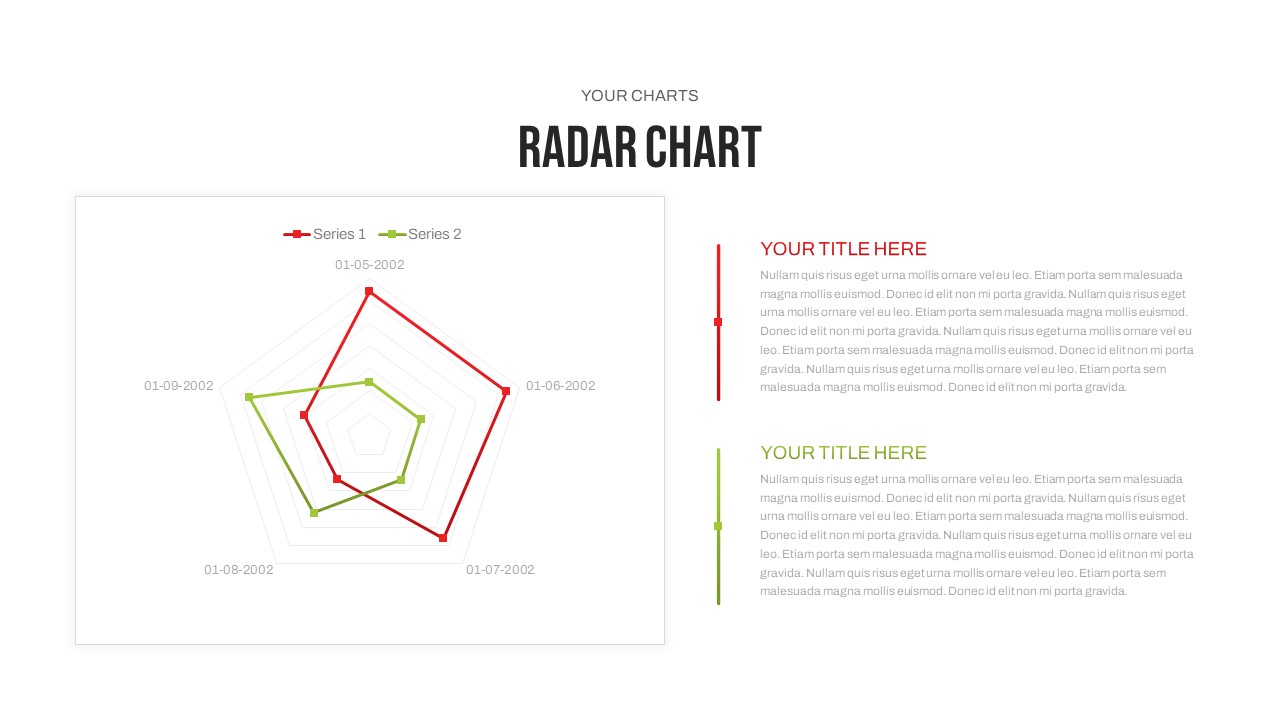
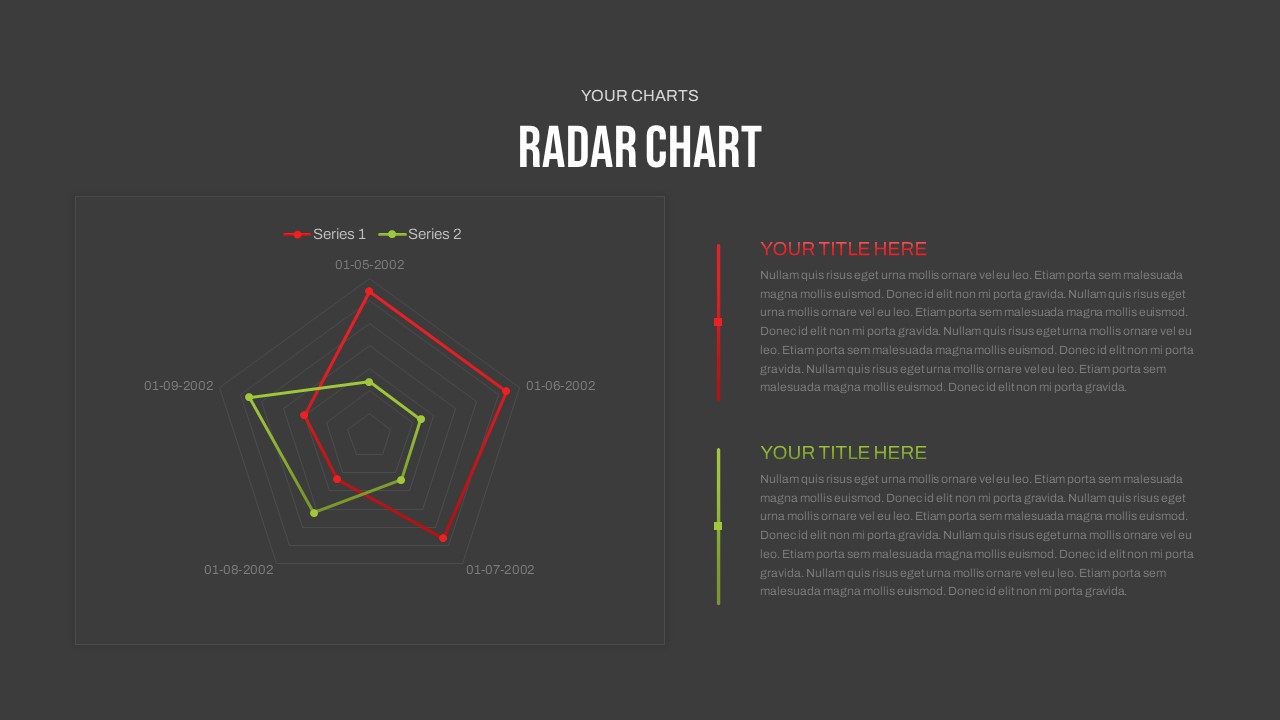
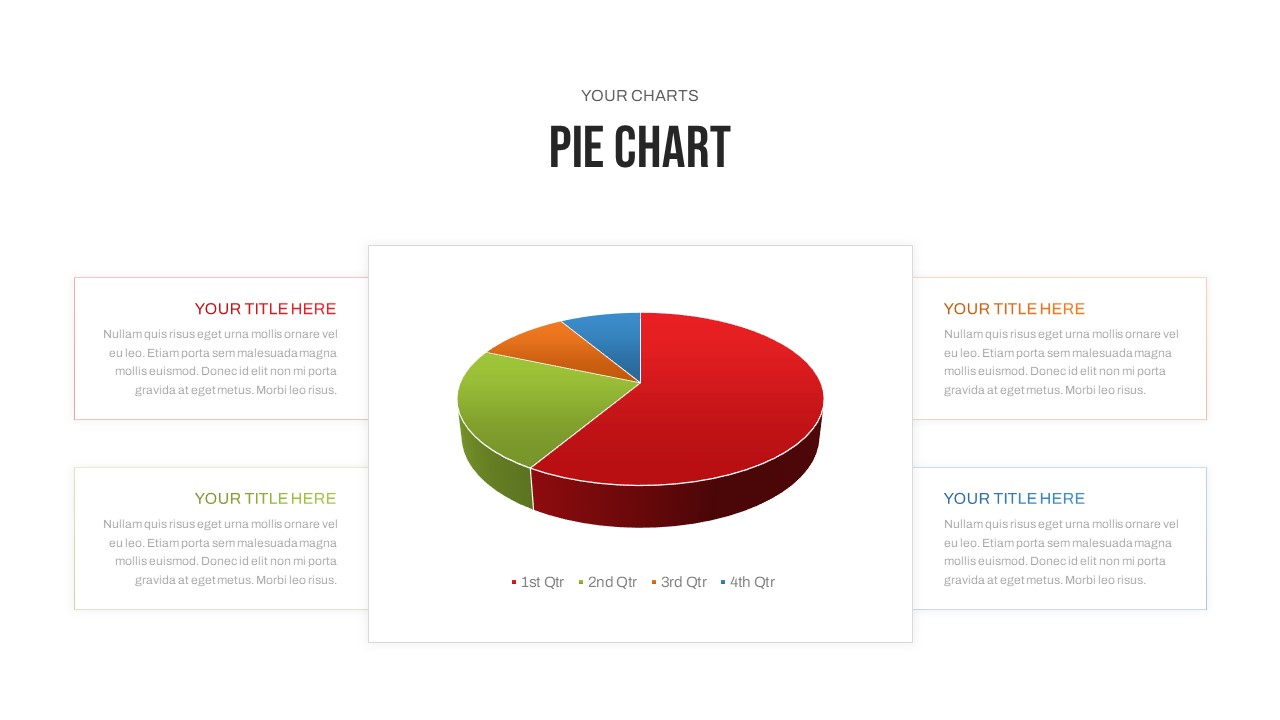
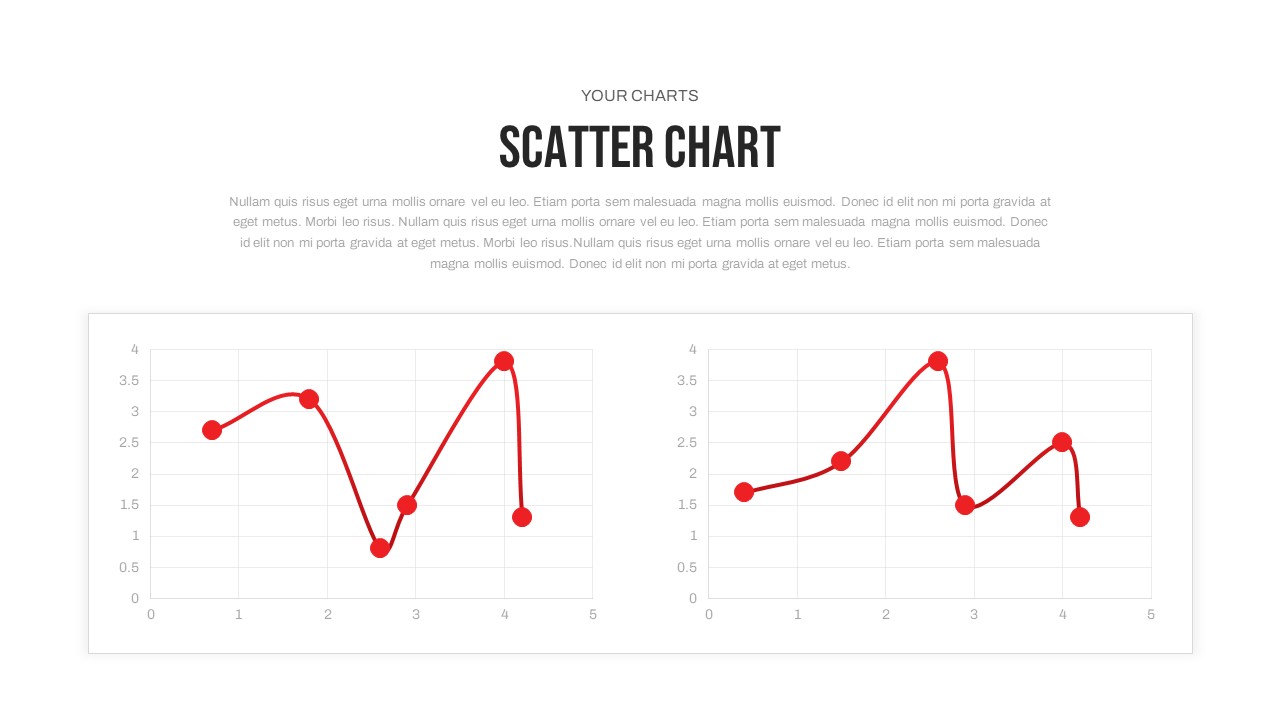
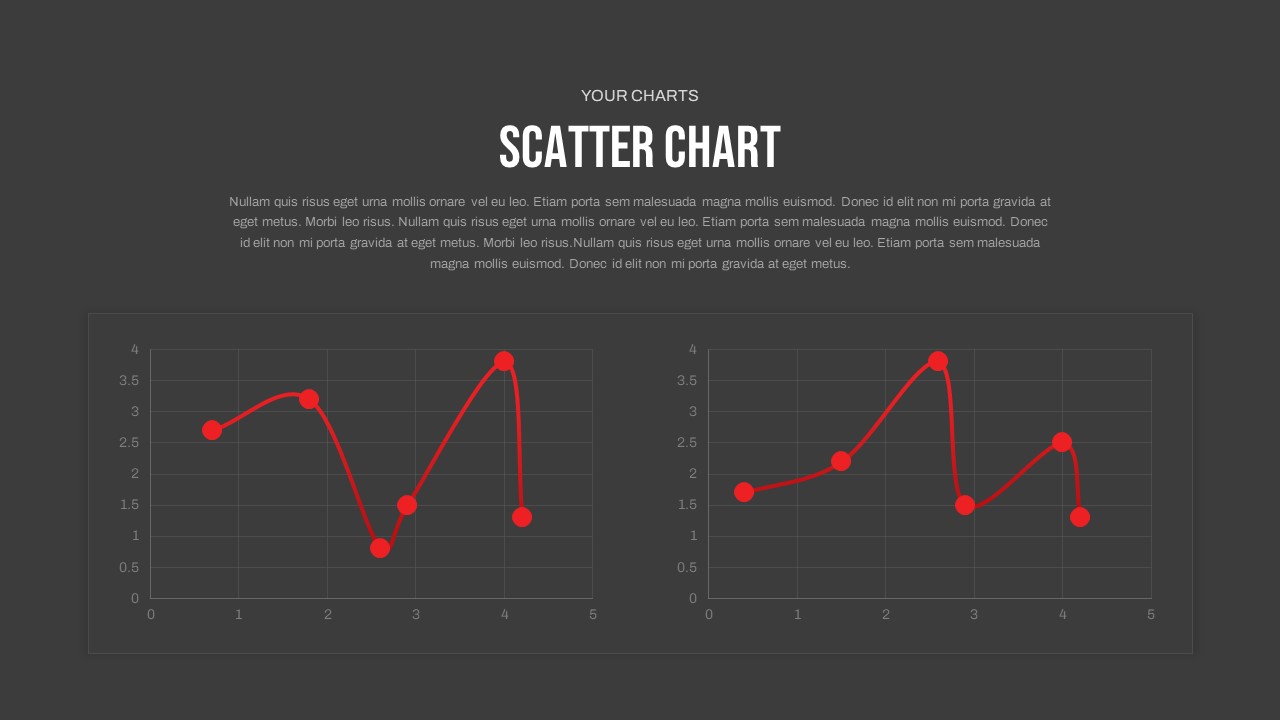
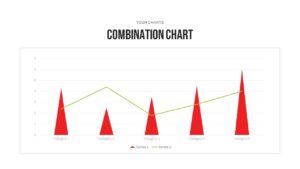
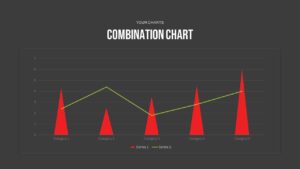
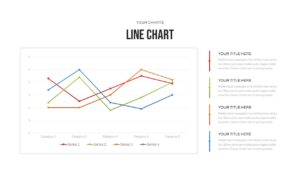
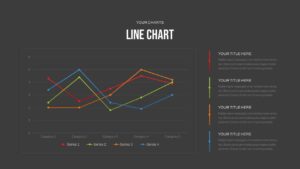
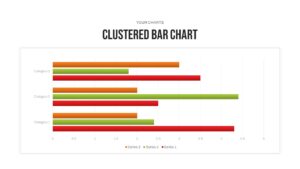
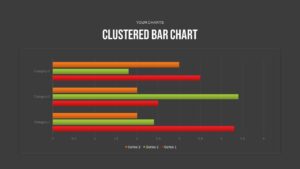
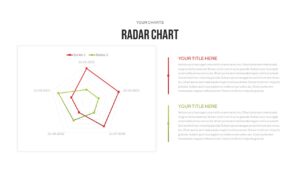
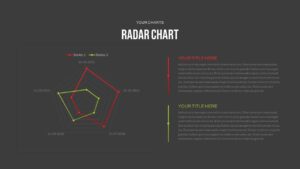
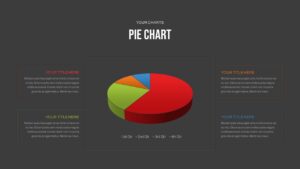
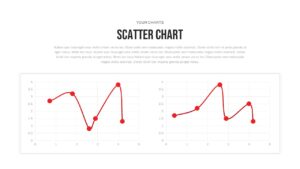
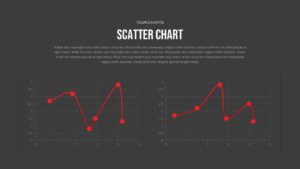
Leverage this comprehensive 15-slide charts & graphs deck to present your data with precision, visual impact, and brand consistency. This free resource includes professionally designed slide layouts for scatter charts, combination charts (line and area overlay), radar & spider charts, pie & donut charts, stacked column charts, clustered bar charts, and line charts—each with editable data tables, vector shapes, legends, and axis labels. Both light and dark background variants ensure seamless integration with corporate branding or themed presentations. Built on master slides with drag-and-drop chart placeholders, the deck supports instant resizing, color-palette swaps, and typography adjustments without disrupting alignment or formatting. Custom legends, data labels, and gridlines can be toggled on or off, enabling you to highlight key metrics or trends. Slide notes offer step-by-step guidance for importing spreadsheet data and fine-tuning styles, while auto-snap alignment guides guarantee polished layouts. Designed for peak compatibility, the deck maintains full resolution across PowerPoint and Google Slides, preserves animations and dynamic data links, and supports collaborative editing in real time. Whether you’re preparing quarterly business reviews, investor presentations, marketing performance dashboards, or academic research summaries, this versatile set simplifies data storytelling. Simply paste your numbers into the built-in editor, apply your color scheme, and reinforce insights with icons and KPI callouts. With this charts & graphs pack, you’ll deliver engaging visuals and actionable insights with maximum efficiency.
Who is it for
Business analysts, marketing directors, financial planners, and academic presenters will benefit from this deck when visualizing complex datasets and trends. Startup founders, project managers, and educators can also leverage the slides to communicate performance metrics, share market research, or illustrate survey findings.
Other Uses
Beyond corporate reporting, repurpose these slides for sales pipelines, social media analytics, customer satisfaction ratings, product comparisons, budget forecasts, or workshop exercises. Adapt the templates for training materials, strategic planning sessions, or client-facing proposals to ensure every data point resonates.
Login to download this file

Item ID
SB03931
Related Templates

Free Comprehensive Charts & Graphs Template for PowerPoint & Google Slides
Charts
Free

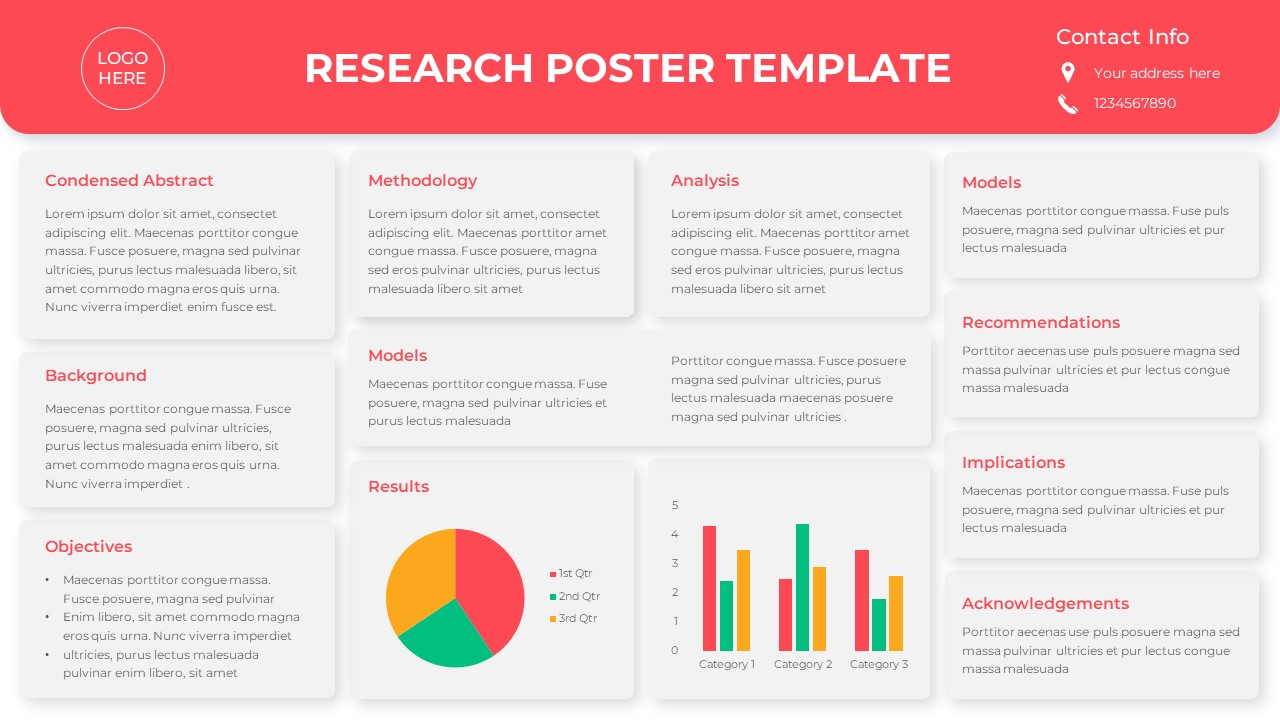
Free Research Poster with Charts Template for PowerPoint & Google Slides
Pie/Donut
Free
Social Media Market Share Pie Charts Template for PowerPoint & Google Slides
Pie/Donut
Dynamic Statistics & Progress Charts Template for PowerPoint & Google Slides
Pie/Donut
Project Progress Dashboard Pie Charts Template for PowerPoint & Google Slides
Project
Budget Forecast Dashboard & Donut Charts Template for PowerPoint & Google Slides
Pie/Donut

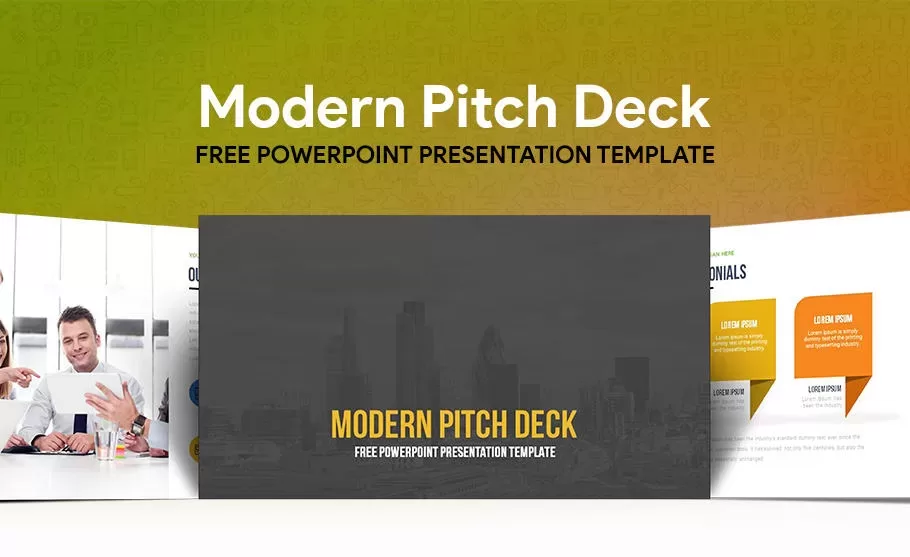
Free Modern Pitch Deck Presentation Template for PowerPoint & Google Slides
Pitch Deck
Free
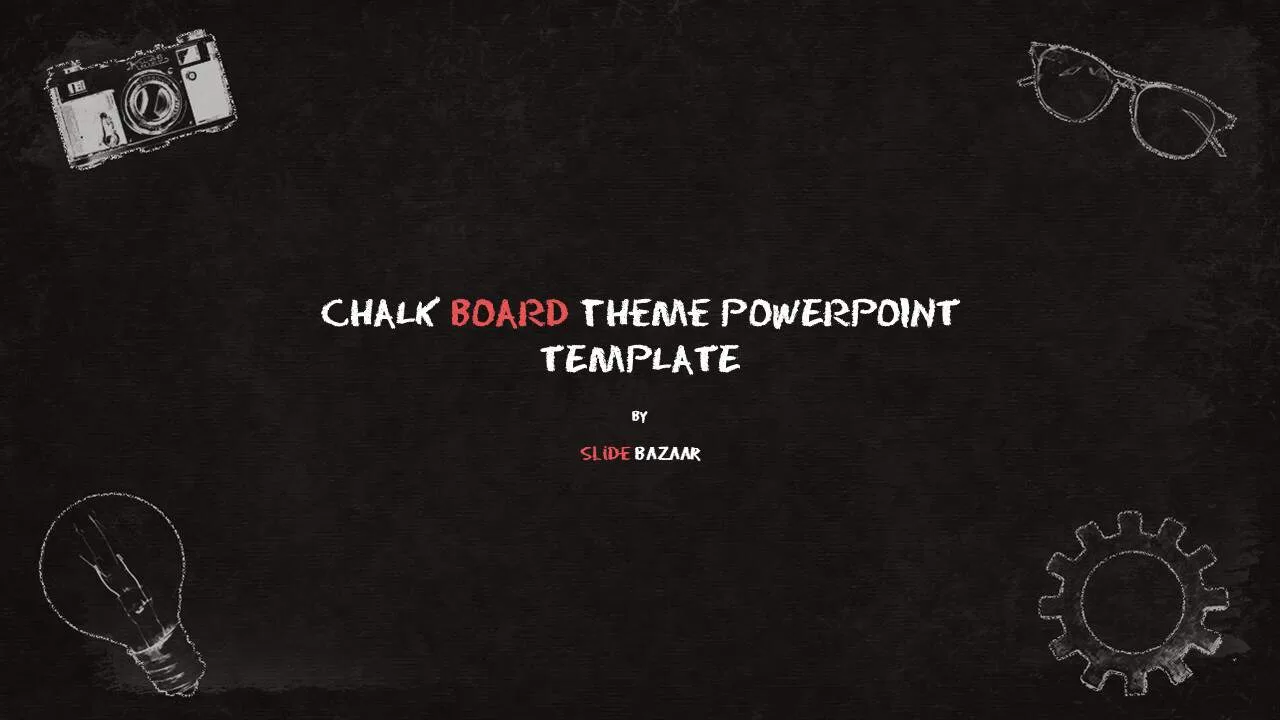
Free Chalkboard Theme Presentation Deck Template for PowerPoint & Google Slides
Pitch Deck
Free

Free Luxury Brand Presentation and Pitch Deck Template for PowerPoint & Google Slides
Company Profile
Free
Free Book Presentation Deck Template for PowerPoint & Google Slides
Decks
Free
Free Community Service Presentation Deck Template for PowerPoint & Google Slides
Company Profile
Free
Free Modern Dark Pitch Deck Presentation Template for PowerPoint & Google Slides
Pitch Deck
Free
Free Research Presentation Slide Deck Template for PowerPoint & Google Slides
Decks
Free
Free Corporate Presentation Cover Page Deck Template for PowerPoint & Google Slides
Free
Free
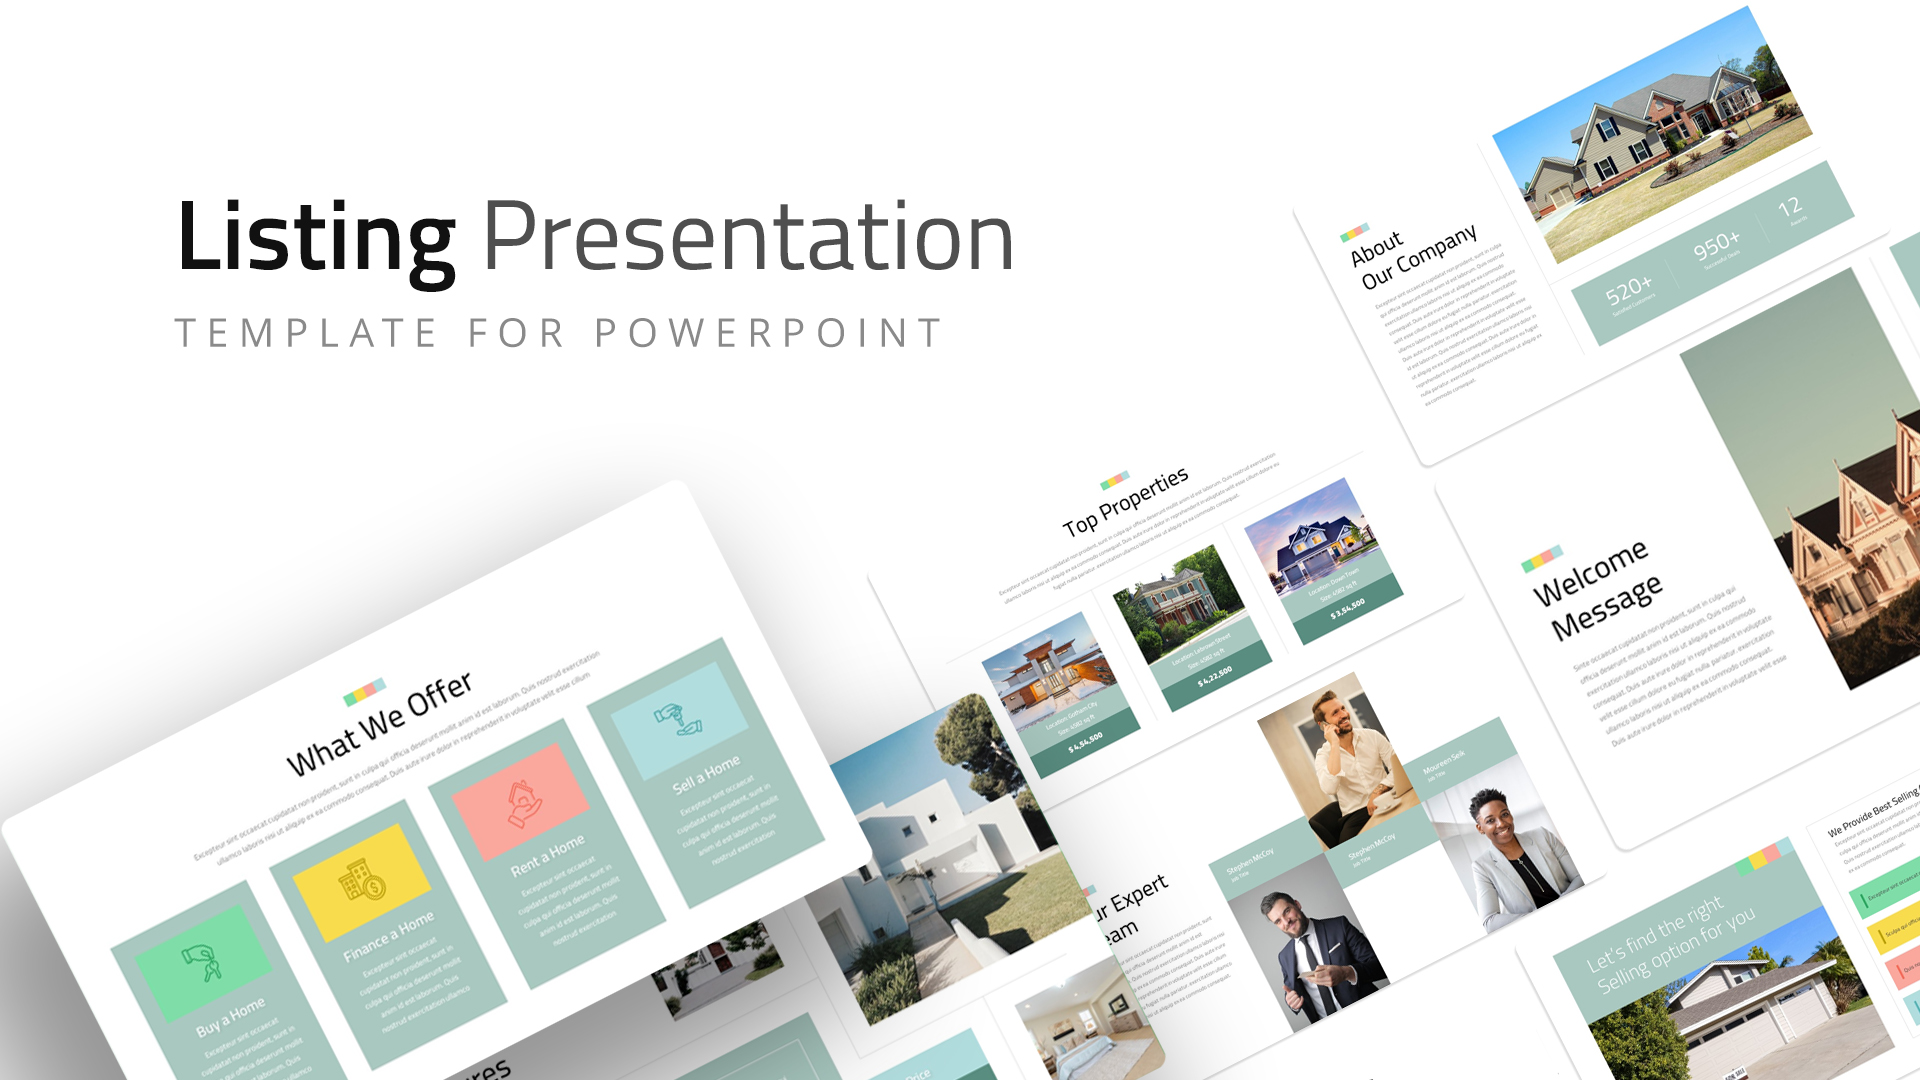
Free Real Estate Listing Presentation Deck Template for PowerPoint & Google Slides
Pitch Deck
Free
Free Bauhaus Art-Inspired Presentation Deck for PowerPoint & Google Slides
Company Profile
Free
Free Modern Corporate Green Presentation Slide Deck for PowerPoint & Google Slides
Company Profile
Free
Free Medical Presentation Deck for PowerPoint & Google Slides
Medical
Free
Free World Health Organization Presentation Deck for PowerPoint & Google Slides
Decks
Free
Free Solar System Morph Presentation Deck for PowerPoint & Google Slides
Decks
Free
Free Infographic Deck PowerPoint Pack for PowerPoint & Google Slides
Infographics
Free

Ultimate Free Company Profile Pitch Deck Template for PowerPoint & Google Slides
Company Profile
Free

Free Business Proposal Pitch Deck Template for PowerPoint & Google Slides
Pitch Deck
Free
Free Fundraising Pitch Deck Timeline Template for PowerPoint & Google Slides
Pitch Deck
Free
Free Corporate Design Deck Template for PowerPoint & Google Slides
Company Profile
Free
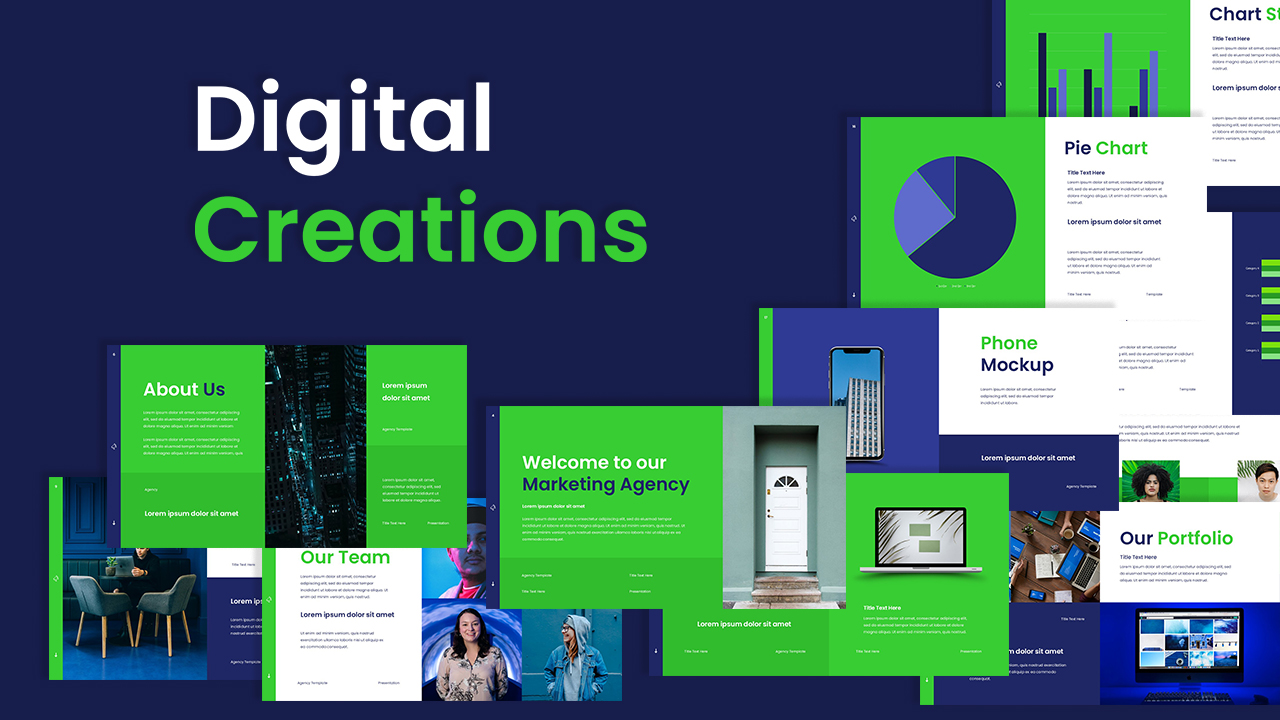
Free Marketing Agency Deck Template for PowerPoint & Google Slides
Pitch Deck
Free
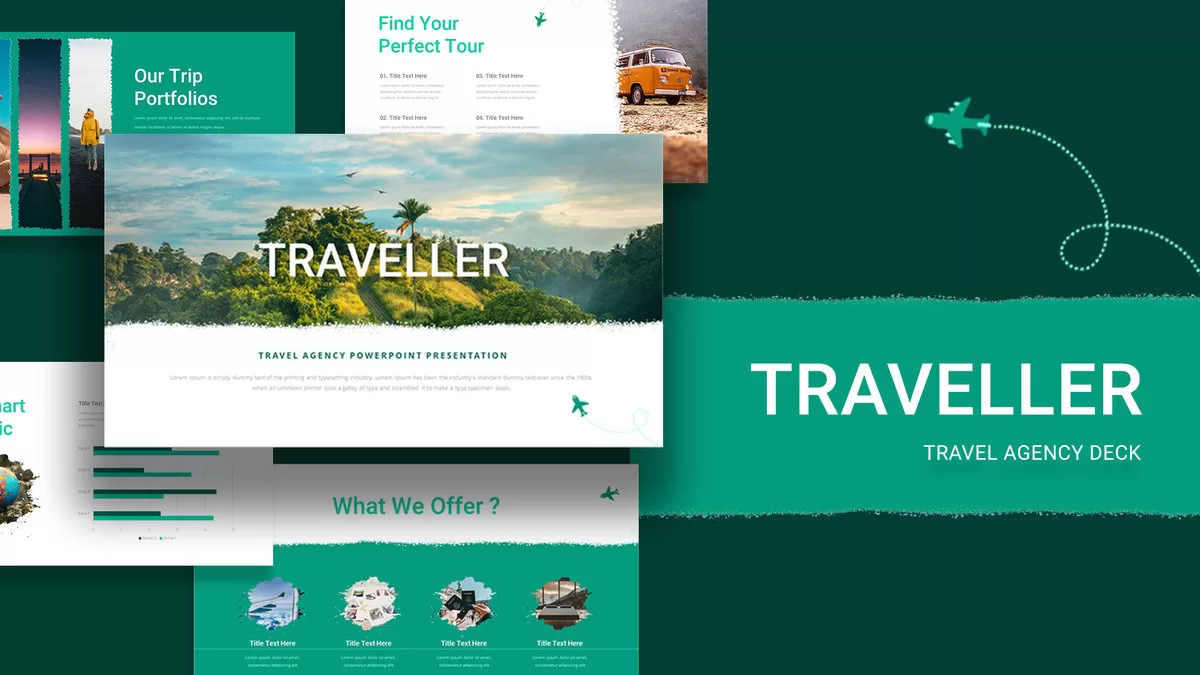
Free Traveller Travel Agency Deck template for PowerPoint & Google Slides
Company Profile
Free
Free Video Game Deck Template for PowerPoint & Google Slides
Advertising
Free
Free Business Deck with Device Mockups Template for PowerPoint & Google Slides
Company Profile
Free
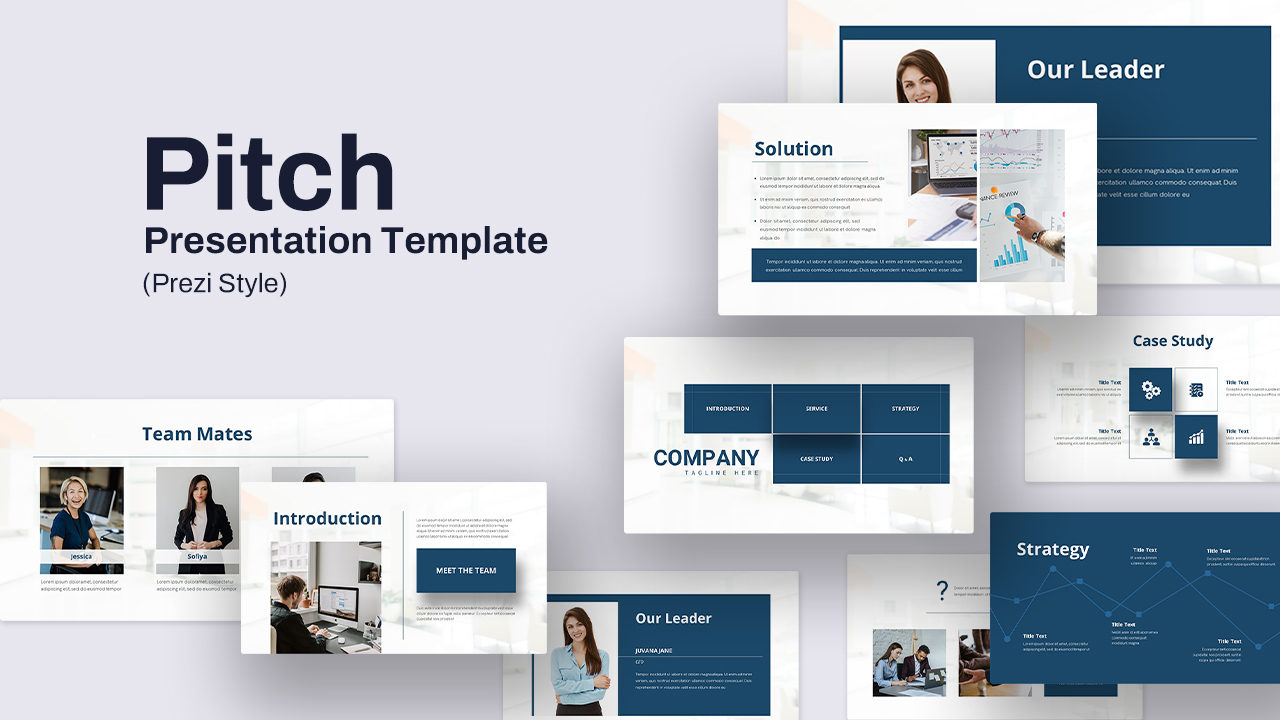
Free Prezi-Style Pitch Deck Template for PowerPoint & Google Slides
Pitch Deck
Free
Free Modern Multipurpose Pitch Deck Template for PowerPoint & Google Slides
Pitch Deck
Free
Free Simple Green Plant Company Profile Deck Template for PowerPoint & Google Slides
Company Profile
Free
Free Modern Sales Pitch Deck Template for PowerPoint & Google Slides
Pitch Deck
Free
Free Startup Pitch Deck Template for PowerPoint & Google Slides
Pitch Deck
Free Space Minimal Deck Design Template for PowerPoint & Google Slides
Company Profile
Free
Free Modern Colorful Business Plan Deck Template for PowerPoint & Google Slides
Business Plan
Free
Free Modern Blue Company Profile Deck Template for PowerPoint & Google Slides
Company Profile
Free
Free Blue Gradient Marketing Plan Slide Deck Template for PowerPoint & Google Slides
Marketing
Free
Free Modern Green Finance Slide Deck Template for PowerPoint & Google Slides
Finance
Free
Free Comprehensive Management Strategy Deck Template for PowerPoint & Google Slides
Pitch Deck
Free
Free Nonprofit Charity Social Impact Deck Template for PowerPoint & Google Slides
Pitch Deck
Free
Free Biology Theme Infographics Deck Template for PowerPoint & Google Slides
Health
Free
Free Agriculture Company Profile Pitch Deck template for PowerPoint & Google Slides
Company Profile
Free
Free Modern Dunder Mifflin Pitch Deck Template for PowerPoint & Google Slides
Pitch Deck
Free
Free Professional Event Planner Slide Deck Template for PowerPoint & Google Slides
Business
Free
Free Professional Carnival Pitch Deck Template for PowerPoint & Google Slides
Pitch Deck
Free
Free Interactive Flashcards Q&A Deck Template for PowerPoint & Google Slides
Free
Free
Free Yellow Film Reel Cinema Pitch Deck Template for PowerPoint & Google Slides
Pitch Deck
Free
Free Charity & Volunteer Program Deck Template for PowerPoint & Google Slides
Pitch Deck
Free
Free Helios Creative Business Deck for PowerPoint & Google Slides
Business
Free
Free Animated Halloween Themed Slide Deck for PowerPoint & Google Slides
Pitch Deck
Free
Free Climate Change Awareness Deck for PowerPoint & Google Slides
Decks
Free
Free Black and Gold Pitch Deck Design for PowerPoint & Google Slides
Pitch Deck
Free
Free Army Training and Discipline Deck for PowerPoint & Google Slides
Company Profile
Free
Sleek Product Launch Presentation Deck Template for PowerPoint & Google Slides
Pitch Deck

Corporate Business Presentation Deck Template for PowerPoint & Google Slides
Company Profile
Black White Pitch Deck Presentation Template for PowerPoint & Google Slides
Pitch Deck
Free Personal Profile PowerPoint Template and Slides for PowerPoint Presentation
Company Profile
Free
Travel and Tourism Presentation Deck Template for PowerPoint & Google Slides
Pitch Deck
Travel Deck Presentation template for PowerPoint & Google Slides
Pitch Deck
E-Learning Education Presentation Deck Template for PowerPoint & Google Slides
Decks
Pastel Multipurpose Presentation Deck Template for PowerPoint & Google Slides
Decks
Professional Consulting Deck Presentation Template for PowerPoint & Google Slides
Pitch Deck
Real Estate Listing Presentation Deck Template for PowerPoint & Google Slides
Company Profile
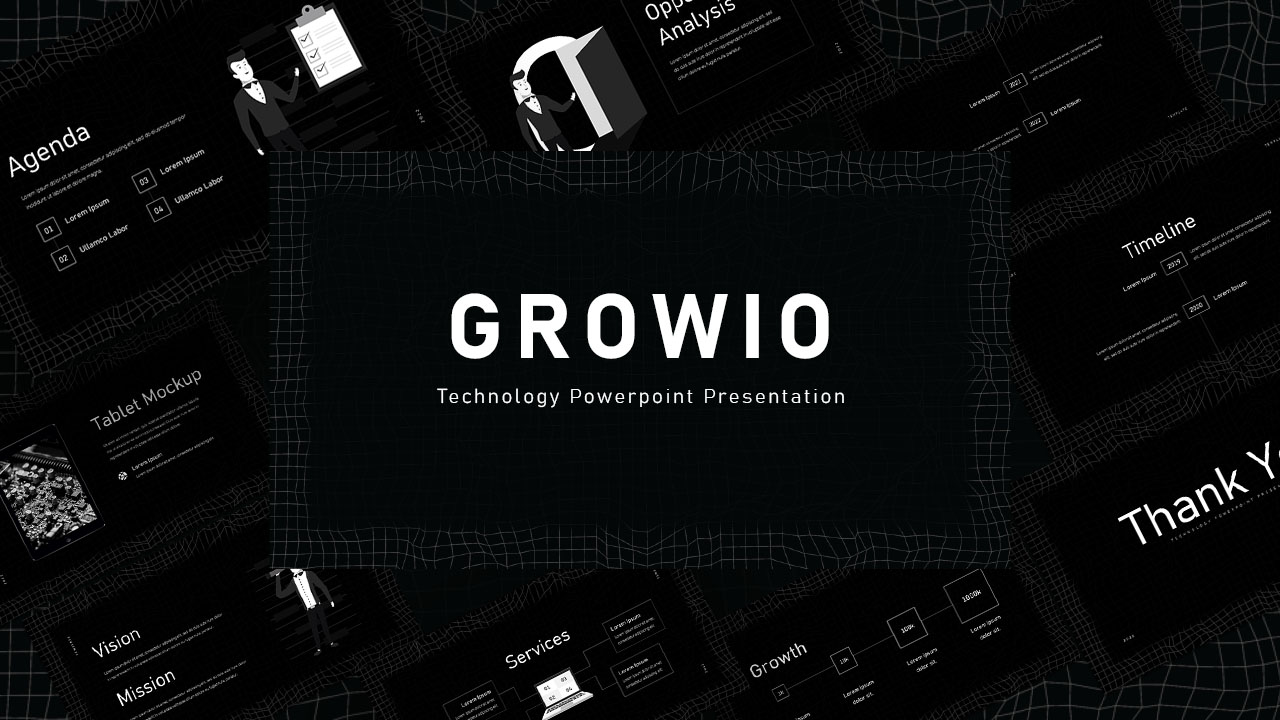
Growio Technology Presentation Deck Template for PowerPoint & Google Slides
Pitch Deck
Airline Industry Presentation Deck Template for PowerPoint & Google Slides
Company Profile
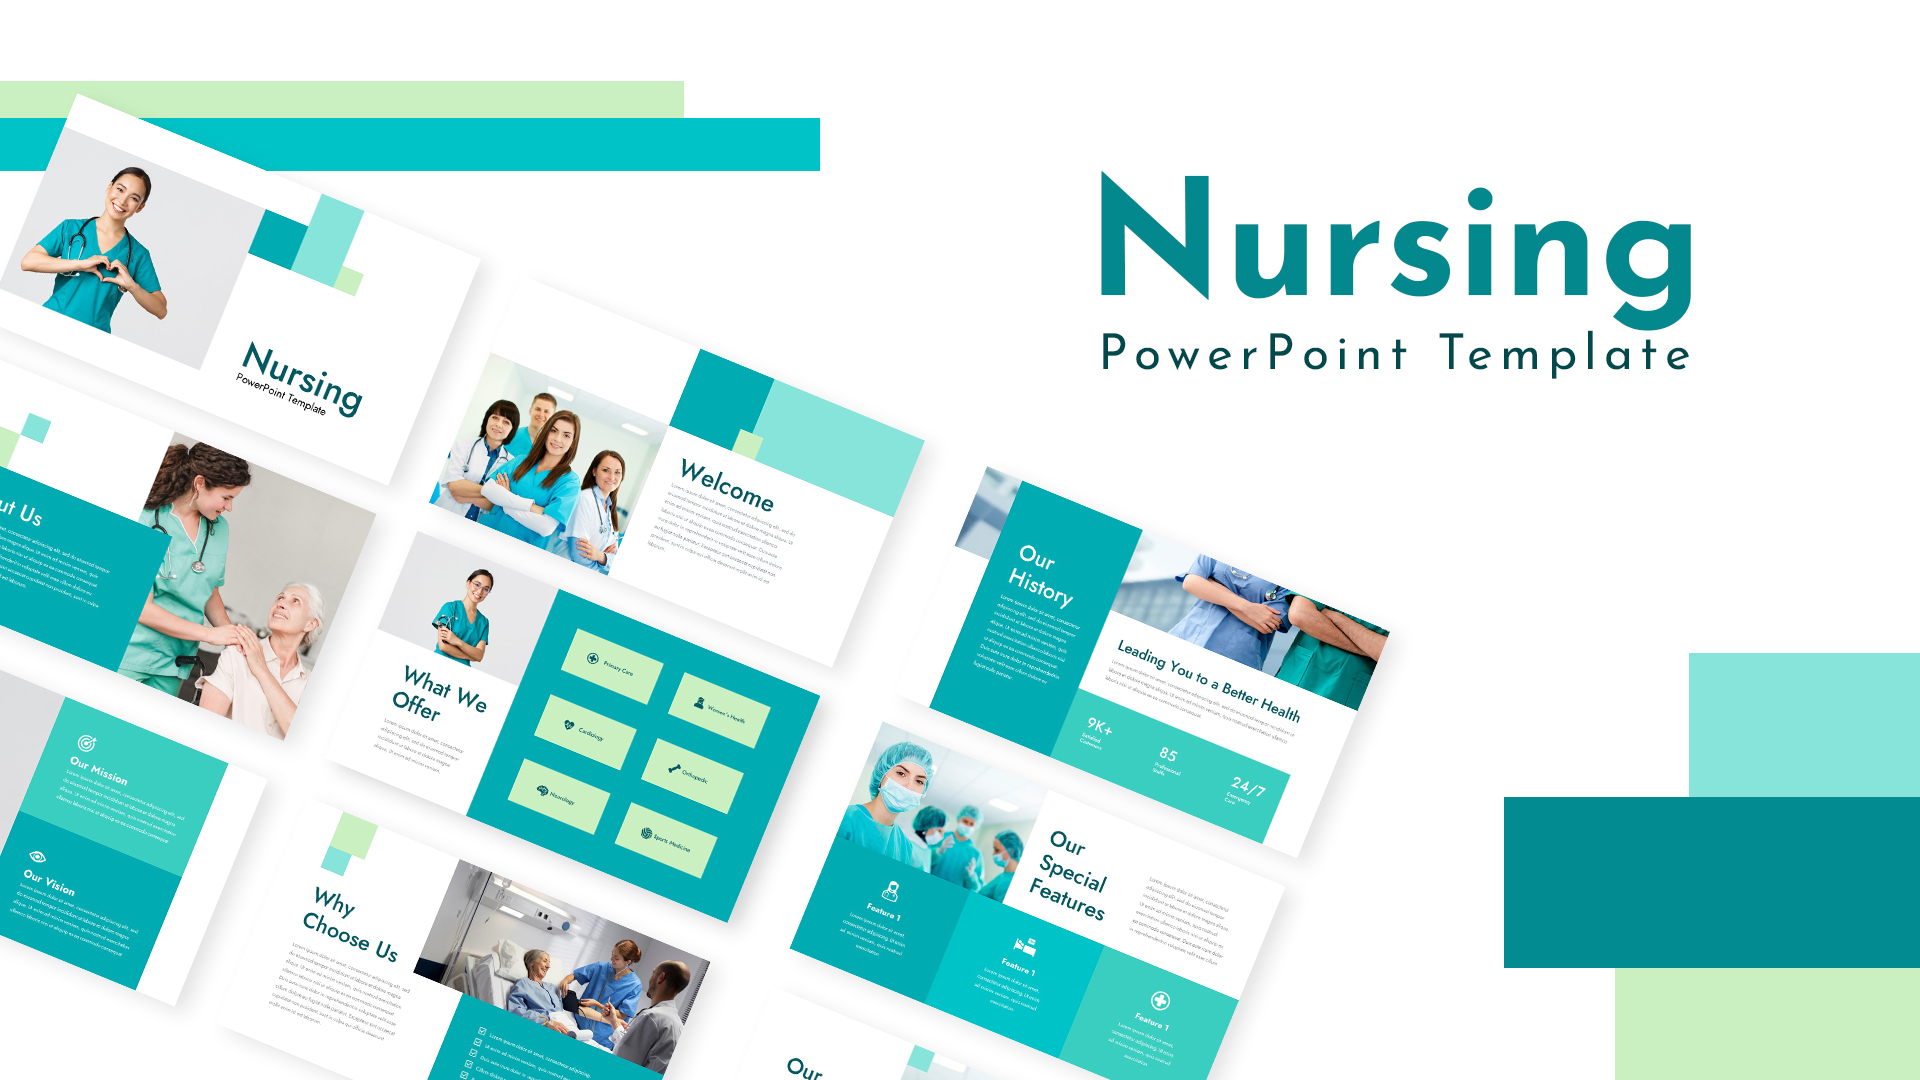
Medical Nursing Presentation Deck Template for PowerPoint & Google Slides
Nursing
Colorful Nursing Presentation Deck Template for PowerPoint & Google Slides
Nursing
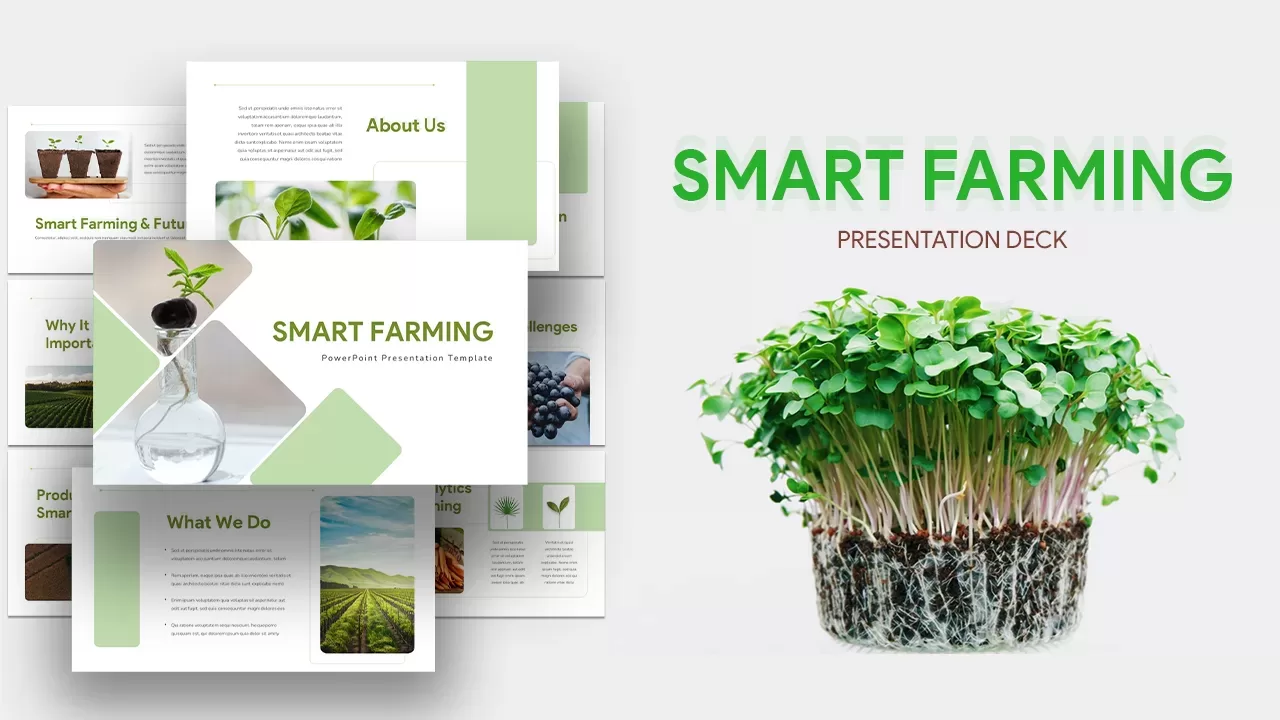
Smart Farming Presentation Deck Template for PowerPoint & Google Slides
Pitch Deck
Smartphone App Pitch Deck Presentation Template for PowerPoint & Google Slides
Pitch Deck
Health Insurance Presentation Deck Template for PowerPoint & Google Slides
Health
Professional Business Deck Presentation Template for PowerPoint & Google Slides
Company Profile
Professional Portfolio Presentation Deck Template for PowerPoint & Google Slides
Decks
Digital Notebook Presentation Deck Template for PowerPoint & Google Slides
Decks
Professional Golf Presentation Deck Template for PowerPoint & Google Slides
Graphics
Business Conference Deck Presentation Template for PowerPoint & Google Slides
Pitch Deck
Editable Sales Pitch Deck Presentation Template for PowerPoint & Google Slides
Pitch Deck
Consulting Sales Presentation Pitch Deck Template for PowerPoint & Google Slides
Pitch Deck
Product Sale Pitch Deck Presentation Template for PowerPoint & Google Slides
Pitch Deck
Nuclear Energy Presentation Deck Template for PowerPoint & Google Slides
Pitch Deck
Text-Heavy Corporate Presentation Deck Template for PowerPoint & Google Slides
Pitch Deck
Navy Presentation Deck Template for PowerPoint & Google Slides
Company Profile
Cinematic Film Pitch Deck Presentation Template for PowerPoint & Google Slides
Pitch Deck
Serene Yoga Class Presentation Deck Template for PowerPoint & Google Slides
Company Profile
Consulting Proposal Presentation Deck Template for PowerPoint & Google Slides
Pitch Deck
Space-Themed Presentation Deck Template for PowerPoint & Google Slides
Pitch Deck
Elegant Food Presentation Deck Template for PowerPoint & Google Slides
Pitch Deck
Colorful Creative Presentation Deck Template for PowerPoint & Google Slides
Company Profile
Education Theme Presentation Deck Template for PowerPoint & Google Slides
Pitch Deck
Vibrant Gaming Theme Presentation Deck Template for PowerPoint & Google Slides
Pitch Deck
Futuristic Technology Presentation Deck Template for PowerPoint & Google Slides
Company Profile
Cute Company Profile Presentation Deck Template for PowerPoint & Google Slides
Company Profile
Self Introduction Presentation Deck Template for PowerPoint & Google Slides
Recruitment
AI Startup Pitch Deck Presentation Template for PowerPoint & Google Slides
Pitch Deck
Hybrid Work Presentation Deck Template for PowerPoint & Google Slides
Company Profile
Inbound Marketing Agency Presentation Deck for PowerPoint & Google Slides
Marketing
Sales Presentation Deck for PowerPoint & Google Slides
Decks
Black and Gold Business Pitch Deck Presentation for PowerPoint & Google Slides
Company Profile
Game Theme Presentation Deck for PowerPoint & Google Slides
Decks
Books Theme Presentation Deck for PowerPoint & Google Slides
Decks