Free Big Data Network Visualization Template for PowerPoint & Google Slides

Description
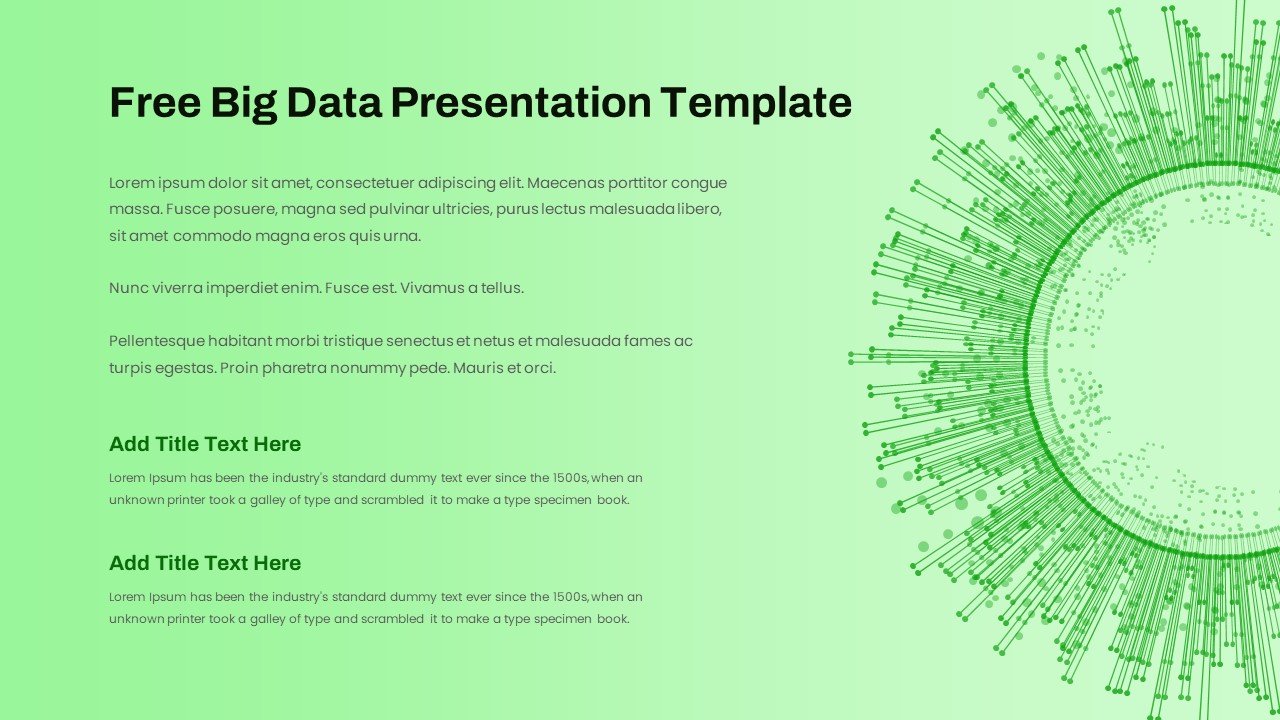
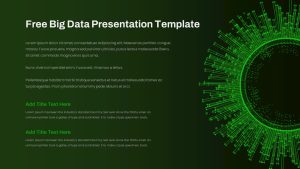
Leverage this big data network visualization template to showcase complex datasets and connectivity insights within a single slide. A striking radial network diagram of interconnected nodes radiates from the right side of the canvas against a dark green-to-black gradient backdrop, emphasizing data flow and technological sophistication. The left panel features a prominent title placeholder and three text blocks for narrative context, enabling you to introduce project objectives, methodology, or key findings. Two subheading sections with bold green headers and placeholder paragraphs allow deep dives into case studies or data highlights.
Fully editable in PowerPoint and Google Slides, every shape and line is vector-based, ensuring crisp rendering at any resolution. Customize node colors, adjust radial density, or replace placeholder text to match your corporate identity. Master slides streamline theme adjustments, granting rapid color palette swaps and font updates while maintaining consistent typographic hierarchy. Alignment guides and smart grouping speed up slide assembly, so you spend less time formatting and more time presenting.
Ideal for data scientists, IT leaders, and analytics teams, this slide enables you to communicate big data architectures, network topologies, machine learning workflows, or data pipeline overviews with clarity. Use the compelling radial design to highlight core datasets, illustrate data processing stages, or map relationships between data sources. The high-contrast palette ensures readability in both boardroom projectors and digital reports, while the modern dark motif projects technical authority and innovation. Whether you’re delivering an executive briefing on data strategy, presenting a proof-of-concept demo, or training stakeholders on analytics frameworks, this big data network visualization template provides a powerful, professional backdrop that elevates your content.
Who is it for
Data scientists, IT leaders, and analytics teams aiming to illustrate data architectures, network topologies, or machine learning workflows with visual clarity.
Other Uses
Repurpose this radial network diagram for network architecture mapping, cybersecurity threat modeling, IoT connectivity overviews, system design presentations, or research on social network analysis.
Login to download this file

Item ID
SB04094
Related Templates

Free Stacked Column Chart Data Visualization Template for PowerPoint & Google Slides
Bar/Column
Free
Circle Graph Data Visualization Template for PowerPoint & Google Slides
Circular
3D Cone Chart Data Visualization template for PowerPoint & Google Slides
Bar/Column
Gear Pie Diagram Data Visualization Template for PowerPoint & Google Slides
Pie/Donut
Leaf Infographic Data Visualization Template for PowerPoint & Google Slides
Infographics
Mobile Infographics Data Visualization Template for PowerPoint & Google Slides
Infographics
Medical Infographics Data Visualization Template for PowerPoint & Google Slides
Health
KPI Dashboard Data Visualization Template for PowerPoint & Google Slides
Bar/Column
Professional Heatmap Data Visualization Template for PowerPoint & Google Slides
Infographics
Waffle Chart Data Visualization Template for PowerPoint & Google Slides
Comparison Chart
Simple Bar Chart Data Visualization Template for PowerPoint & Google Slides
Bar/Column
XY Bubble Chart Data Visualization Template for PowerPoint & Google Slides
Comparison Chart
Waterfall Chart Data Visualization Template for PowerPoint & Google Slides
Comparison Chart
UK Counties Map Data Visualization Template for PowerPoint & Google Slides
World Maps
Segmented Scatter Chart Data Visualization Template for PowerPoint & Google Slides
Business Strategy
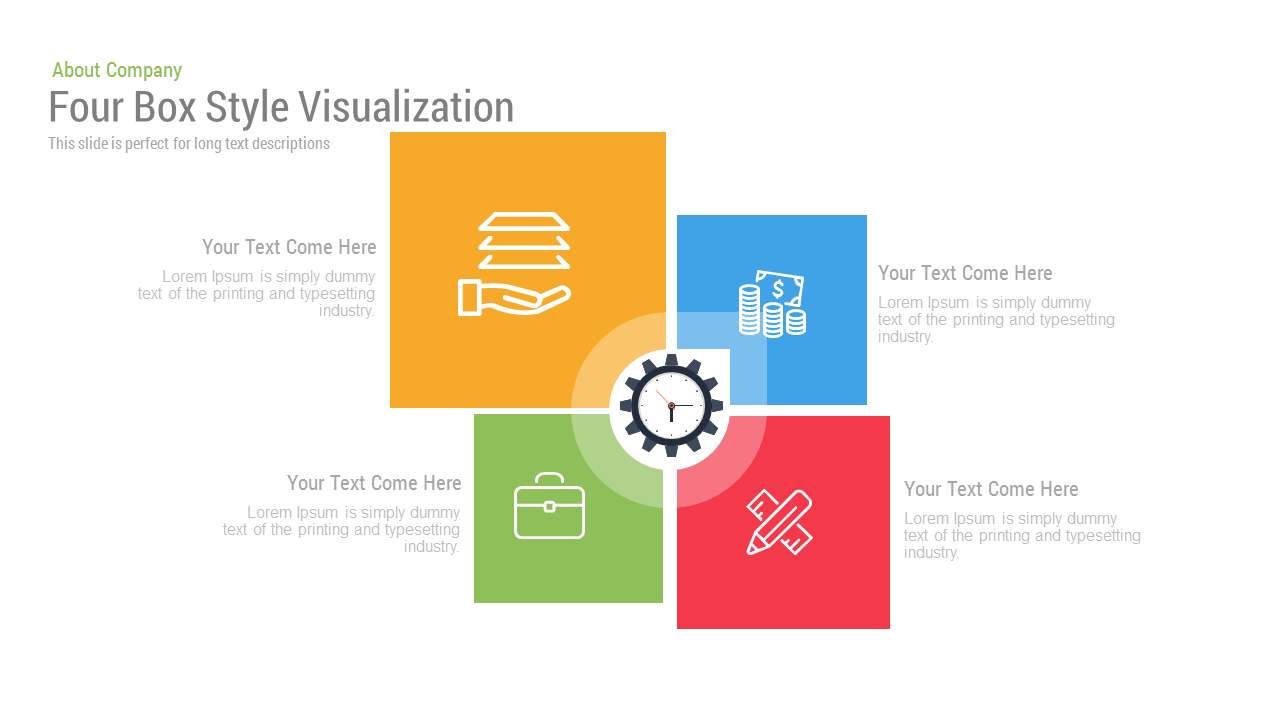
Free Four Box Style Visualization template for PowerPoint & Google Slides
Process
Free
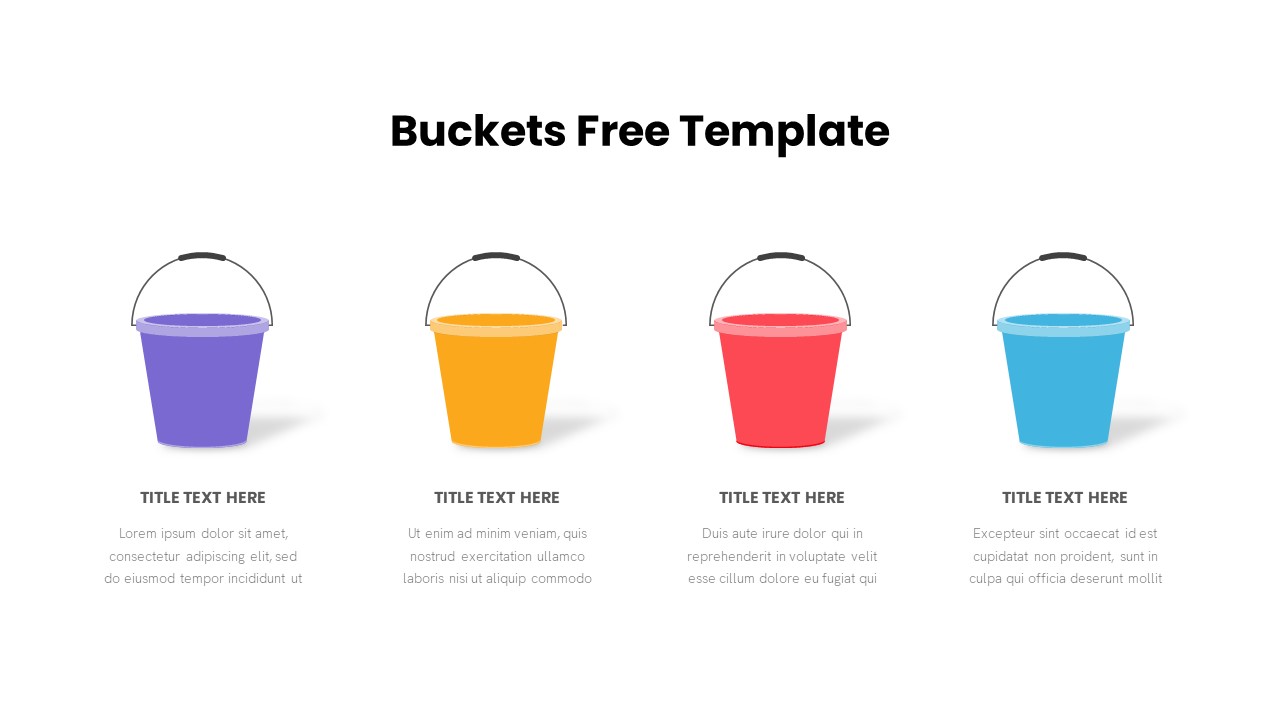
Free Bucket Process Visualization Template for PowerPoint & Google Slides
Process
Free

Bold Diamond Risk Alert Visualization Template for PowerPoint & Google Slides
Risk Management
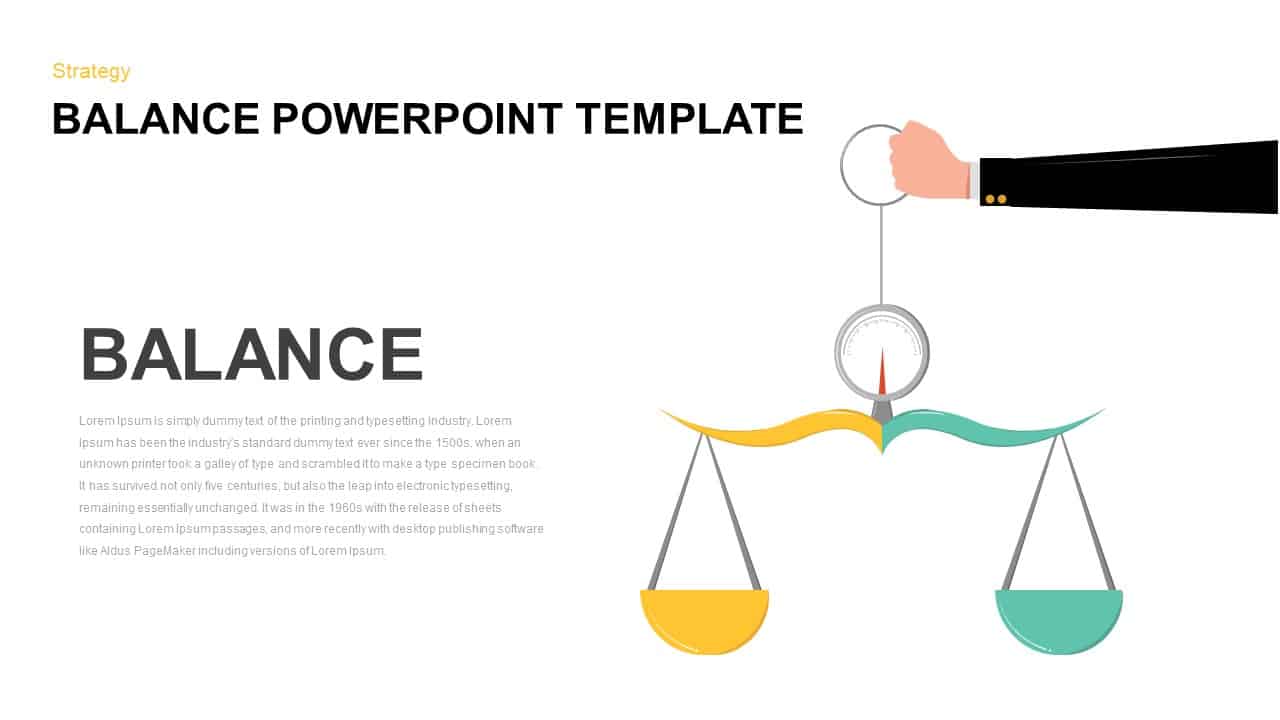
Balance Scale Visualization Infographic Template for PowerPoint & Google Slides
Comparison
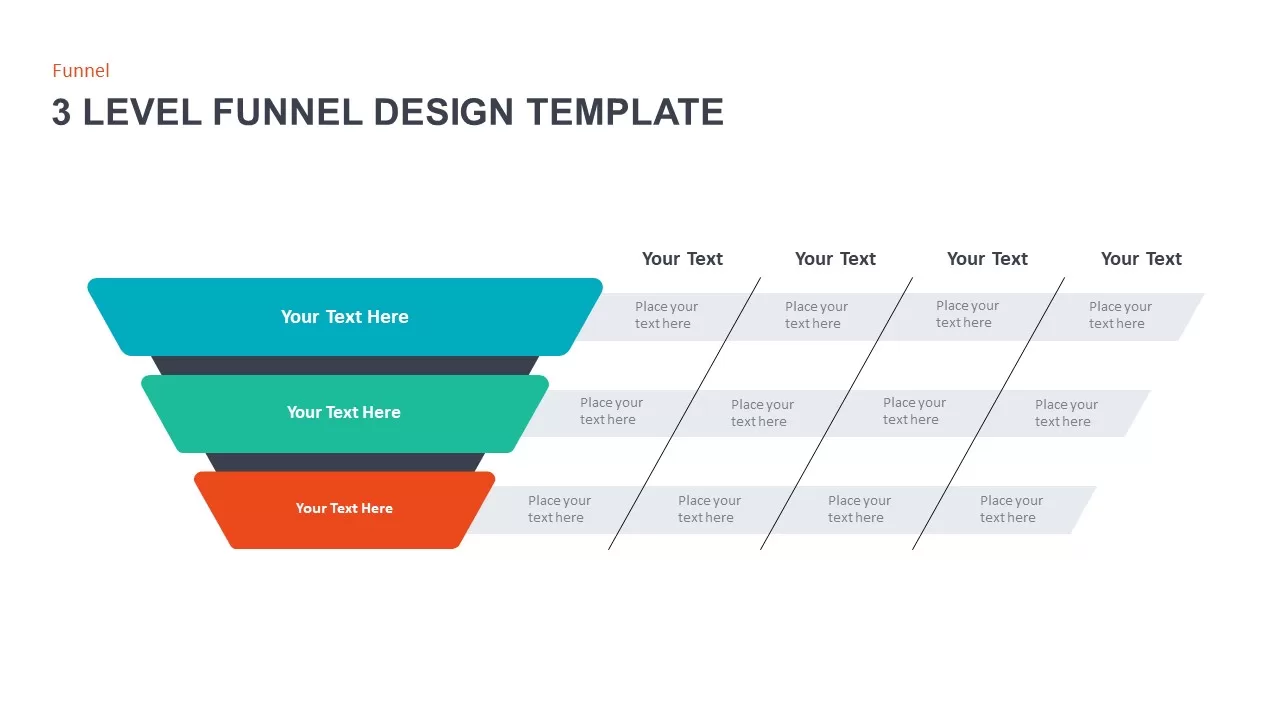
3 Level Funnel Design Visualization Template for PowerPoint & Google Slides
Funnel
Professional Risk Heat Map Visualization Template for PowerPoint & Google Slides
Risk Management
Growth Curve Line Chart Visualization Template for PowerPoint & Google Slides
Charts
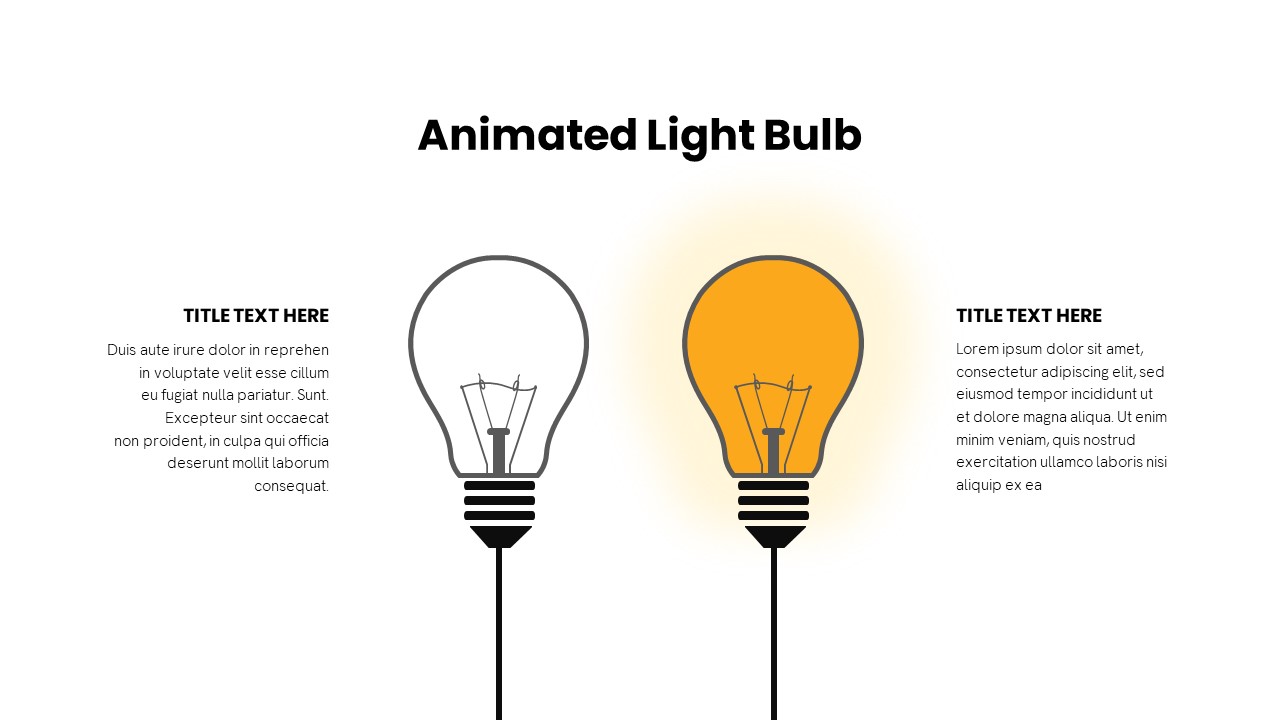
Animated Light Bulb Visualization Template for PowerPoint & Google Slides
Process
Progress Bar and Milestone Visualization Template for PowerPoint & Google Slides
Timeline
Dynamic Sunburst Chart Visualization Template for PowerPoint & Google Slides
Charts
Kentucky County Map Visualization Template for PowerPoint & Google Slides
World Maps
3D Cylinder Bar Chart Visualization Template for PowerPoint
Bar/Column
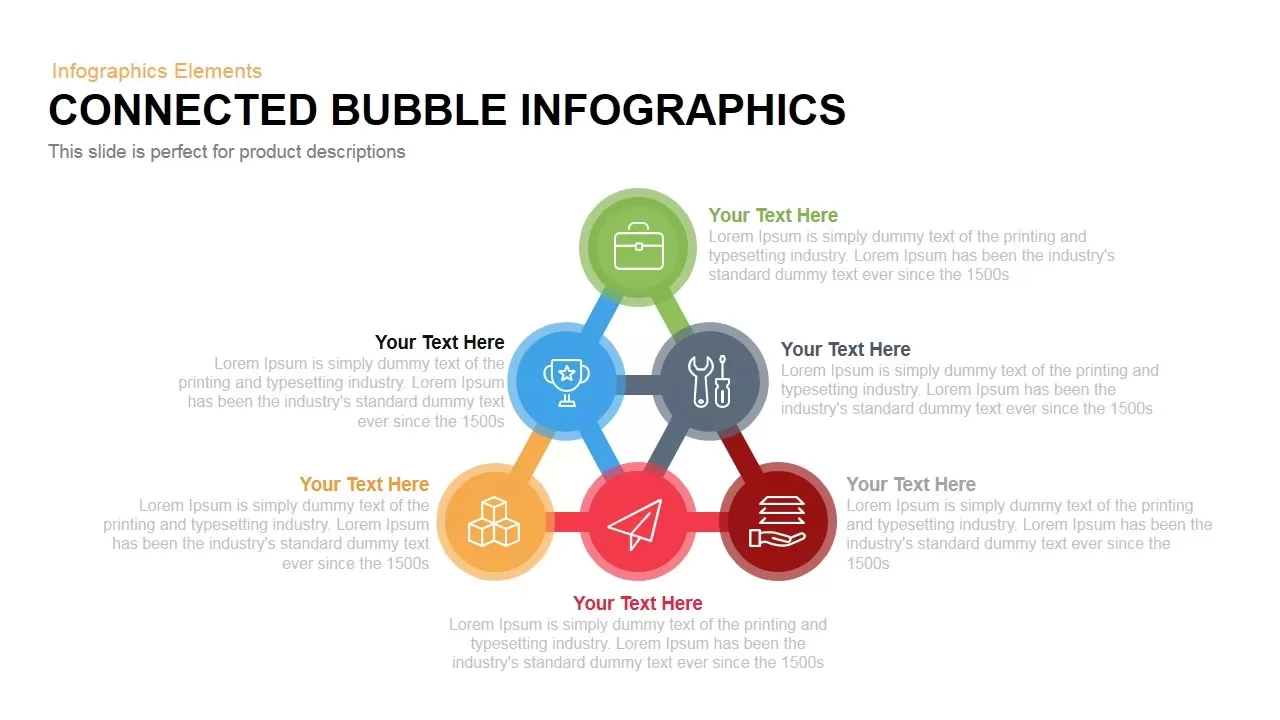
Connected Bubble Network Infographic Template for PowerPoint & Google Slides
Circular
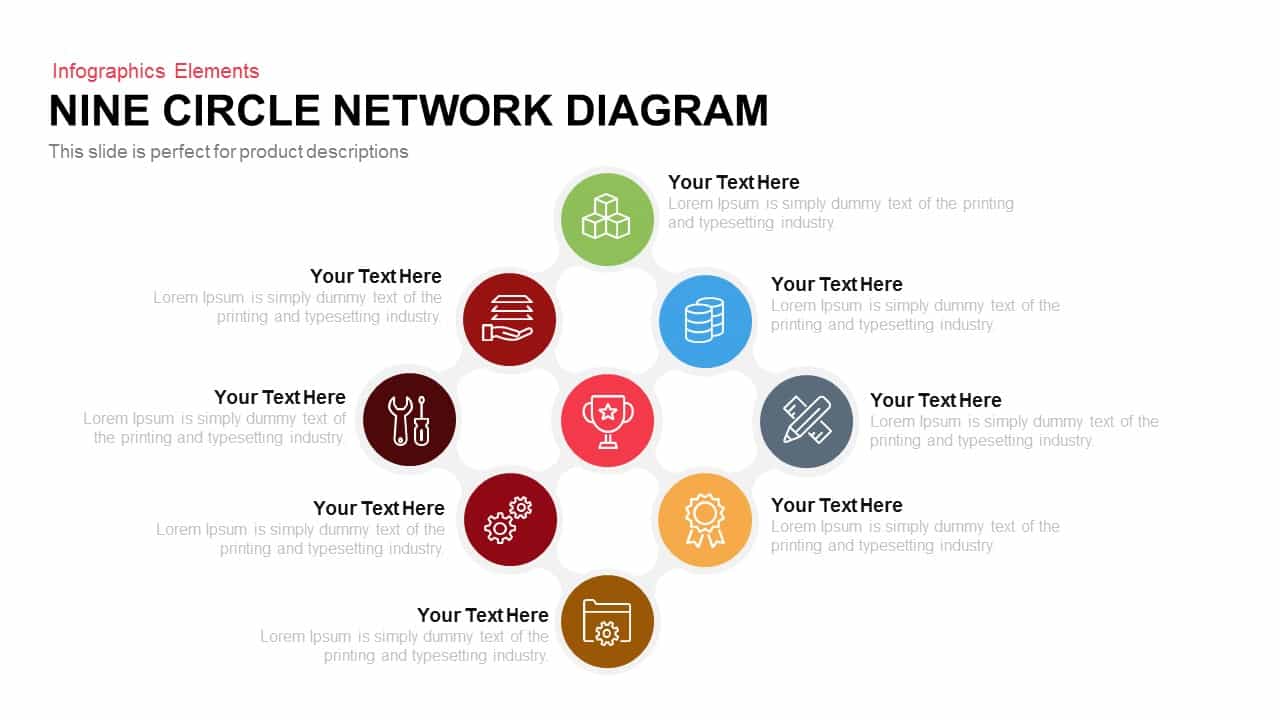
Modern Nine Circle Network Diagram Template for PowerPoint & Google Slides
Circular
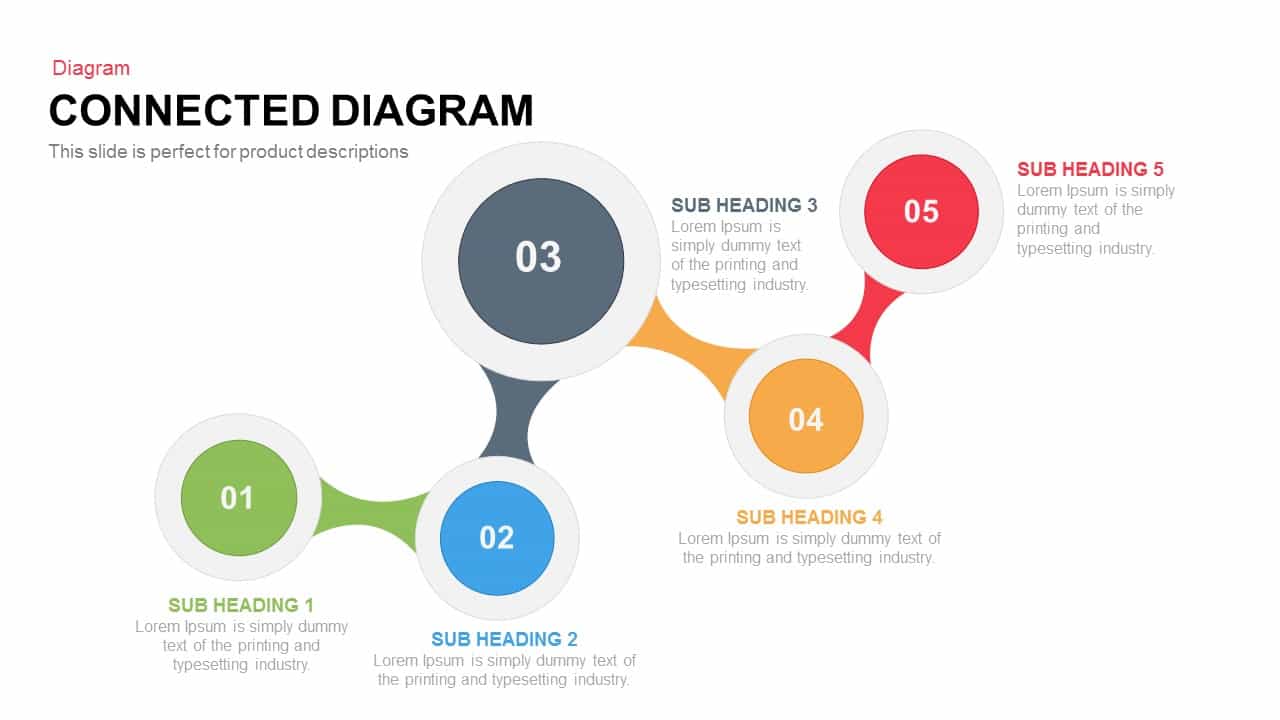
Interactive Connected Network Diagram Template for PowerPoint & Google Slides
Process
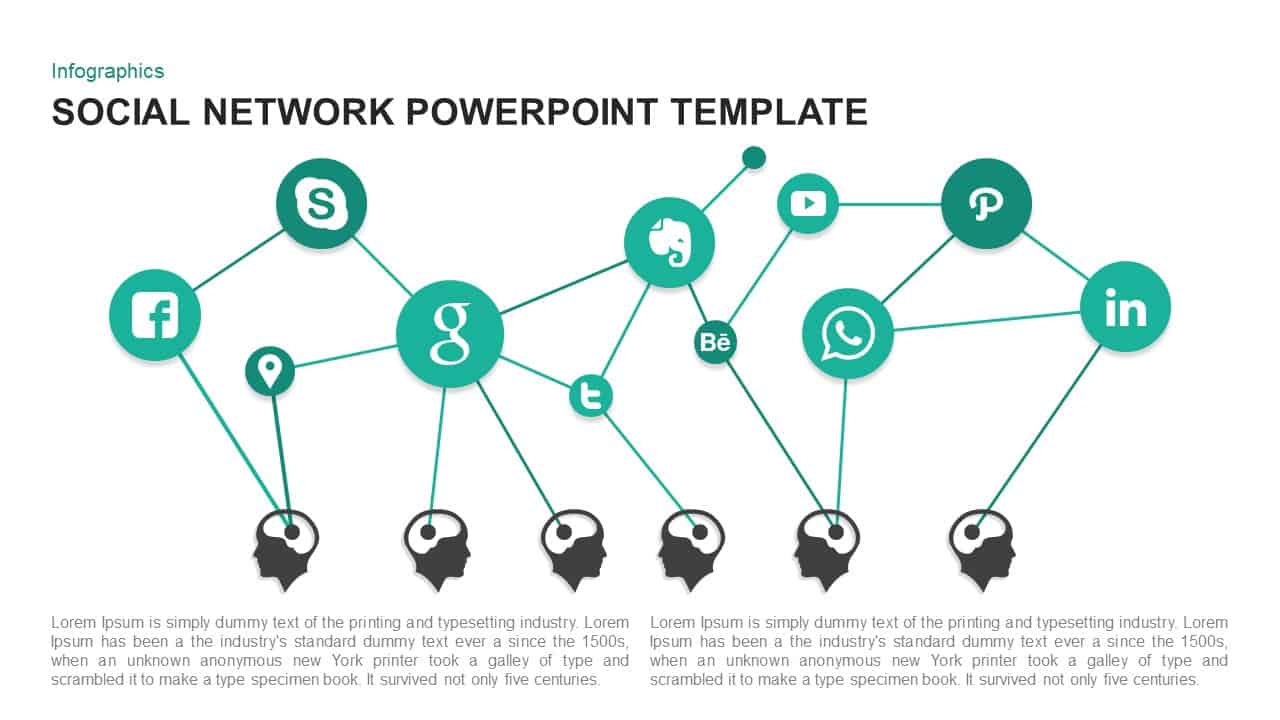
Social Media Mind Network Infographic Template for PowerPoint & Google Slides
Digital Marketing
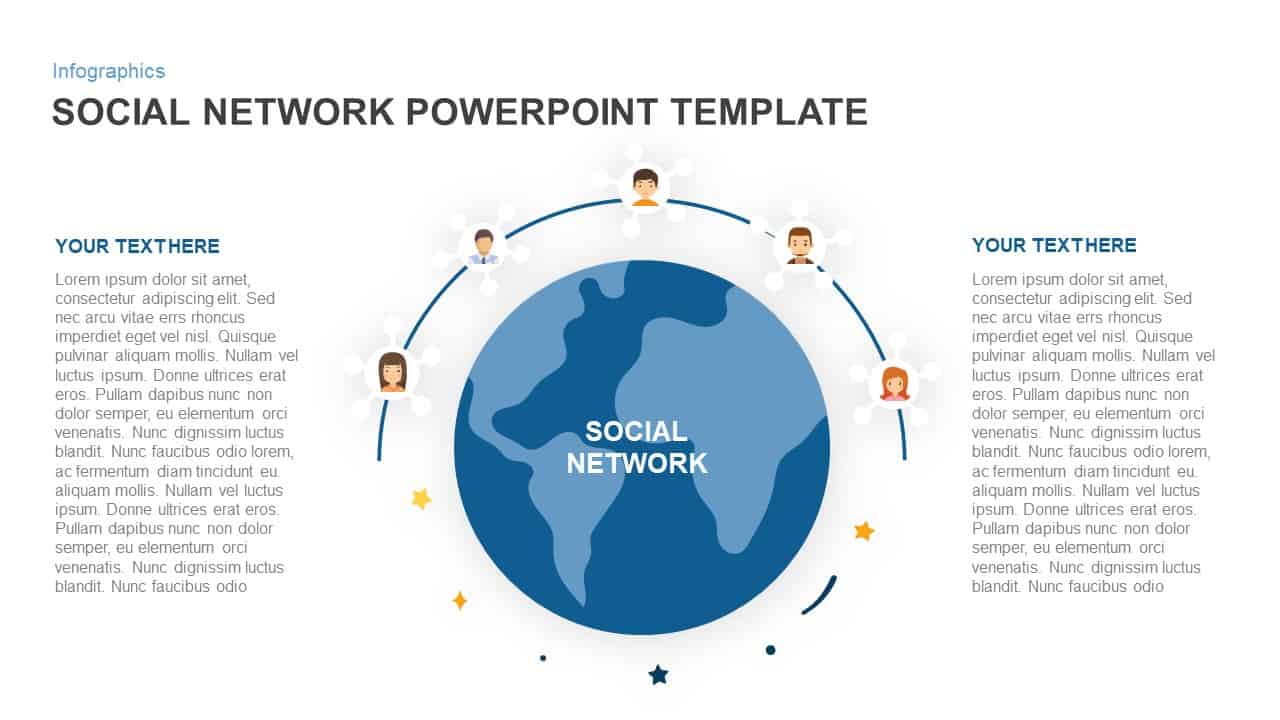
Social Network Connectivity Infographic Template for PowerPoint & Google Slides
Infographics
Social Network Infographic Diagram Template for PowerPoint & Google Slides
Digital Marketing
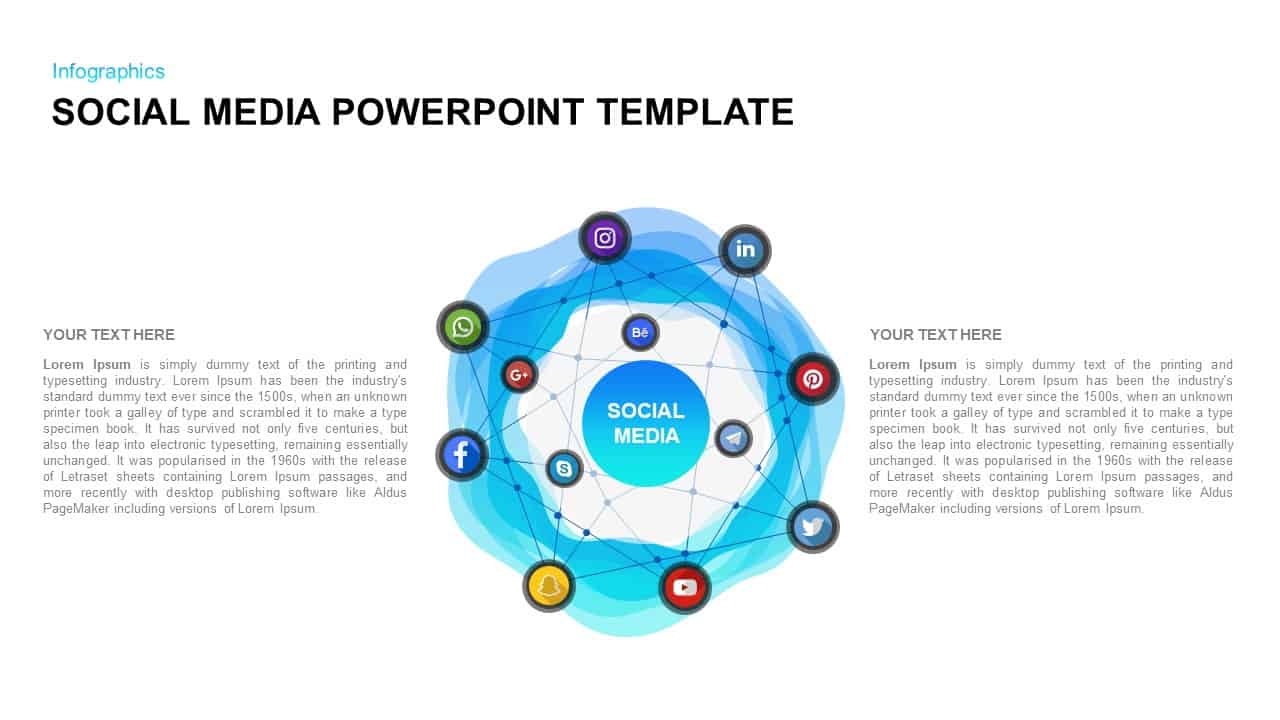
Social Media Network Infographic Template for PowerPoint & Google Slides
Circular
Network Diagram Elements and Icons Pack Template for PowerPoint & Google Slides
Information Technology
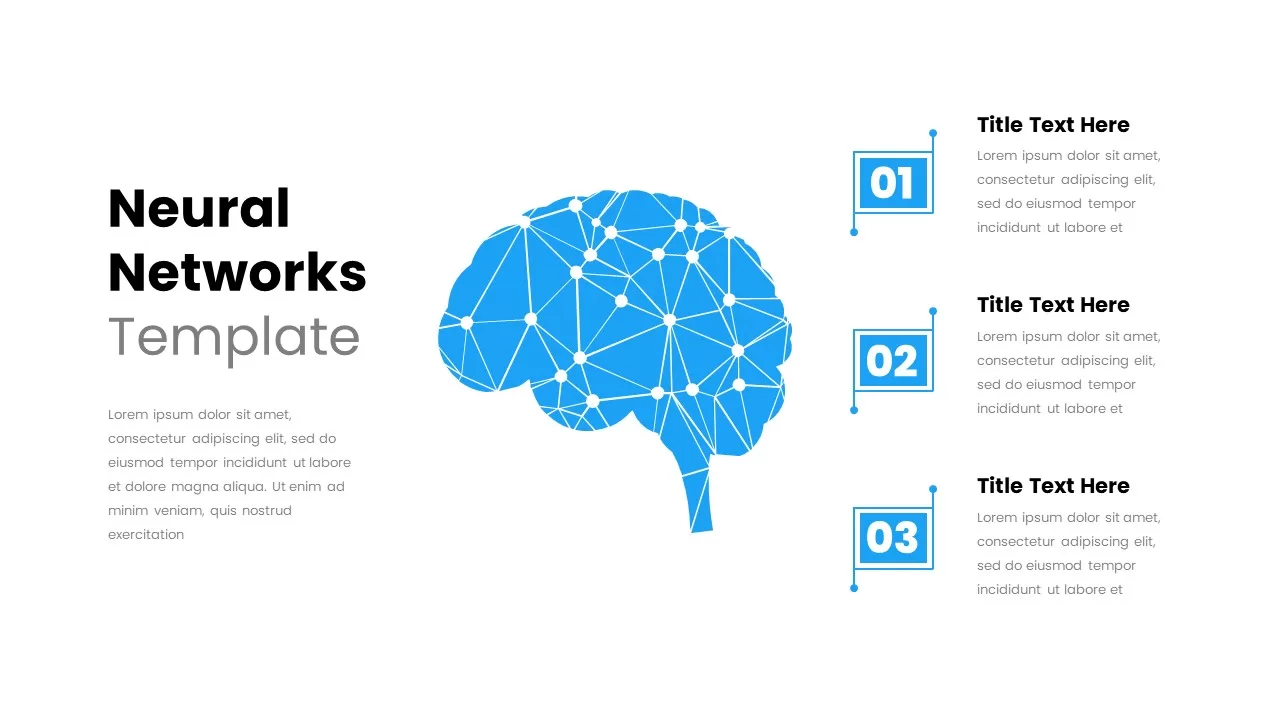
Neural Network Brain Infographic Template for PowerPoint & Google Slides
Process
Social Media Community Network Slide Template for PowerPoint & Google Slides
Circular
Quarterly Network Volume Analysis Template for PowerPoint & Google Slides
Business Report
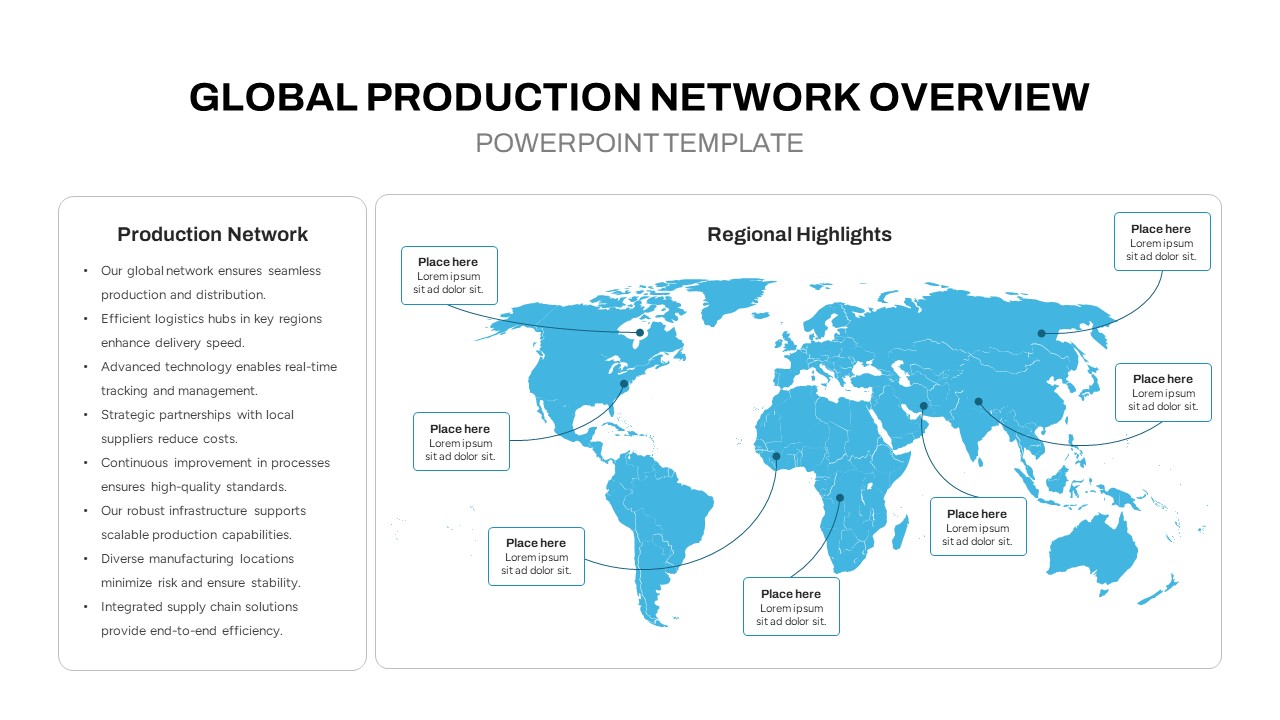
Global Production Network Overview Map Template for PowerPoint & Google Slides
World Maps
5Cs of Network Effect Circular Diagram Template for PowerPoint & Google Slides
Circular
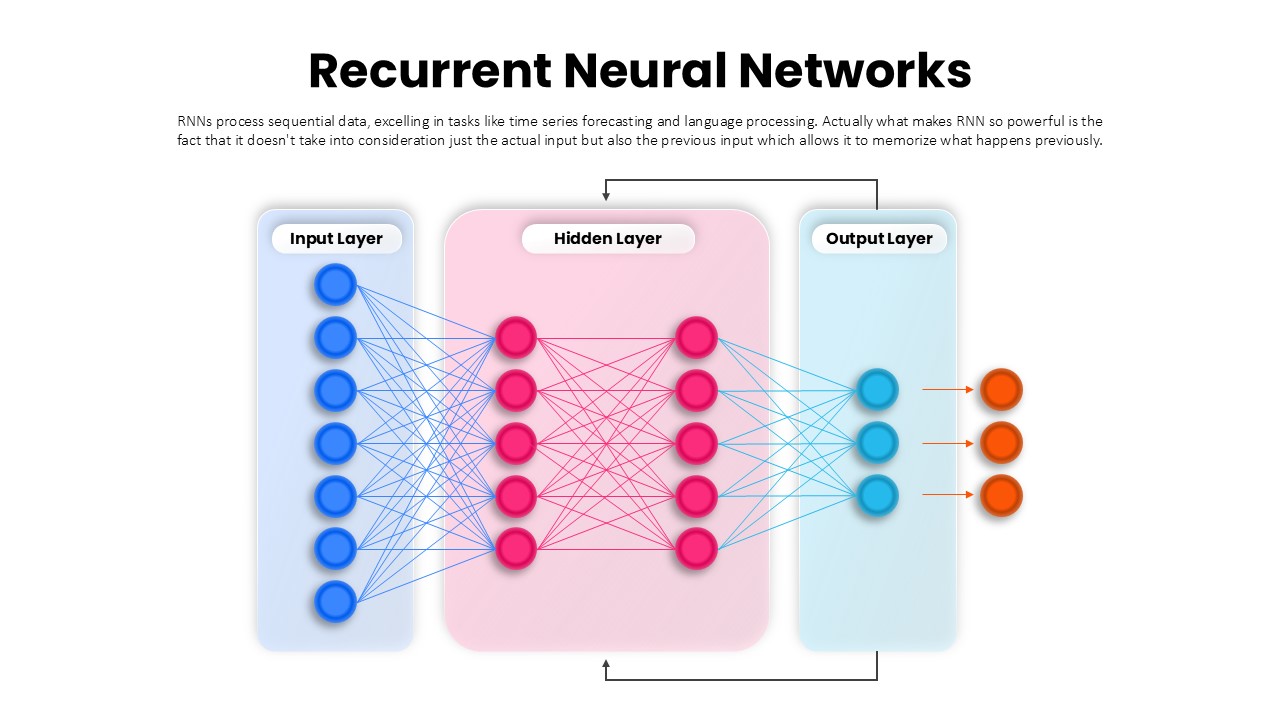
Recurrent Neural Network Architecture Template for PowerPoint & Google Slides
AI
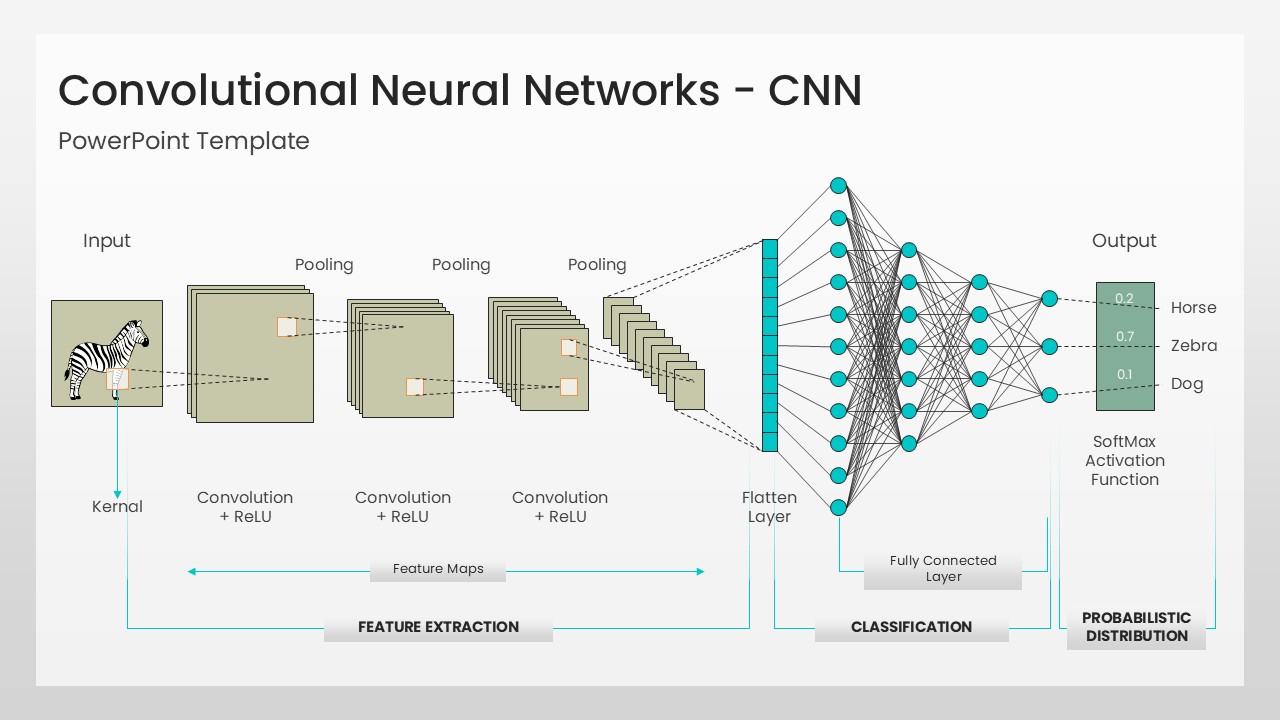
Convolutional Neural Network Architecture Template for PowerPoint & Google Slides
Machine Learning
Network Effects Template for PowerPoint & Google Slides
Software Development
Social Media Network Hub Diagram Slide for PowerPoint & Google Slides
Process
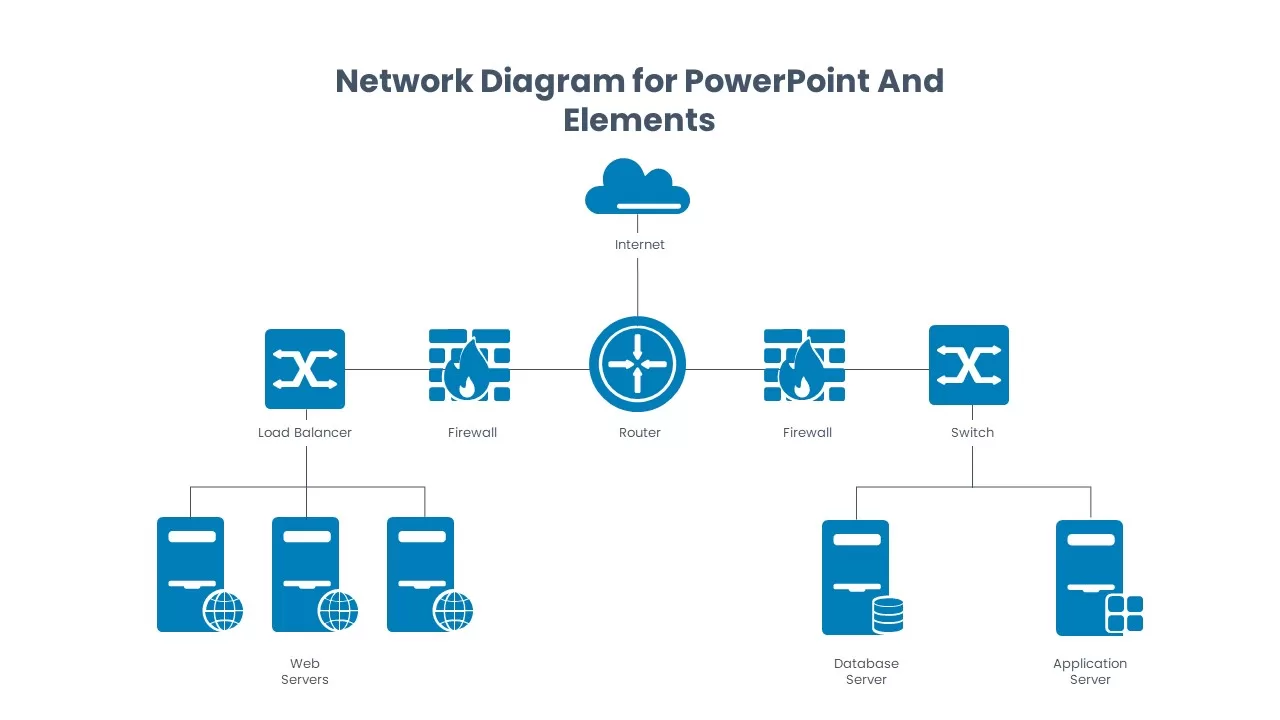
Network Diagram Infographics for PowerPoint & Google Slides
Technology
Network Organizational Chart for PowerPoint & Google Slides
Business
Cybersecurity Network Theme for PowerPoint & Google Slides
Information Technology

Free Data Analytics Dashboard Template for PowerPoint
Charts
Free
Data Science PowerPoint Presentation Template for PowerPoint & Google Slides
Pitch Deck
Data Center PowerPoint Template for PowerPoint & Google Slides
Information Technology
Creative data chart analytics template for PowerPoint & Google Slides
Charts
Mobile Data Analysis Chart template for PowerPoint & Google Slides
Charts
World Map Data template for PowerPoint & Google Slides
World Maps
Circle Chart Data template for PowerPoint & Google Slides
Pie/Donut
Creative Data Analysis Bar Chart template for PowerPoint & Google Slides
Bar/Column

Smartphone Data User template for PowerPoint & Google Slides
Charts
Interactive US Population Data Map Slide Template for PowerPoint & Google Slides
World Maps
3D Bar Chart Data Infographics Template for PowerPoint & Google Slides
Bar/Column
3D Stacked Infographic Layers Data Template for PowerPoint & Google Slides
Pyramid
Creative Lab Beakers Data Infographic template for PowerPoint & Google Slides
Infographics

Dynamic Data Dashboard Infographic Template for PowerPoint & Google Slides
Bar/Column
Data Analytics Dashboard Design template for PowerPoint & Google Slides
Bar/Column
Data-Driven Marketing Cycle Diagram Template for PowerPoint & Google Slides
Customer Journey
Bottle Data Percentage Infographic Template for PowerPoint & Google Slides
Infographics
Immigration Data Dashboard Template for PowerPoint & Google Slides
Bar/Column
Data Management and Analytics Diagram Template for PowerPoint & Google Slides
Circular
Data Migration Life Cycle Curved Diagram Template for PowerPoint & Google Slides
Process
DIKW Data to Wisdom Pyramid Model Template for PowerPoint & Google Slides
Pyramid
Data-driven GDP Growth Infographic Pack Template for PowerPoint & Google Slides
Infographics
KPI Dashboard Data Overview Slide Template for PowerPoint & Google Slides
Bar/Column
North America Data Map Callouts Template for PowerPoint & Google Slides
World Maps
Donut Chart Data Breakdown template for PowerPoint & Google Slides
Pie/Donut

Modern Big Data Infographic Deck Template for PowerPoint & Google Slides
Decks
Layered Data Governance Maturity Model Template for PowerPoint & Google Slides
Process
Simple Area Chart Data Trends Analysis Template for PowerPoint & Google Slides
Comparison Chart
Data Over Time Line Chart template for PowerPoint & Google Slides
Charts
Multipurpose Spline Chart Data Trend Template for PowerPoint & Google Slides
Bar/Column
Editable Africa Map Infographic Data Template for PowerPoint & Google Slides
World Maps
Advanced Data Flow Diagram Pack Template for PowerPoint & Google Slides
Flow Charts
Interactive Jump Line Data Chart Template for PowerPoint & Google Slides
Comparison Chart
Syria Regional Data Map Infographic Template for PowerPoint & Google Slides
World Maps
Data Analysis Bar Chart with Insights Template for PowerPoint & Google Slides
Bar/Column
Free
Data Lake Hub-and-Spoke Diagram Template for PowerPoint & Google Slides
Cloud Computing
ETL Data Pipeline Workflow Diagram Template for PowerPoint & Google Slides
Process
Data Privacy template for PowerPoint & Google Slides
Information Technology
Data Protection Strategies template for PowerPoint & Google Slides
Information Technology
Data Flywheel Strategy template for PowerPoint & Google Slides
Business
Data Privacy and Compliance in ML template for PowerPoint & Google Slides
Technology
Data-Driven AI in Insurance Infographic Template for PowerPoint & Google Slides
Circular
AI and Data Ecosystem Map Template for PowerPoint & Google Slides
AI
Data Studio Insights template for PowerPoint & Google Slides
Business Report
Data Protection & Encryption in the Cloud Overview template for PowerPoint & Google Slides
Cloud Computing
Customer Data Platform Workflow Diagram Template for PowerPoint & Google Slides
Information Technology
Data-Driven Marketing Lifecycle Diagram Template for PowerPoint & Google Slides
Process
Data-Driven Decision Making overview template for PowerPoint & Google Slides
Business
First Party Data Overview Template for PowerPoint & Google Slides
Business
Data Governance Roles Pyramid Diagram Template for PowerPoint & Google Slides
Pyramid
Business Data Table Template for PowerPoint & Google Slides
Table
Colorful Business Data Comparison Table Template for PowerPoint & Google Slides
Table
Six Column Data Table Template for PowerPoint & Google Slides
Table