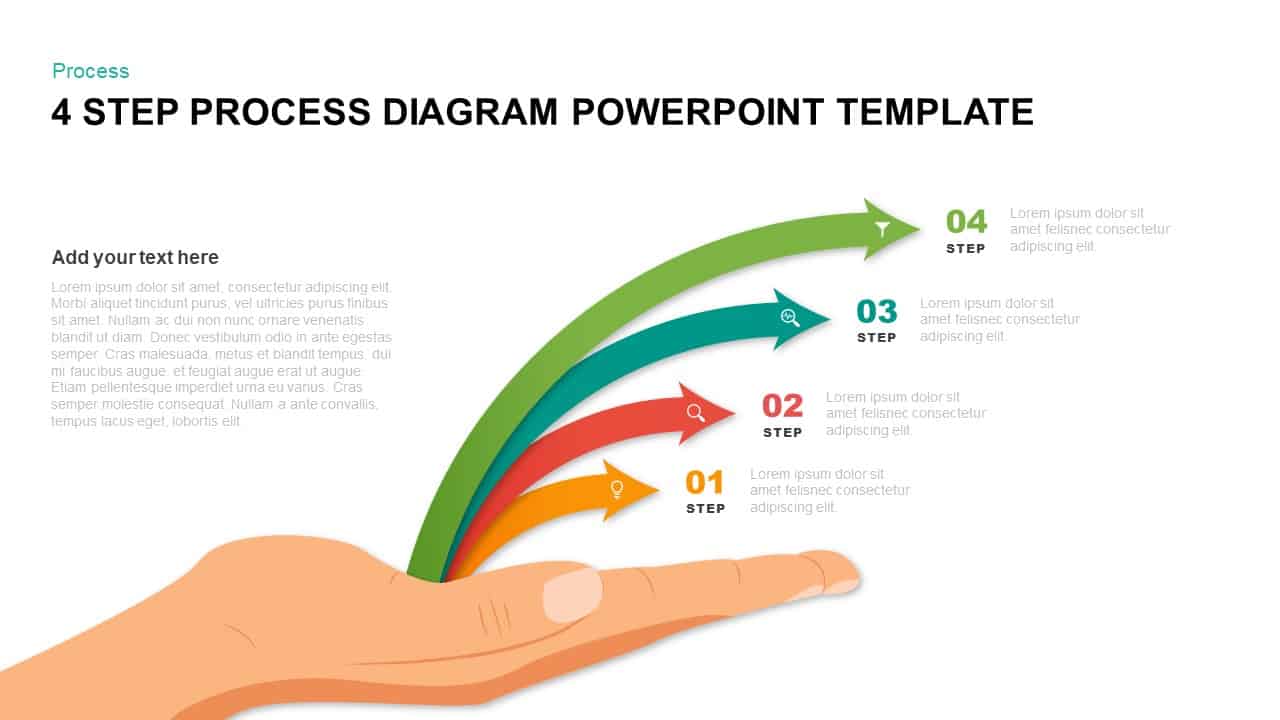
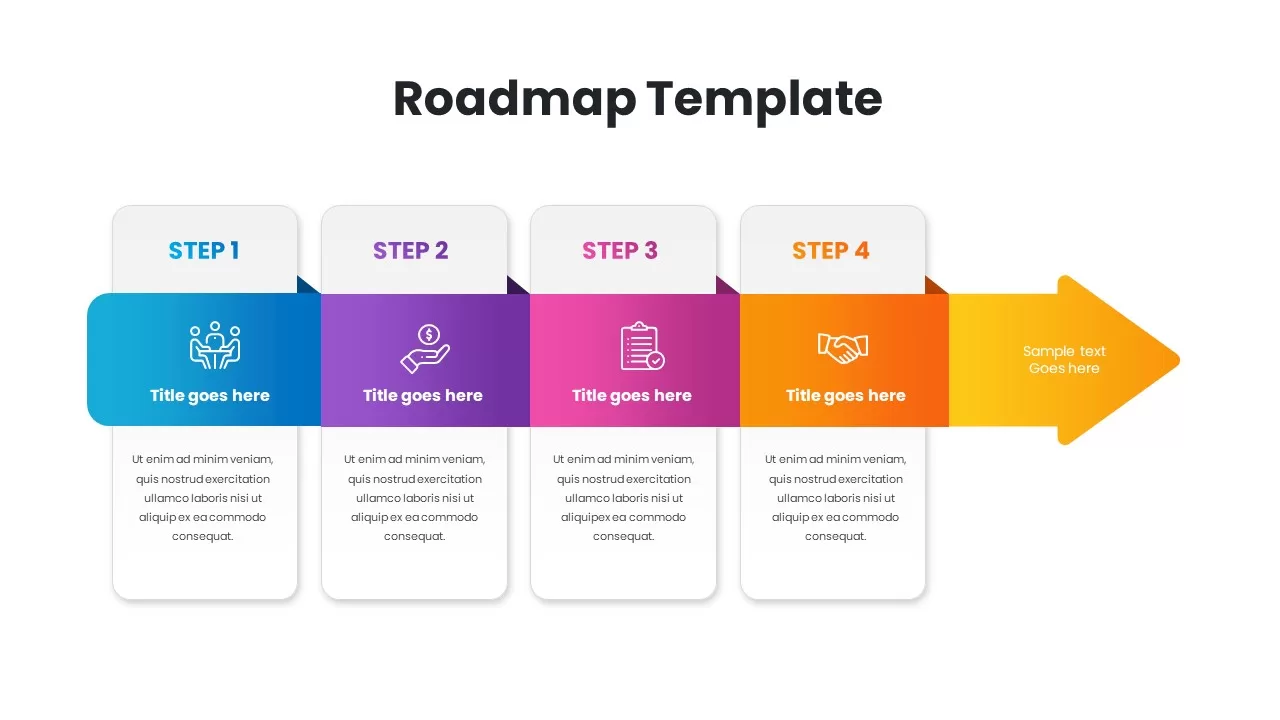
Four-Step Arrow Process Infographic Template for PowerPoint & Google Slides
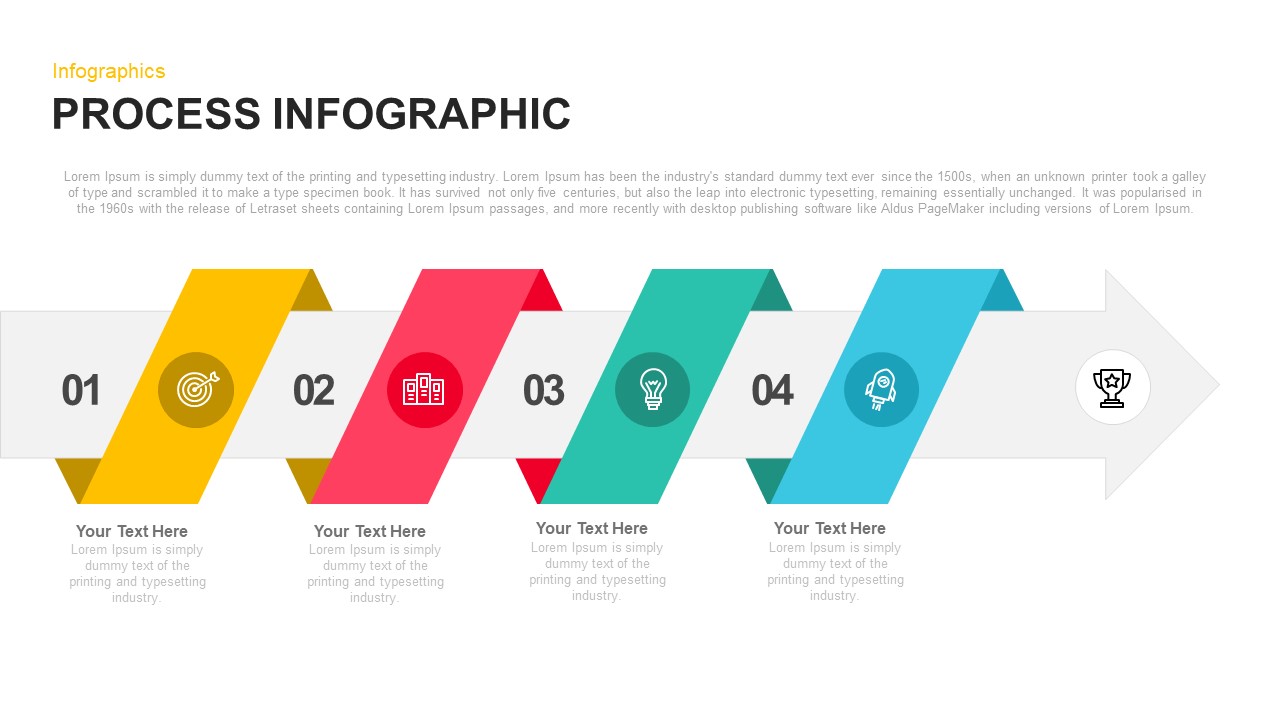
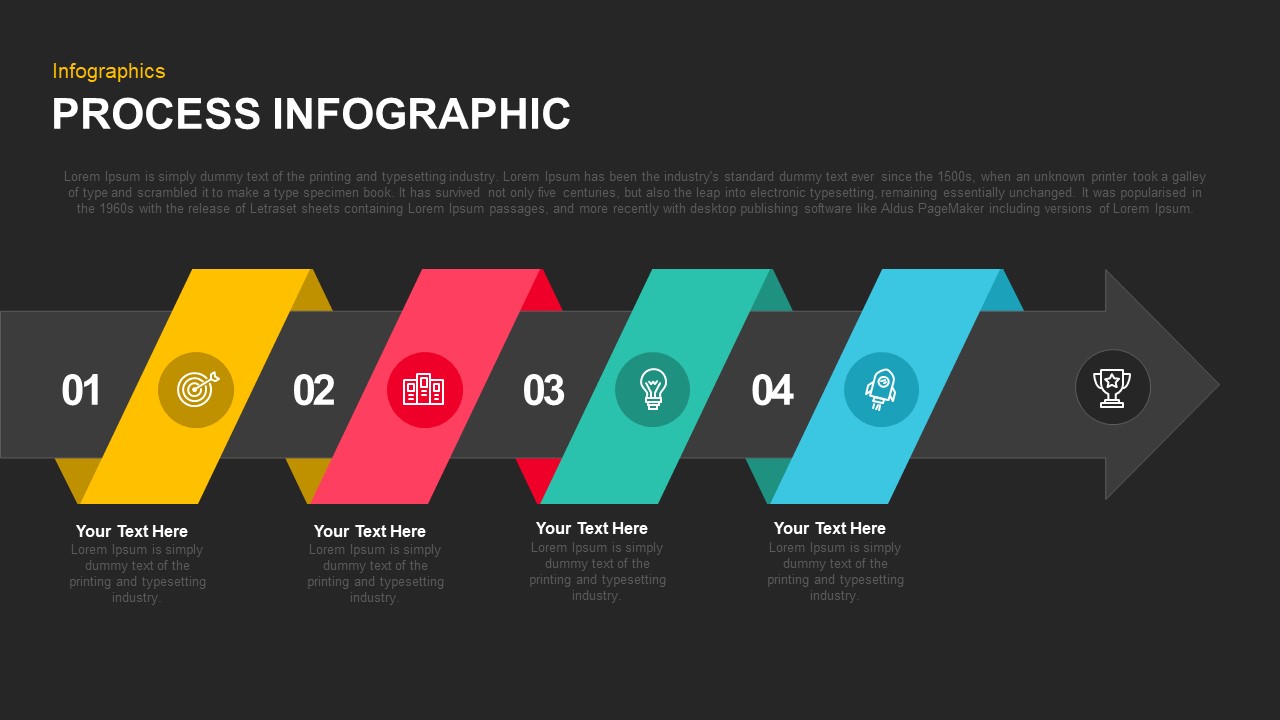
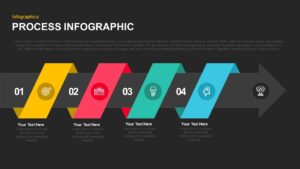
Guide your audience through step-by-step workflows with this vibrant four-step ribbon arrow process infographic slide. The central arrow base provides directional flow from left to right, overlaid by four colored vector ribbons—yellow, red, green, and blue—each wrapped around the arrow to highlight sequential milestones. Large, numbered circles mark steps 01 through 04, paired with customizable icons such as target, building, lightbulb, and rocket to visually reinforce each phase. Adjacent text placeholders sit below each ribbon for concise descriptions or action items, while a trophy icon at the arrow head offers a compelling cue for final objectives or success outcomes.
Constructed on PowerPoint and Google Slides master slides, this infographic ensures global editing of colors, fonts, and layouts. All ribbons, icons, and arrow elements are vector-based, allowing pixel-perfect scaling and effortless recoloring to match corporate branding. Update step numbers or swap icons from the integrated library in seconds, and adjust ribbon positions or arrow length to fit additional steps or text. Table-style placeholders and smart guide alignment support quick content entry, while the minimal white background and subtle arrow grid keep focus firmly on your core message. Explore more versatile arrow templates for presenting sequential processes and workflows with clarity.
Ideal for illustrating project roadmaps, process flows, or strategic plans, this slide empowers presenters to map objectives, outline key deliverables, and showcase milestone achievements within a single, cohesive visual. Duplicate or resize the slide to fit extended workflows, or integrate it into broader decks alongside Gantt charts, KPI dashboards, or SWOT analyses. Whether leading workshops, pitching stakeholders, or training teams, this four-step arrow infographic simplifies preparation and elevates audience engagement through clear, professional design.
Who is it for
Project managers, marketing teams, and operations leaders will find this arrow process infographic ideal for mapping workflows, illustrating four-phase strategies, and communicating key milestones. Consultants, trainers, and executive teams can leverage the step-by-step layout to guide stakeholders through objectives during board presentations, team workshops, and client pitches.
Other Uses
Beyond process mapping, repurpose this slide for product launch timelines, training agendas, or goal-setting sessions. You could also combine it with the four-arrow infographic template to add a multi-directional view of tasks, or enhance presentations with the 3d four-arrow infographics diagram for visually engaging 3D layouts of multi-step workflows. Adjust icon sets to represent KPIs, organizational milestones, or audit steps, and integrate the infographic into quarterly reviews, investor decks, or departmental reports for a versatile visual tool.
Login to download this file

Item ID
SB00887
Related Templates

Four-Option 4-Step Arrow Infographic Template for PowerPoint & Google Slides
Arrow
Four-Step Curved Arrow Process Template for PowerPoint & Google Slides
Process
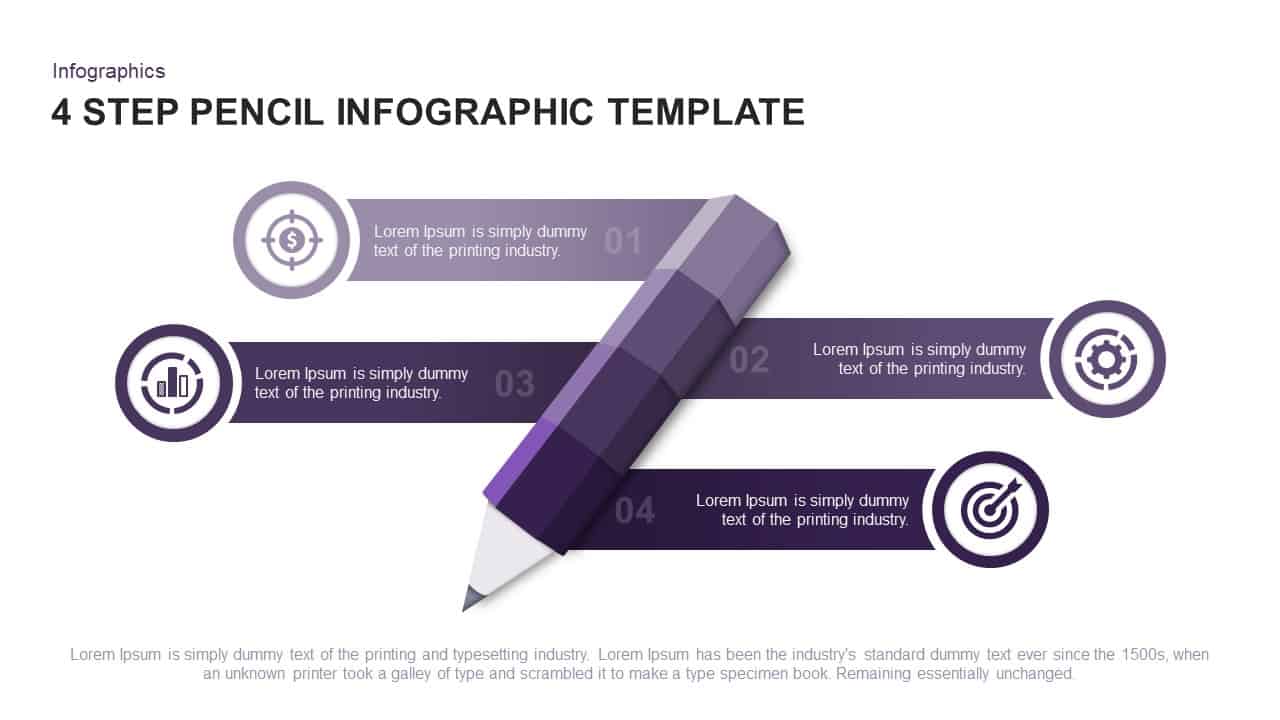
Four-Step Pencil Infographic Process Template for PowerPoint & Google Slides
Process
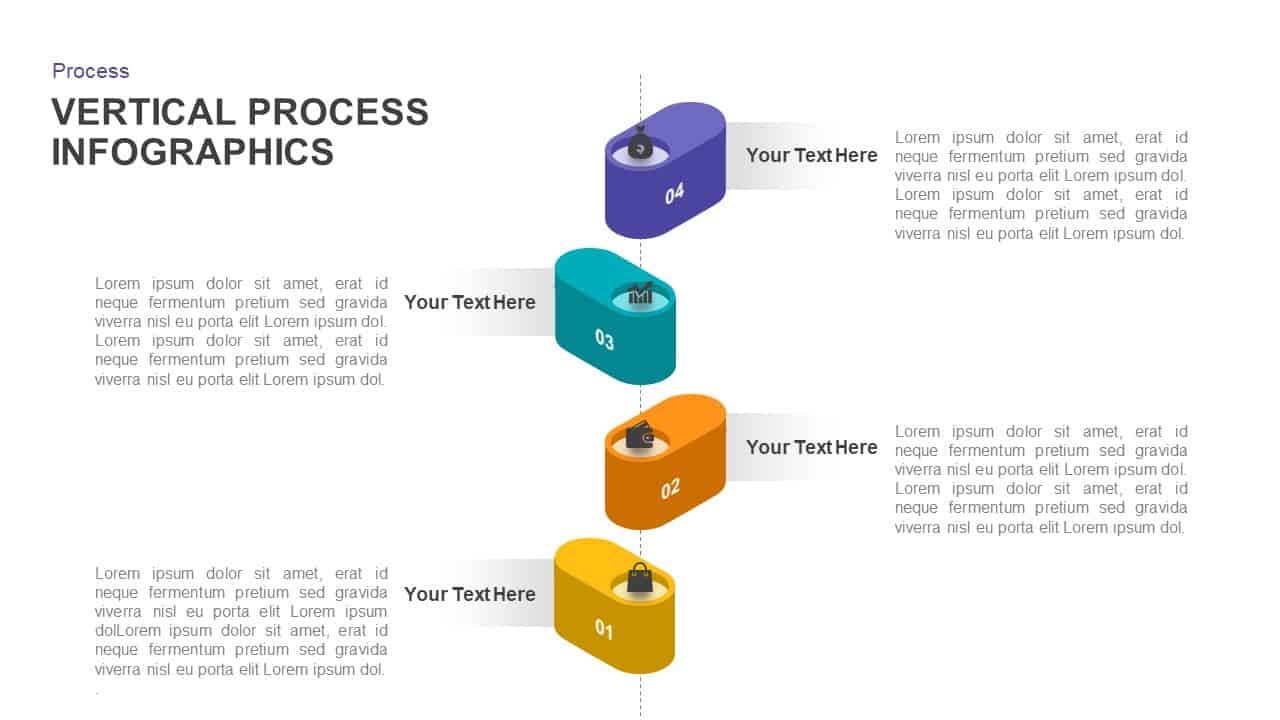
Vertical Four-Step Process Infographic Template for PowerPoint & Google Slides
Process
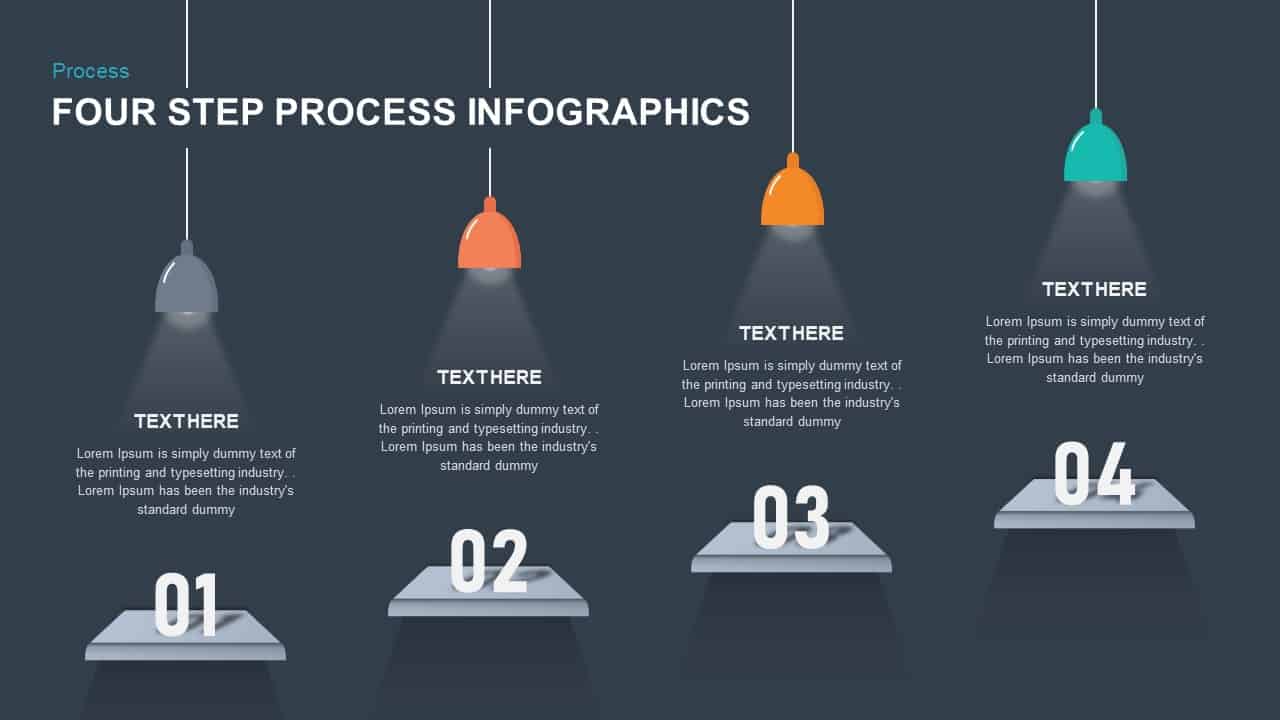
Four Step Process Infographic Slide Template for PowerPoint & Google Slides
Process
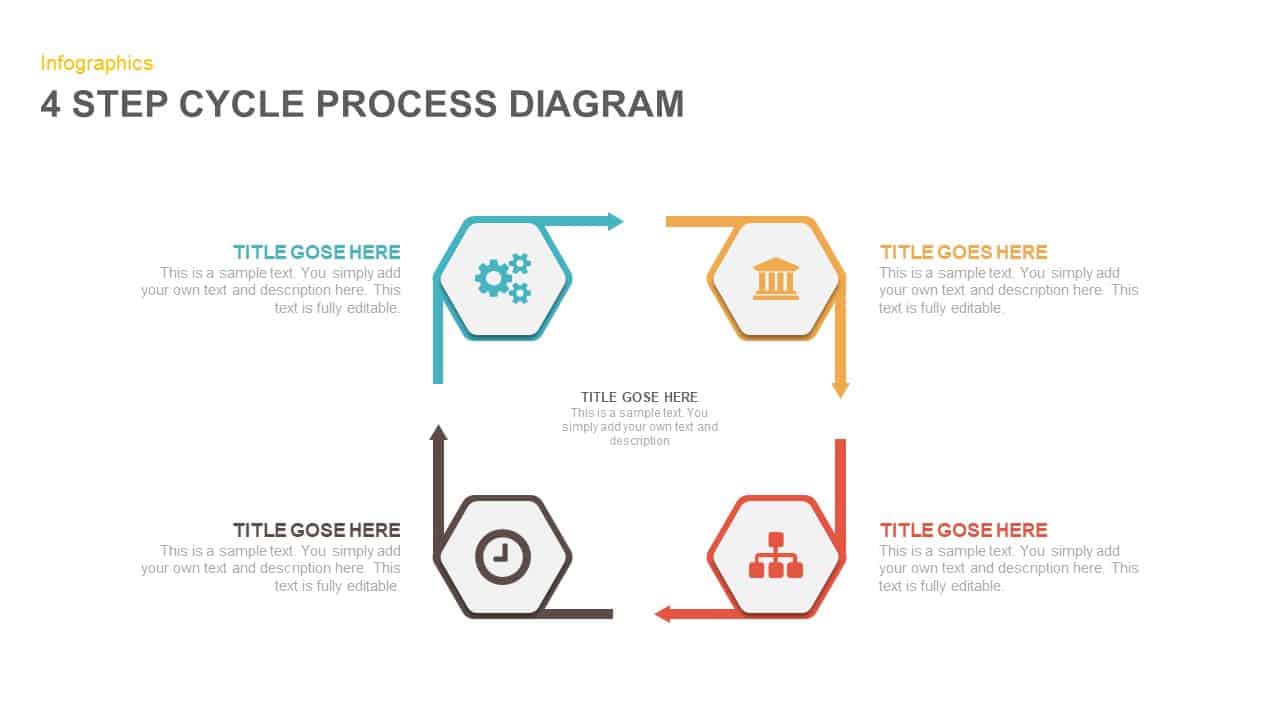
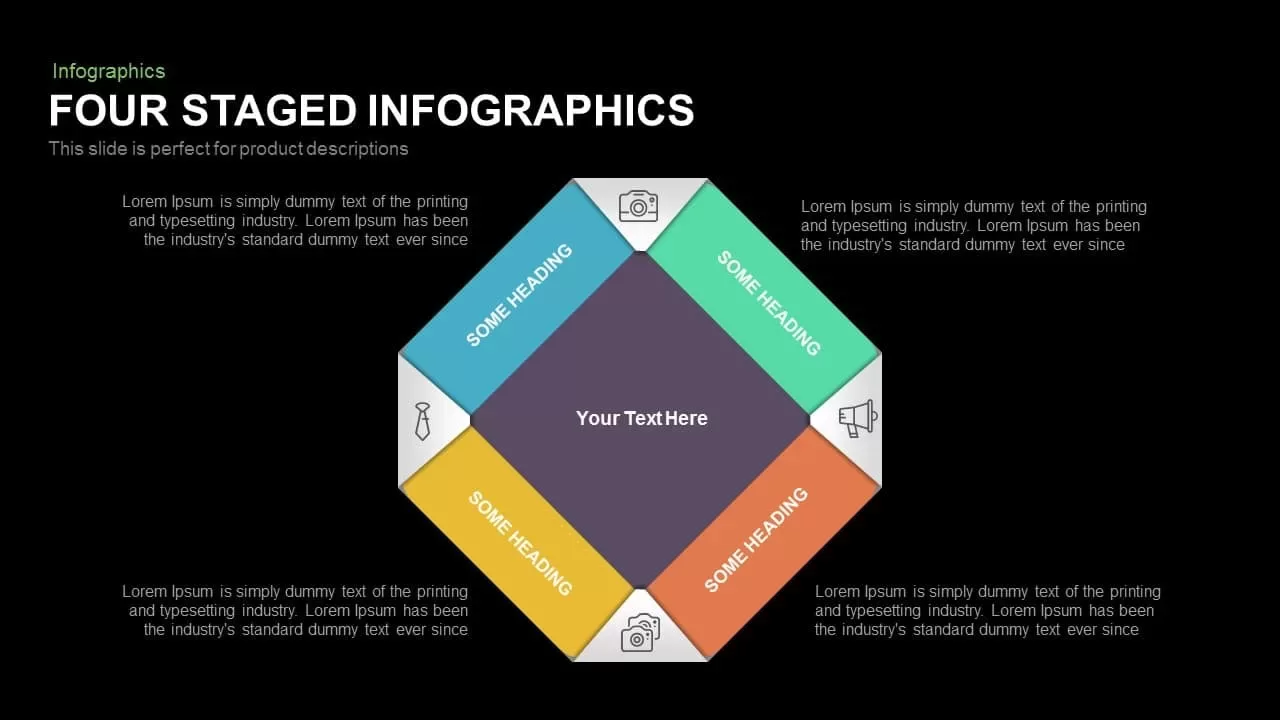
Four-Step Hexagon Process Infographic Template for PowerPoint & Google Slides
Process

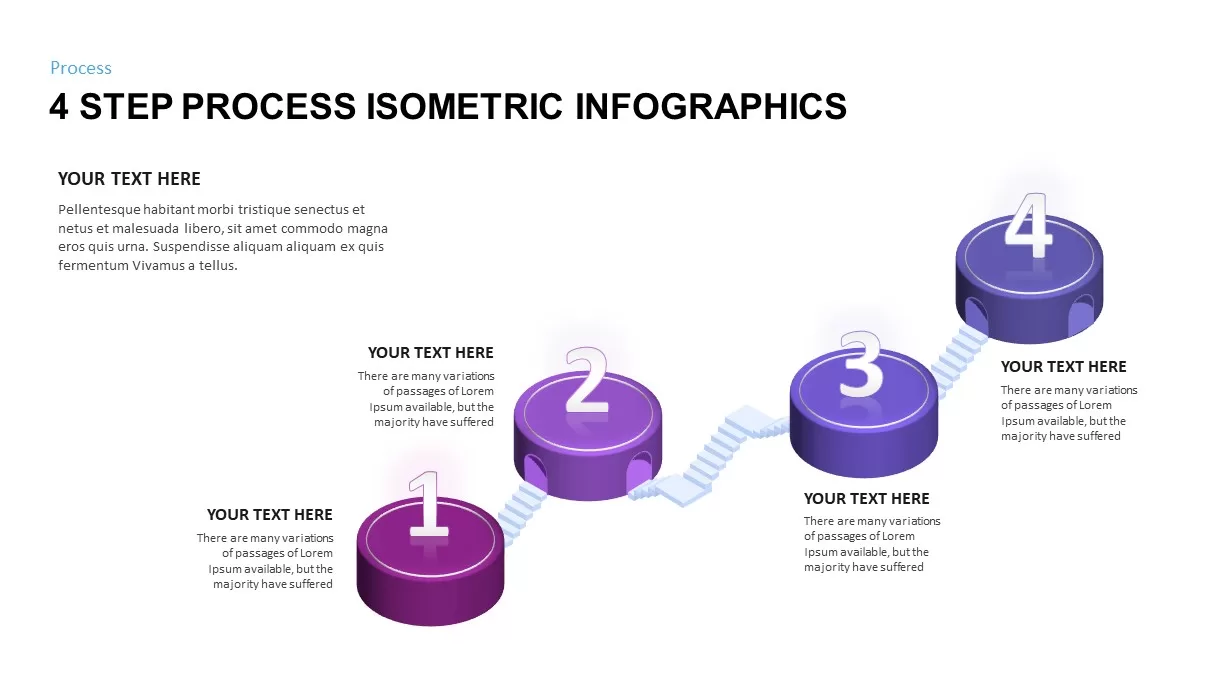
Four-Step Isometric Process Infographic Template for PowerPoint & Google Slides
Process
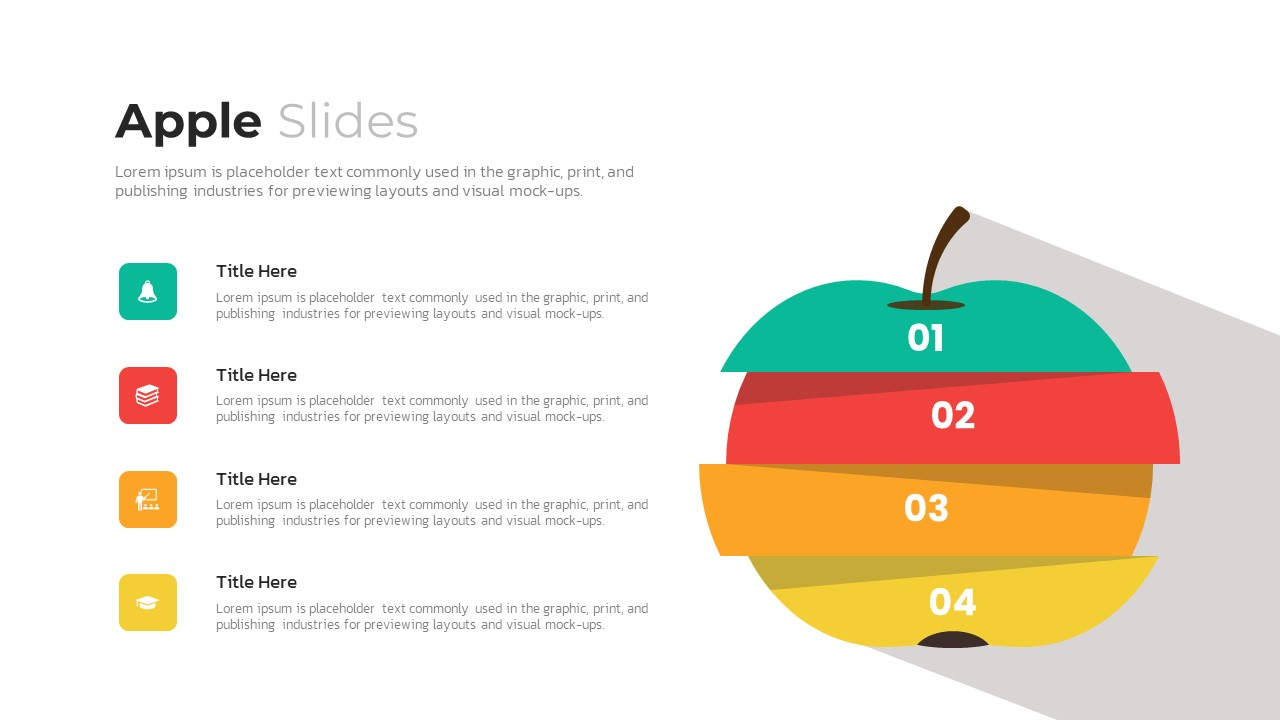
Apple Four-Step Process Infographic Template for PowerPoint & Google Slides
Process
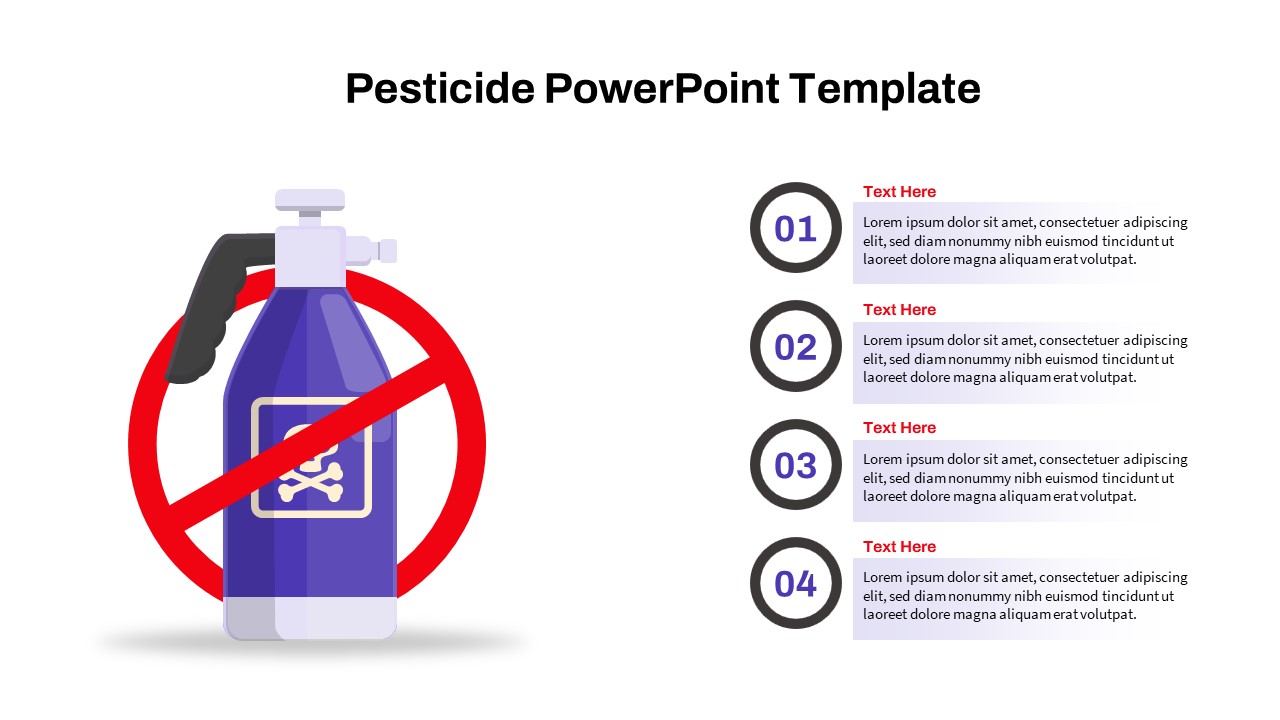
Pesticide Four-Step Process Infographic Template for PowerPoint & Google Slides
Process
Hand-Drawn Four-Step Curved Arrow Diagram Template for PowerPoint & Google Slides
Arrow
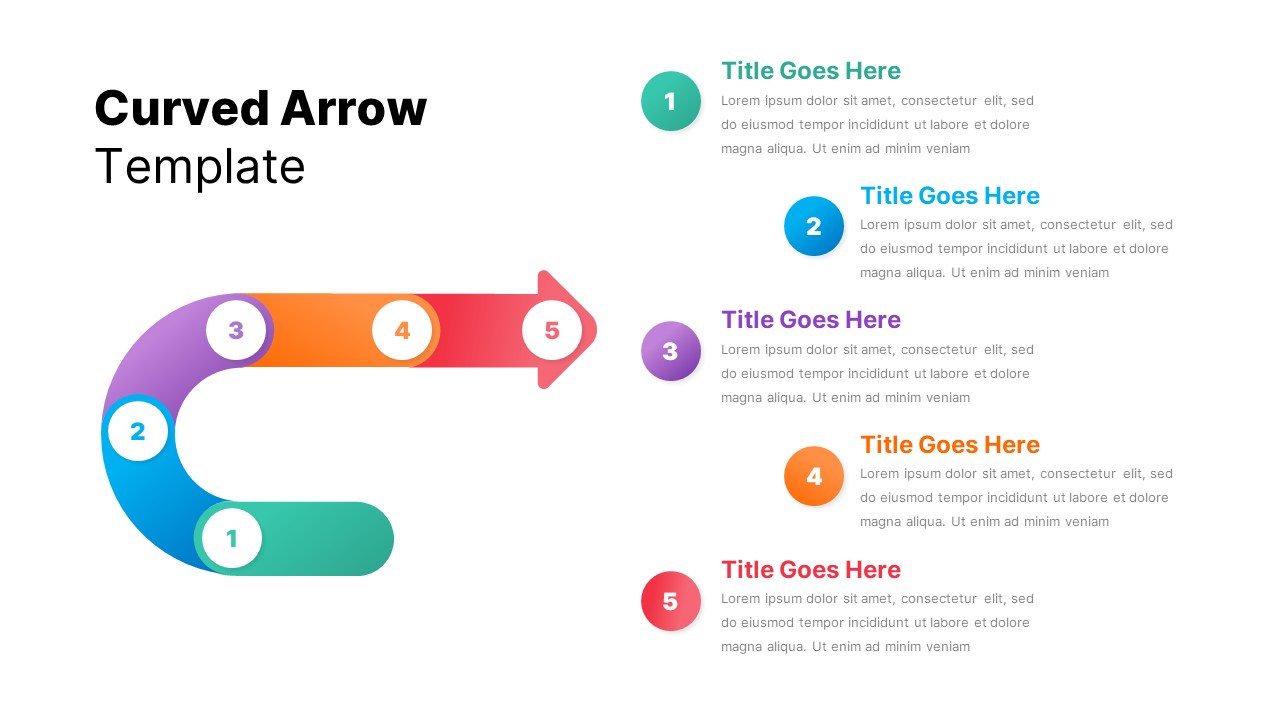
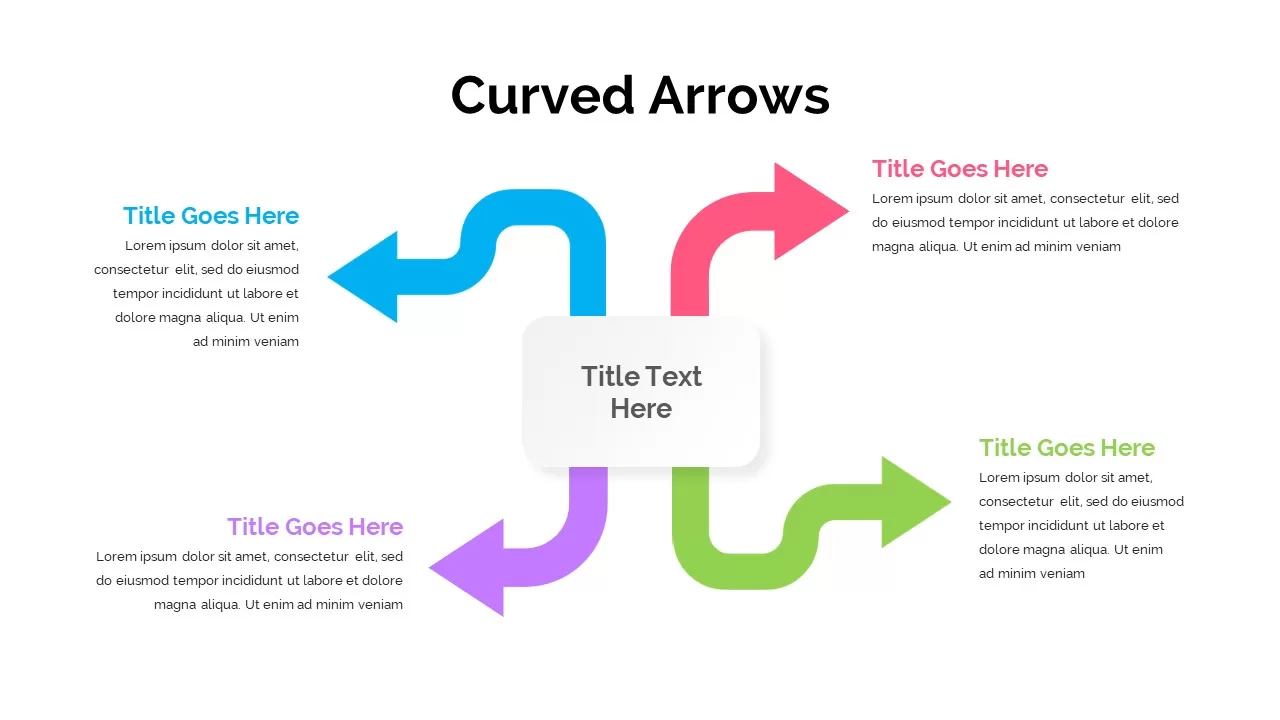
Four-Step Curved Arrow Diagram Template for PowerPoint & Google Slides
Arrow
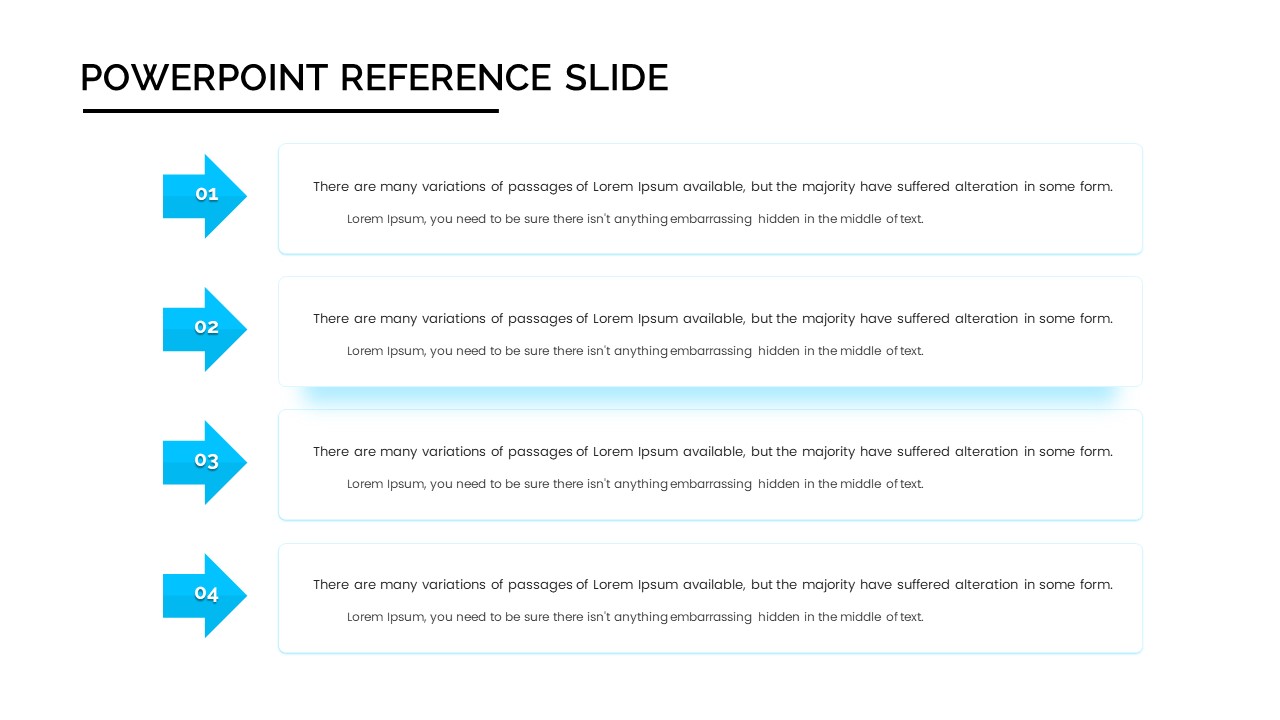
Four-Step Arrow Reference Diagram Slide Template for PowerPoint & Google Slides
Arrow
Four-Section Arrow Infographic Diagram Template for PowerPoint & Google Slides
Arrow
Four-Stage Circle Arrow Infographic Template for PowerPoint & Google Slides
Circular
Four-Stage Circle Arrow Infographic Template for PowerPoint & Google Slides
Circular
Shape Loop Four-Step Infographic Slide Template for PowerPoint & Google Slides
Process
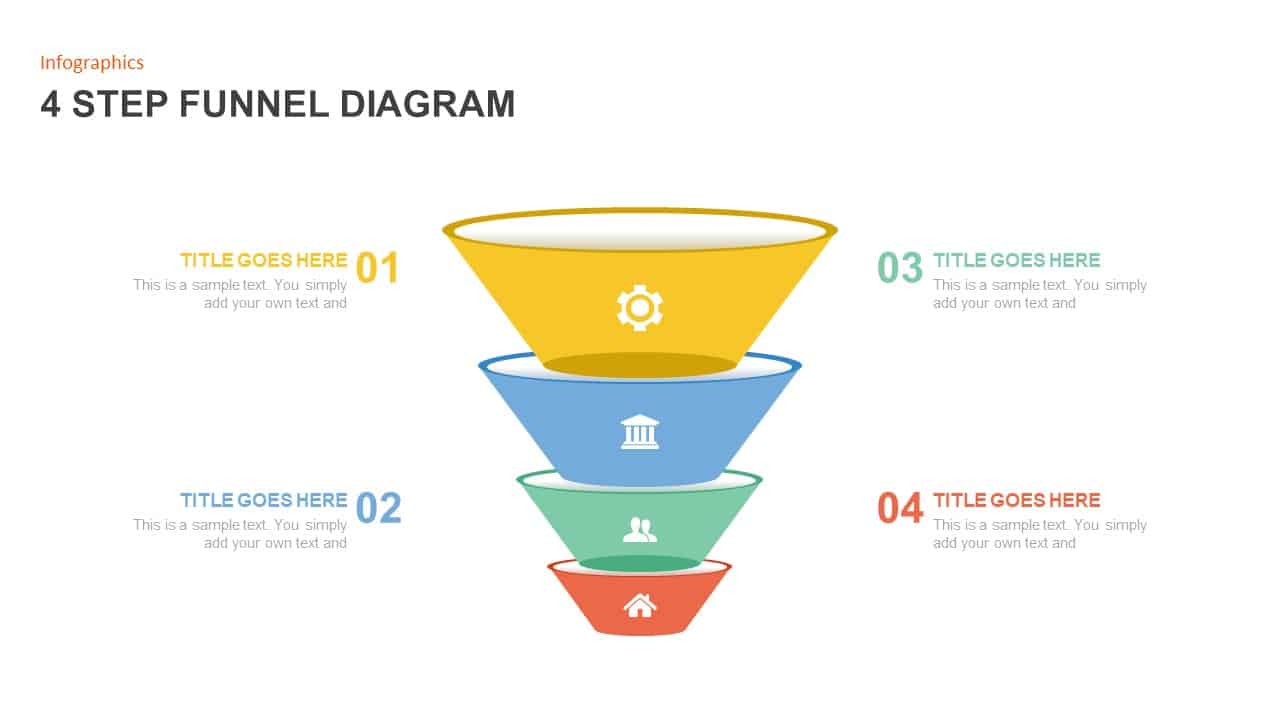
Four-Step Funnel Infographic Pack Template for PowerPoint & Google Slides
Funnel
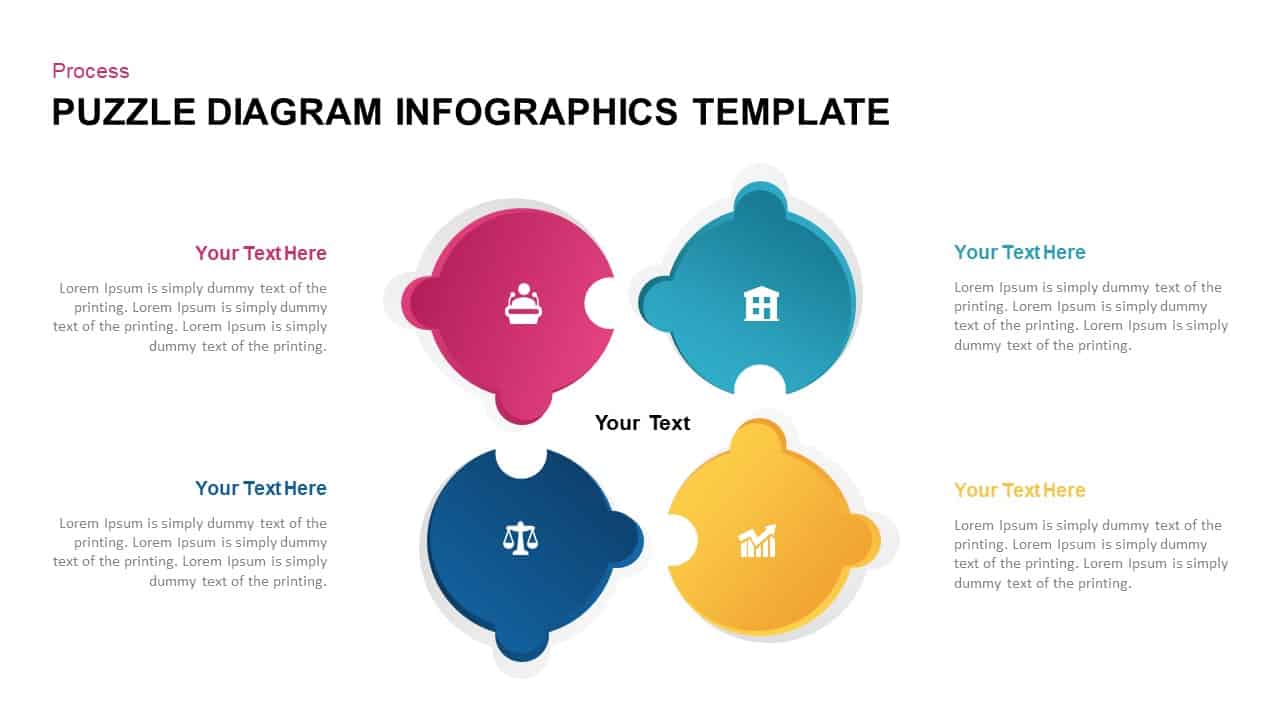
Four-Step Puzzle Diagram Infographic Template for PowerPoint & Google Slides
Process
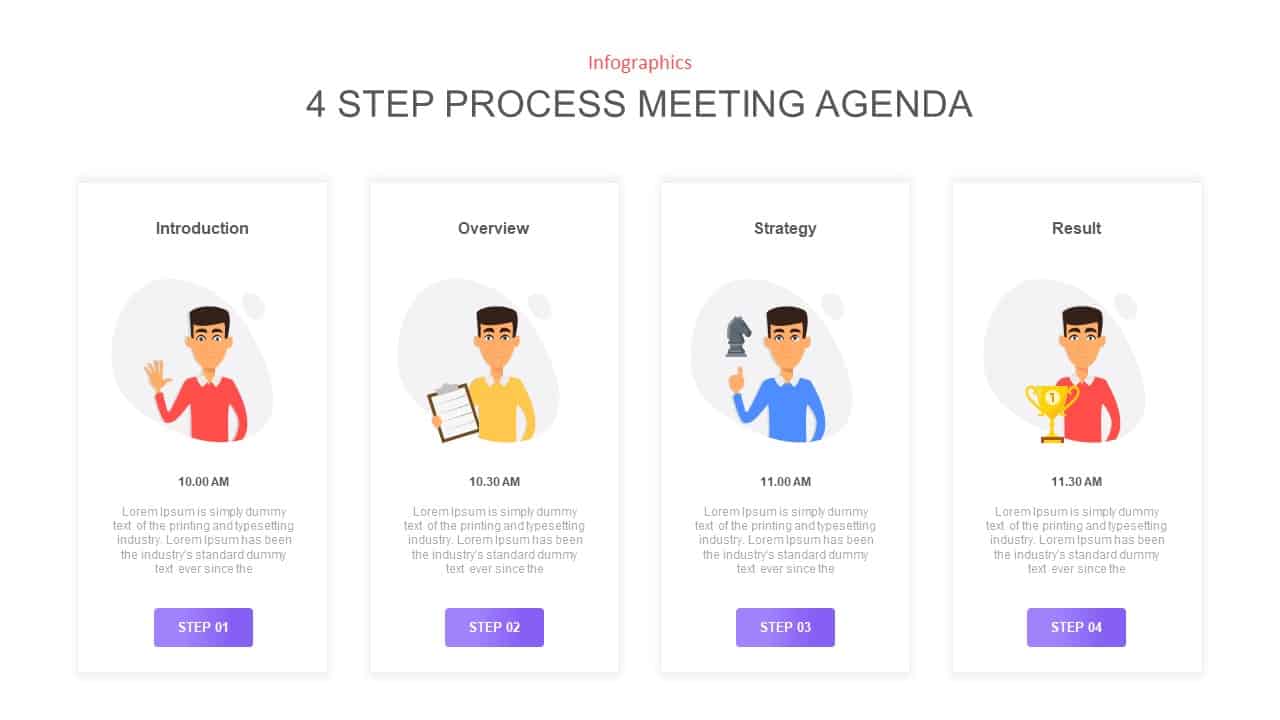
Four-Step Meeting Agenda Infographic Template for PowerPoint & Google Slides
Agenda
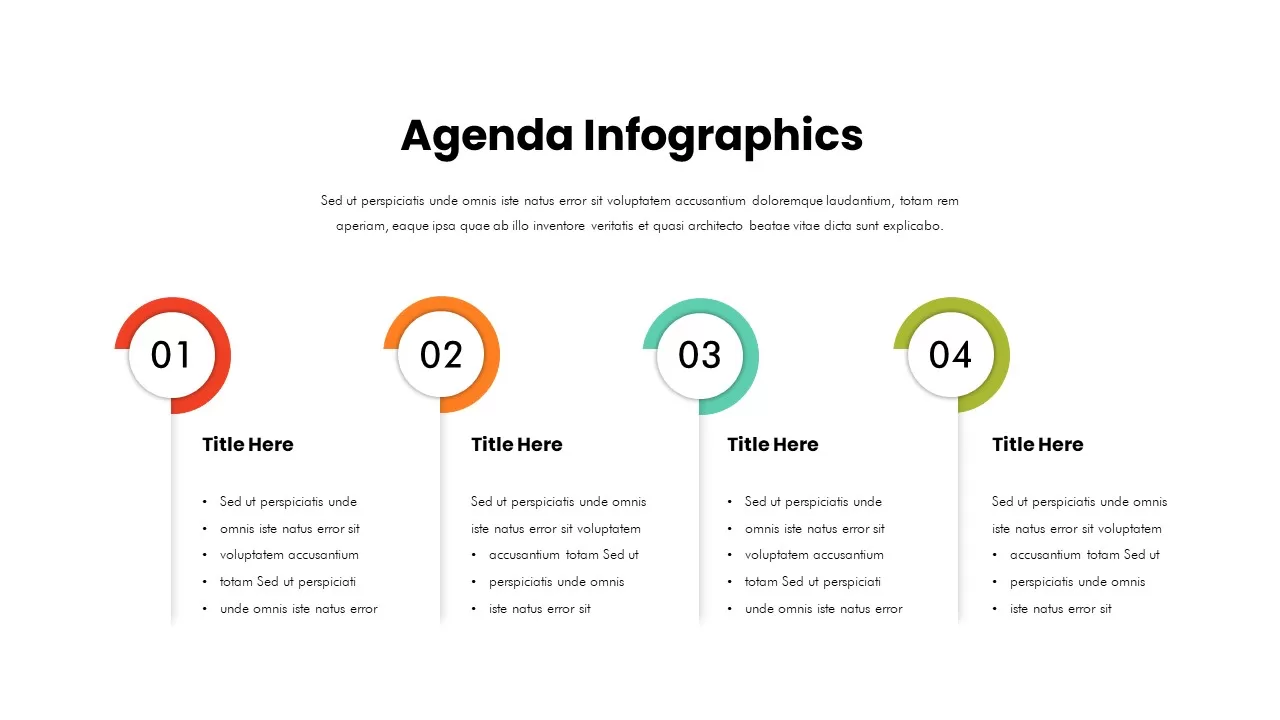
Free Modern Four-Step Agenda Infographic Template for PowerPoint & Google Slides
Agenda
Free
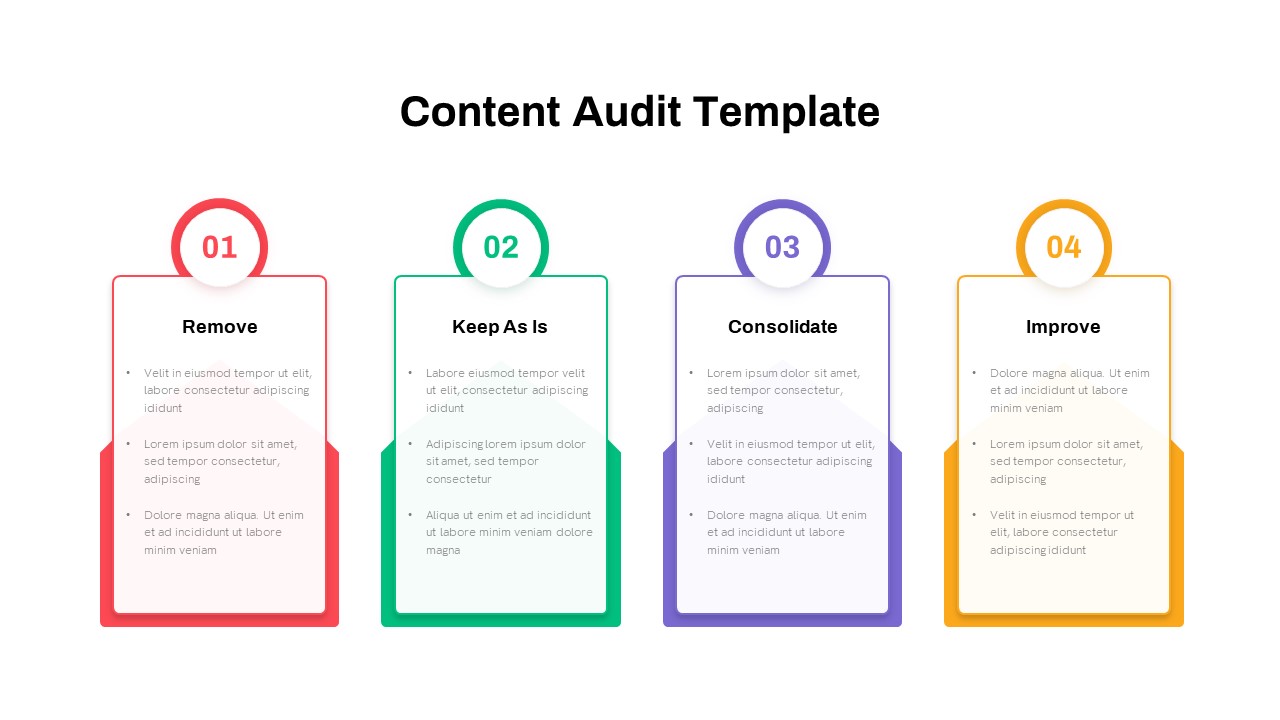
Four-Step Content Audit Infographic Template for PowerPoint & Google Slides
Process

Pie Segment Diagram Four-Step Process Template for PowerPoint & Google Slides
Pie/Donut
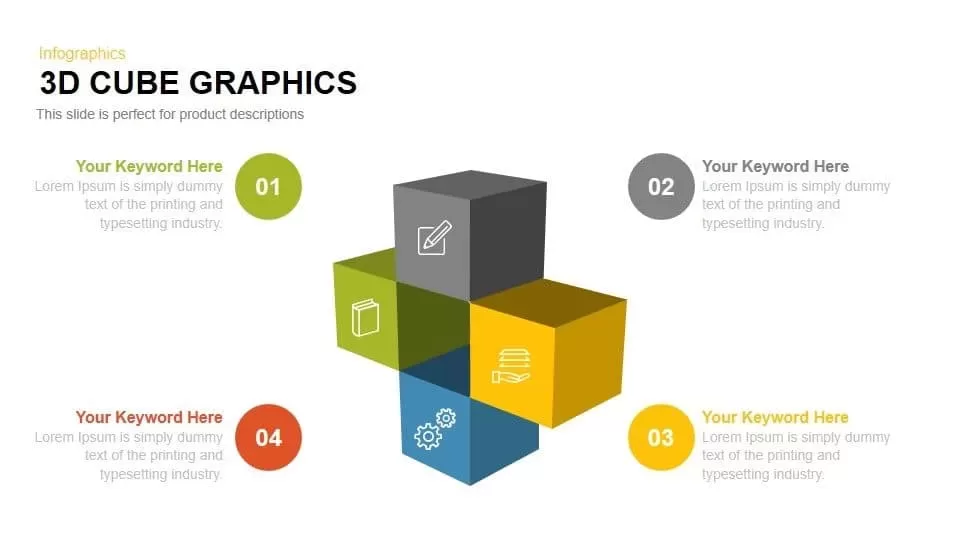
3D Cube Graphics for Four-Step Process Template for PowerPoint & Google Slides
Process
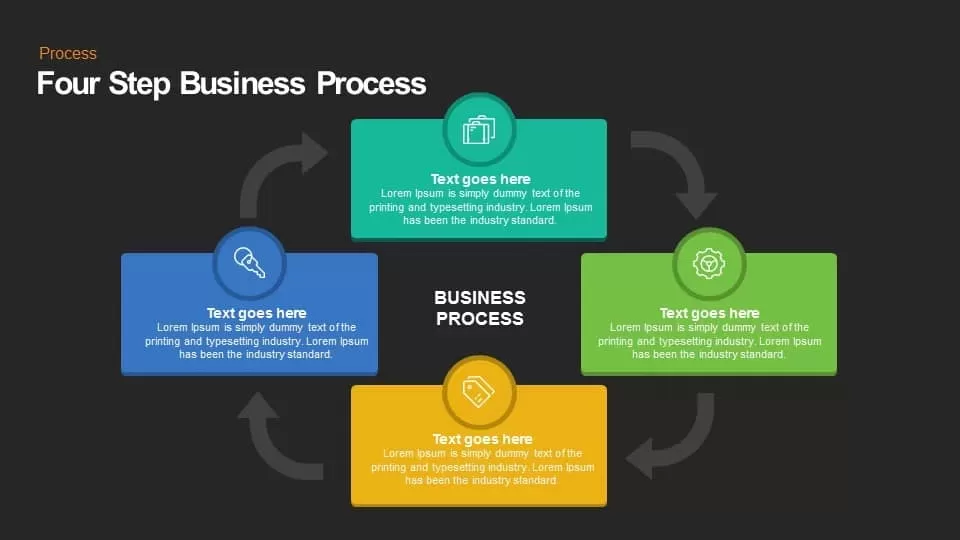
Four Step Business Process template for PowerPoint & Google Slides
Process
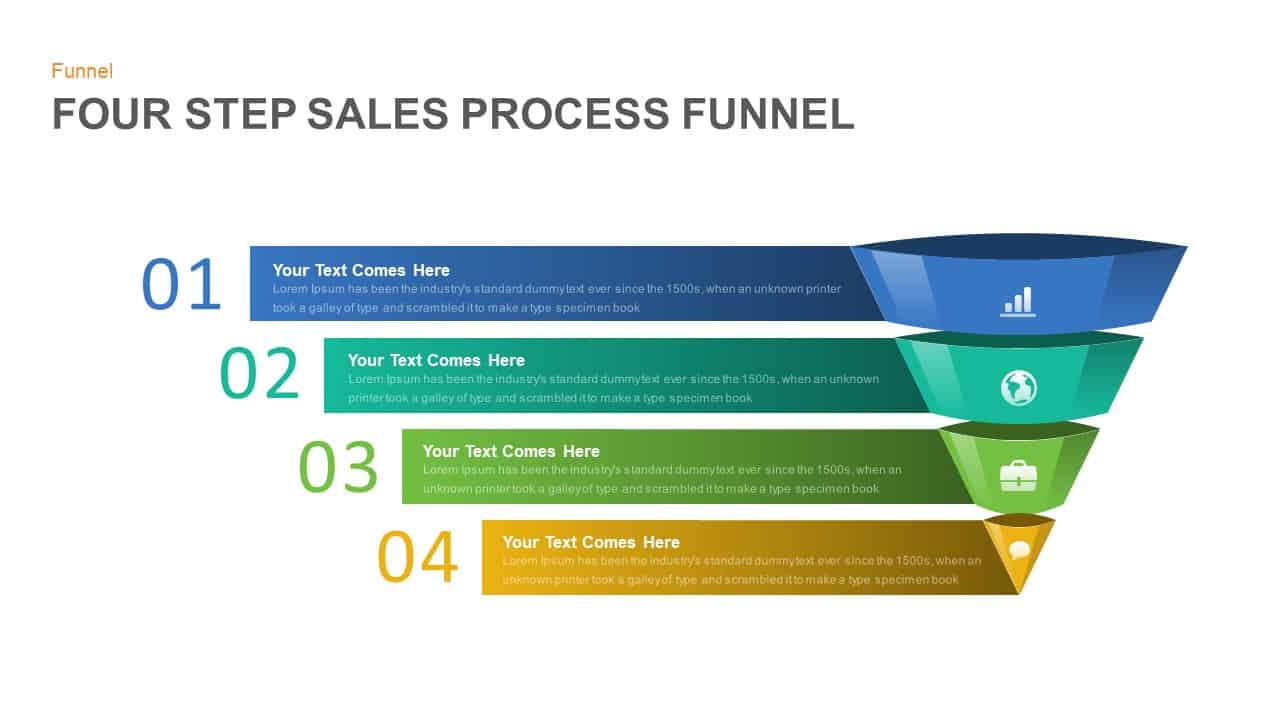
Four Step Sales Process Funnel Template for PowerPoint & Google Slides
Funnel
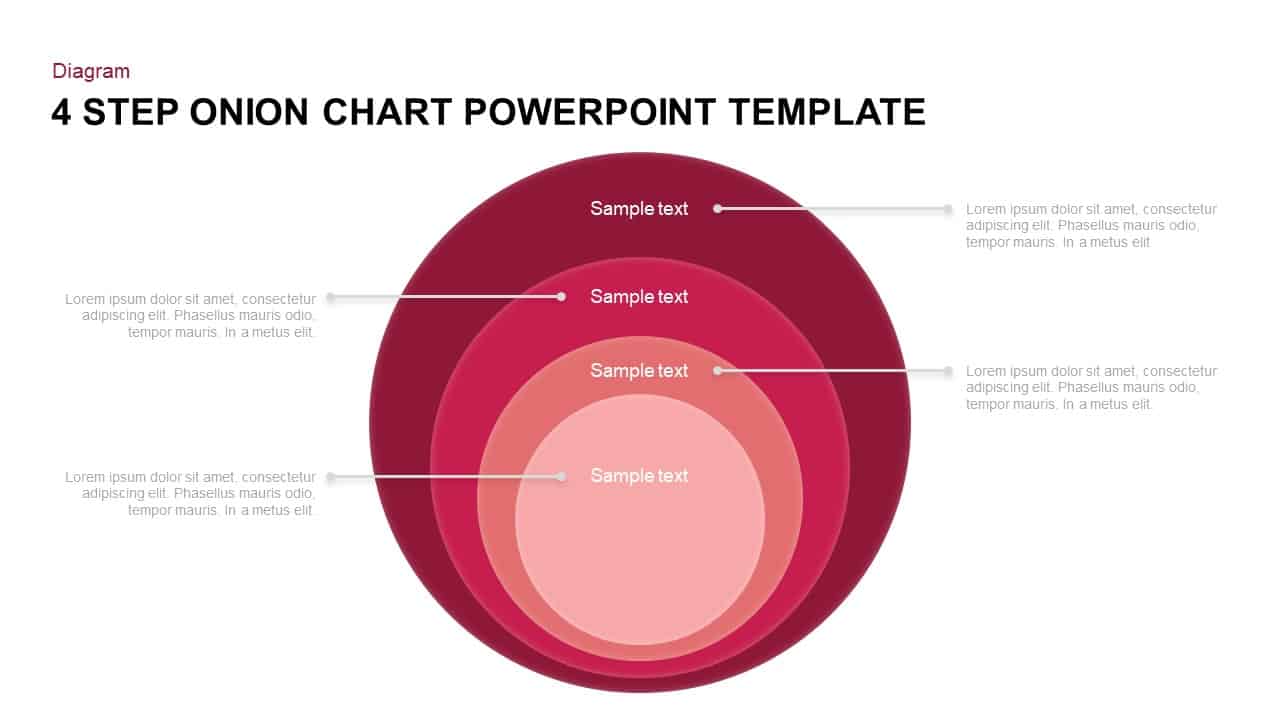
Four-Step Onion Chart Process Template for PowerPoint & Google Slides
Charts
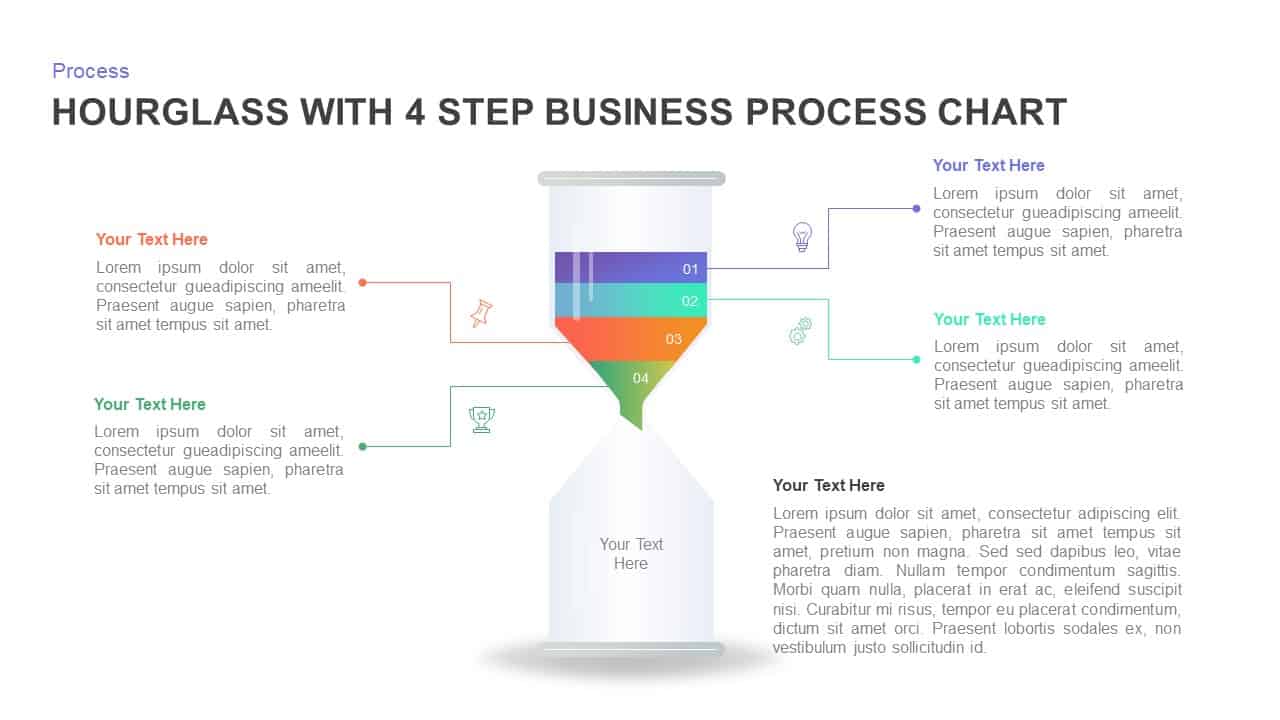
Four-Step Hourglass Business Process Template for PowerPoint & Google Slides
Process
Hand-Held Four-Step Process Diagram Template for PowerPoint & Google Slides
Process
Four-Step Circular Process Infographics Template for PowerPoint & Google Slides
Circular
Folded Square Four-Step Process Template for PowerPoint & Google Slides
Process
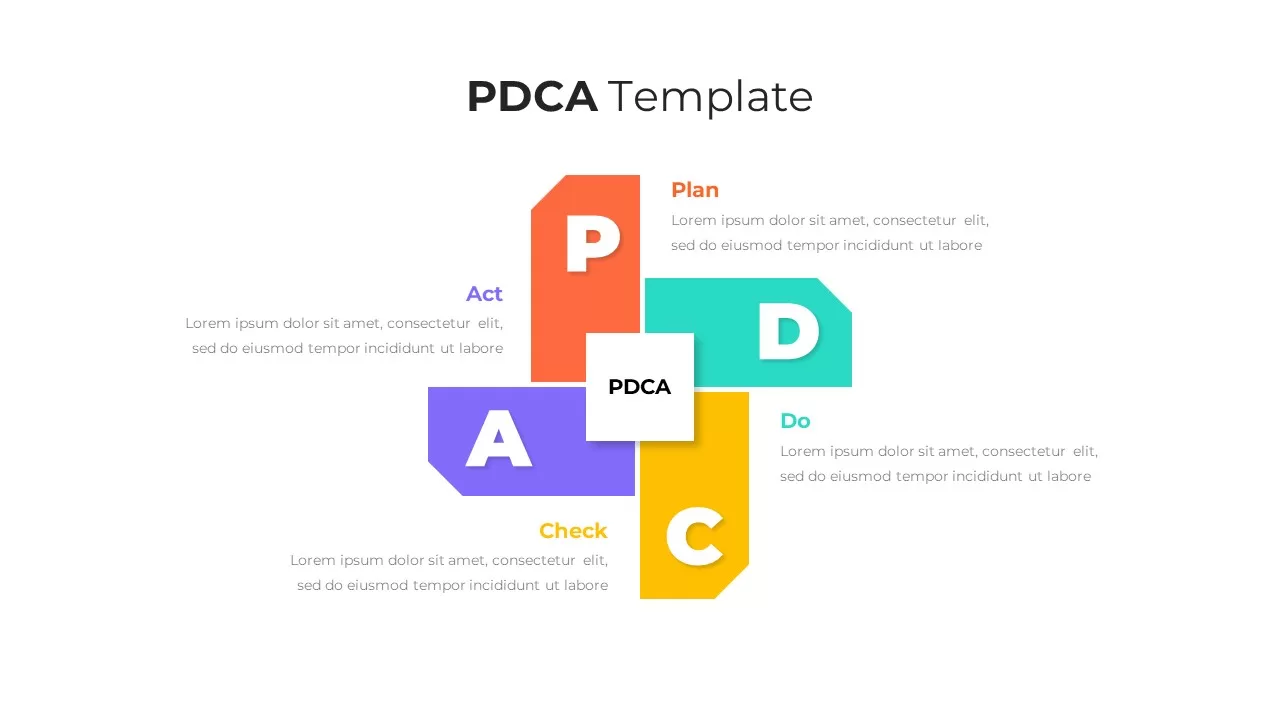
Elegant PDCA Four-Step Process Diagram Template for PowerPoint & Google Slides
Process
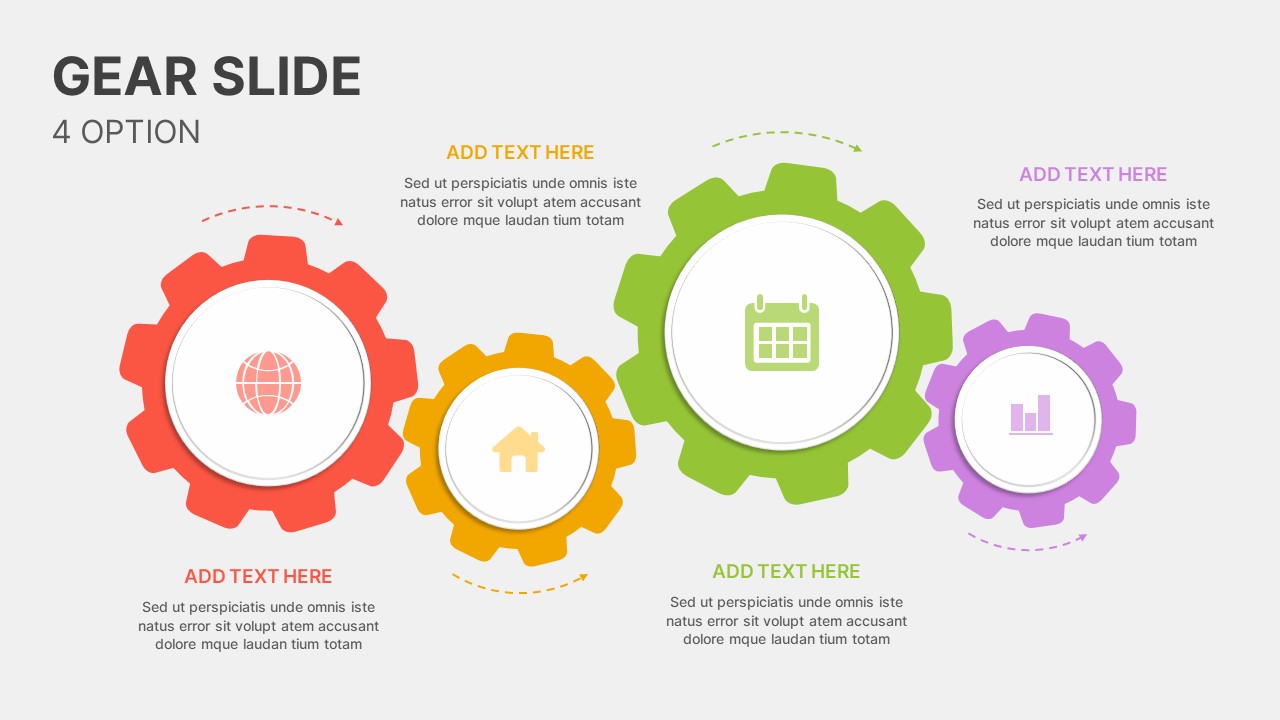
Dynamic Four-Step Gear Process Template for PowerPoint & Google Slides
Process
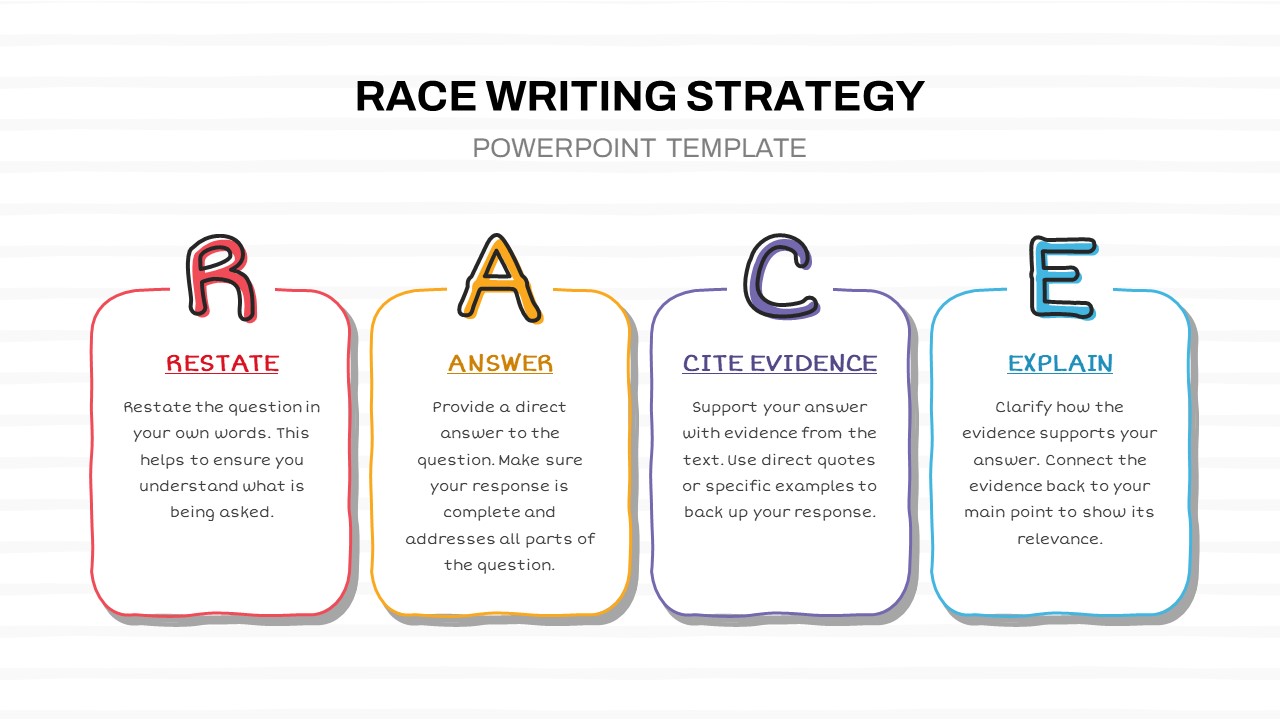
RACE Writing Strategy Four-Step Process Template for PowerPoint & Google Slides
Process
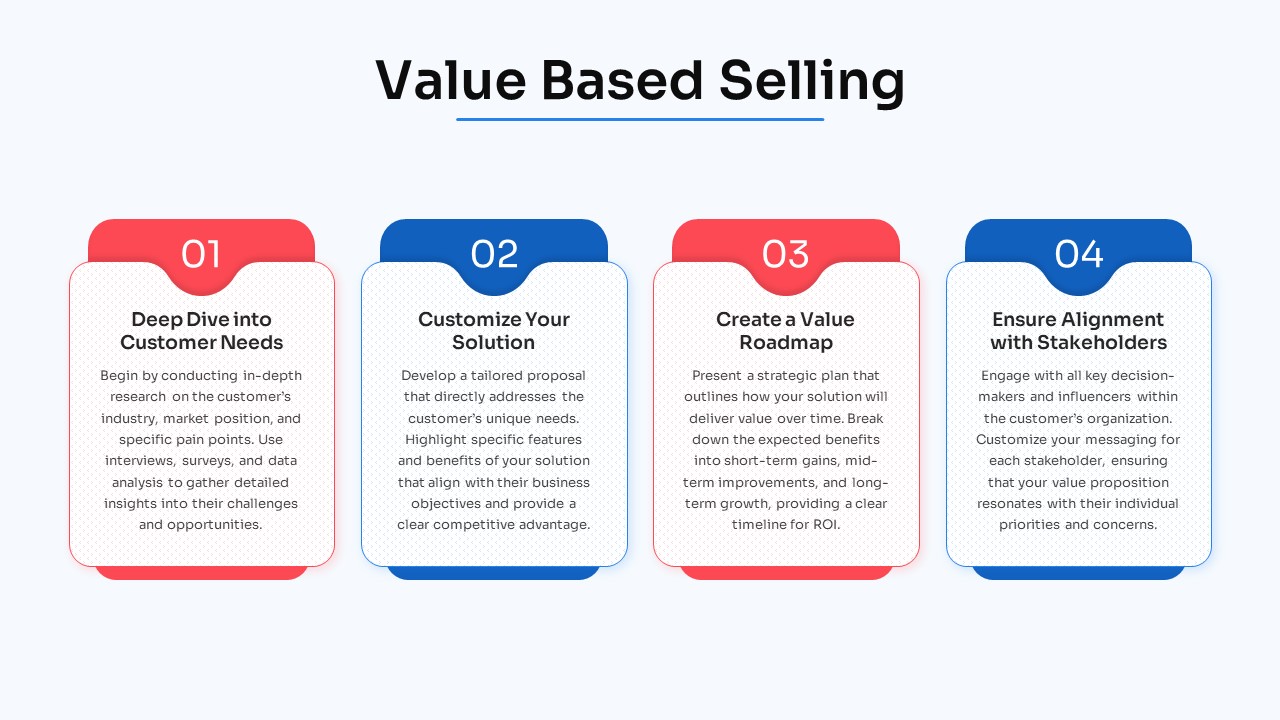
Free Four-Step Value-Based Selling Process Template for PowerPoint & Google Slides
Process
Free
Machine Learning Four-Step Process Template for PowerPoint & Google Slides
Machine Learning
Dynamic Growth Arrow Step Infographic Template for PowerPoint & Google Slides
Process
5-Step Curved Arrow Infographic Template for PowerPoint & Google Slides
Arrow
6-Step Arrow Process Diagram Template for PowerPoint & Google Slides
Process
Six-Step Linear Arrow Process Diagram Template for PowerPoint & Google Slides
Process
Three-Step Curved Arrow Process Diagram Template for PowerPoint & Google Slides
Arrow
Four-Circle Business Process Infographic Template for PowerPoint & Google Slides
Circular
Colorful Four-Stage Infographic Process Template for PowerPoint & Google Slides
Process
3D Four Arrow Infographics Diagram Template for PowerPoint & Google Slides
Arrow
Four Arrow Square Infographics Template for PowerPoint & Google Slides
Arrow
Four Swoosh Arrow Infographics template for PowerPoint & Google Slides
Arrow
Four Directional Arrow Diagram Template for PowerPoint & Google Slides
Arrow
3D Four-Directional Arrow Infographics Template for PowerPoint & Google Slides
Arrow
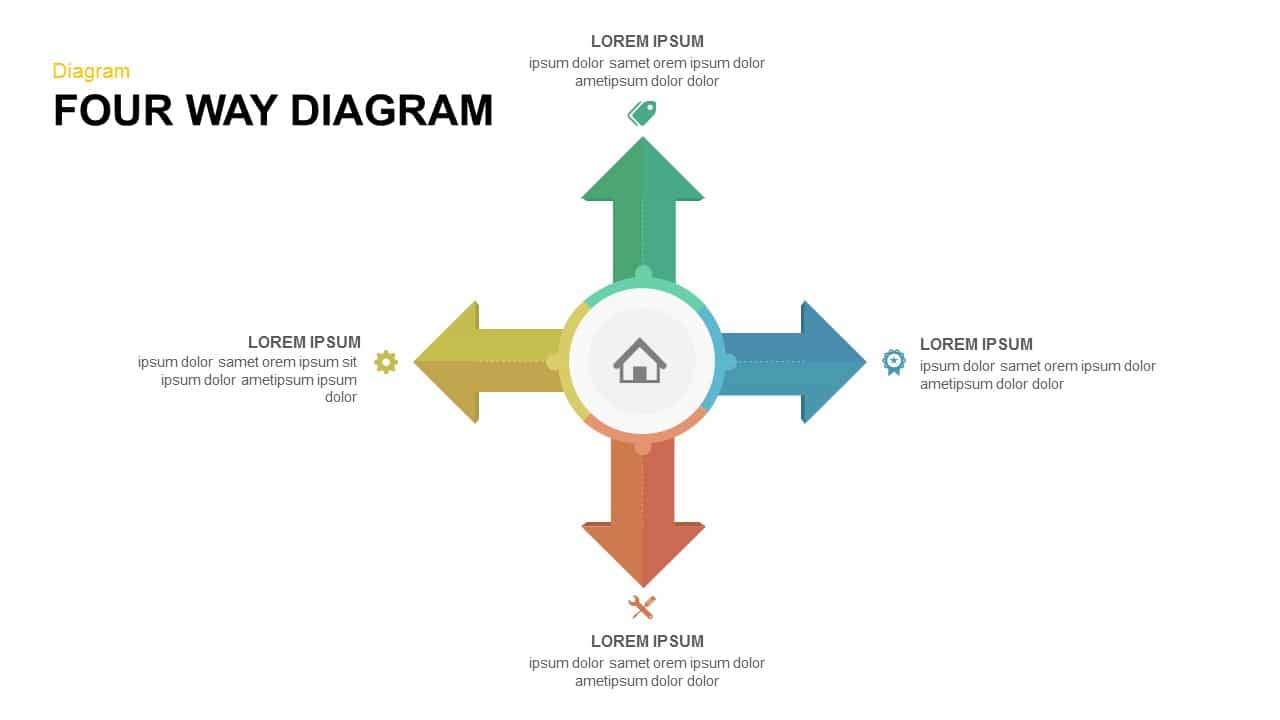
Four-Way Directional Arrow Diagram Template for PowerPoint & Google Slides
Arrow
Four-Point Arrow Cycle Diagram Template for PowerPoint & Google Slides
Arrow

Four-Staged Business Arrow Diagram Template for PowerPoint & Google Slides
Process
Four-Segment Circular Arrow Cycle Template for PowerPoint & Google Slides
Circular
Four-Arrow Curved Hub-and-Spoke Diagram Template for PowerPoint & Google Slides
Arrow
Curved Arrow Process Flow Infographic Template for PowerPoint & Google Slides
Process
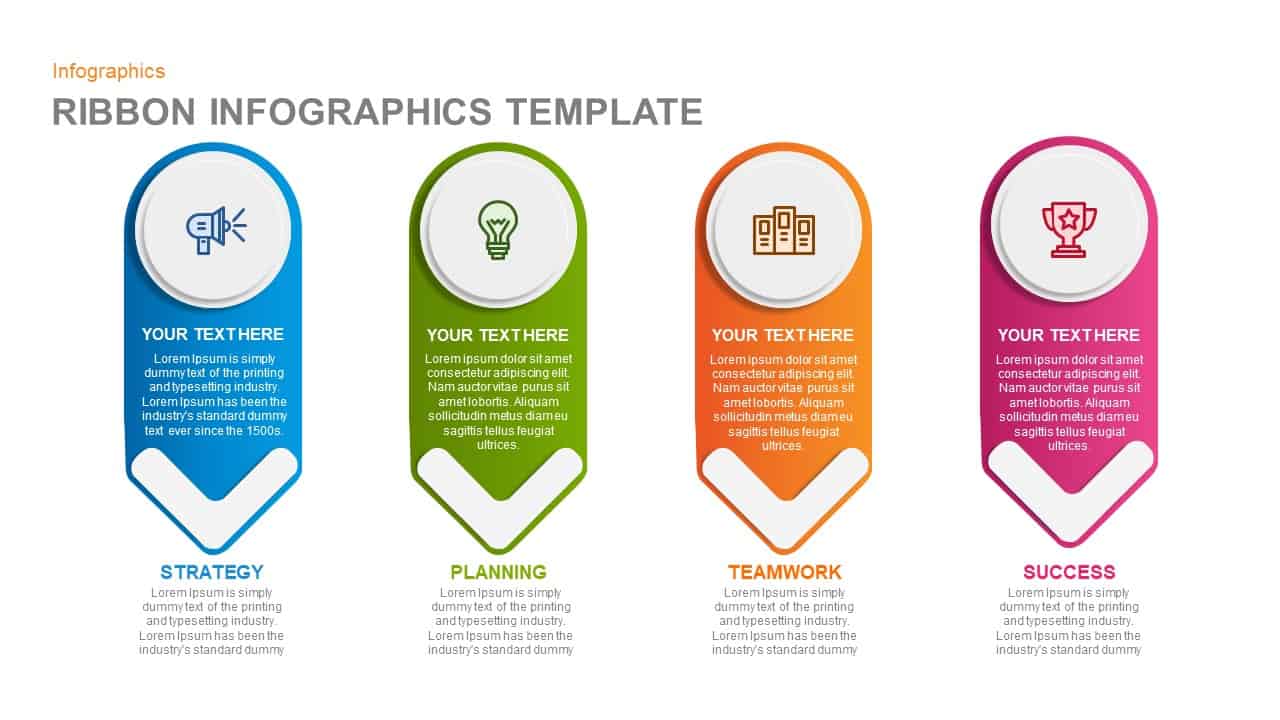
Ribbon Infographics Step-by-Step Process Template for PowerPoint & Google Slides
Process
Sales Playbook Step-by-Step Process Template for PowerPoint & Google Slides
Process
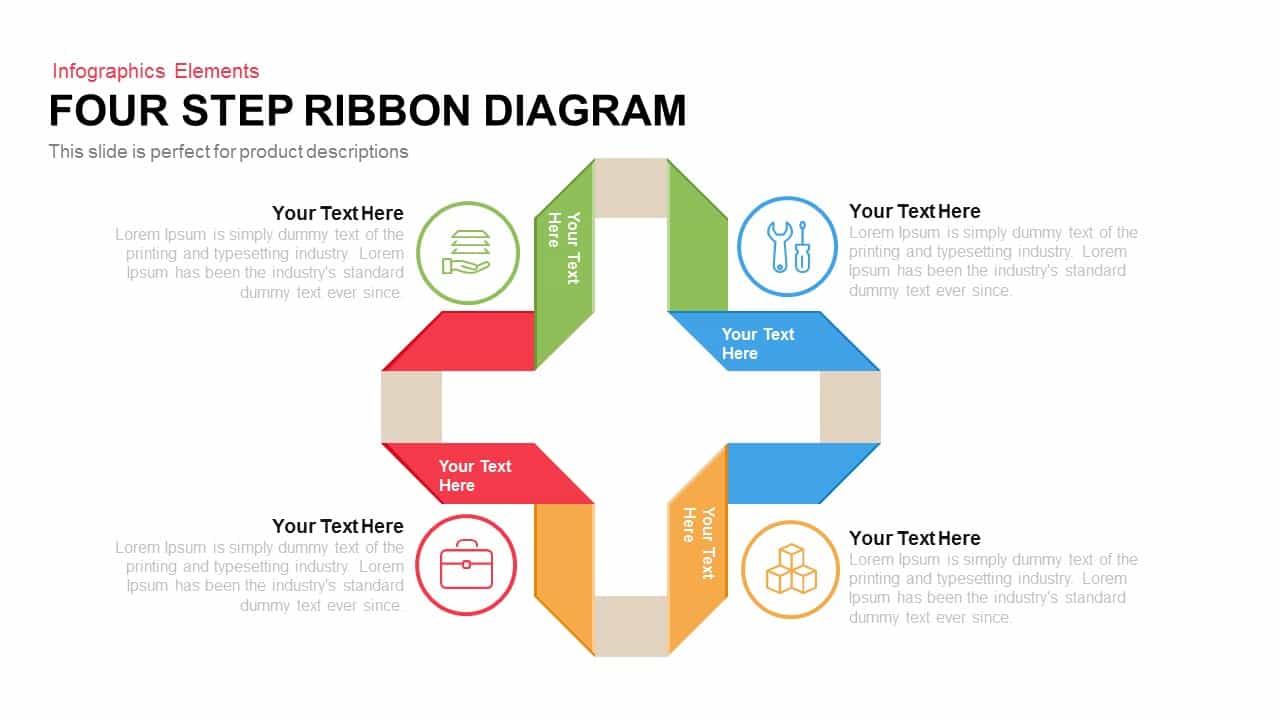
Four Step Ribbon Diagram Template for PowerPoint & Google Slides
Infographics
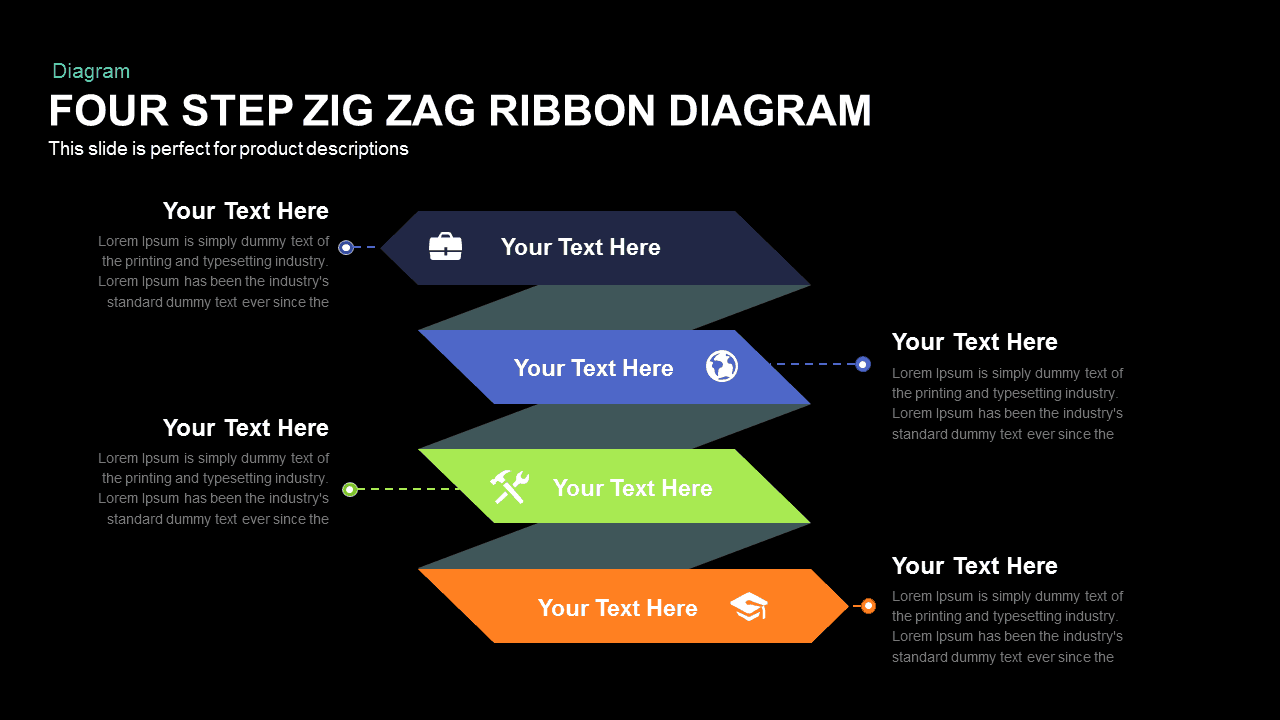
Four-Step Zigzag Ribbon Diagram template for PowerPoint & Google Slides
Arrow
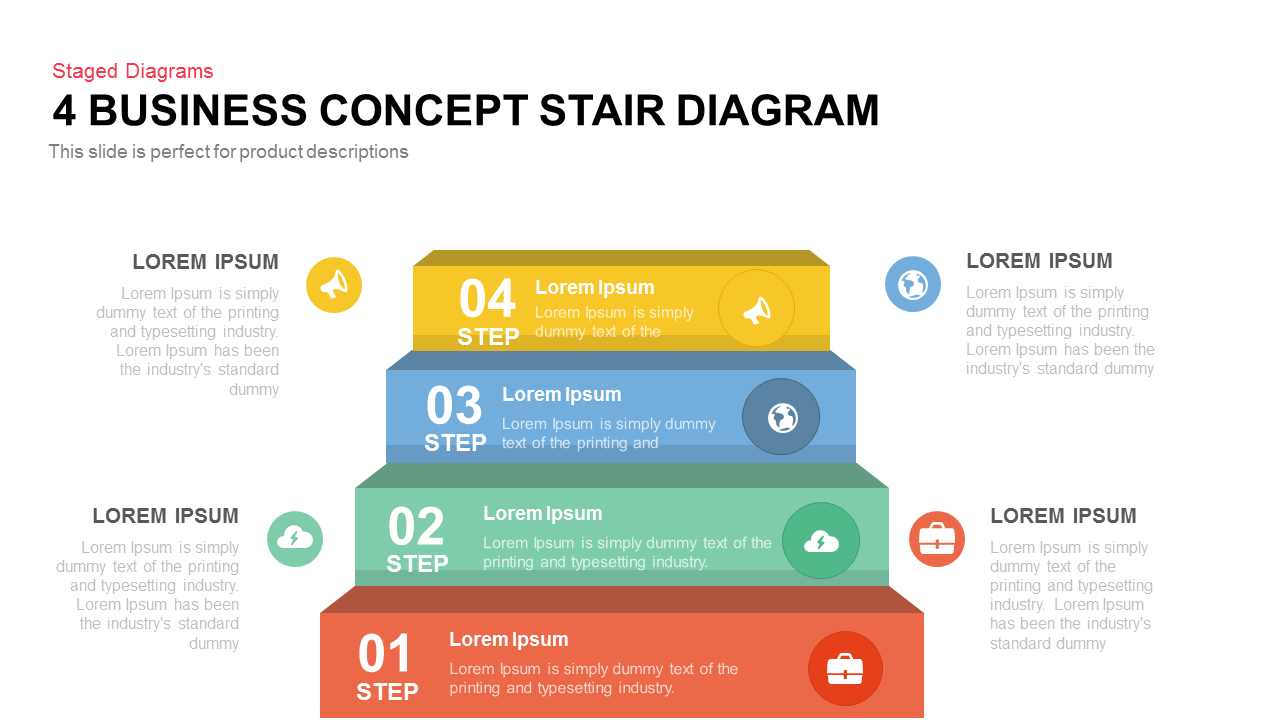
Four-Step Business Staircase Diagram template for PowerPoint & Google Slides
Process
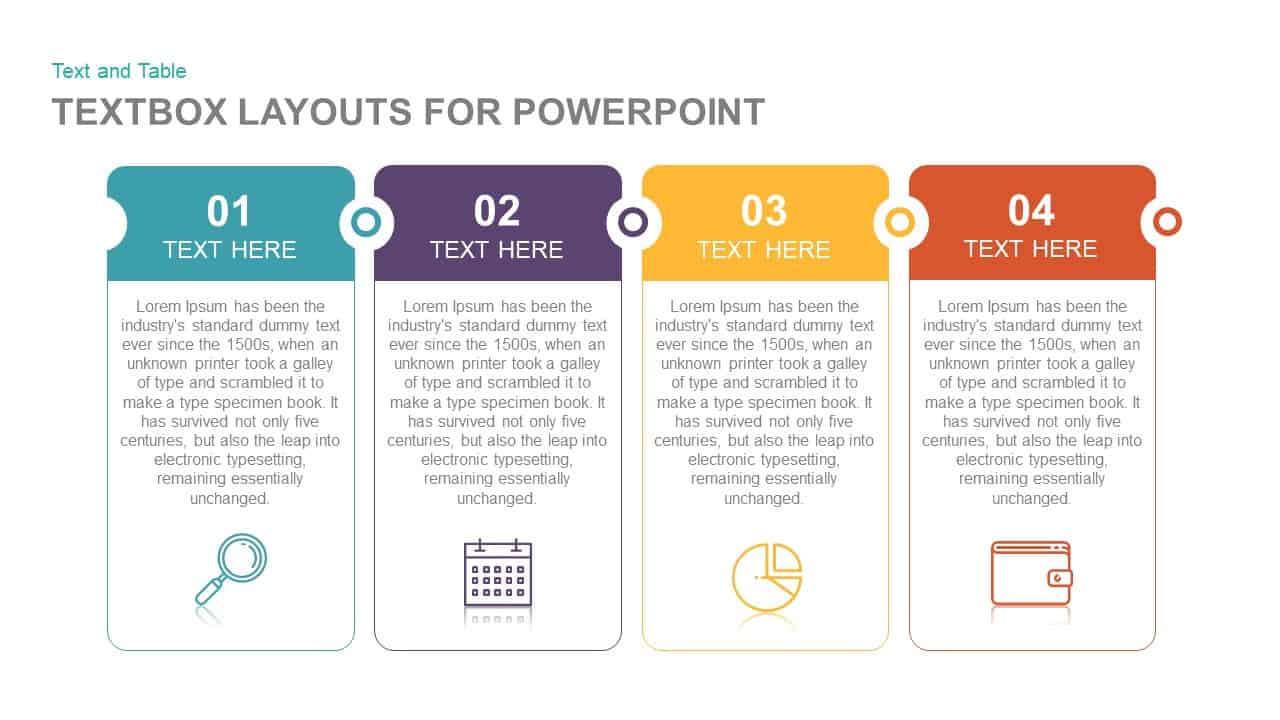
Four-Step Textbox Layout Diagram Template for PowerPoint & Google Slides
Business Report
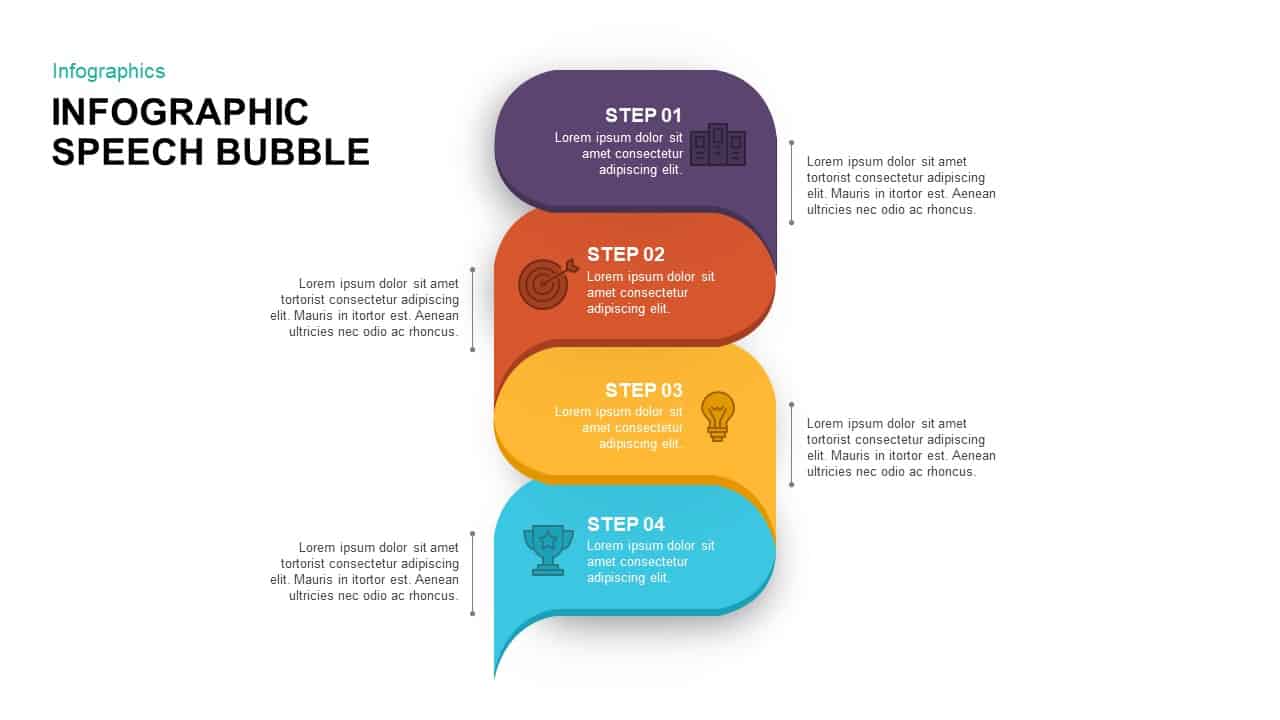
Four-Step Speech Bubble Diagram Template for PowerPoint & Google Slides
Process
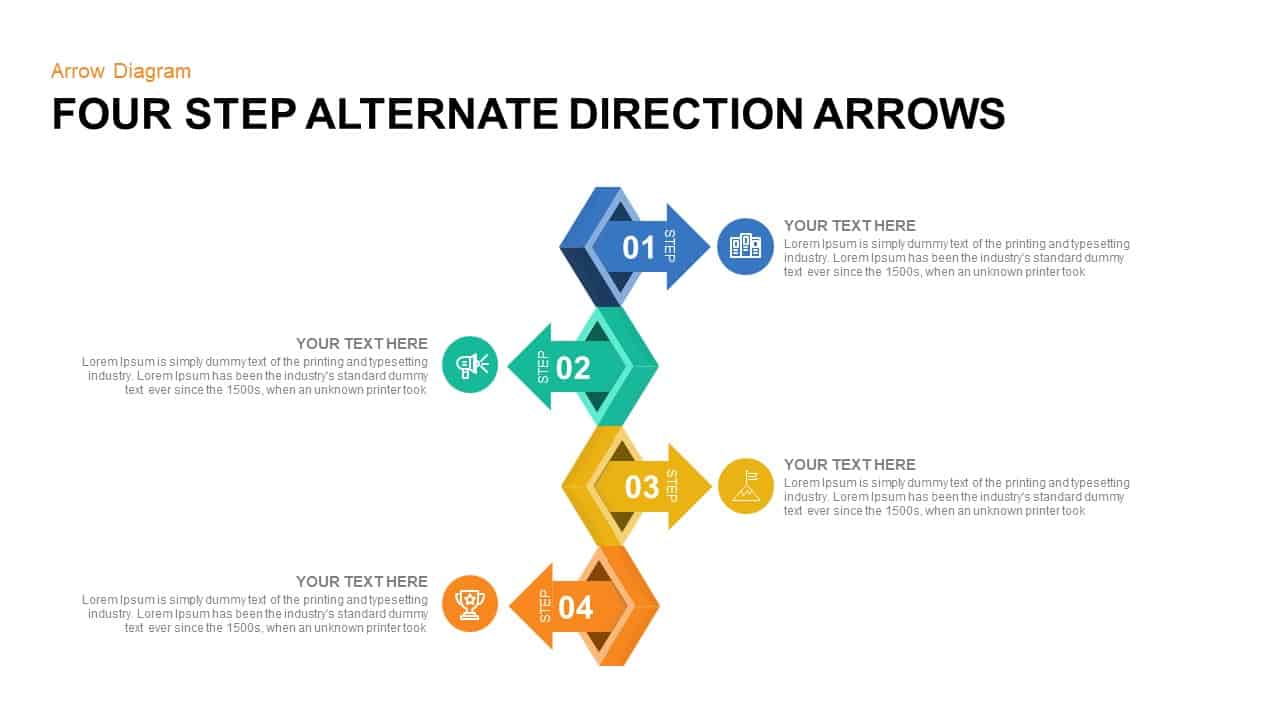
Four Step Alternate Direction Arrows Template for PowerPoint & Google Slides
Arrow
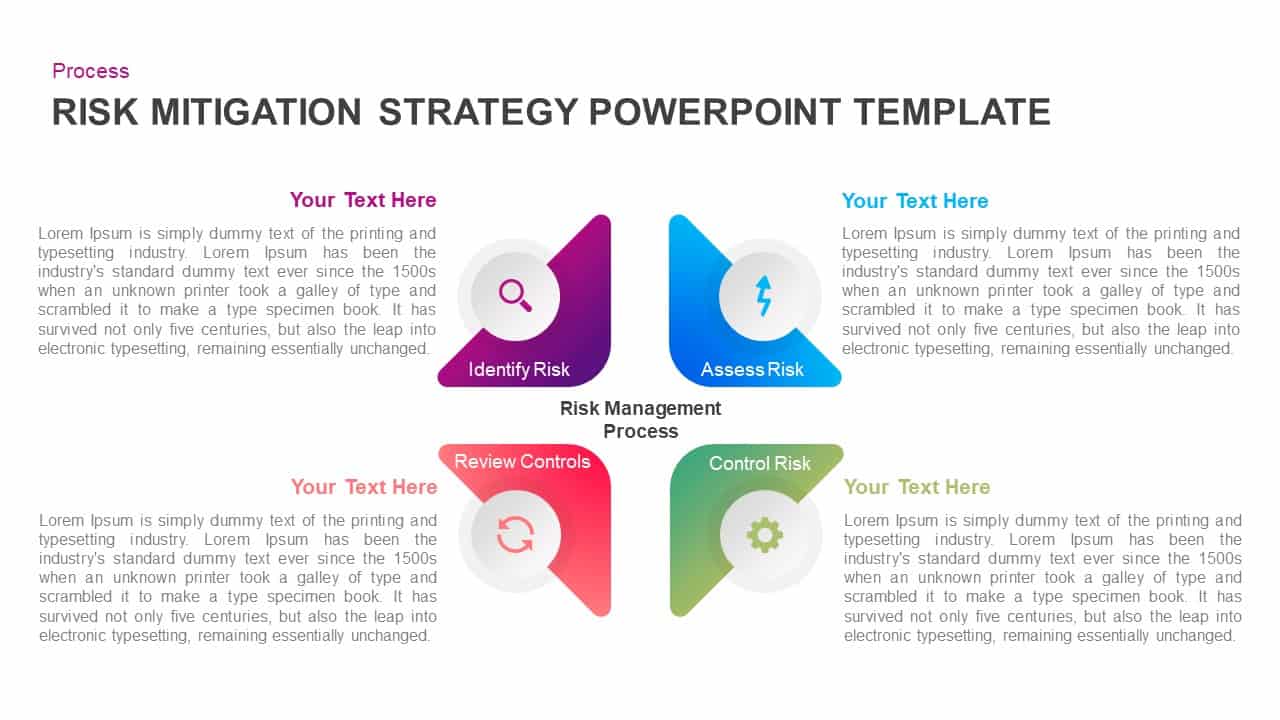
Four-Step Risk Mitigation Strategy Template for PowerPoint & Google Slides
Process
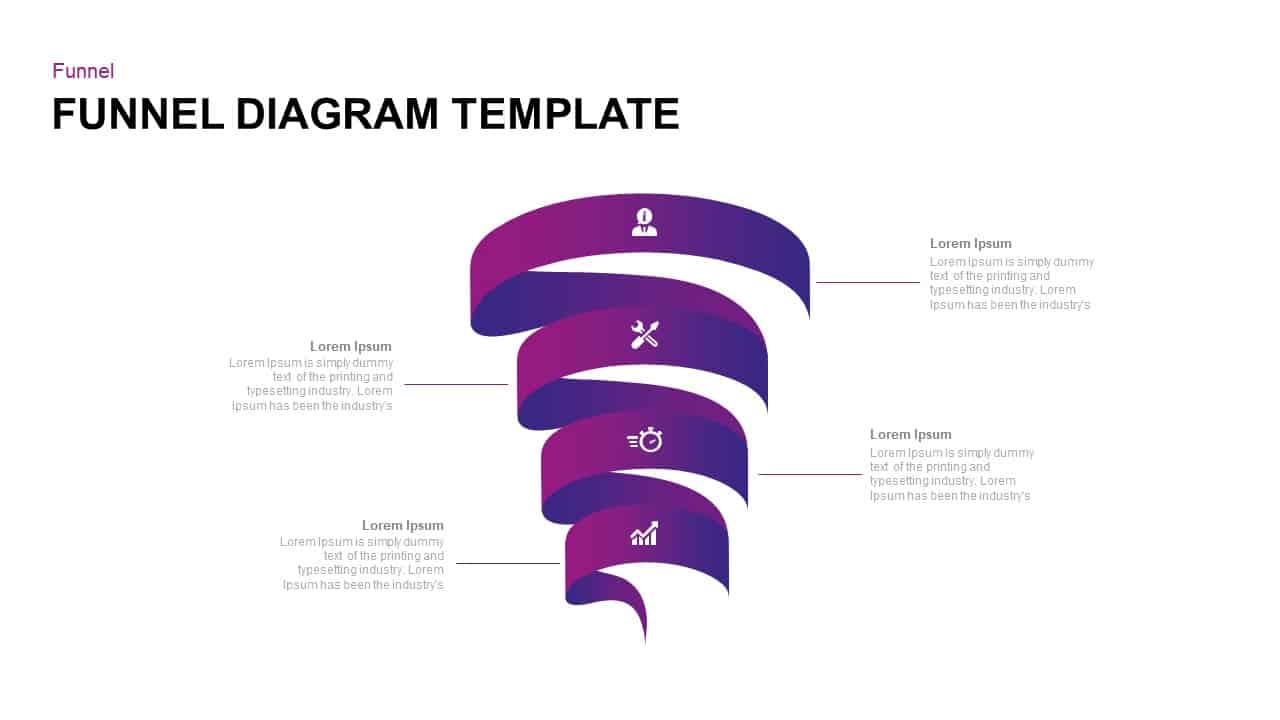
Four-Step Spiral Funnel Diagram Template for PowerPoint & Google Slides
Funnel
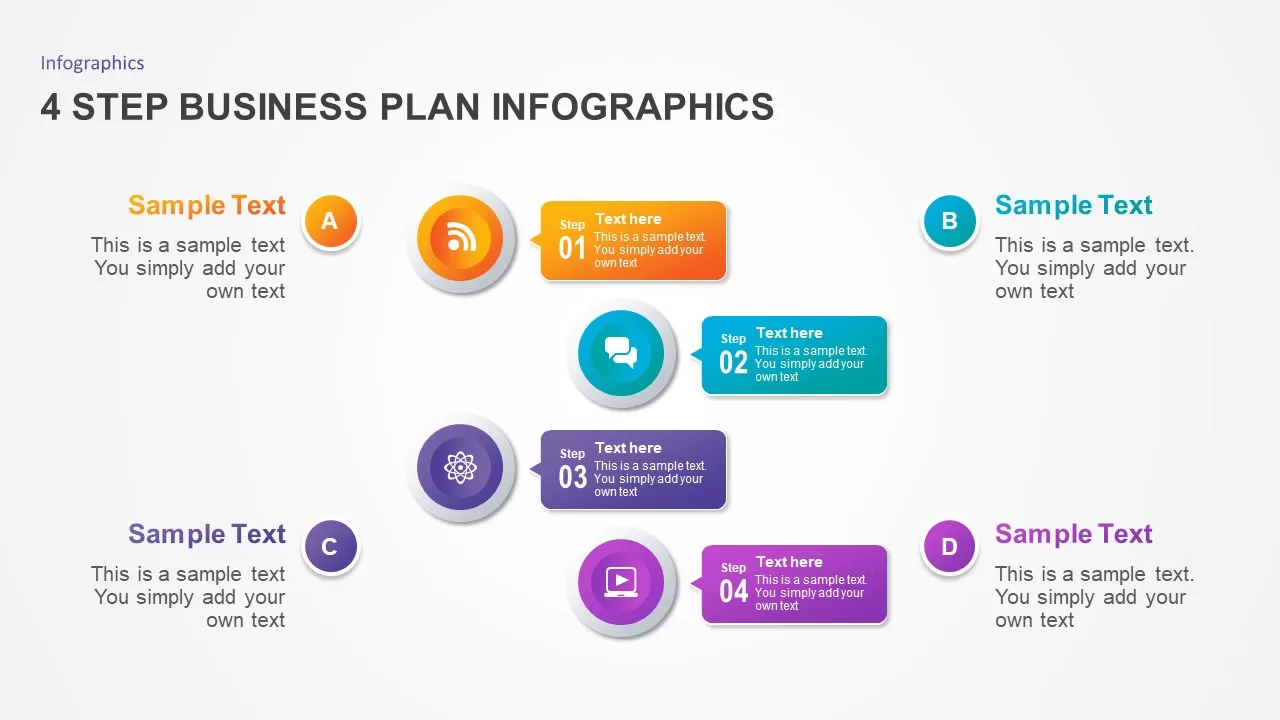
Four-Step Business Plan Infographics Template for PowerPoint & Google Slides
Business Plan
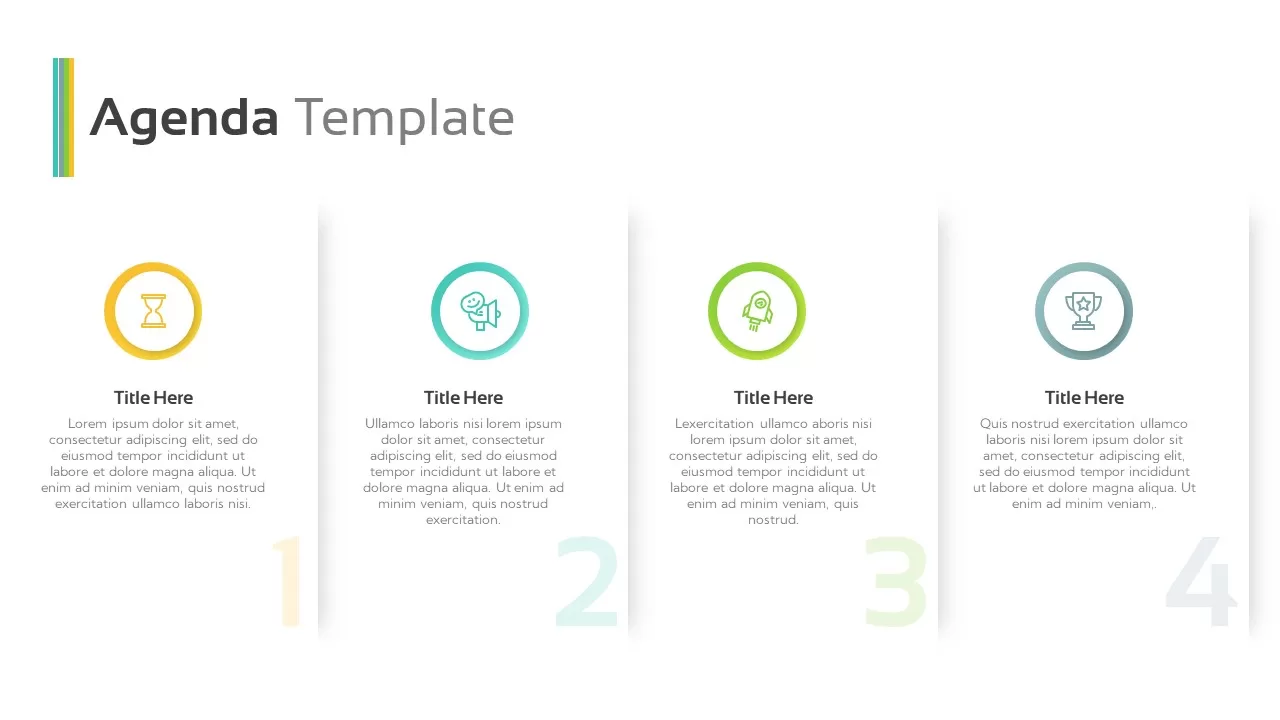
Modern Four-Step Agenda Slide Layout Template for PowerPoint & Google Slides
Agenda
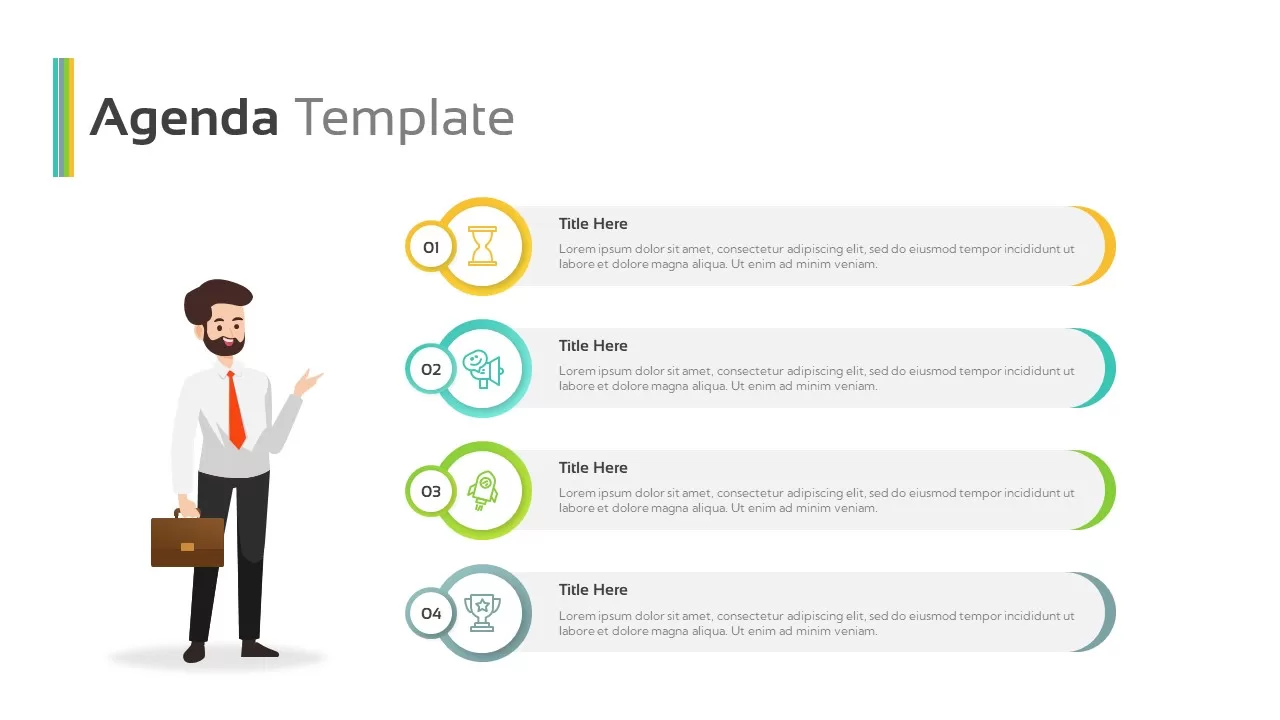
Four-Step Business Agenda Slide Layout Template for PowerPoint & Google Slides
Agenda
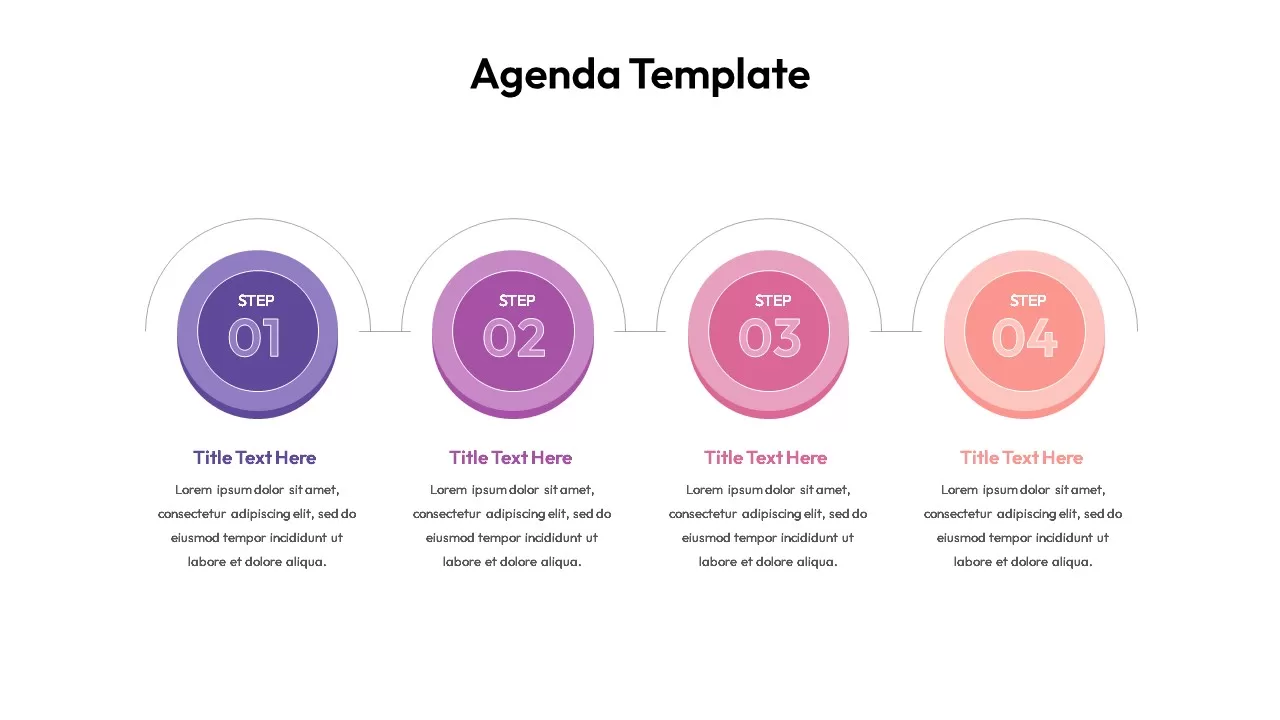
Gradient Four-Step Roadmap Diagram Template for PowerPoint & Google Slides
Roadmap
Layered Circular Four-Step Agenda Slide Layout Template for PowerPoint & Google Slides
Agenda
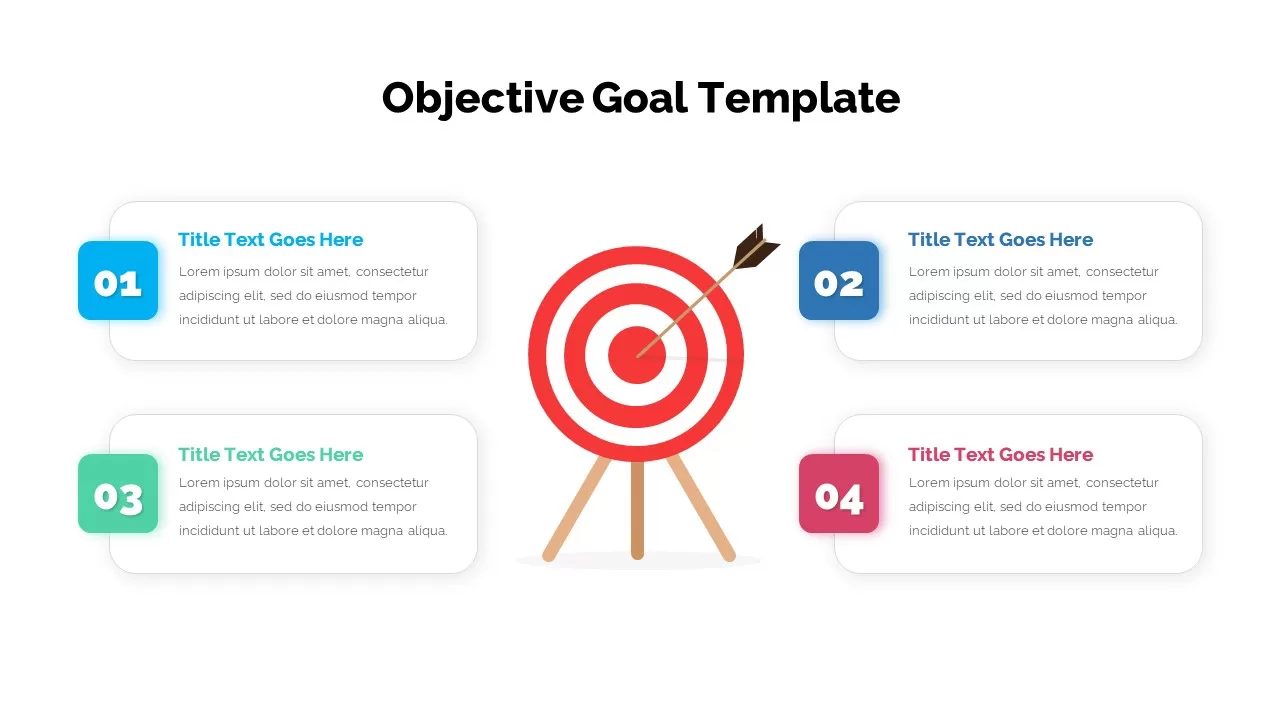
Four-Step Objective Goal Diagram Template for PowerPoint & Google Slides
Goals
Four-Step Numbered Table of Contents Template for PowerPoint & Google Slides
Agenda
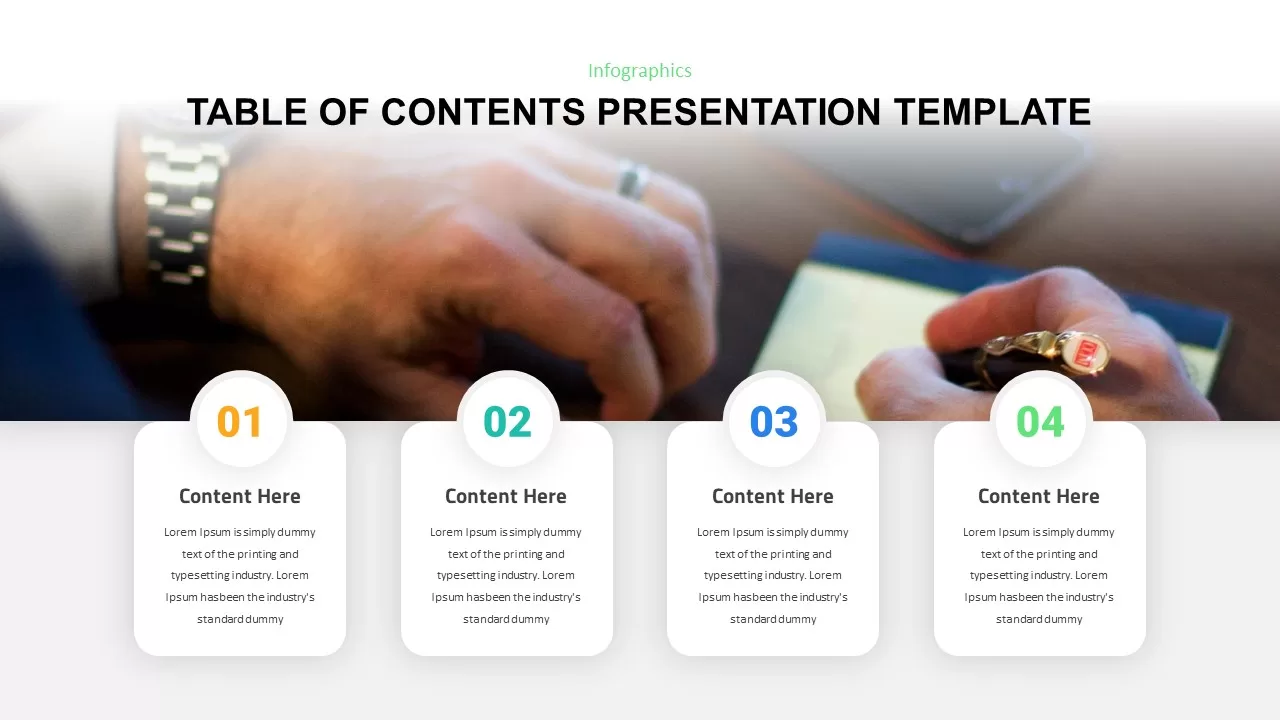
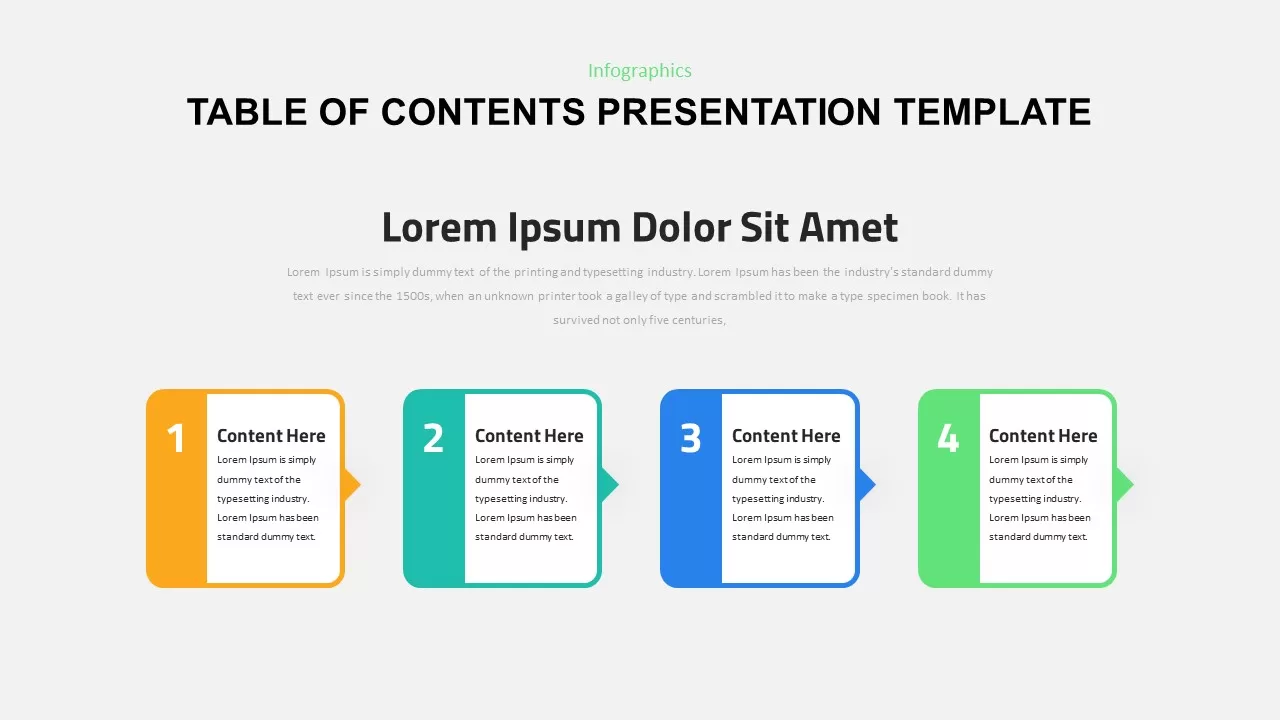
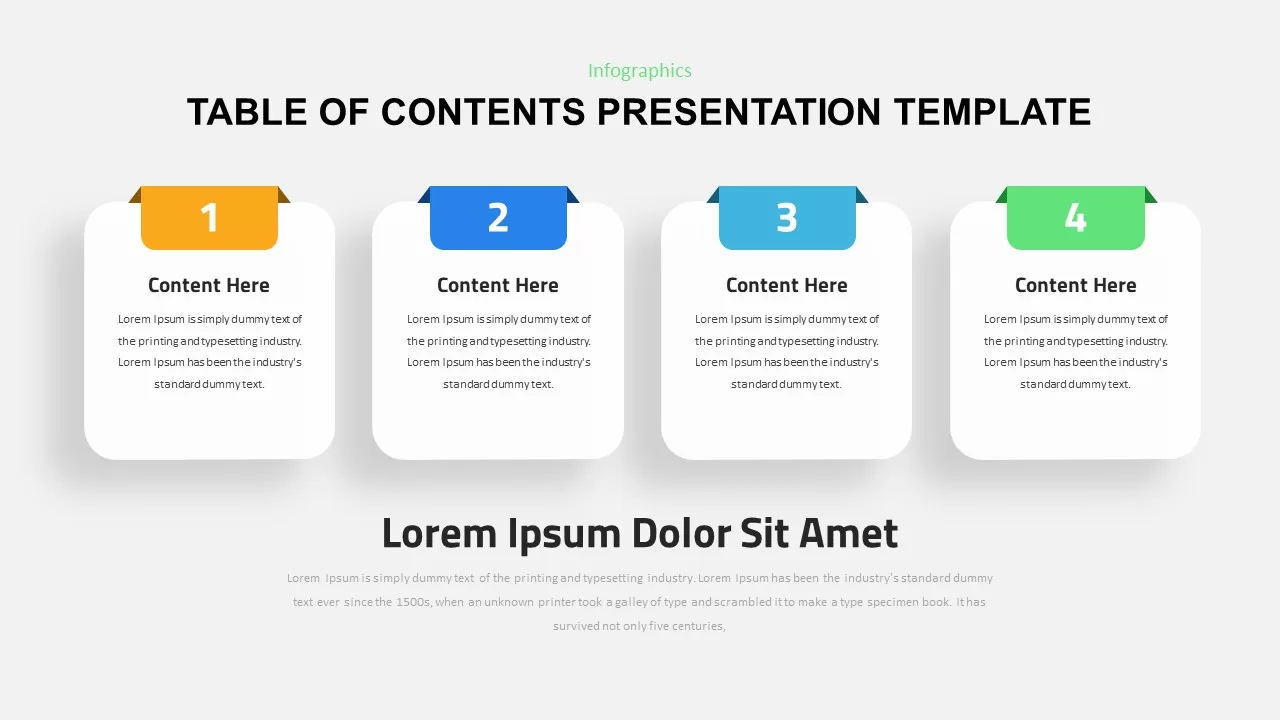
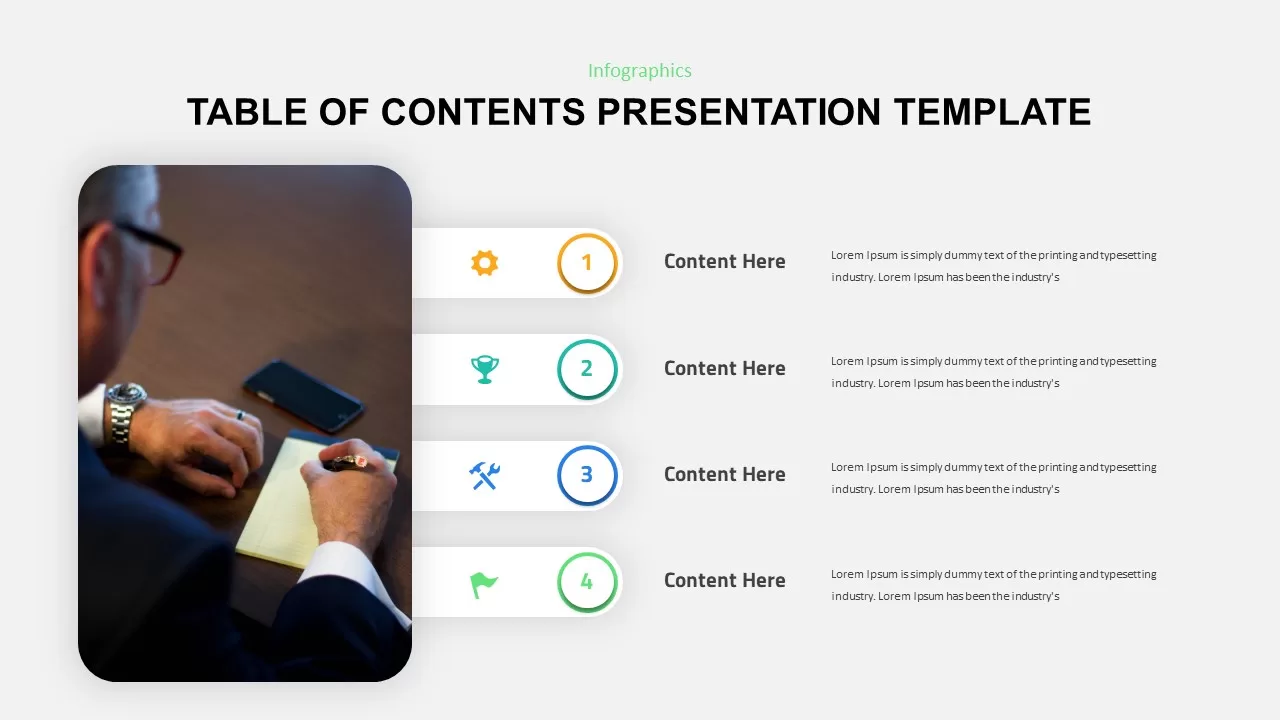
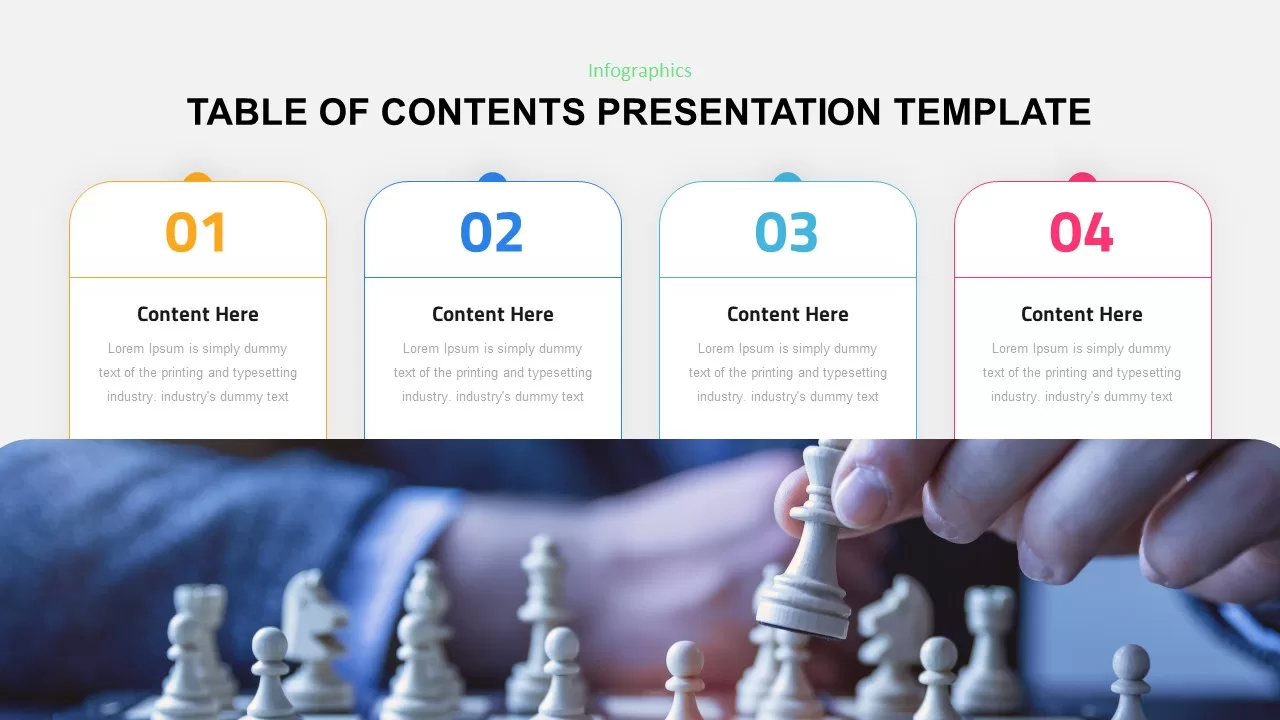
Four-Step Table of Contents Presentation Template for PowerPoint & Google Slides
Agenda
Four-Step Agenda Table of Contents Template for PowerPoint & Google Slides
Agenda
Modern Four-Step Table of Contents Template for PowerPoint & Google Slides
Agenda
Four-Step Strategic Table of Contents Template for PowerPoint & Google Slides
Agenda
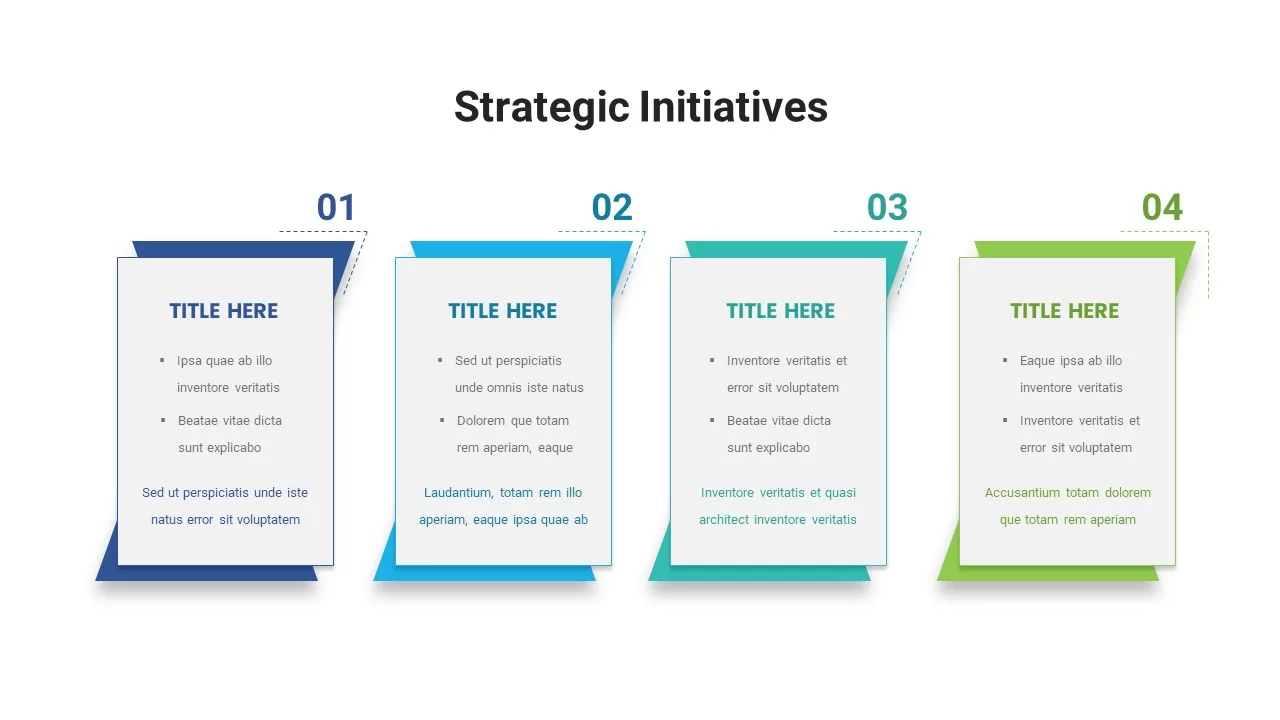
Four-Step Strategic Initiatives Card Template for PowerPoint & Google Slides
Process
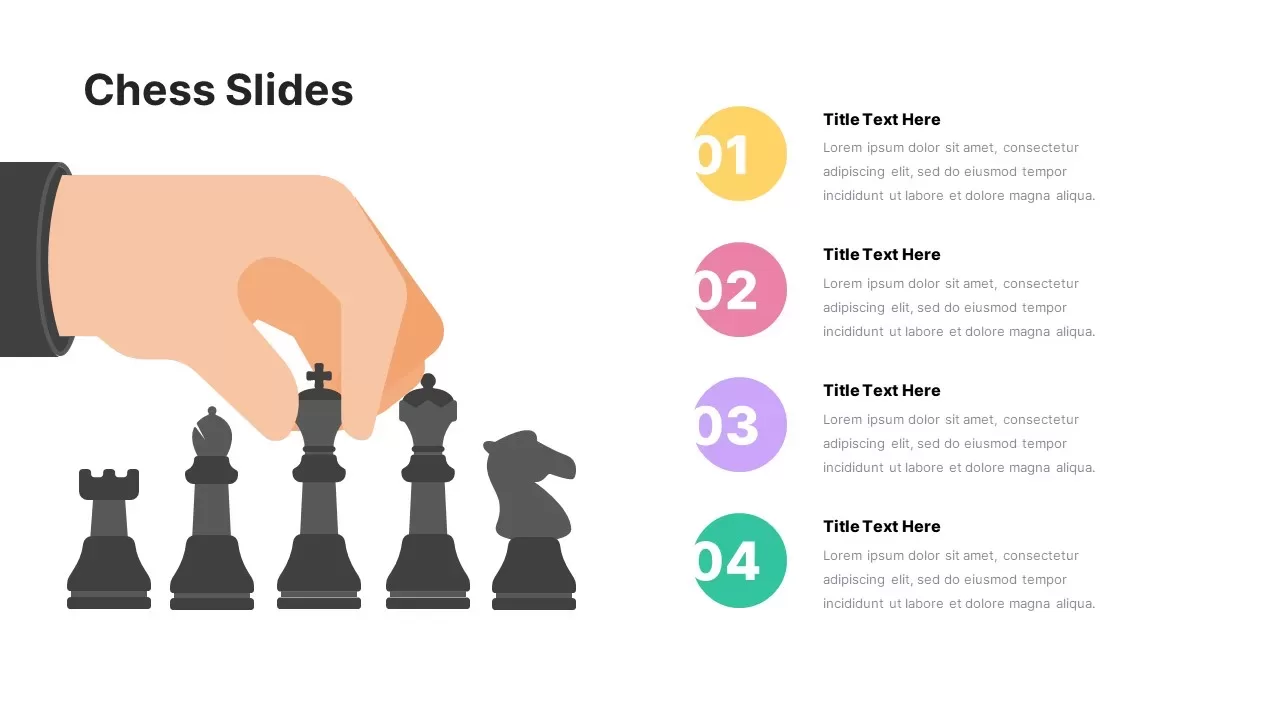
Strategic Chess Four Step Slide Template for PowerPoint & Google Slides
Process
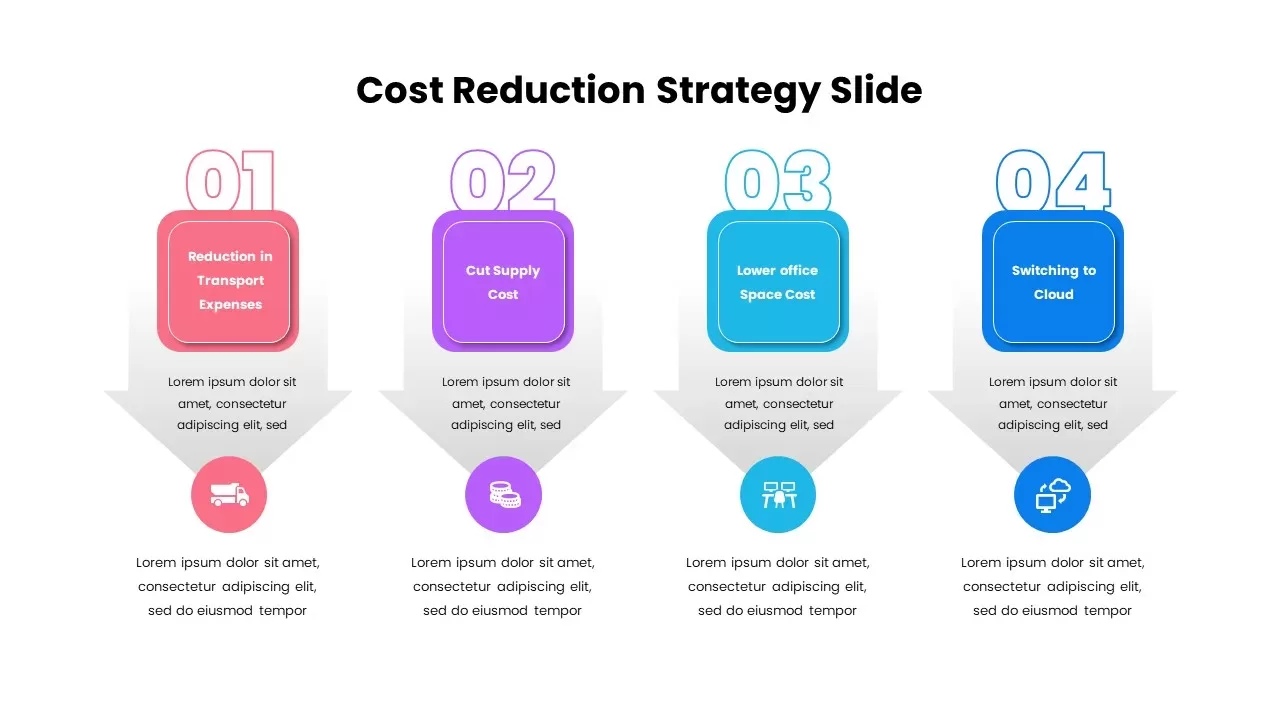
Four-Step Cost Reduction Strategy Template for PowerPoint & Google Slides
Process
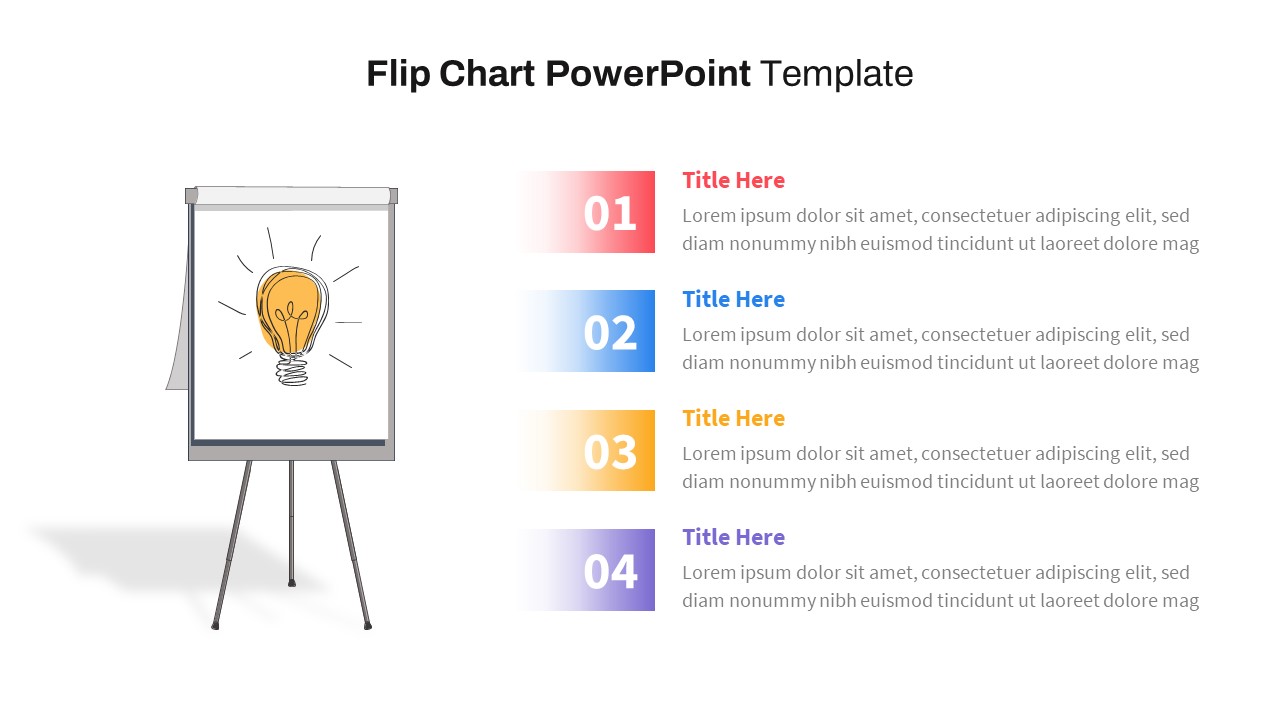
Flip Chart Four-Step List Layout Template for PowerPoint & Google Slides
Process
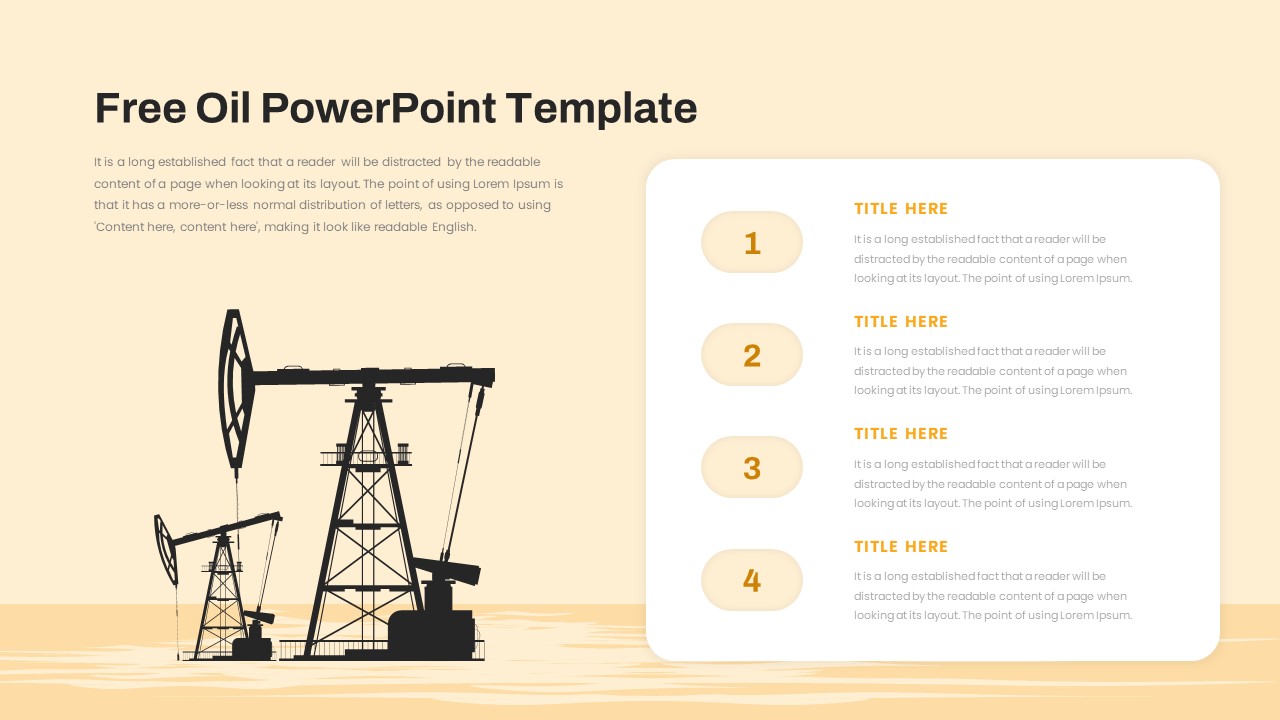
Free Oil Industry Four-Step Presentation Template for PowerPoint & Google Slides
Process
Free
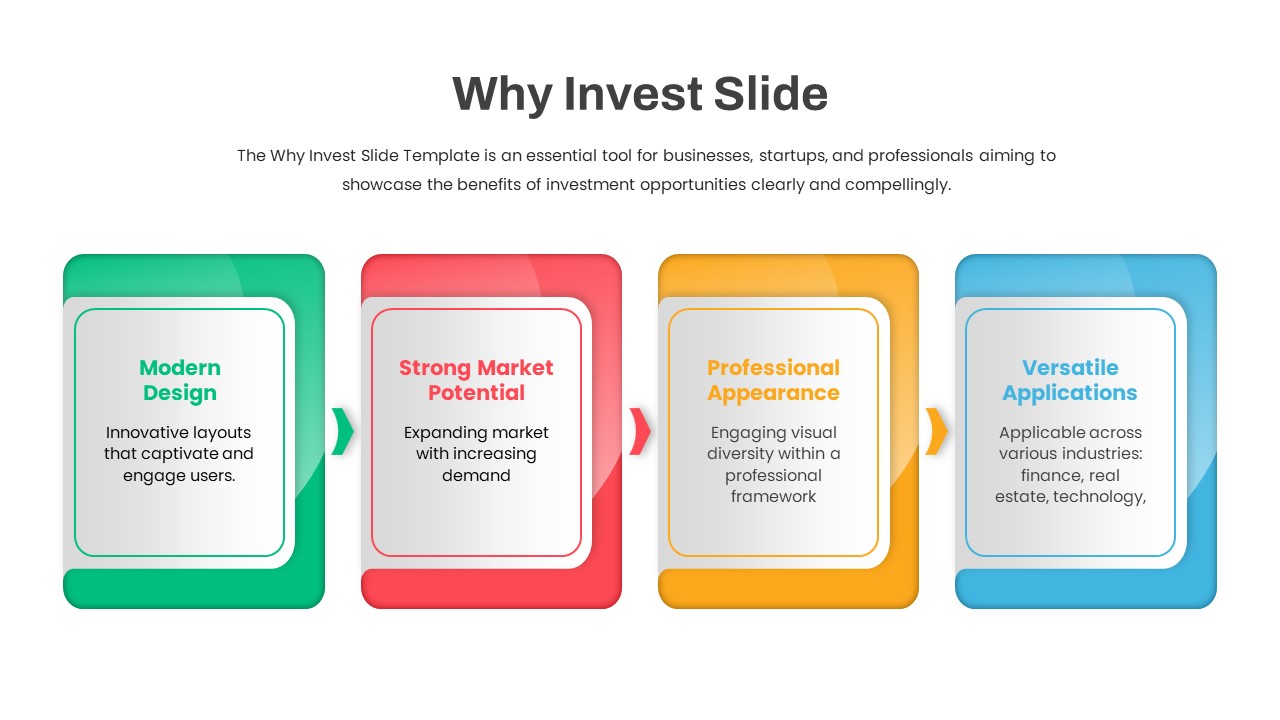
Why Invest Slide Four-Step Benefits Flow Template for PowerPoint & Google Slides
Business Plan
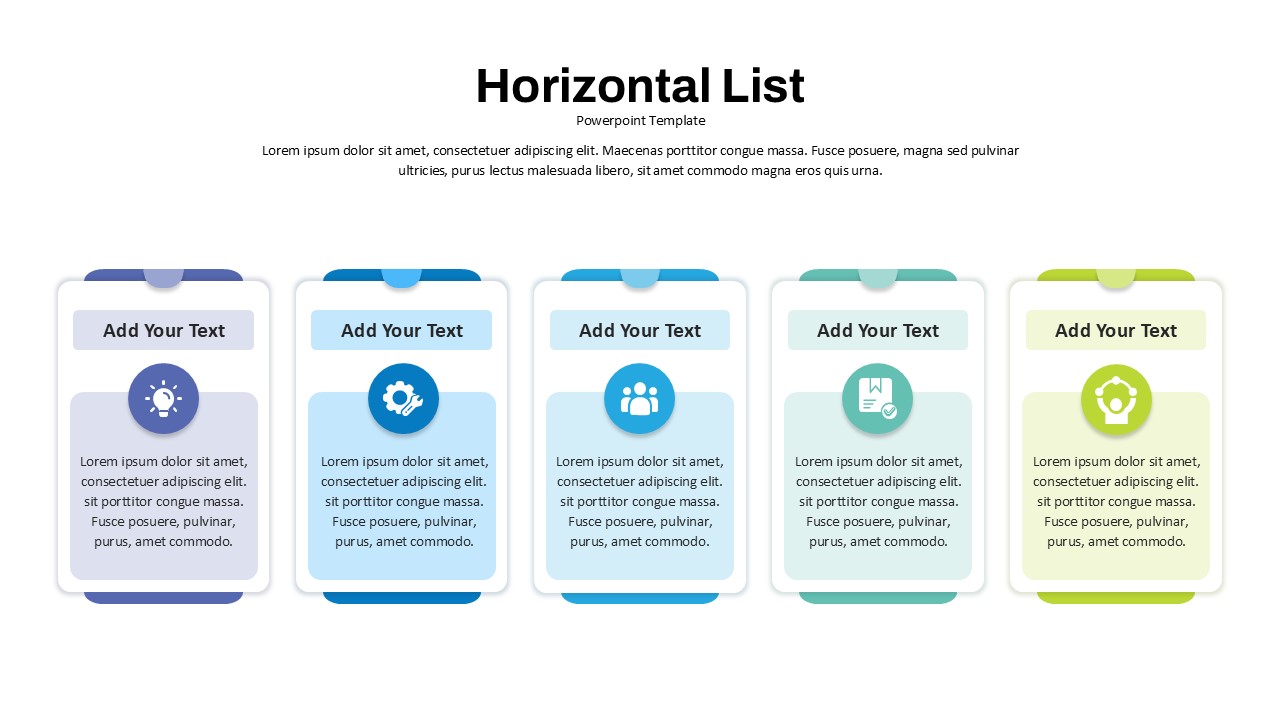
Modern Four-Step Horizontal List Template for PowerPoint & Google Slides
Process
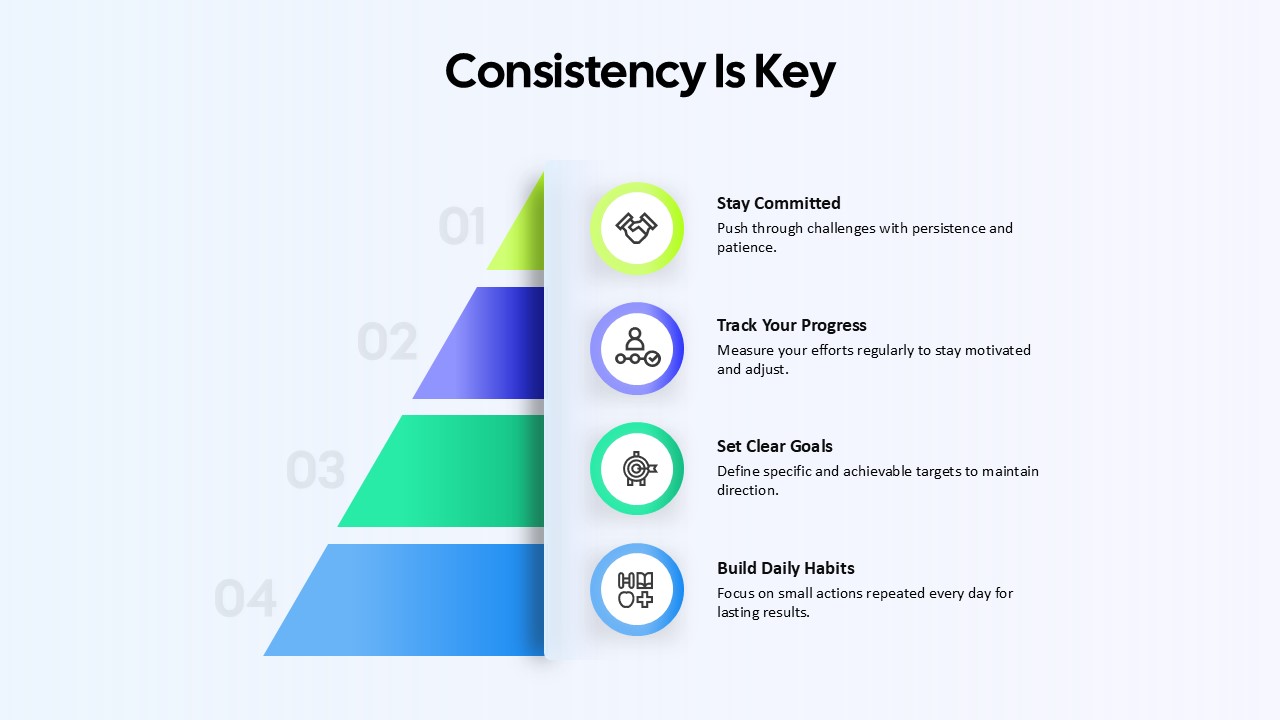
Consistency Is Key Four-Step Pyramid Template for PowerPoint & Google Slides
Process
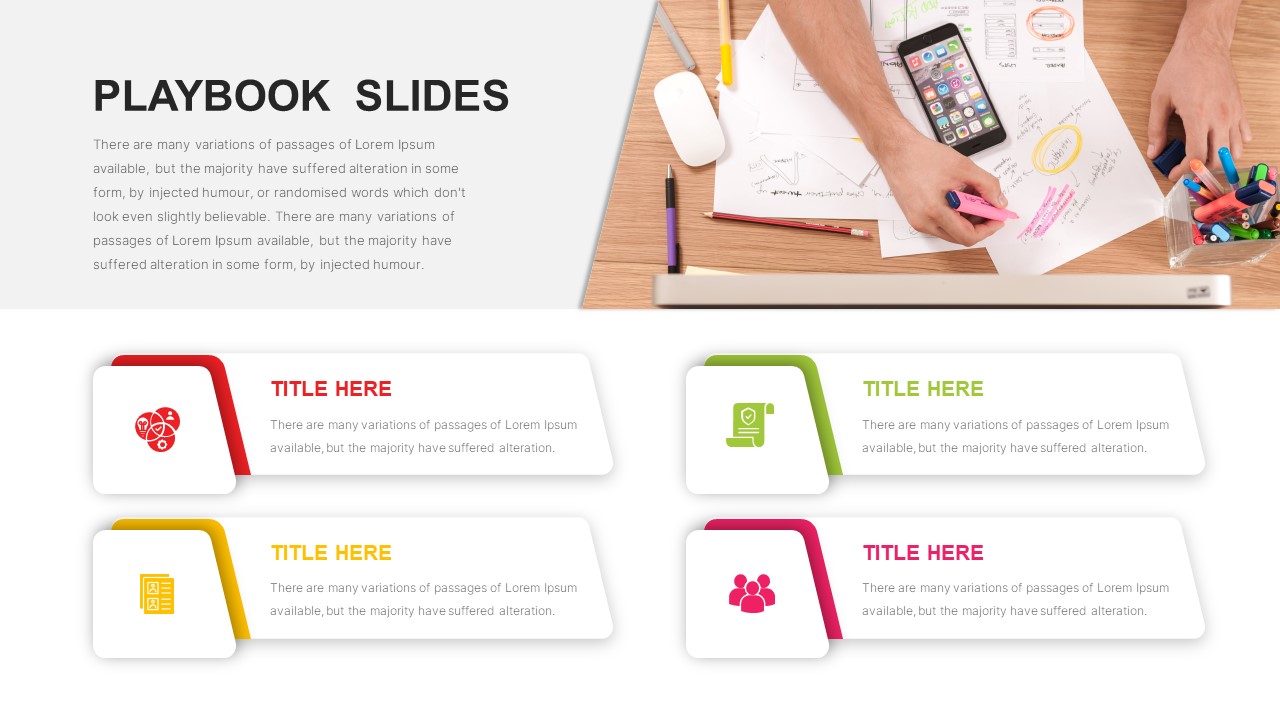
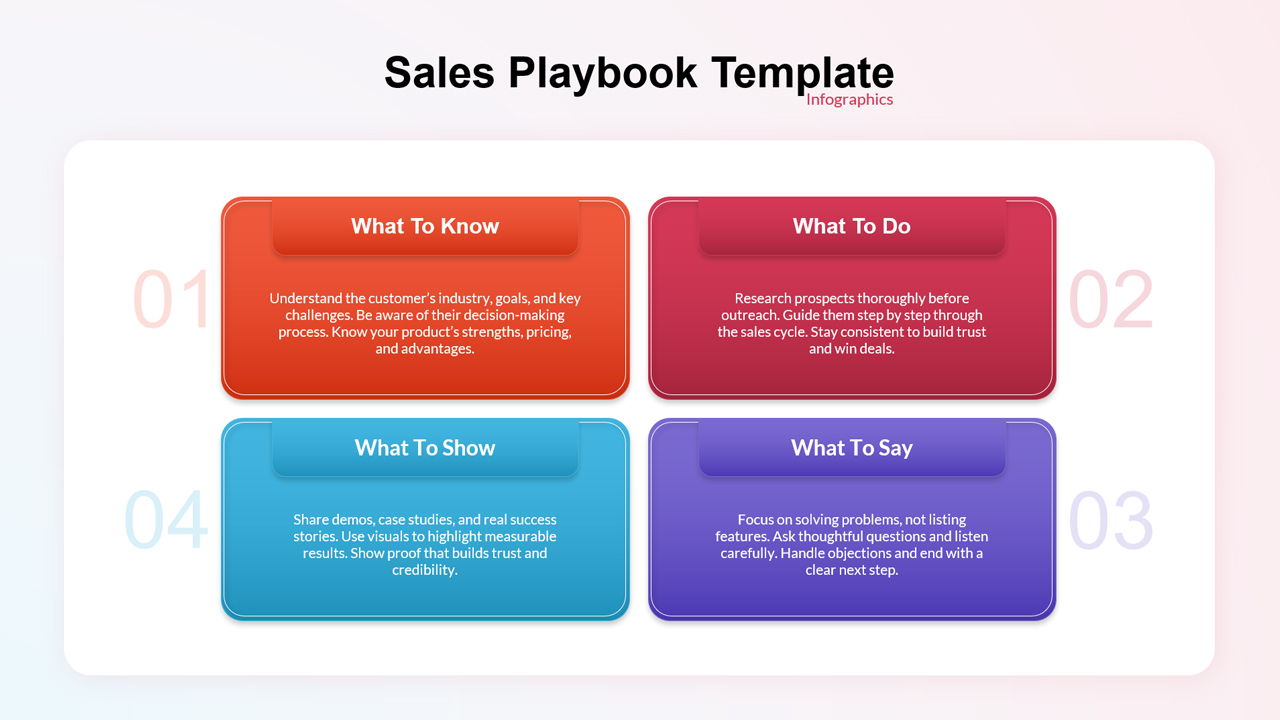
Four Step Sales Playbook Guide Template for PowerPoint & Google Slides
Marketing
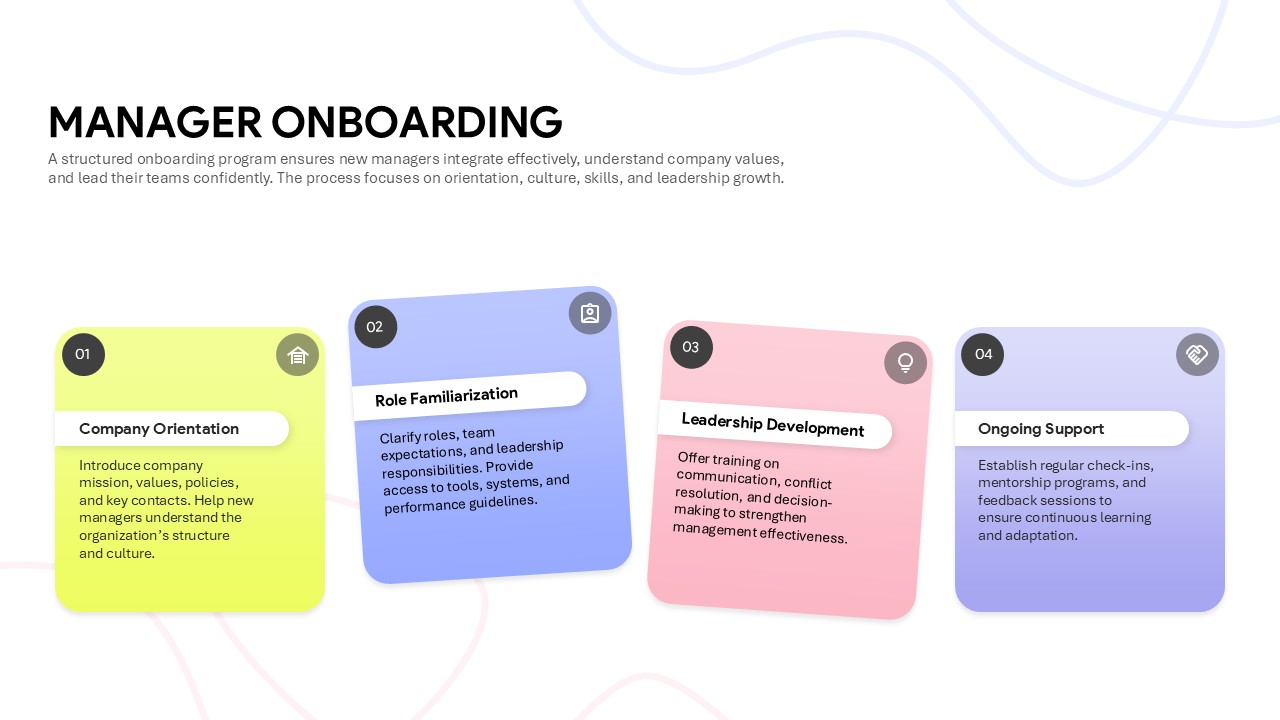
Four Step Manager Onboarding Template for PowerPoint & Google Slides
HR
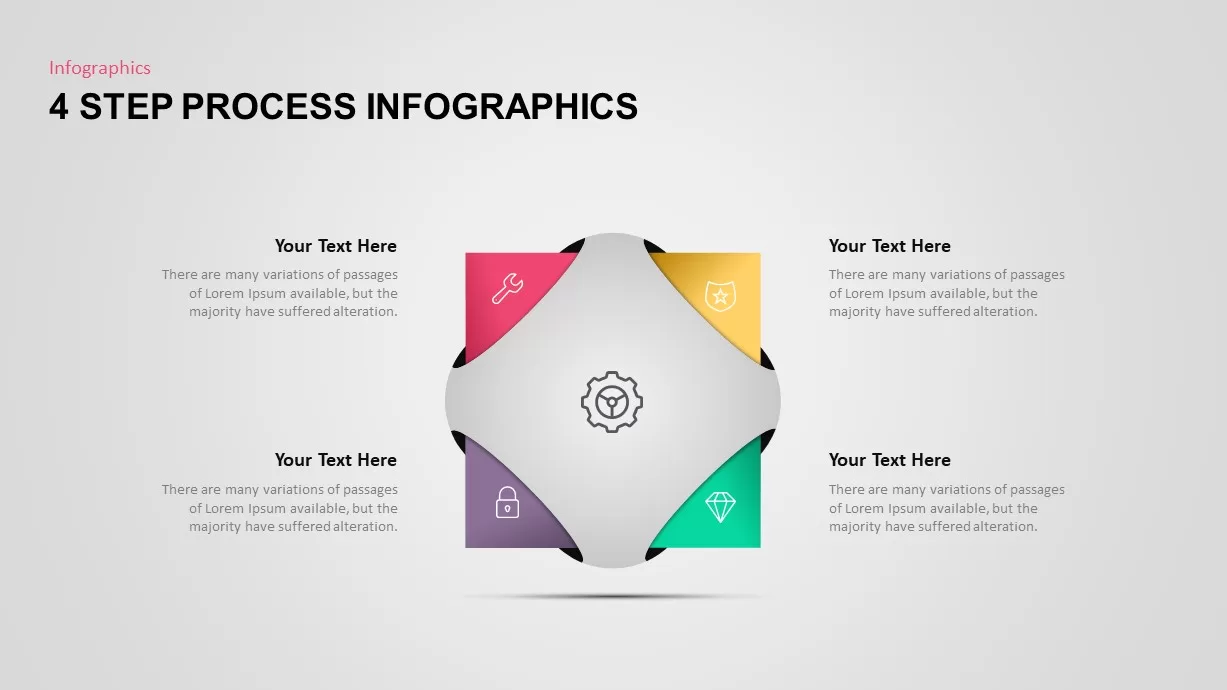
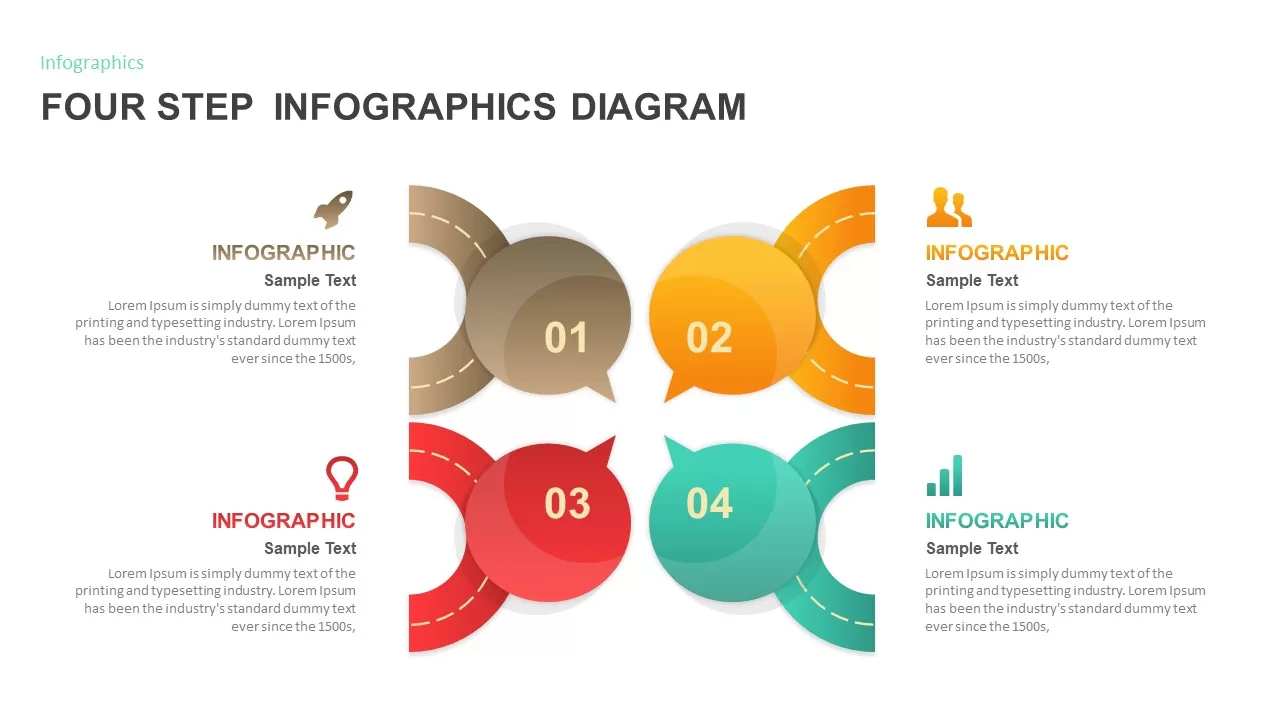
Four Step Infographics Diagram for PowerPoint & Google Slides
Process
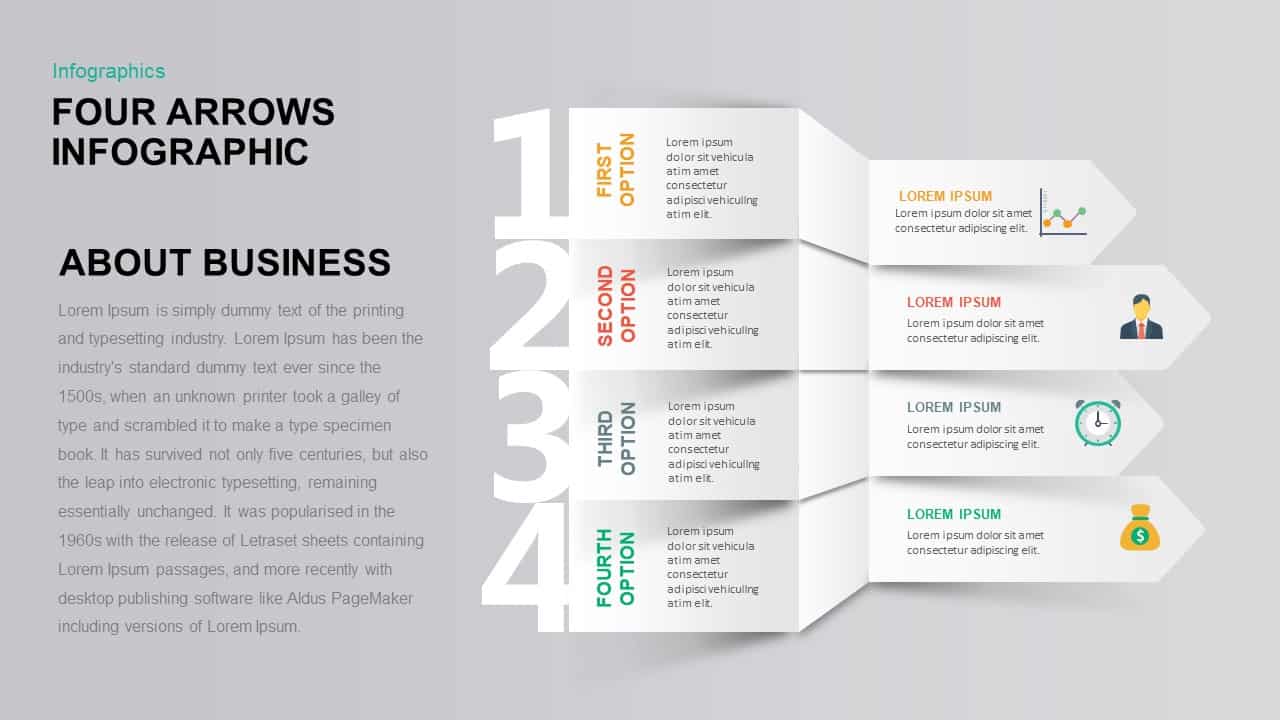
Four Options Infographic Slides Template for PowerPoint & Google Slides
Comparison
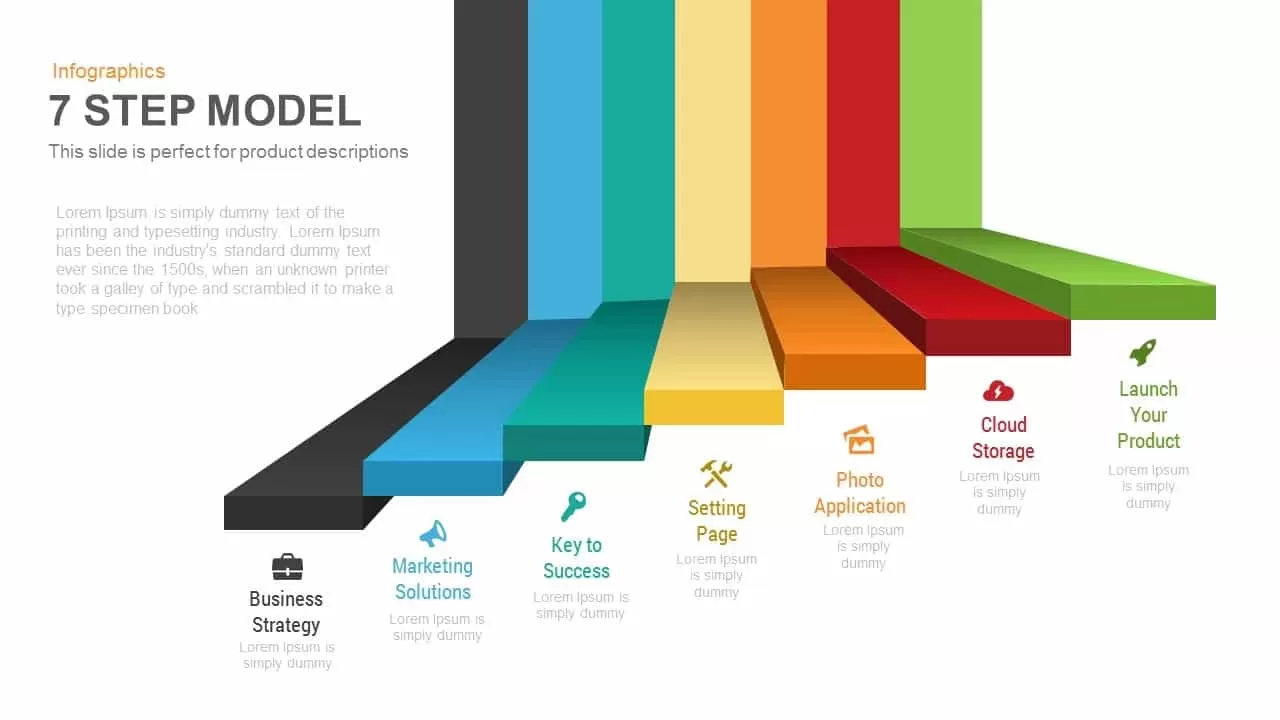
7-Step 3D Process Infographic Model template for PowerPoint & Google Slides
Process
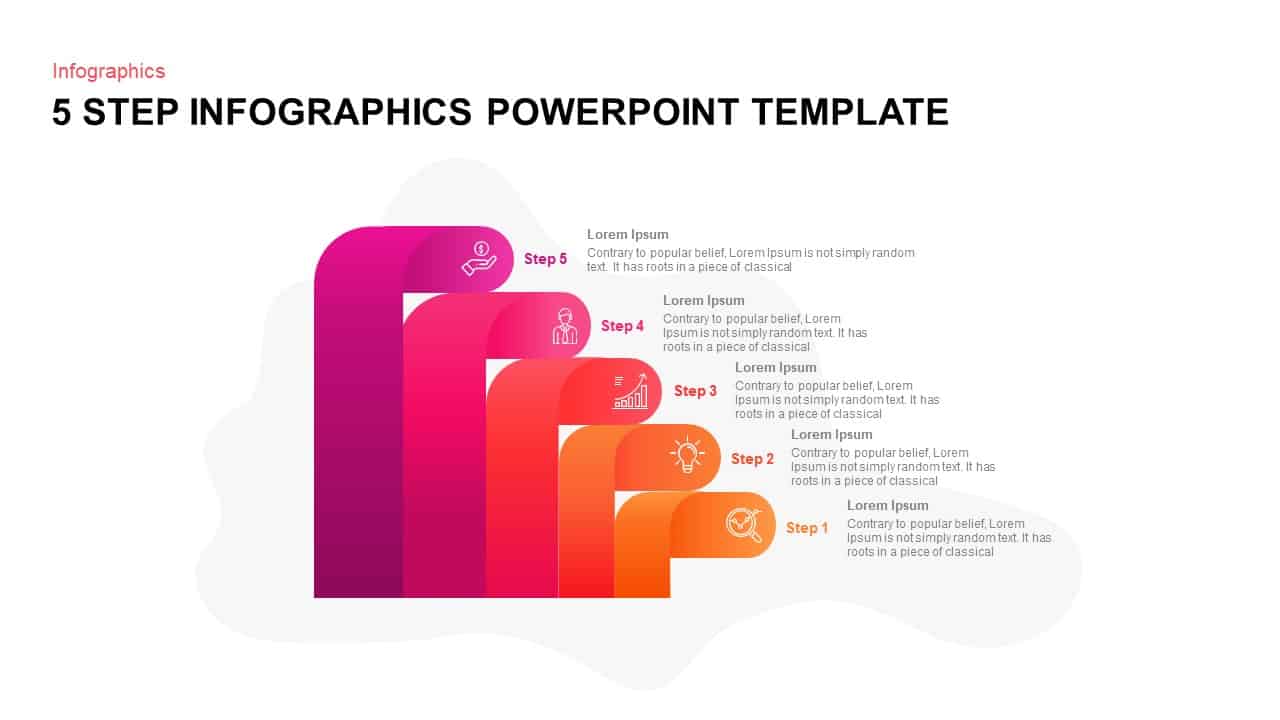
Gradient 5-Step Infographic Process Template for PowerPoint & Google Slides
Process
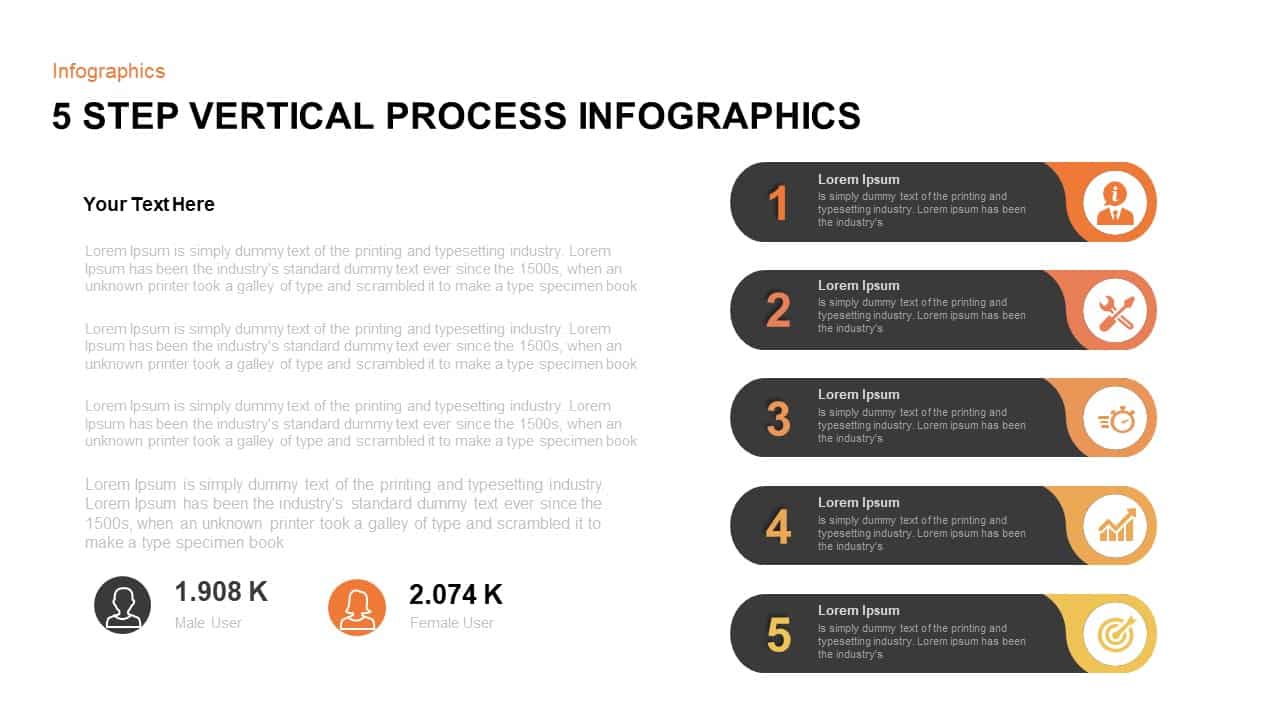
Five-Step Vertical Process Infographic Template for PowerPoint & Google Slides
Process
Five-Step Infographic Process and Agenda Template for PowerPoint & Google Slides
Process
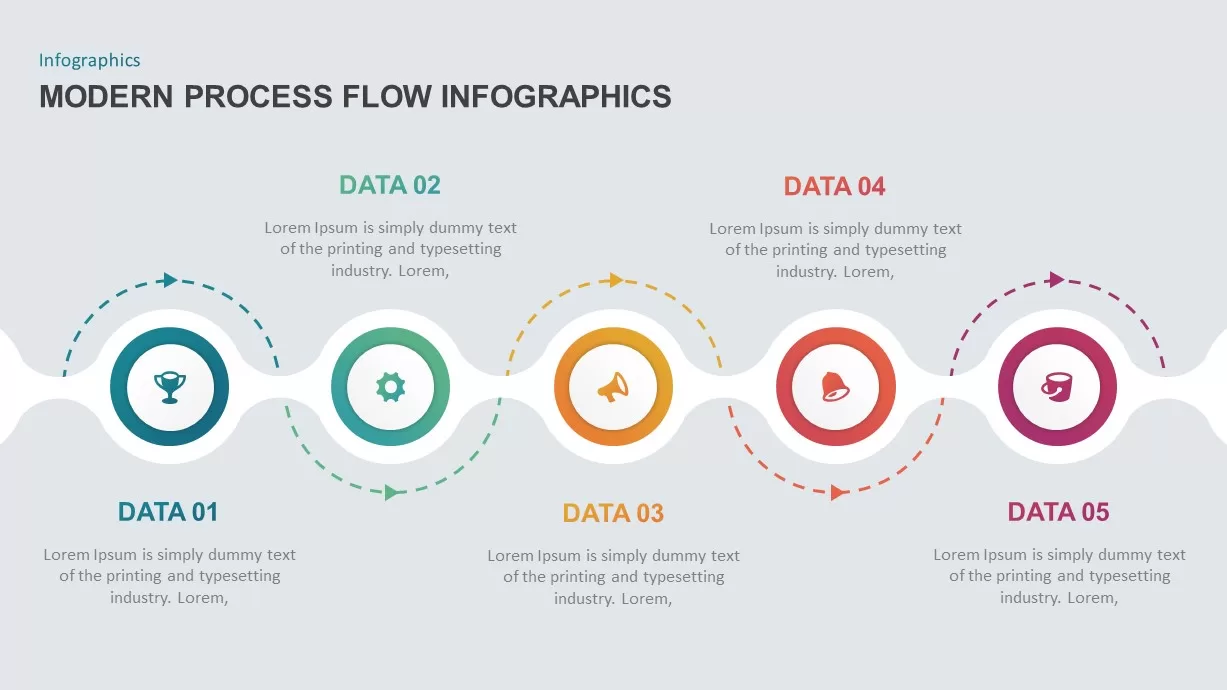
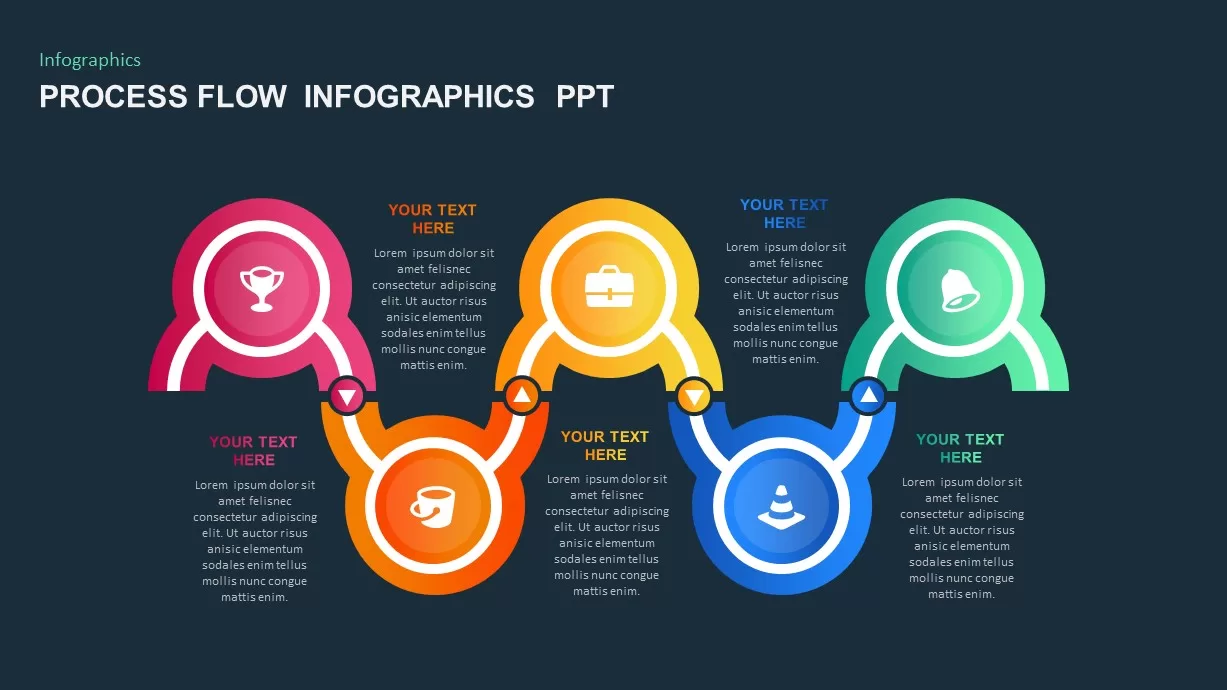
Modern 5-Step Process Flow Infographic Template for PowerPoint & Google Slides
Process
Five-Step Process Flow Infographic Template for PowerPoint & Google Slides
Process
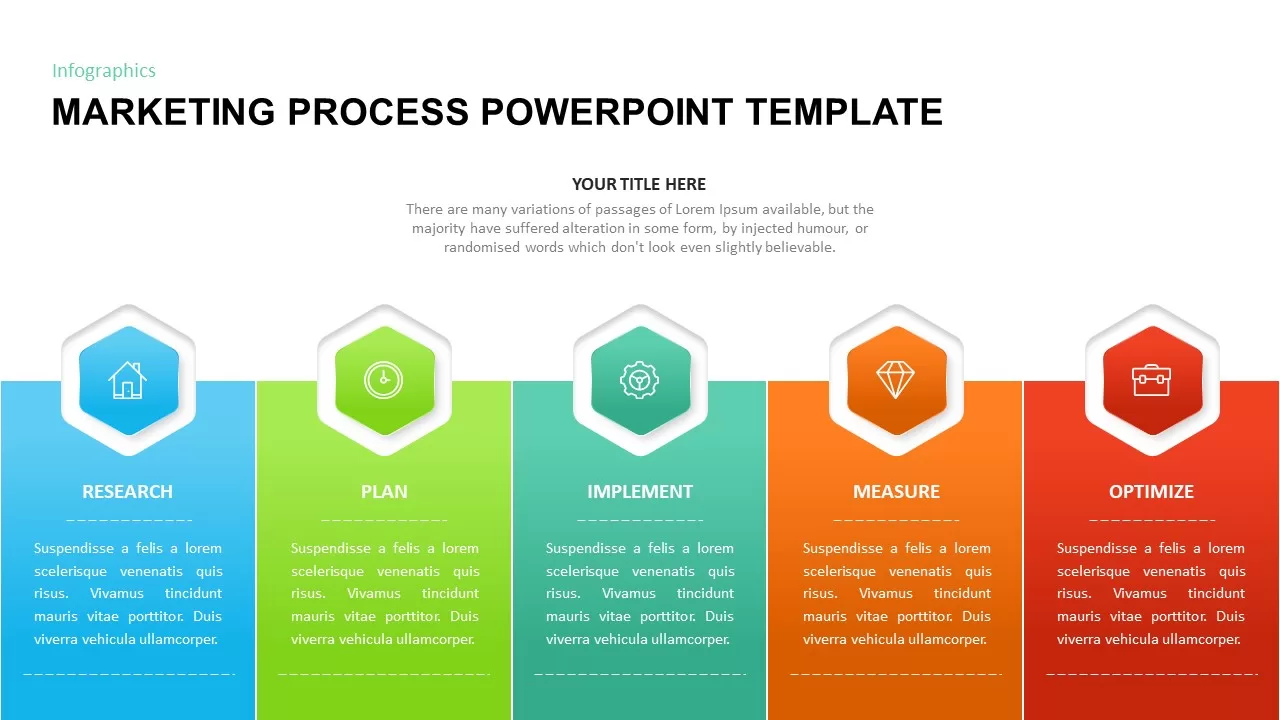
Five-Step Marketing Process Infographic Template for PowerPoint & Google Slides
Process
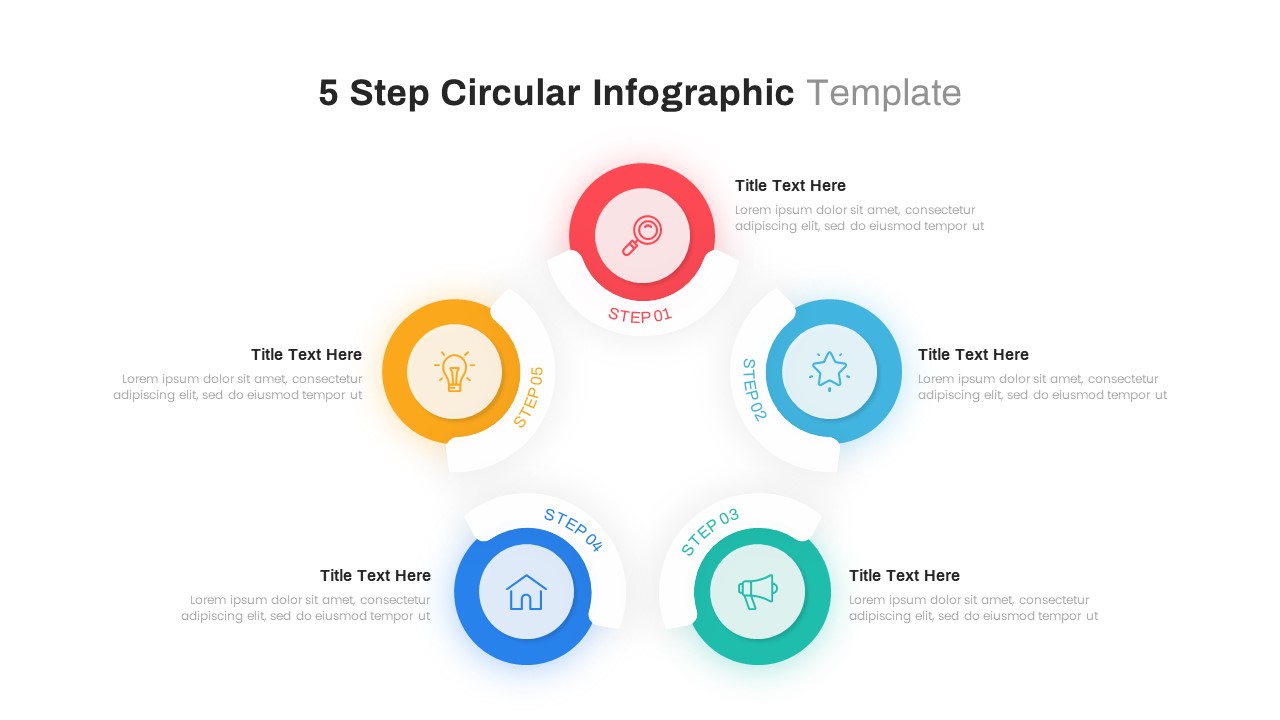
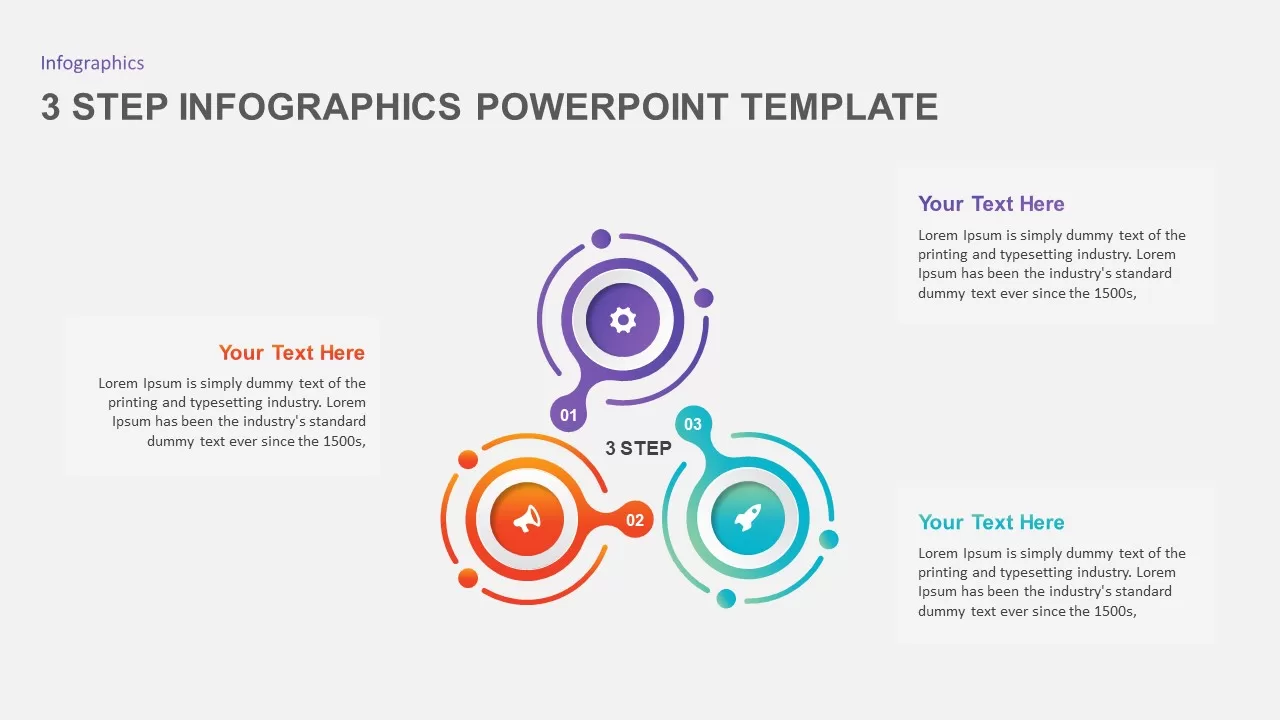
3 & 4 Step Circular Process Infographic Template for PowerPoint & Google Slides
Process
Multi-Step Infographic Process Layout Template for PowerPoint & Google Slides
Process
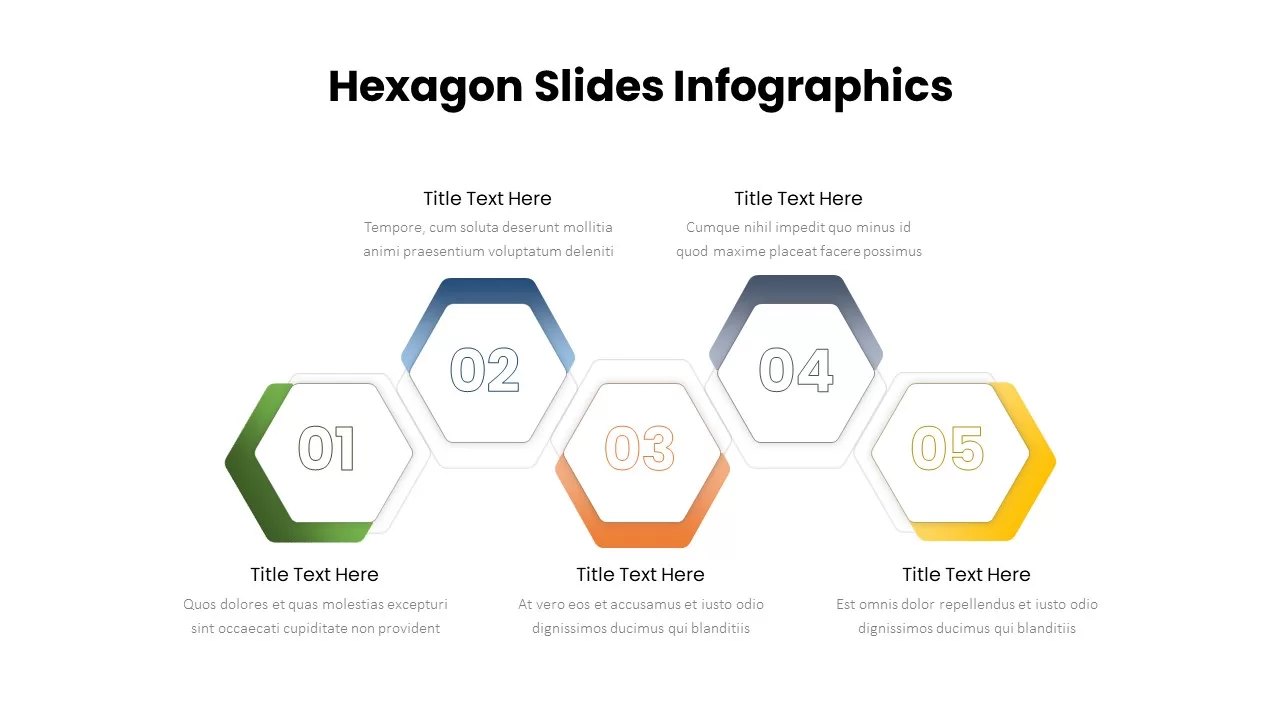
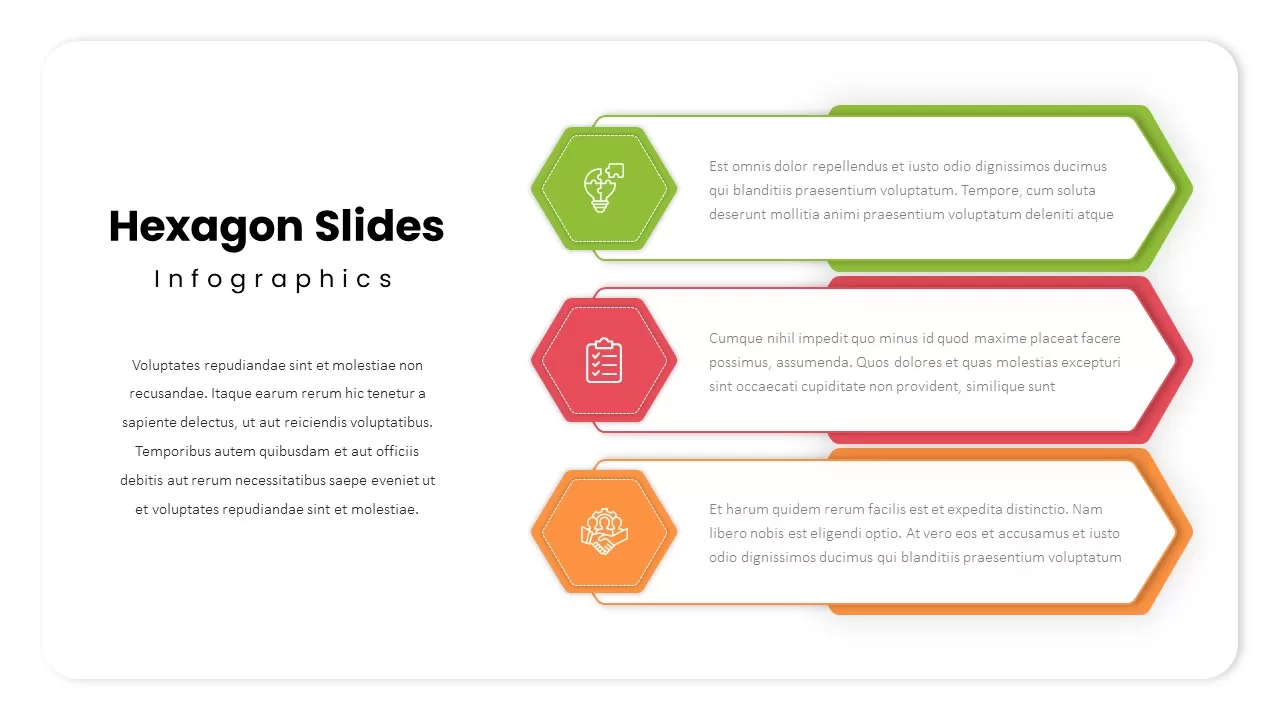
Five-Step Hexagon Infographic Process Template for PowerPoint & Google Slides
Process
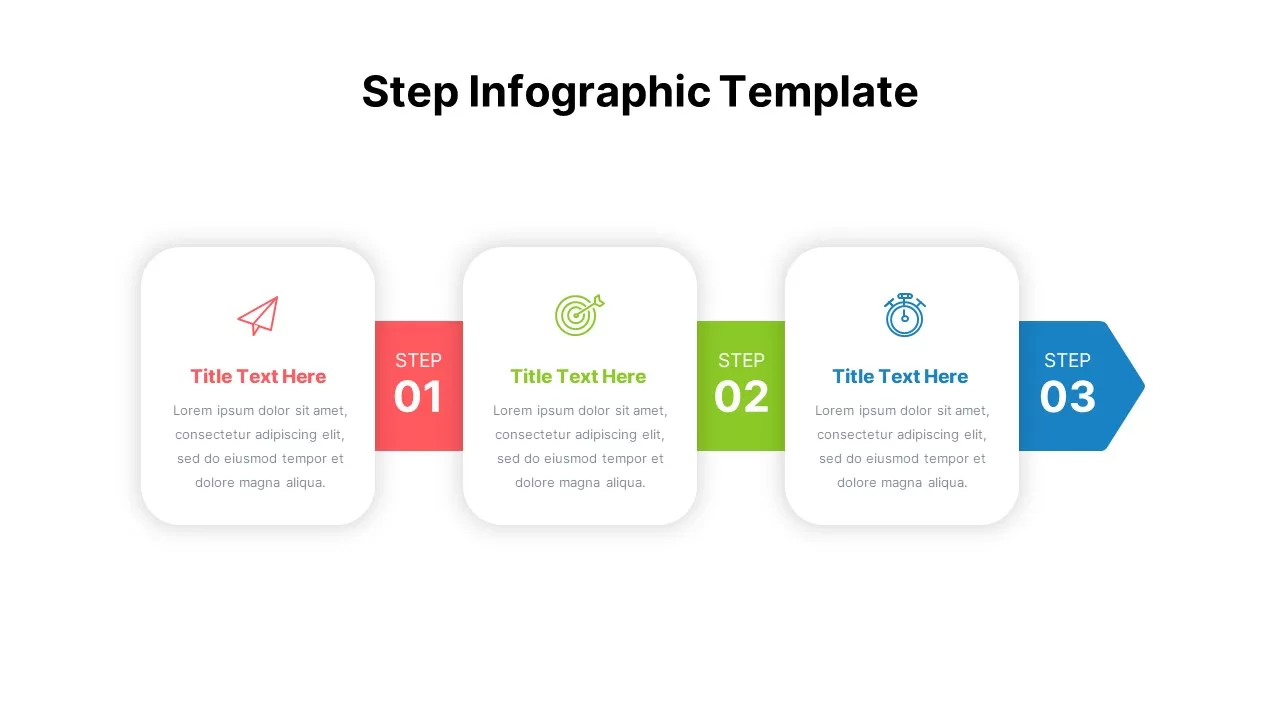
Three-Step Hexagon Infographic Process Template for PowerPoint & Google Slides
Process
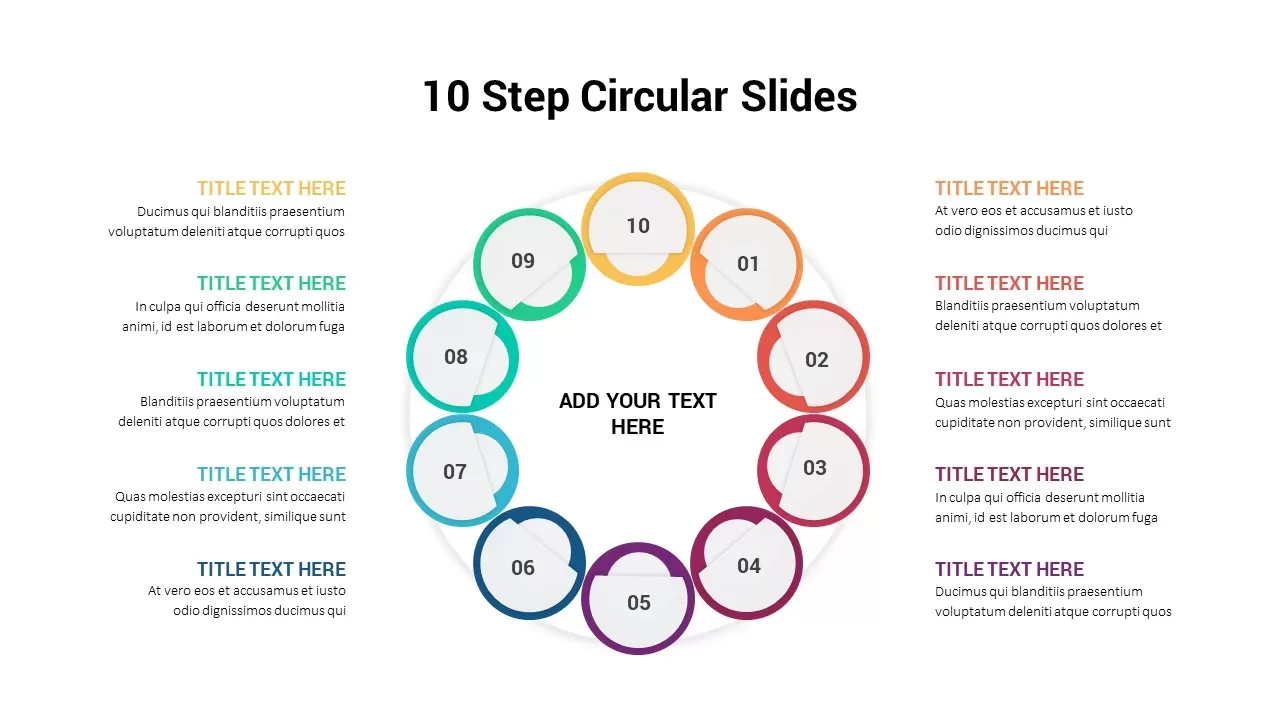
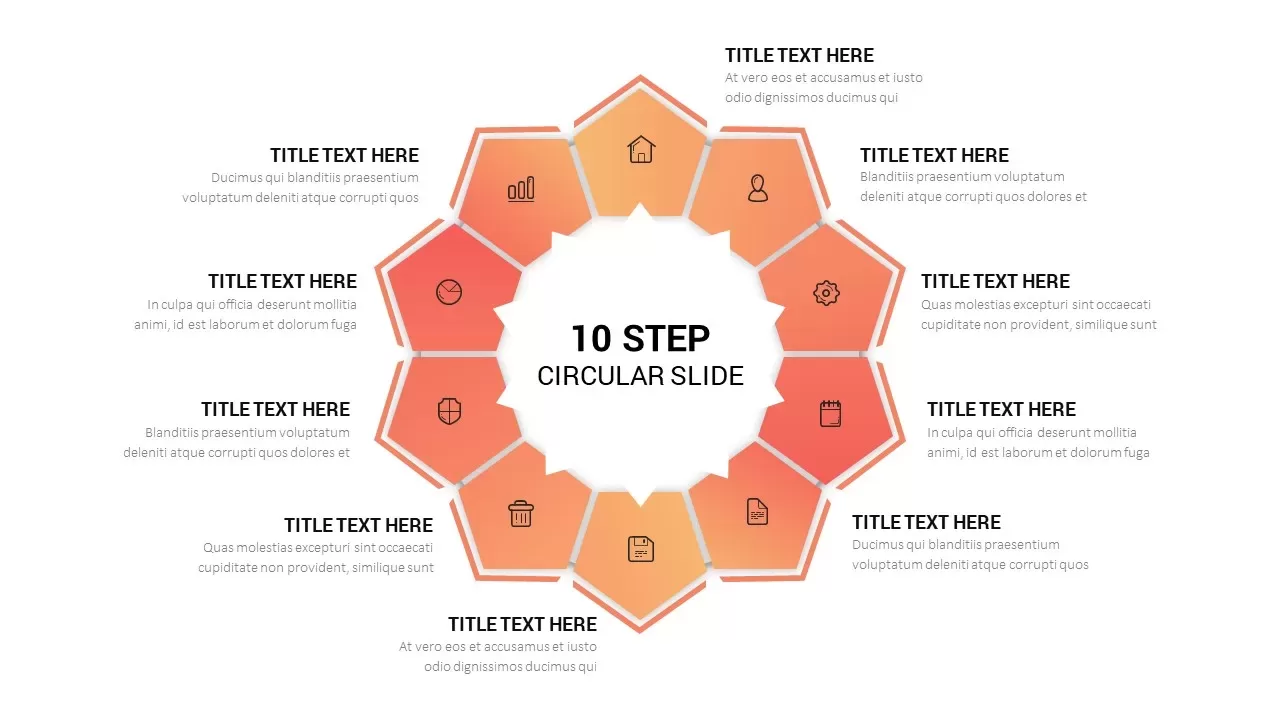
Ten Step Circular Process Infographic Template for PowerPoint & Google Slides
Process
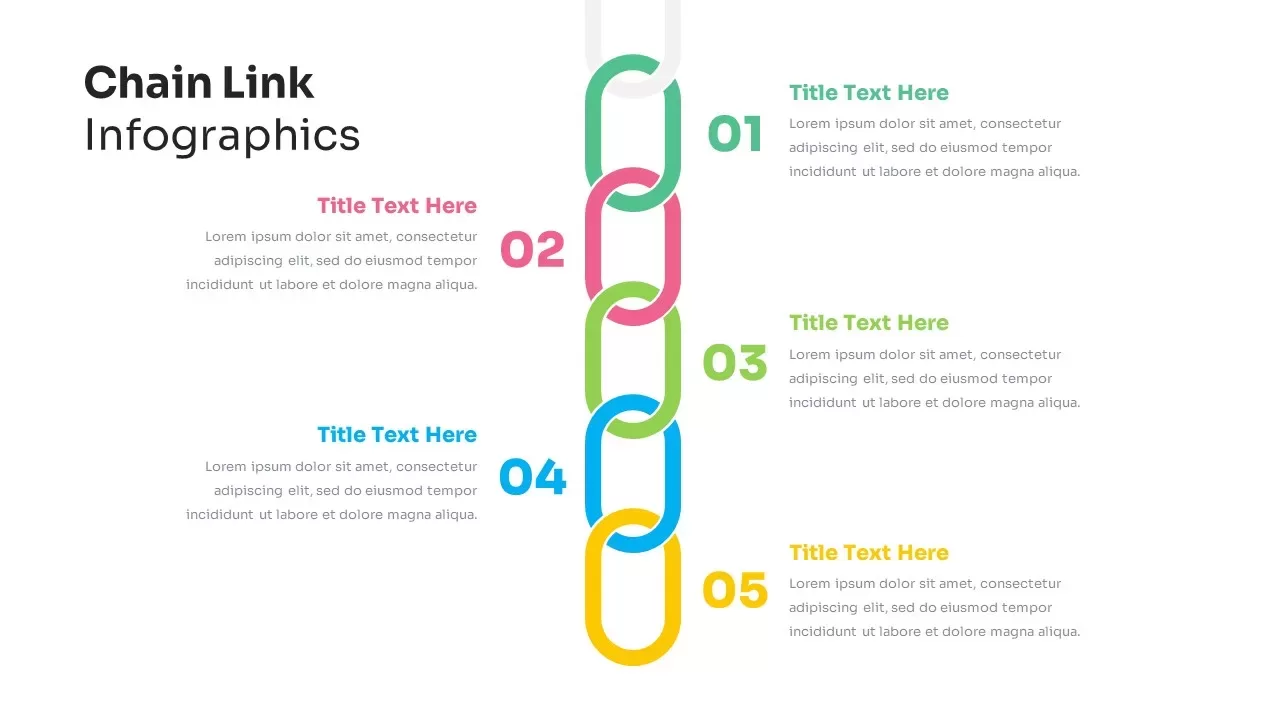
Five-Step Chain Link Process Infographic Template for PowerPoint & Google Slides
Process
Ten-Step Circular Process Infographic Template for PowerPoint & Google Slides
Circular