Fishbone Timeline Infographic Series Template for PowerPoint & Google Slides


Description
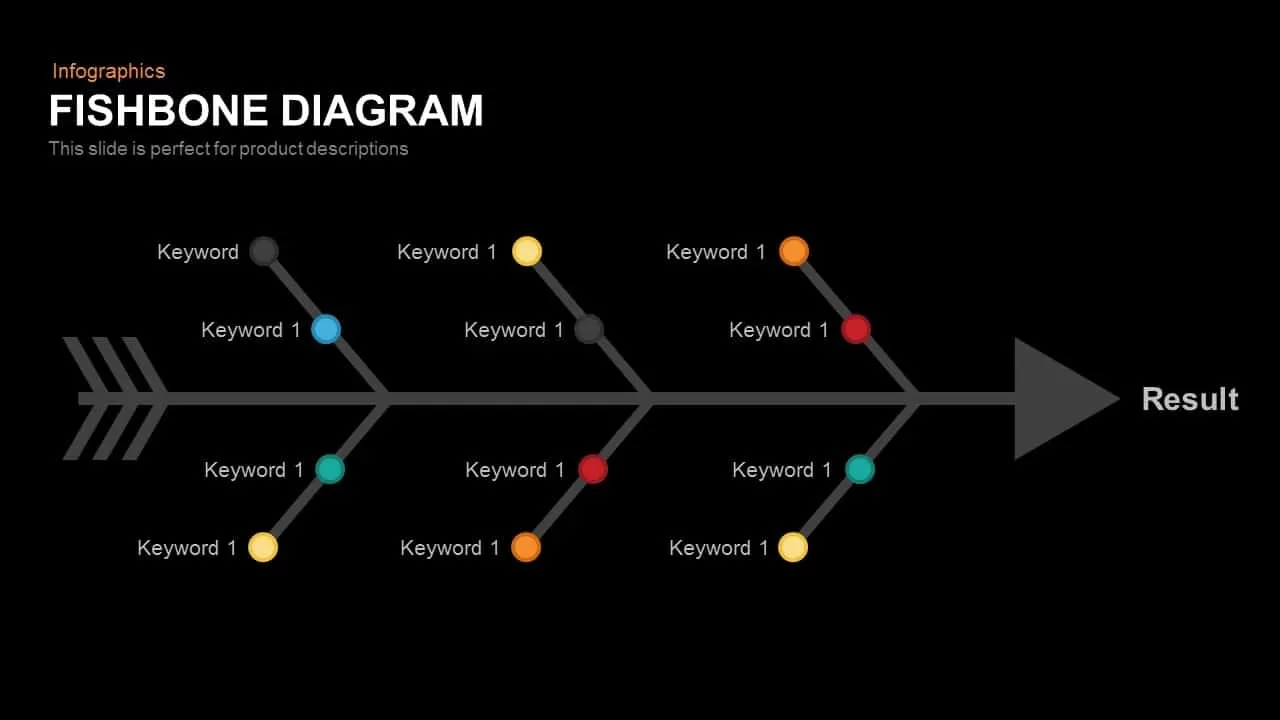
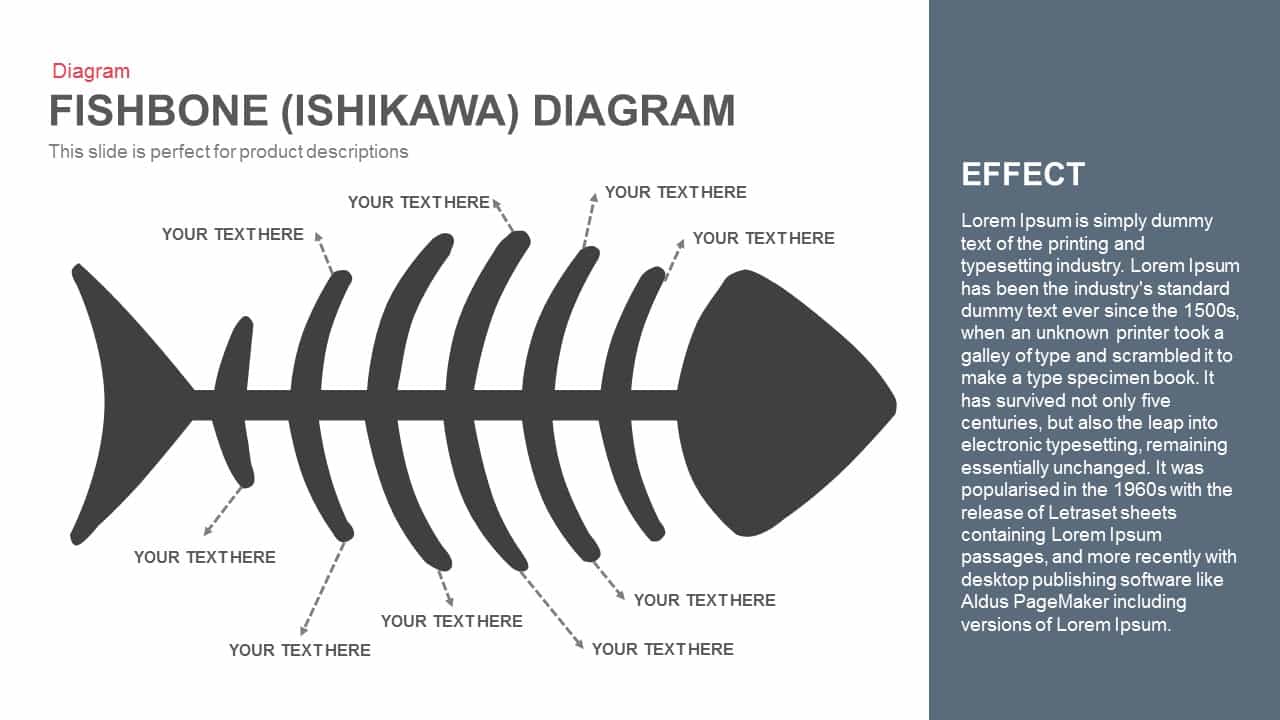
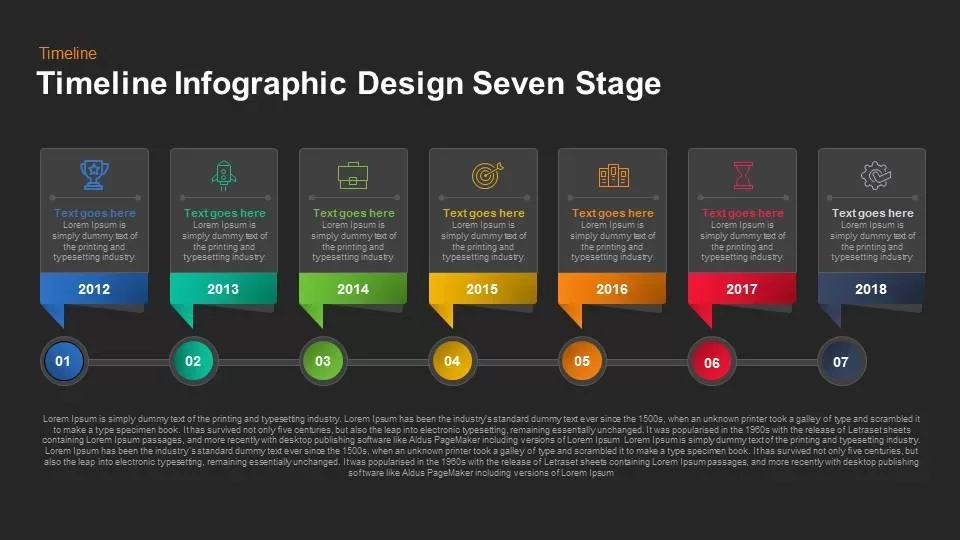
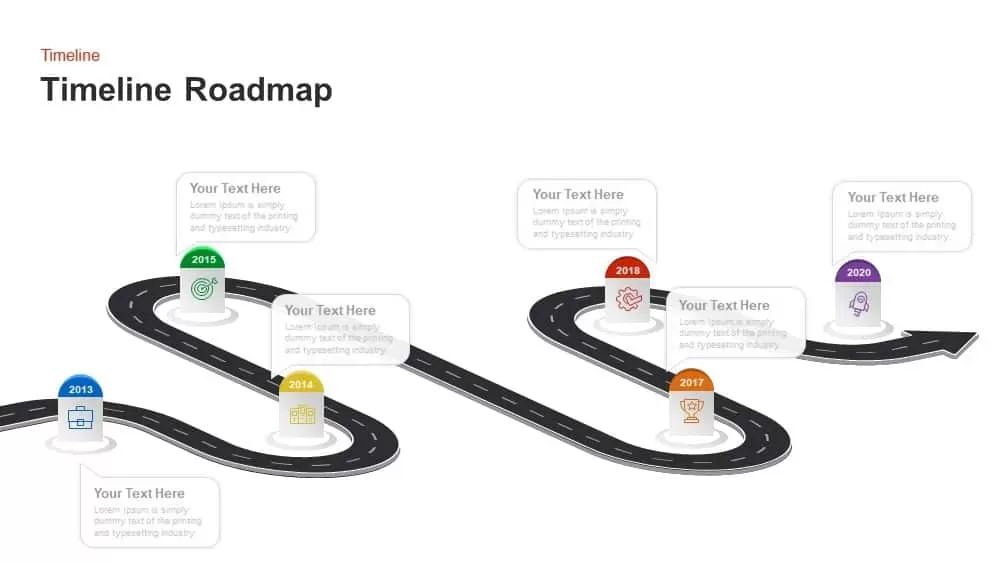
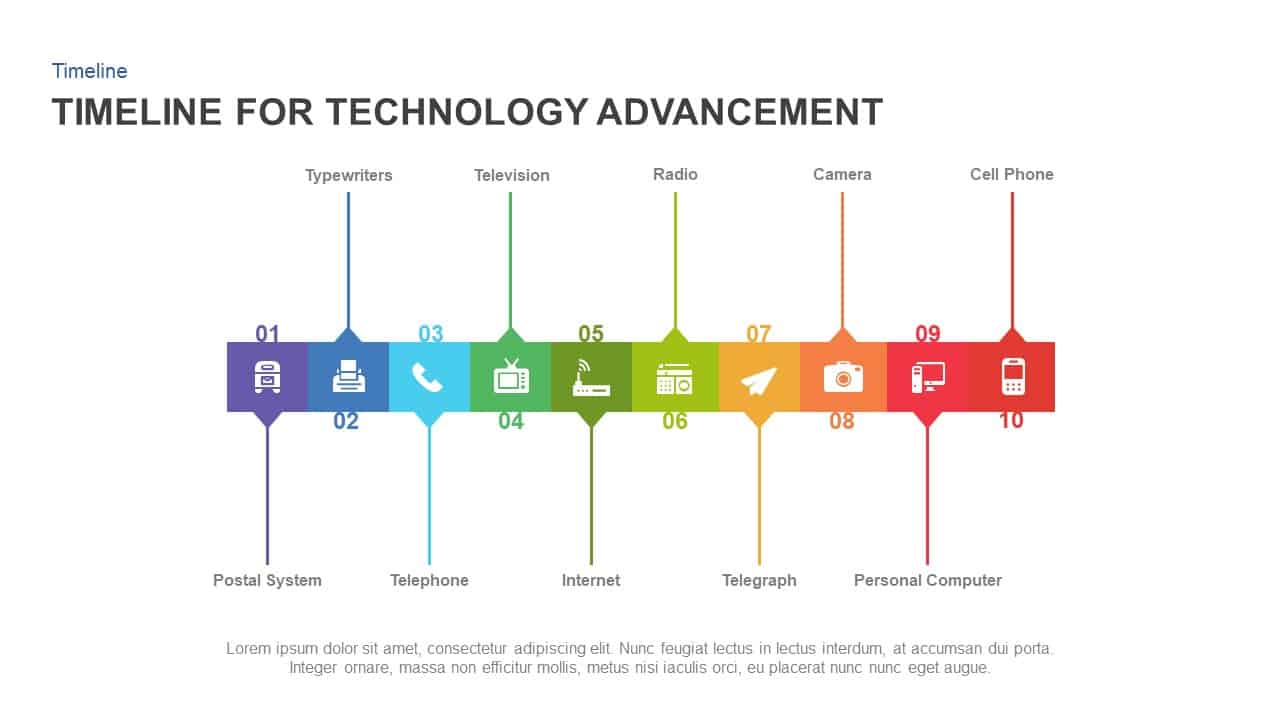
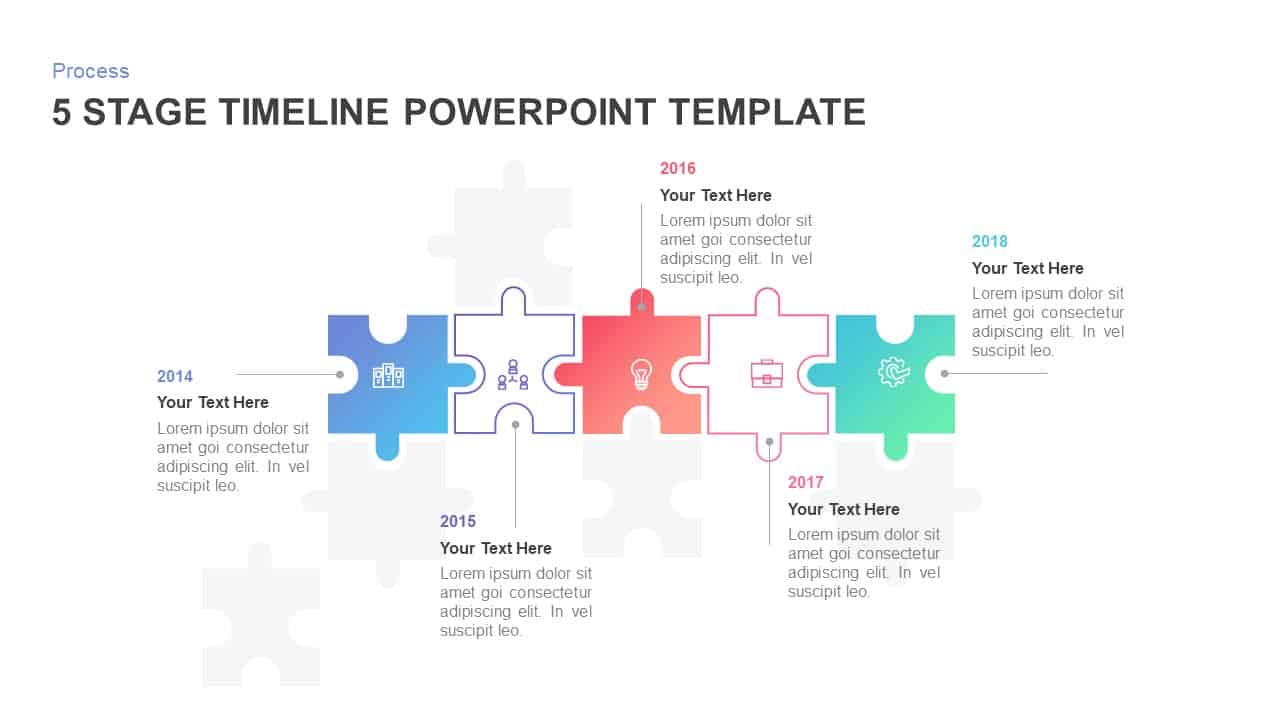
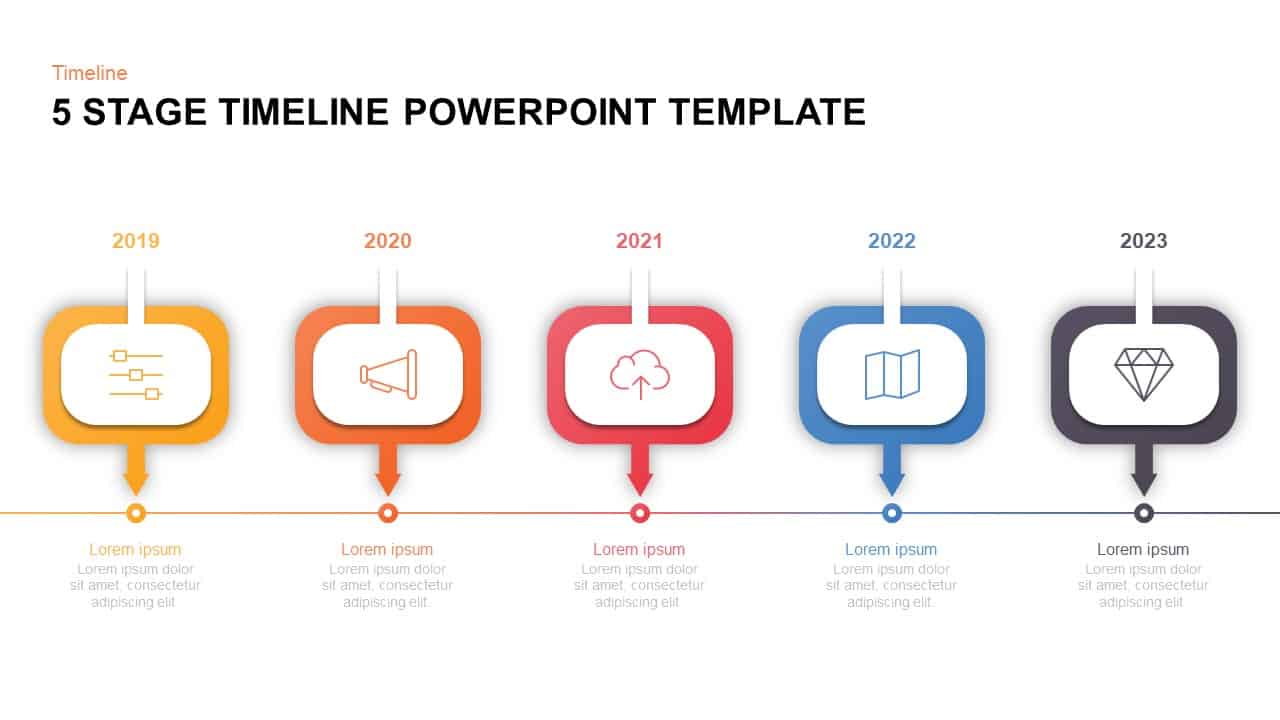
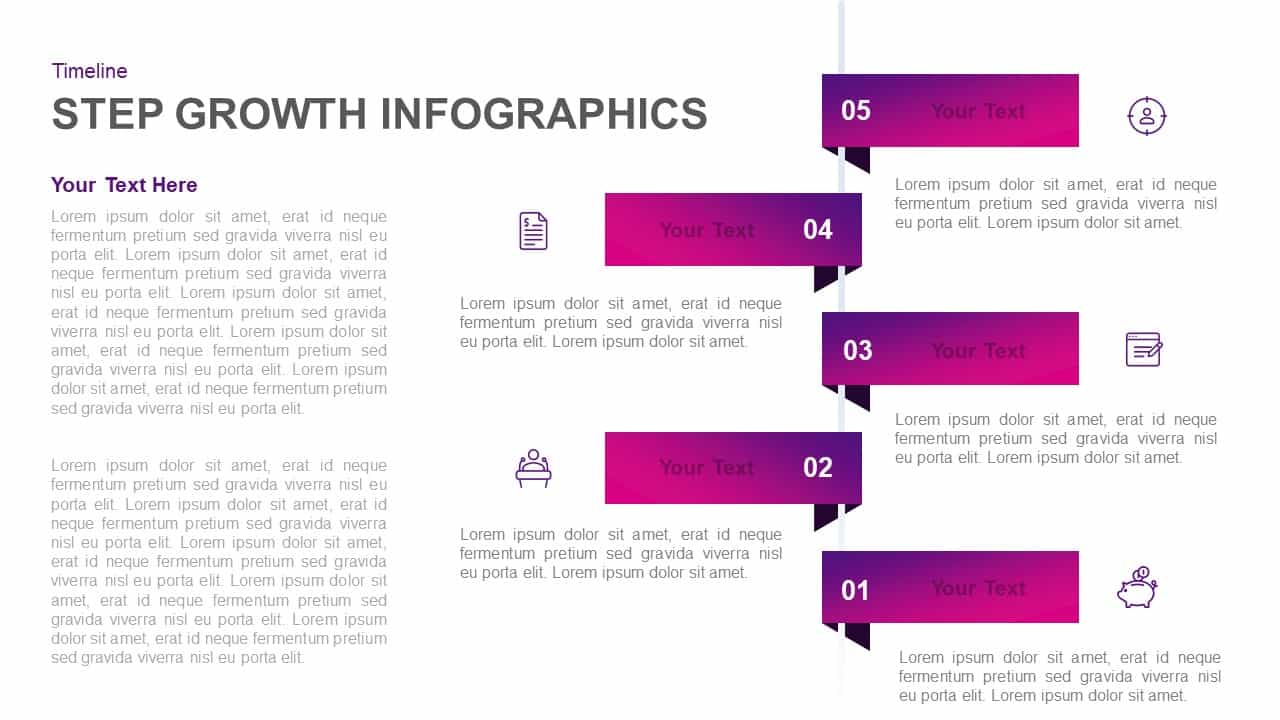
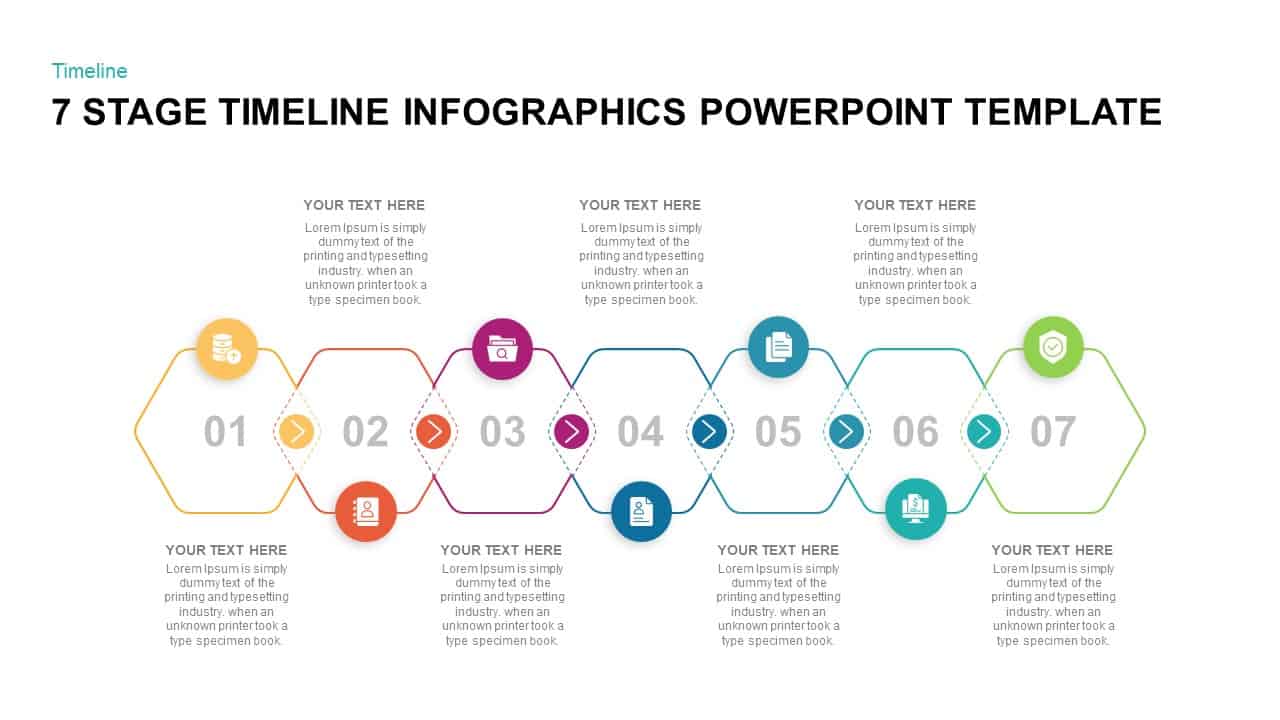
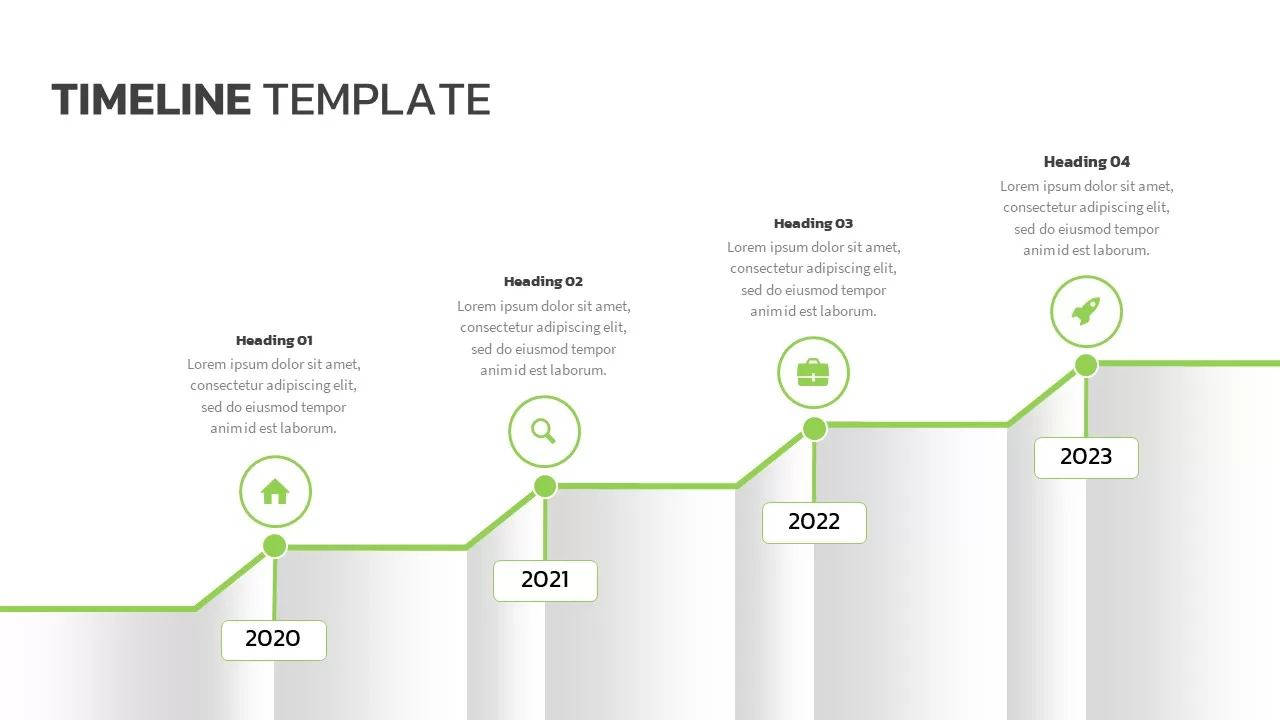
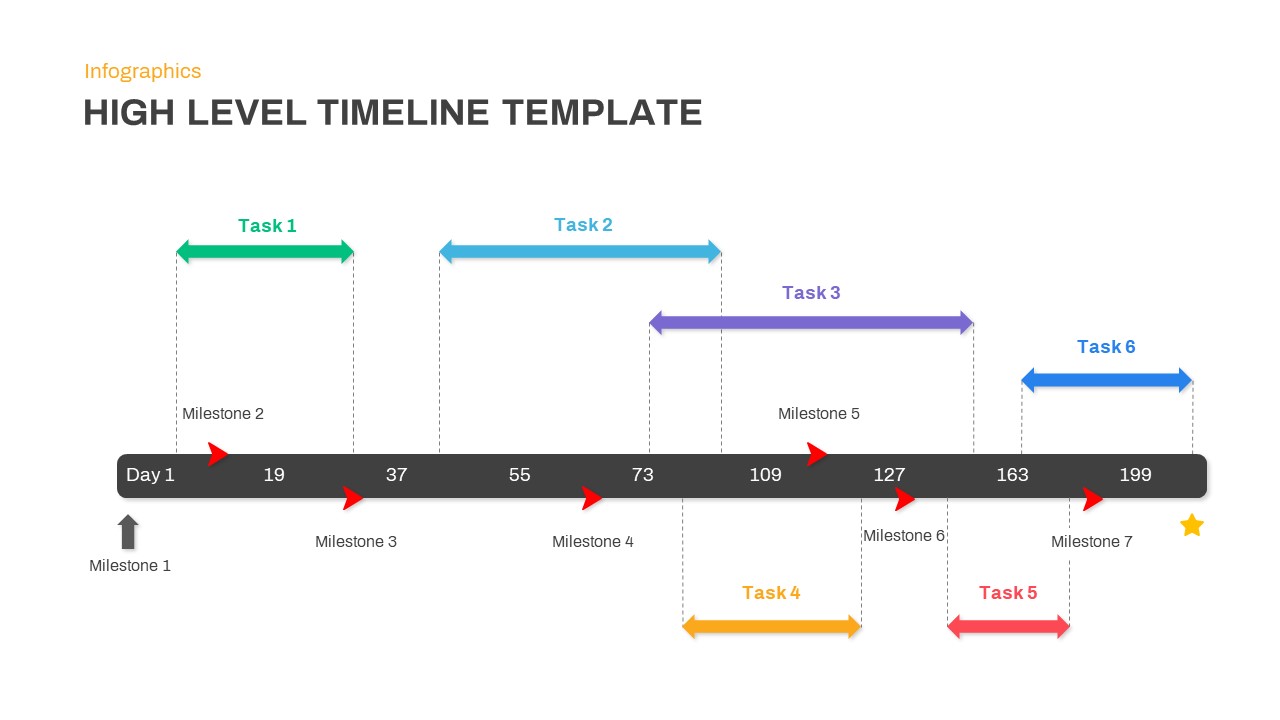
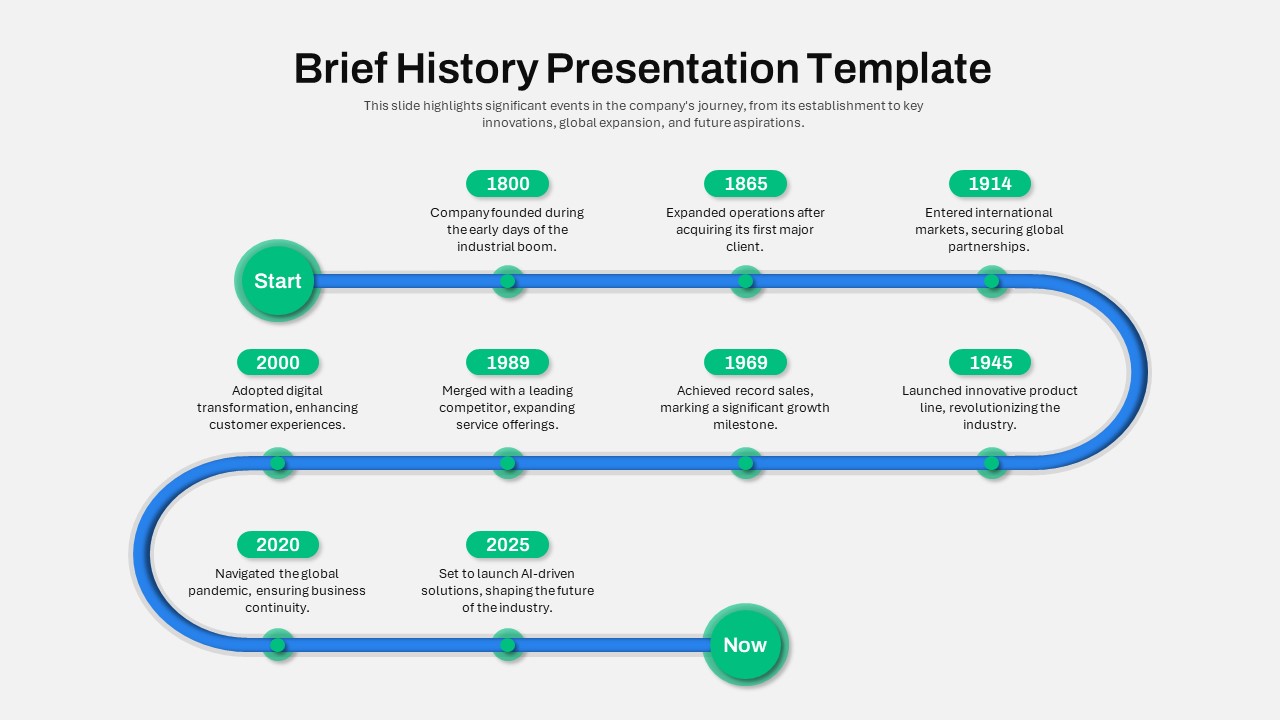
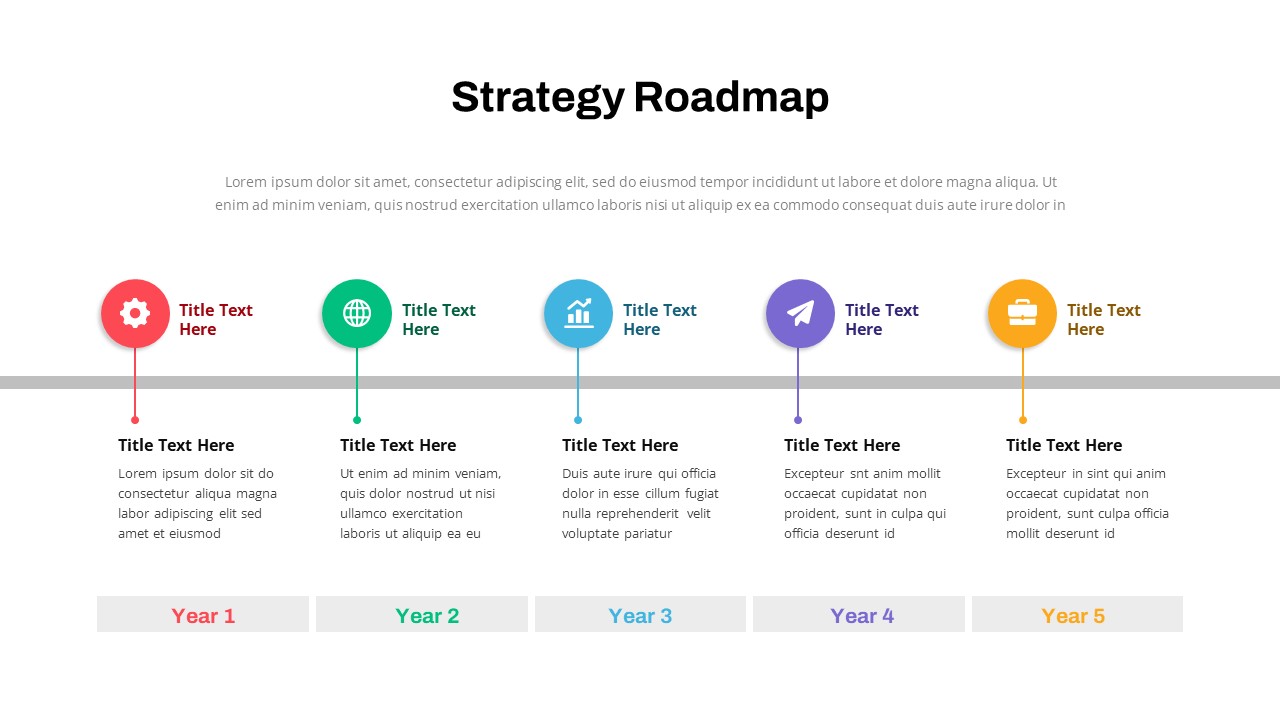
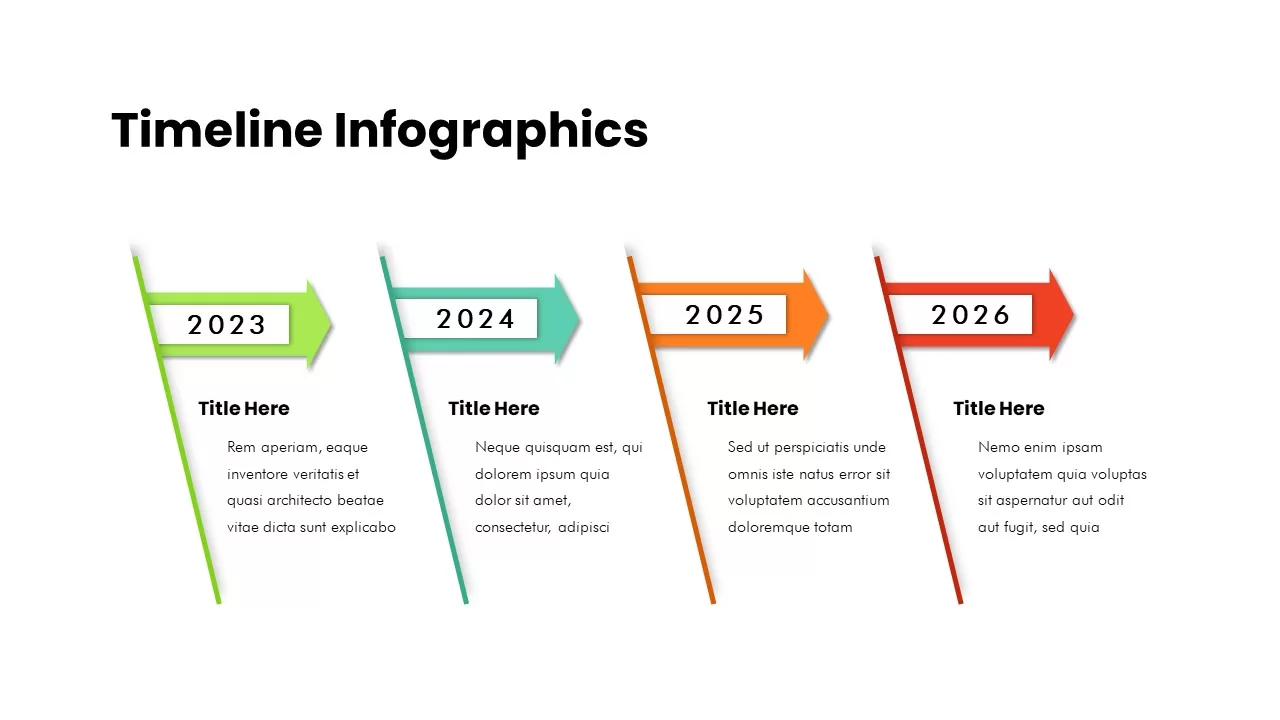
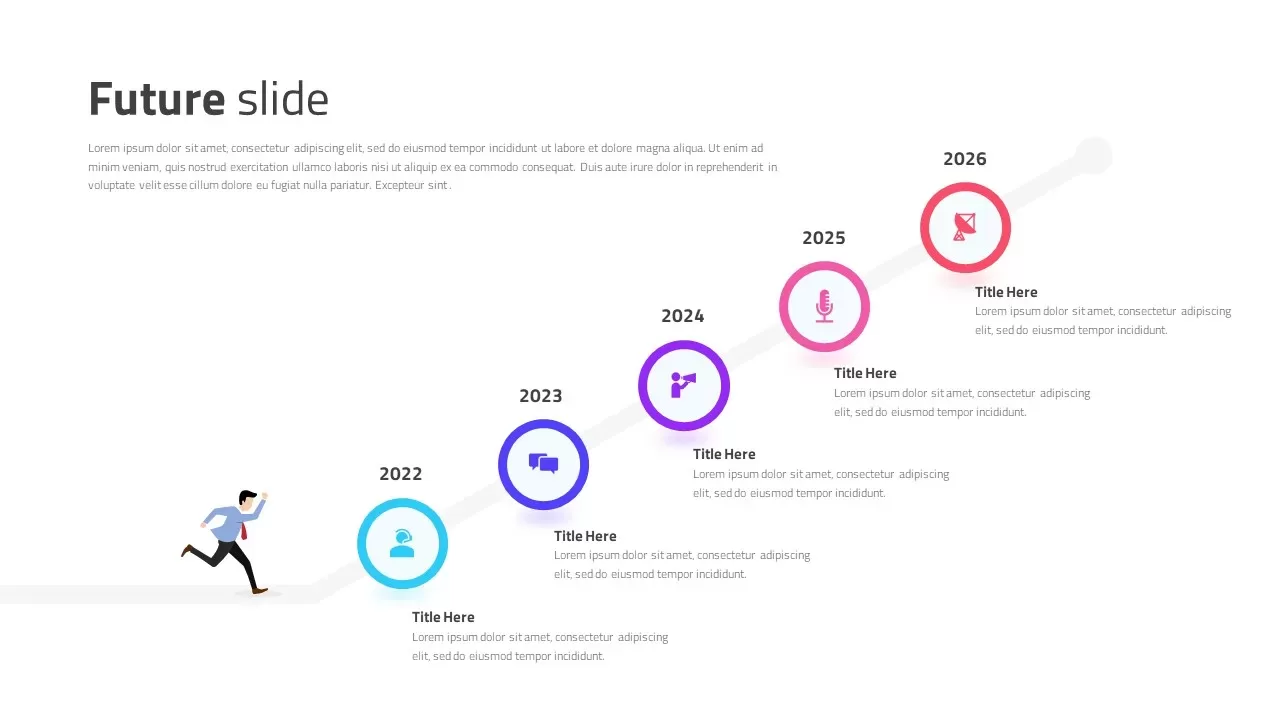
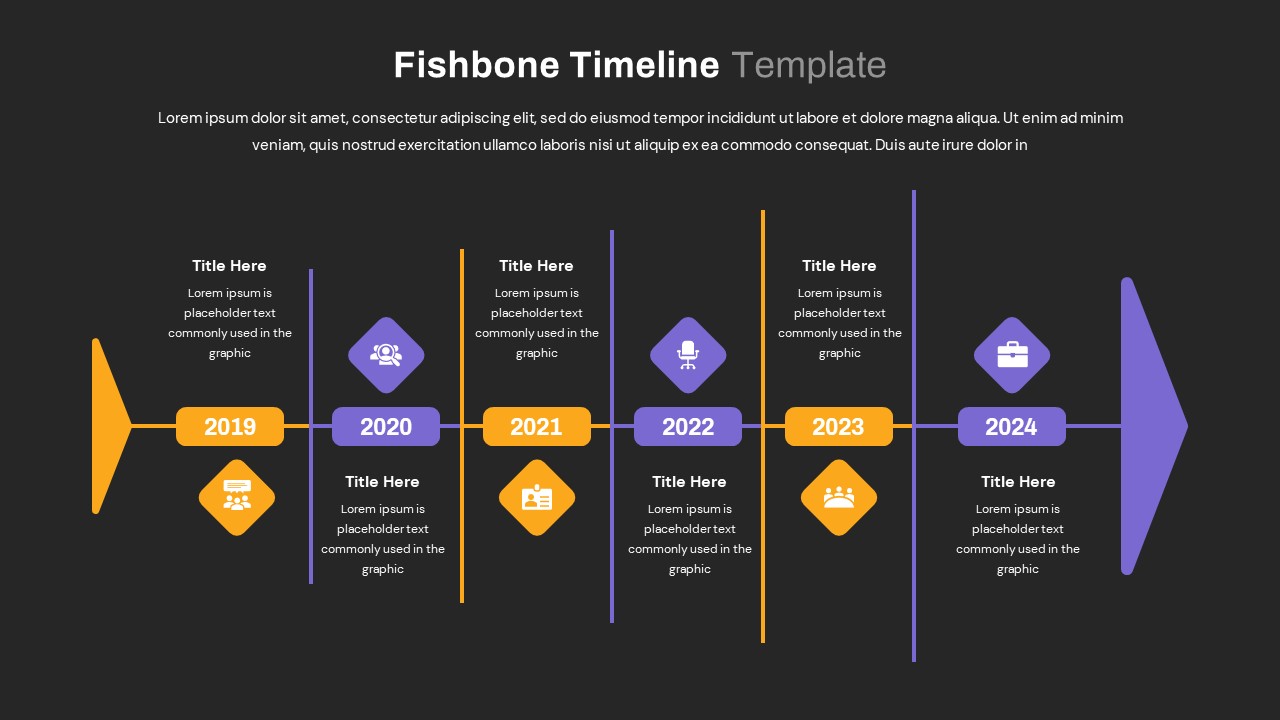
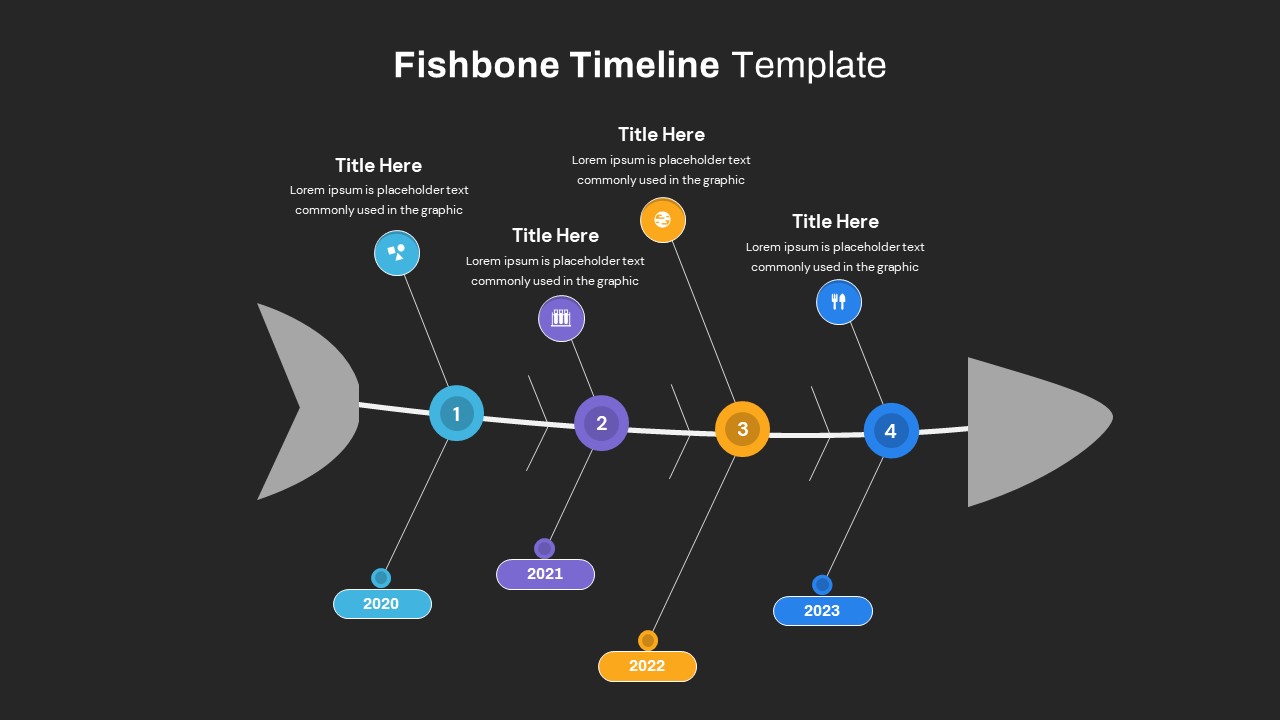
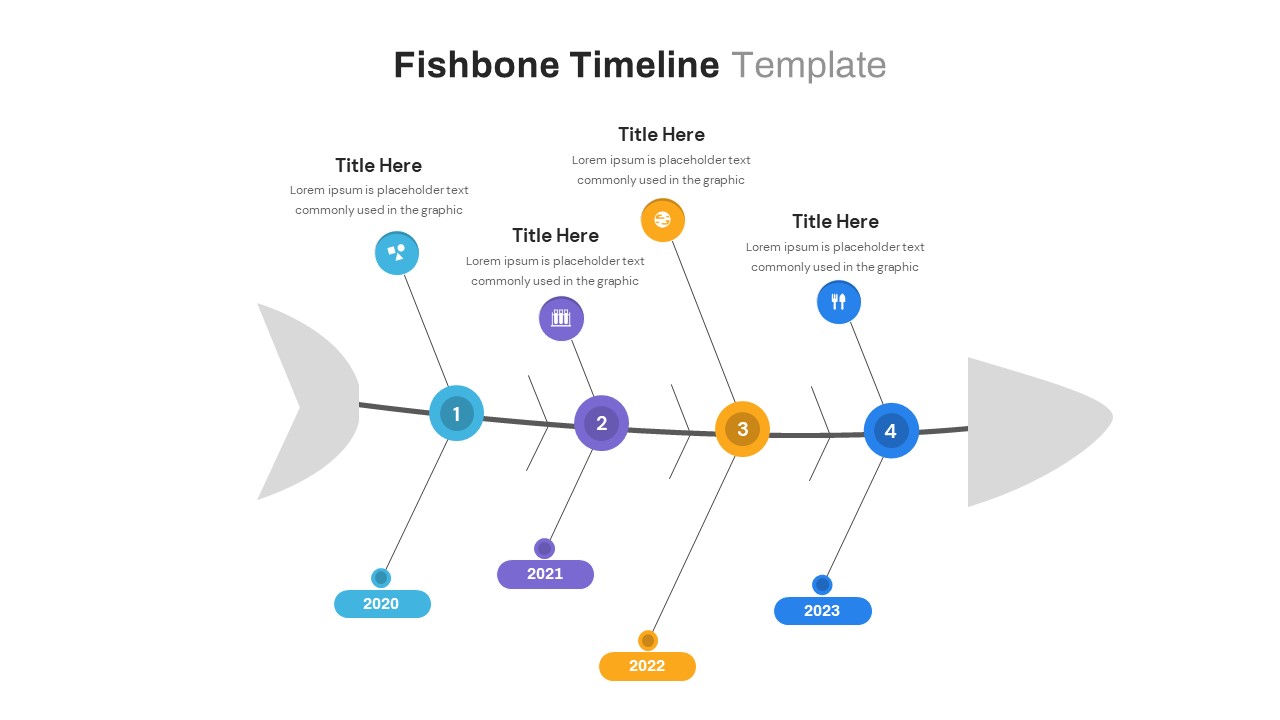
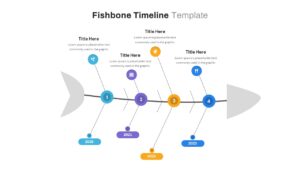
Leverage this fishbone timeline infographic series to present chronological sequences and project milestones across two cohesive layouts. The first layout features a horizontal spine with alternating year markers from 2019 to 2024, each highlighted by color-coded diamond icons and title placeholders for succinct event descriptions. The second layout offers a curved fishbone design with four numbered nodes (2020–2023) connected by angled lines and customizable icon markers, enabling focused storytelling and visual differentiation. Built entirely with editable vector shapes, this template allows easy adjustment of colors, icons, and text for seamless branding integration.
Each slide includes intuitive placeholders for headings and descriptions, plus scalable icons that clearly denote key milestones, tasks, or causal factors. The clean layouts ensure that your audience’s attention remains on the progression of events, while optional connector lines and marker shapes reinforce relationships between timeline points. Master slide functionality in both PowerPoint and Google Slides preserves formatting across platforms, making it simple to duplicate, reorder, or extend the timeline.
Ideal for mapping project phases, illustrating product roadmaps, or analyzing cause-and-effect scenarios, these fishbone timeline slides support process optimization and strategic planning. Use consistent color schemes or assign unique hues to each marker to emphasize priority events or category groupings. The flexible design also accommodates additional nodes or date ranges, allowing you to tailor the timeline depth to your specific needs.
These versatile layouts adapt seamlessly to corporate, academic, and startup environments, ensuring consistent visual impact across departments and industries.
Empower your presentations with a professional and visually engaging timeline solution that highlights critical milestones and dependencies in a clear, digestible format.
Who is it for
Project managers, business analysts, product teams, and consultants will benefit from these slides when illustrating roadmaps, tracking milestones, or diagnosing process bottlenecks. Corporate communicators, marketing strategists, and educators can also leverage the fishbone design to drive audience engagement.
Other Uses
Repurpose these layouts for cause-and-effect analyses, risk assessments, strategic planning sessions, or process improvement workshops. Augment team retrospectives, client proposals, or executive briefings by visualizing dependencies and decision points with clarity.
Login to download this file

Item ID
SB03707
Related Templates

Multi-Series Curved Line Graph Analytics Template for PowerPoint & Google Slides
Comparison Chart
Multi-Series Stacked Bar Chart Template for PowerPoint & Google Slides
Bar/Column
Editable Multi-Series Peak Line Chart Template for PowerPoint & Google Slides
Comparison Chart
Multi-Series Line Chart with Icons Template for PowerPoint & Google Slides
Comparison Chart
Multi-Series Vertical Dot Chart Template for PowerPoint & Google Slides
Comparison Chart
Dynamic Three-Series Stacked Area Chart Template for PowerPoint & Google Slides
Comparison Chart
Fishbone Cause and Effect Infographic Template for PowerPoint & Google Slides
Infographics
Three-Section Fishbone Process Diagram template for PowerPoint & Google Slides
Process
Fishbone RCA Diagram Template for PowerPoint & Google Slides
Business Strategy
Fishbone Diagram Overview template for PowerPoint & Google Slides
Infographics
Fishbone Diagram Cause-and-Effect Template for PowerPoint & Google Slides
Process
Free Color-Coded Fishbone Diagram Template for PowerPoint & Google Slides
Project
Free
Fishbone Cause and Effect Diagram Template for PowerPoint & Google Slides
Process
Fishbone Diagram Analysis Template for PowerPoint & Google Slides
Flow Charts
Fishbone Cause Analysis Diagram Template for PowerPoint & Google Slides
Process
Underwater Fishbone Cause-Effect Diagram Template for PowerPoint & Google Slides
Process
Fishbone Process Diagram template for PowerPoint & Google Slides
Infographics
Free Root Cause Analysis Fishbone Diagram Template for PowerPoint & Google Slides
Process
Free
Fishbone (Ishikawa) Diagram for PowerPoint & Google Slides
Process
5 Why Fishbone Diagram for Root Cause Analysis in PowerPoint & Google Slides
Process
7-Stage Colorful Timeline Infographic Template for PowerPoint & Google Slides
Timeline
Creative Pencil Timeline Infographic Template for PowerPoint & Google Slides
Timeline
Three Four Five Stage Timeline Infographic Template for PowerPoint & Google Slides
Timeline
Curved Five-Section Timeline Infographic template for PowerPoint & Google Slides
Timeline
Curved Road Map Timeline Infographic Template for PowerPoint & Google Slides
Roadmap
Roadmap Infographic Timeline Slide Template for PowerPoint & Google Slides
Roadmap
Horizontal Timeline Infographic Template for PowerPoint & Google Slides
Timeline
Professional Linear Timeline Infographic Template for PowerPoint & Google Slides
Timeline
Six-Stage Hexagon Timeline Infographic Template for PowerPoint & Google Slides
Timeline

Medical Stethoscope Timeline Infographic Template for PowerPoint & Google Slides
Timeline

Timeline Infographic Design Seven Stage template for PowerPoint & Google Slides
Timeline

Timeline Roadmap Milestones Infographic Template for PowerPoint & Google Slides
Roadmap
Modern Bubble Timeline Infographic Template for PowerPoint & Google Slides
Timeline
Creative Bubble Timeline Infographic Template for PowerPoint & Google Slides
Timeline
Multi-Year Timeline Infographic Template for PowerPoint & Google Slides
Timeline
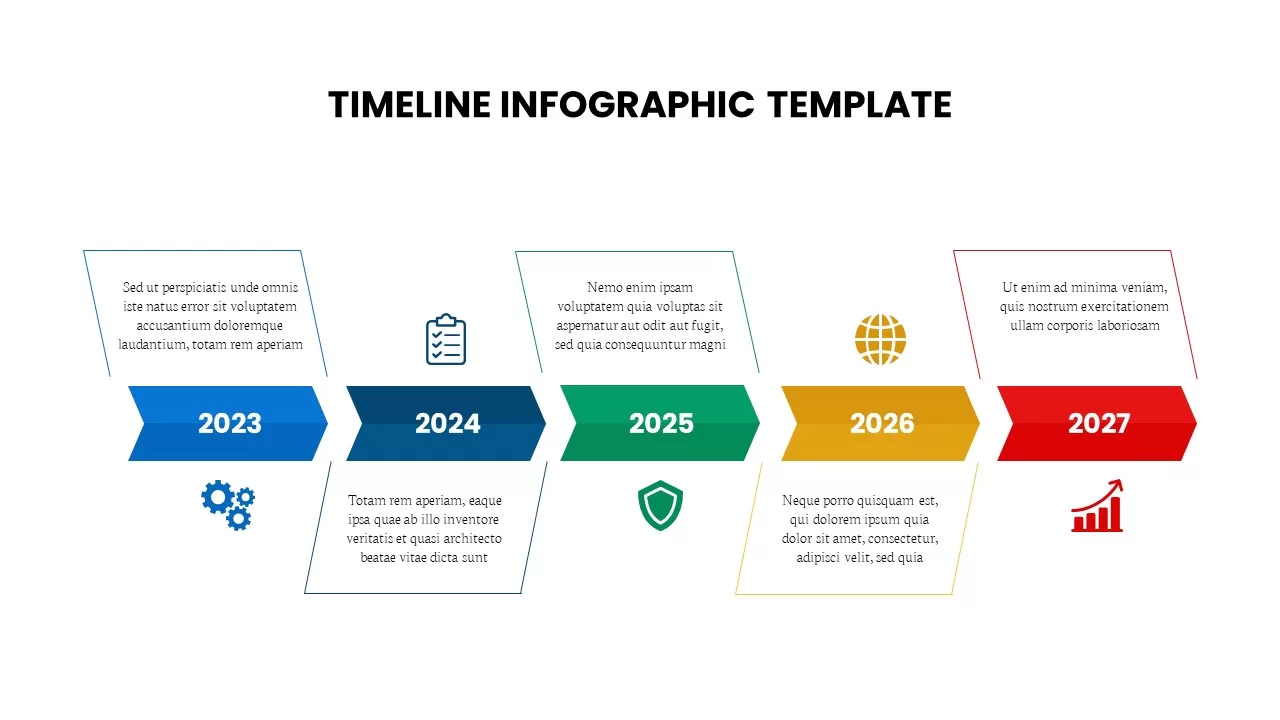
Arrow Timeline Infographic Slide Template for PowerPoint & Google Slides
Timeline
Technology Advancement Timeline Infographic Template for PowerPoint & Google Slides
Information Technology
Animated 5-Stage Puzzle Timeline Infographic Template for PowerPoint & Google Slides
Timeline
5 Stage Circular Timeline Infographic Template for PowerPoint & Google Slides
Timeline
Six-Stage Timeline Infographic Template for PowerPoint & Google Slides
Timeline
5 Stage Timeline Infographic Slide Template for PowerPoint & Google Slides
Timeline
Five-Year Gradient Timeline Infographic Template for PowerPoint & Google Slides
Timeline
Five-Step Growth Timeline Infographic Template for PowerPoint & Google Slides
Timeline
Business Timeline Envelope Infographic Template for PowerPoint & Google Slides
Timeline
5-Stage Timeline Infographic Slide Template for PowerPoint & Google Slides
Timeline
Seven-Stage Hexagon Timeline Infographic Template for PowerPoint & Google Slides
Timeline
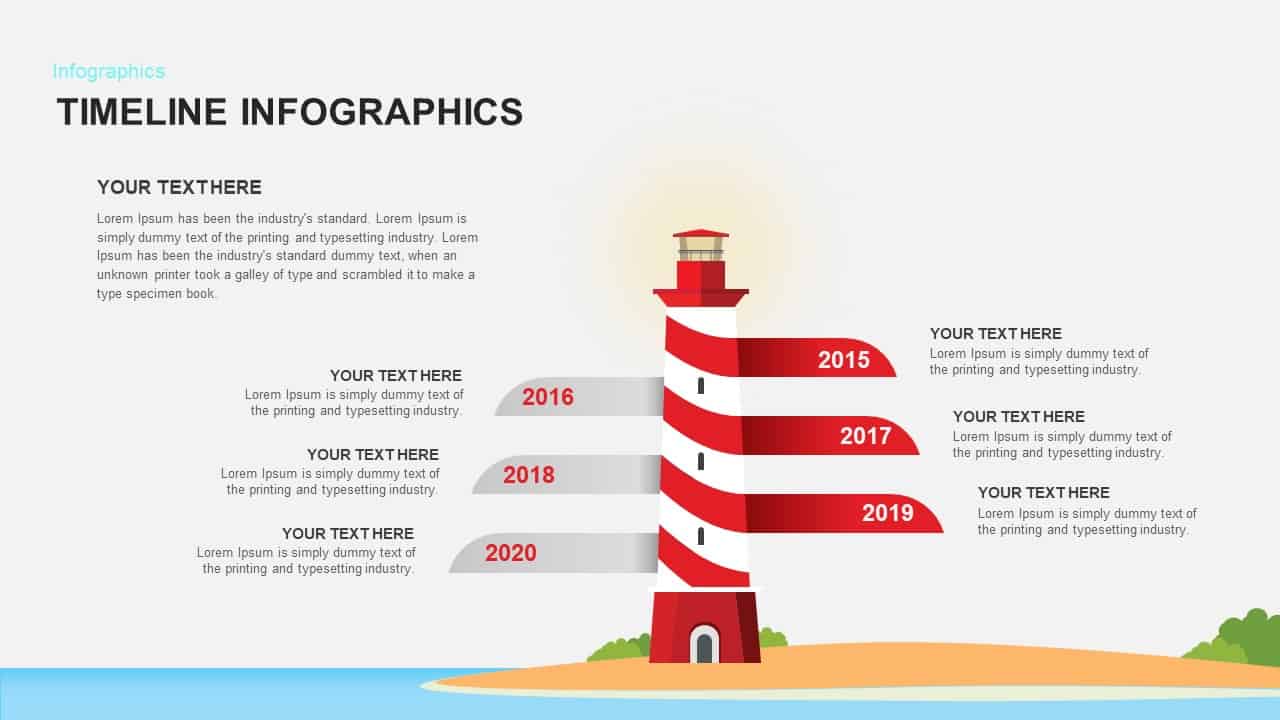
Lighthouse Timeline Infographic Template for PowerPoint & Google Slides
Timeline
Six-Stage Road Map Infographic Timeline Template for PowerPoint & Google Slides
Roadmap
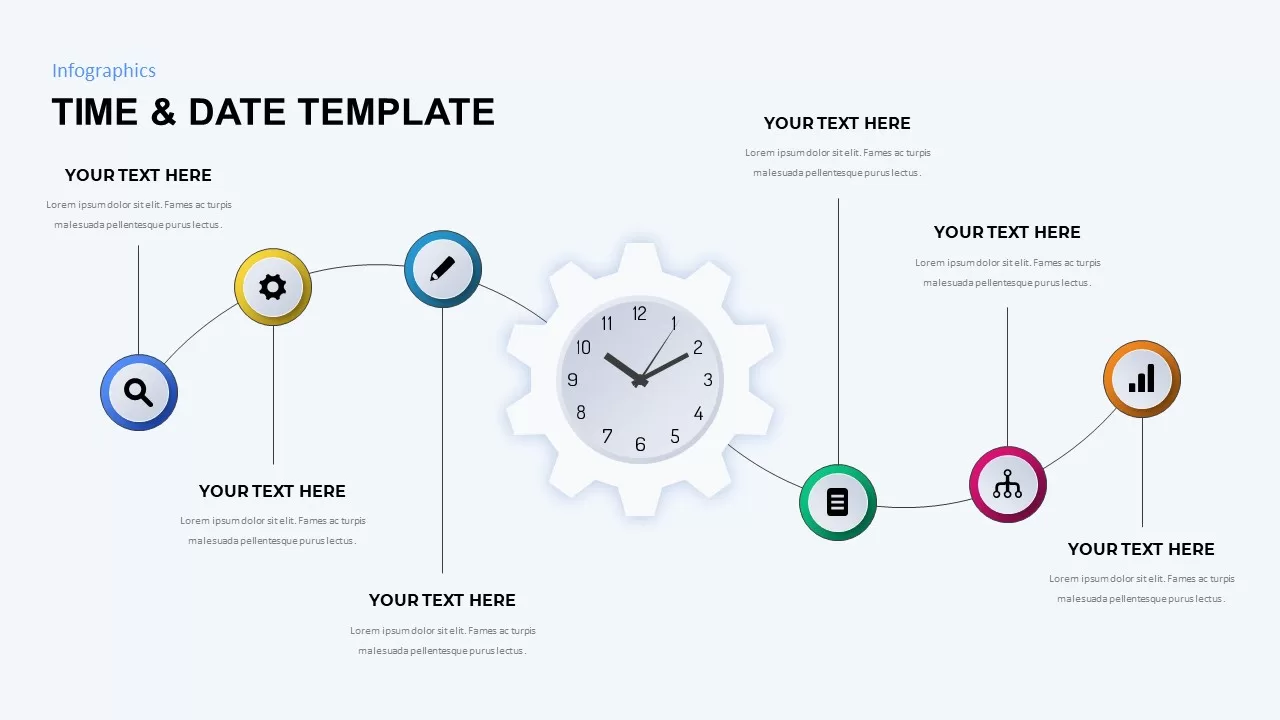
Time & Date Infographic Timeline Template for PowerPoint & Google Slides
Decks
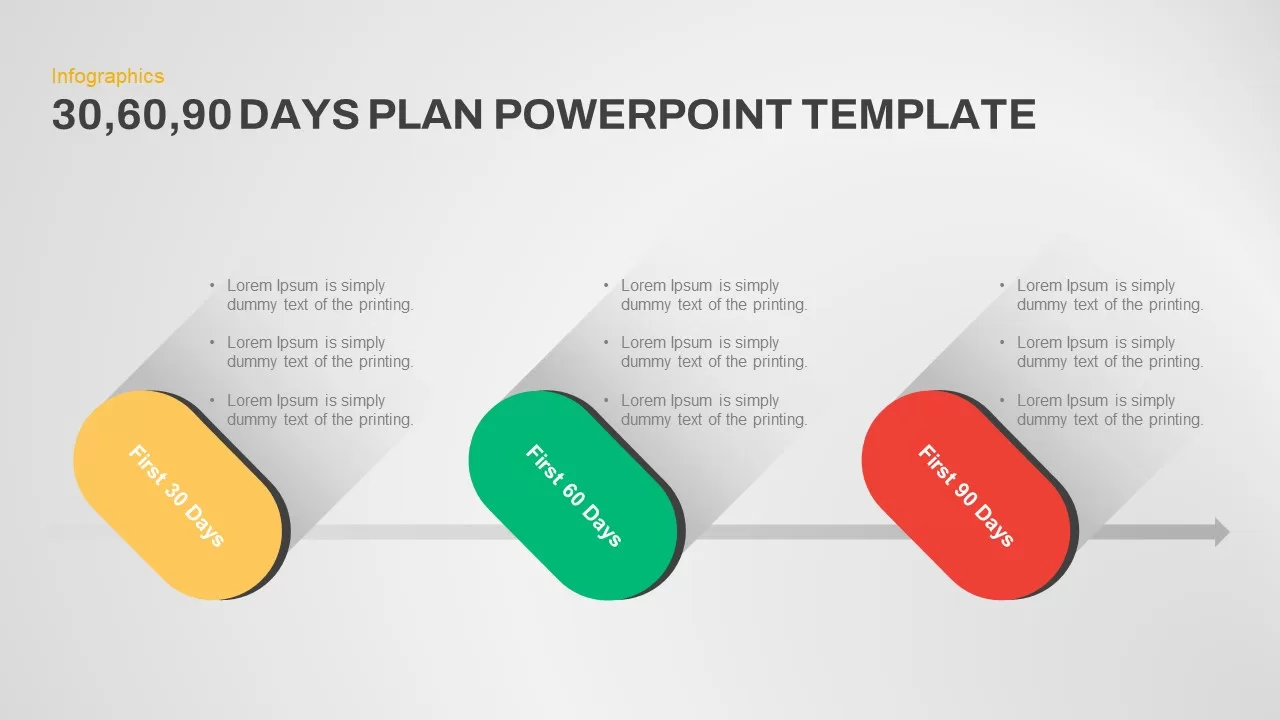
Pill-Style 30-60-90 Timeline Infographic Template for PowerPoint & Google Slides
Timeline
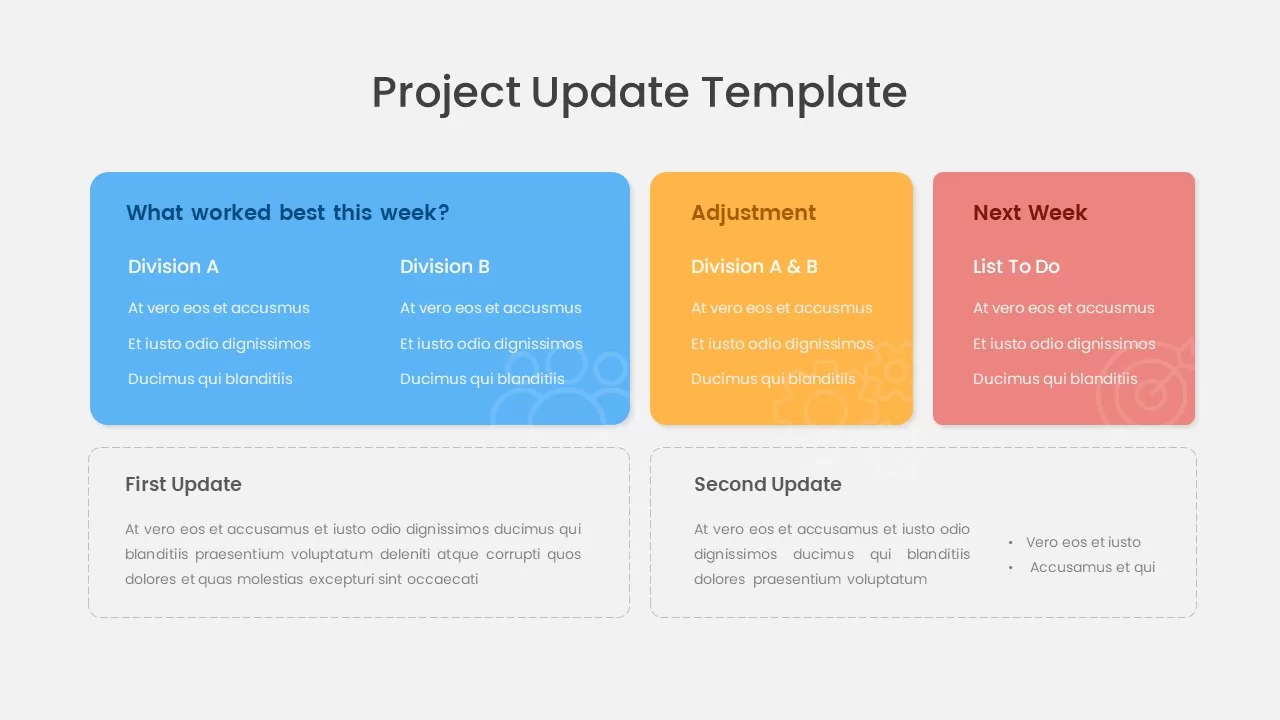
Project Update & Timeline Infographic Template for PowerPoint & Google Slides
Business
Modern Green Timeline Infographic Template for PowerPoint & Google Slides
Timeline
Free Multi-Year Arrow Timeline Infographic Template for PowerPoint & Google Slides
Timeline
Free
Free Five-Step Circular Timeline Infographic Template for PowerPoint & Google Slides
Timeline
Free
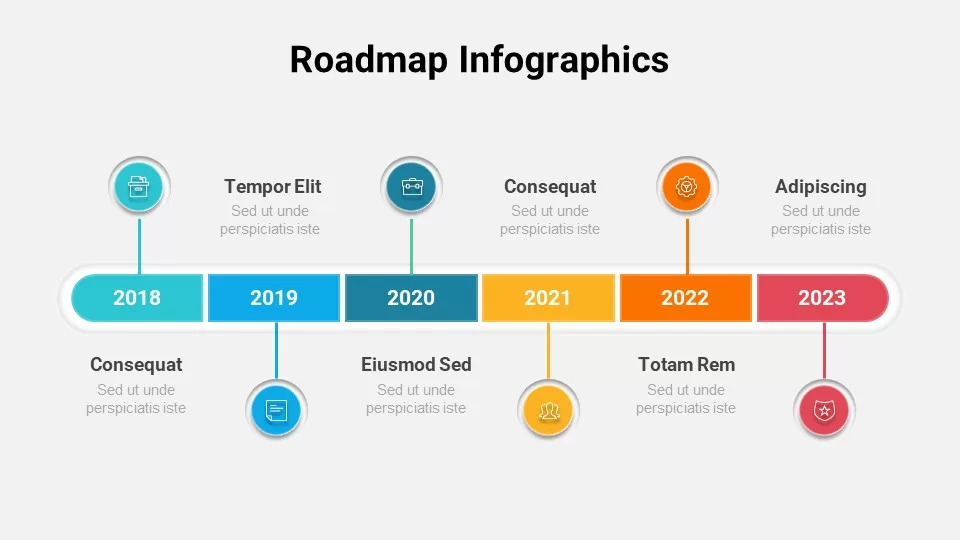
Free Colorful Roadmap Timeline Infographic Template for PowerPoint & Google Slides
Roadmap
Free
Timeline Infographic Steps template for PowerPoint & Google Slides
Business Plan
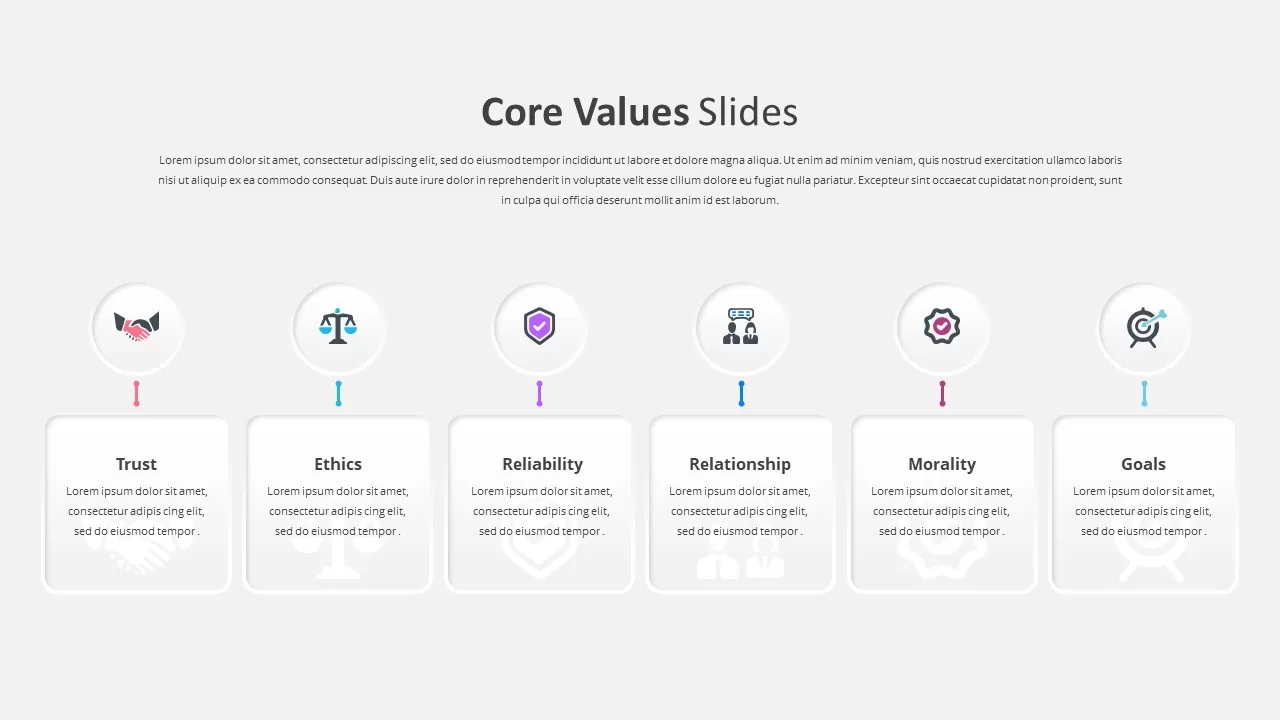
Six Core Values Infographic Timeline Template for PowerPoint & Google Slides
Comparison
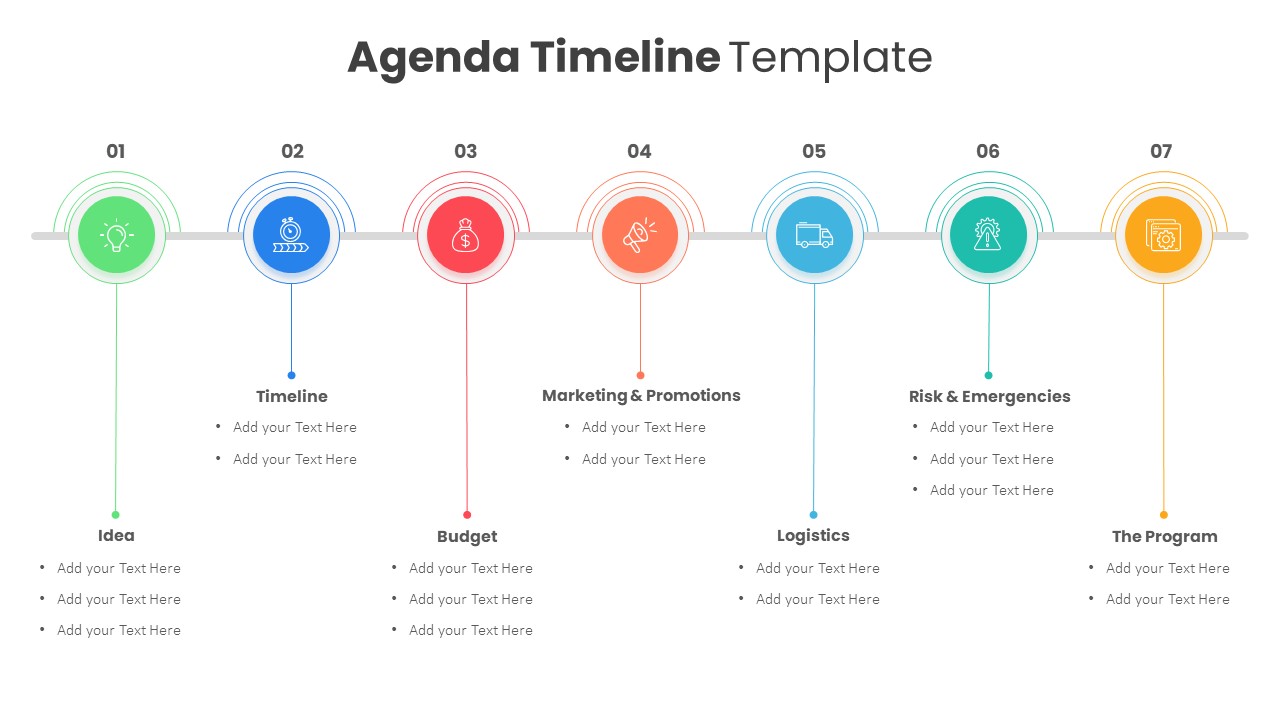
Colorful Agenda Timeline Infographic Template for PowerPoint & Google Slides
Agenda
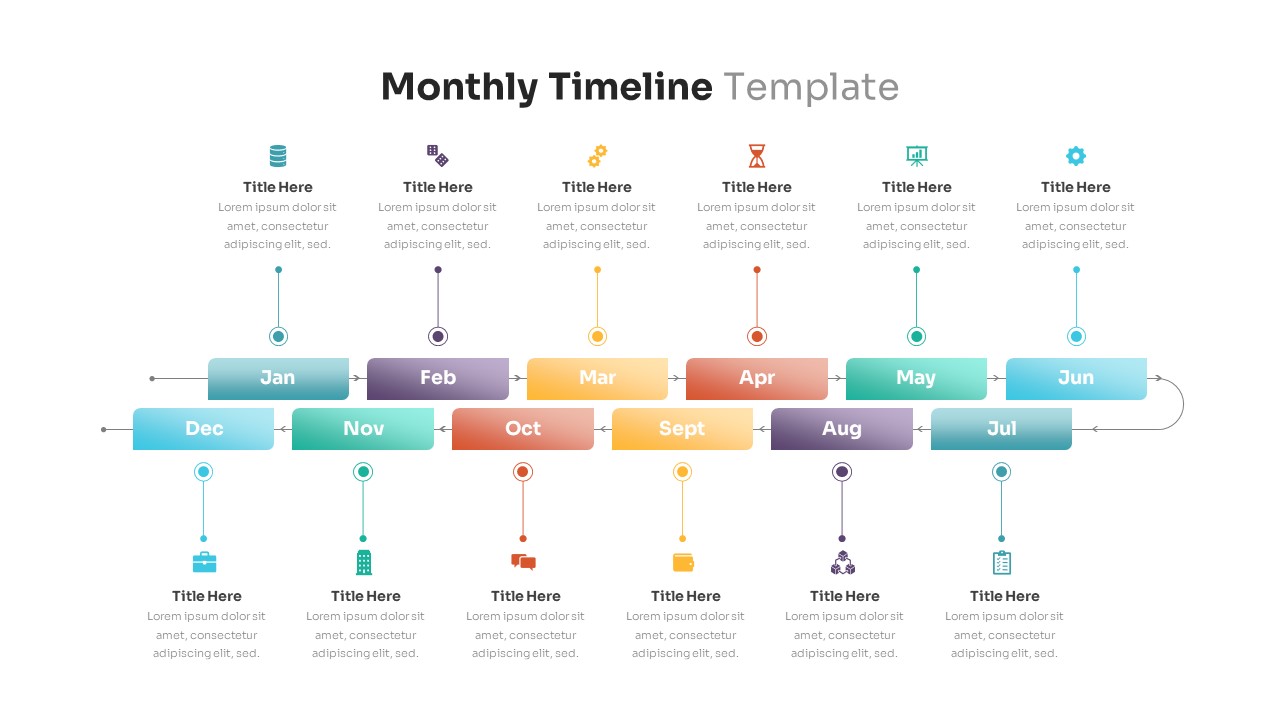
Editable Monthly Timeline Infographic Template for PowerPoint & Google Slides
Timeline
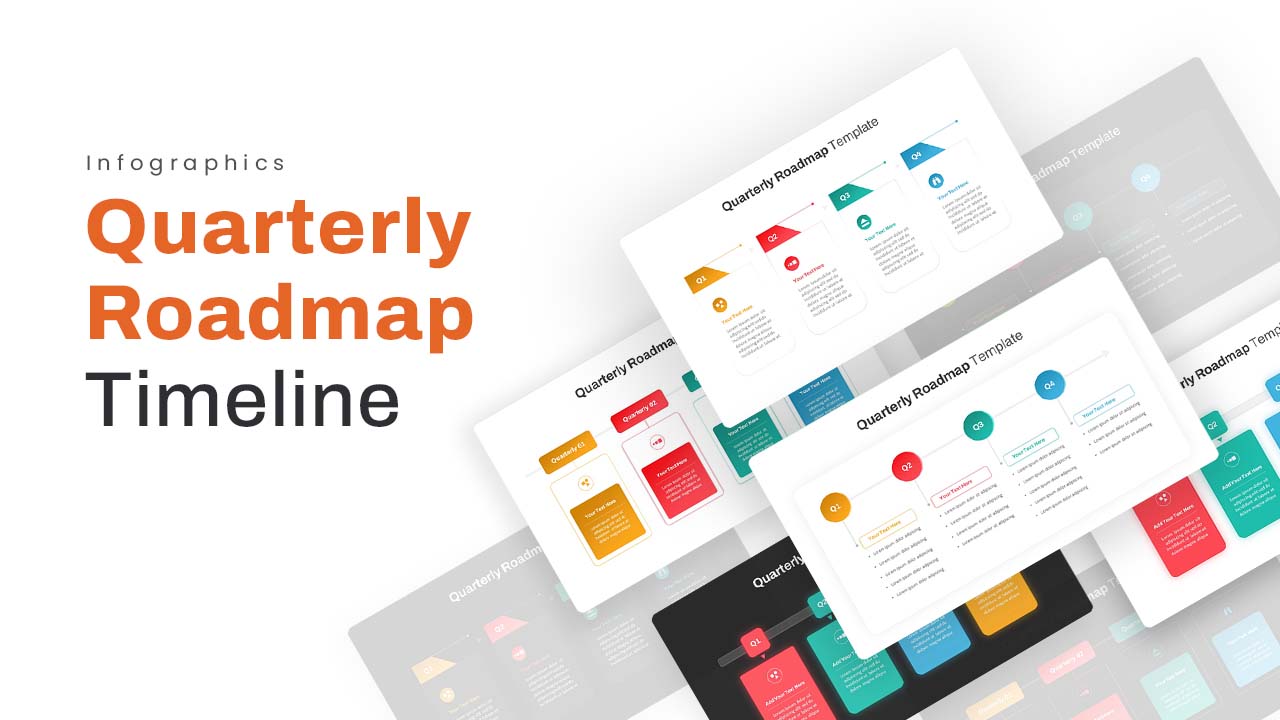
Quarterly Roadmap Timeline Infographic Template for PowerPoint & Google Slides
Timeline
Colorful Agile Timeline Infographic Template for PowerPoint & Google Slides
Timeline
Free
Dynamic Chevron Timeline Infographic Template for PowerPoint & Google Slides
Timeline
Circular Timeline Infographic Template for PowerPoint & Google Slides
Timeline
Quarterly Timeline Infographic Template for PowerPoint & Google Slides
Timeline
Minimalist Timeline Infographic Template for PowerPoint & Google Slides
Timeline
High-Level Timeline Infographic Template for PowerPoint & Google Slides
Timeline
Modern Six-Point Timeline Infographic Template for PowerPoint & Google Slides
Timeline
Vertical Crime Timeline Infographic Template for PowerPoint & Google Slides
Timeline
Personal Timeline Infographic Template for PowerPoint & Google Slides
Timeline
Brief History Timeline Infographic Template for PowerPoint & Google Slides
Timeline
Project Milestone Timeline Infographic Template for PowerPoint & Google Slides
Timeline
Curved Road Timeline Infographic Template for PowerPoint & Google Slides
Timeline
Dark Horizontal Timeline Infographic Template for PowerPoint & Google Slides
Timeline
Strategy Roadmap Timeline Slides Template for PowerPoint & Google Slides
Roadmap
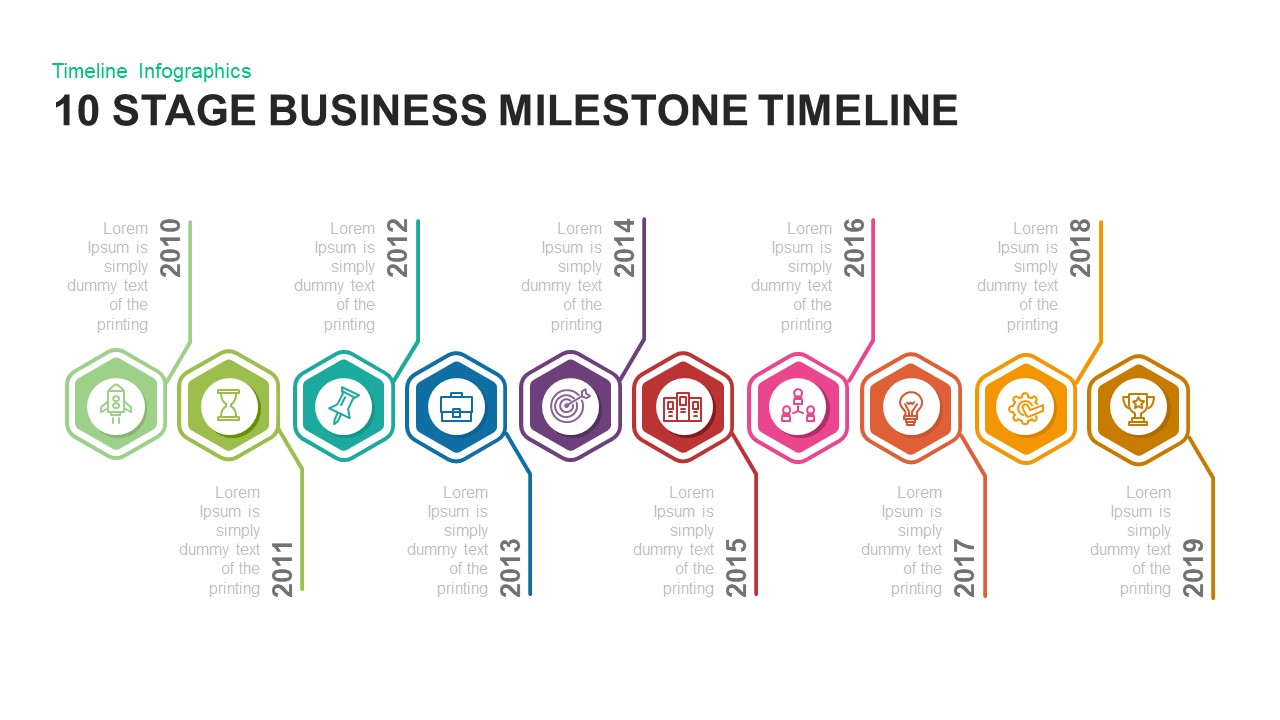
10 Stage Business Milestone Timeline PowerPoint Template for PowerPoint & Google Slides
Timeline
Google Ads Optimization & Performance Infographic Template for PowerPoint & Google Slides
Digital Marketing
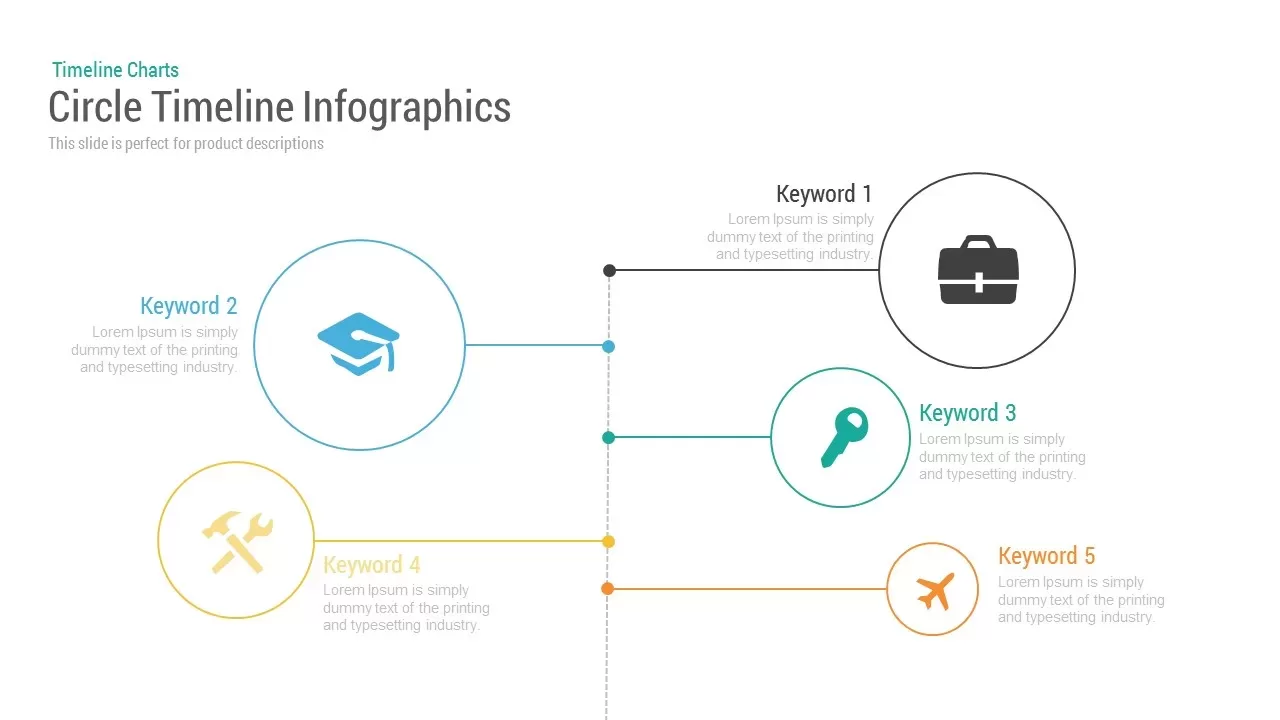
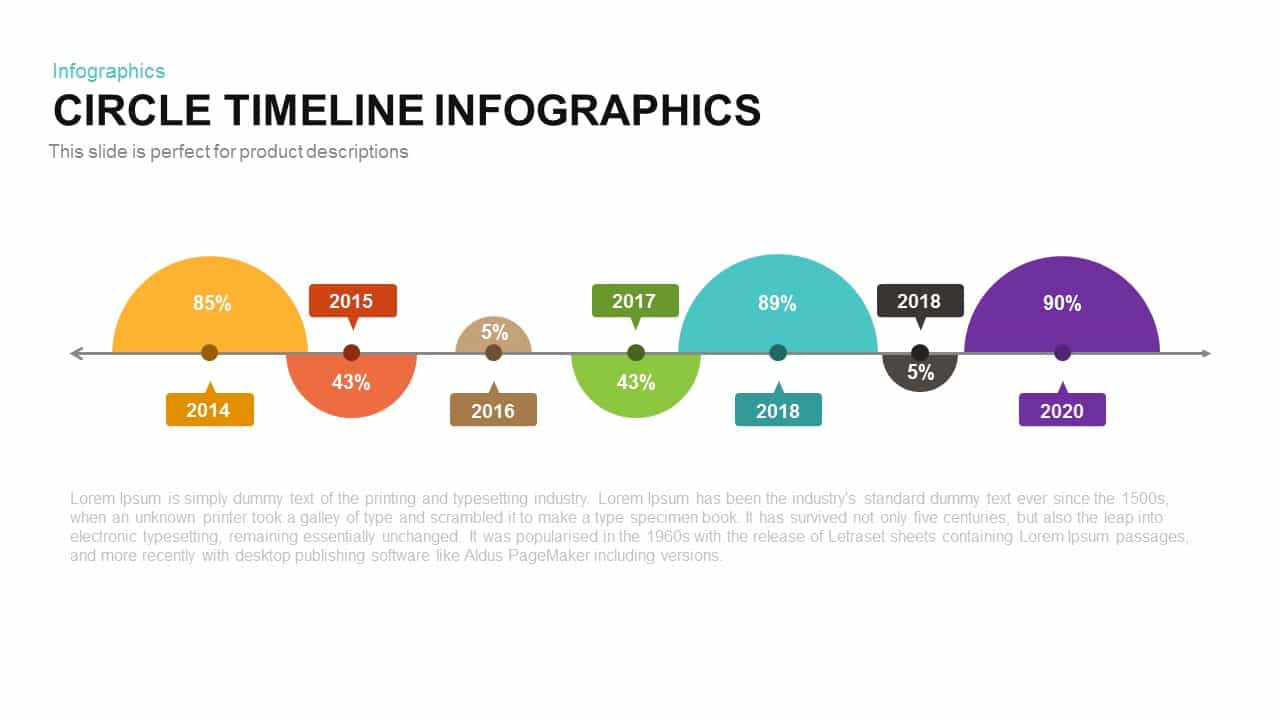
Circle Timeline Infographics template for PowerPoint & Google Slides
Timeline
Creative Dynamic Gantt Chart Timeline Template for PowerPoint & Google Slides
Timeline
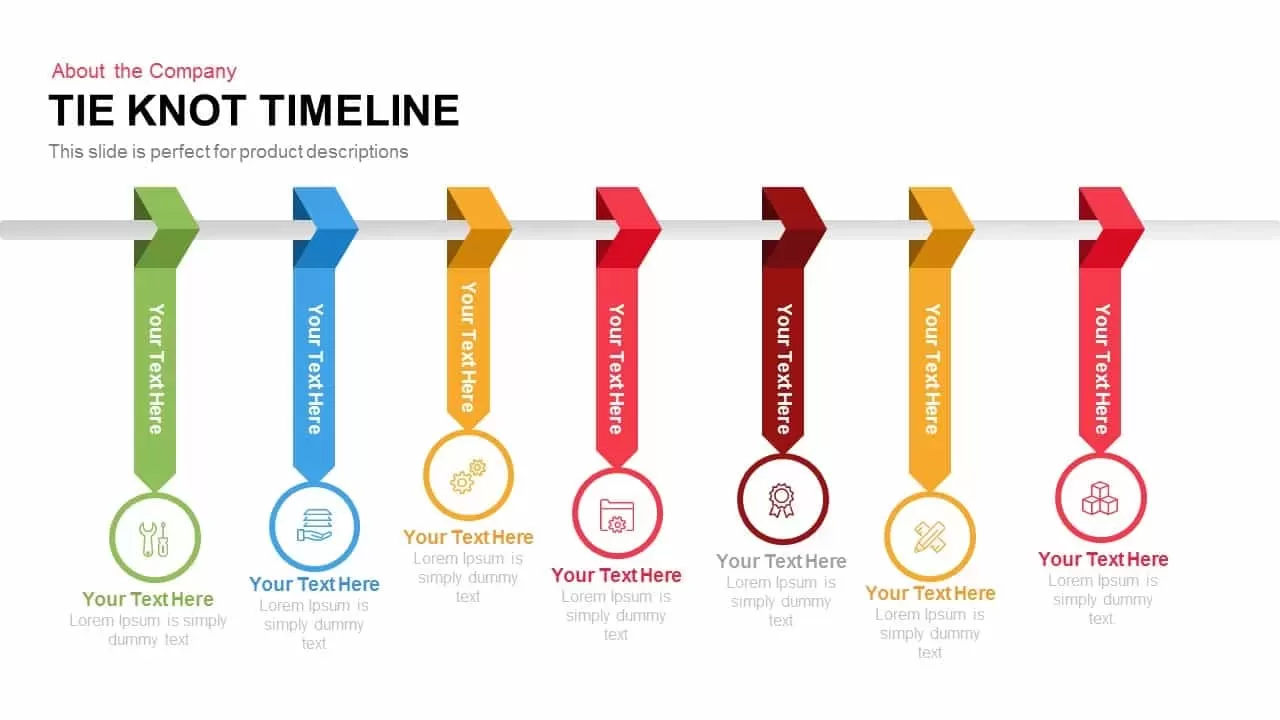
Tie Knot Timeline template for PowerPoint & Google Slides
Timeline
Alternating Circle Timeline Diagram Template for PowerPoint & Google Slides
Timeline

Fully Editable Gantt Chart Timeline template for PowerPoint & Google Slides
Gantt Chart
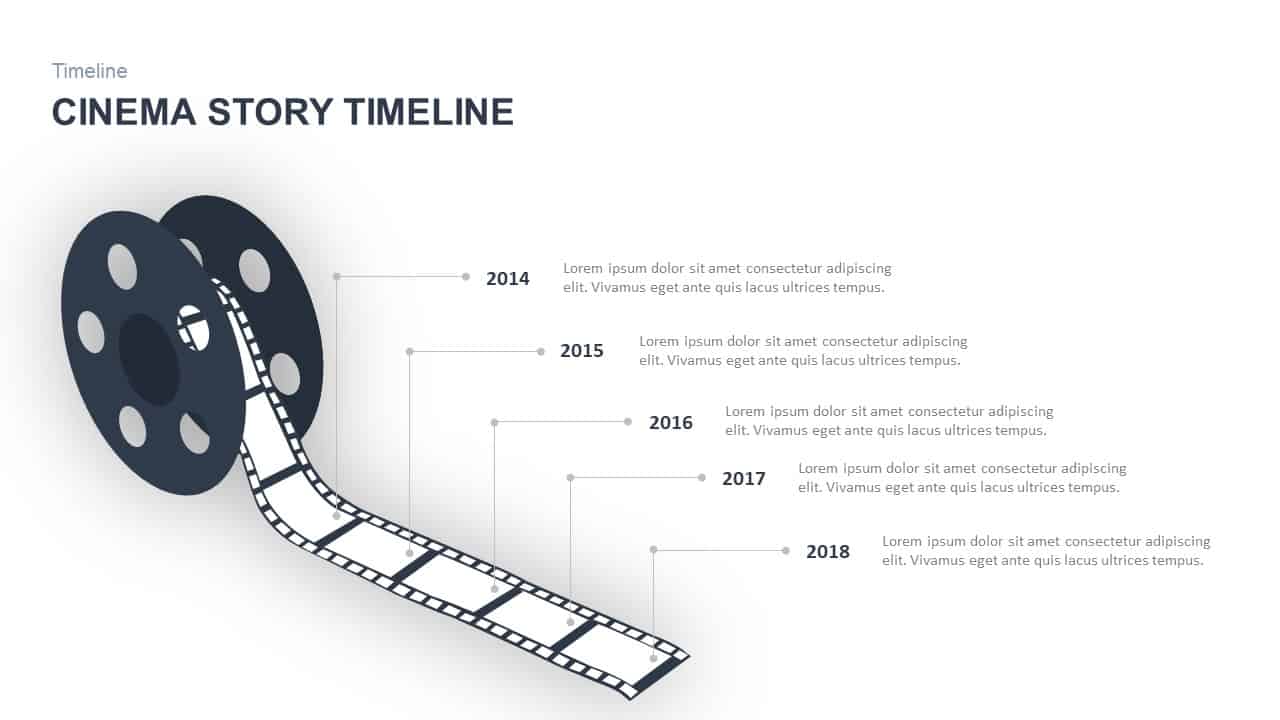
Cinema Story Timeline Reel Illustration Template for PowerPoint & Google Slides
Timeline
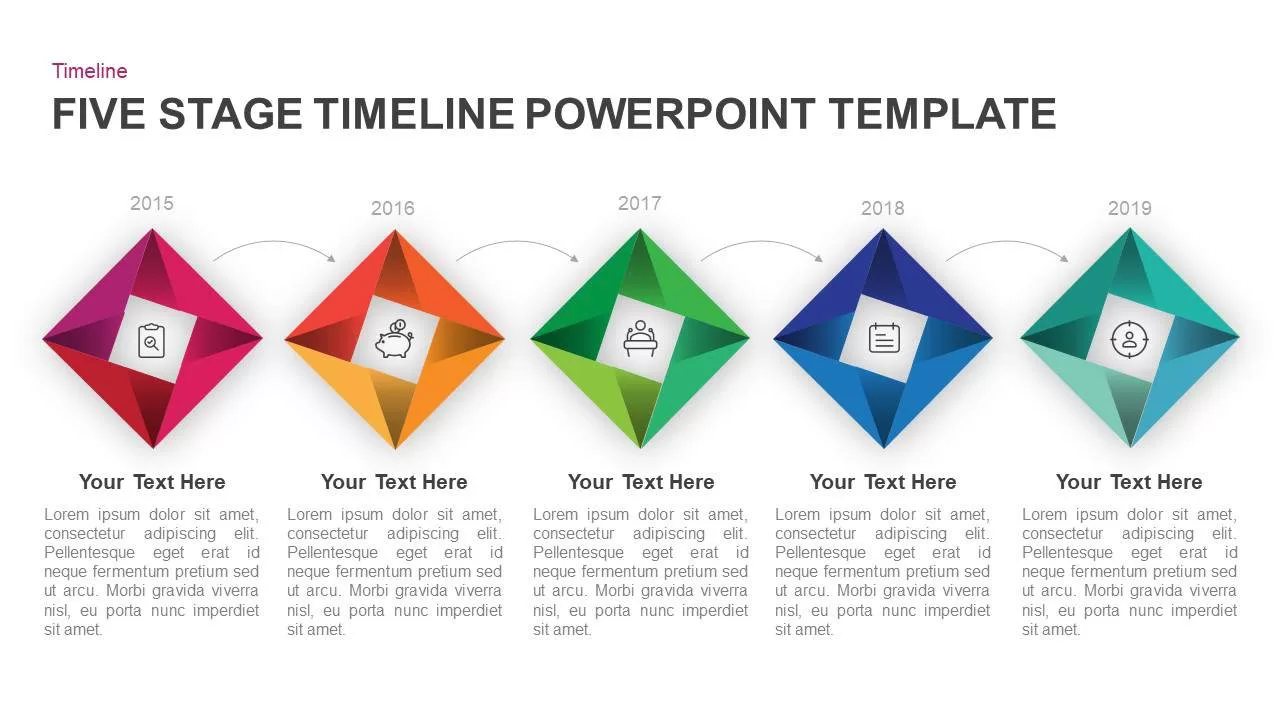
Five-Stage Diamond Timeline Chart Template for PowerPoint & Google Slides
Timeline
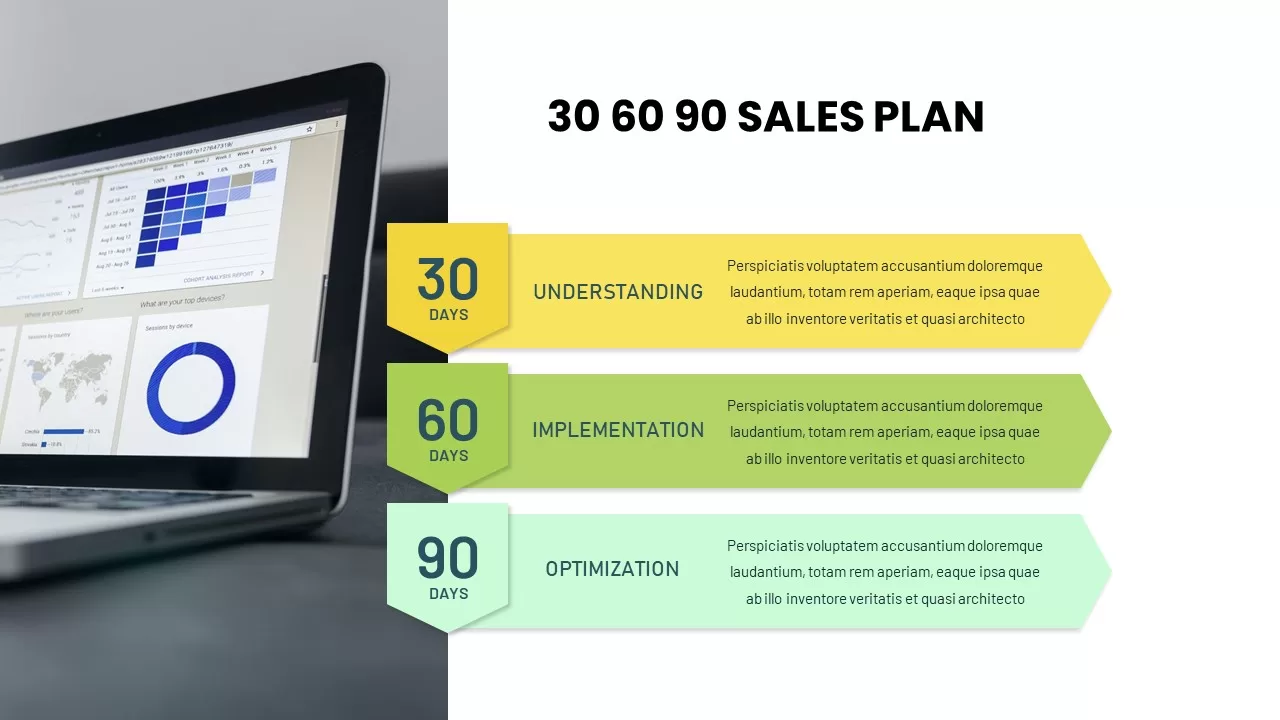
Modern 30-60-90 Sales Plan Timeline Template for PowerPoint & Google Slides
Timeline
Timeline Infographics template for PowerPoint & Google Slides
Timeline
Project Execution Gantt Timeline Template for PowerPoint & Google Slides
Gantt Chart
Diagonal Future Timeline Template for PowerPoint & Google Slides
Timeline
Six-Month Innovation Roadmap Timeline Template for PowerPoint & Google Slides
Roadmap
Timeline Roadmap with Progress Bar Template for PowerPoint & Google Slides
Timeline
Multi-Style Event Timeline Agenda Template for PowerPoint & Google Slides
Timeline
Blank Two-Tier Color-Coded Timeline Template for PowerPoint & Google Slides
Timeline
Interactive Serpentine Timeline Diagram Template for PowerPoint & Google Slides
Timeline
UX Roadmap Timeline Template for PowerPoint & Google Slides
Roadmap

Free Colorful Timeline Infographics Template for PowerPoint & Google Slides
Timeline
Free
Free Next Steps Process Timeline Template for PowerPoint & Google Slides
Project
African American History Timeline Template for PowerPoint & Google Slides
Graphics
Operations Management Free Timeline Template for PowerPoint & Google Slides
Process
Free
Weekly Gantt Chart Project Timeline Template for PowerPoint & Google Slides
Gantt Chart
Applicant Tracking System Timeline Template for PowerPoint & Google Slides
Process
Creative Project Timeline Roadmap Template for PowerPoint & Google Slides
Timeline