Home » Templates » Infographics » Circle » Experience Economy Quadrant Diagram Template for PowerPoint & Google Slides
Experience Economy Quadrant Diagram Template for PowerPoint & Google Slides
Description
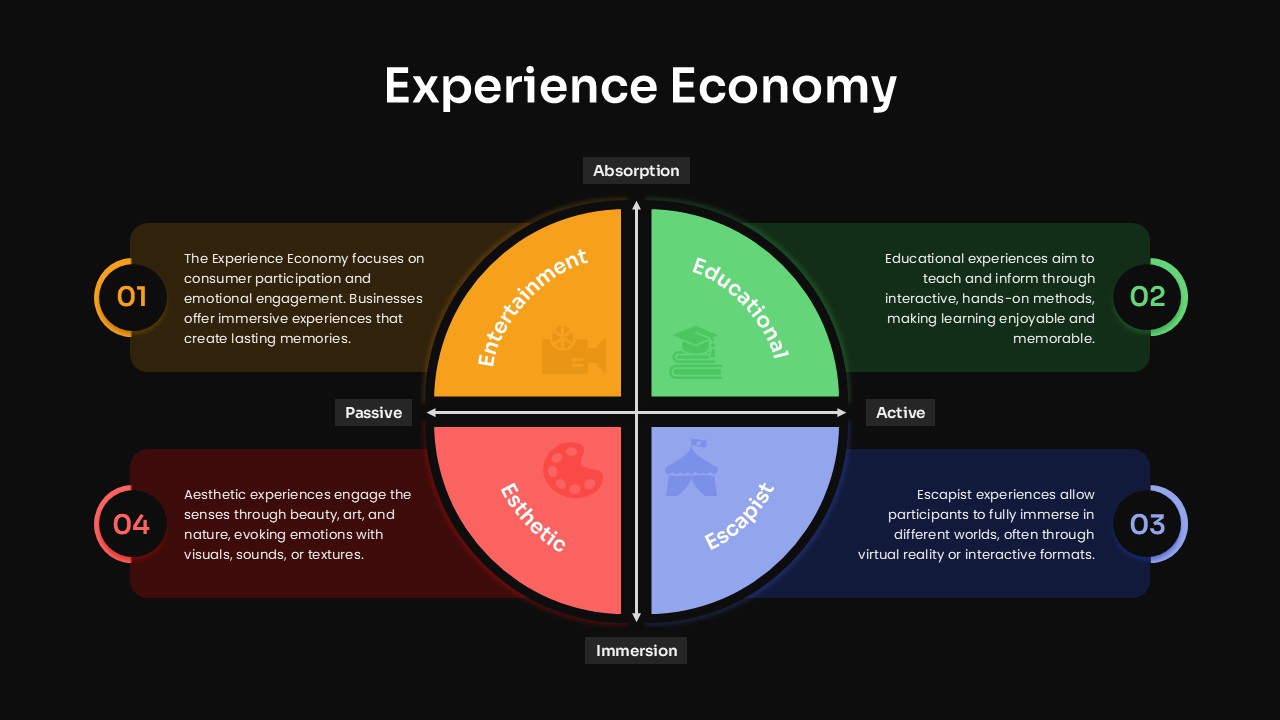
This slide presents a four-quadrant infographic that maps the core dimensions of the Experience Economy across two axes—Passive vs. Active and Absorption vs. Immersion. Each quadrant is color-coded (orange for Entertainment, green for Educational, blue for Escapist, red for Esthetic) and features a minimalist icon to reinforce the experience type. Surrounding callouts provide concise definitions and use numbered badges for easy reference. The circular layout with clean separators and ample white space ensures audiences quickly grasp how businesses can design experiences that educate, entertain, immerse, or engage aesthetically.
Built on editable master slides, users can swap icons, adjust quadrant colors, or replace text placeholders without disturbing the radial structure. Whether you need to highlight consumer participation models, showcase design thinking outputs, or train teams on experience-design frameworks, this template preserves pixel-perfect clarity in both PowerPoint and Google Slides. The balanced typography hierarchy and subtle drop shadows maintain focus on content, while the intuitive quadrant diagram accelerates comprehension during workshops, marketing reviews, or executive presentations.
Who is it for
Marketing teams, customer-experience designers, brand strategists, and workshop facilitators will leverage this slide to illustrate the four realms of engaging experiences and align on strategic initiatives.
Other Uses
Repurpose this layout for buyer-persona mapping, competitive analysis, product-market fit workshops, or any scenario requiring a two-axis, four-segment comparison diagram.
Login to download this file
No. of Slides
2Item ID
SB05198Rating
0.0
(0 reviews)
Related Templates

7-Step Virtuous Economy Cycle Diagram Template for PowerPoint & Google Slides
Process

Global Economy Market Trends Analysis Template for PowerPoint & Google Slides
Comparison Chart

Gig Economy Infographic One-Pager Template for PowerPoint & Google Slides
Comparison

Traditional vs Digital Economy Template for PowerPoint & Google Slides
Comparison

Circular Economy Process Overview Template for PowerPoint & Google Slides
Circle

4 Quadrant Model Diagram template for PowerPoint & Google Slides
Process

Four-Quadrant SWOT Analysis Diagram Template for PowerPoint & Google Slides
SWOT

Marketing Matrix Brand Quadrant Diagram Template for PowerPoint & Google Slides
Process

Gradient SWOT Quadrant Diagram Template for PowerPoint & Google Slides
SWOT

Opportunities Quadrant Diagram Template for PowerPoint & Google Slides
Opportunities Challenges

Researcher Skills Quadrant Diagram Template for PowerPoint & Google Slides
Circle

Dave Ulrich Strategic HR Model Quadrant Template for PowerPoint & Google Slides
Employee Performance

Gradient Petal SWOT Analysis Quadrant Template for PowerPoint & Google Slides
SWOT

Gartner Magic Quadrant Analysis Template for PowerPoint & Google Slides
Business

Editable Four-Quadrant TOWS Matrix Template for PowerPoint & Google Slides
Opportunities Challenges

Modern Colorful SWOT Quadrant Analysis Template for PowerPoint & Google Slides
SWOT

Colorful SWOT Analysis Quadrant Template for PowerPoint & Google Slides
SWOT

SWOT Analysis Quadrant template for PowerPoint & Google Slides
Business Strategy

SWOT Analysis Quadrant template for PowerPoint & Google Slides
Business Strategy

Modern Brainstorming Quadrant Slide Template for PowerPoint & Google Slides
Business Strategy

Emotional Intelligence Quadrant Template for PowerPoint & Google Slides
Circle

Four Quadrant Scatter Chart Analysis Template for PowerPoint & Google Slides
Comparison Chart

Free 4 Quadrant Template for PowerPoint & Google Slides
Business
Free

Free Balanced Scorecard Quadrant KPI Layout Template for PowerPoint & Google Slides
Employee Performance
Free

Four-Corners Strategic Analysis Quadrant Template for PowerPoint & Google Slides
SWOT

Four-Quadrant Responsible AI Framework Template for PowerPoint & Google Slides
Circle

Service Delivery Quadrant Slide Template for PowerPoint & Google Slides
Comparison

Colorful SWOT Analysis Quadrant Template for PowerPoint & Google Slides
SWOT

Multi Color SWOT Analysis Quadrant Template for PowerPoint & Google Slides
SWOT

3D Quadrant SWOT Analysis Template for PowerPoint & Google Slides
SWOT

Dave Ulrich HR Model 4-Quadrant Slide Deck for PowerPoint & Google Slides
HR

Experience Curve Analysis Diagram Template for PowerPoint & Google Slides
Business Strategy

Experience Pyramid Hierarchy Diagram Template for PowerPoint & Google Slides
Pyramid

Customer Experience Journey Diagram Template for PowerPoint & Google Slides
Customer Journey

Omnichannel Customer Experience Overview Template for PowerPoint & Google Slides
Customer Journey

First-Day Experience Onboarding Schedule template for PowerPoint & Google Slides
Recruitment

Search Generative Experience template for PowerPoint & Google Slides
Digital Marketing

Customer Experience Loop Template for PowerPoint & Google Slides
Customer Experience

Customer Experience Journey Template for PowerPoint & Google Slides
Customer Journey

Customer Experience Journey Template for PowerPoint & Google Slides
Customer Journey

Pillars of Customer Experience Template for PowerPoint & Google Slides
Customer Experience

Customer Experience Lifecycle Template for PowerPoint & Google Slides
Customer Journey

Customer Experience 4-Step Journey Template for PowerPoint & Google Slides
Customer Journey

Employee Experience Template for PowerPoint & Google Slides
Employee Performance

Customer Experience & Journey Infographic Templates for PowerPoint & Google Slides
Process

Customer Experience Loyalty Deck for PowerPoint & Google Slides
Customer Experience

Snake Diagram Pack of 8 Slides template for PowerPoint & Google Slides
Process

Gear Process Diagram PowerPoint Template for PowerPoint & Google Slides
Process

Sales Process Workflow Funnel Diagram PowerPoint Template for PowerPoint & Google Slides
Funnel

Puzzle Diagram PowerPoint Template for PowerPoint & Google Slides
Process

Transportation Logistics PowerPoint Diagram template for PowerPoint & Google Slides
Process

Emoji Scale PowerPoint Diagram for PowerPoint & Google Slides
Infographics

4 Step Problem Solving PowerPoint Diagram for PowerPoint & Google Slides
Process

3D Four Arrow Infographics Diagram Template for PowerPoint & Google Slides
Arrow

Modern Nine Circle Network Diagram Template for PowerPoint & Google Slides
Circle

Alternating Circle Timeline Diagram Template for PowerPoint & Google Slides
Timeline

Creative Organization Chart Diagram Template for PowerPoint & Google Slides
Org Chart

Colorful Creative Mind Map Diagram template for PowerPoint & Google Slides
Mind Maps

3D Shaped Section Diagram template for PowerPoint & Google Slides
Infographics

Four-Stage Business Circular Diagram Template for PowerPoint & Google Slides
Process

Roadmap with Milestones Process Diagram Template for PowerPoint & Google Slides
Roadmap

Editable Twin Circle Process Diagram Template for PowerPoint & Google Slides
Process

Modern Five-Stage Cycle Process Diagram Template for PowerPoint & Google Slides
Process

Five Stage Process Diagram Infographic Template for PowerPoint & Google Slides
Process

Six-Step Hexagon Process Diagram Template for PowerPoint & Google Slides
Process

SCAMPER Technique Diagram template for PowerPoint & Google Slides
Process

10 Stages Business Flow Process Diagram template for PowerPoint & Google Slides
Business

Gear Flow Diagram template for PowerPoint & Google Slides
Process

Seven-Part Marketing Mix Diagram Template for PowerPoint & Google Slides
Marketing

Eight-Stage Zigzag Arrow Diagram Template for PowerPoint & Google Slides
Process

Modern Five-Step Circles Process Diagram Template for PowerPoint & Google Slides
Circle

Fishbone Diagram Cause-and-Effect Template for PowerPoint & Google Slides
Process

Three Section Triangle Diagram Template for PowerPoint & Google Slides
Process

Website User Flowchart Diagram Template for PowerPoint & Google Slides
Process

Four-Step Speech Bubble Diagram Template for PowerPoint & Google Slides
Process

Risk Management Heat Map Diagram Template for PowerPoint & Google Slides
Comparison Chart

Six-Step Linear Arrow Process Diagram Template for PowerPoint & Google Slides
Process

Liebig’s Law Barrel Diagram Template for PowerPoint & Google Slides
Process

Six-Step Hexagon Process Flow Diagram Template for PowerPoint & Google Slides
Process

4 Ps of Management Circular Diagram Template for PowerPoint & Google Slides
Circle

Process Methodology Overview Diagram Template for PowerPoint & Google Slides
Process

Customer-Centric Hub and Spoke Diagram Template for PowerPoint & Google Slides
Customer Experience

Business Process Management Flow Diagram Template for PowerPoint & Google Slides
Process

Value Discipline Strategy Diagram Template for PowerPoint & Google Slides
Comparison

Six-Step Output Process Diagram Template for PowerPoint & Google Slides
Process

Four-Arrow Curved Hub-and-Spoke Diagram Template for PowerPoint & Google Slides
Arrow

Customer Centricity Venn Diagram template for PowerPoint & Google Slides
Infographics

Feature-Attribute-Benefit Diagram Slide Template for PowerPoint & Google Slides
Circle

Classic Family Tree Diagram Layout Template for PowerPoint & Google Slides
Infographics

Interactive Serpentine Timeline Diagram Template for PowerPoint & Google Slides
Timeline

Four-Phase Decarbonization Diagram Template for PowerPoint & Google Slides
Process

Test Strategy Circular Diagram Template for PowerPoint & Google Slides
Circle

Scenario Planning Process Diagram Template for PowerPoint & Google Slides
Process

Project Life Cycle Workflow Diagram Template for PowerPoint & Google Slides
Process

Branding and Positioning Venn Diagram Template for PowerPoint & Google Slides
Comparison

Proactive Hub-and-Spoke Diagram Template for PowerPoint & Google Slides
Process

K-Means Clustering Process Diagram Template for PowerPoint & Google Slides
Machine Learning

AI Adoption Framework Circular Diagram Template for PowerPoint & Google Slides
AI

Feedback Mechanisms Circular Diagram Template for PowerPoint & Google Slides
Circle

Operating Channels Comparison Diagram Template for PowerPoint & Google Slides
Business Models


