Timmons Model of Entrepreneurship Process Template for PowerPoint & Google Slides

Description
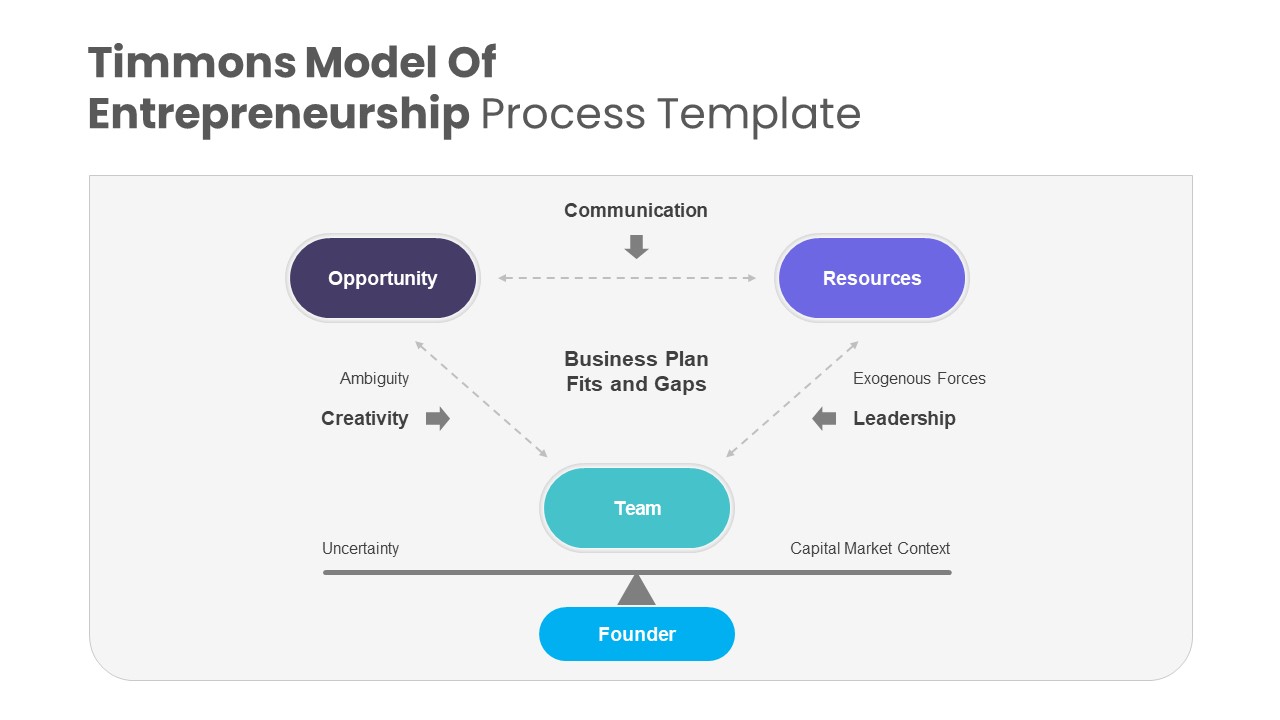
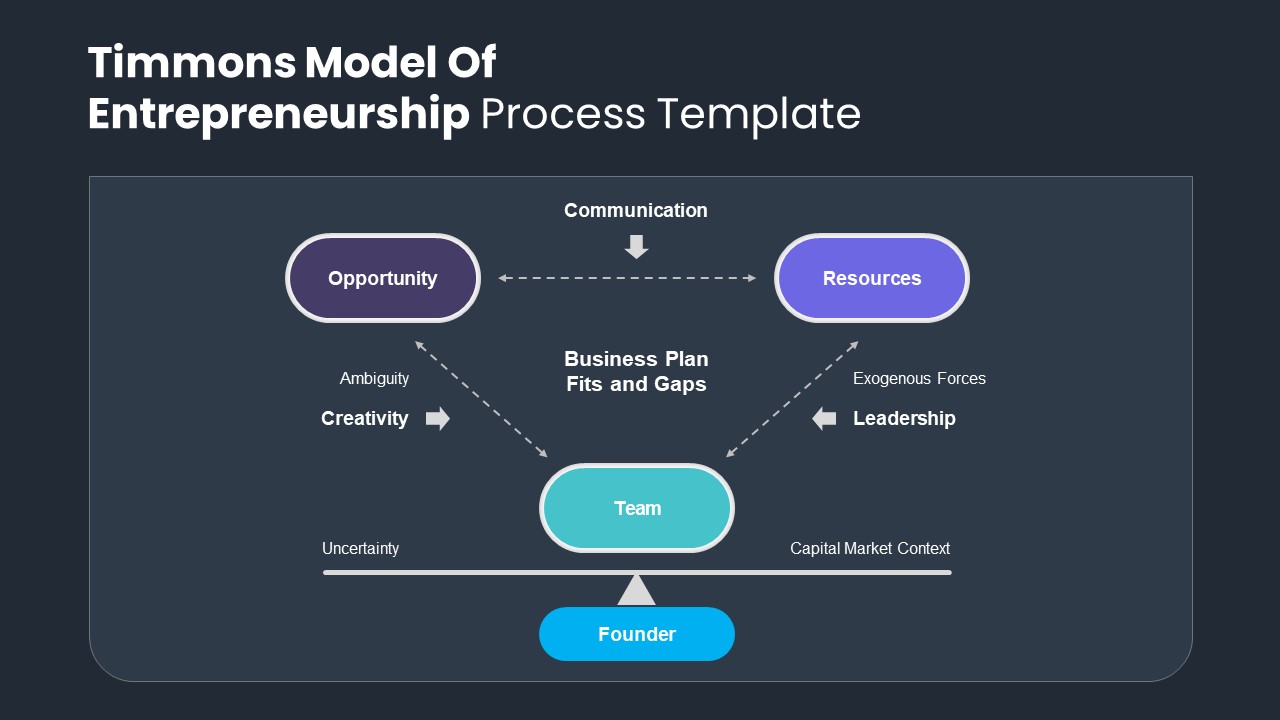
Leverage this Timmons Model of Entrepreneurship process diagram to convey the dynamic interplay between opportunity, resources, team, and founder in your presentations. This visually engaging slide features four distinct oval shapes—deep purple for Opportunity, violet-blue for Resources, turquoise for Team, and bright cyan for Founder—arranged within a contextual frame that highlights key entrepreneurial forces. Dashed arrows illustrate communication flows, creativity-driven ambiguity, leadership-influenced gaps, and capital market context, while a central label “Business Plan Fits and Gaps” underscores the core analytical focus. The slide uses a minimalist white and gray background with subtle drop shadows, crisp sans-serif typography, and intuitive placeholders for titles and descriptions, ensuring clarity and brand consistency.
Designed for both PowerPoint and Google Slides, this fully editable template leverages master slides and vector shapes that let you adjust colors, reposition elements, or replace text and icons in seconds. You can easily modify arrow styles, swap placeholder text, or reassign color codes to match your corporate palette. Whether you’re explaining a university lecture, investor briefing, or internal workshop, the clear layout and logical flow guide audiences through complex relationships with minimal cognitive load. This asset eliminates formatting headaches and accelerates slide creation, so you can focus on strategic insights instead of design details.
Beyond entrepreneurship education, this flexible framework can adapt to a wide range of contexts: shuffle the ovals to map product development stages, resource allocation scenarios, cross-functional team alignment, or risk management frameworks. Use the same layout to illustrate strategic alignment between market opportunities and organizational capabilities, to analyze leadership gaps in project planning, or to visualize innovation pipelines in corporate settings. With this versatile diagram in your toolkit, you can drive stakeholder engagement, foster data-driven discussions, and present complex business models with maximum impact and minimal effort.
Who is it for
Entrepreneurs, startup founders, business consultants, innovation managers, and MBA students will benefit from this process slide when explaining the Timmons model in strategic planning sessions, pitch decks, or classroom lectures.
Other Uses
Repurpose this diagram to map product development stages, illustrate resource allocation scenarios, align cross-functional teams, or analyze risk management frameworks. It also works for corporate training, investor briefings, and innovation pipeline visualizations.
Login to download this file

Item ID
SB03418
Related Templates

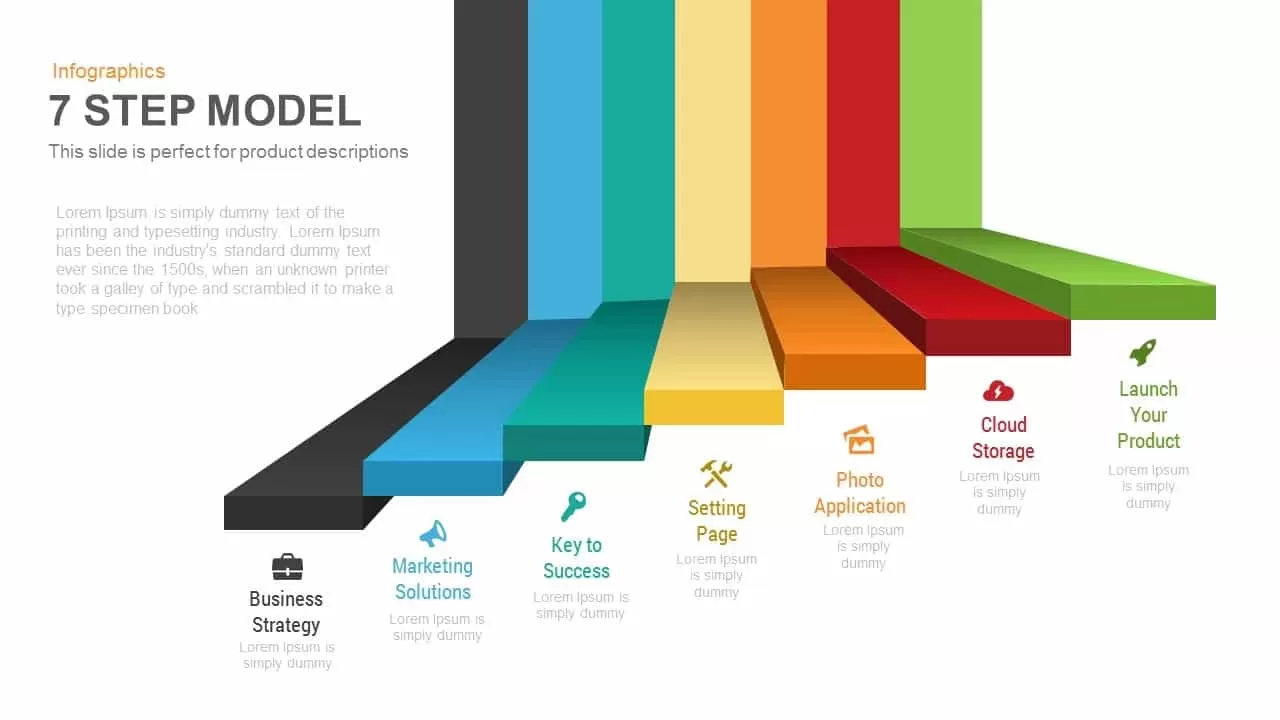
7-Step 3D Process Infographic Model template for PowerPoint & Google Slides
Process
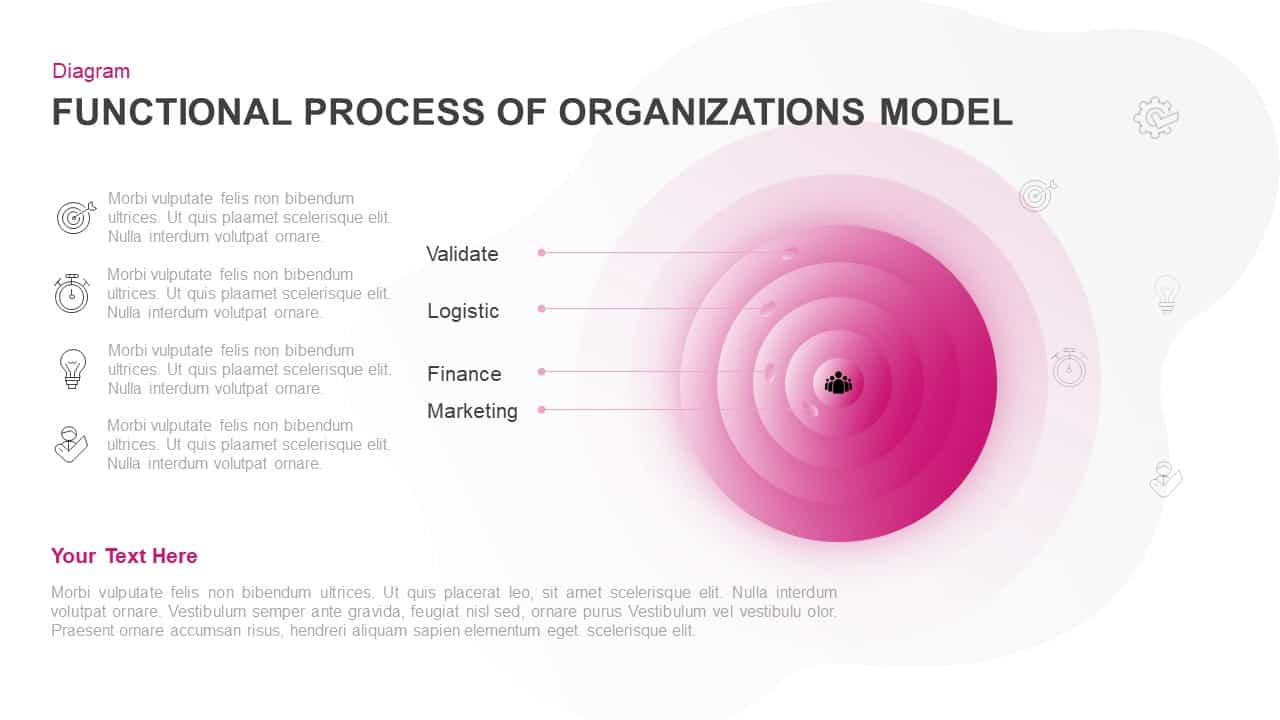
Concentric Functional Process Model Template for PowerPoint & Google Slides
Circular
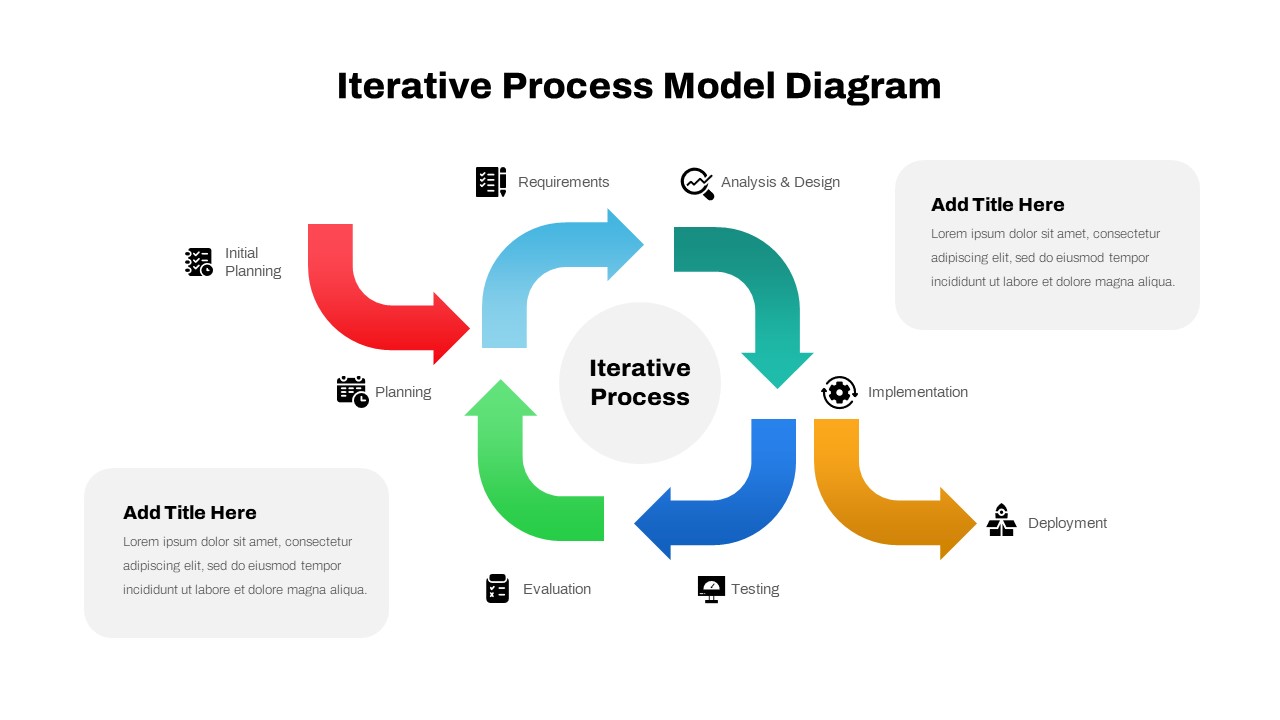
Iterative Process Model Diagram Template for PowerPoint & Google Slides
Process
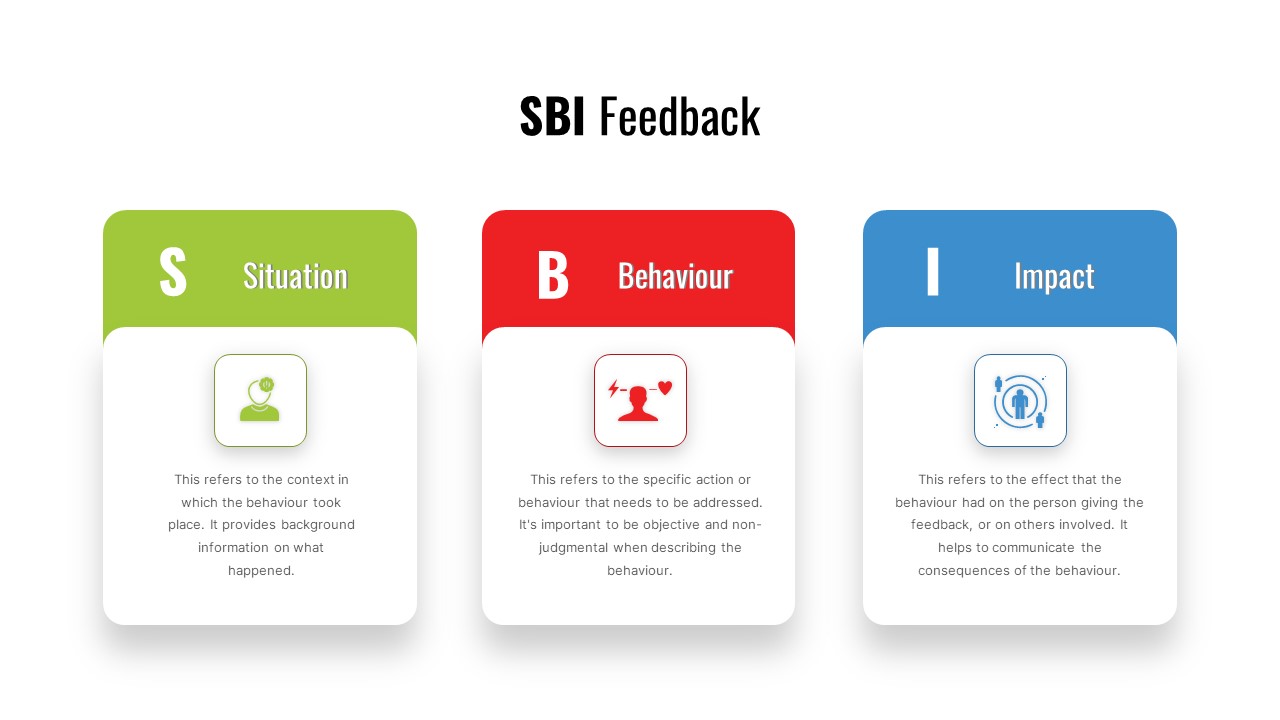
SBI Feedback Model Process Diagram Template for PowerPoint & Google Slides
Process
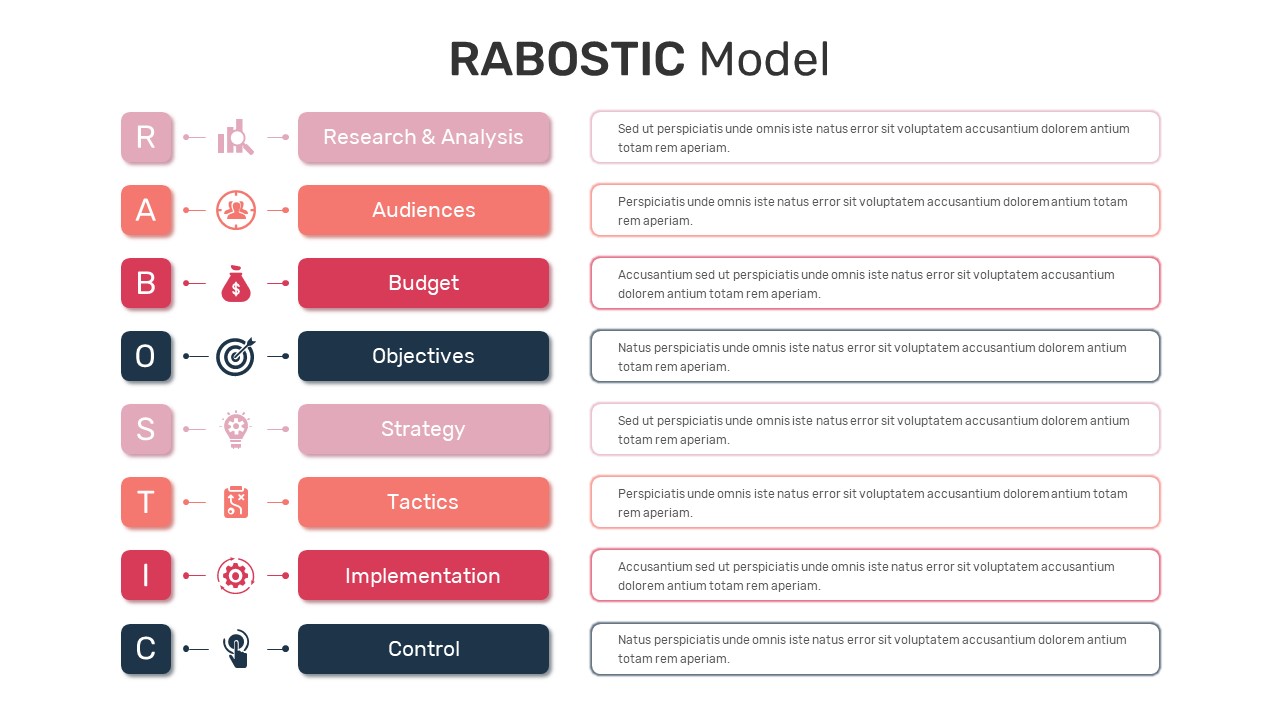
RABOSTIC Marketing Model Process Diagram Template for PowerPoint & Google Slides
Process
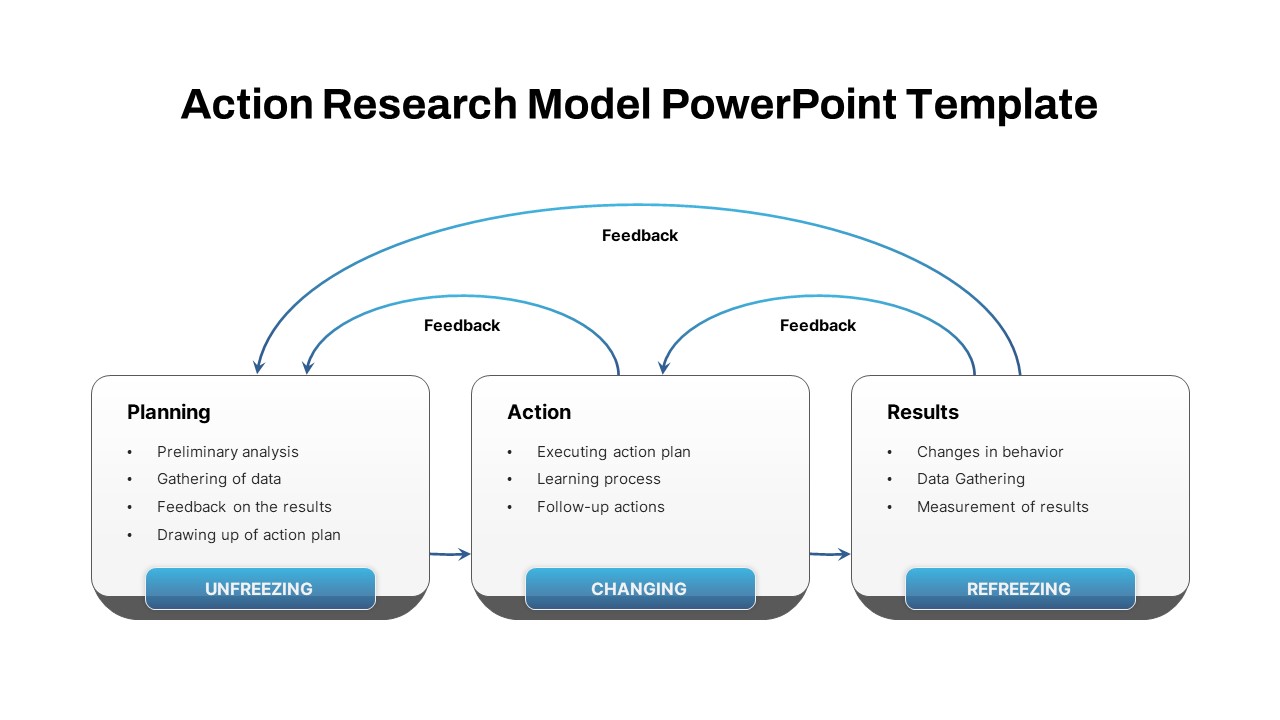
Action Research Feedback Process Model Template for PowerPoint & Google Slides
Process
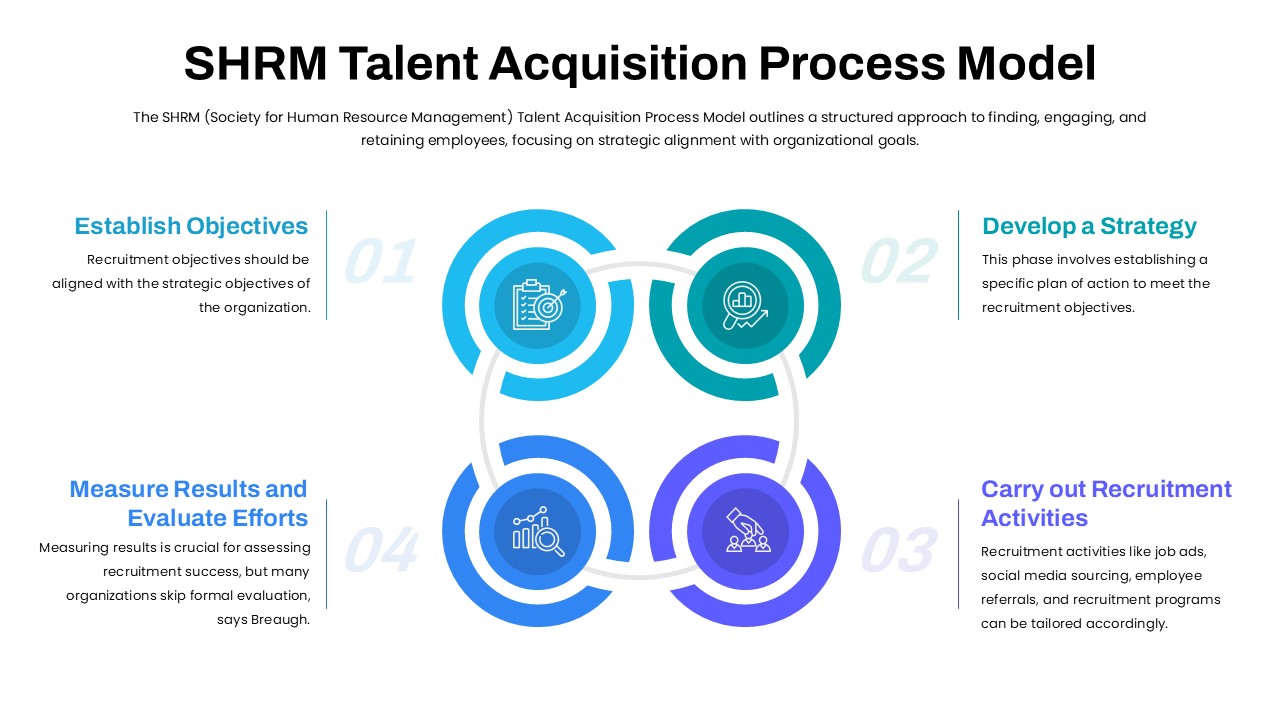
SHRM Talent Acquisition Process Model Template for PowerPoint & Google Slides
Business Models
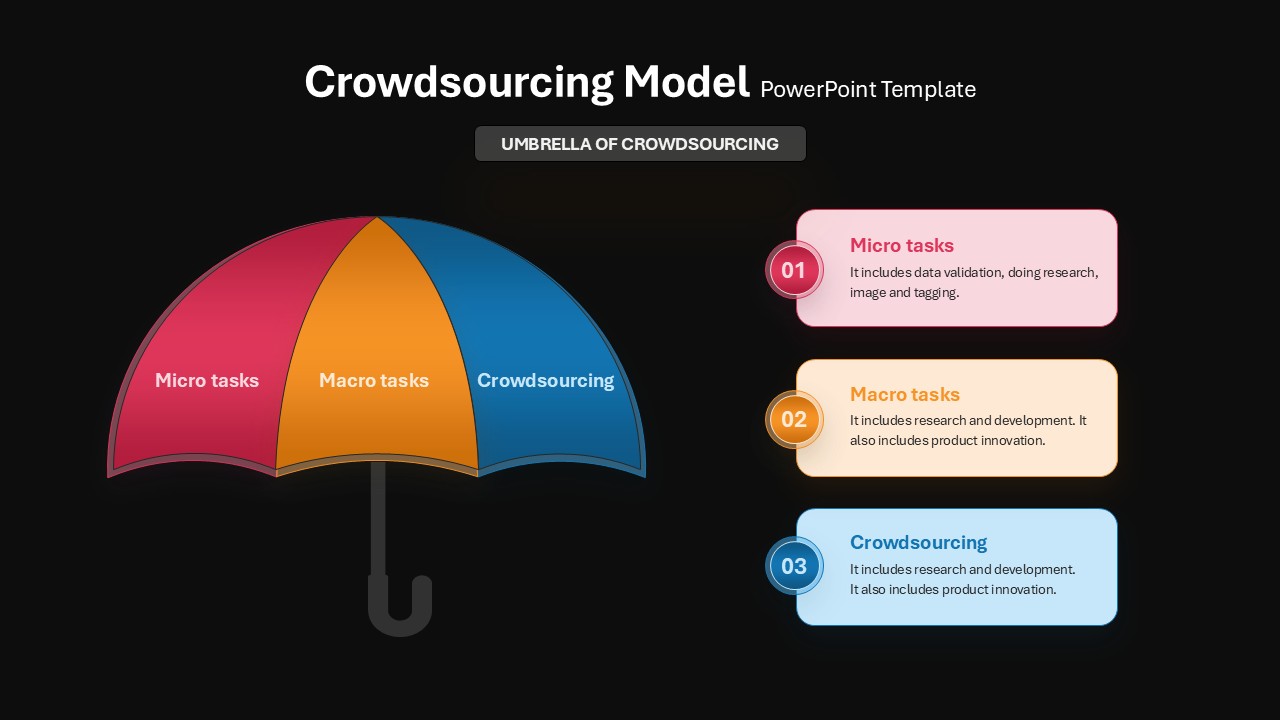
Crowdsourcing Model Umbrella & Process Template for PowerPoint & Google Slides
Infographics
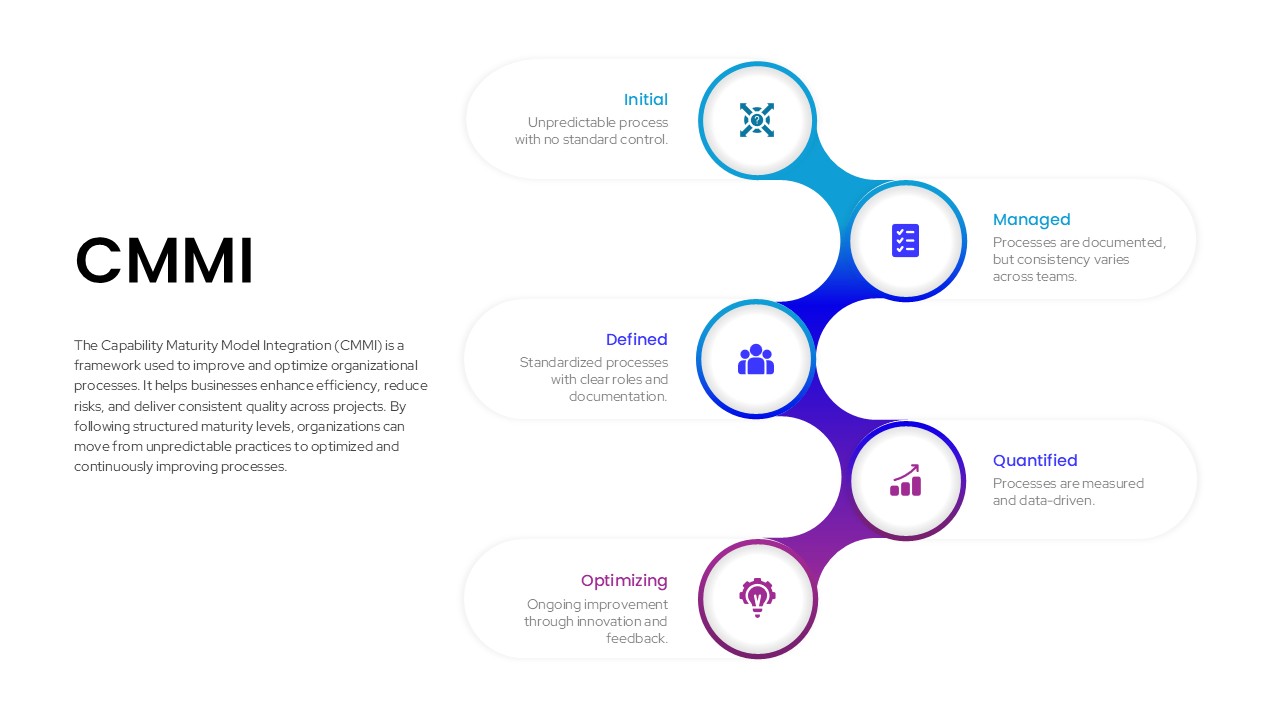
CMMI Process Maturity Model Infographic Template for PowerPoint & Google Slides
Process
4 Step Process PowerPoint & Google Slides Template for PowerPoint & Google Slides
Process

Sales Process Infographic Slides Pack Template for PowerPoint & Google Slides
Process
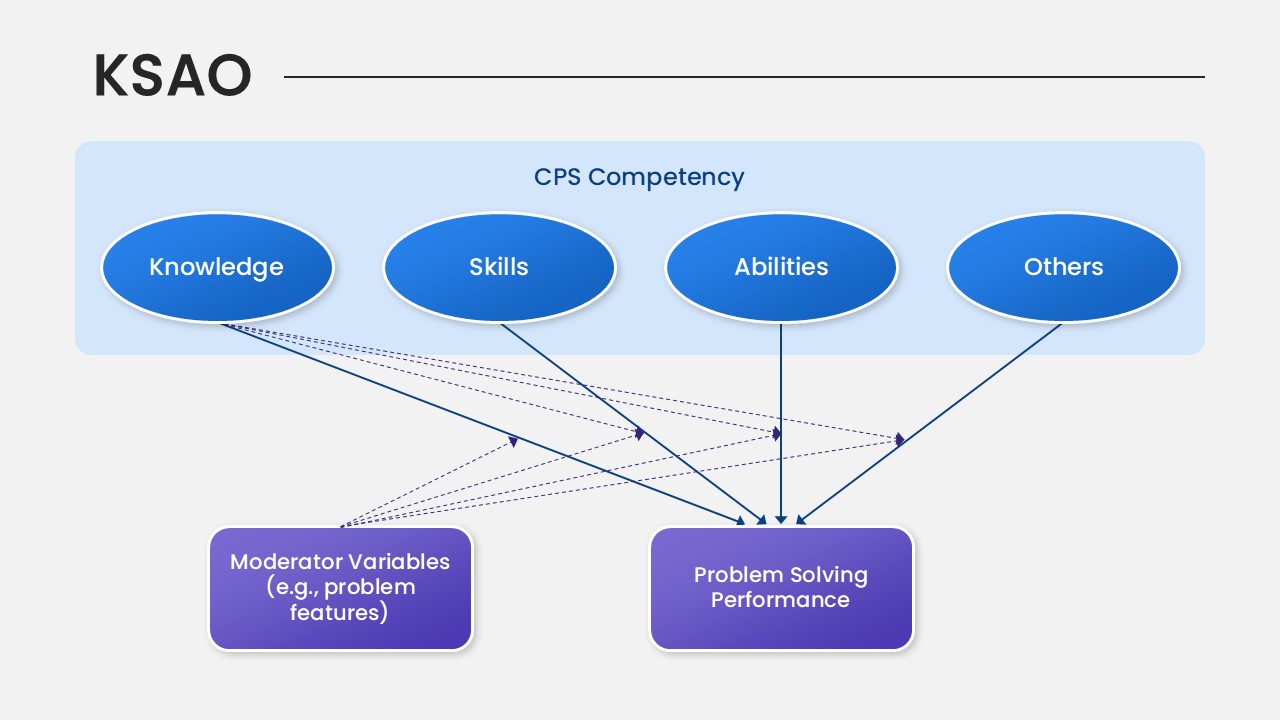
KSAO Model PowerPoint Template for PowerPoint & Google Slides
Business Strategy
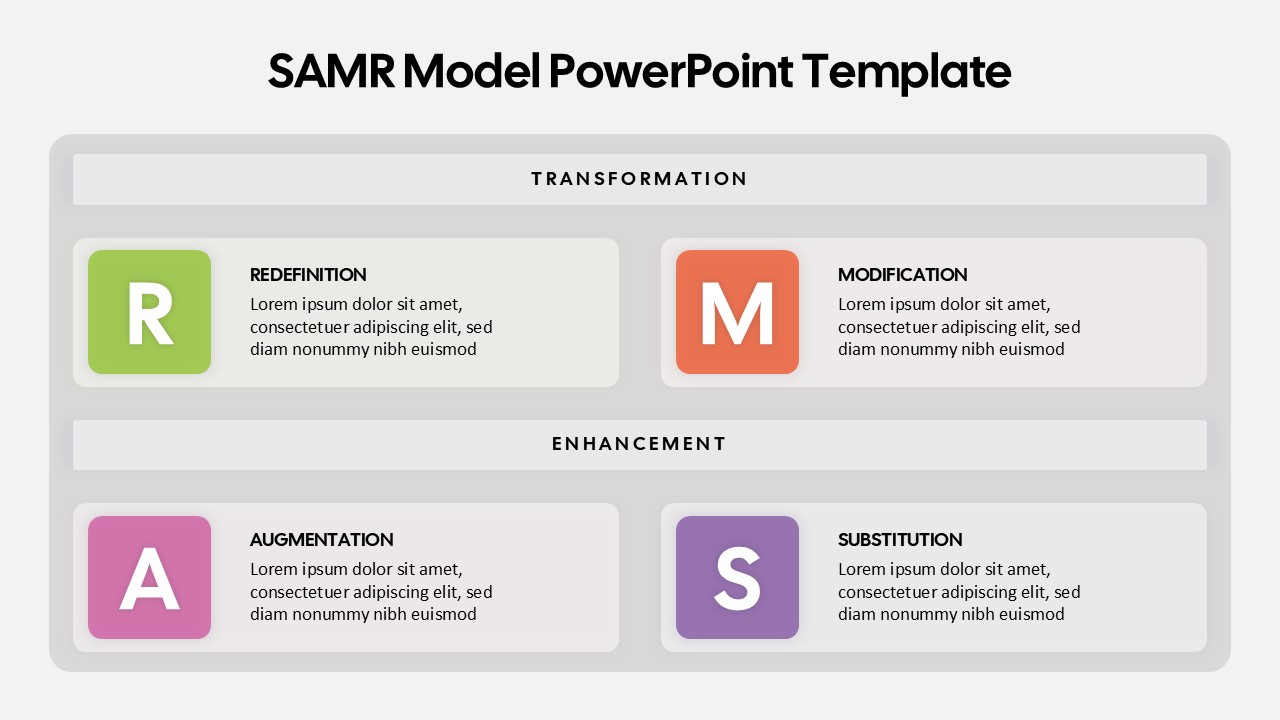
SAMR Model PowerPoint Template for PowerPoint & Google Slides
Business
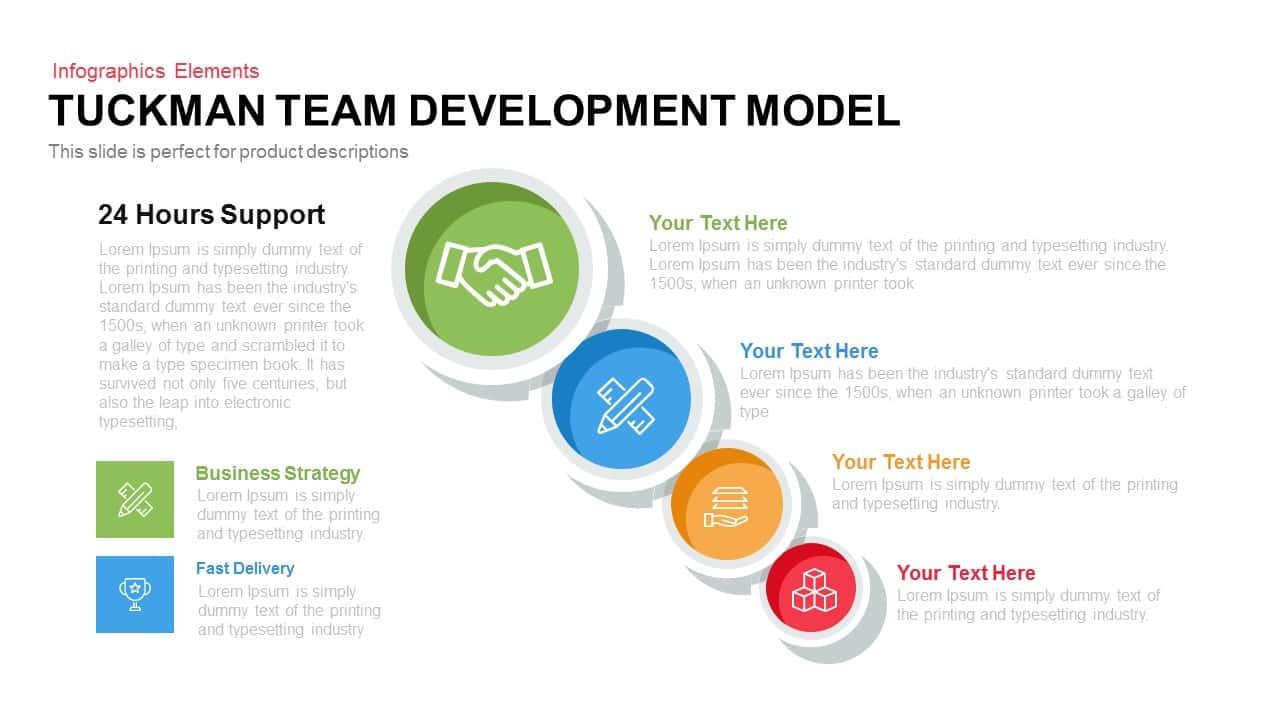
Tuckman Team Model Template for PowerPoint & Google Slides
Infographics
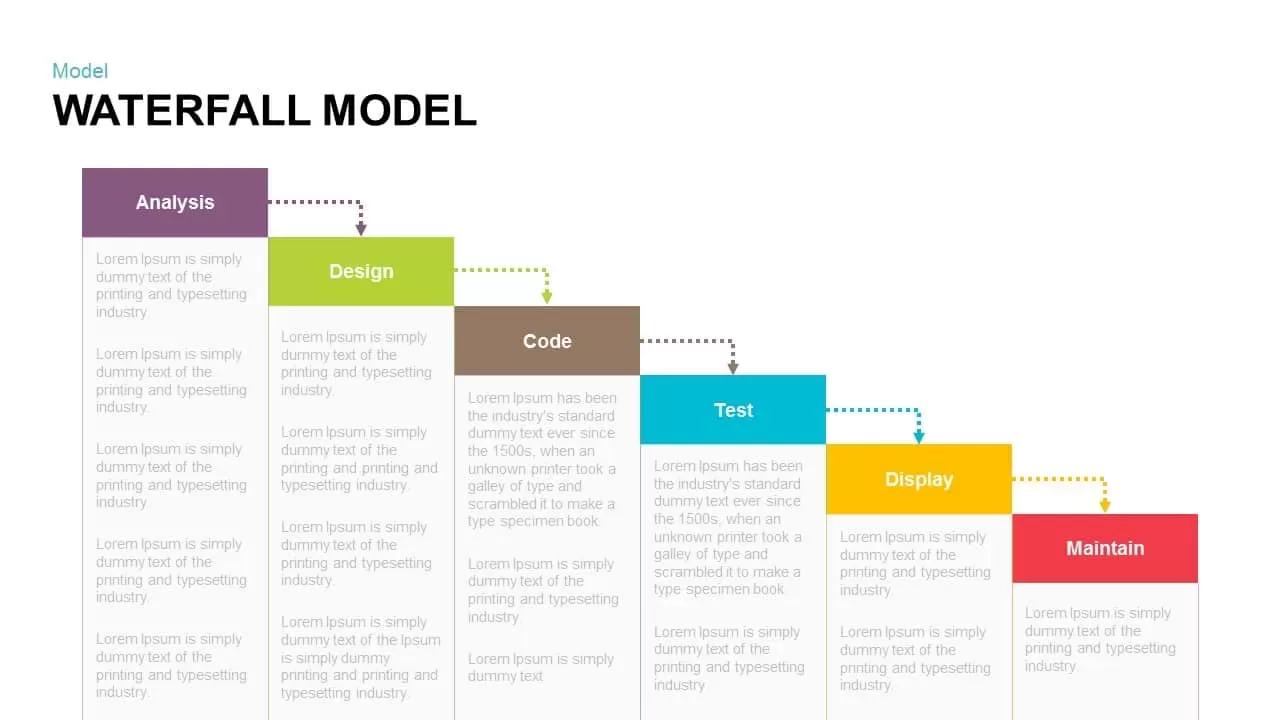
Waterfall Model Diagram Template for PowerPoint & Google Slides
Information Technology
Ansoff Matrix Growth Strategy Model Template for PowerPoint & Google Slides
BCG
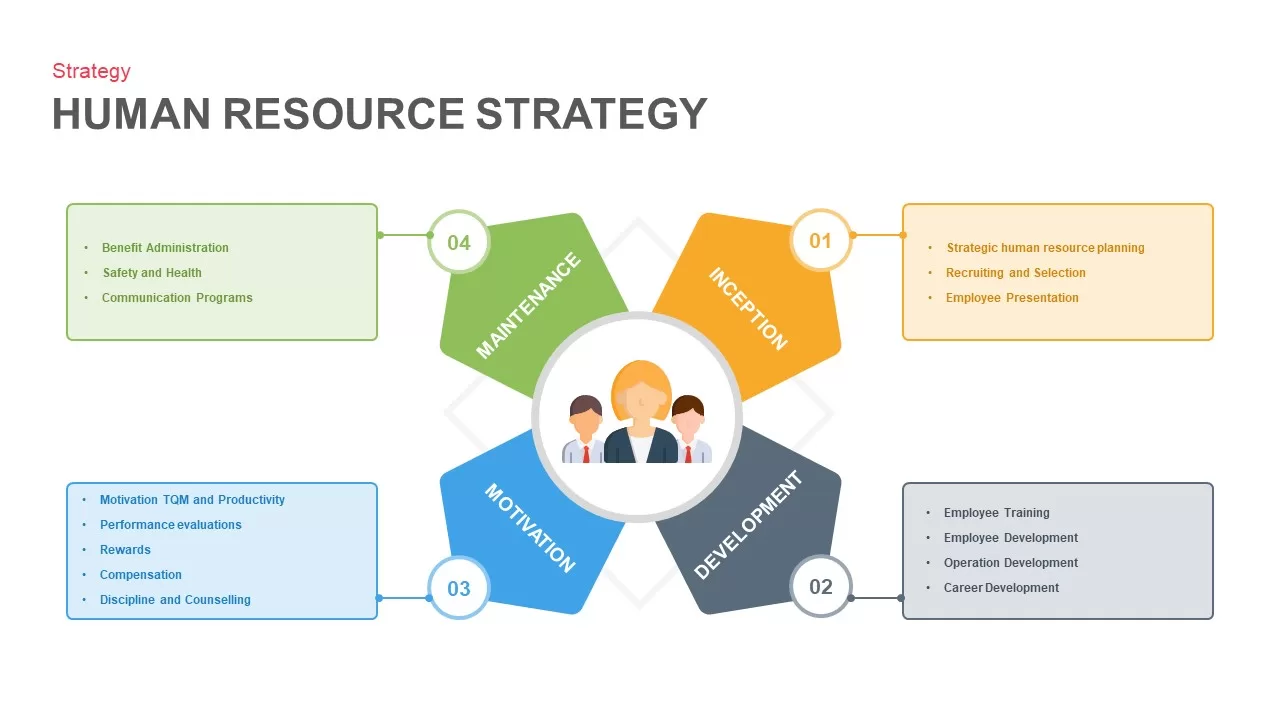
Human Resource Strategy Model Pack Template for PowerPoint & Google Slides
HR
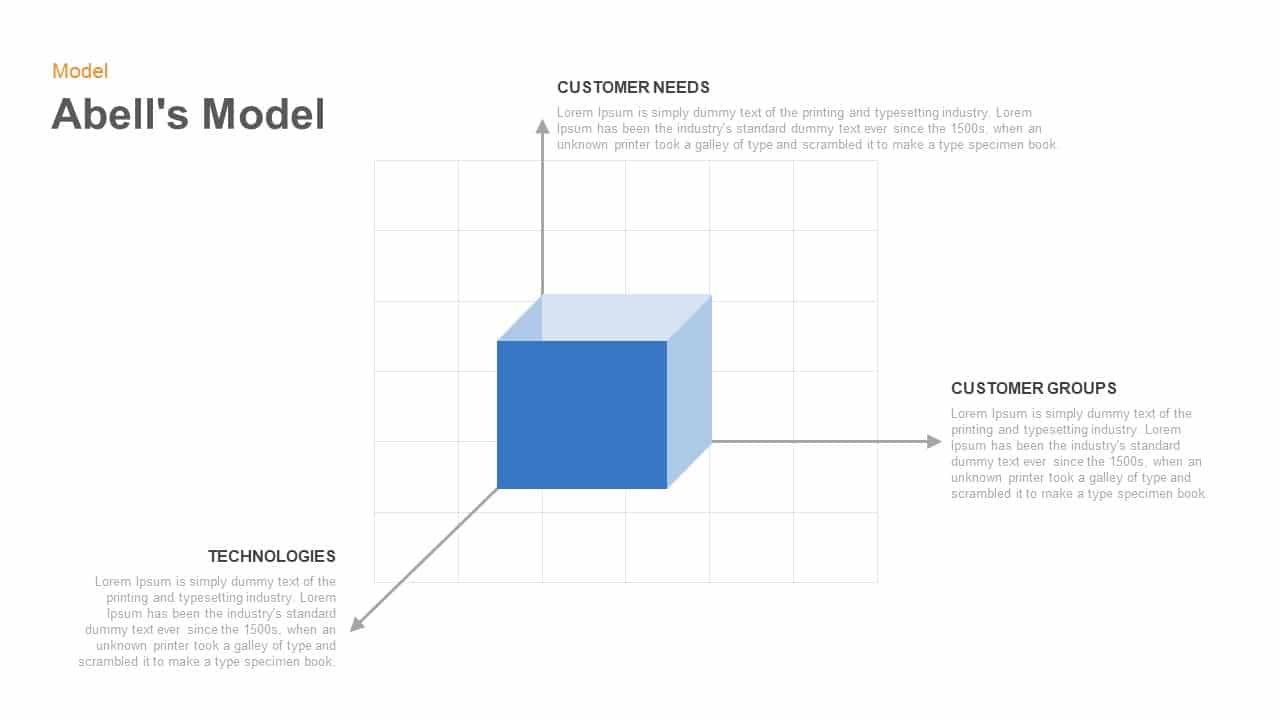
Abell’s 3D Cube Model Diagram Template for PowerPoint & Google Slides
Business Models

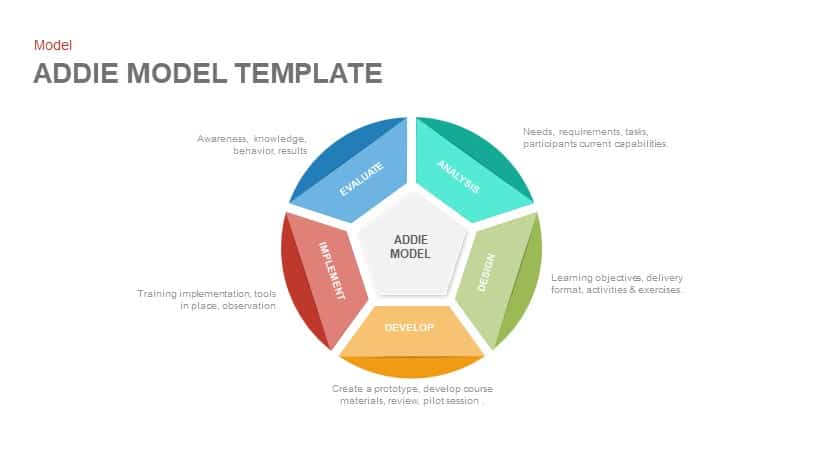
ADDIE Model Instructional Design Template for PowerPoint & Google Slides
Circular
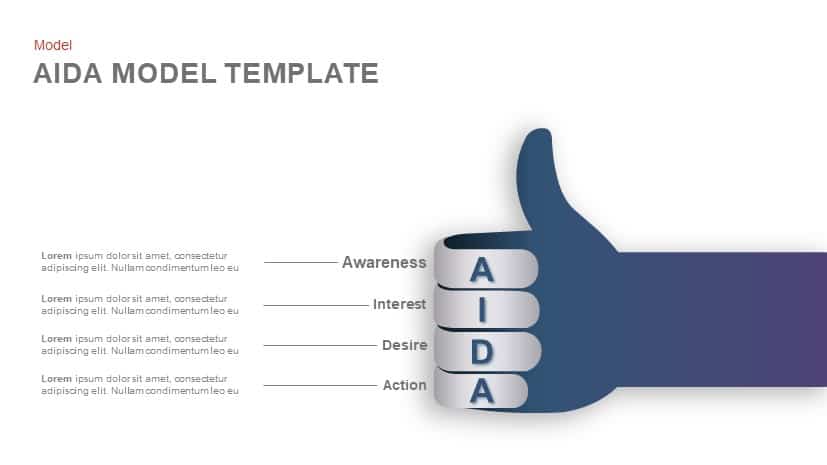
AIDA Model Funnel Thumb Diagram Template for PowerPoint & Google Slides
Process
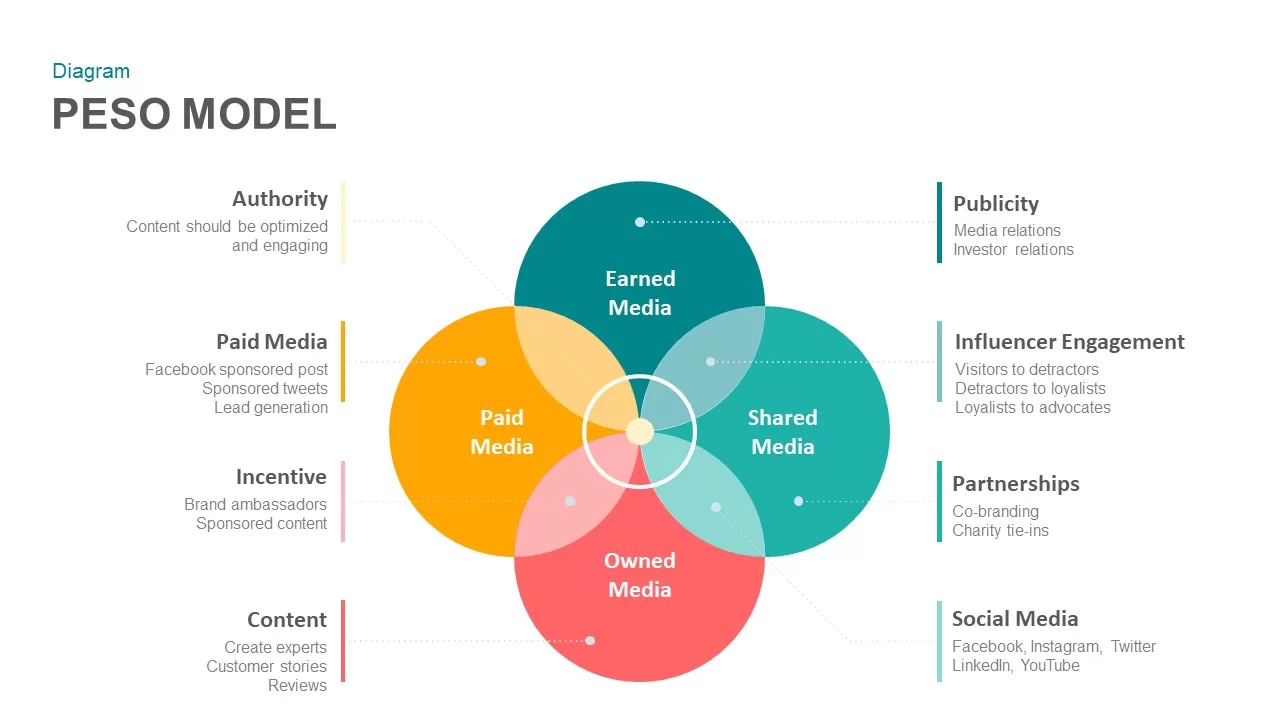
PESO Model Marketing Diagram Template for PowerPoint & Google Slides
Digital Marketing
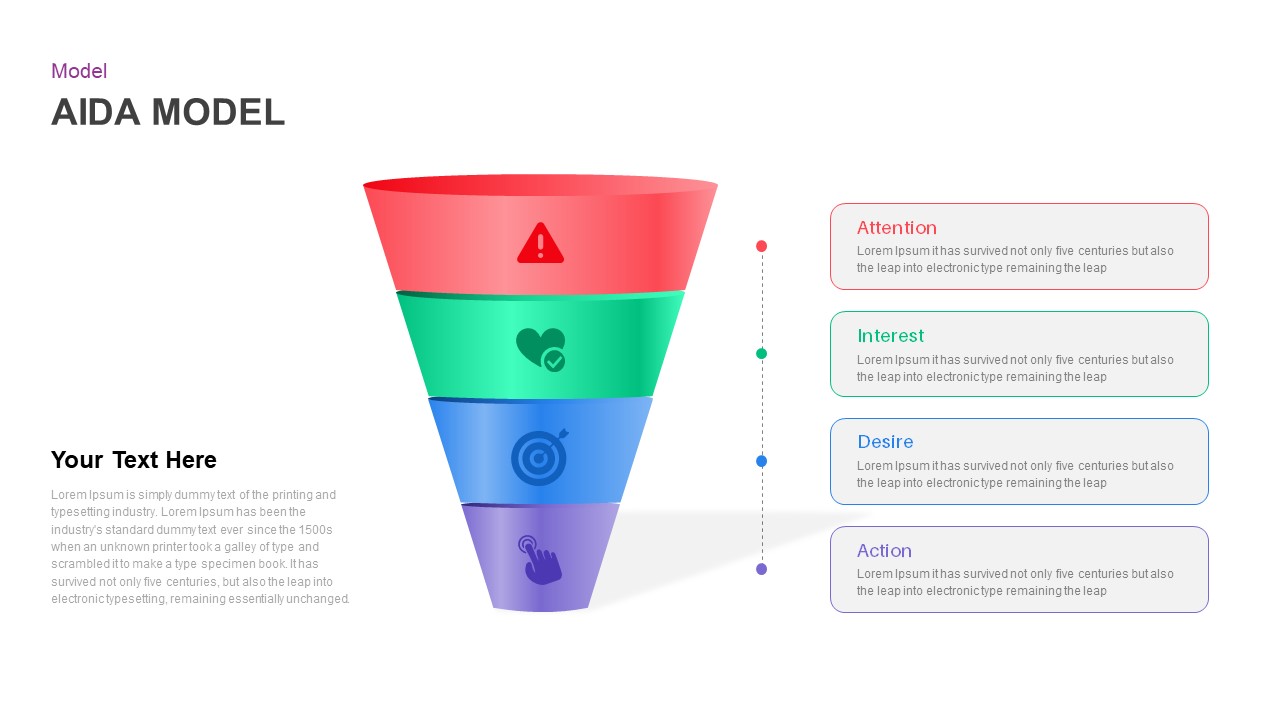
AIDA Marketing Funnel Model Template for PowerPoint & Google Slides
Marketing
Greiner Growth Model Six-Phase Diagram Template for PowerPoint & Google Slides
Business Models
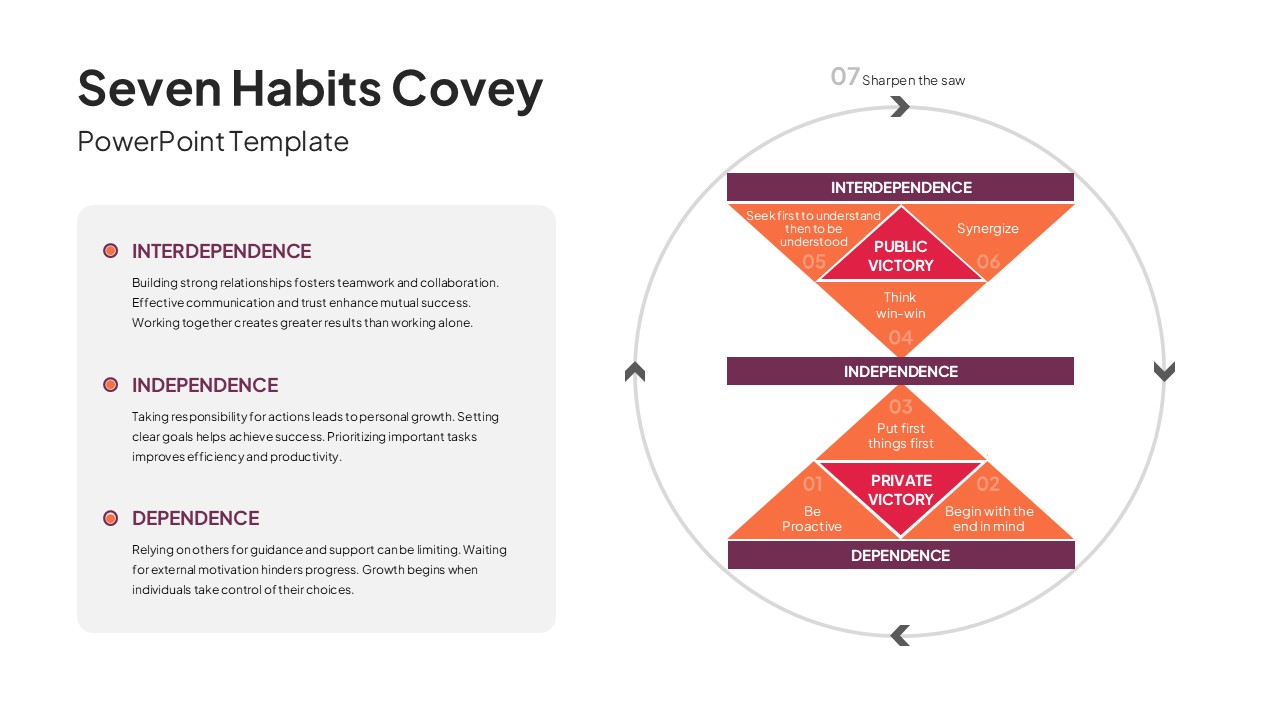
7 Habits of Highly Effective People Covey Model Template for PowerPoint & Google Slides
Leadership

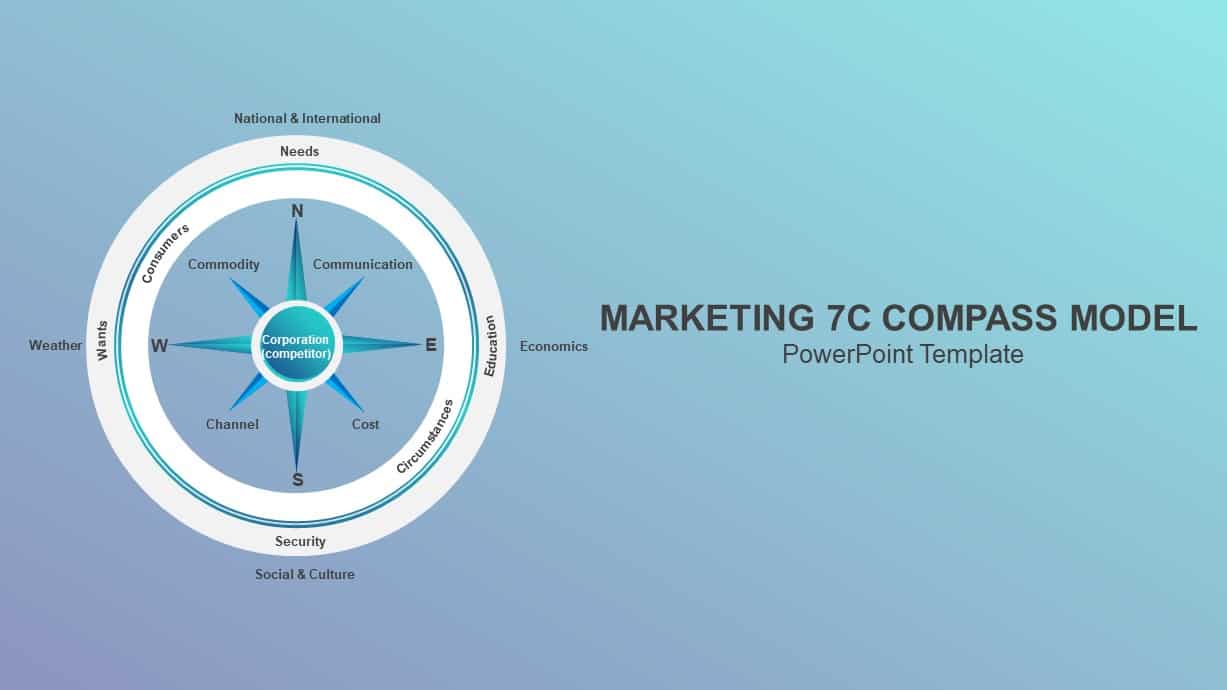
Marketing 7C Compass Model Infographic Template for PowerPoint & Google Slides
Circular
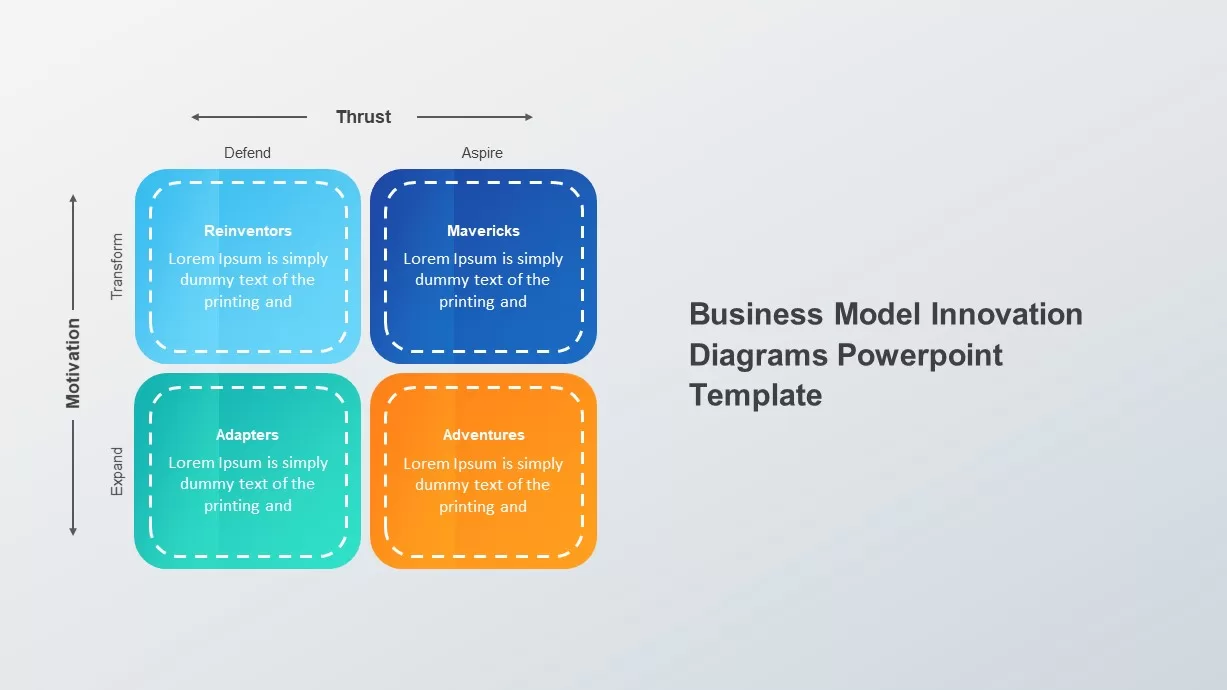
Business Model Innovation Diagrams template for PowerPoint & Google Slides
Process
Four-Phase Maturity Model Diagram Template for PowerPoint & Google Slides
Process
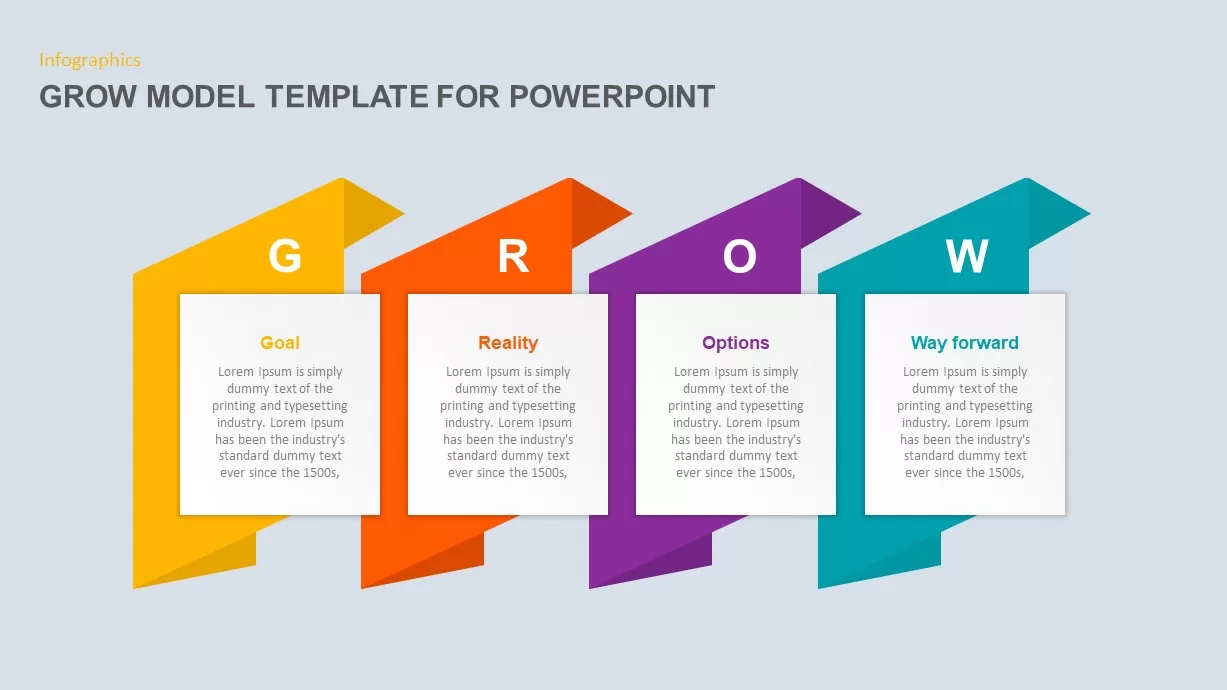
GROW Model Coaching Infographic Template for PowerPoint & Google Slides
Process
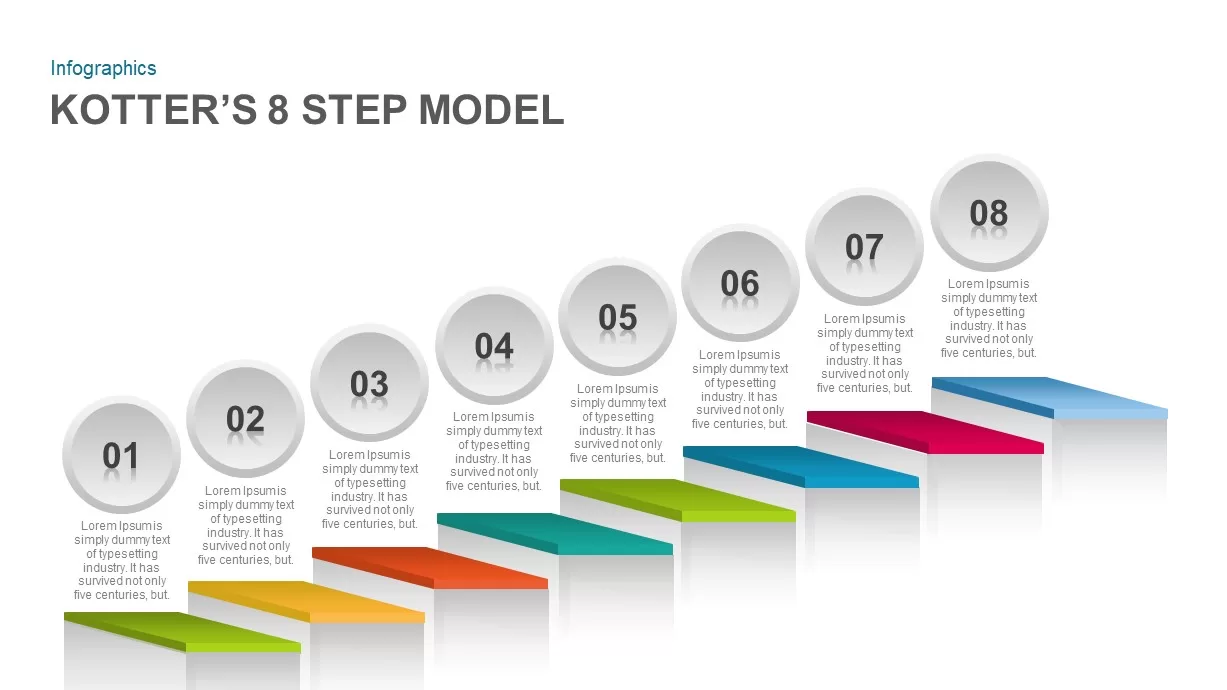
Kotter’s 8-Step Model Infographic Template for PowerPoint & Google Slides
Process
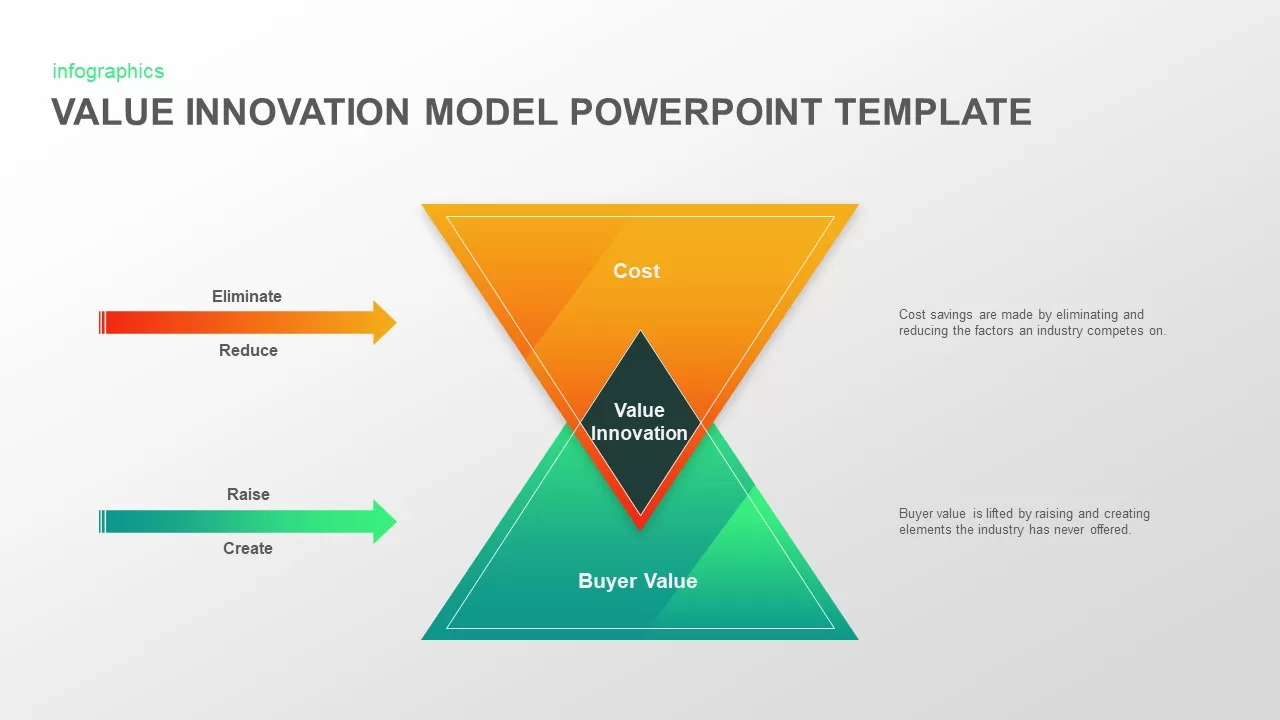
Value Innovation Model PowerPoint & Google Slides Template for Presentations
Business Proposal
Greiner’s Growth Model Curve template for PowerPoint & Google Slides
Infographics
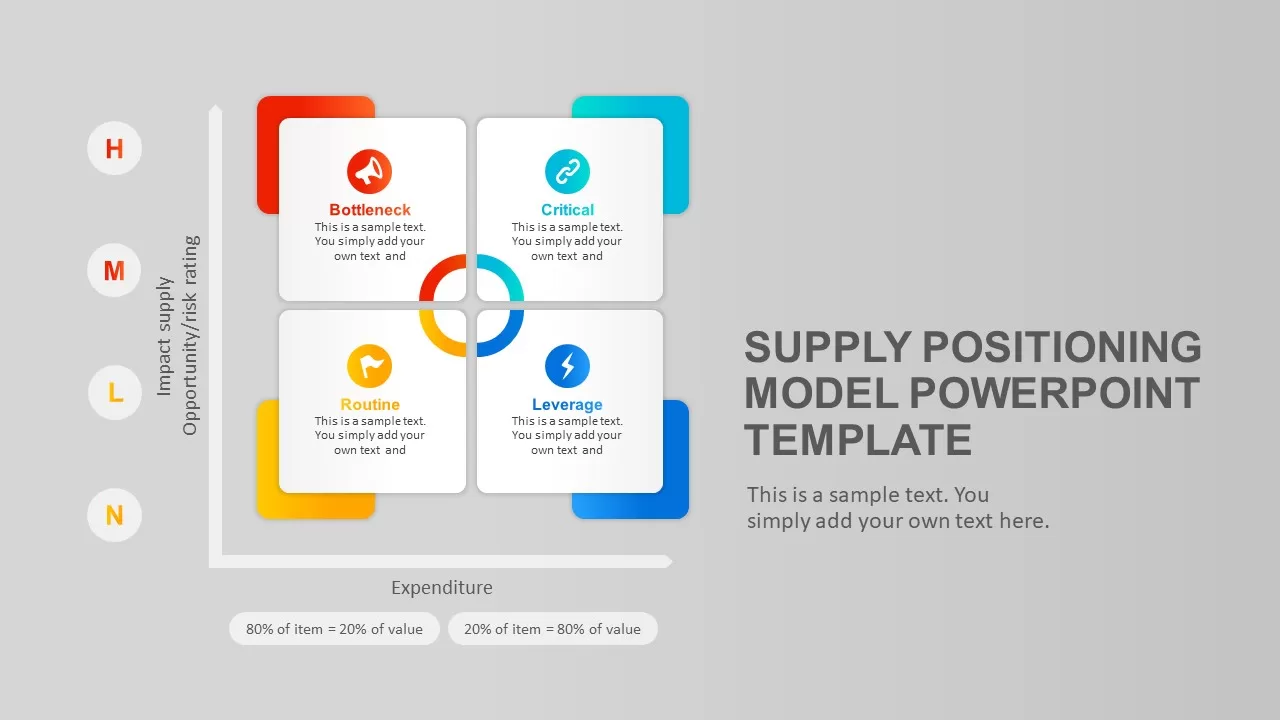
Supply Positioning Model Template for PowerPoint & Google Slides
Business Models
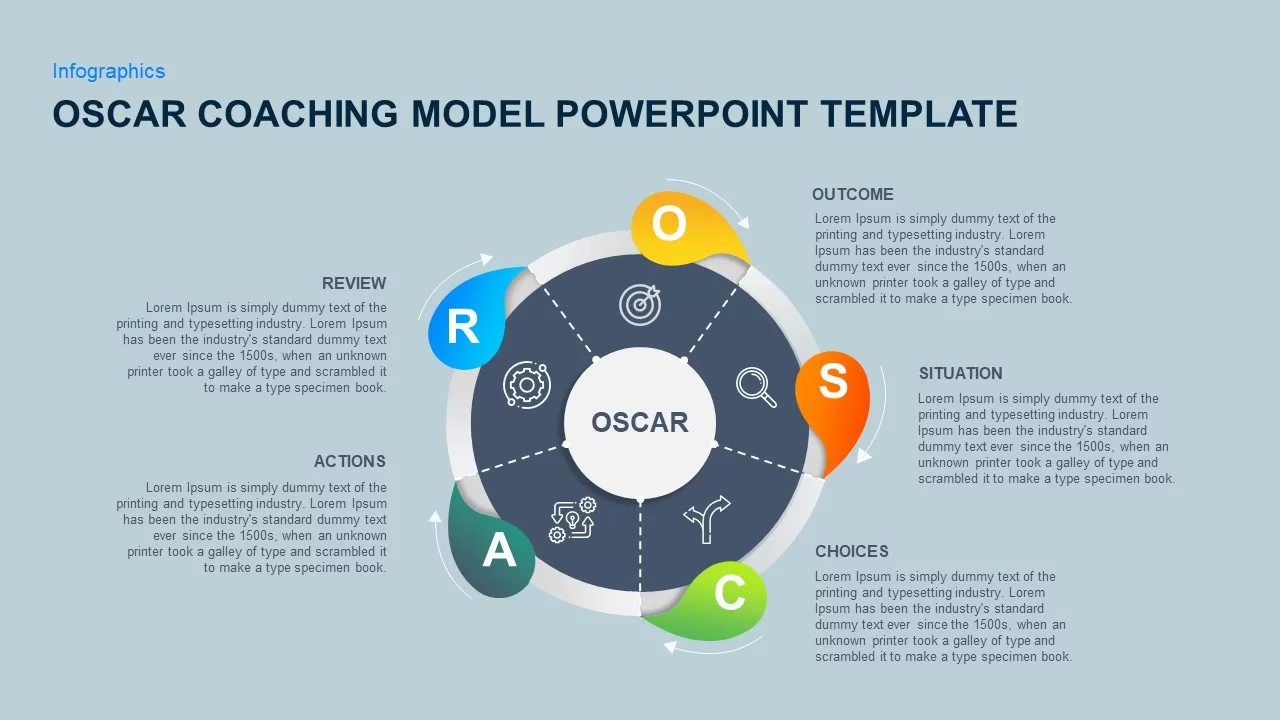
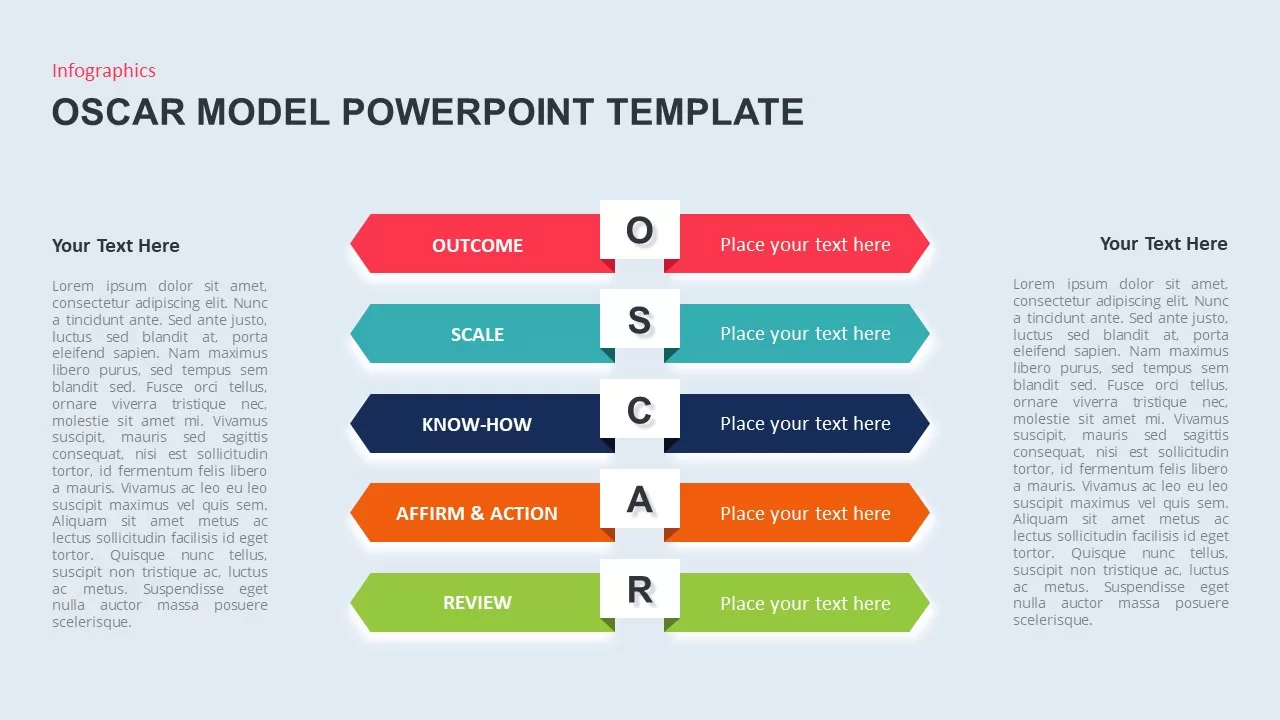
OSCAR Coaching Model Template for PowerPoint & Google Slides
Business Models
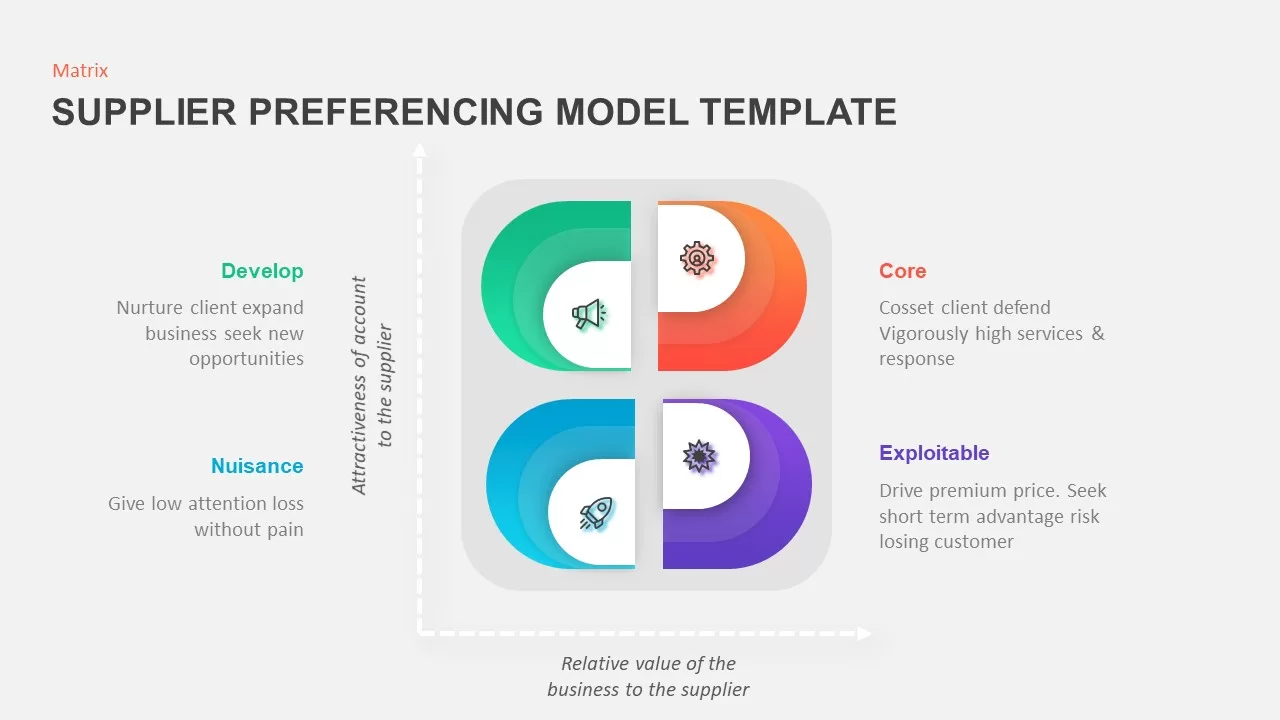
Supplier Preferencing Model Matrix Template for PowerPoint & Google Slides
Business Strategy
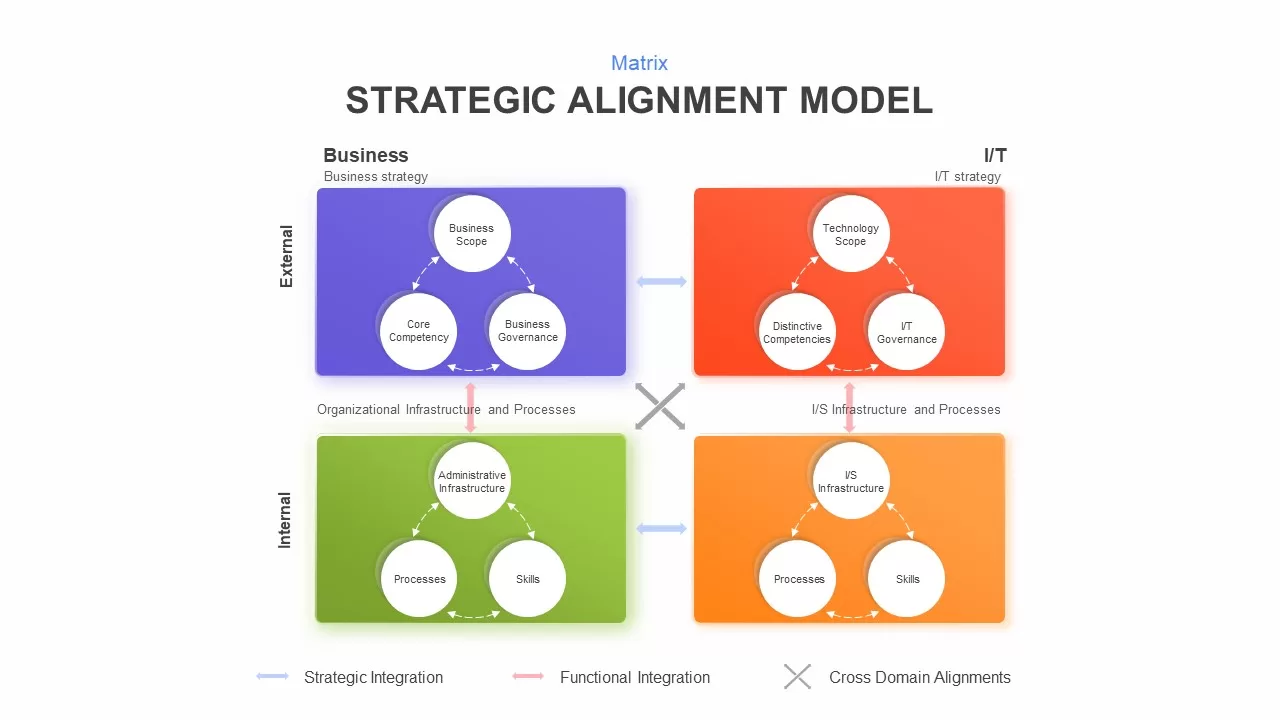
Strategic Alignment Matrix Model Template for PowerPoint & Google Slides
Project
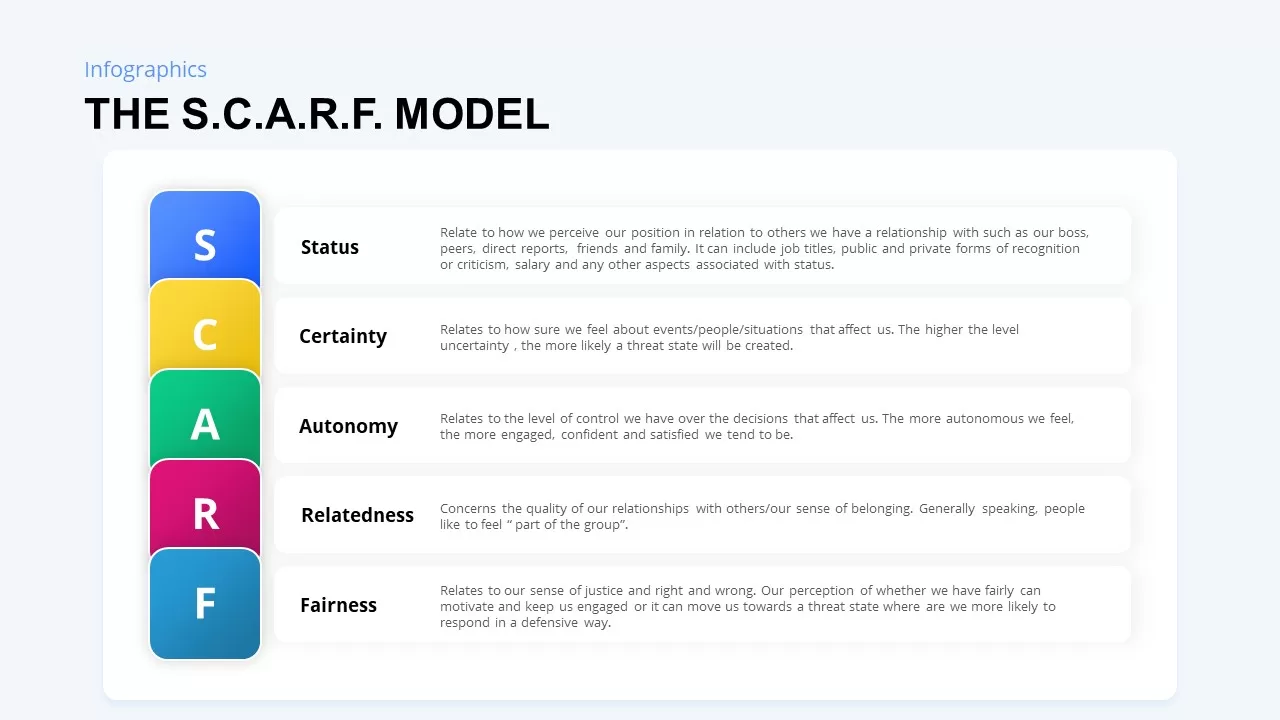
SCARF Model Social Threats & Rewards Template for PowerPoint & Google Slides
Business Strategy
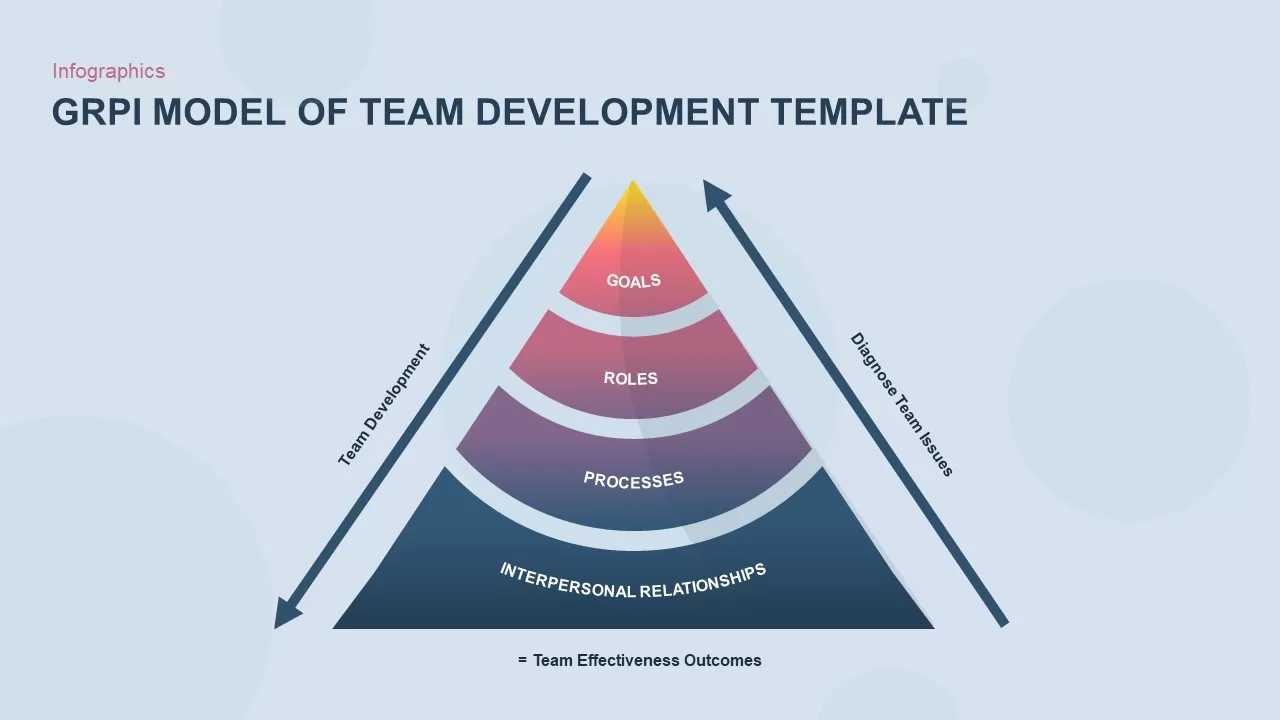
GRPI Model of Team Development Framework Template for PowerPoint & Google Slides
Leadership
OSCAR Behavior Model Infographic Template for PowerPoint & Google Slides
HR
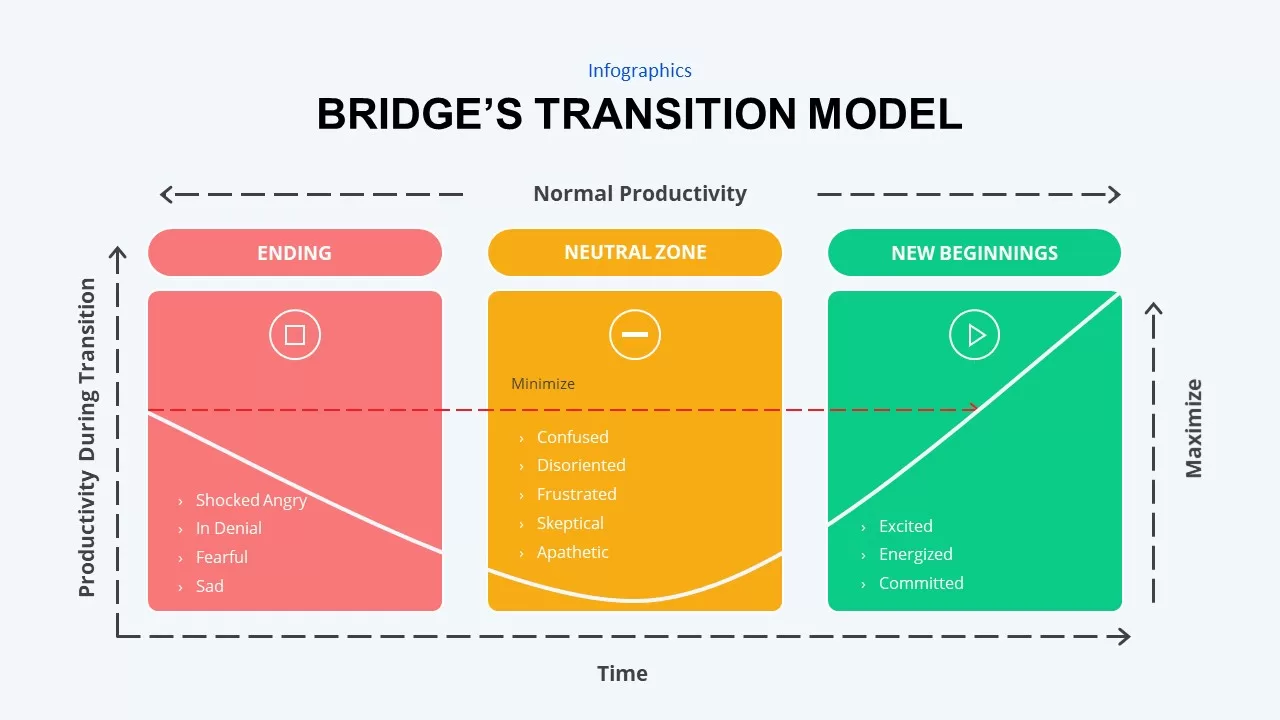
Bridge’s Transition Model Infographic Template for PowerPoint & Google Slides
HR
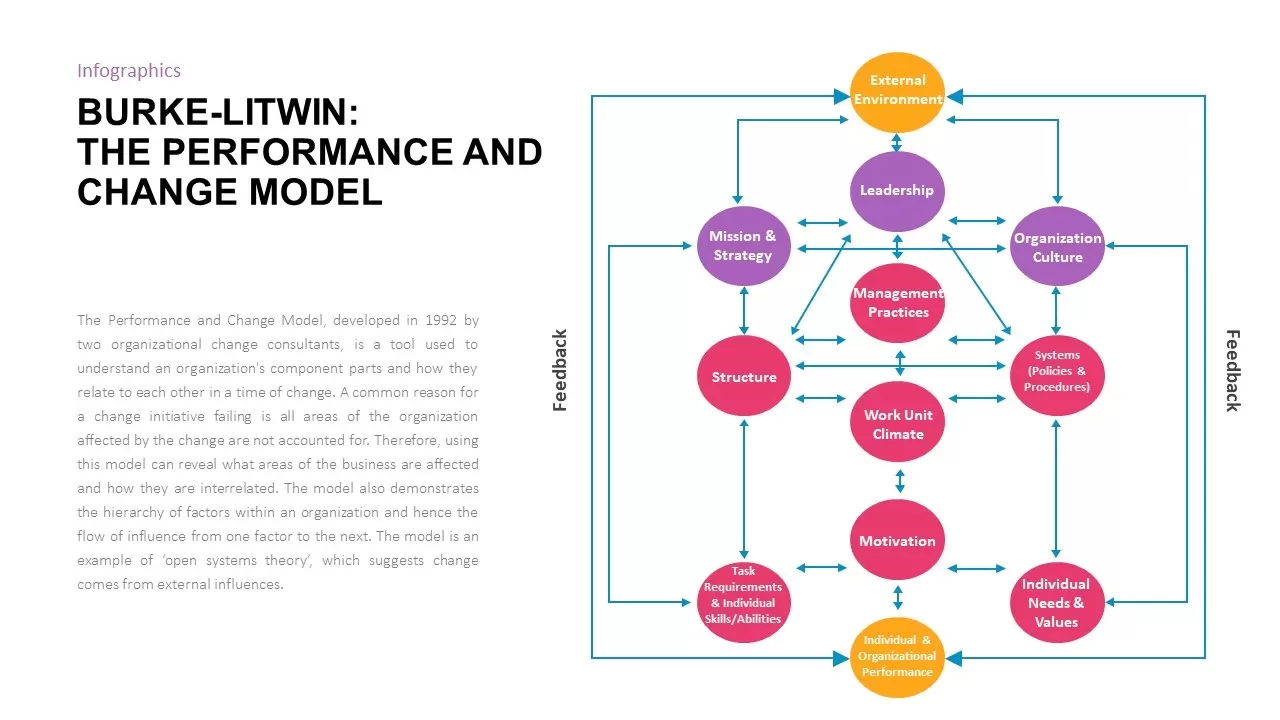
Burke-Litwin Performance and Change Model template for PowerPoint & Google Slides
Infographics
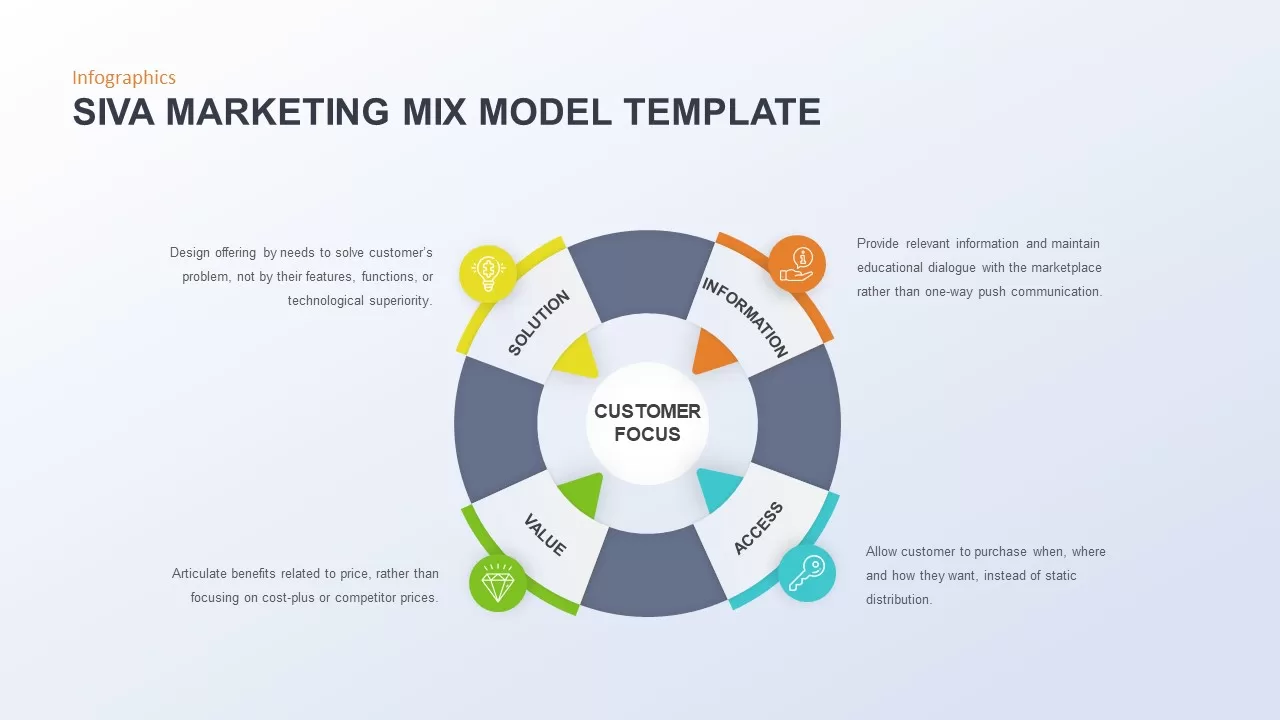
Comprehensive SIVA Marketing Mix Model Template for PowerPoint & Google Slides
Marketing
Demographic Transition Model Template for PowerPoint & Google Slides
Process
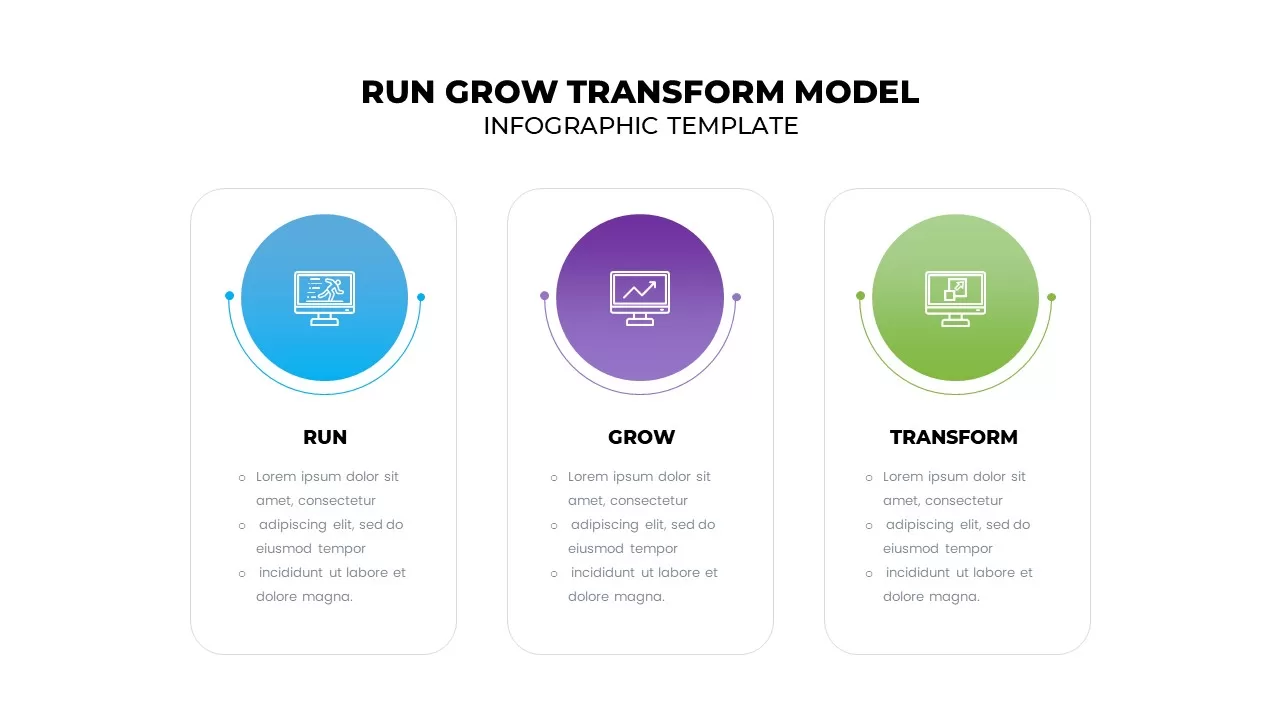
Run Grow Transform Model Infographic Template for PowerPoint & Google Slides
Business
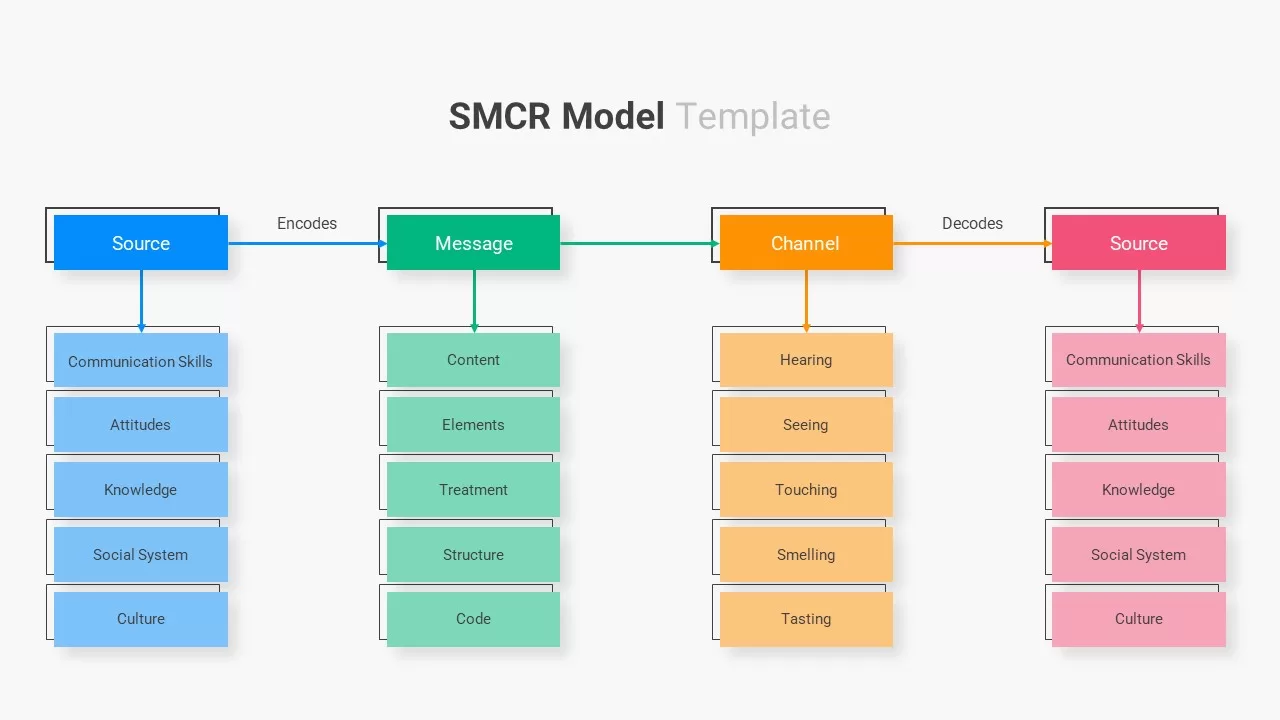
SMCR Model Template for PowerPoint & Google Slides
Infographics
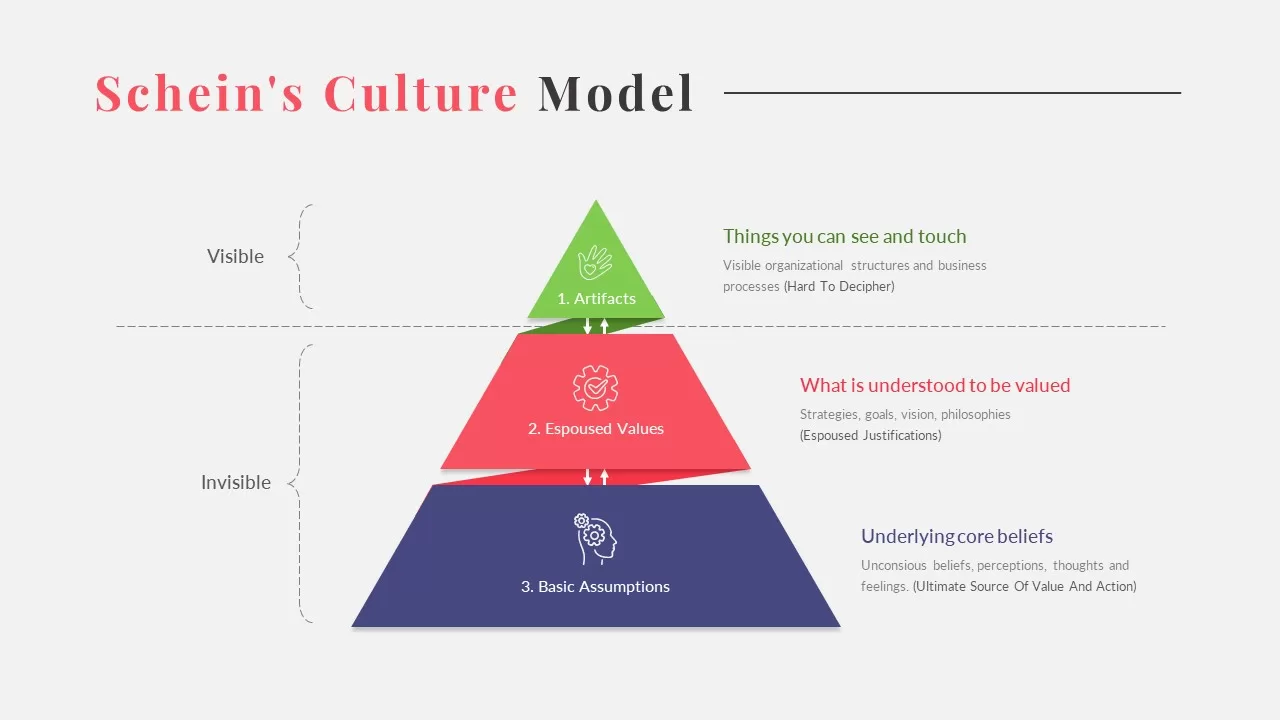
Schein’s Culture Pyramid Model Template for PowerPoint & Google Slides
Pyramid
DIKW Data to Wisdom Pyramid Model Template for PowerPoint & Google Slides
Pyramid
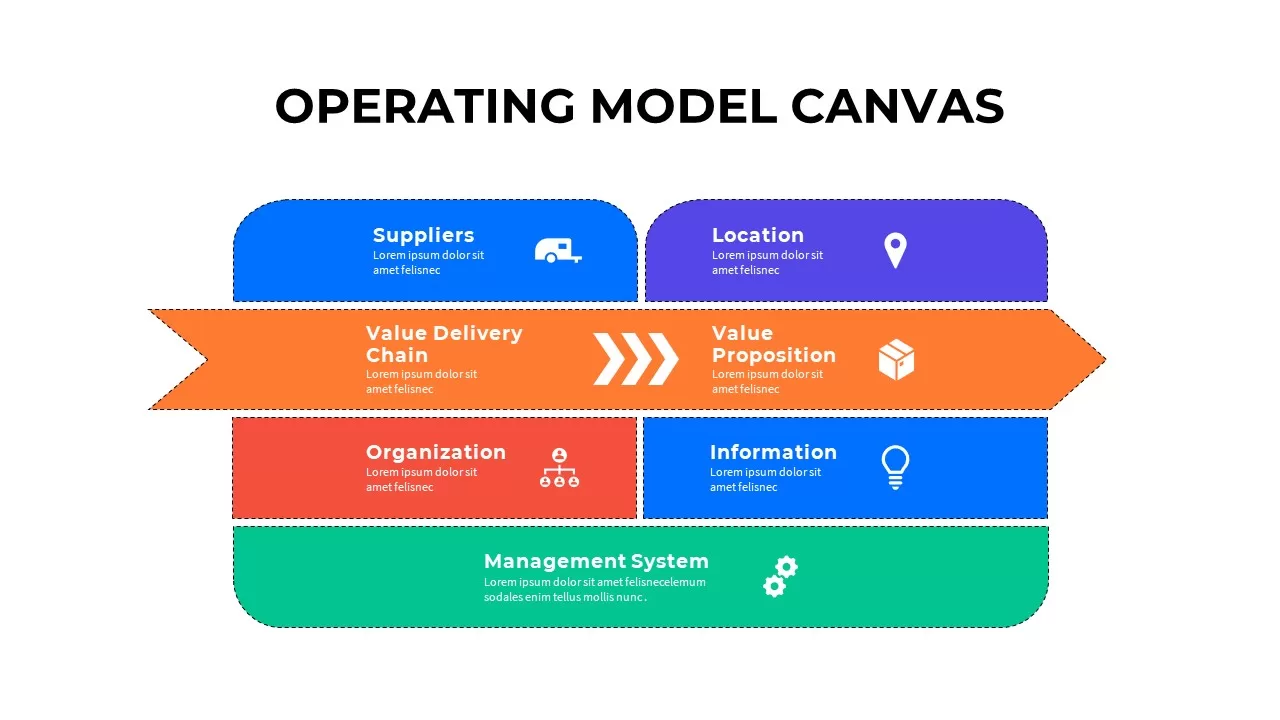
Operating Model Canvas Infographic Template for PowerPoint & Google Slides
Business Models
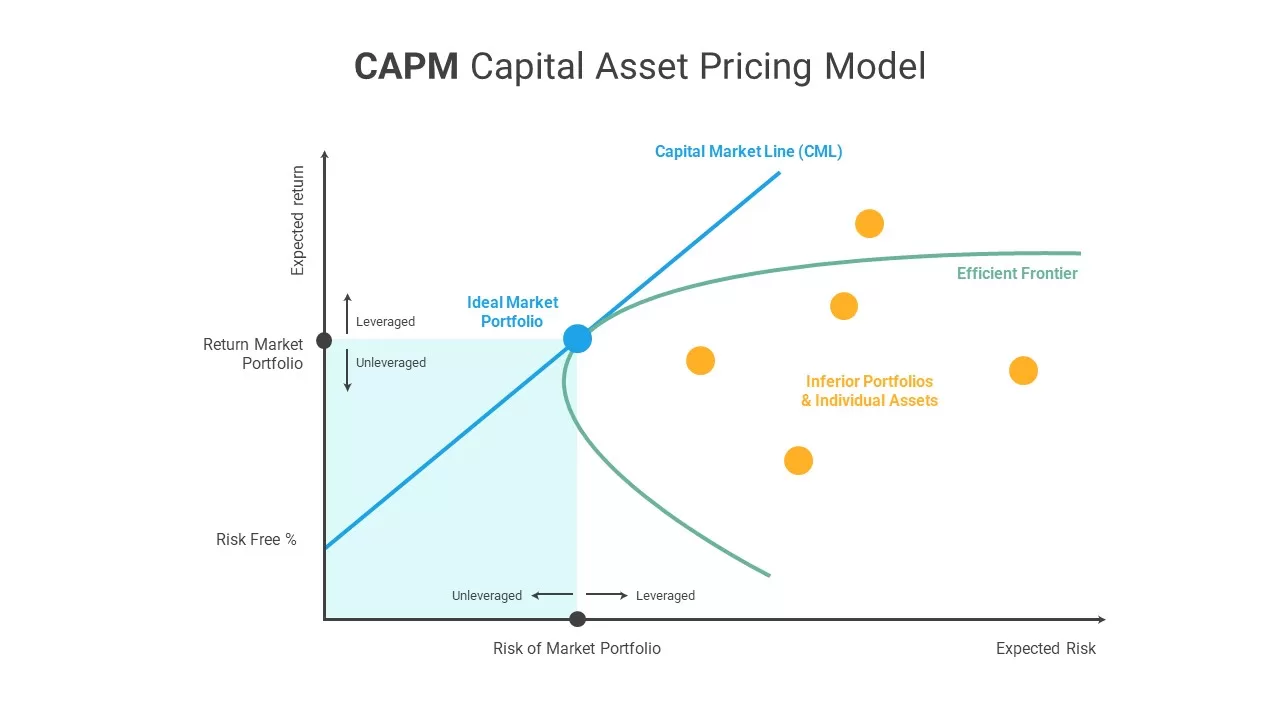
CAPM Capital Asset Pricing Model template for PowerPoint & Google Slides
Finance
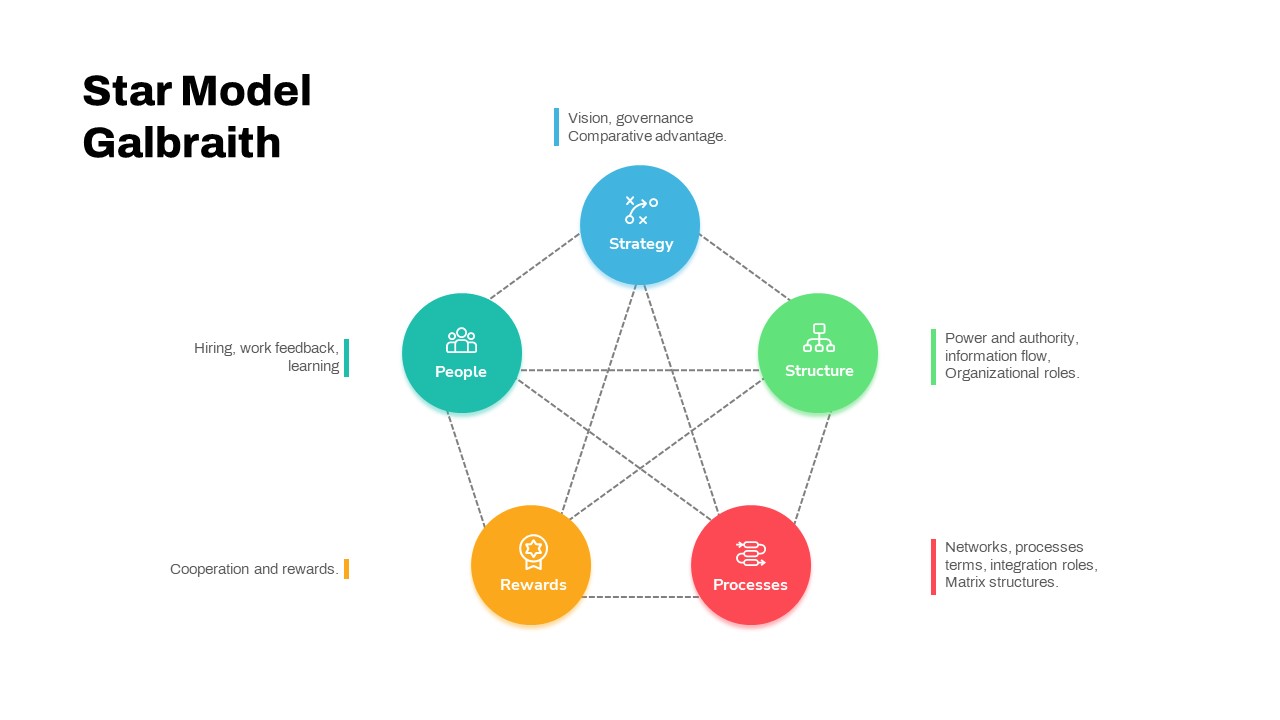
Star Model Galbraith Framework Template for PowerPoint & Google Slides
Business Strategy
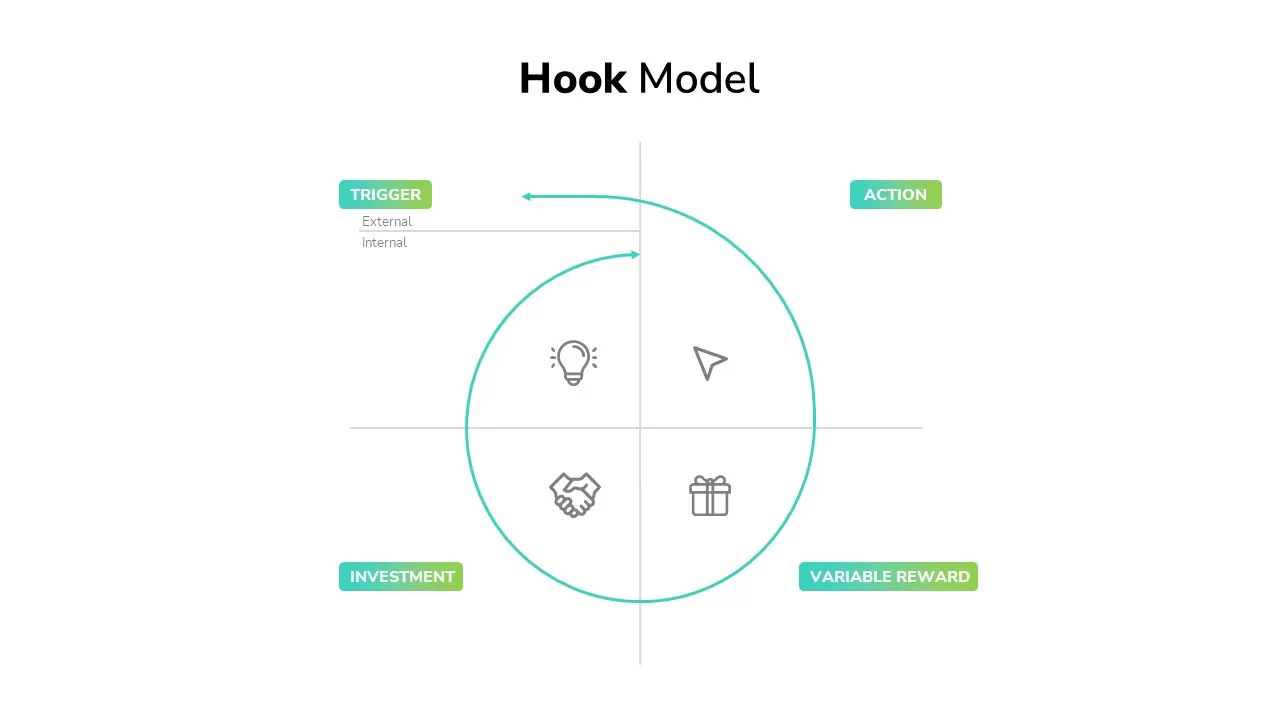
Hook Model Framework Template for PowerPoint & Google Slides
Business Strategy
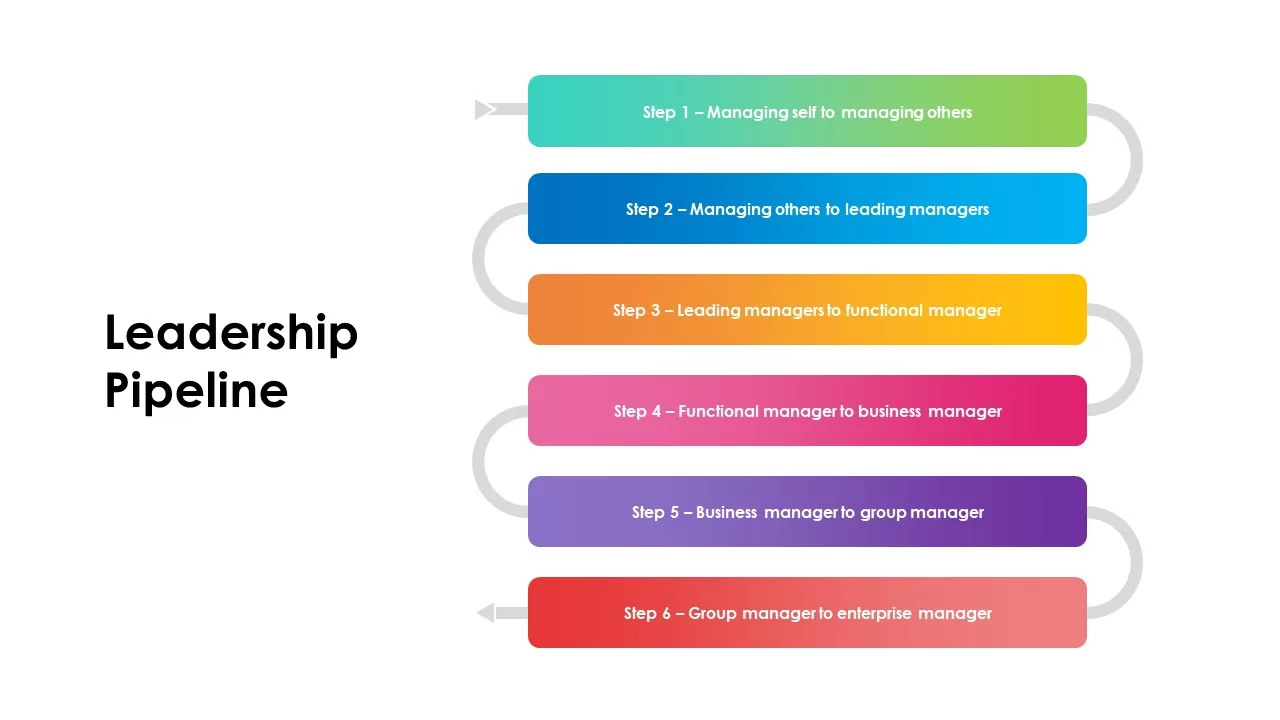
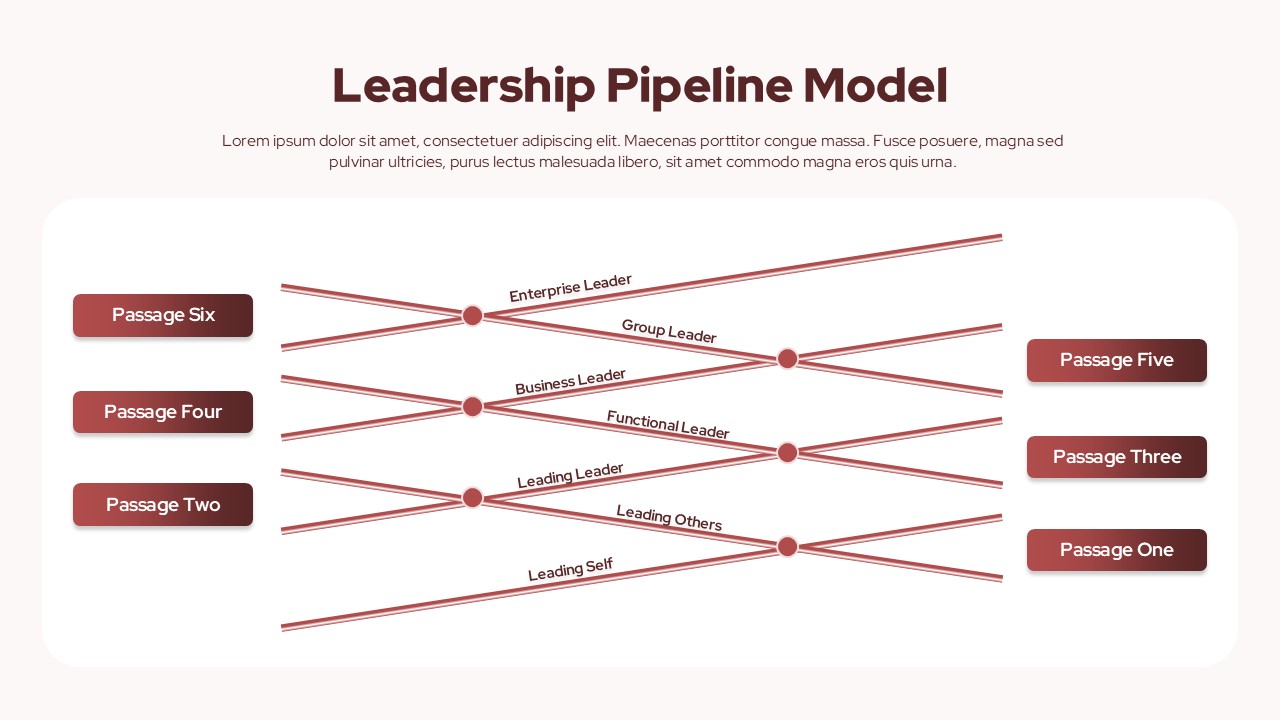
Leadership Pipeline Model Template for PowerPoint & Google Slides
Business Strategy
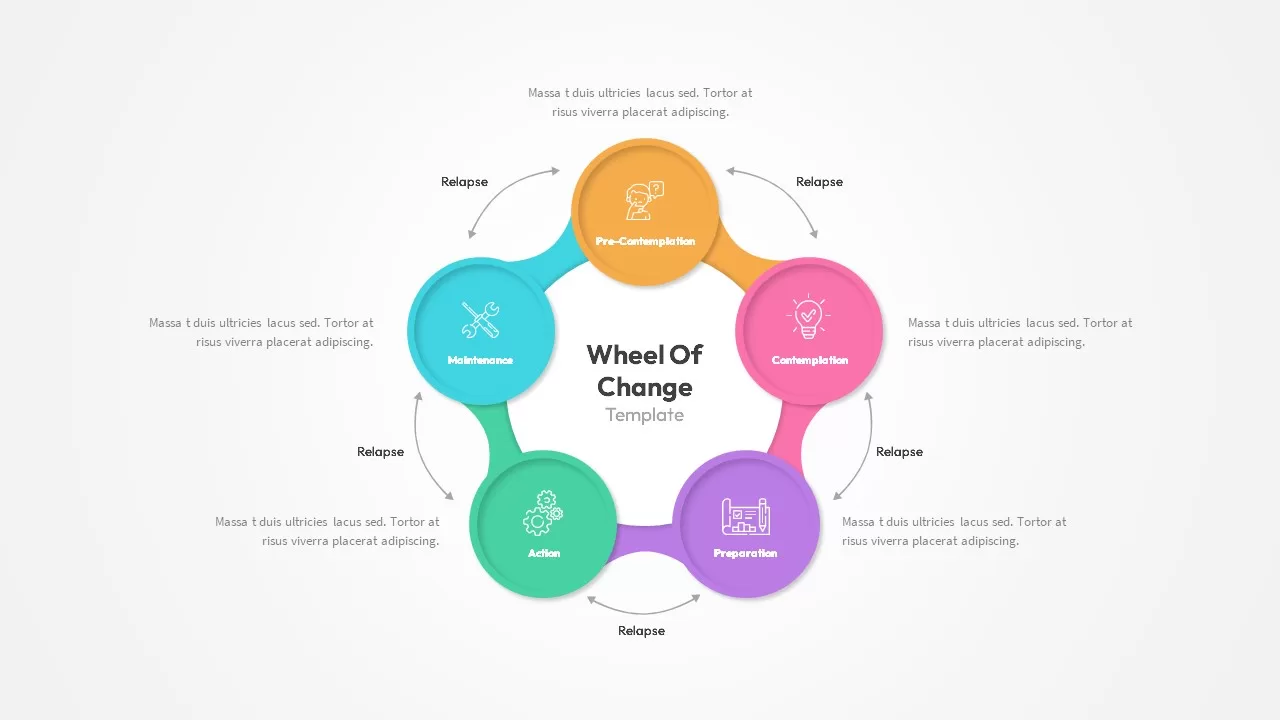
Wheel of Change Model template for PowerPoint & Google Slides
Business Strategy
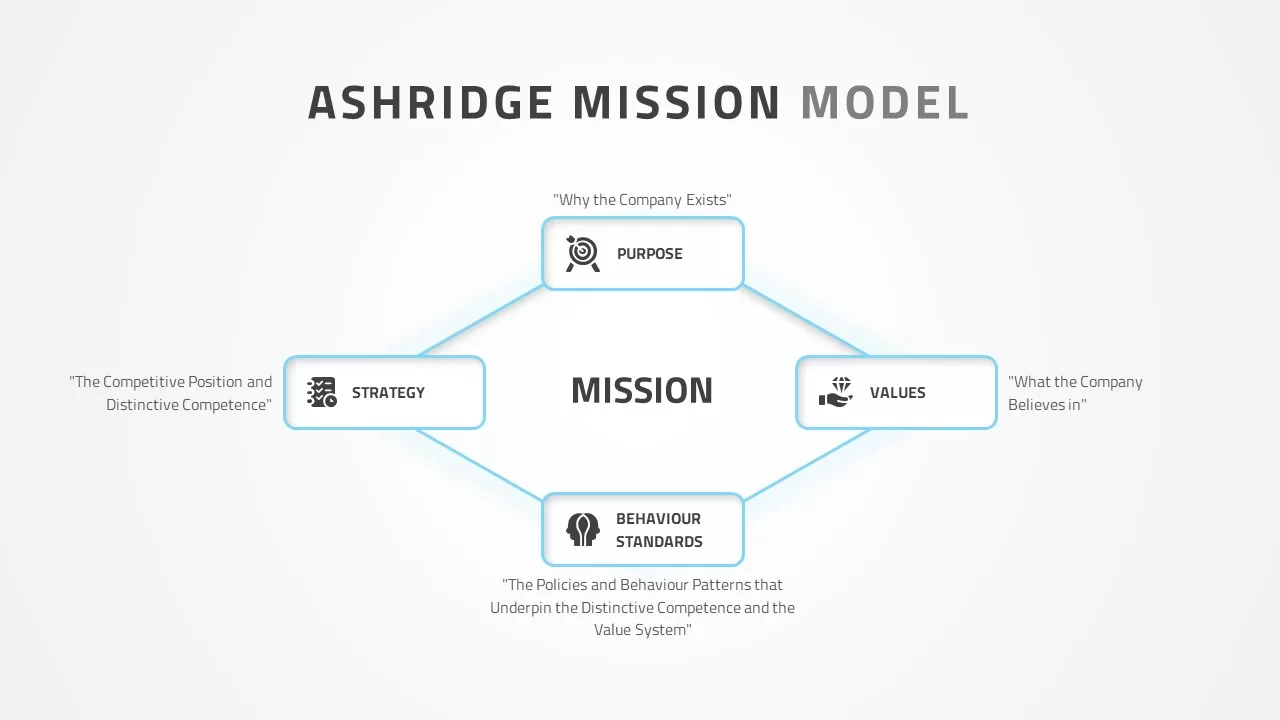
Ashridge Mission Model template for PowerPoint & Google Slides
Competitor Analysis
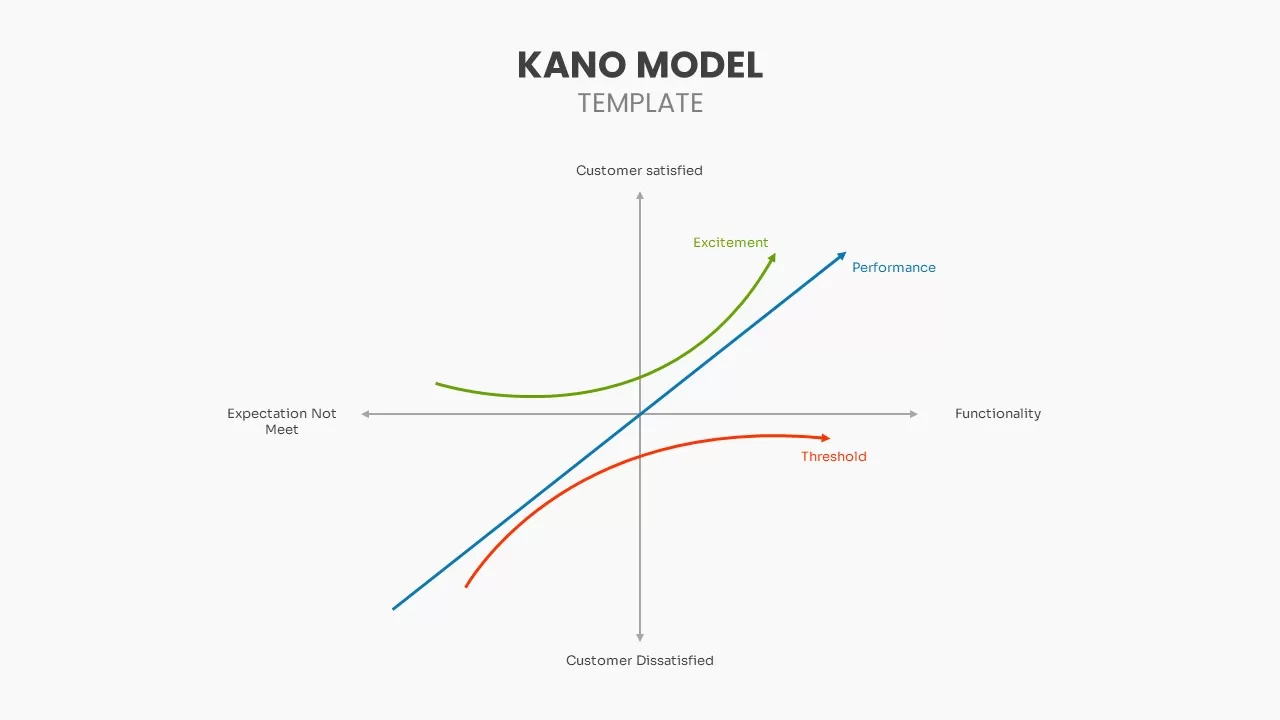
Kano Model template for PowerPoint & Google Slides
Business Strategy
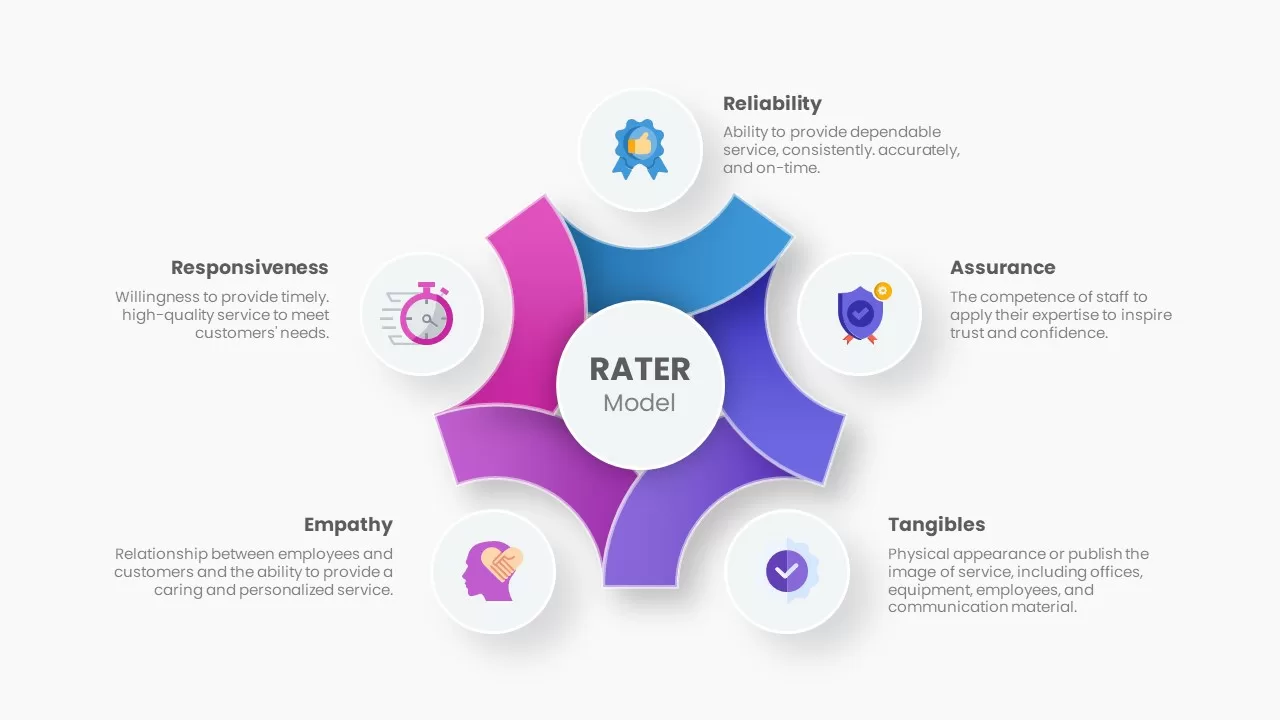
RATER Model template for PowerPoint & Google Slides
Business Strategy
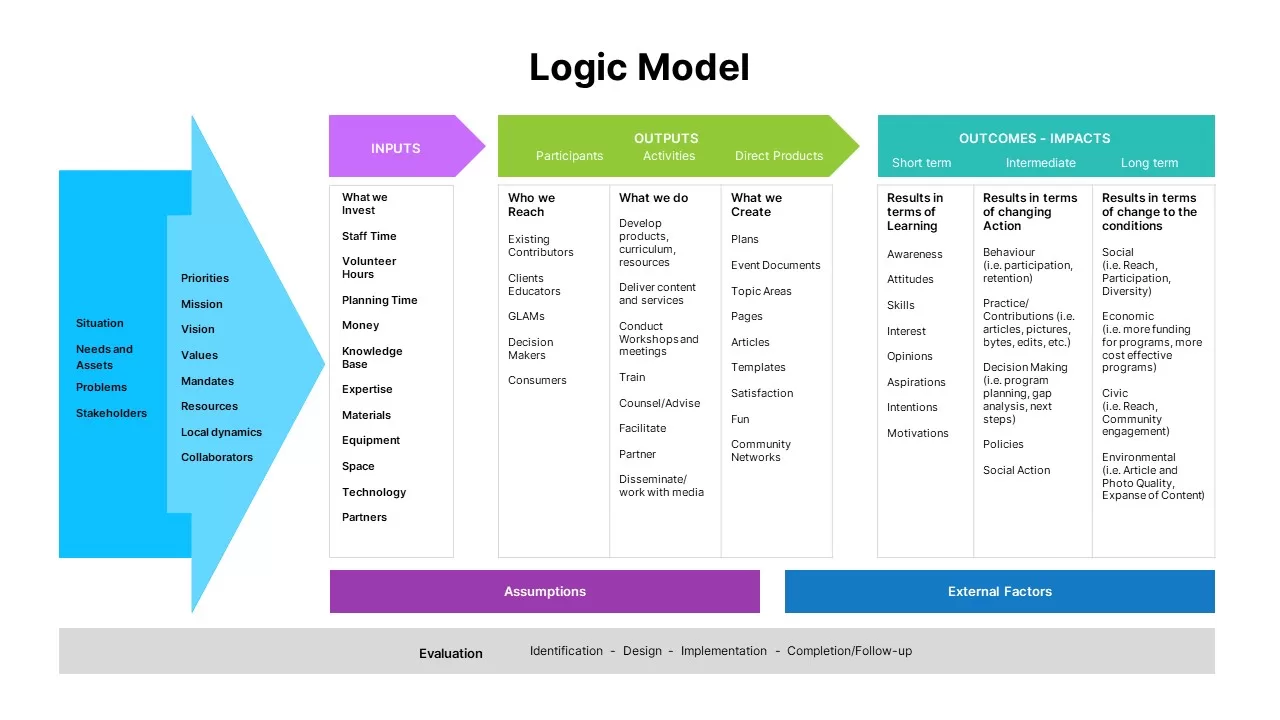
Logic Model template for PowerPoint & Google Slides
Infographics
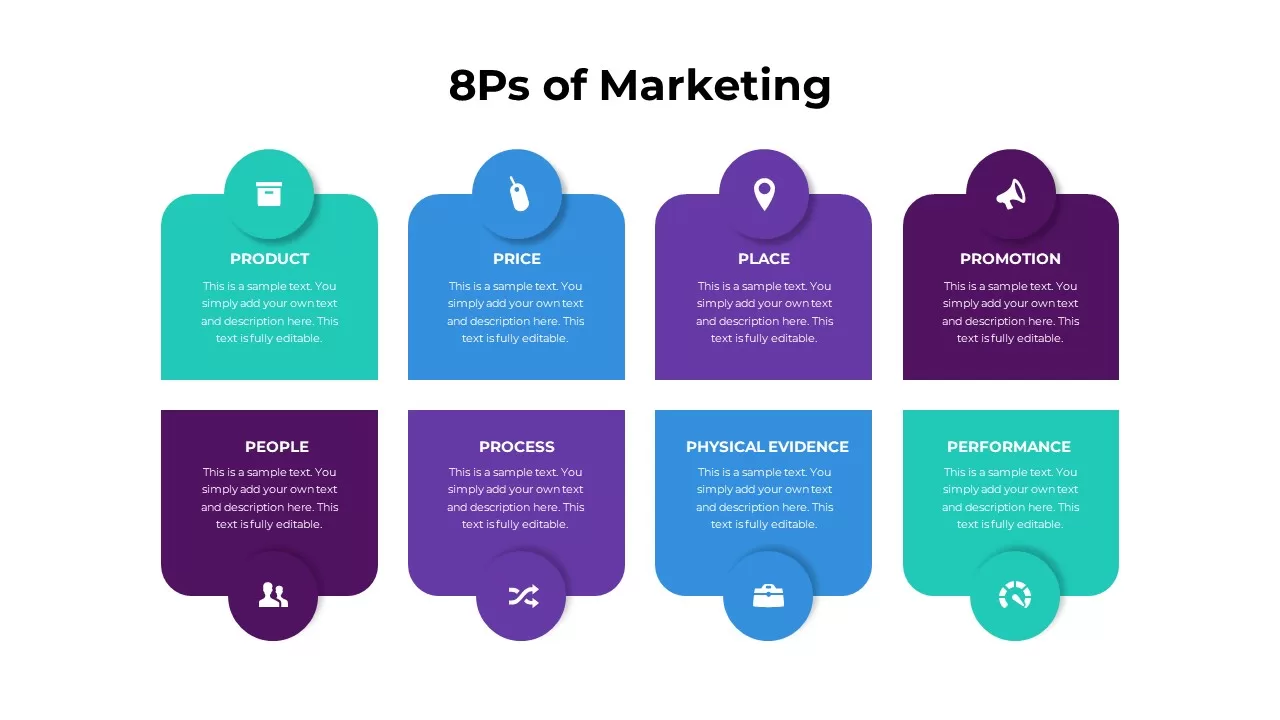
8Ps of Marketing Model Infographic Template for PowerPoint & Google Slides
Marketing
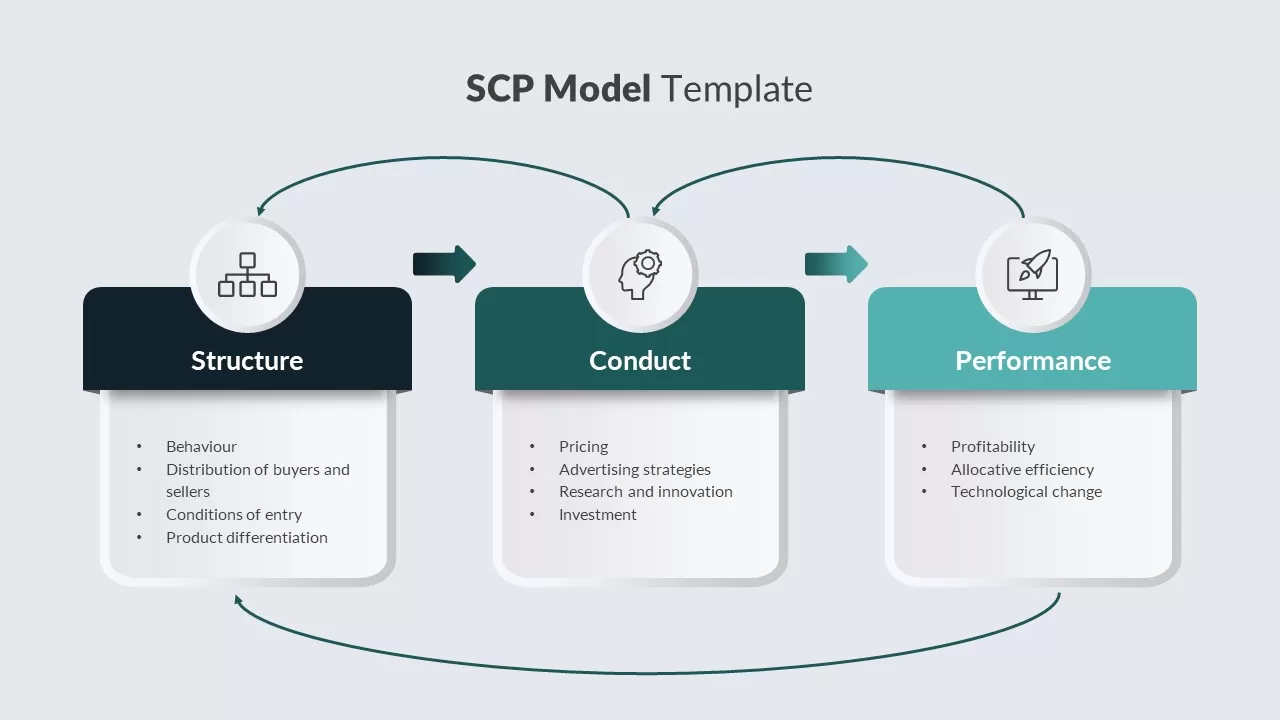
SCP Model Template for PowerPoint & Google Slides
Process
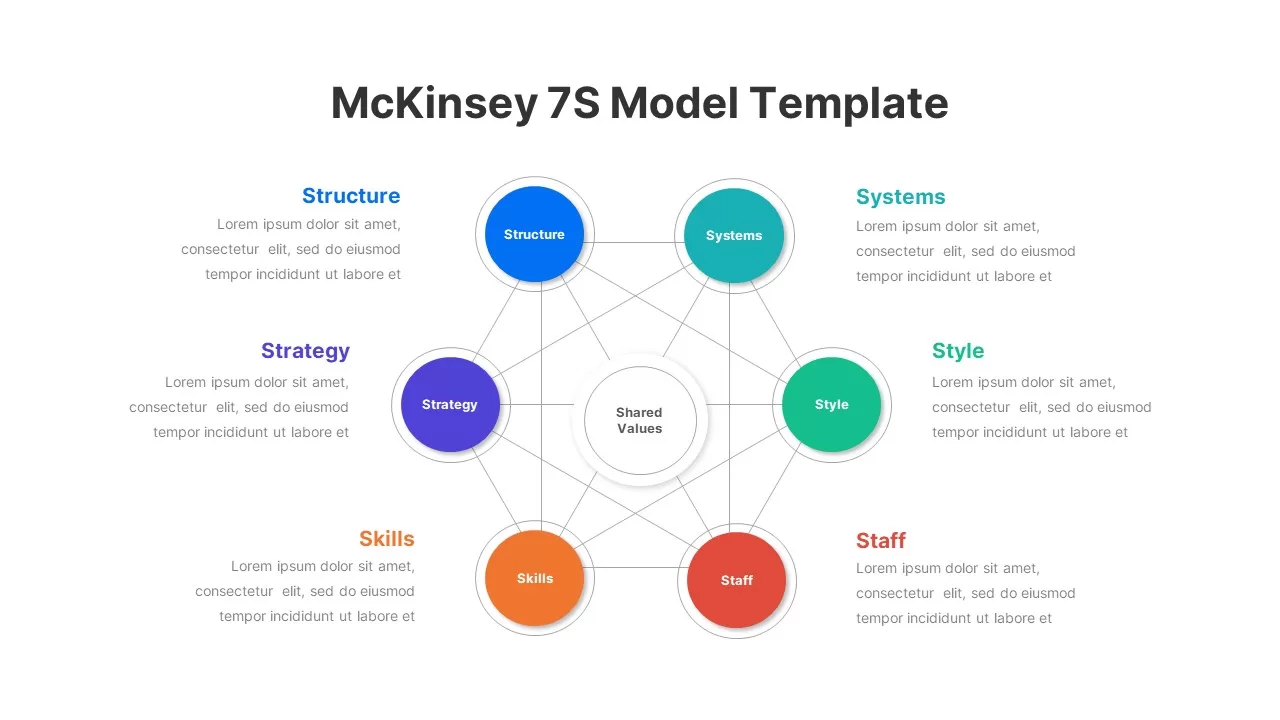
McKinsey 7S Model Strategic Alignment Template for PowerPoint & Google Slides
Circular
Hexagon 7S Strategic Alignment Model Template for PowerPoint & Google Slides
Business Strategy
Five-Stage Digital Maturity Model Diagram Template for PowerPoint & Google Slides
Process
Flywheel Model Infographic Template for PowerPoint & Google Slides
Process
Four-Segment Flywheel Infographic Model Template for PowerPoint & Google Slides
Process
AAKER brand equity model template for PowerPoint & Google Slides
Business Strategy
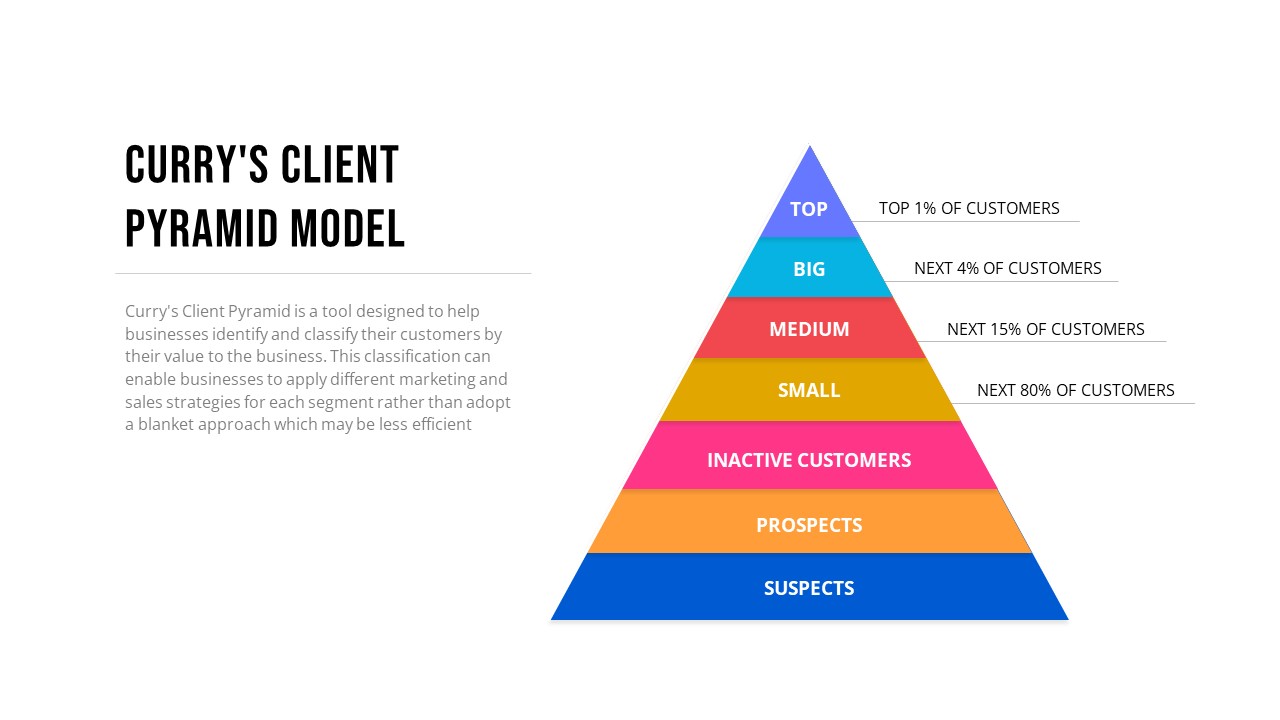
Curry’s Client Segmentation Pyramid Model Template for PowerPoint & Google Slides
Pyramid
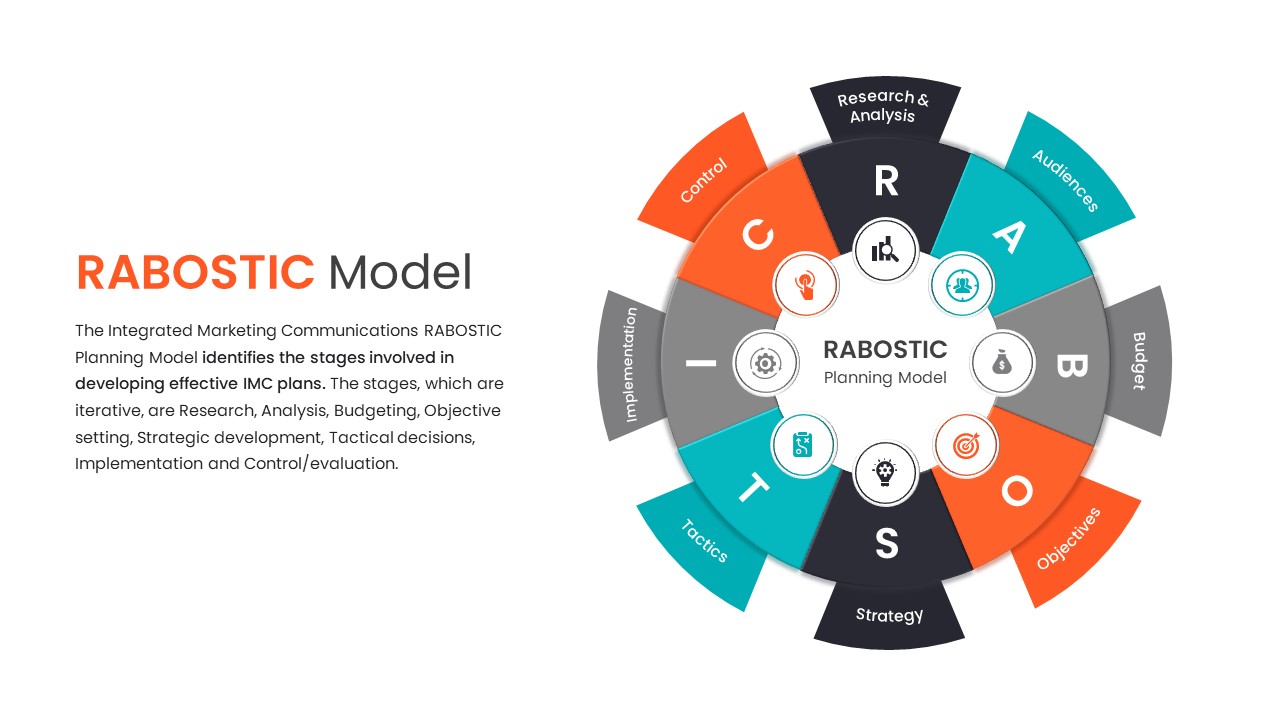
RABOSTIC IMC Planning Model Diagram Template for PowerPoint & Google Slides
Process
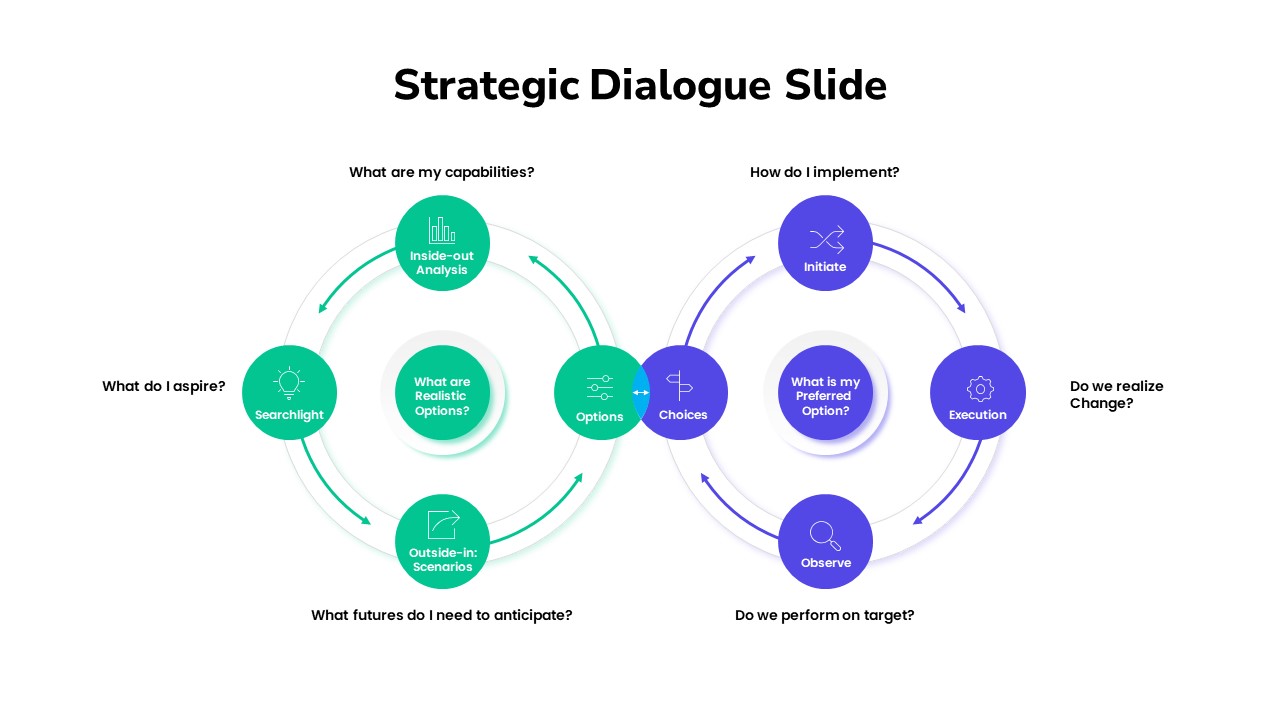
Strategic Dialogue Model Cycle Template for PowerPoint & Google Slides
Circular
Organizational Maturity Model Diagram Template for PowerPoint & Google Slides
Process
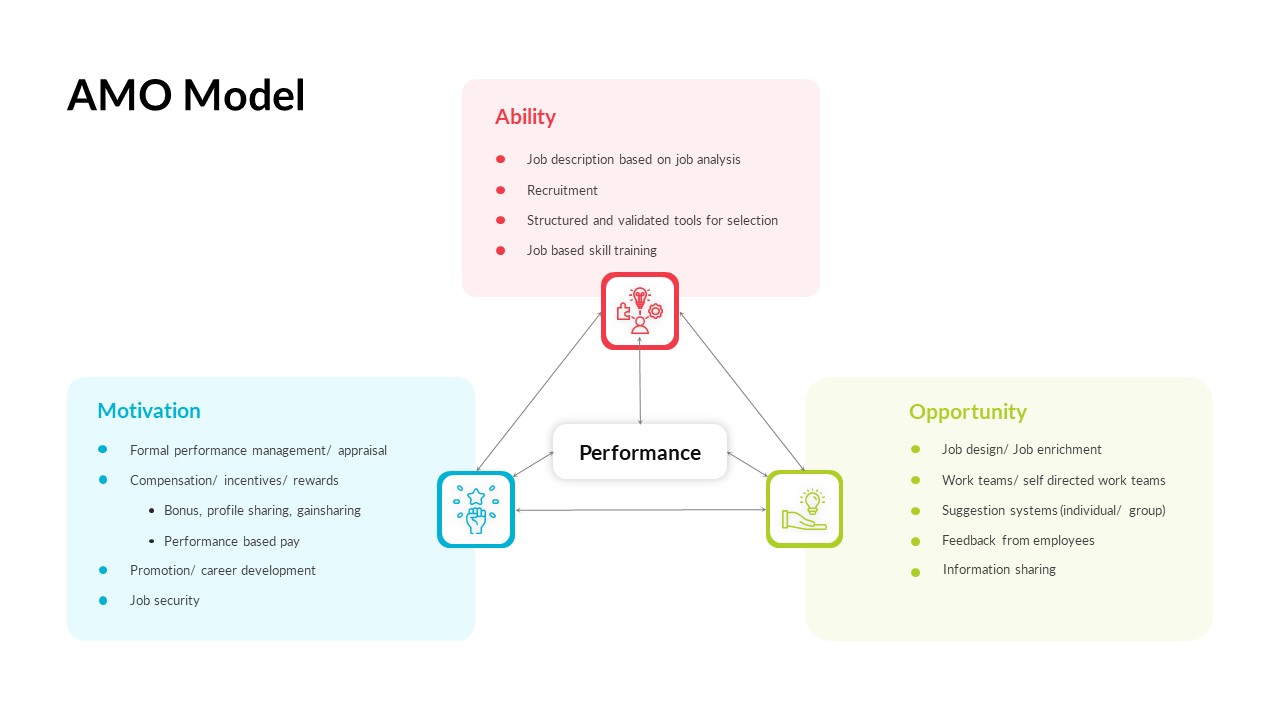
AMO Performance Model Feedback Diagram Template for PowerPoint & Google Slides
Employee Performance
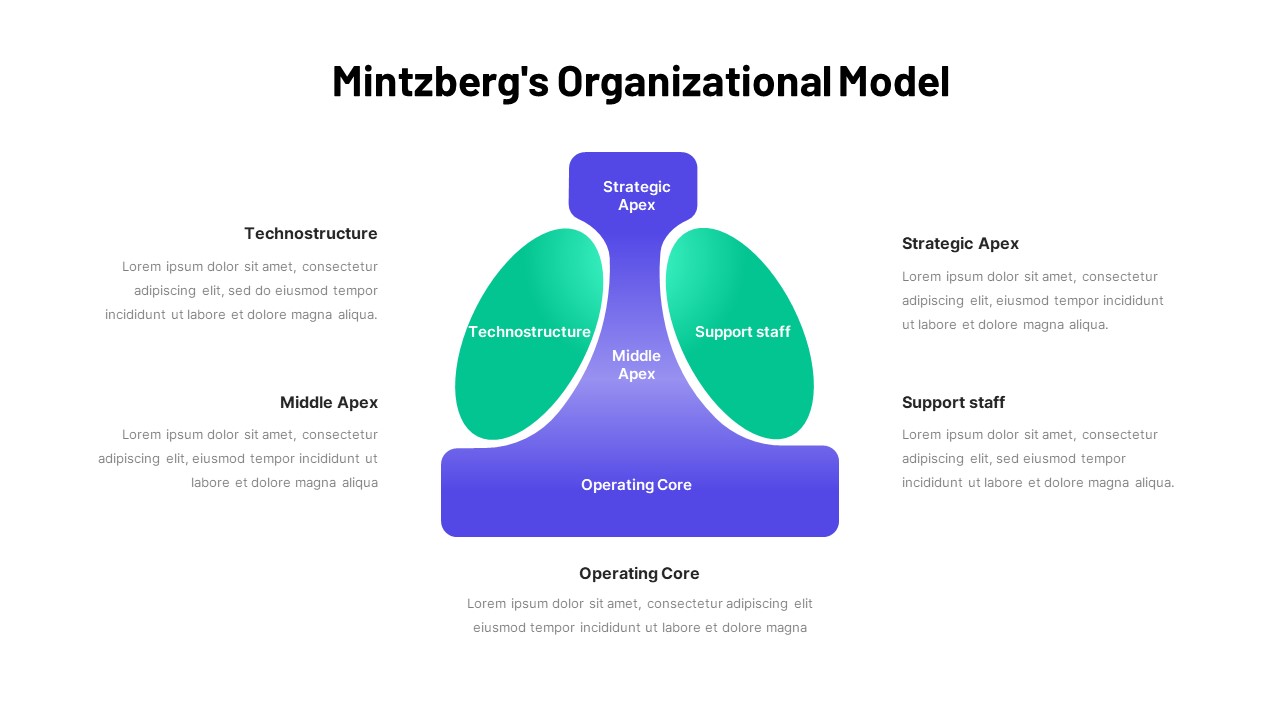
Mintzberg Organizational Model Gradient Template for PowerPoint & Google Slides
Business
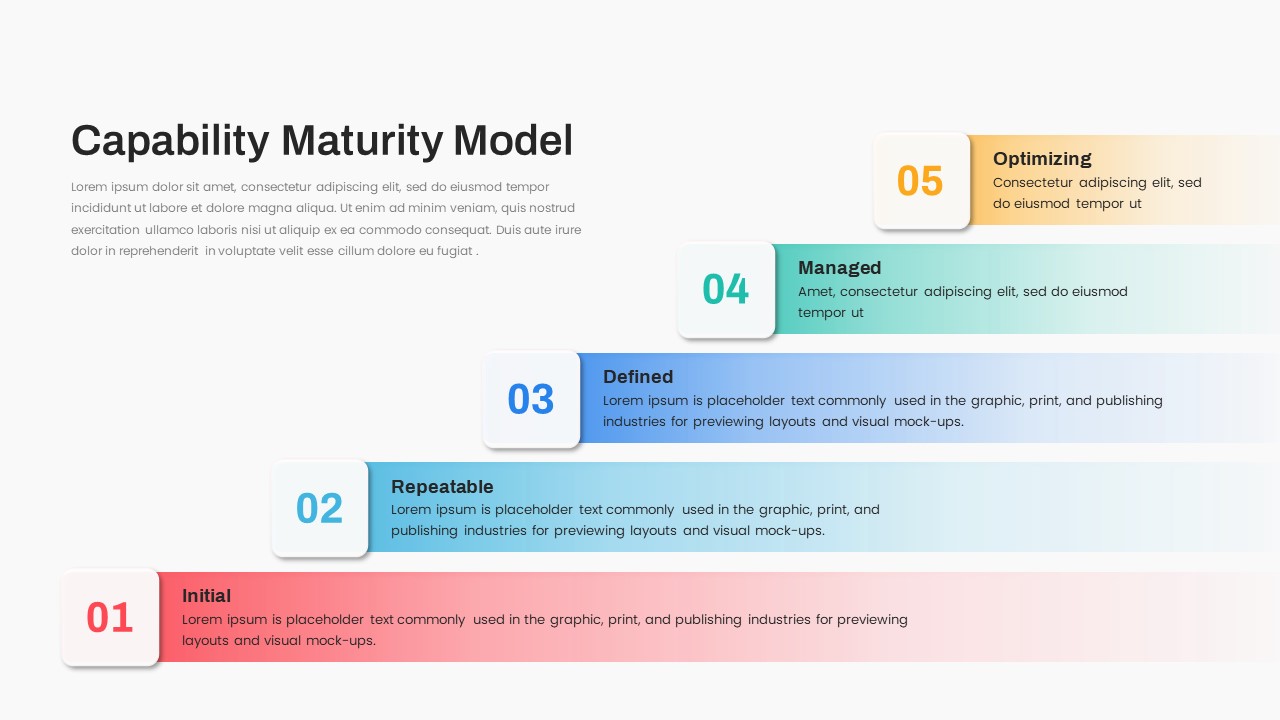
Capability Maturity Model Infographic Template for PowerPoint & Google Slides
Software Development
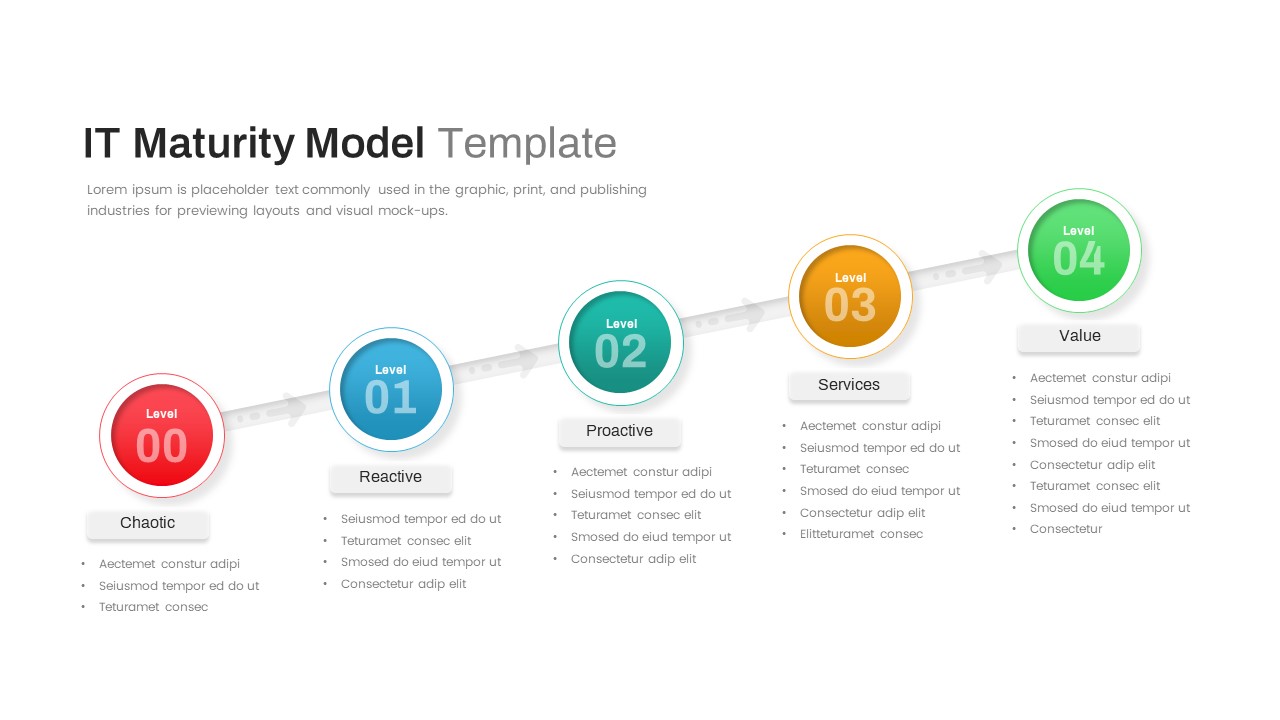
IT Maturity Model with Five Stages Template for PowerPoint & Google Slides
Timeline
Layered Data Governance Maturity Model Template for PowerPoint & Google Slides
Process
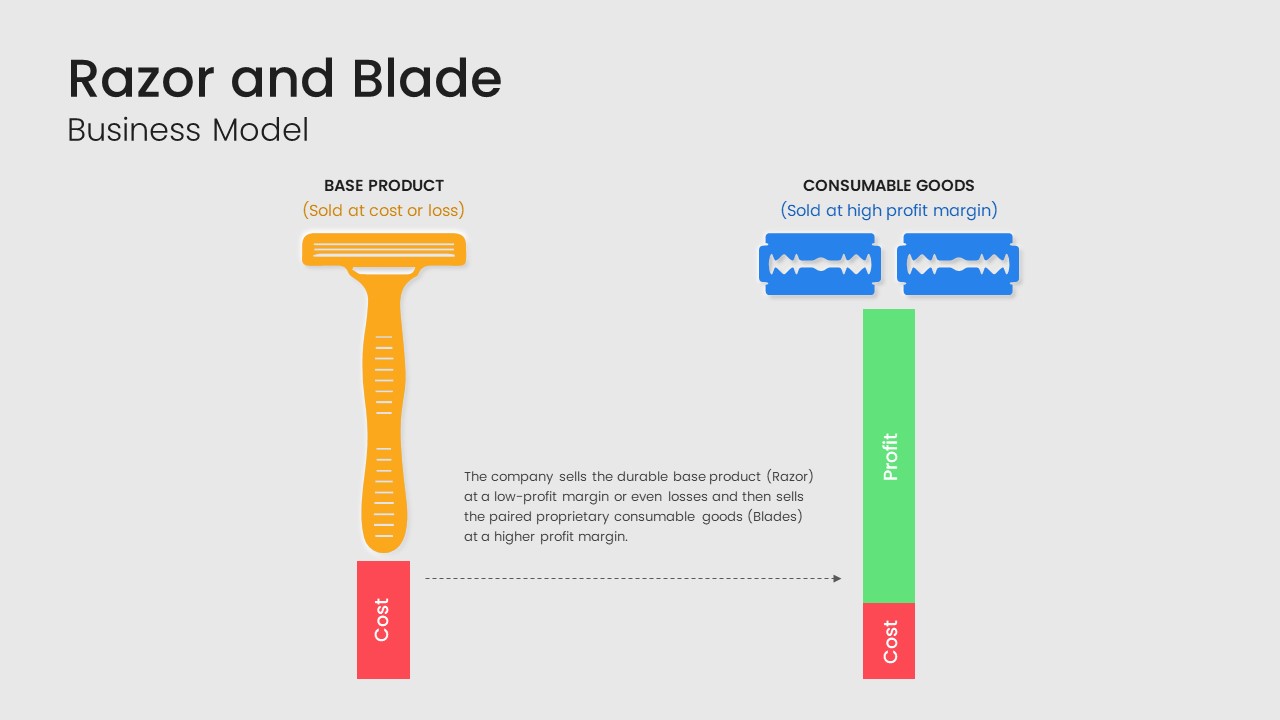
Razor and Blade Business Model Diagram Template for PowerPoint & Google Slides
Business Models
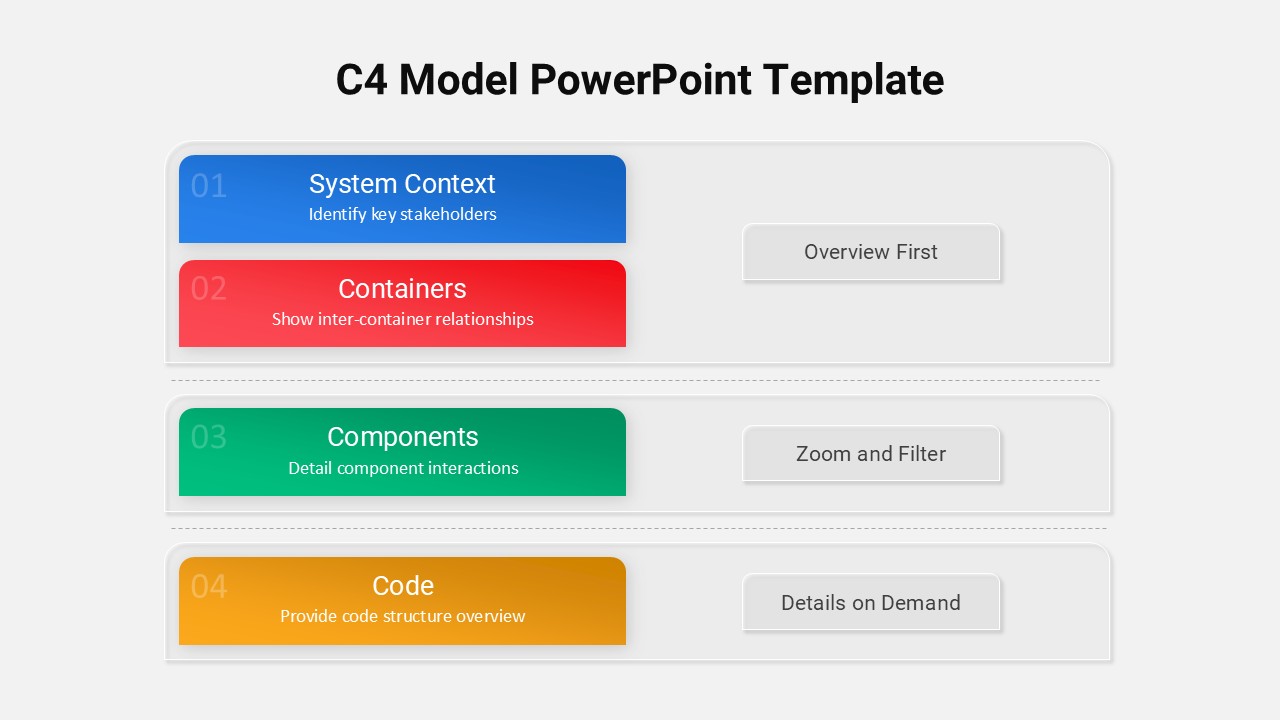
C4 Model Architecture Overview Template for PowerPoint & Google Slides
Software Development
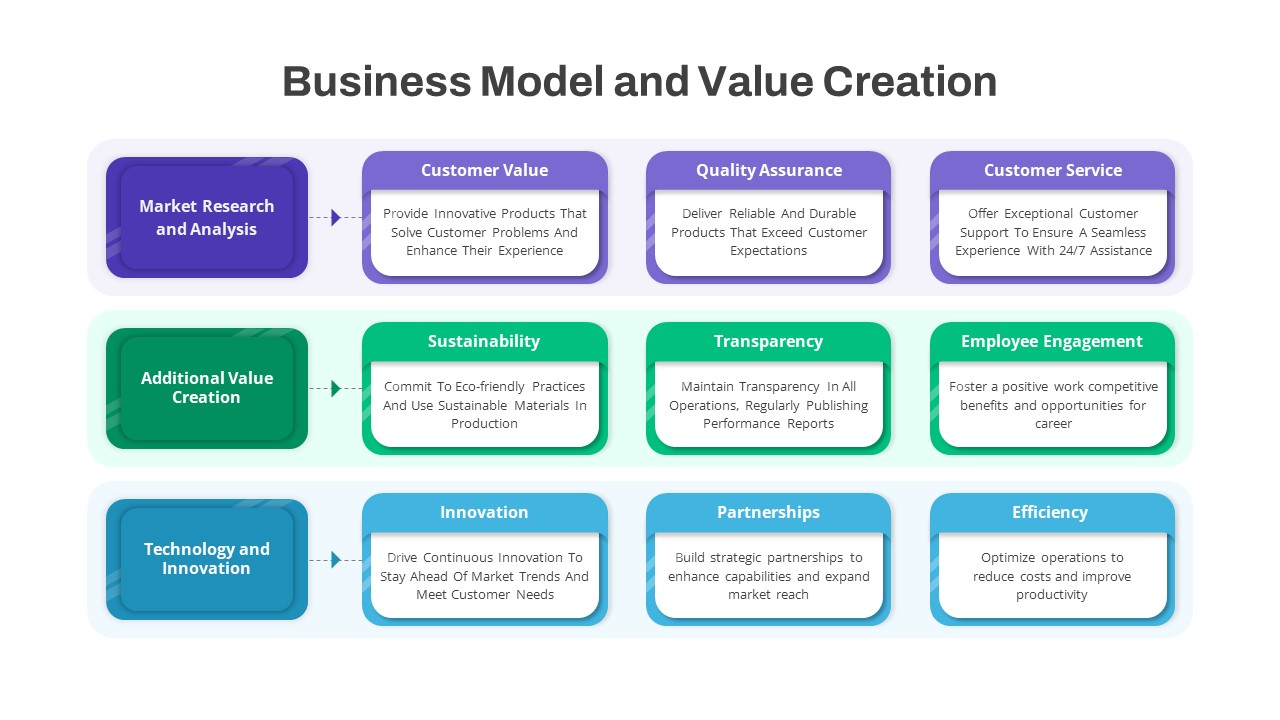
Business Model & Value Creation Template for PowerPoint & Google Slides
Process
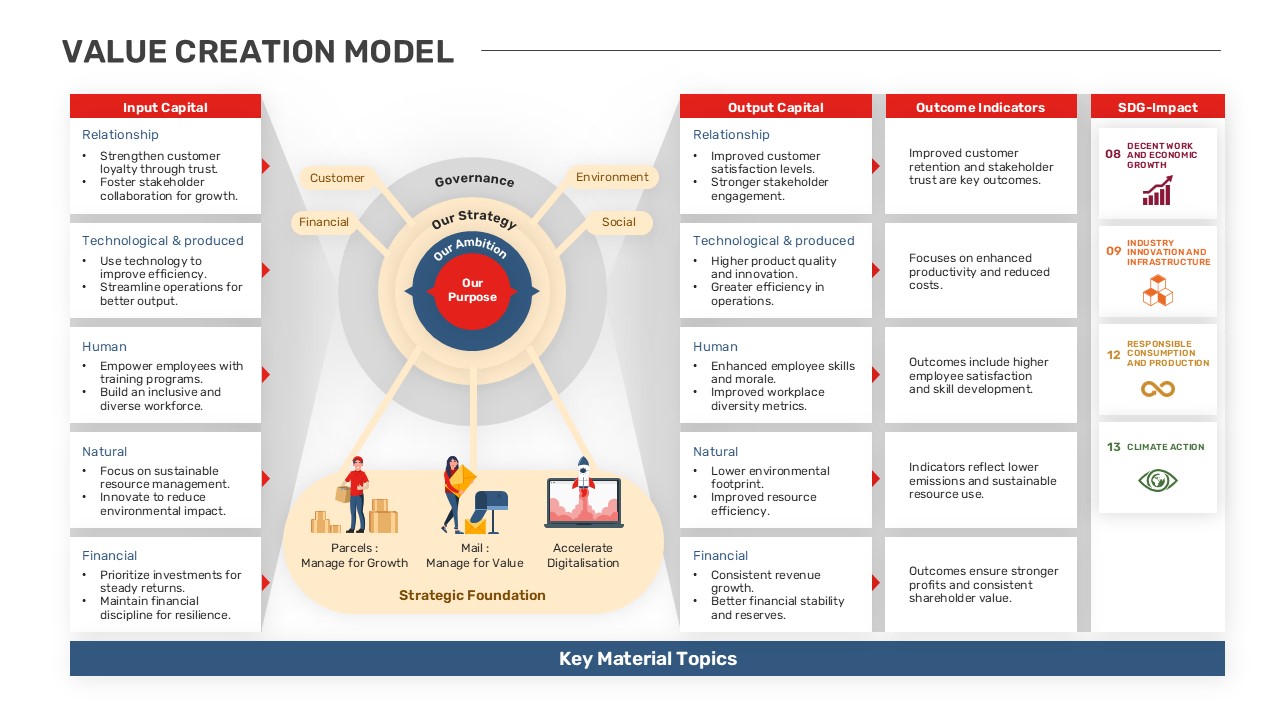
Comprehensive Value Creation Model Template for PowerPoint & Google Slides
Business Models
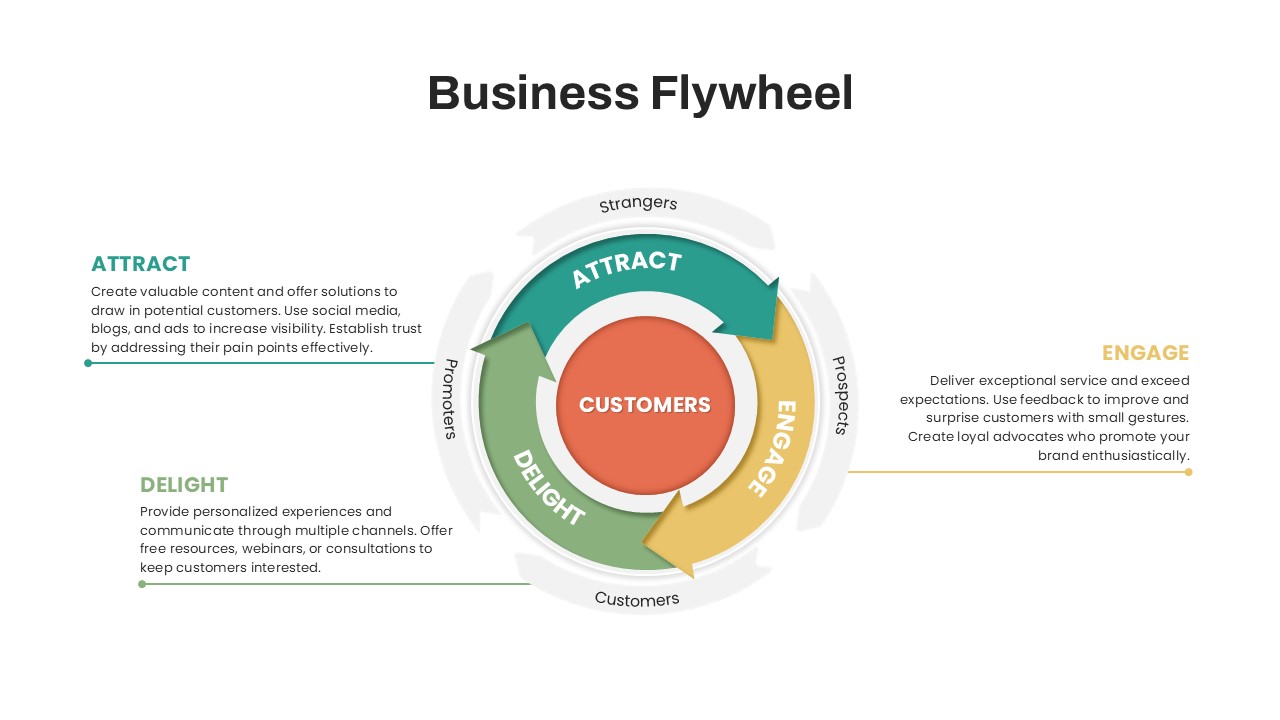
Business Flywheel Lifecycle Model Template for PowerPoint & Google Slides
Circular
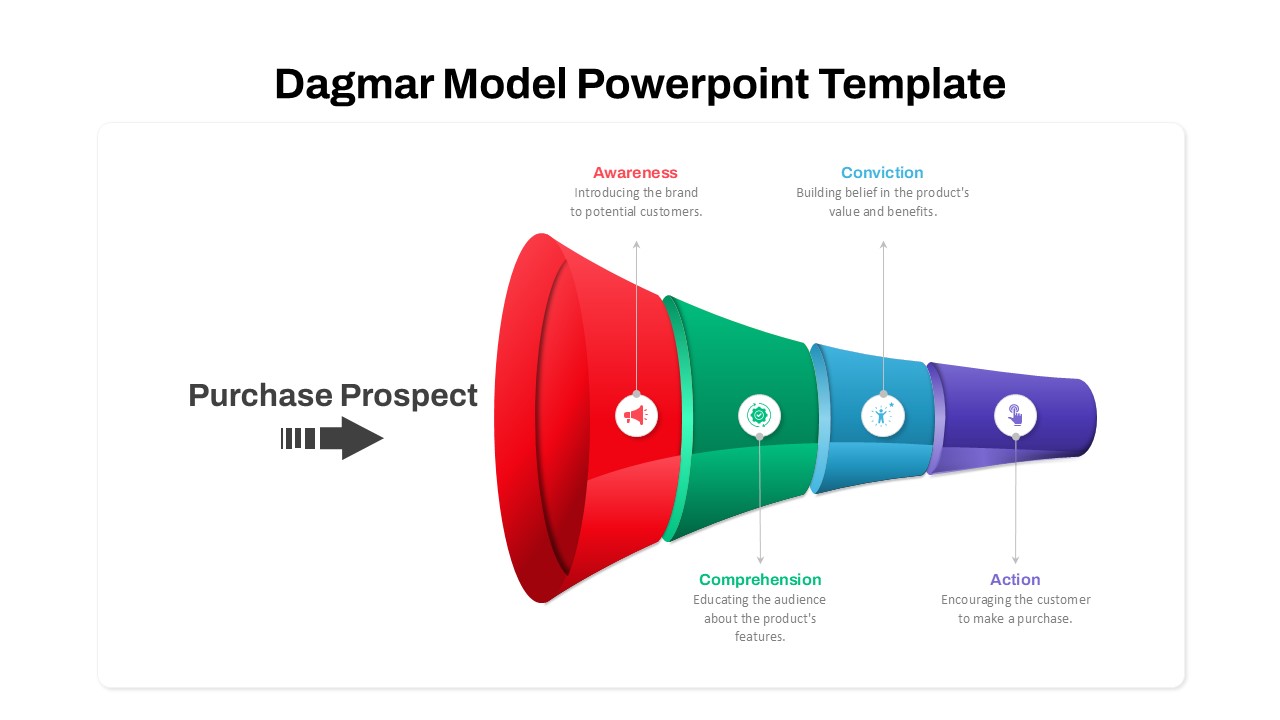
Dagmar Model Marketing Funnel Diagram Template for PowerPoint & Google Slides
Funnel
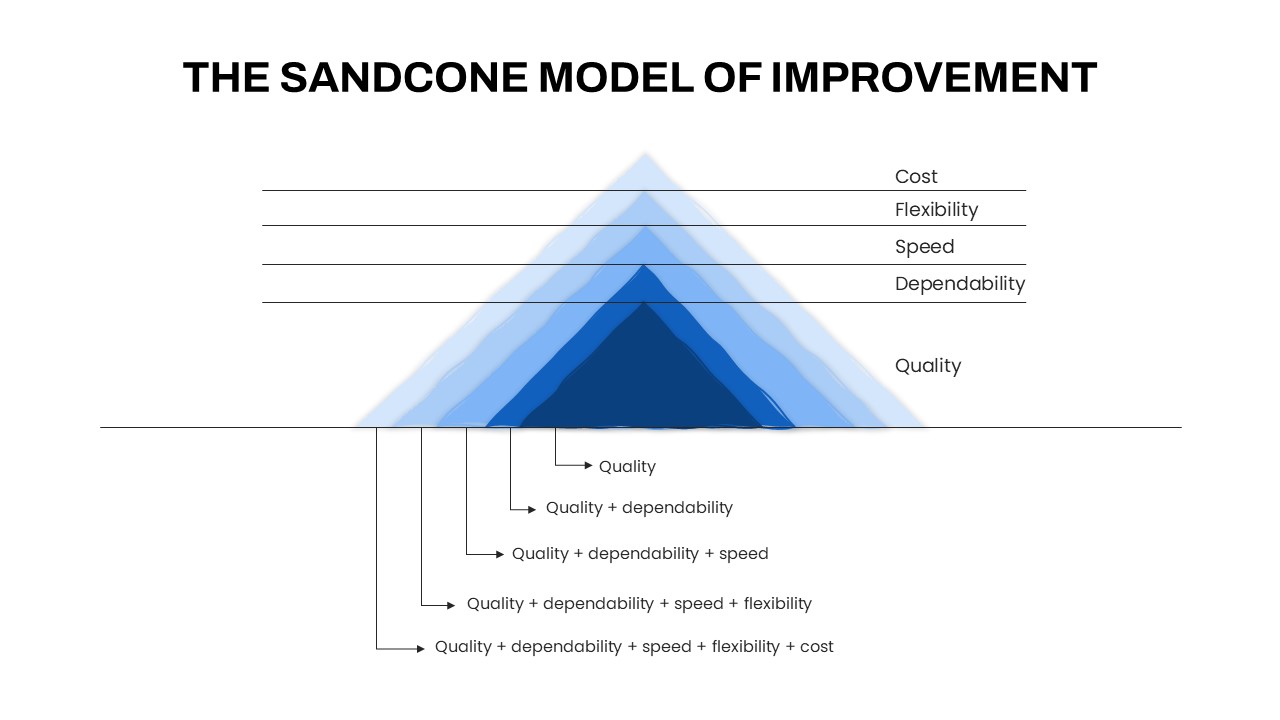
Sandcone Model of Improvement Diagram Template for PowerPoint & Google Slides
Pyramid
Seeds Growth Cycle Business Model Template for PowerPoint & Google Slides
Process
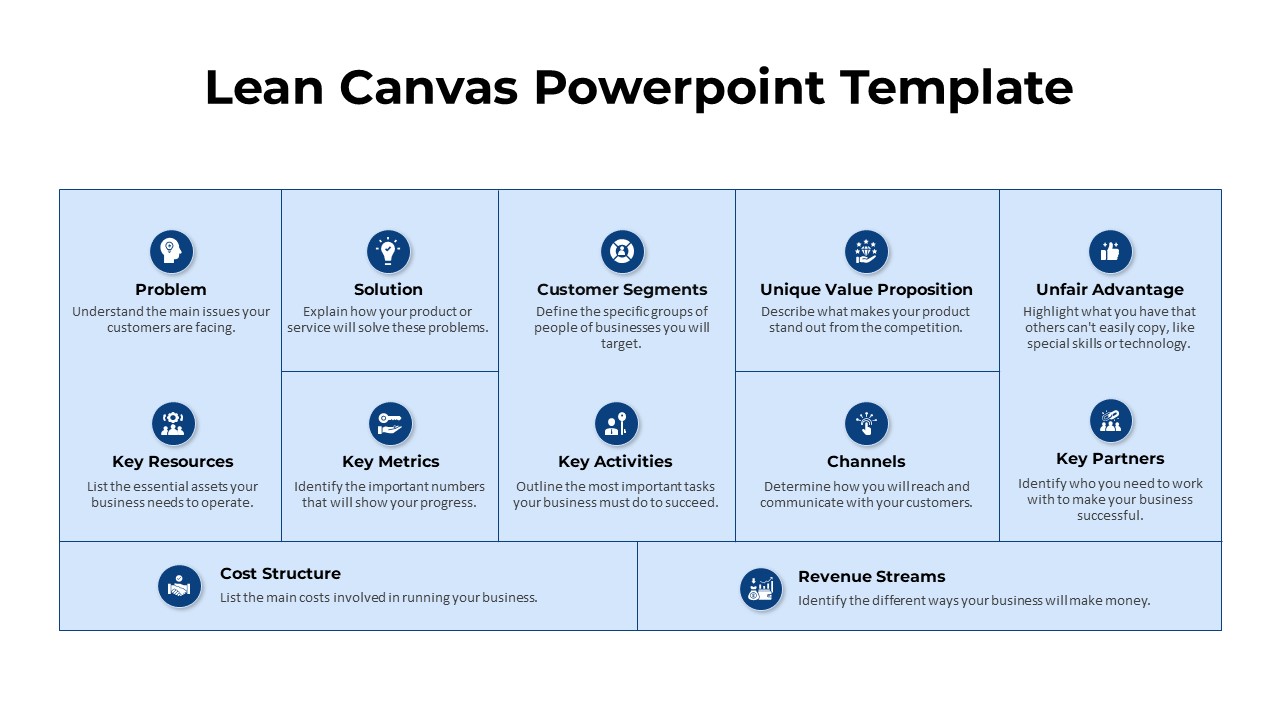
Strategic Lean Canvas Business Model Template for PowerPoint & Google Slides
Business Models
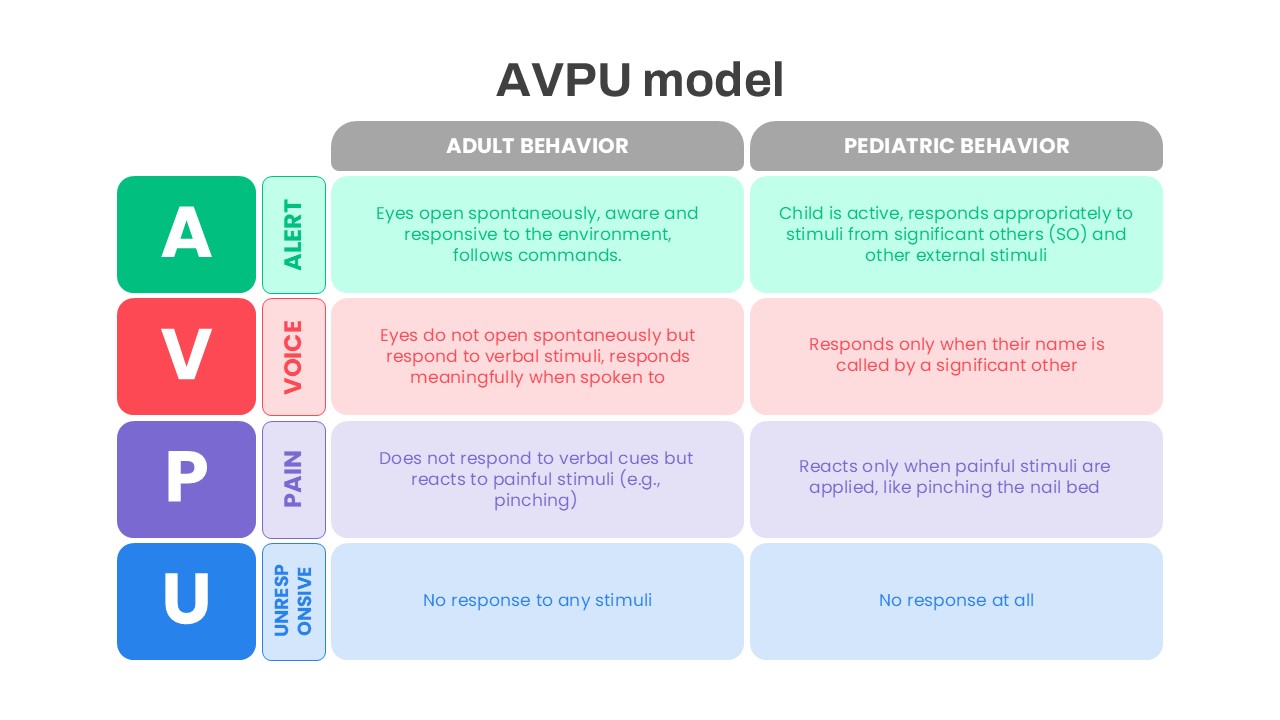
AVPU Model Behavior Assessment Template for PowerPoint & Google Slides
Health
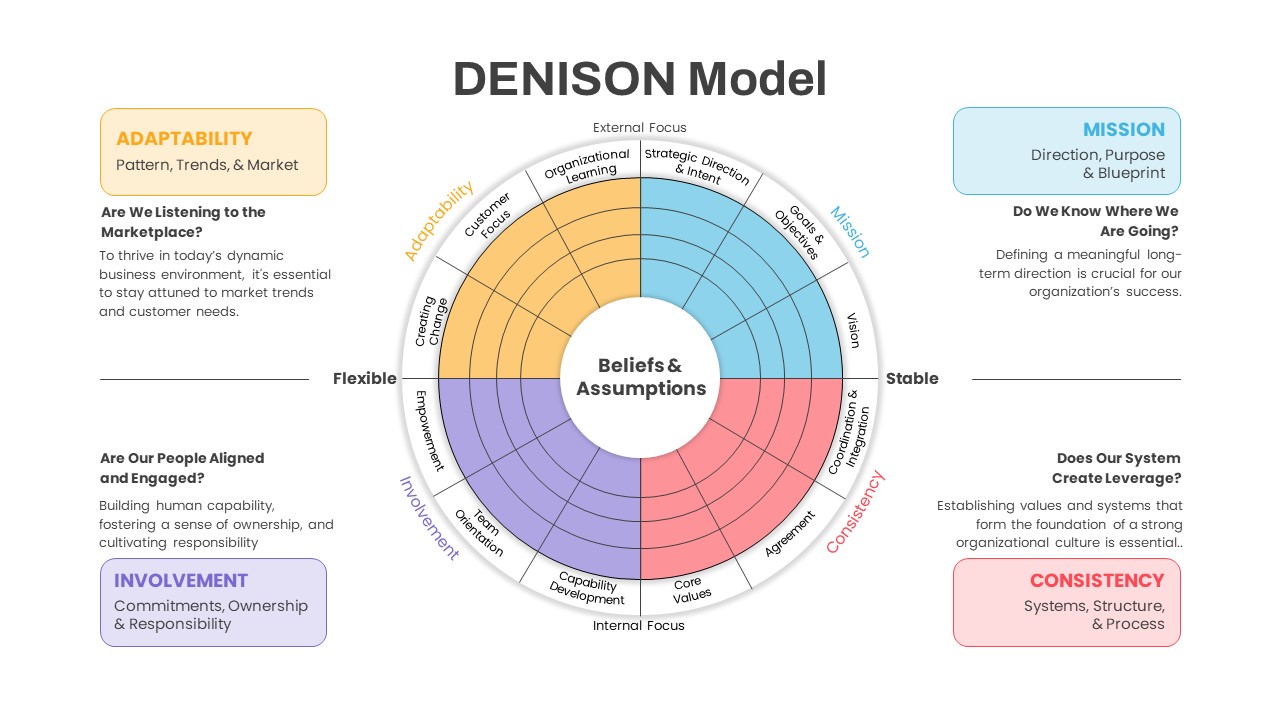
Denison Culture Model Wheel template for PowerPoint & Google Slides
Leadership
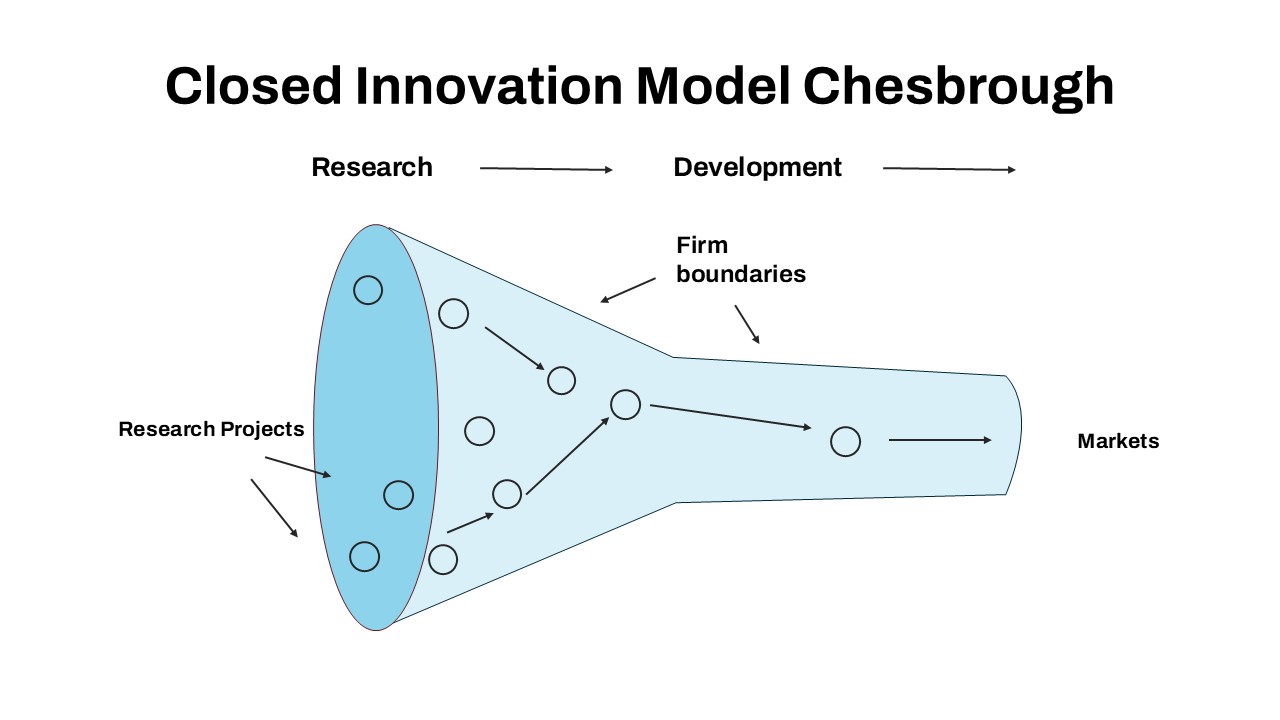
Closed Innovation Model Funnel Diagram Template for PowerPoint & Google Slides
Funnel
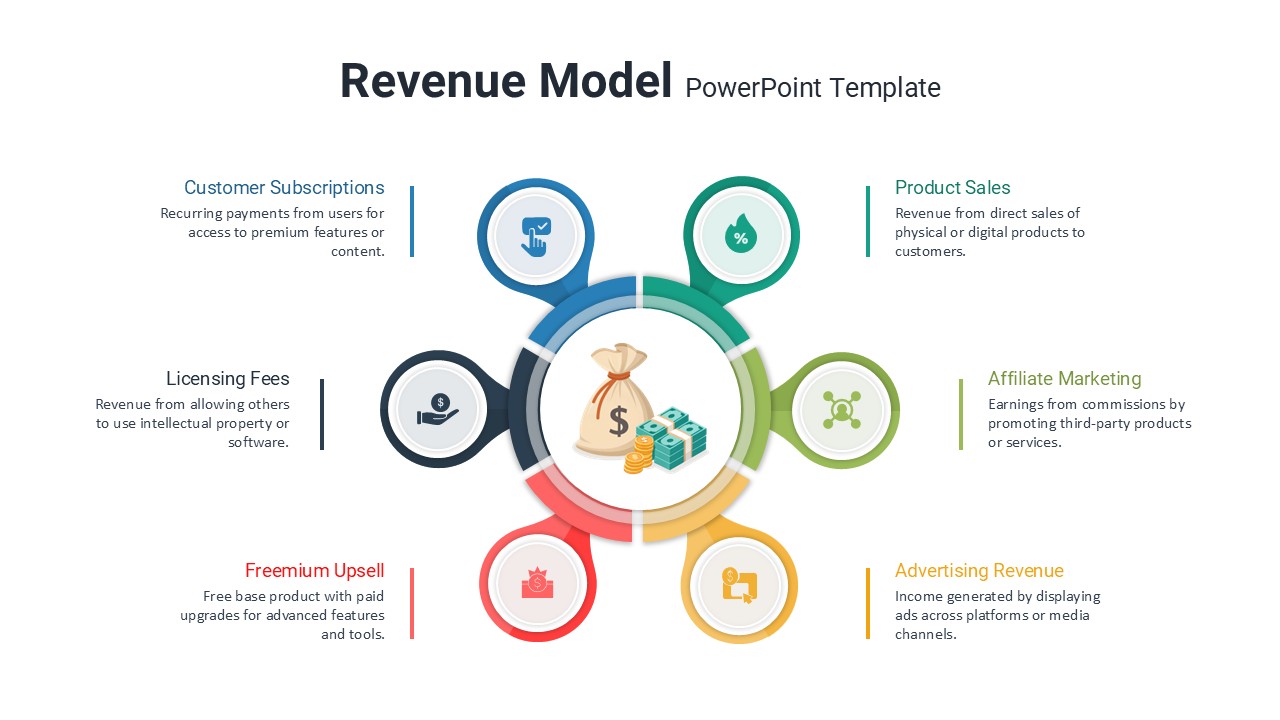
Six Revenue Stream Model Infographic Template for PowerPoint & Google Slides
Circular
Comprehensive Data & AI Capability Model Template for PowerPoint & Google Slides
AI
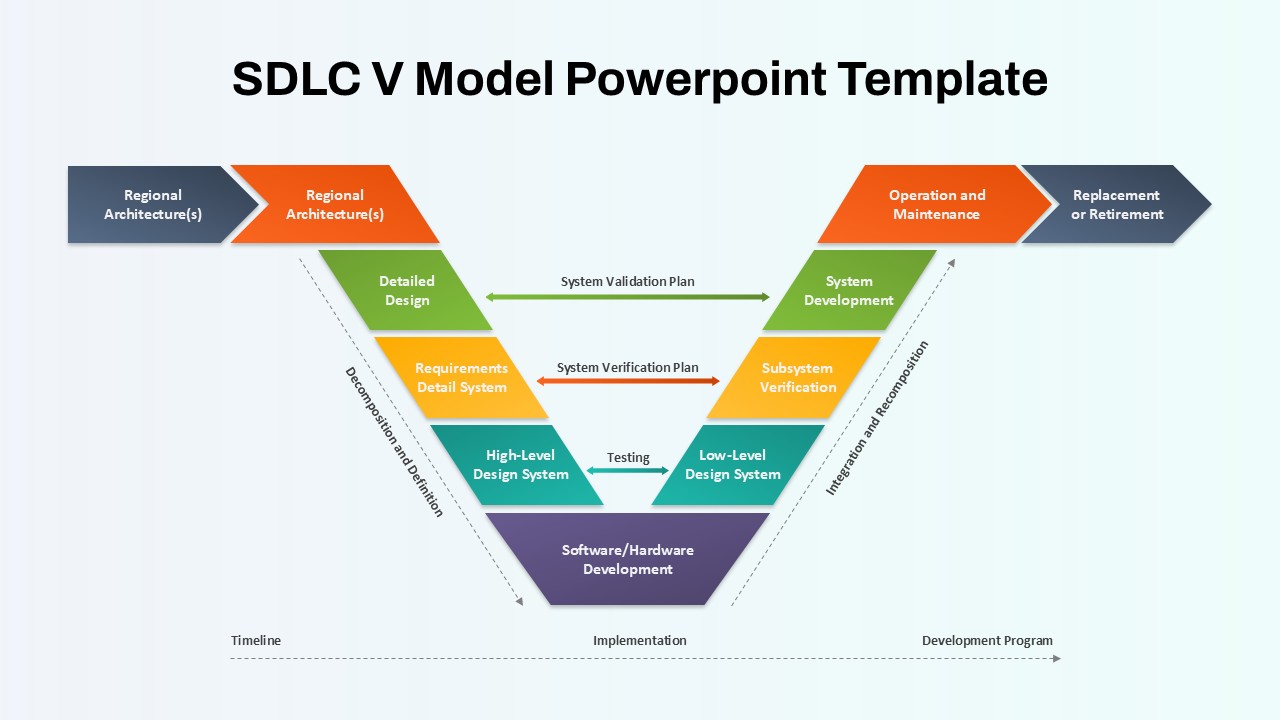
SDLC V Model Lifecycle Diagram Template for PowerPoint & Google Slides
Process
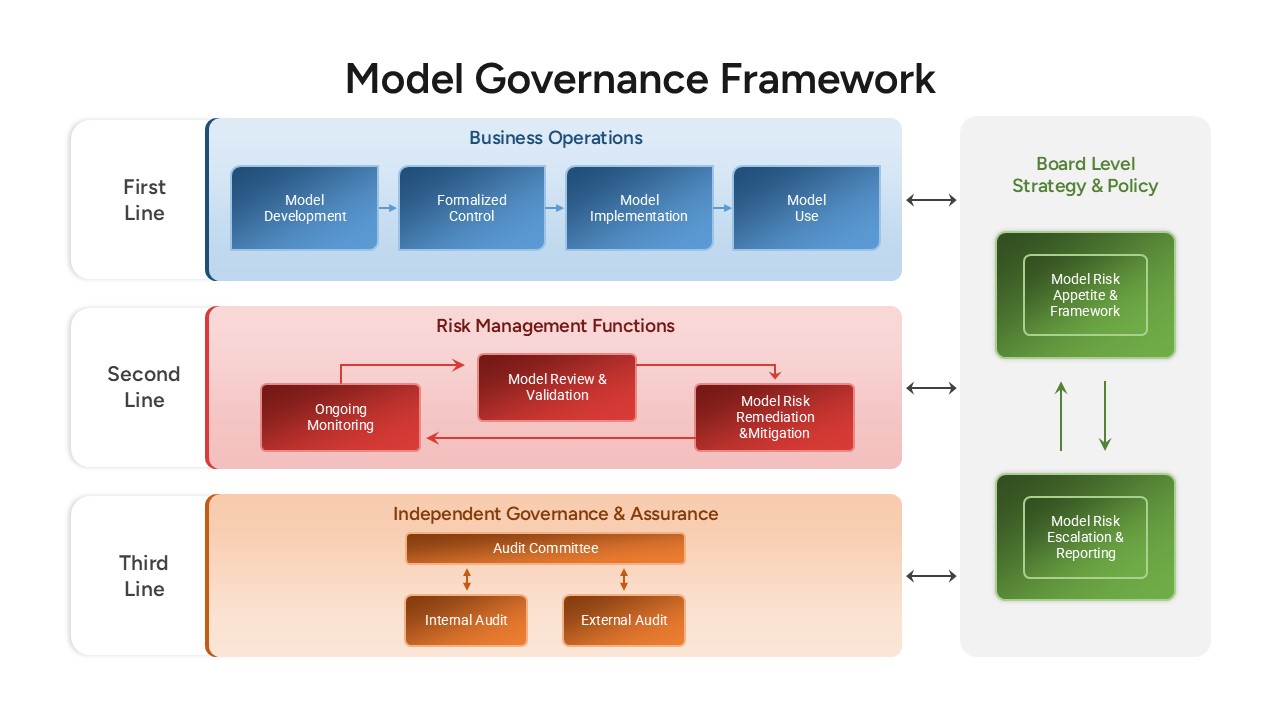
Model Governance Framework Template for PowerPoint & Google Slides
Risk Management
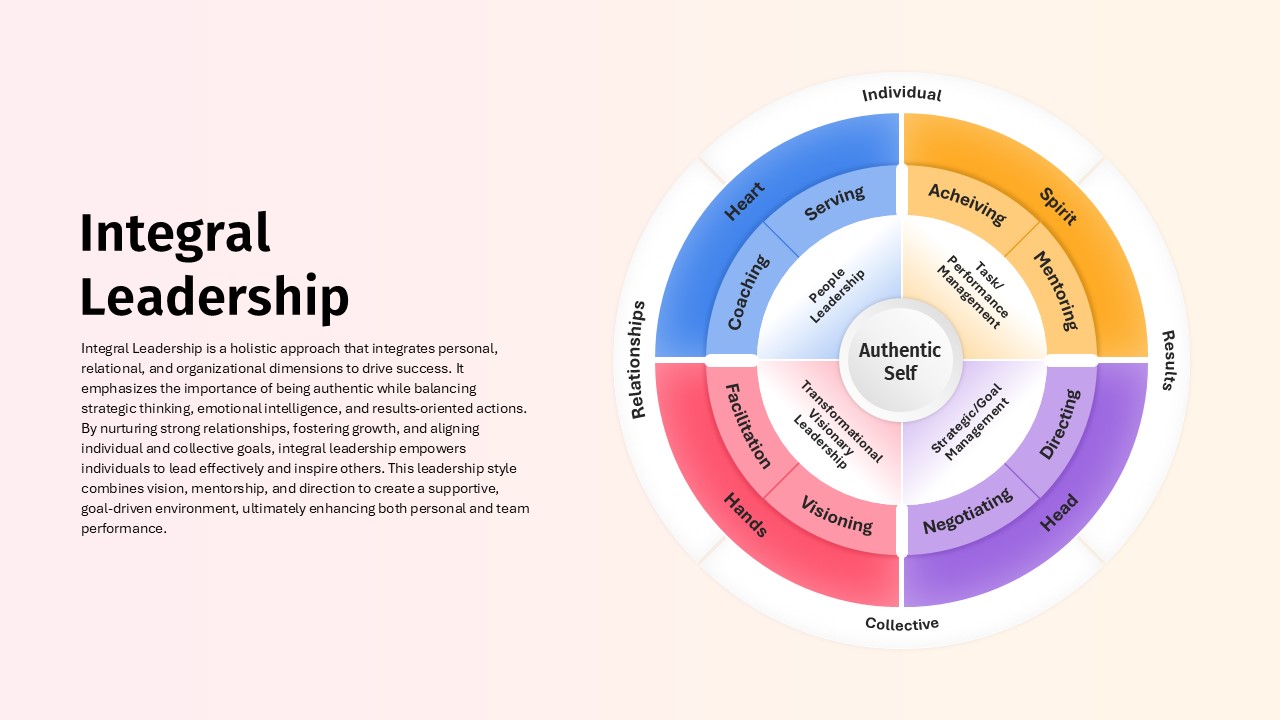
Integral Leadership Model Overview template for PowerPoint & Google Slides
Leadership
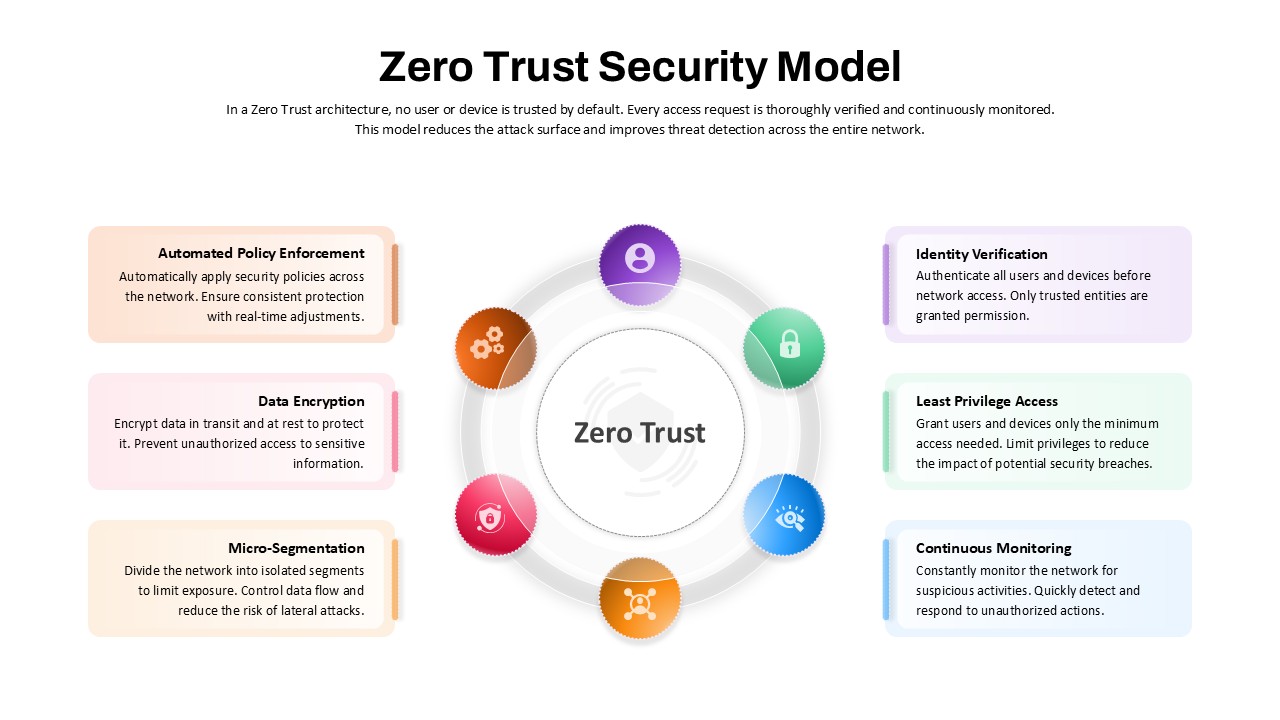
Zero Trust Security Model Overview template for PowerPoint & Google Slides
Risk Management
Leadership Pipeline Model Overview template for PowerPoint & Google Slides
Leadership
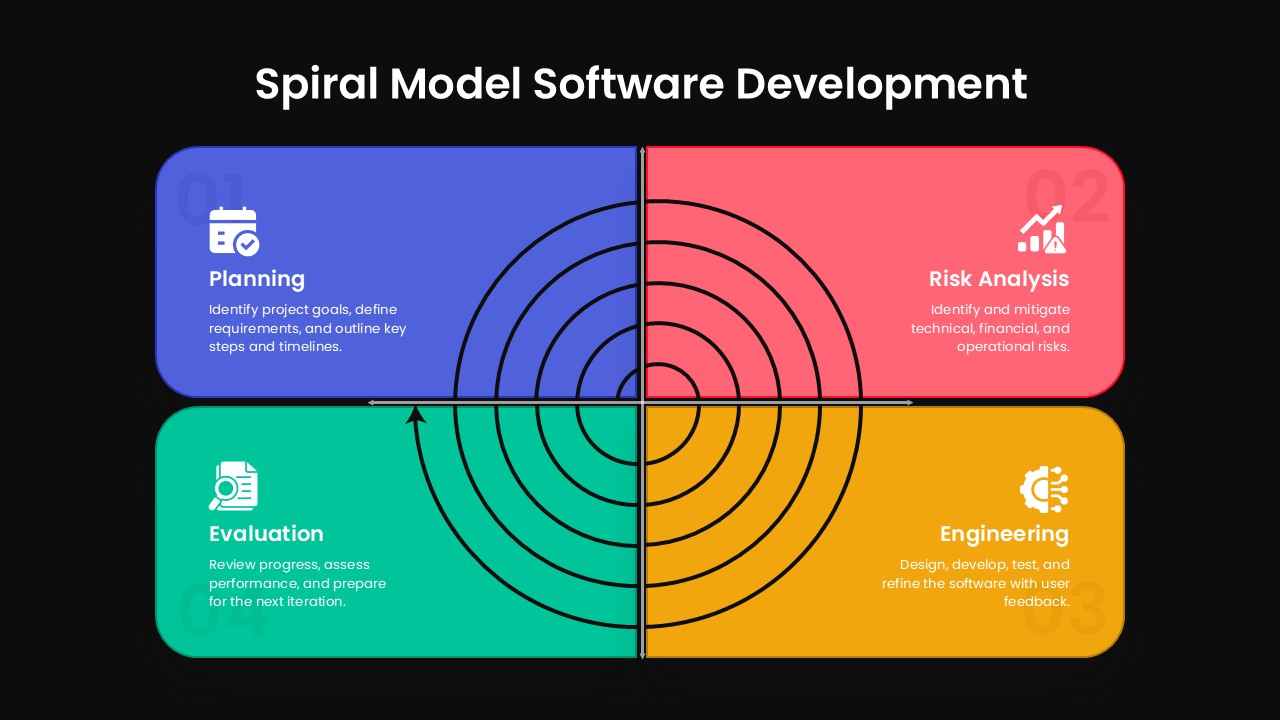
Spiral Model Software Development Template for PowerPoint & Google Slides
Process
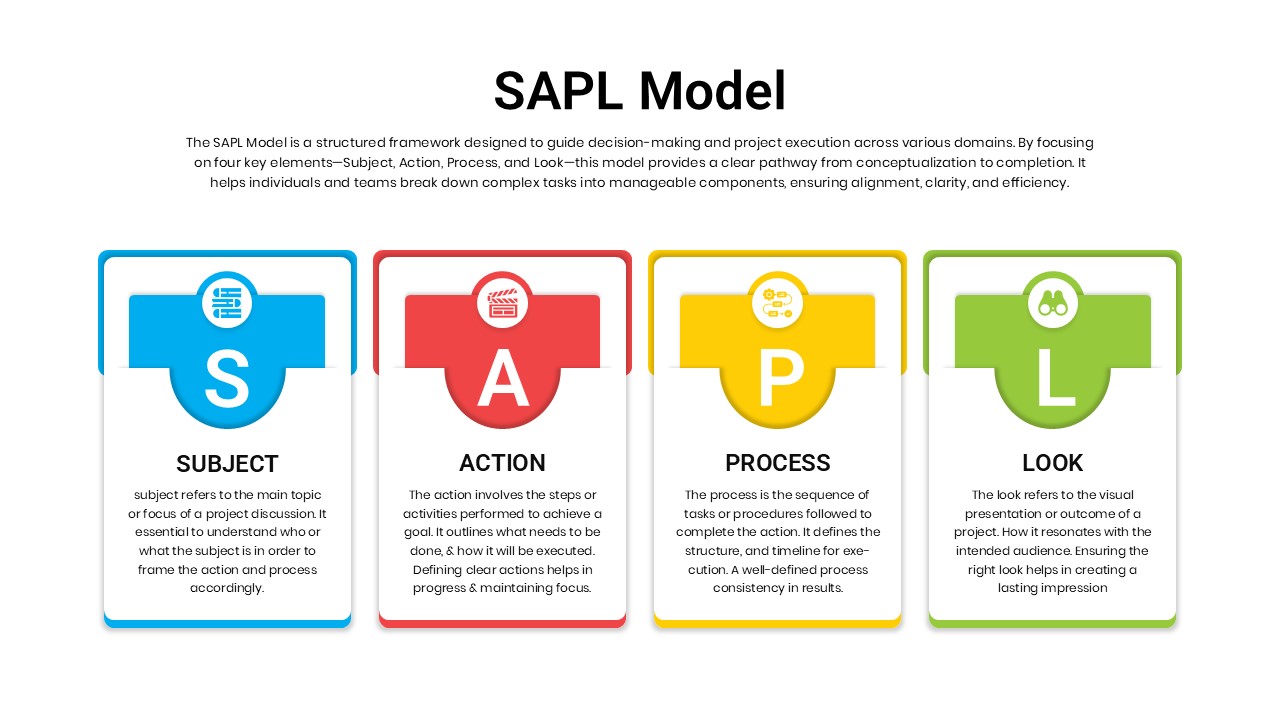
SAPL Model Framework template for PowerPoint & Google Slides
Business
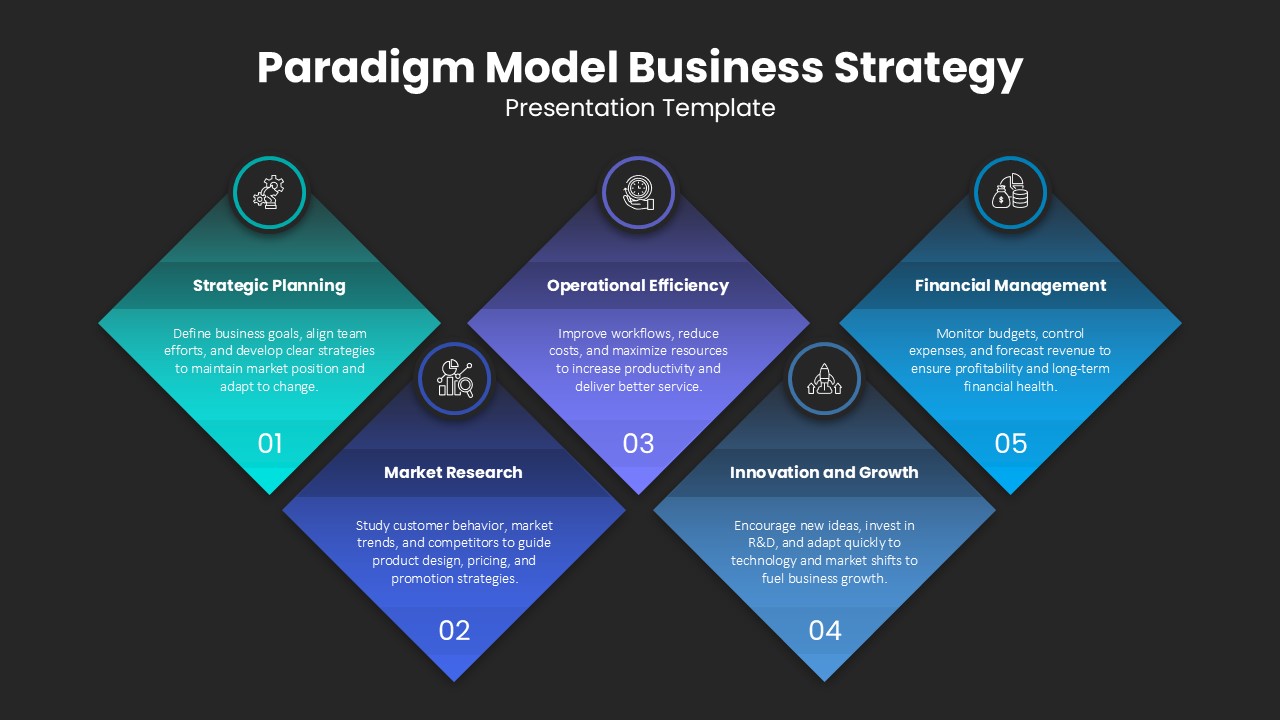
Paradigm Model Business Strategy Template for PowerPoint & Google Slides
Business Strategy
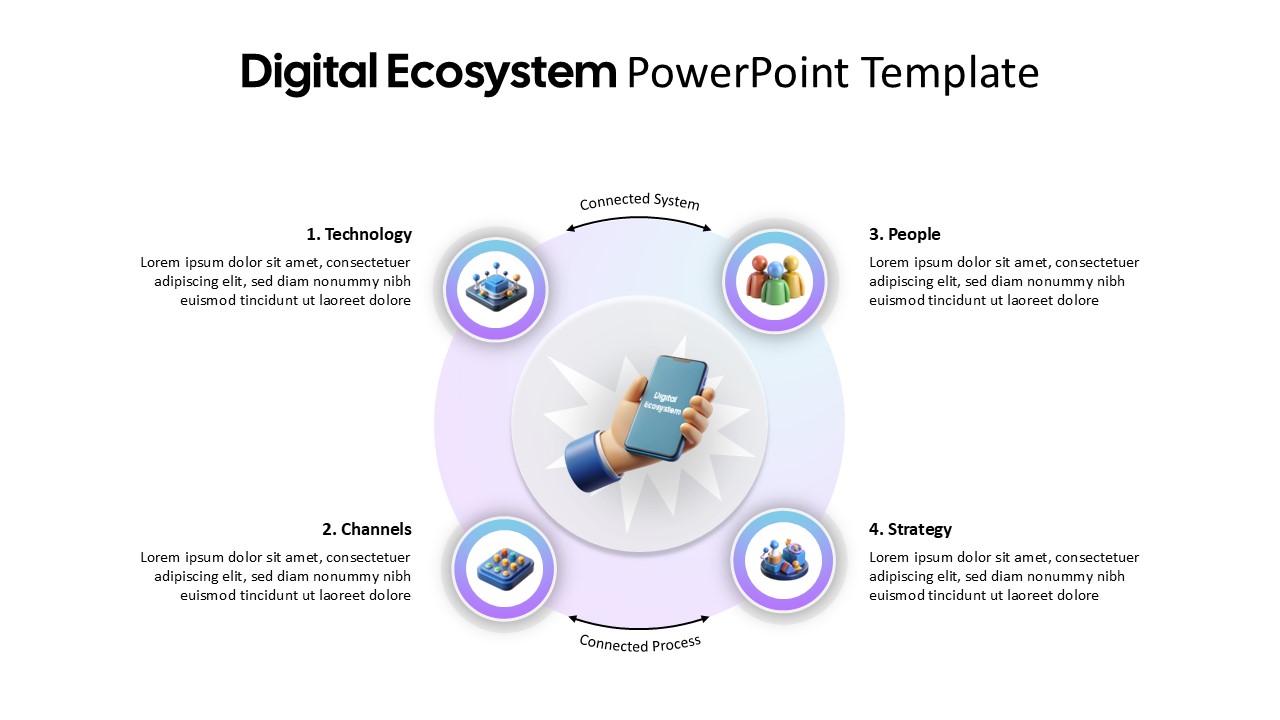
Digital Ecosystem Circular Model Template for PowerPoint & Google Slides
Information Technology
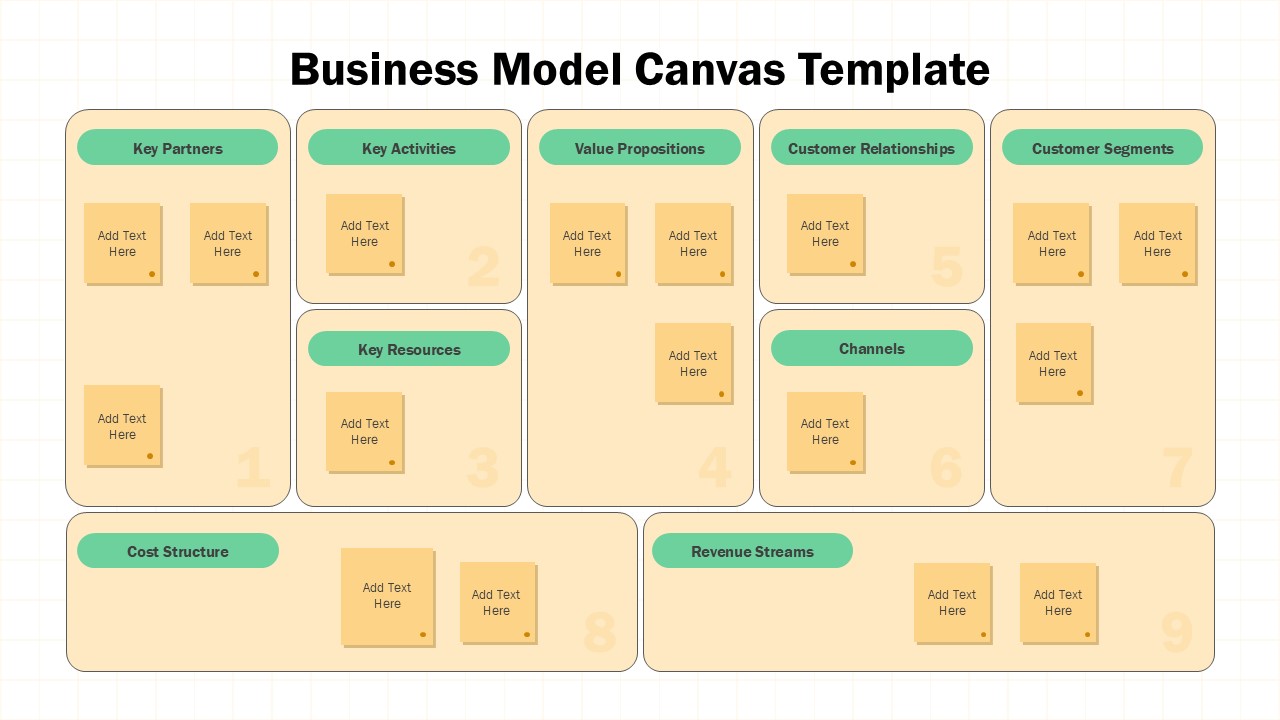
Business Model Canvas Sticky Notes Template for PowerPoint & Google Slides
Business Models
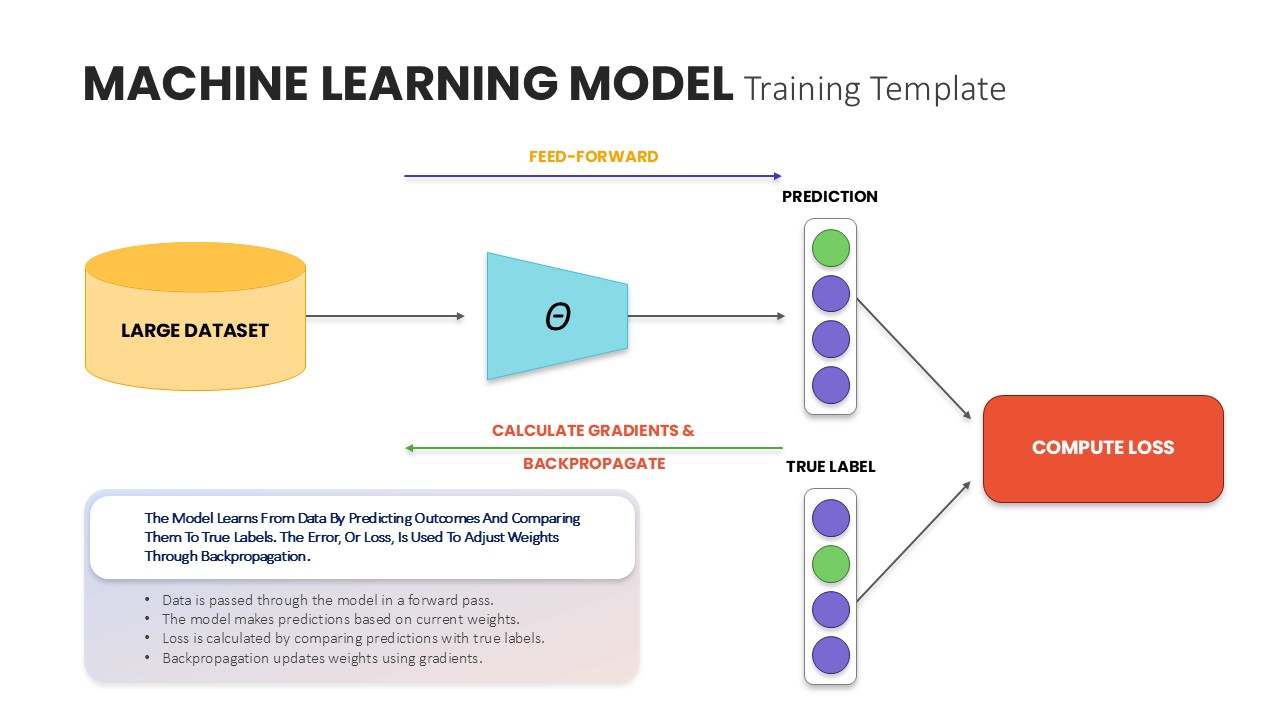
Machine Learning Model Training Template for PowerPoint & Google Slides
Machine Learning
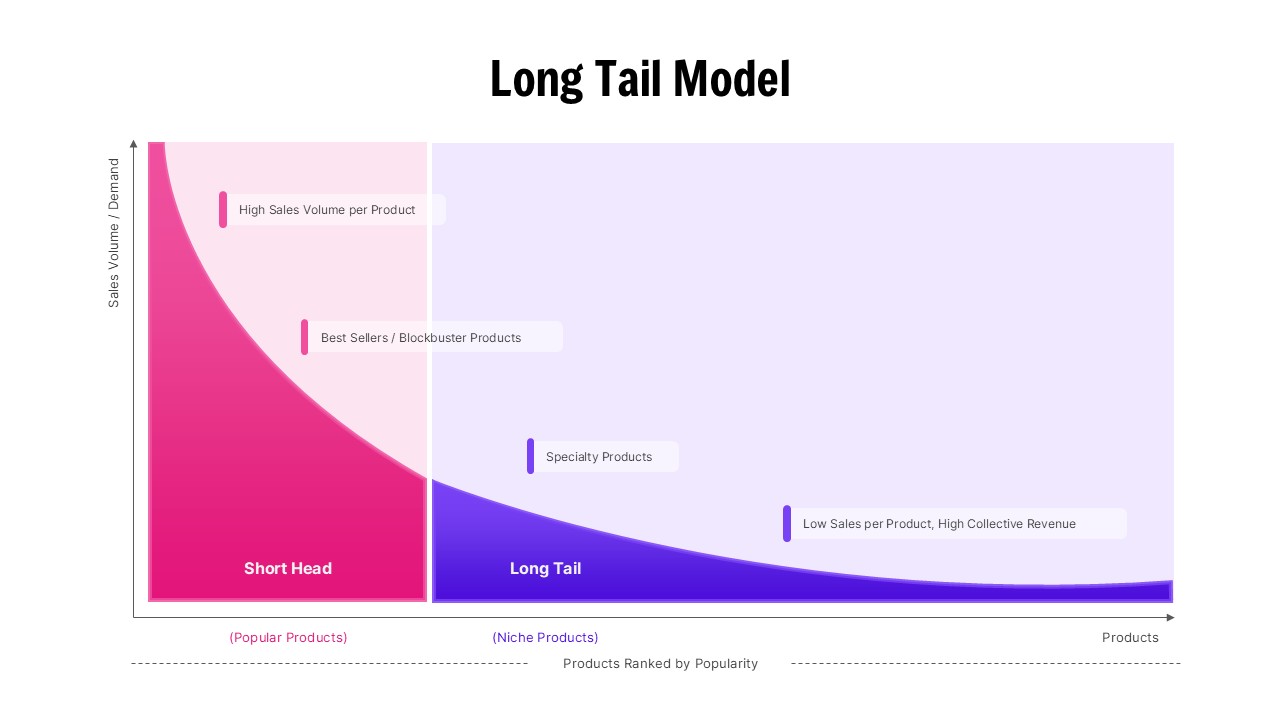
Long Tail Model Business Strategy Diagram Template for PowerPoint & Google Slides
Business
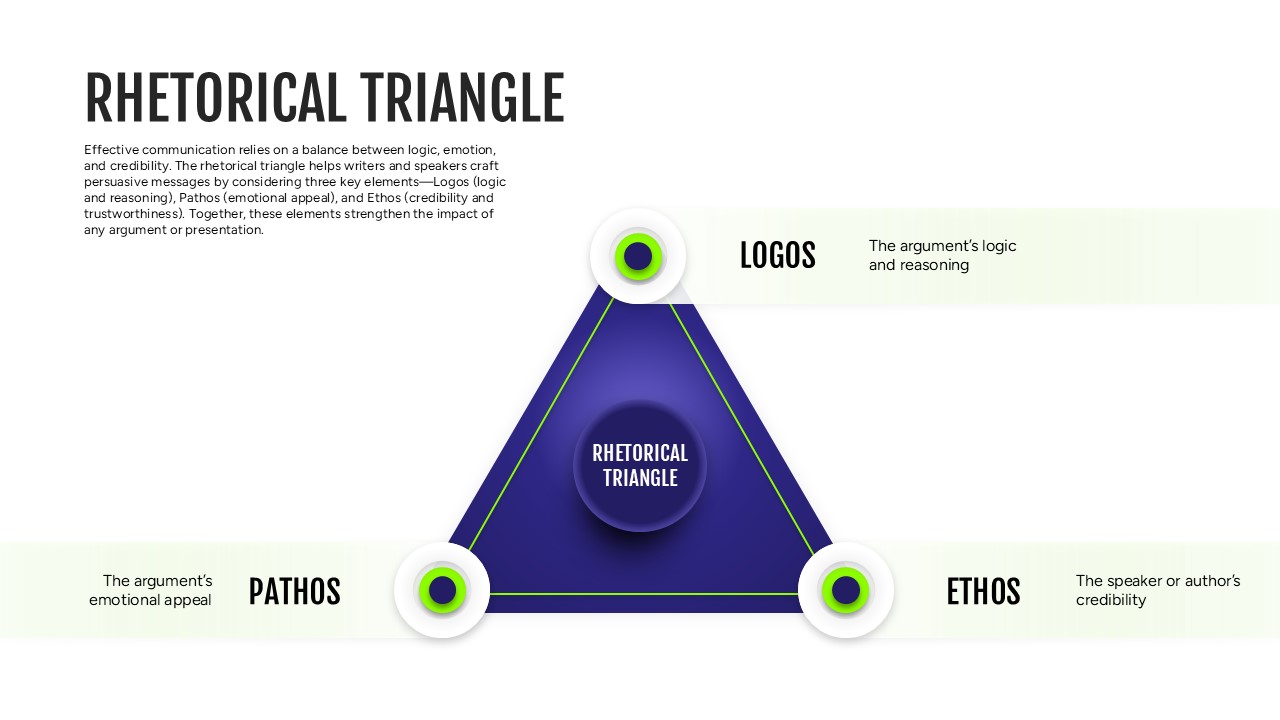
Rhetorical Triangle Model Diagram Template for PowerPoint & Google Slides
Leadership