Energy Comparison Template for PowerPoint & Google Slides
Description
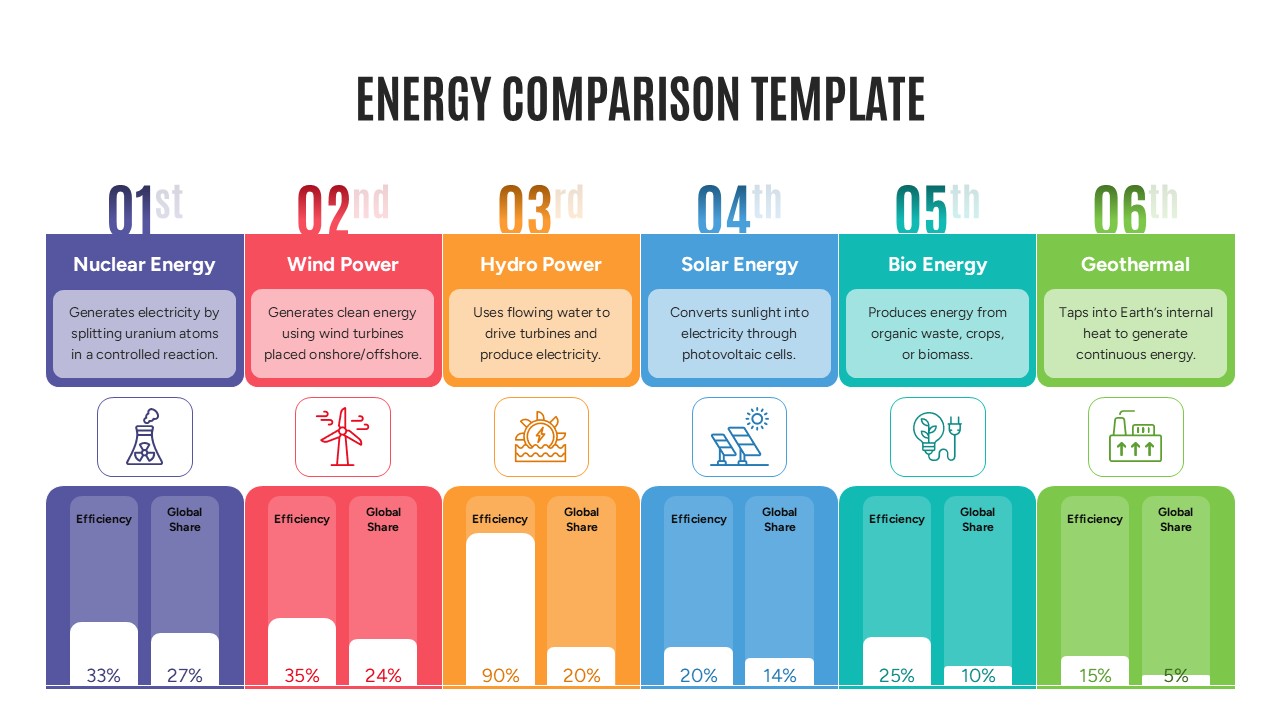
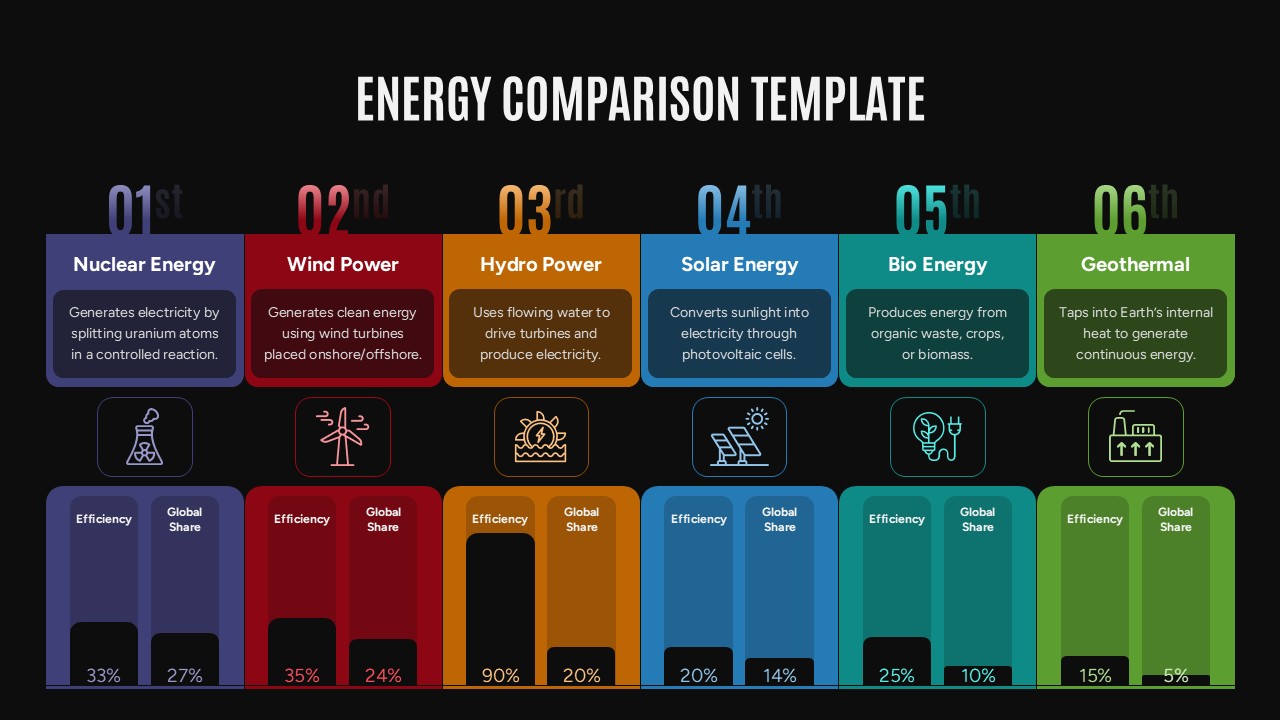
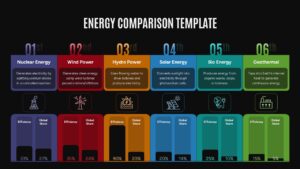
This energy comparison infographic template provides a visually engaging way to showcase different types of energy sources and their relative performance metrics. The slide presents six major energy types—Nuclear, Wind, Hydro, Solar, Bio, and Geothermal—each highlighted with distinctive color-coded blocks for quick recognition. Every block contains a concise definition, an intuitive icon, and bar-style data graphics illustrating efficiency and global share percentages.
The structured side-by-side format makes it easy for audiences to compare attributes across energy sources, such as nuclear power’s controlled uranium reactions, wind power’s clean turbine-based generation, hydropower’s use of flowing water, solar energy’s photovoltaic conversion, bioenergy’s organic waste utilization, and geothermal energy’s tapping of Earth’s heat. The clear labeling of efficiency and global share helps decision-makers quickly understand each source’s global impact and practical viability.
Designed with modern flat icons, bold typography, and clean layout, this slide works seamlessly in corporate, academic, and technical presentations. Its vibrant multi-color scheme not only makes comparisons easier but also enhances audience engagement. Since it is fully editable, users can adapt metrics, colors, and text to reflect updated statistics or focus areas. Optimized for both PowerPoint and Google Slides, the template ensures clarity on different devices and presentation environments.
Who is it for
This comparison slide is ideal for sustainability consultants, educators, researchers, and energy policy professionals. Corporate leaders and investors evaluating renewable energy opportunities can also use it to present data-driven insights.
Other Uses
Apart from energy industry presentations, this slide can be adapted for classroom lessons on sustainability, climate change debates, corporate ESG reports, renewable energy investment pitches, or government policy workshops. It can also serve as a visual summary for scientific reports or training modules.
Login to download this file

Item ID
SB05533Designed By
Geethu
Related Templates

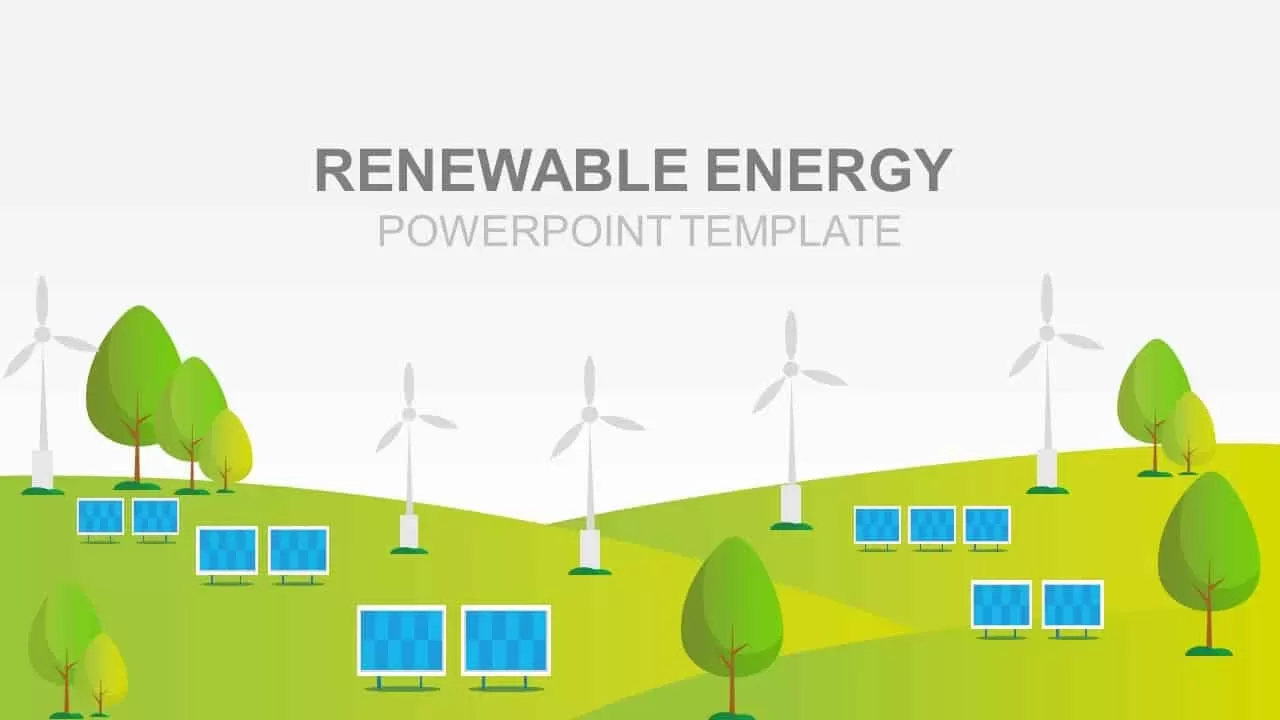
Renewable Energy PowerPoint Template for PowerPoint & Google Slides
Graphics
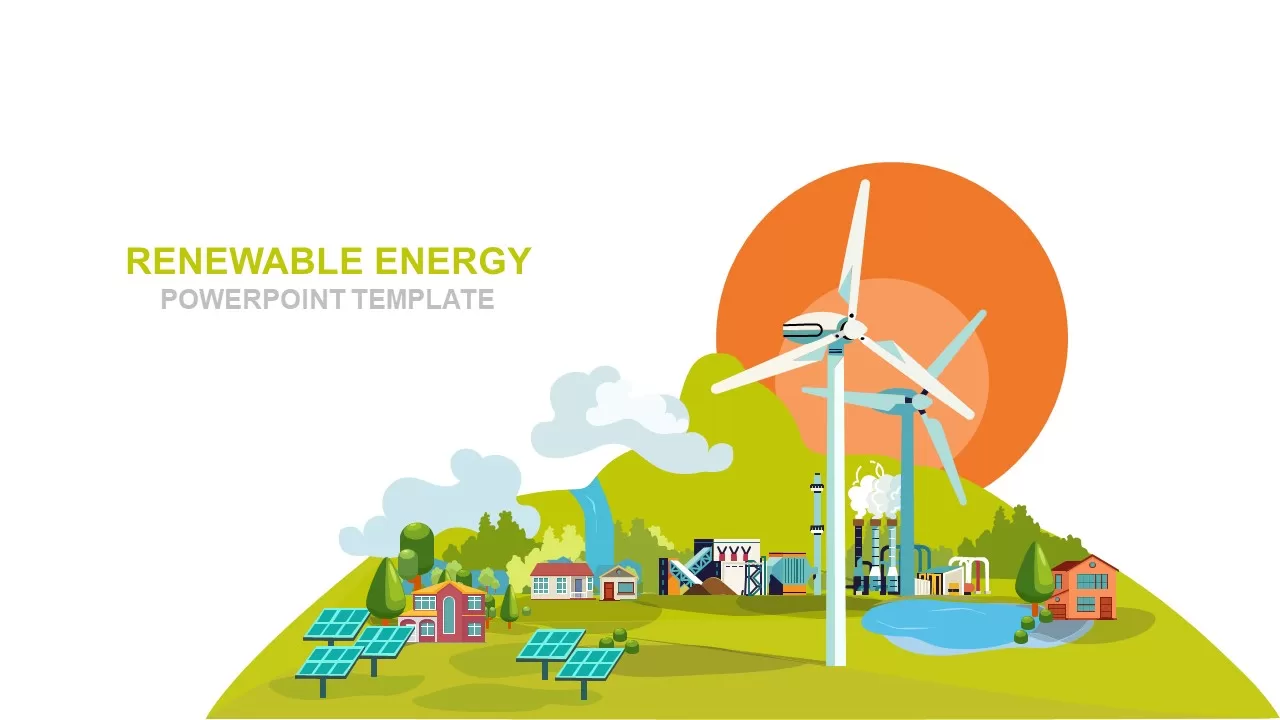
Renewable Energy Landscape Illustration Template for PowerPoint & Google Slides
Graphics
Clean Renewable Energy Wind Turbine Template for PowerPoint & Google Slides
Pitch Deck
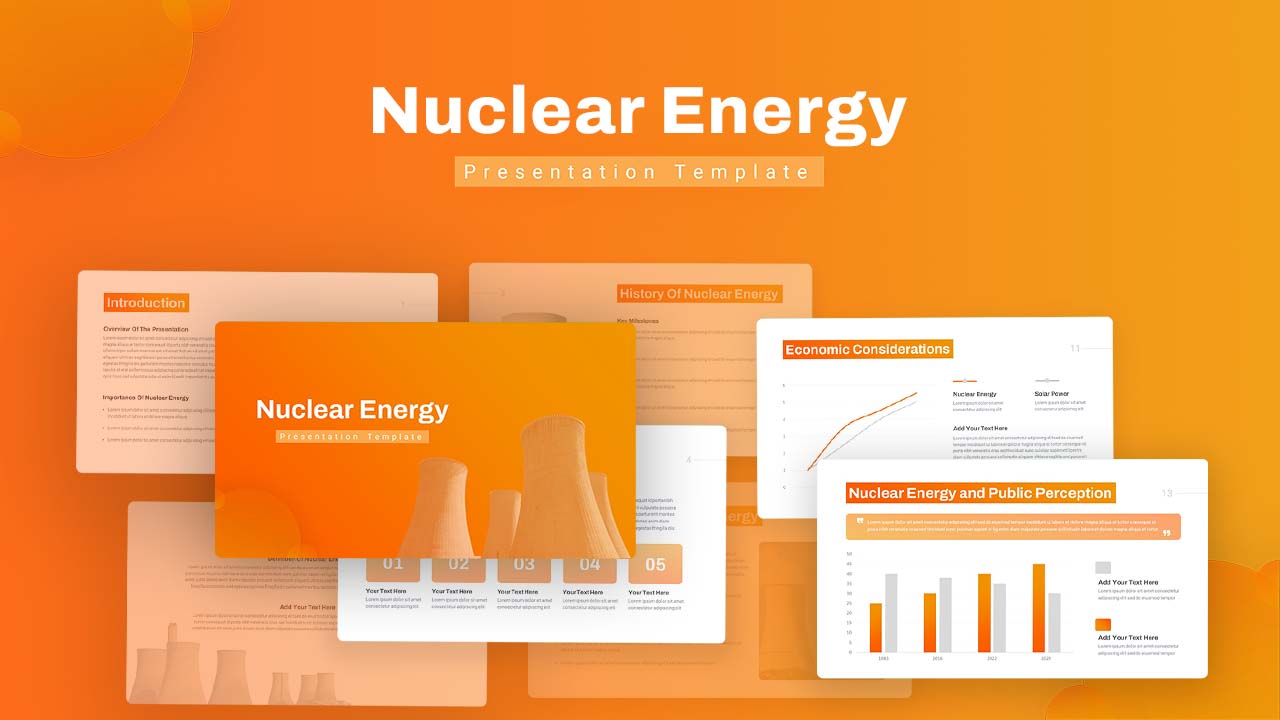
Nuclear Energy Presentation Deck Template for PowerPoint & Google Slides
Pitch Deck
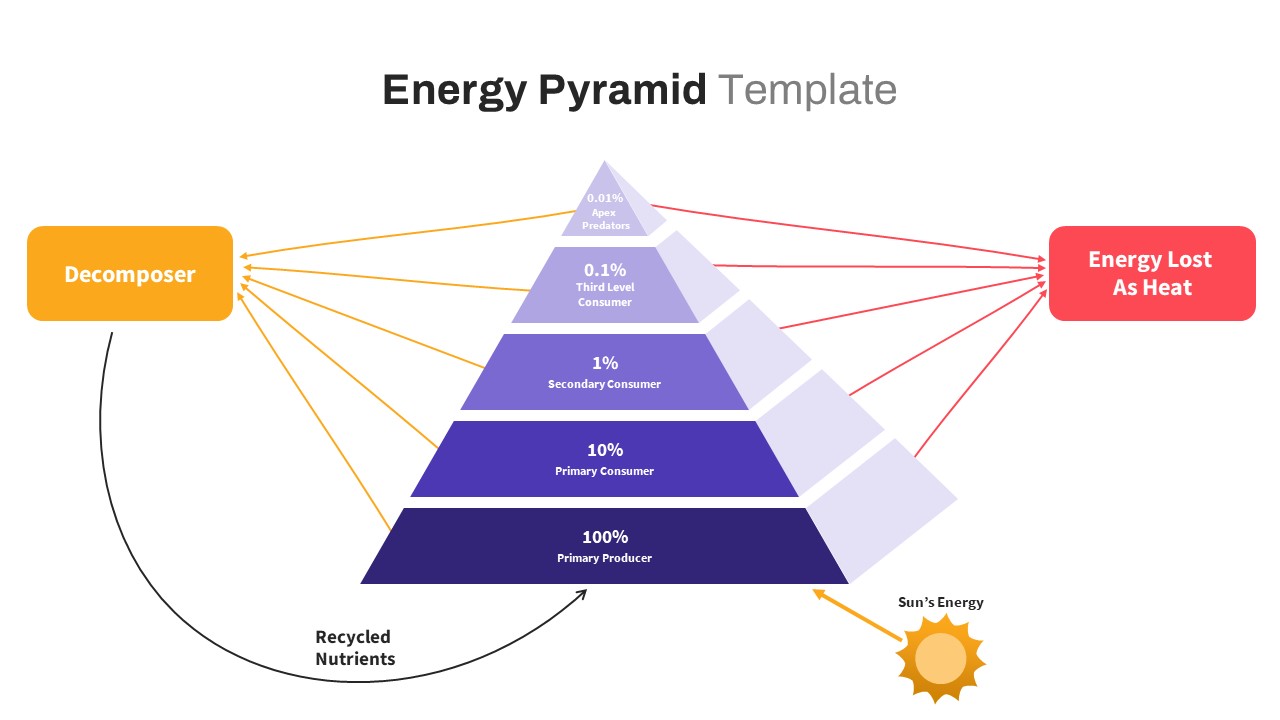
Free Ecological Energy Flow Pyramid Template for PowerPoint & Google Slides
Pyramid
Free
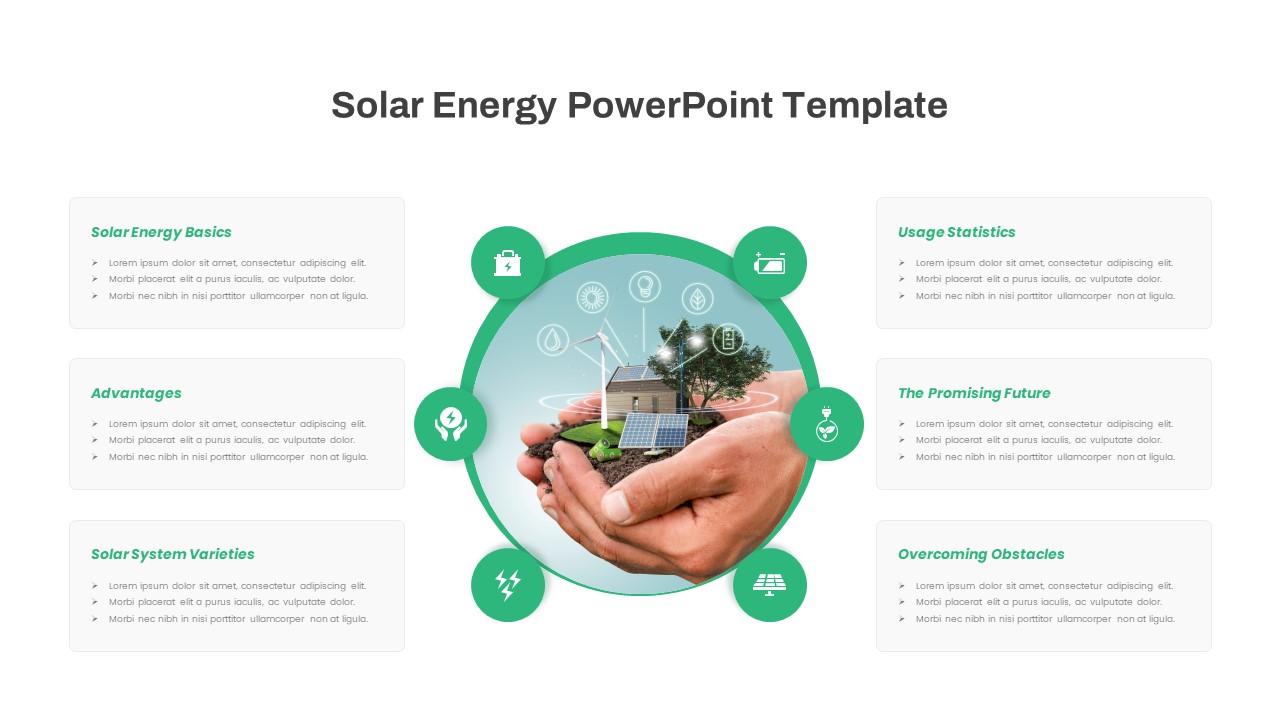
Free Solar Energy Infographic Slide Template for PowerPoint & Google Slides
Circular
Free
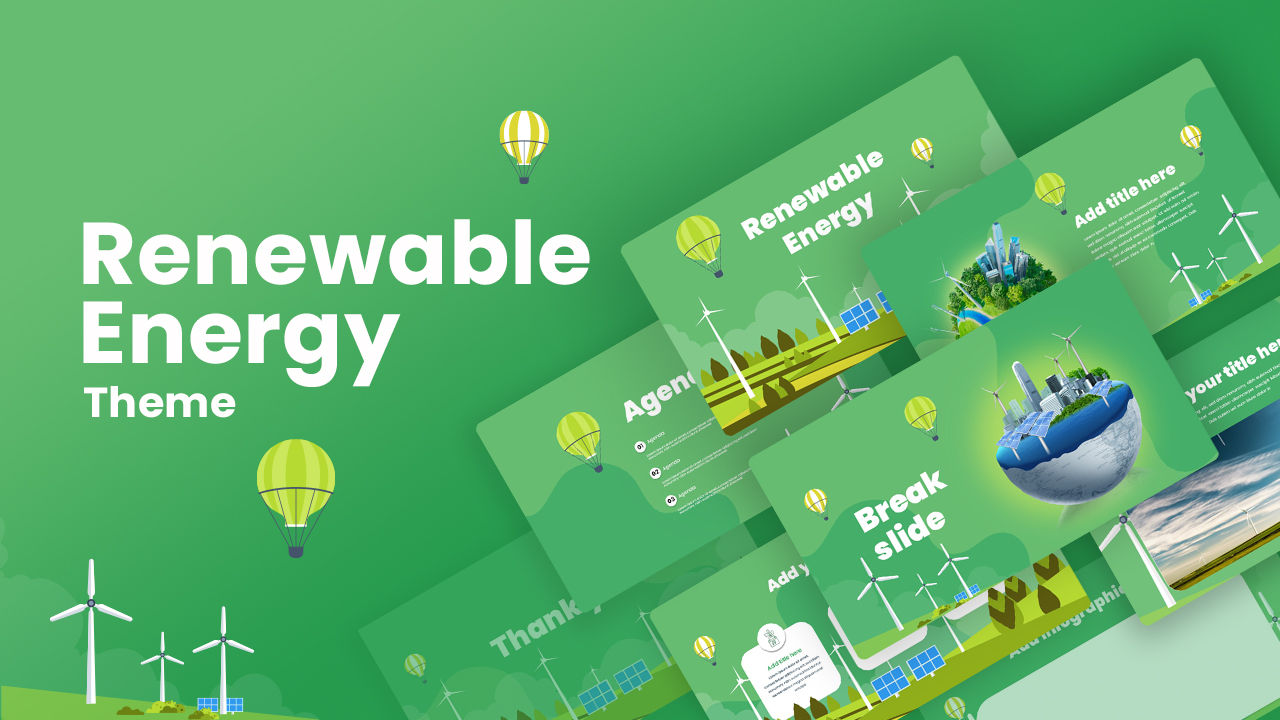
Renewable Energy Presentation Theme Template for PowerPoint & Google Slides
Pitch Deck

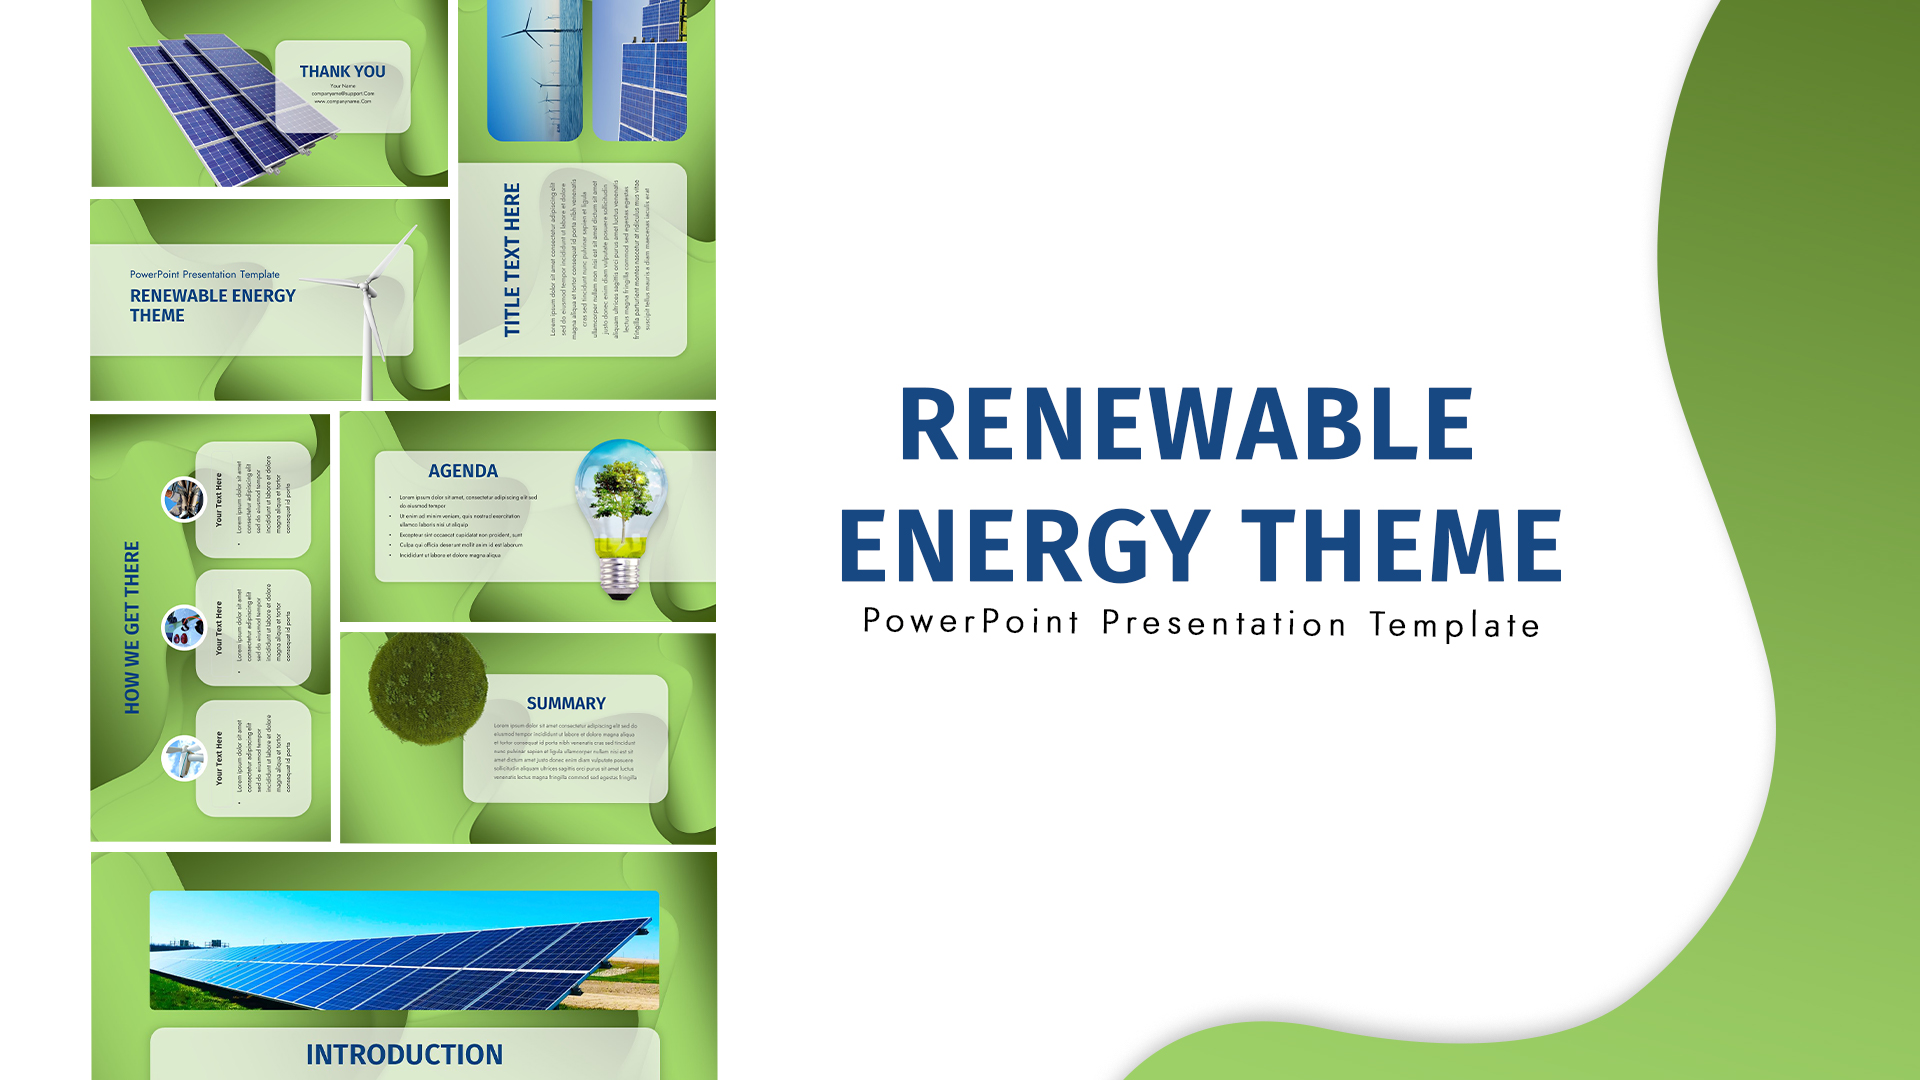
Renewable Energy Theme Template for PowerPoint & Google Slides
Company Profile
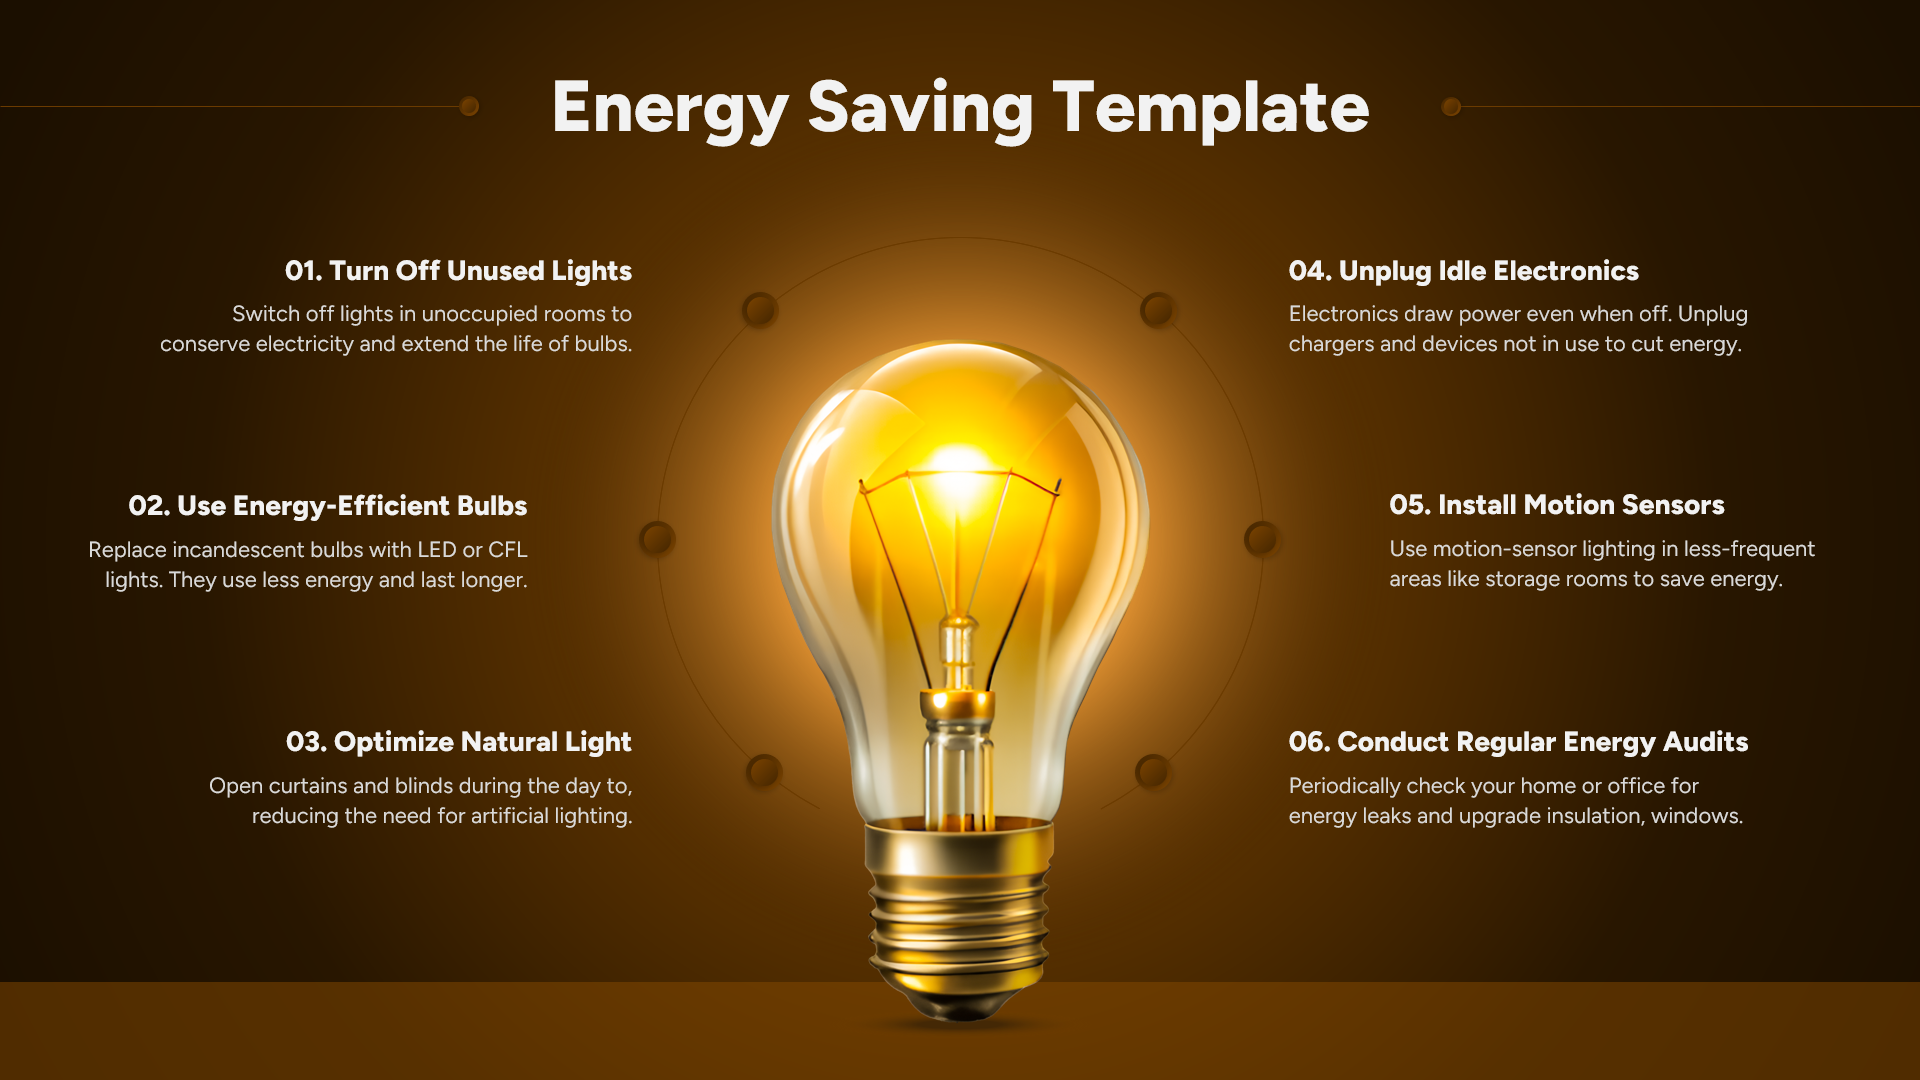
Energy Saving Tips Presentation Template for PowerPoint & Google Slides
Business Strategy
Service Zoom Feature Slides Comparison template for PowerPoint & Google Slides
Process
Simple Comparison Table Template for PowerPoint & Google Slides
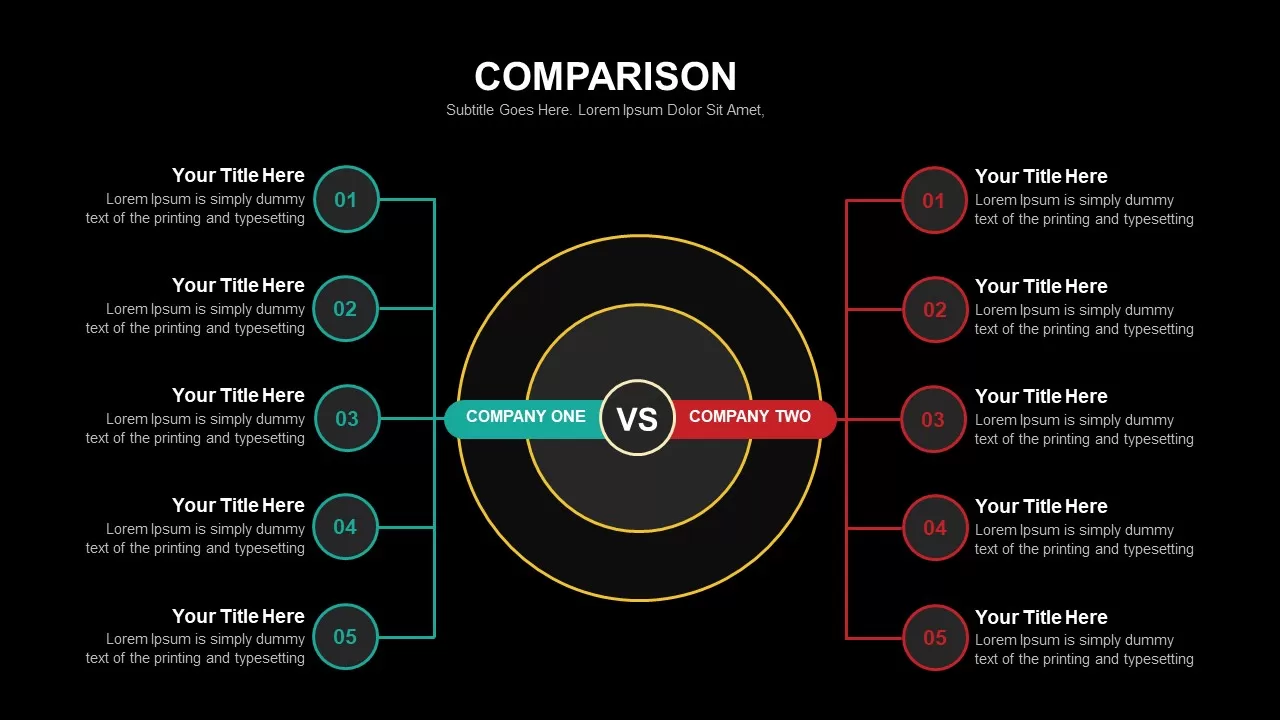
Comparison
Speedometer Infographic Gauge Comparison Template for PowerPoint & Google Slides
Comparison
Four Section Comparison Chart Diagram Template for PowerPoint & Google Slides
Infographics
3-Column Comparison template for PowerPoint & Google Slides
Comparison

Clean Mobile Service Comparison Slide Template for PowerPoint & Google Slides
Comparison

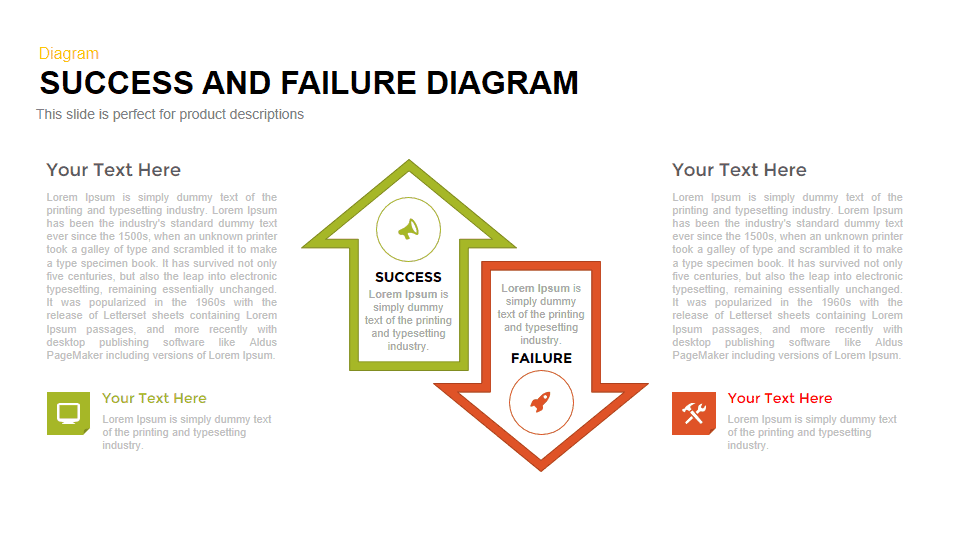
Success vs Failure Comparison Diagram Template for PowerPoint & Google Slides
Comparison
Scale Metaphor Metrics Comparison Template for PowerPoint & Google Slides
Charts
Dual Percentage Comparison Metaphor Template for PowerPoint & Google Slides
Comparison
Interactive Product Comparison Bar Chart Template for PowerPoint & Google Slides
Bar/Column
Comparison Chart Overview template for PowerPoint & Google Slides
Comparison Chart
Dynamic Multicolor Comparison Table Template for PowerPoint & Google Slides
Comparison

Comparison Pricing Table Infographic Template for PowerPoint & Google Slides
Comparison Chart
Tornado Chart Data Comparison Slide Template for PowerPoint & Google Slides
Bar/Column
Five-Option Text Boxes Table Comparison Template for PowerPoint & Google Slides
Business Report
Radar Chart Product Comparison Template for PowerPoint & Google Slides
Comparison Chart
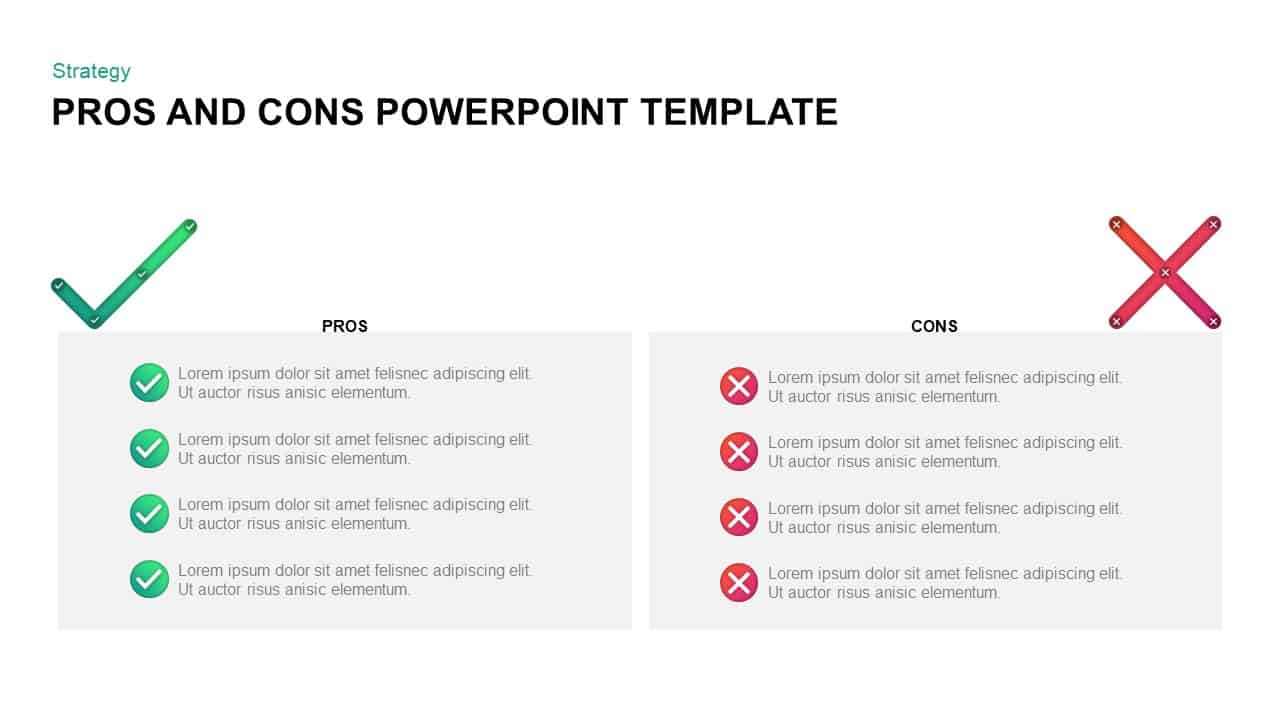
Pros and Cons Comparison Slide Template for PowerPoint & Google Slides
Comparison
Seller Portals Comparison Infographic Template for PowerPoint & Google Slides
Process
Fact and Figures Comparison Slide Template for PowerPoint & Google Slides
Business Report
Four Business Structure Types Comparison Diagram Template for PowerPoint & Google Slides
Business Strategy
Generations Comparison Infographic Template for PowerPoint & Google Slides
Timeline
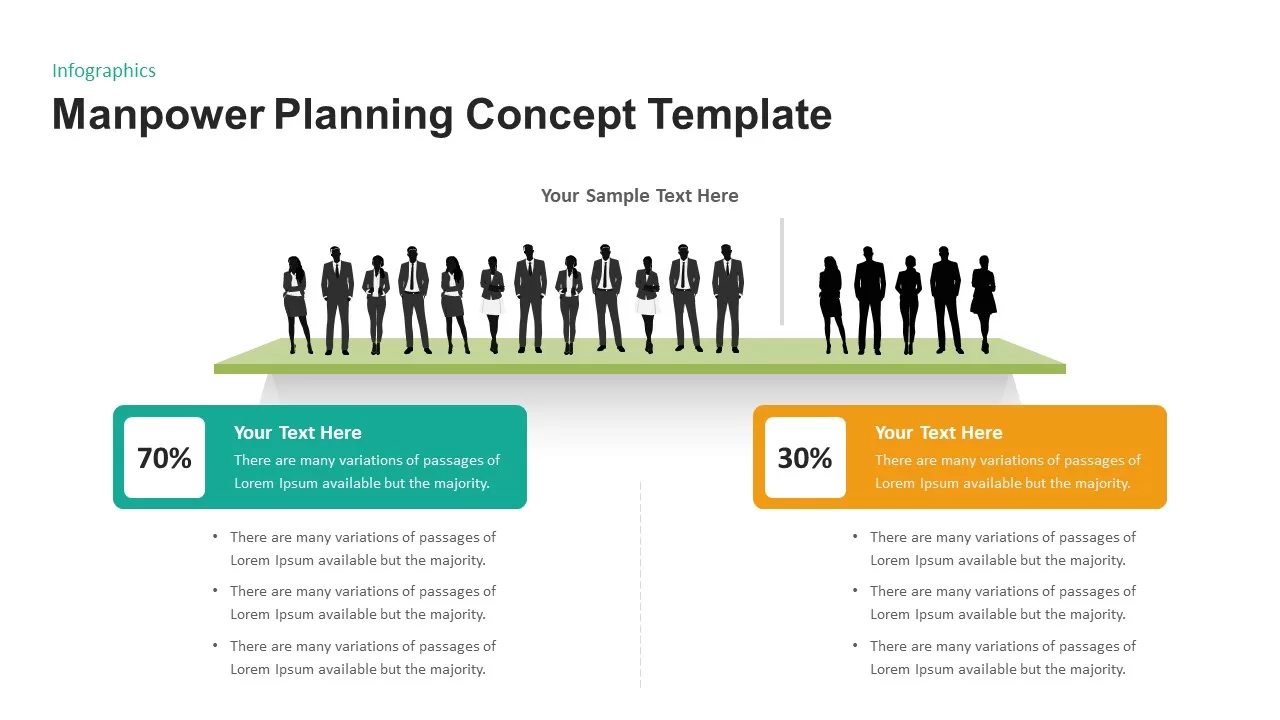
Manpower Planning Concept Comparison Template for PowerPoint & Google Slides
Comparison Chart
RAG Status Infographic Comparison Template for PowerPoint & Google Slides
Project
Theory X and Theory Y Comparison Template for PowerPoint & Google Slides
Comparison
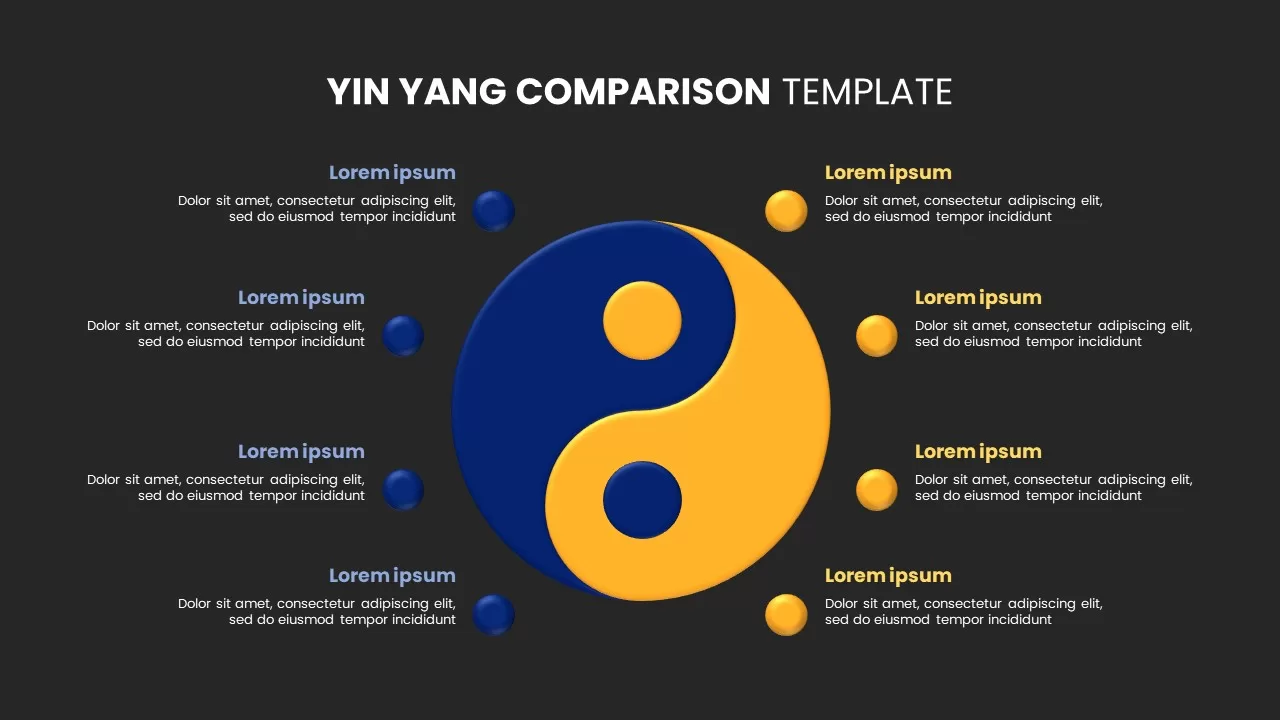
Yin Yang Comparison template for PowerPoint & Google Slides
Business
Comparison Infographic Overview template for PowerPoint & Google Slides
Business
Pugh Matrix Decision Comparison Chart Template for PowerPoint & Google Slides
Comparison Chart
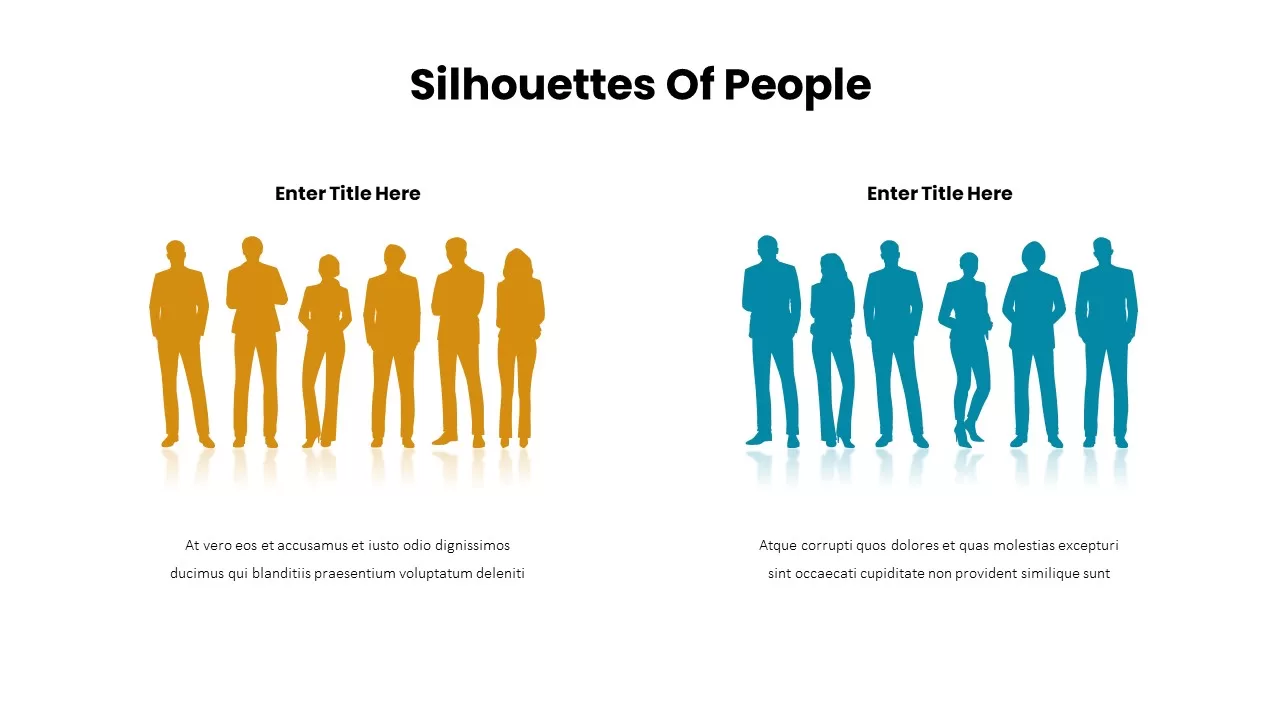
Business Silhouettes Comparison Slide Template for PowerPoint & Google Slides
HR
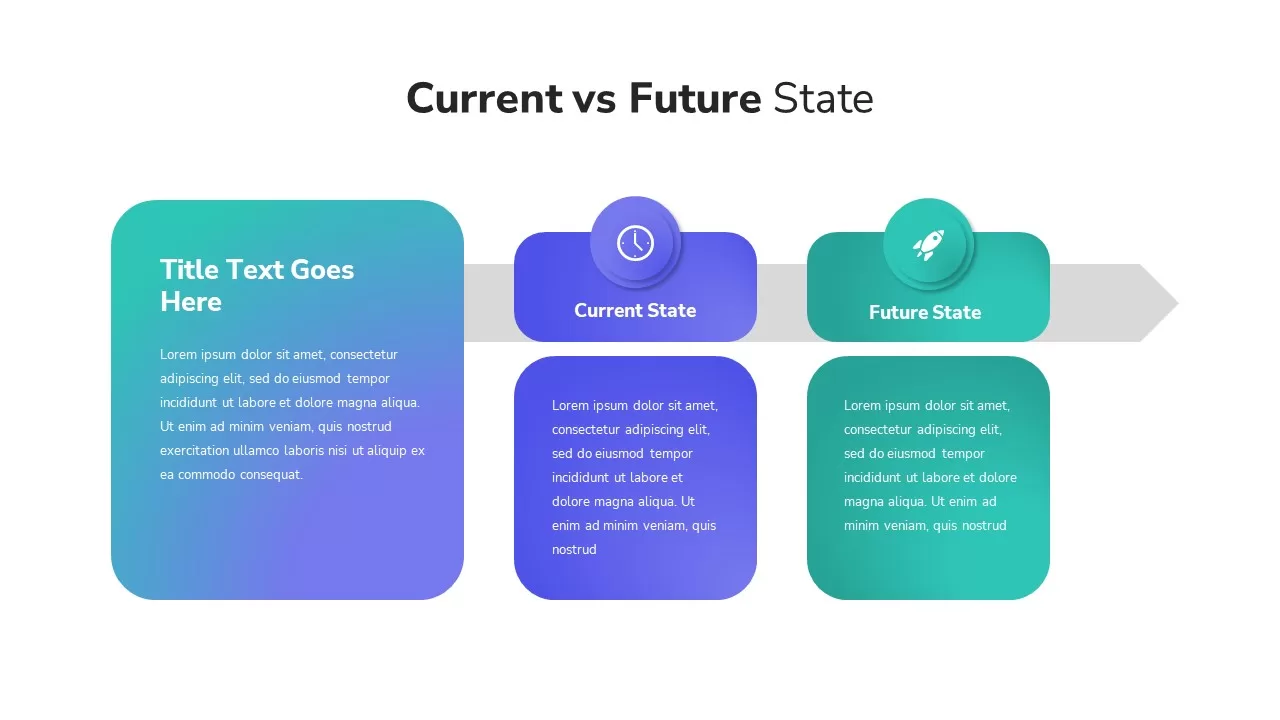
Current vs Future State Comparison Slide Template for PowerPoint & Google Slides
Comparison Chart
Current vs Future State Comparison Slide Template for PowerPoint & Google Slides
Comparison Chart
Current vs Future State Comparison Template for PowerPoint & Google Slides
Comparison Chart
Before and After Comparison Slide Template for PowerPoint & Google Slides
Comparison
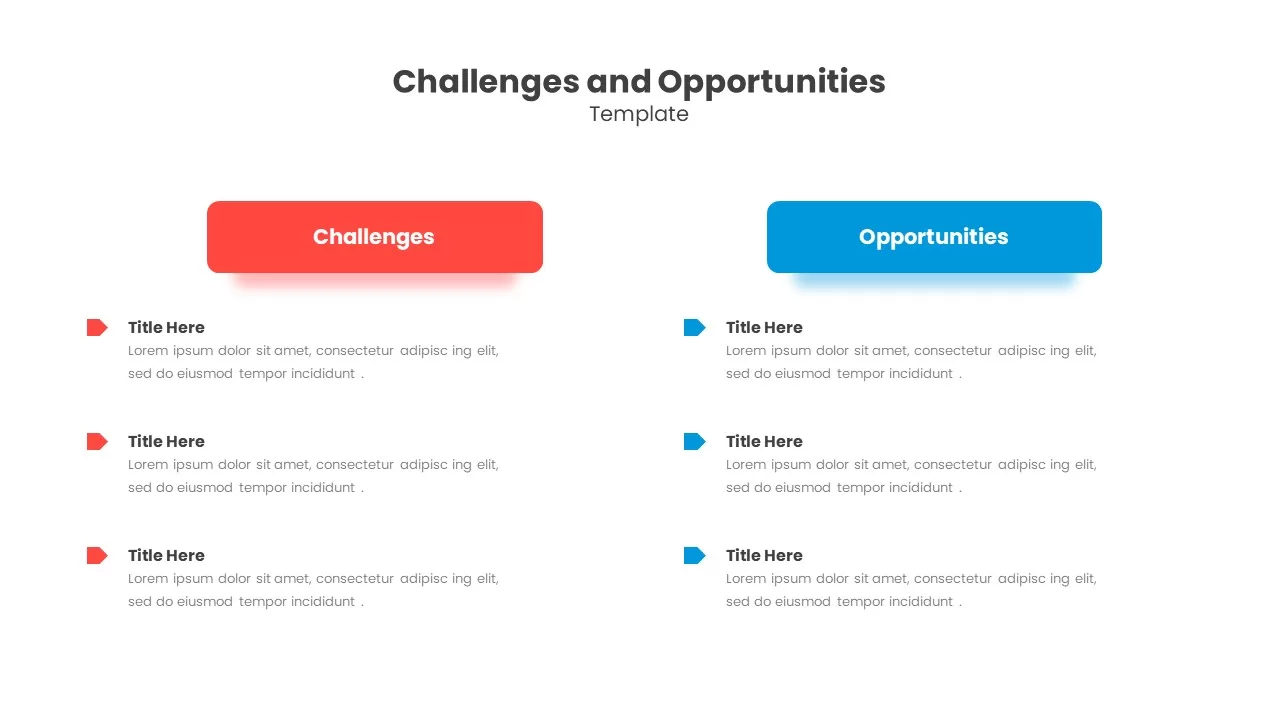
Challenges & Opportunities Comparison Template for PowerPoint & Google Slides
Opportunities Challenges
Opportunities Hub-and-Spoke Comparison Diagram Template for PowerPoint & Google Slides
Opportunities Challenges
Modern Before and After Comparison Template for PowerPoint & Google Slides
Infographics
Benchmarking Metrics Comparison Slide Template for PowerPoint & Google Slides
Pie/Donut
Dynamic Benchmarking Comparison Chart Template for PowerPoint & Google Slides
Comparison Chart
Challenges & Solutions Comparison Template for PowerPoint & Google Slides
Opportunities Challenges
Adam’s Equity Theory Scale Comparison Template for PowerPoint & Google Slides
Comparison
Casino Poker Chips Comparison Slide Template for PowerPoint & Google Slides
Comparison
Vendor Comparison Analysis template for PowerPoint & Google Slides
Comparison Chart
Vendor Comparison Matrix with High-Level Requirements template for PowerPoint & Google Slides
Comparison Chart
Modern Tradeoffs Comparison Slide Template for PowerPoint & Google Slides
Comparison
Popular Social Media Comparison Grid Template for PowerPoint & Google Slides
Digital Marketing
Hits and Misses Performance Comparison Template for PowerPoint & Google Slides
Comparison
Conflict Infographics Comparison Template for PowerPoint & Google Slides
Infographics
Surgery Infographics Comparison Template for PowerPoint & Google Slides
Health
Clustered Bar Chart Comparison Template for PowerPoint & Google Slides
Bar/Column
Business Timeline Comparison Bar Chart Template for PowerPoint & Google Slides
Comparison Chart
Grouped Column Chart Comparison Template for PowerPoint & Google Slides
Bar/Column
Multiple Line Chart Comparison Template for PowerPoint & Google Slides
Comparison Chart
Interactive Multi-Use Cost Comparison Template for PowerPoint & Google Slides
Comparison
Free Pros and Cons Comparison Template for PowerPoint & Google Slides
Comparison
Free
Free Versatile Product Comparison Chart Template for PowerPoint & Google Slides
Charts
Free
AI vs. Human Intelligence Comparison Template for PowerPoint & Google Slides
Comparison
Quarterly Revenue Comparison Bar Chart Template for PowerPoint & Google Slides
Bar/Column
Regional Revenue Comparison Overview Template for PowerPoint & Google Slides
Comparison
Hits & Misses Comparison Infographic Template for PowerPoint & Google Slides
Pitch Deck
Project Comparison Timeline Roadmap Template for PowerPoint & Google Slides
Comparison
Good vs Bad Comparison with Scale Template for PowerPoint & Google Slides
Comparison
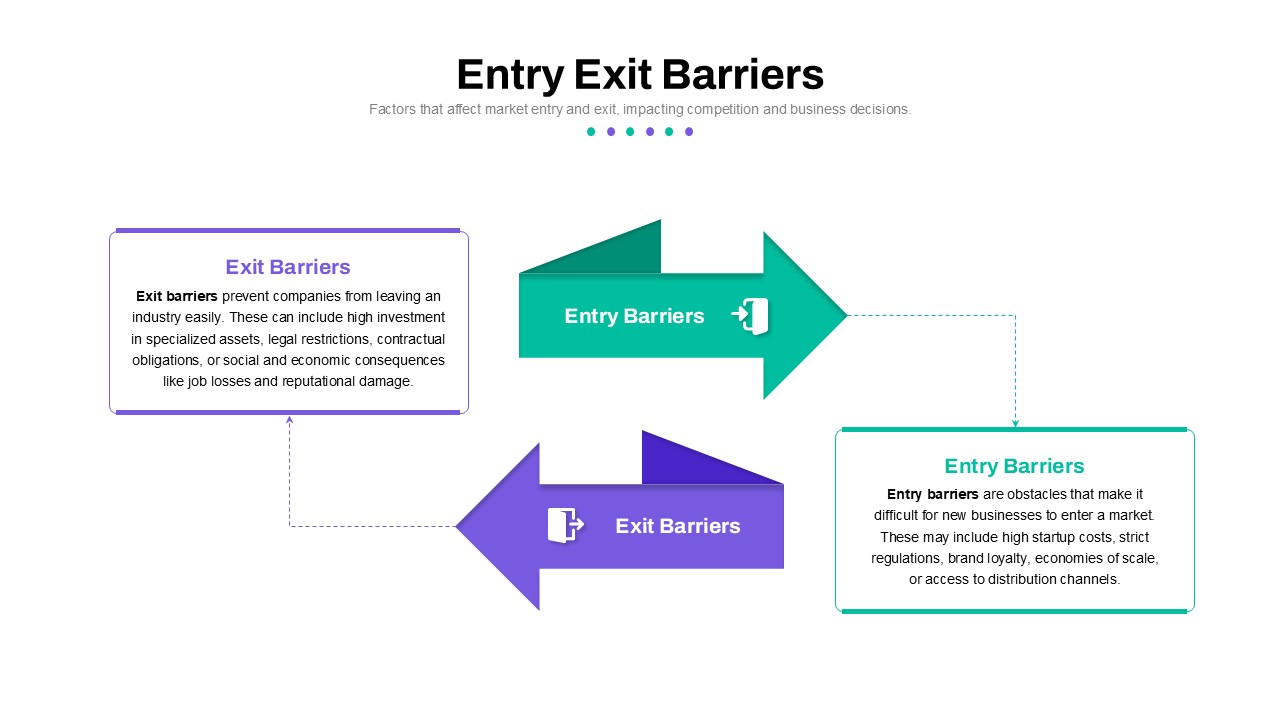
Entry and Exit Barriers Comparison Template for PowerPoint & Google Slides
Comparison
Competitor Comparison Chart Design Template for PowerPoint & Google Slides
Comparison
Two-Option Bar Chart Comparison Table Template for PowerPoint & Google Slides
Comparison
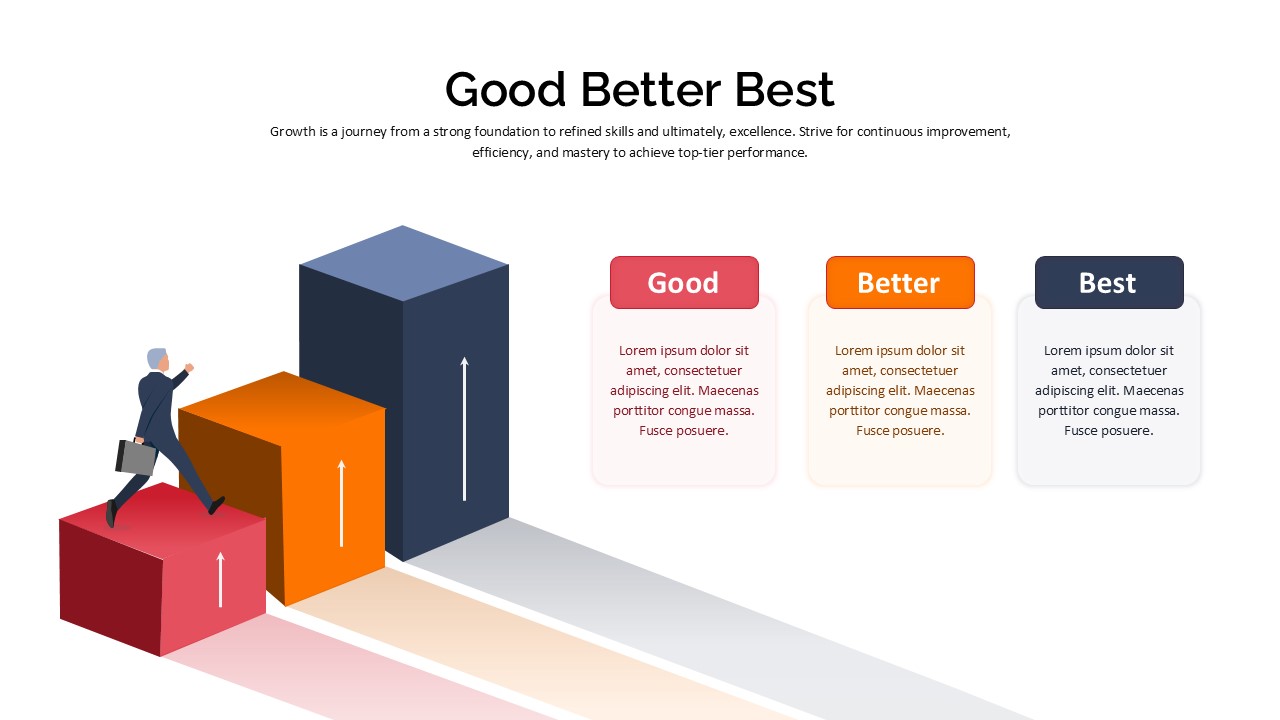
Good Better Best Comparison template for PowerPoint & Google Slides
Comparison
Cross Sell & Up Sell Strategy Comparison template for PowerPoint & Google Slides
Comparison
Product Feature Comparison Table Template for PowerPoint & Google Slides
Comparison Chart
Competitor Profile Matrix Comparison Template for PowerPoint & Google Slides
Comparison Chart
Two-Sided Coin Comparison Diagram Template for PowerPoint & Google Slides
Comparison
Two-Box Analysis & Target Comparison Template for PowerPoint & Google Slides
Comparison
Two Section Comparison template for PowerPoint & Google Slides
Business Proposal
VUCA vs BANI Comparison Infographic Template for PowerPoint & Google Slides
Comparison
Category Analysis Comparison Infographic Template for PowerPoint & Google Slides
Comparison
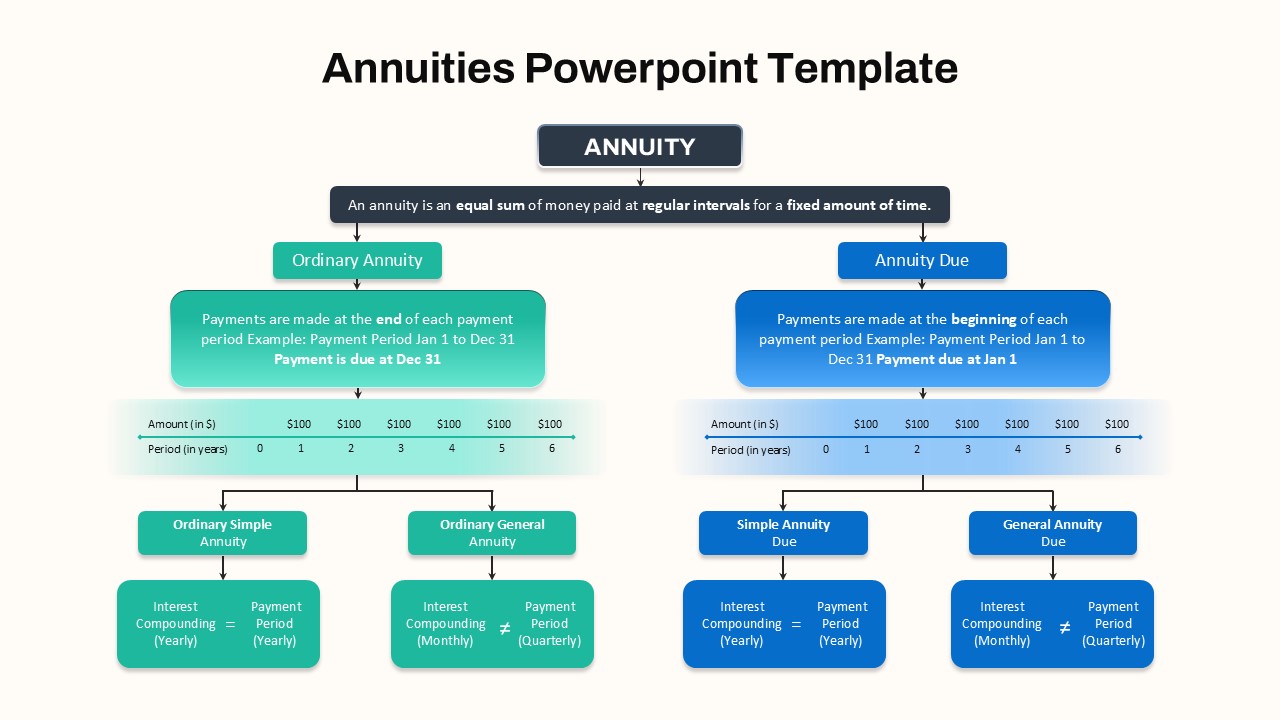
Hierarchical Annuity Comparison Flowchart Template for PowerPoint & Google Slides
Business Report
Feasibility Matrix Comparison Chart Template for PowerPoint & Google Slides
Comparison Chart
Funnel and Flywheel Thinking Comparison template for PowerPoint & Google Slides
Infographics
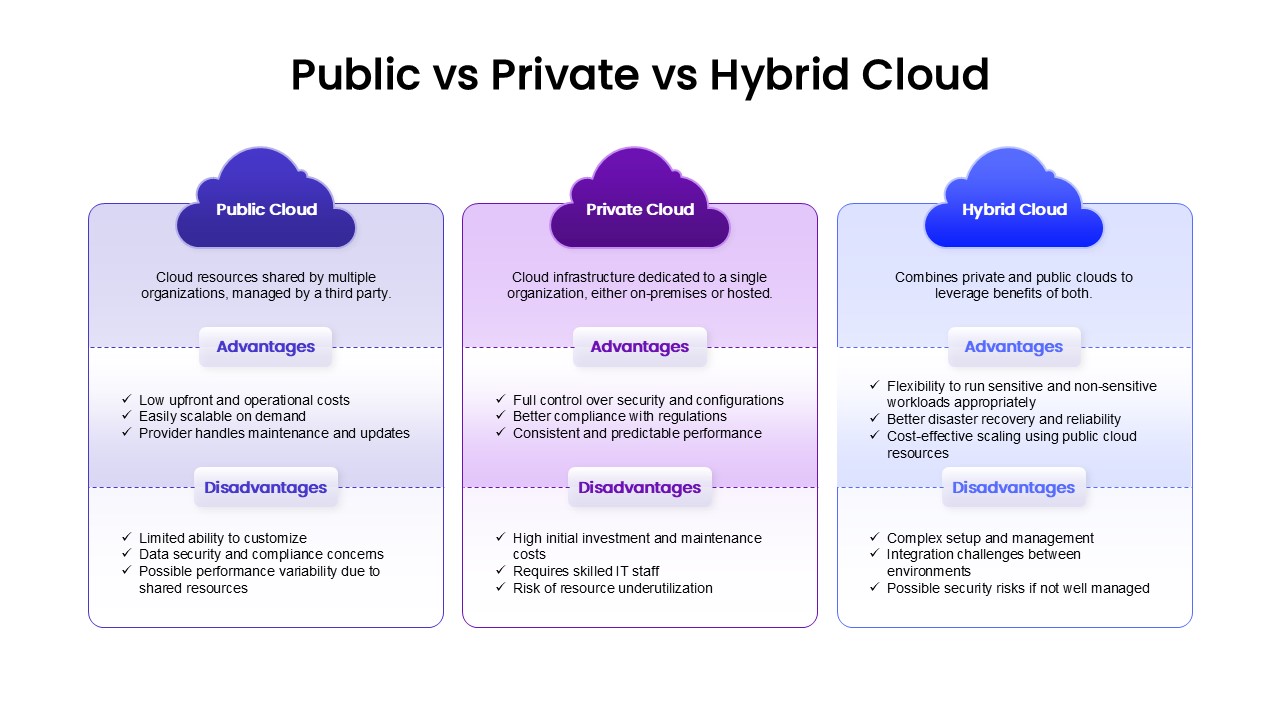
Public, Private & Hybrid Cloud Comparison Template for PowerPoint & Google Slides
Cloud Computing
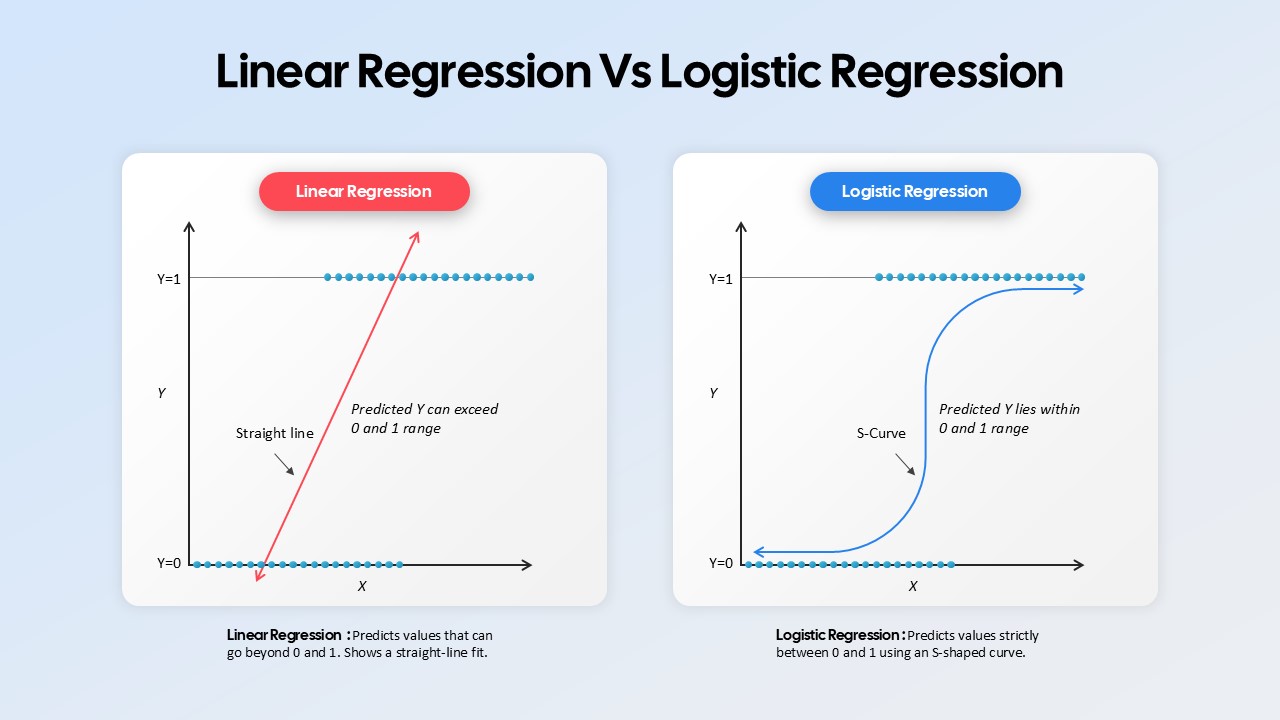
Linear Regression vs Logistic Regression Comparison template for PowerPoint & Google Slides
Comparison
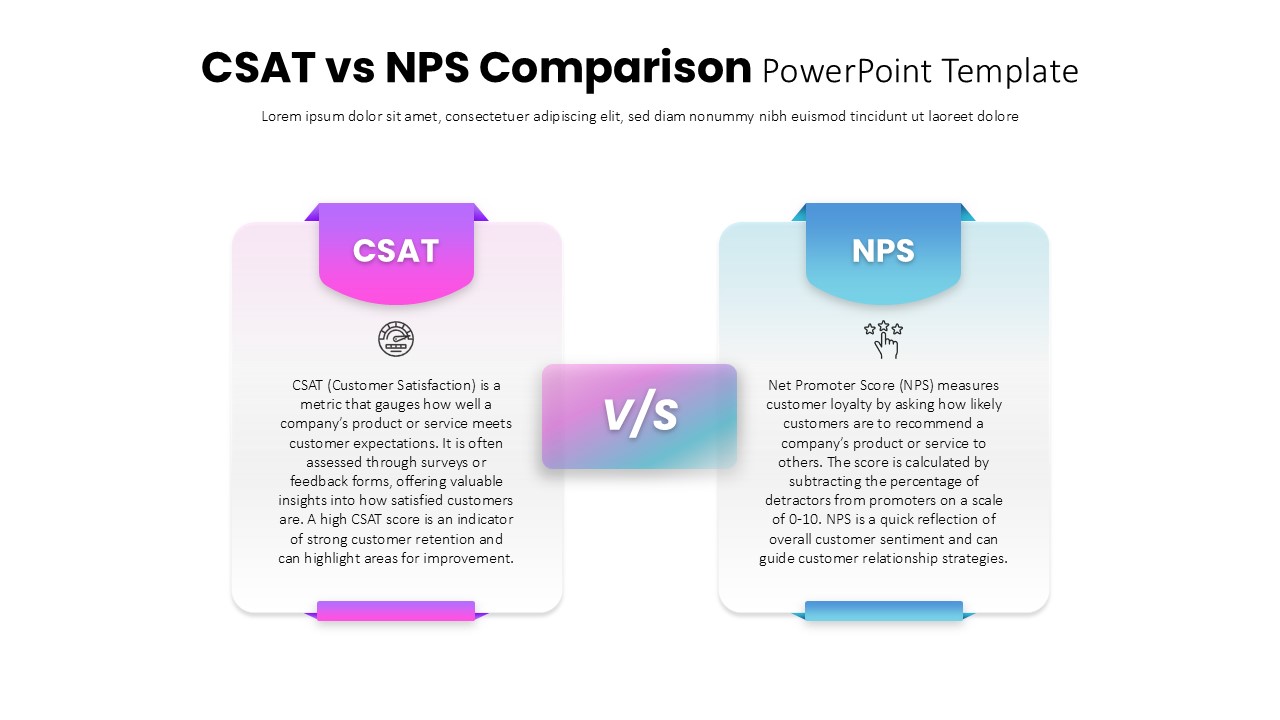
CSAT vs NPS Comparison template for PowerPoint & Google Slides
Business Strategy
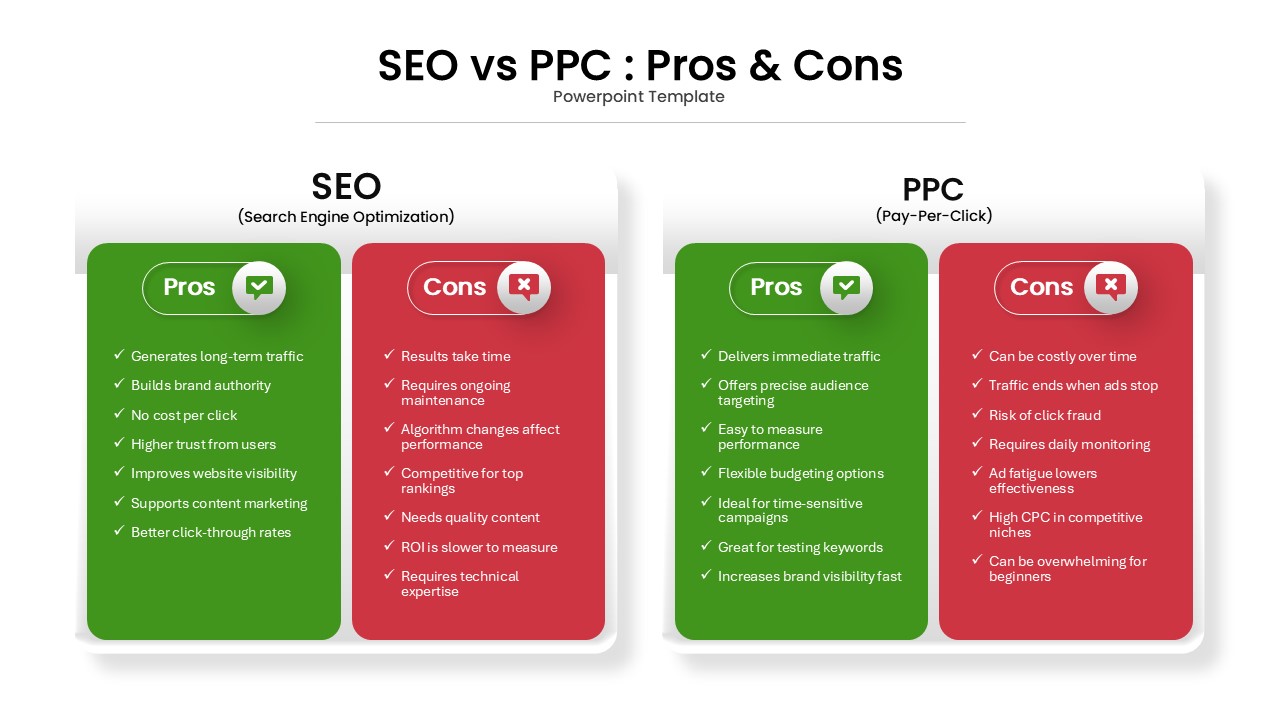
SEO vs PPC: Pros & Cons Comparison Template for PowerPoint & Google Slides
Comparison
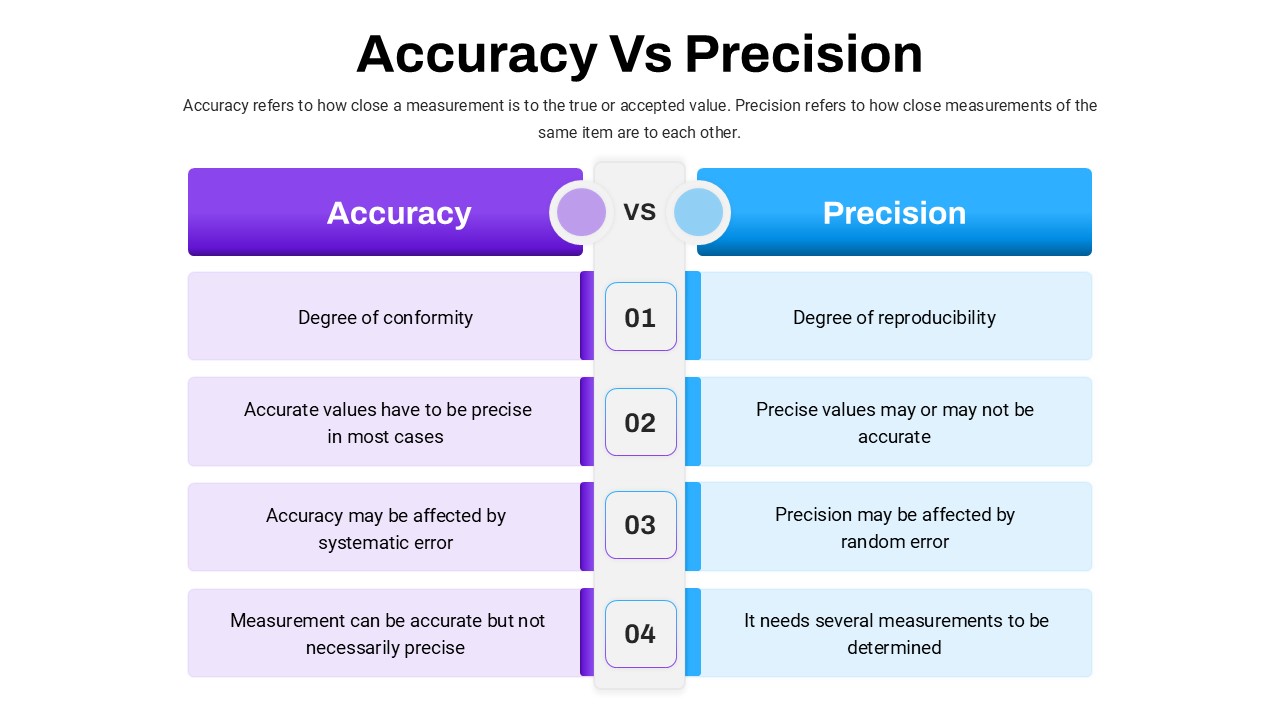
Accuracy Vs Precision Comparison Template for PowerPoint & Google Slides
Comparison Chart
Risk vs Reward Comparison Template for PowerPoint & Google Slides
Opportunities Challenges
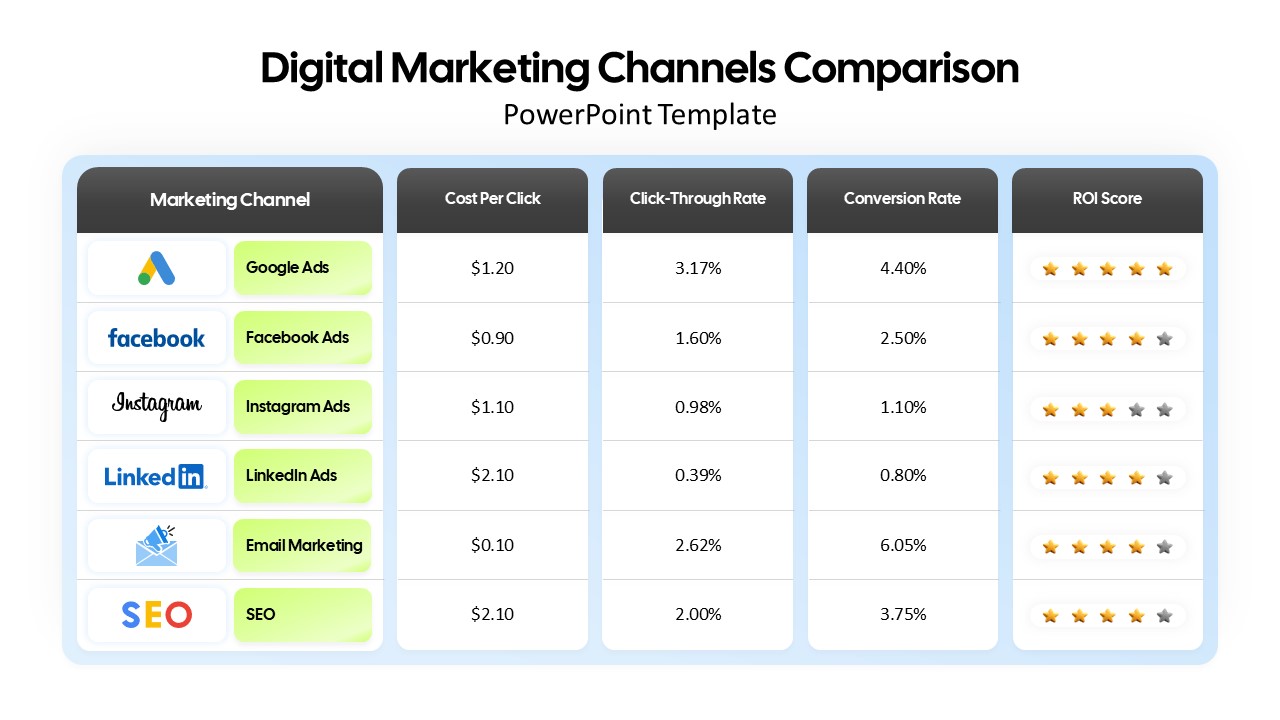
Digital Marketing Channels Comparison template for PowerPoint & Google Slides
Business
Comparison Table Presentation Template for PowerPoint & Google Slides
Table
Colorful Comparison Table Presentation Template for PowerPoint & Google Slides
Table
Colorful Business Data Comparison Table Template for PowerPoint & Google Slides
Table
Five Column Comparison Table Layout Template for PowerPoint & Google Slides
Comparison
Quarterly Comparison Pie Chart Template for PowerPoint & Google Slides
Pie/Donut
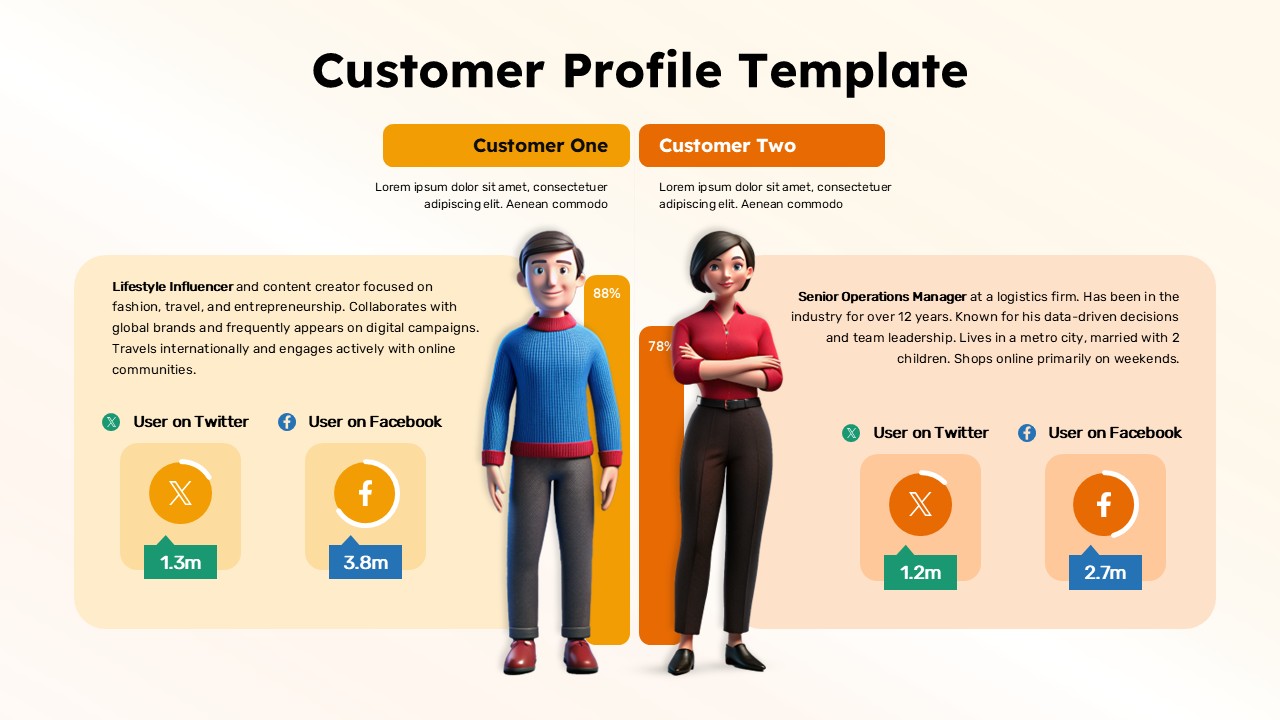
Customer Persona Comparison Profile Template for PowerPoint & Google Slides
Business
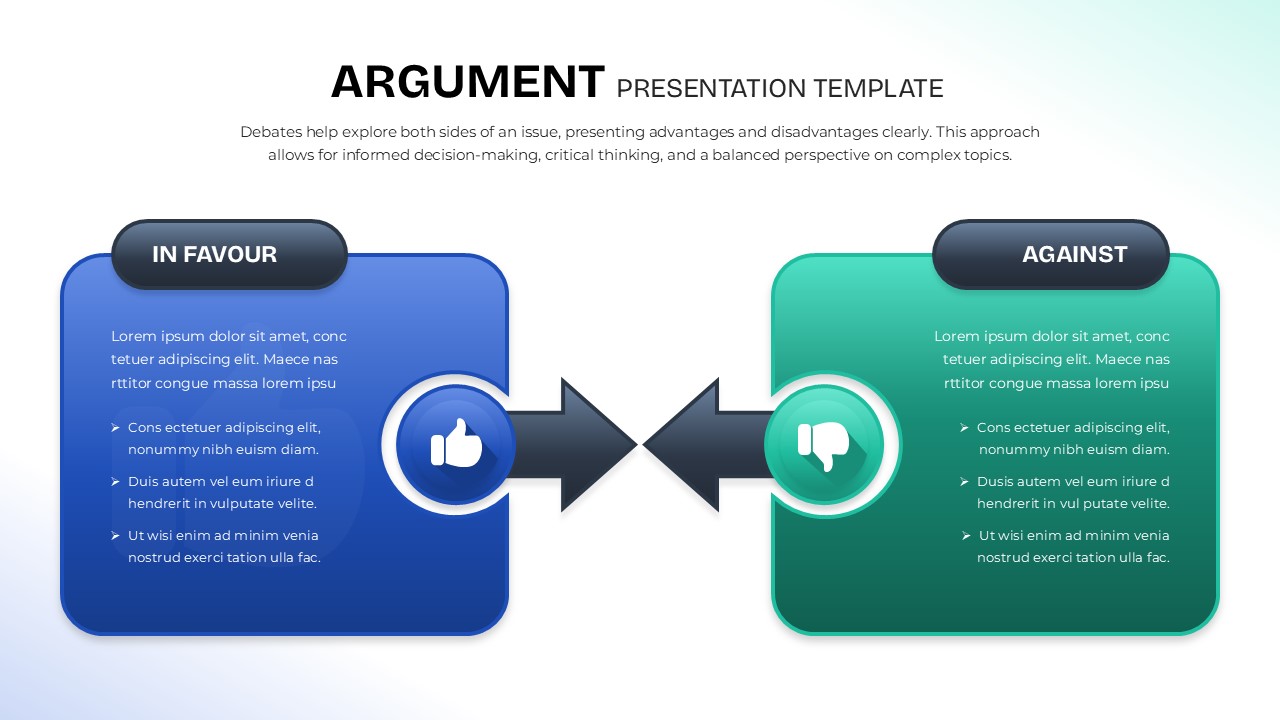
Argument Comparison Template for PowerPoint & Google Slides
Comparison
Operating Channels Comparison Diagram Template for PowerPoint & Google Slides
Business Models
4 Set Venn Diagram Comparison Template for PowerPoint & Google Slides
Comparison