Eight-Segment 3D Arrow Infographics Template for PowerPoint & Google Slides
Description
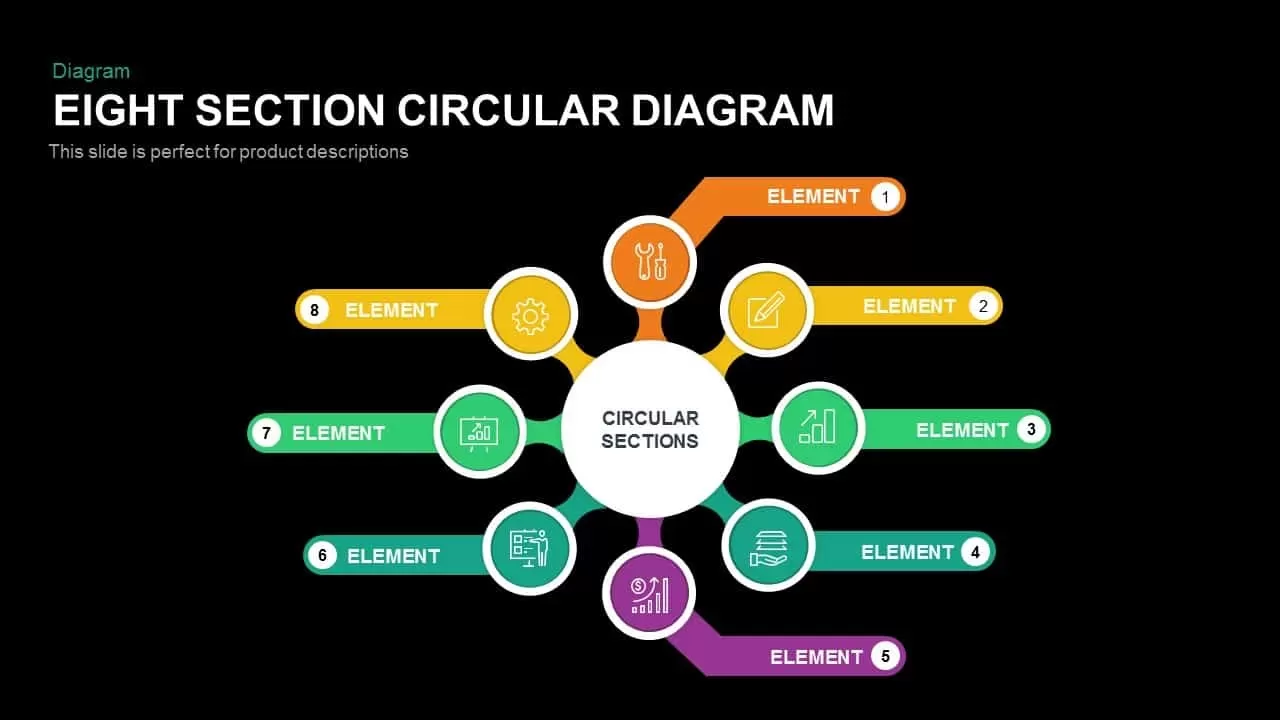
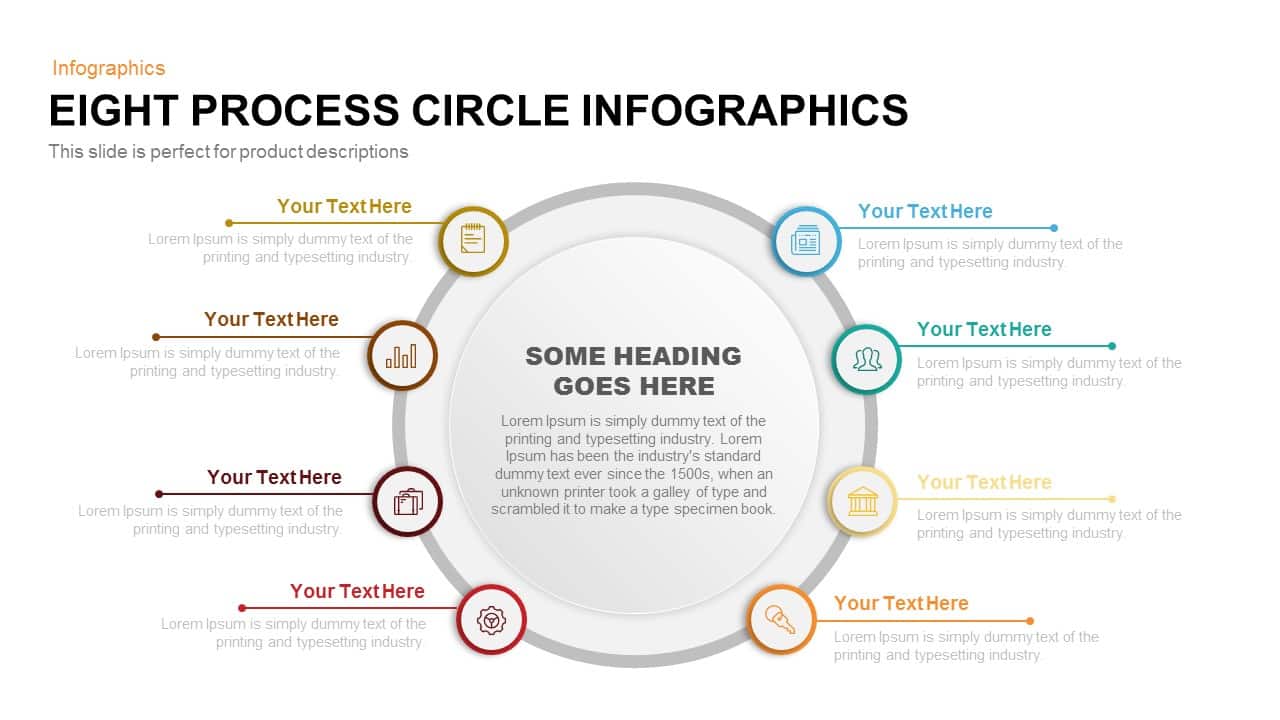
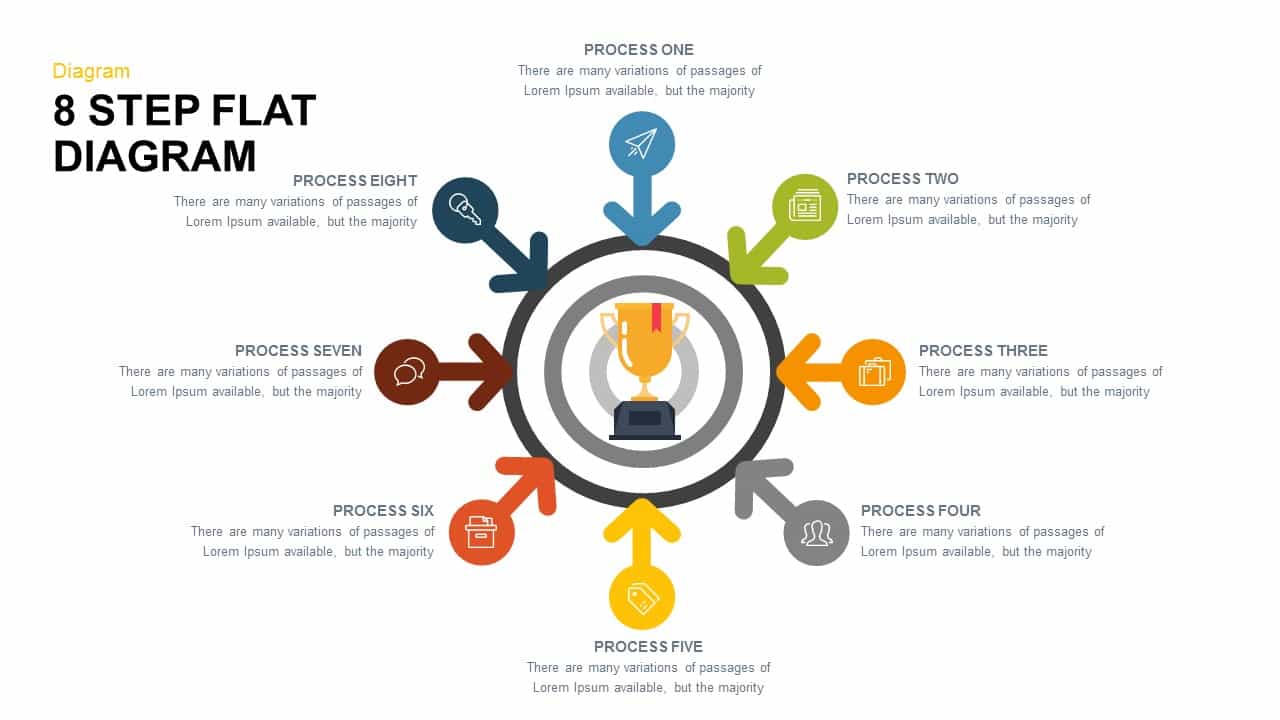
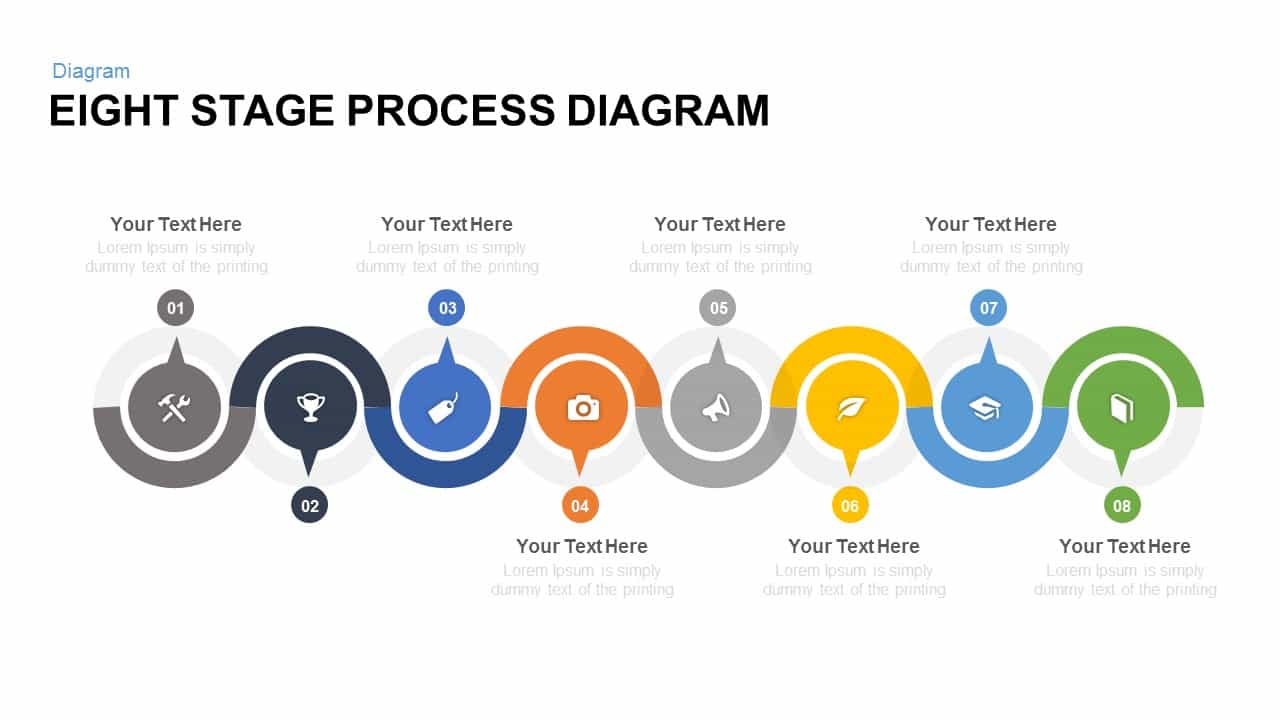
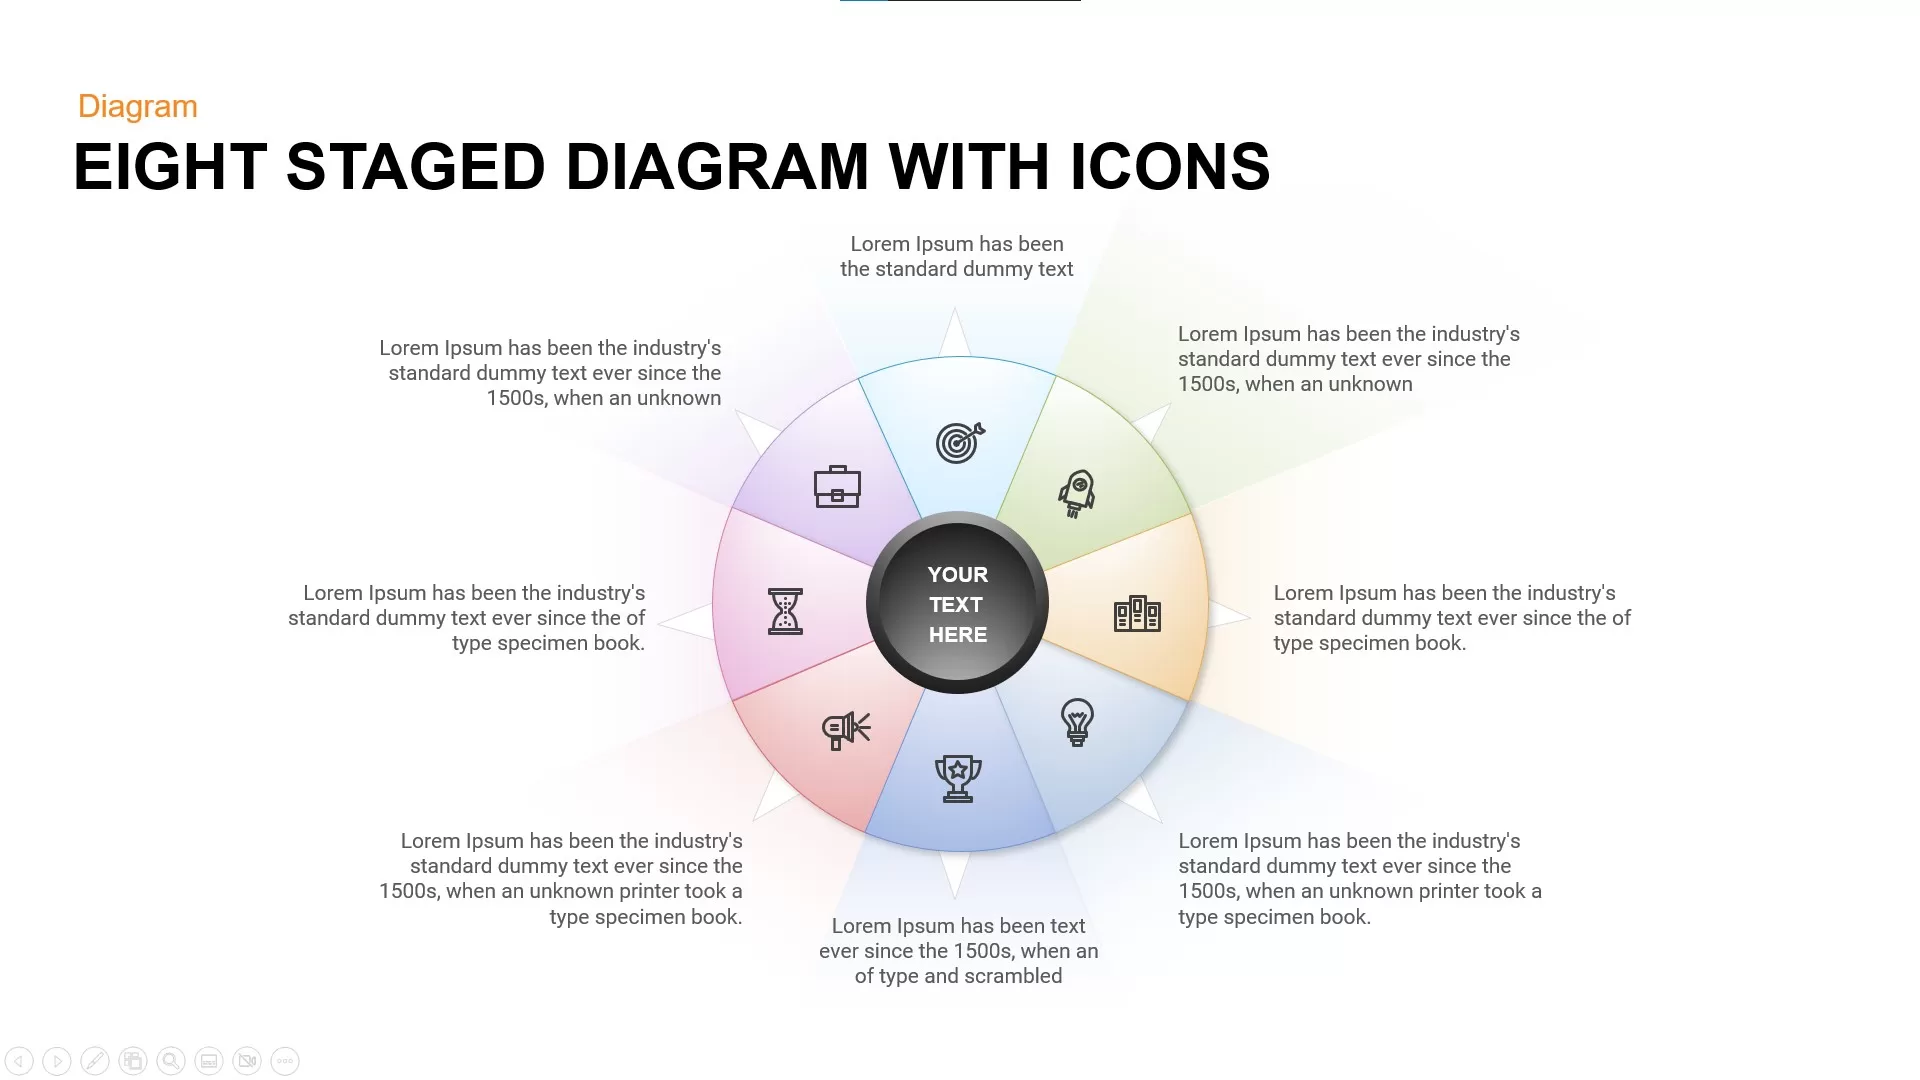
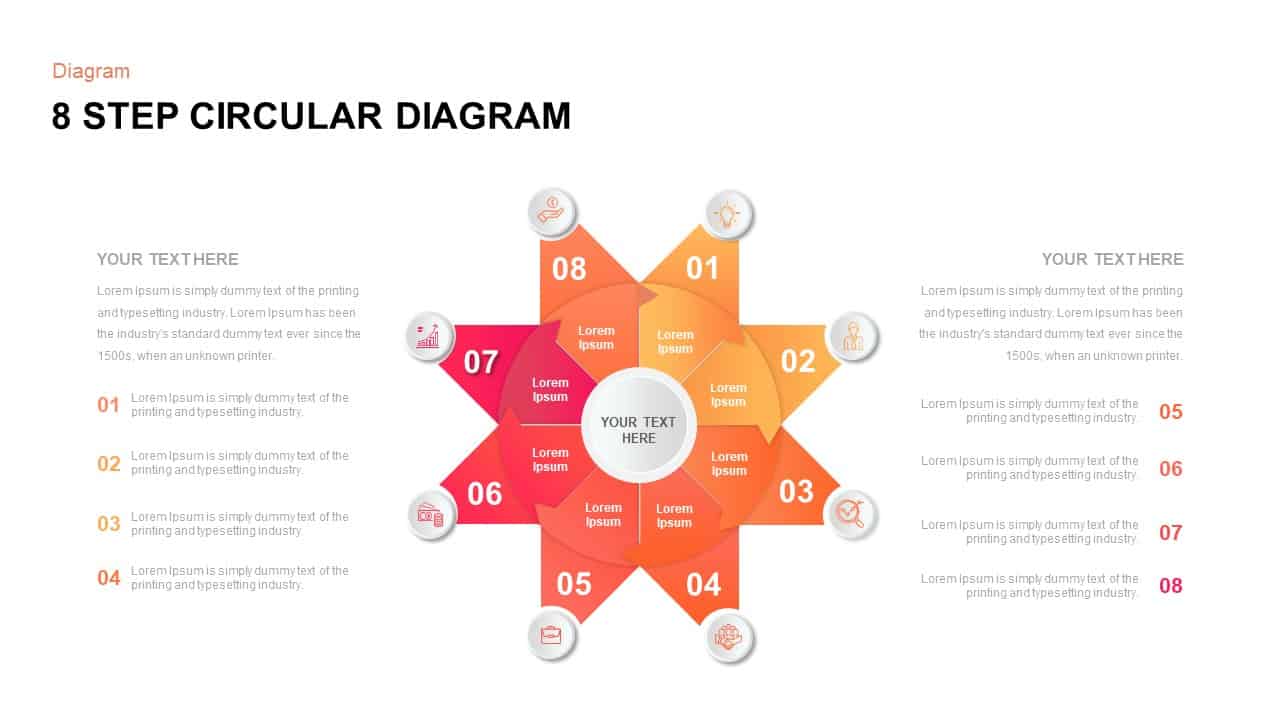
Leverage this vibrant eight-segment 3D arrow infographic to present complex workflows, processes, or strategic frameworks with visual clarity. At the center, a “Main Keyword” placeholder anchors eight glossy vector arrows—orange, lime, green, teal, blue, purple, magenta, and red—arranged in a perfect circle. Each arrow features a white icon and a detachable callout line that leads to a text box for concise labels or metrics. Semi-transparent gradient arrows on the slide margins hint at guided navigation or step-by-step storytelling.
Built on master slides and composed of fully editable vector shapes, you can resize arrows, swap colors, replace icons, or update text placeholders in seconds. The 3D shading and polished gradients ensure each segment pops against the clean white background, while minimalist typography maintains readability. This template guarantees pixel-perfect fidelity across both PowerPoint and Google Slides, eliminating formatting headaches and accelerating slide creation.
Ideal for mapping product development stages, illustrating departmental responsibilities, or visualizing phased rollouts, this circular arrow design streamlines data storytelling and keeps your audience engaged. Duplicate or remove segments to accommodate varying numbers of steps, reorder arrows to match your narrative flow, or apply custom color themes to align with brand guidelines. With intuitive placeholders and vector-driven assets, you can focus on delivering insights rather than wrestling with graphics.
Who is it for
Project managers, business analysts, marketing strategists, and product developers will find this eight-segment arrow infographic invaluable for presenting process maps, strategic roadmaps, or multi-step proposals in executive briefings, team workshops, or investor pitches.
Other Uses
Repurpose this slide for timeline milestones, organizational charts, feature prioritization, or risk management frameworks. Replace segment icons to denote KPIs, departmental leads, or customer journey stages, adapting the design for any industry or presentation context.
Login to download this file

Item ID
SB00486
Related Templates

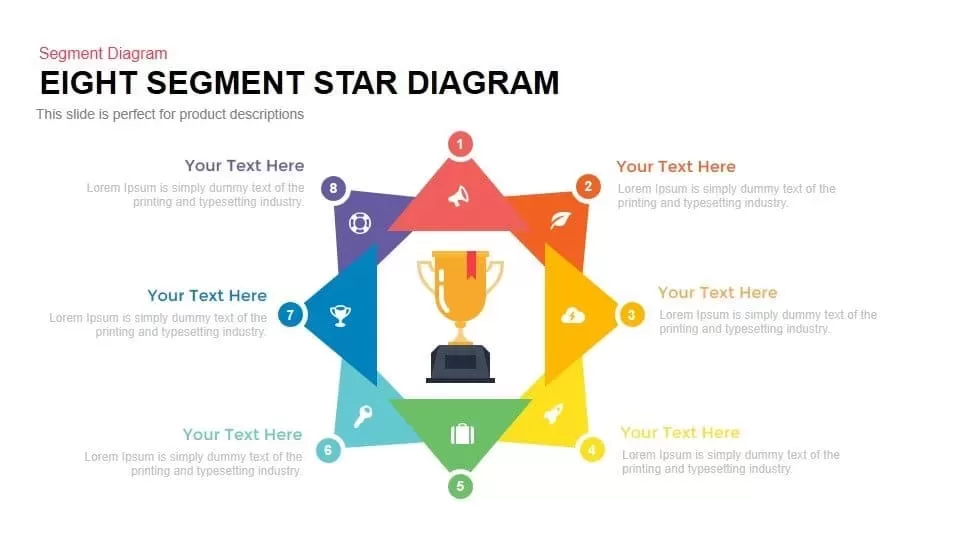
Eight Segment Star Diagram Infographic Template for PowerPoint & Google Slides
Process

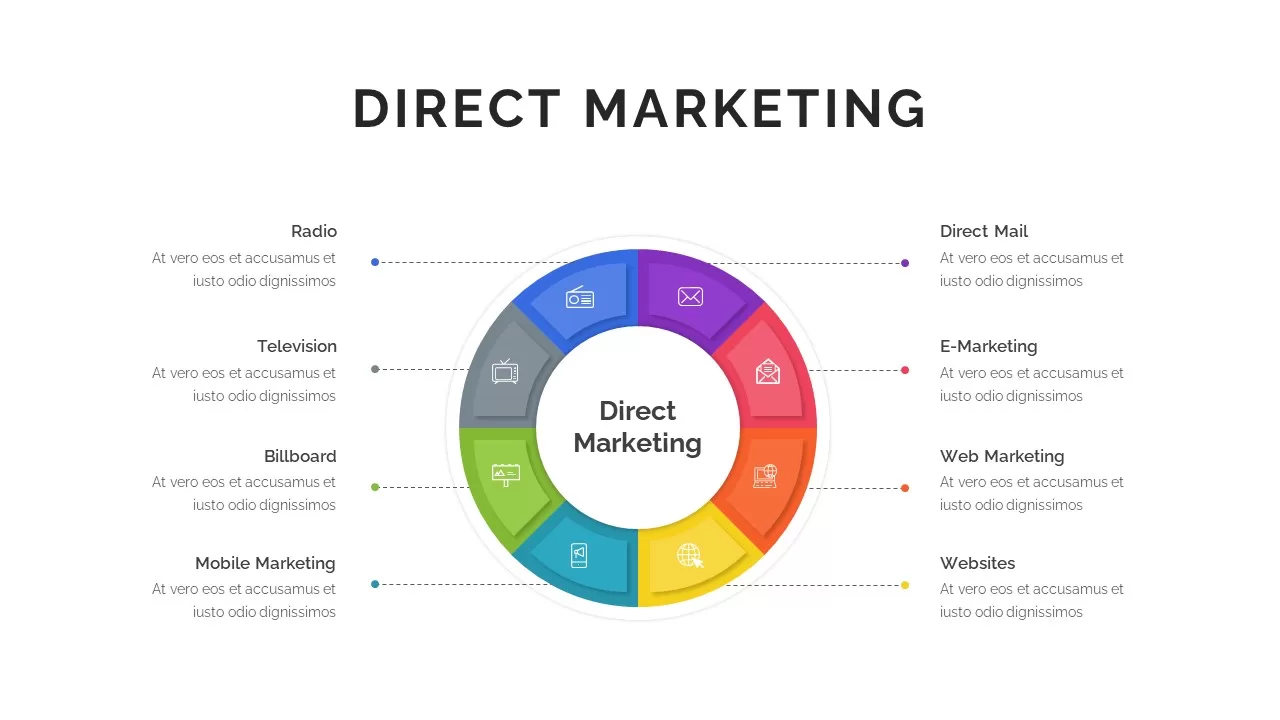
Eight-Segment Direct Marketing Wheel Template for PowerPoint & Google Slides
Circular
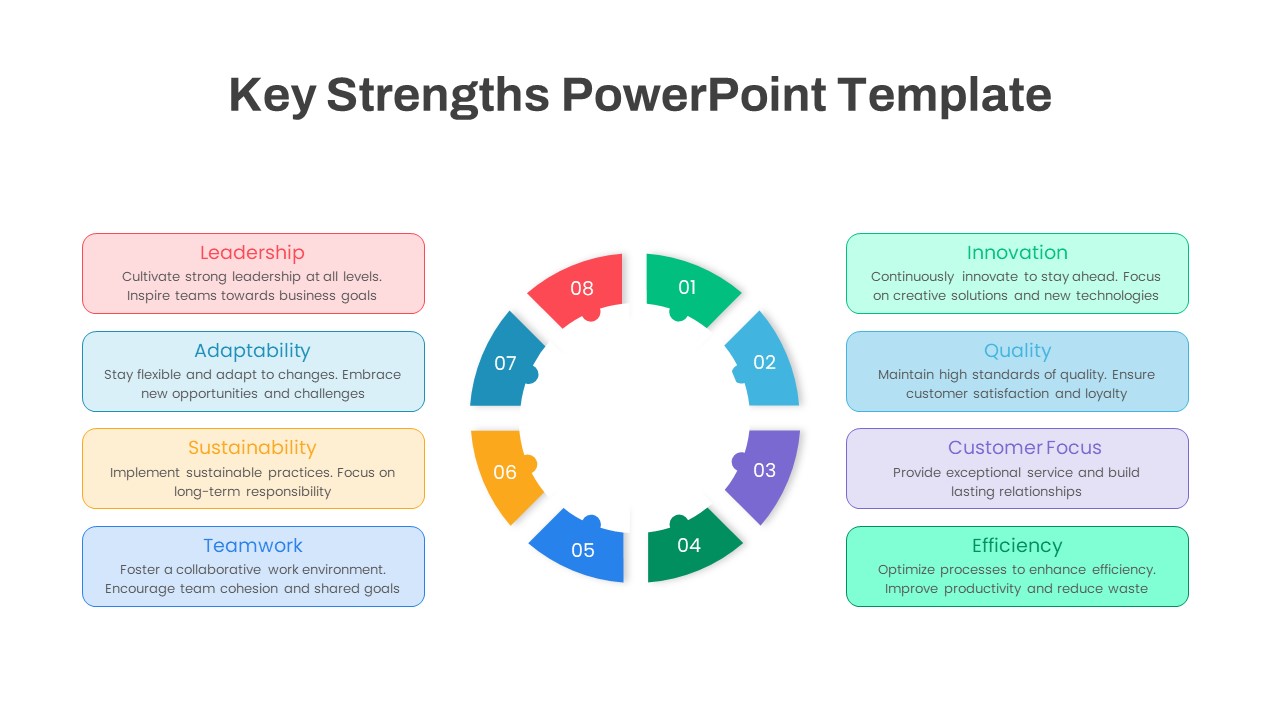
Eight-Segment Key Strengths Diagram Template for PowerPoint & Google Slides
Circular
Seven-Segment Circular Arrow Diagram Template for PowerPoint & Google Slides
Arrow
Three-Segment Circular Arrow Cycle Template for PowerPoint & Google Slides
Circular
Four-Segment Circular Arrow Cycle Template for PowerPoint & Google Slides
Circular
Six-Segment Circular Arrow Cycle Template for PowerPoint & Google Slides
Circular
Six-Segment Circular Arrow Infographic Template for PowerPoint & Google Slides
Circular

Eight Post-It Note Arrow Infographic Template for PowerPoint & Google Slides
Arrow
Eight-Stage Zigzag Arrow Diagram Template for PowerPoint & Google Slides
Process
Eight-Step Inward Arrow Diagram Template for PowerPoint & Google Slides
Arrow
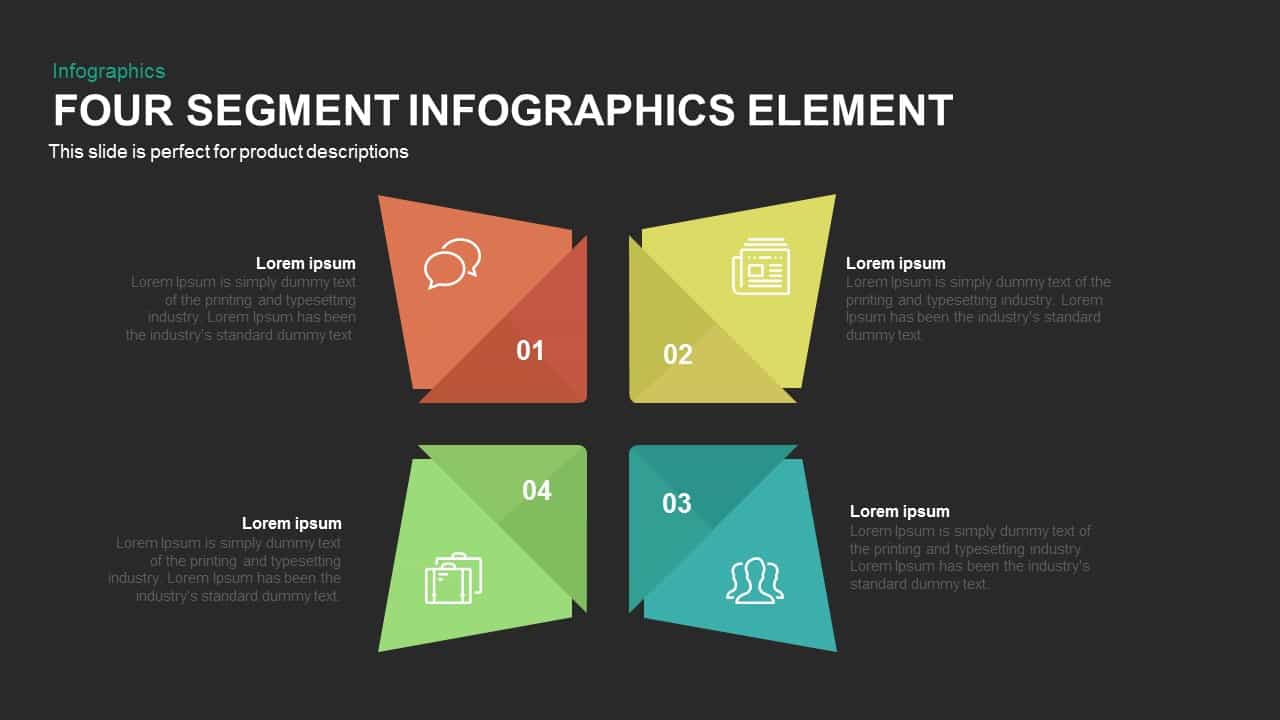
Four Segment Infographics Element Template for PowerPoint & Google Slides
Comparison
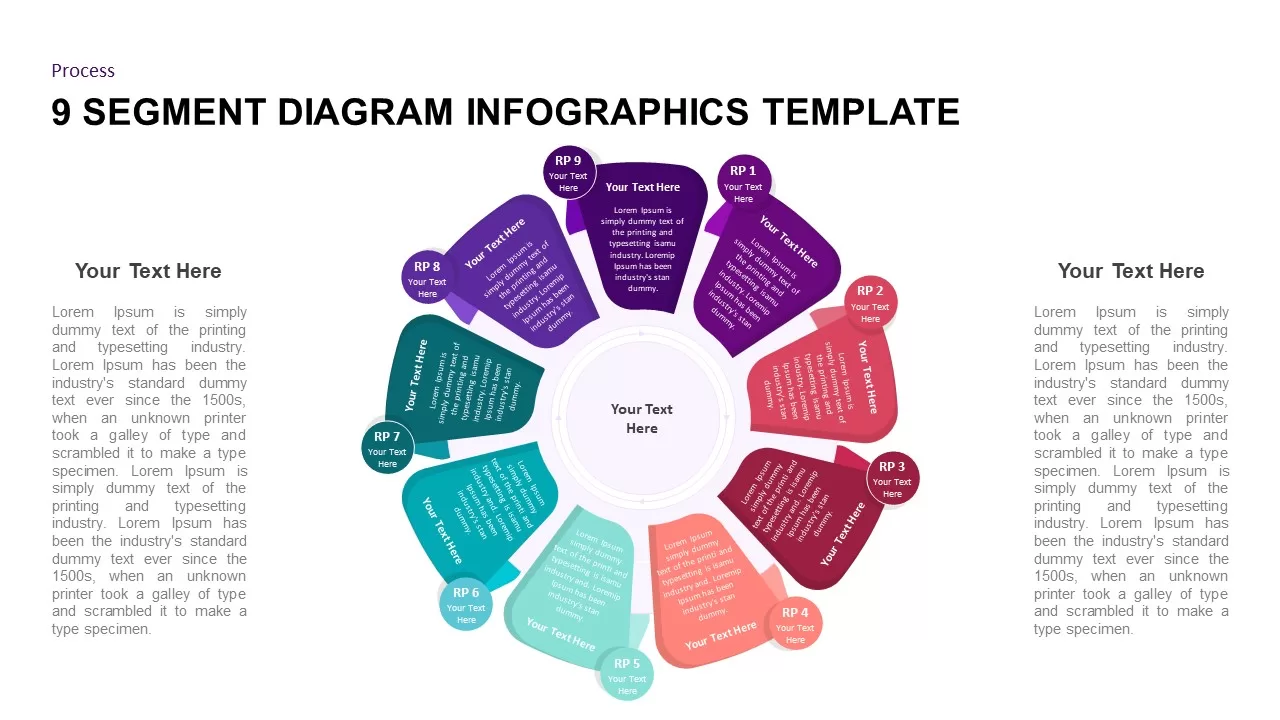
9 Segment Diagram Infographics for PowerPoint & Google Slides
Process
Circle Segment Sales Metrics Infographic Template for PowerPoint & Google Slides
Circular
Multi-Segment Circle Split Diagram template for PowerPoint & Google Slides
Circular

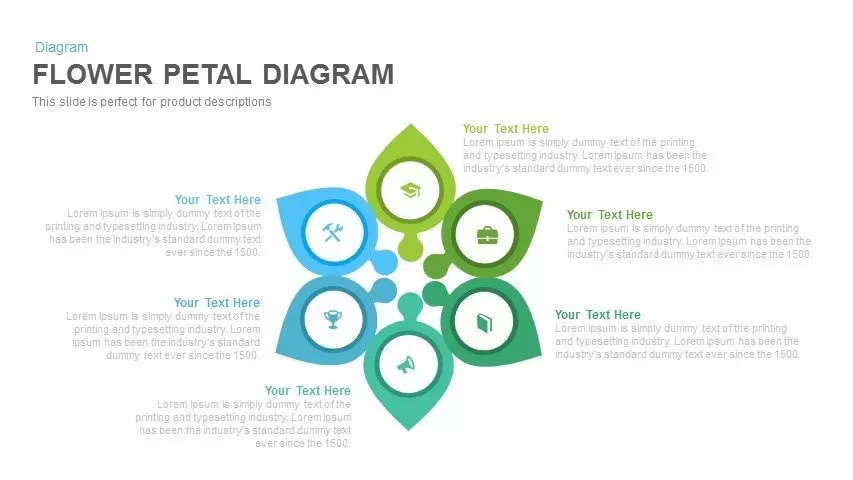
Six-Segment Flower Petal Diagram Template for PowerPoint & Google Slides
Circular
Pie Segment Diagram Four-Step Process Template for PowerPoint & Google Slides
Pie/Donut
Six-Segment Circular Hub Infographic Template for PowerPoint & Google Slides
Circular
Six Segment Hexagon Circular Diagram Template for PowerPoint & Google Slides
Circular
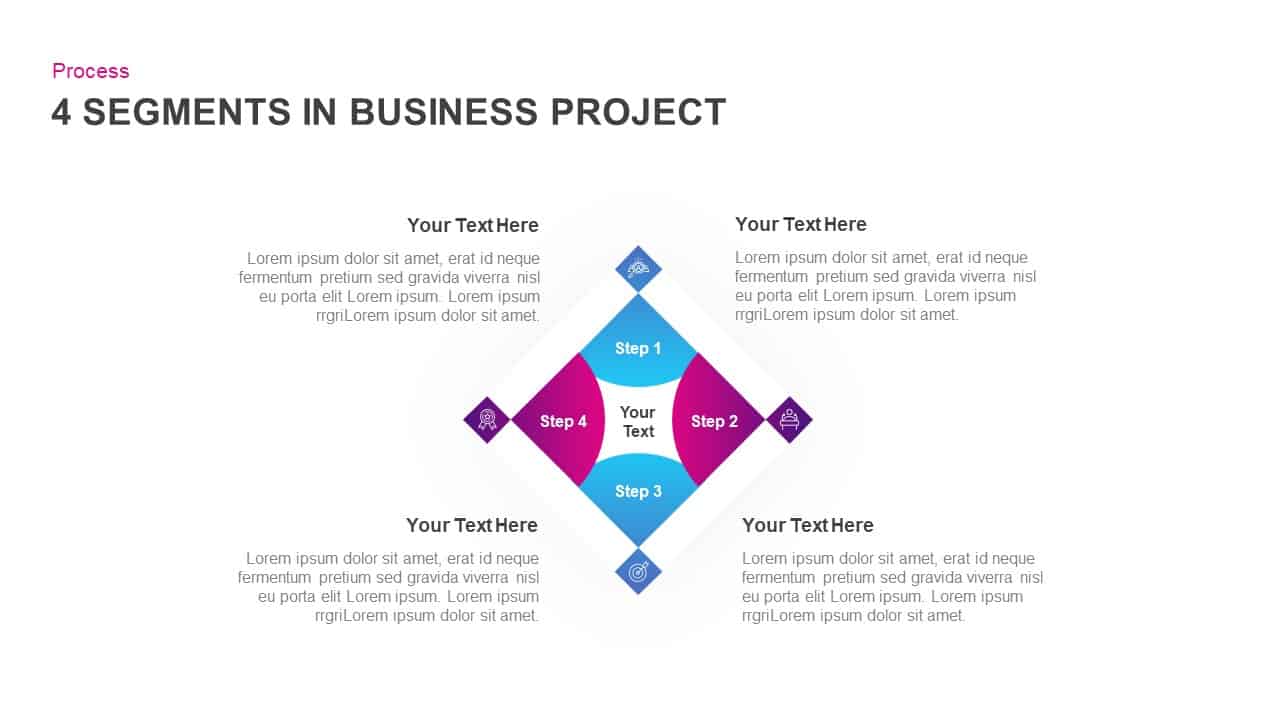
4-Segment Business Project Diamond Diagram Template for PowerPoint & Google Slides
Process
Circular 3D Cube Six-Segment Diagram Template for PowerPoint & Google Slides
Infographics
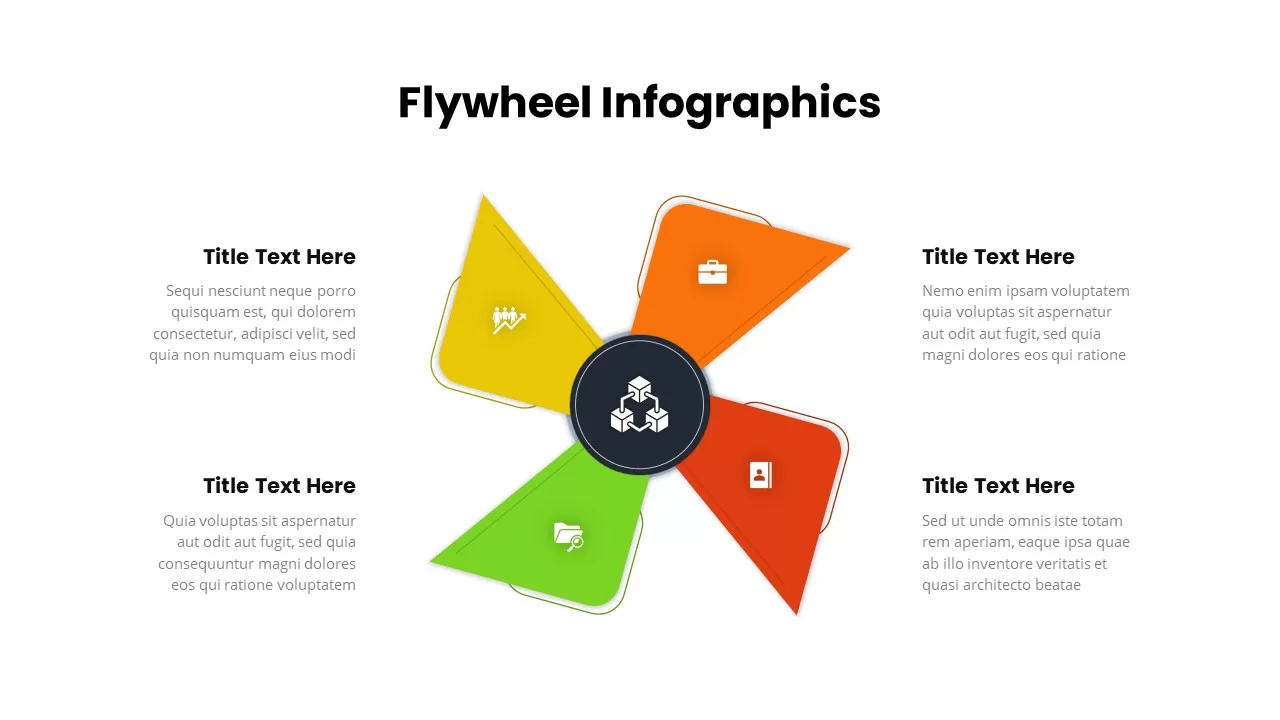
Four-Segment Flywheel Infographic Model Template for PowerPoint & Google Slides
Process
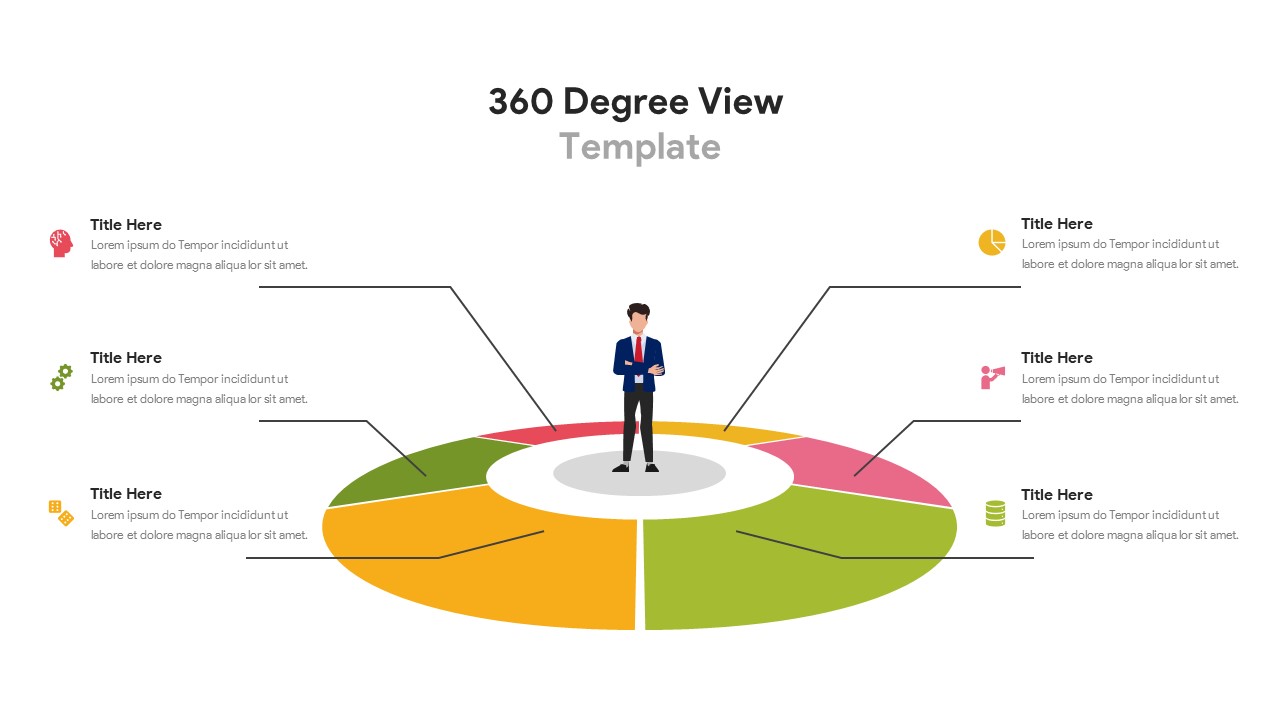
Six-Segment 360 Degree View Infographic Template for PowerPoint & Google Slides
Circular
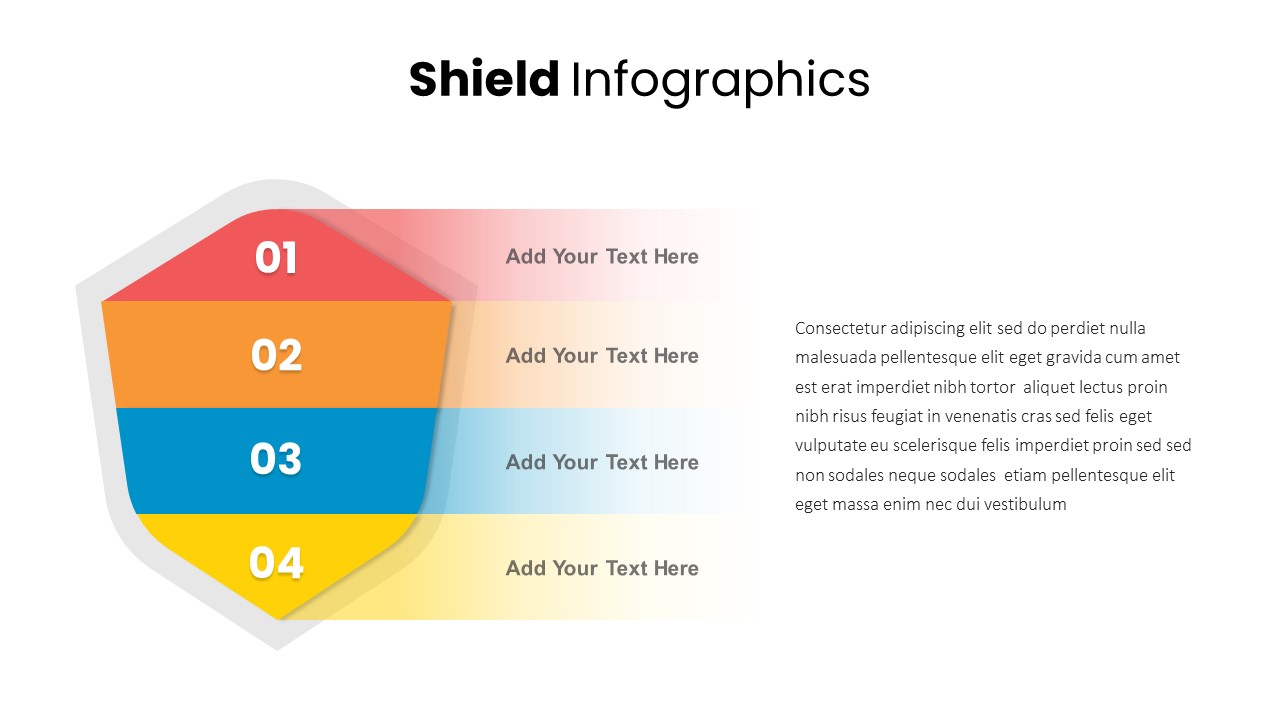
Shield Four-Segment Infographic Template for PowerPoint & Google Slides
Process
Colorful Four-Segment Wheel Chart Template for PowerPoint & Google Slides
Circular
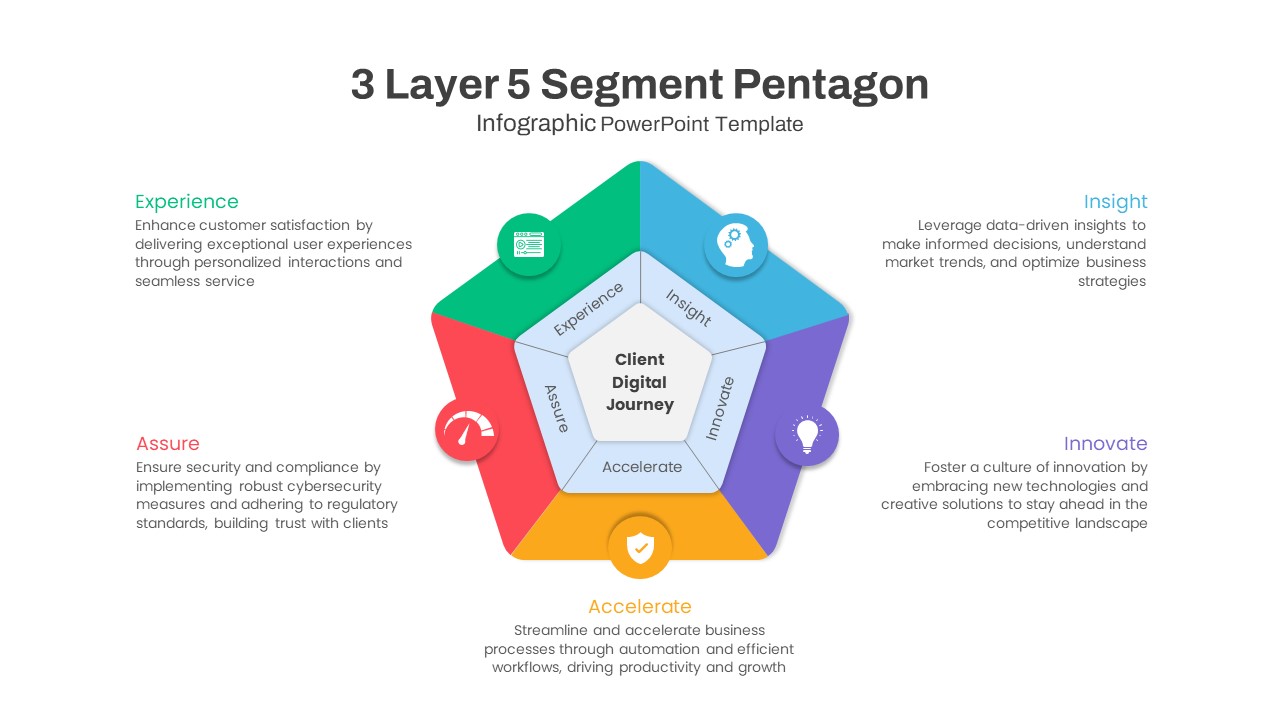
Five-Segment Pentagon Digital Journey Template for PowerPoint & Google Slides
Process
Three Segment Donut Chart KPI Infographic Template for PowerPoint & Google Slides
Pie/Donut
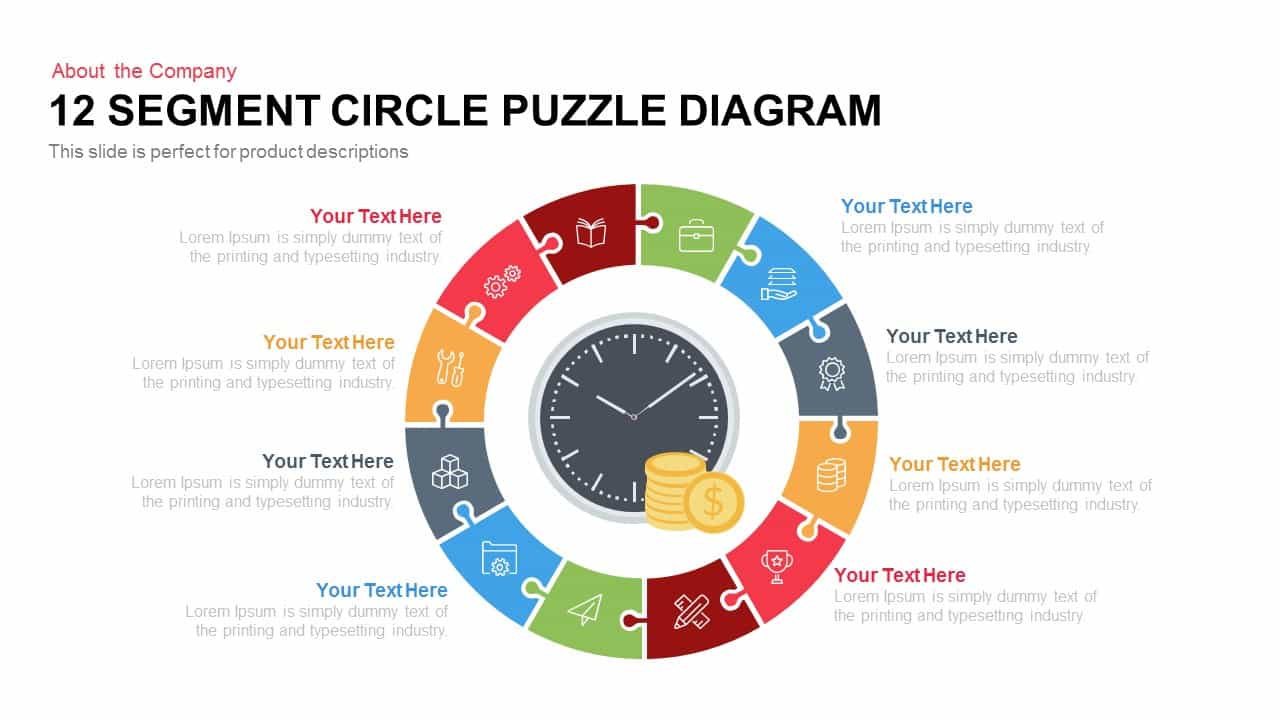
12 Segment Circle Puzzle Diagram Template for PowerPoint and Keynote
Circular
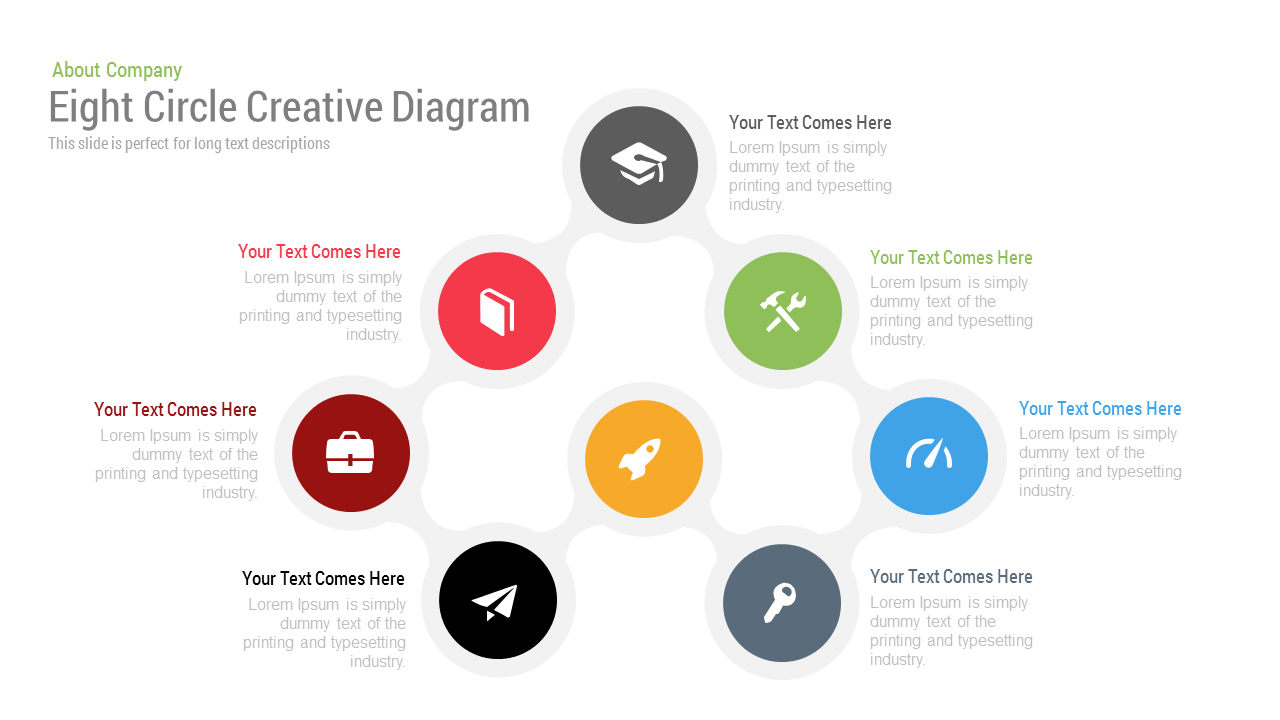
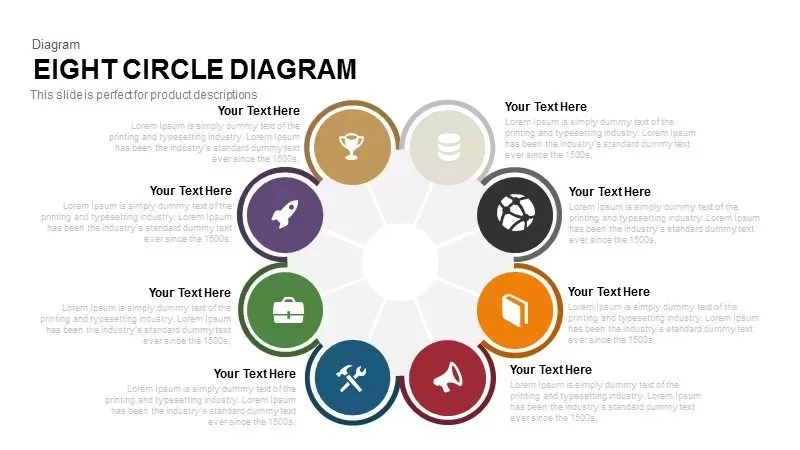
Free Eight Circle Creative Diagram template for PowerPoint & Google Slides
Circular
Free
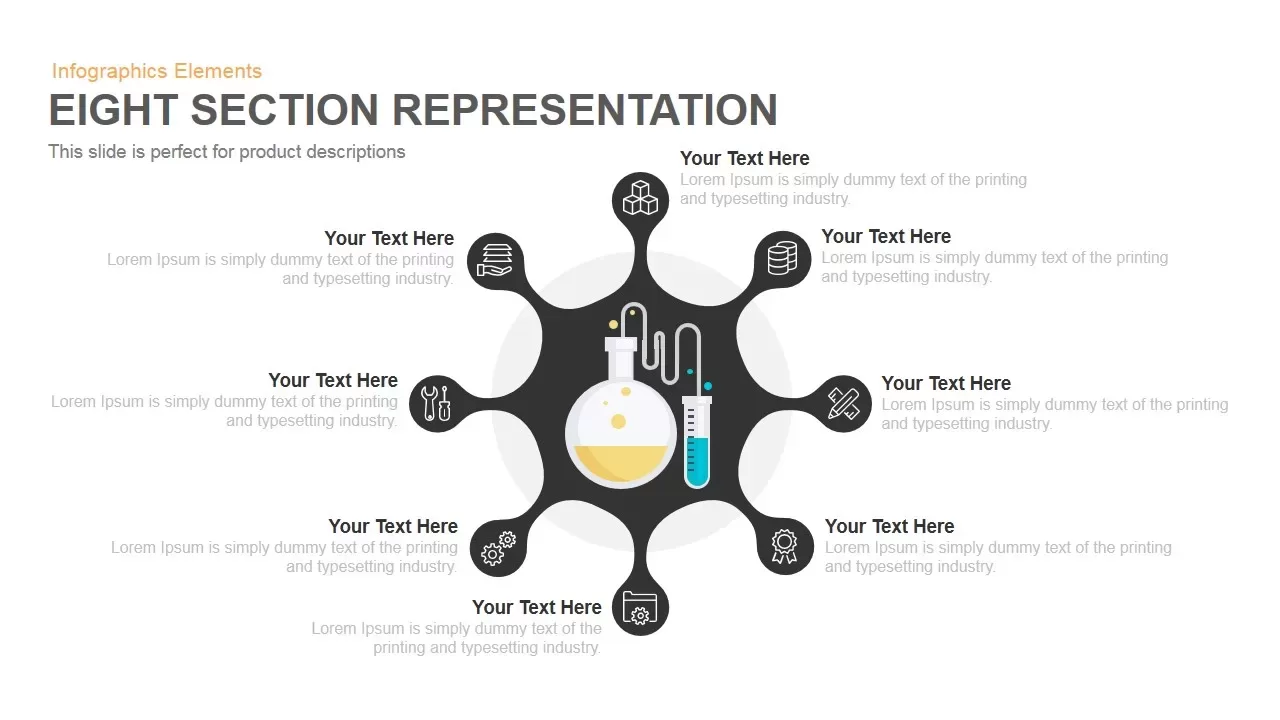
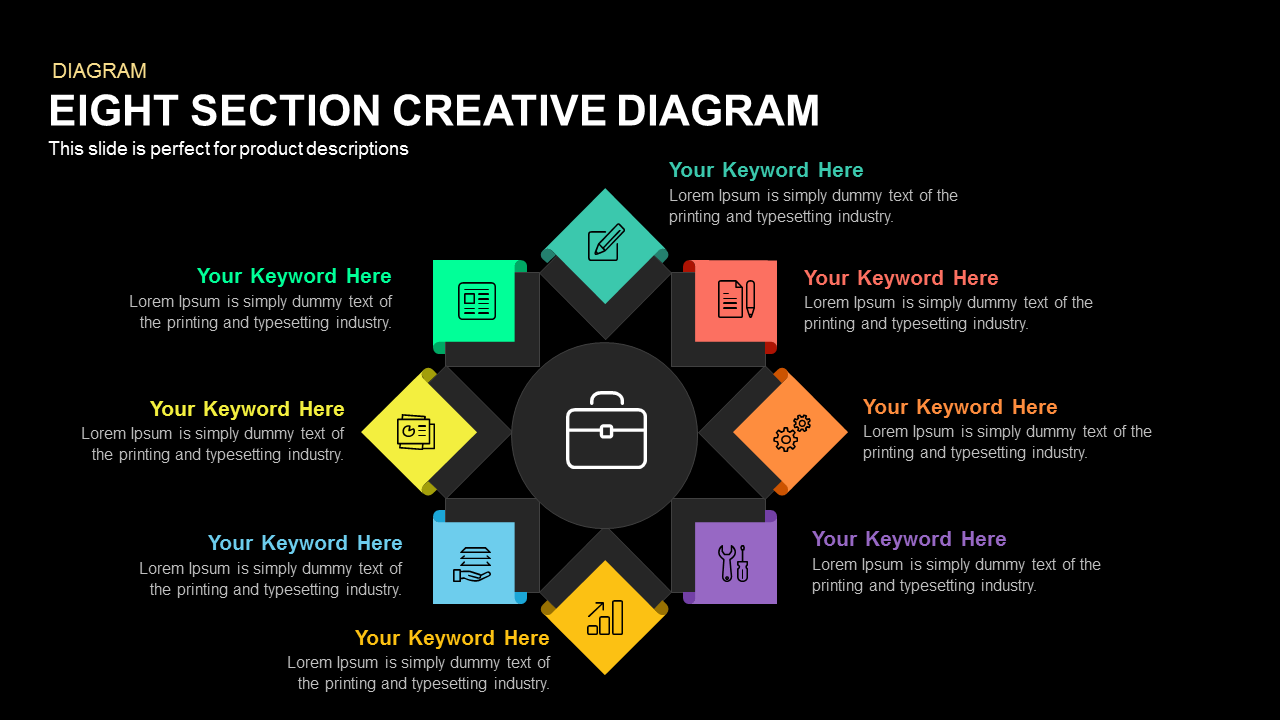
Eight Section Lab Infographic with Icons Template for PowerPoint & Google Slides
Circular
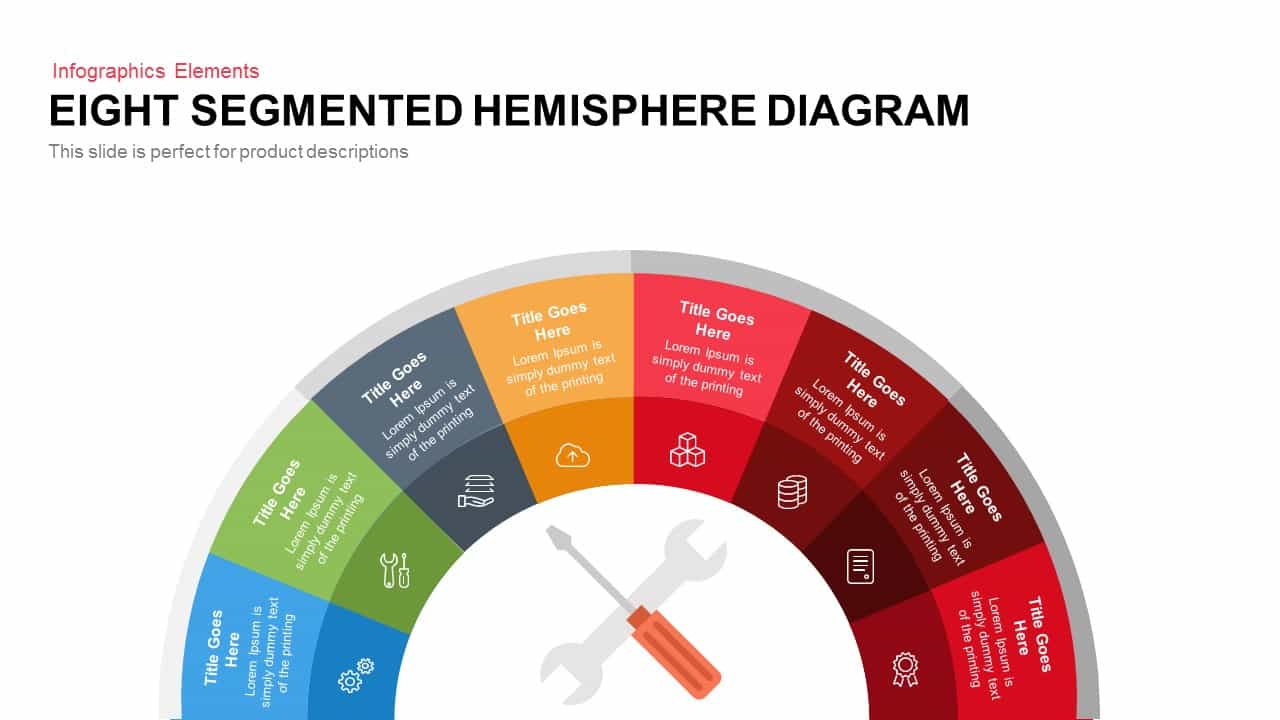
Eight Segmented Hemisphere Diagram Template for PowerPoint & Google Slides
Process
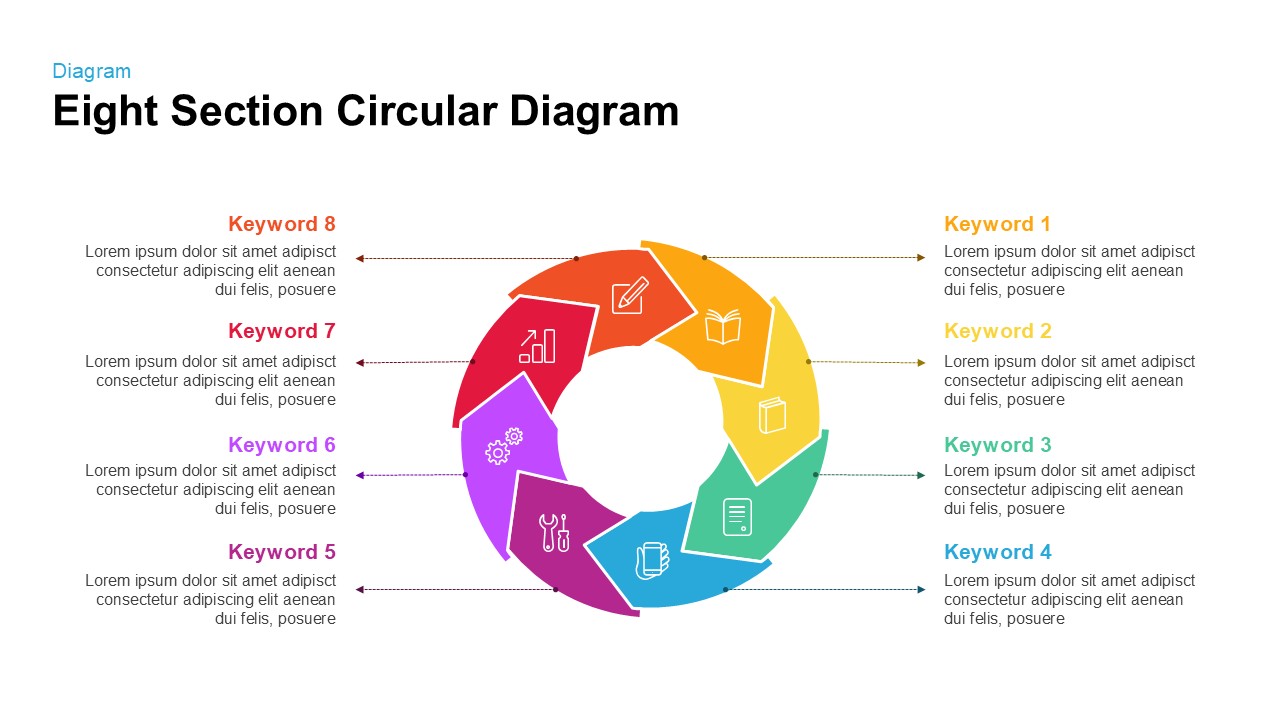
Eight Section Circular Diagram Template for PowerPoint & Google Slides
Circular
Eight Section Circular Diagram Template for PowerPoint & Google Slides
Circular
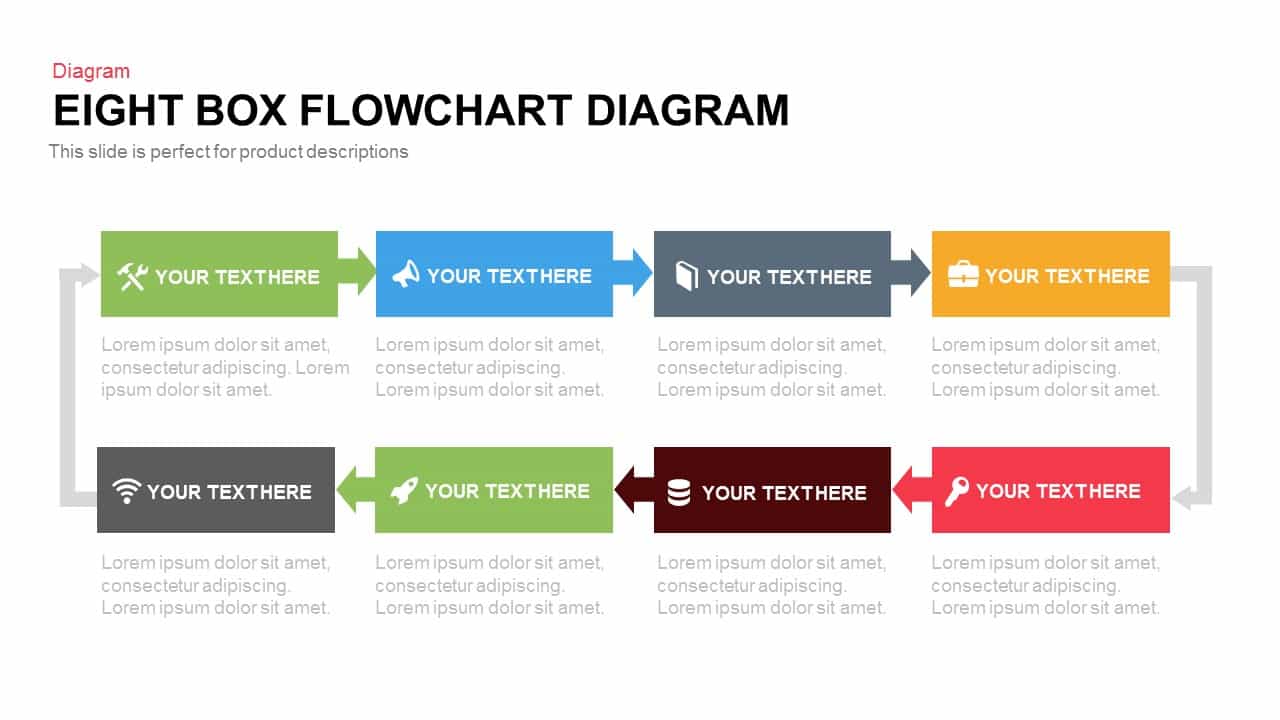
Eight Box Flowchart template for PowerPoint & Google Slides
Flow Charts
Eight-Section Circular Diagram template for PowerPoint & Google Slides
Circular

Eight Circle Diagram Template for PowerPoint & Google Slides
Circular
Eight Section Donut Chart Infographic Template for PowerPoint & Google Slides
Pie/Donut
Eight-Stage Circular Process Infographic Template for PowerPoint & Google Slides
Circular
Eight-Step Hub and Spoke Diagram Template for PowerPoint & Google Slides
Process
Eight Stage Process Diagram template for PowerPoint & Google Slides
Process

Eight Staged Diagram with Icons template for PowerPoint & Google Slides
Process
Free
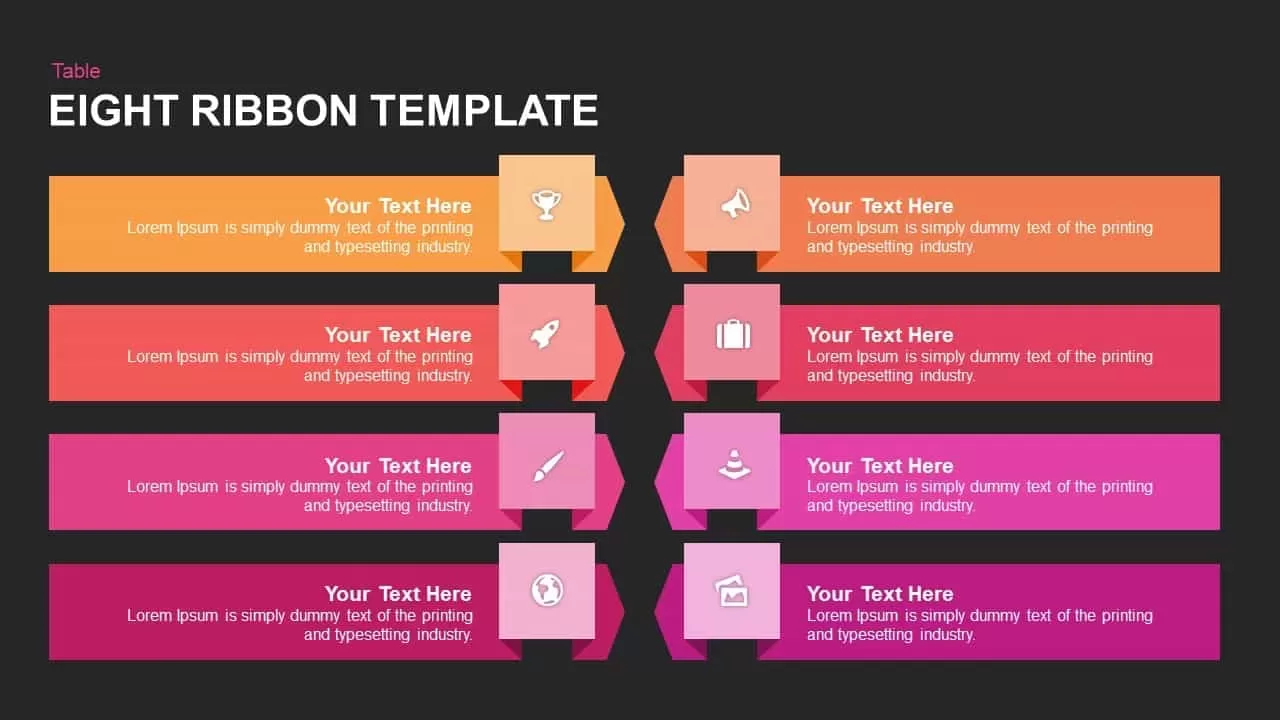
Multi-Color Eight-Step Ribbon Diagram Template for PowerPoint & Google Slides
Process
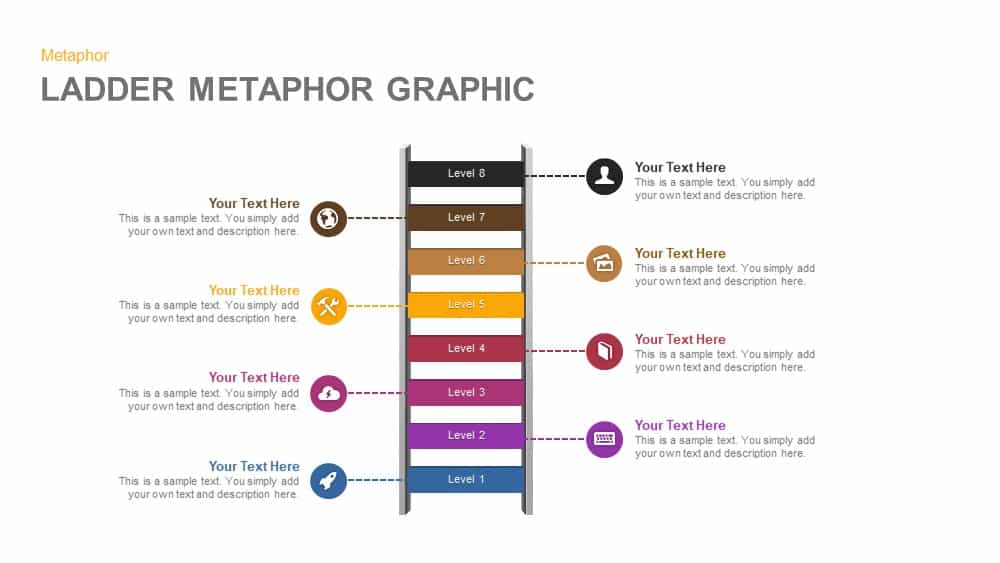
Eight-Level Ladder Metaphor Graphic Template for PowerPoint & Google Slides
Process

Eight-Stage Radial Process Flow Diagram Template for PowerPoint & Google Slides
Process
Eight-Step Circular Diagram Infographic Template for PowerPoint & Google Slides
Circular
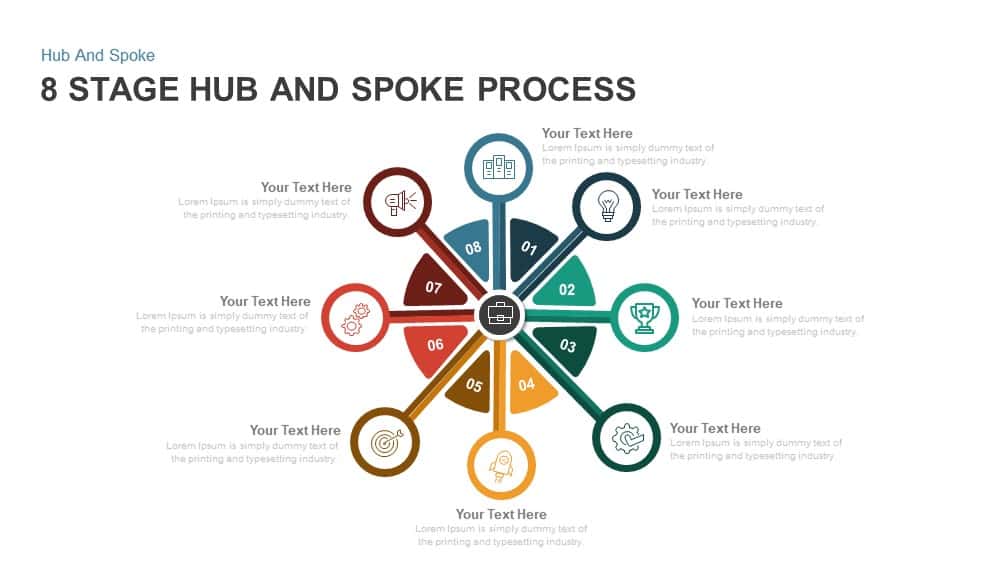
Eight-Stage Hub & Spoke Process Template for PowerPoint & Google Slides
Process
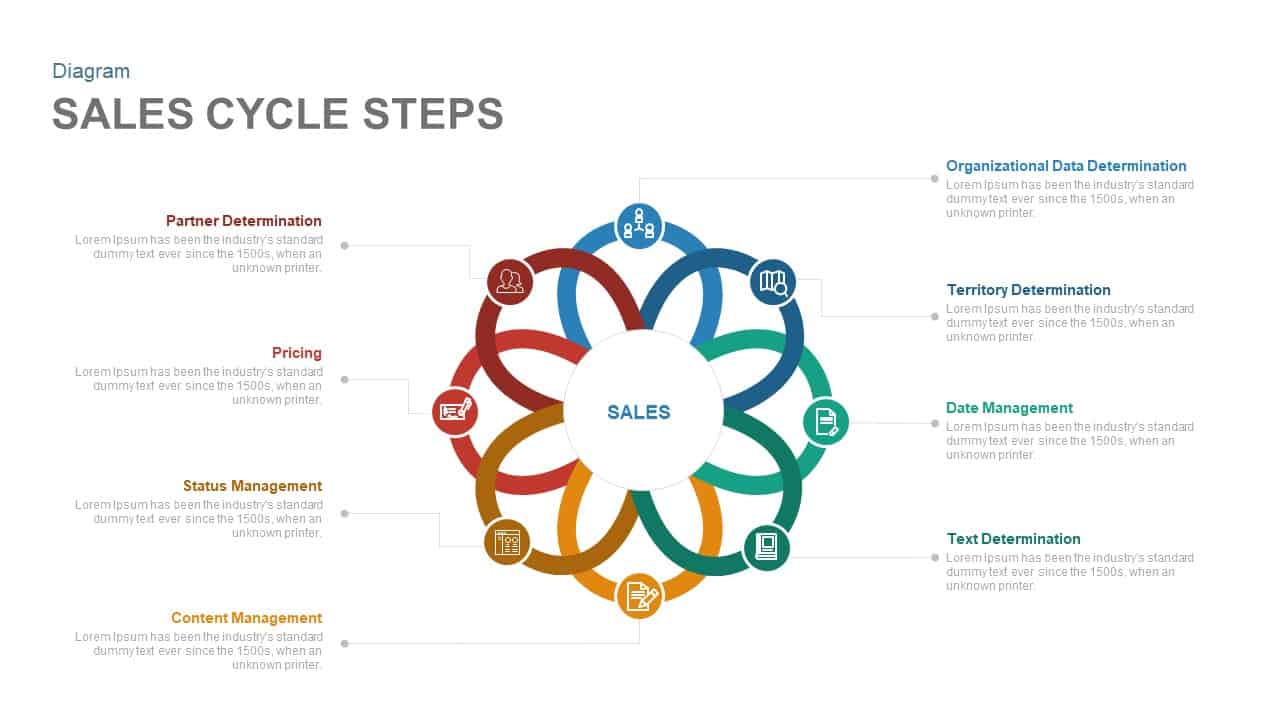
Eight-Step Sales Cycle Diagram Template for PowerPoint & Google Slides
Process
Eight Section Agenda Slide Layout Template for PowerPoint & Google Slides
Agenda
Eight Stage Hourglass Workflow Diagram Template for PowerPoint & Google Slides
Process
Eight-Step Brainstorming Process Diagram Template for PowerPoint & Google Slides
Process
Eight-Step New Product Survey Process Template for PowerPoint & Google Slides
Process
Corporate Meeting Agenda Eight-Step Template for PowerPoint & Google Slides
Agenda
Eight Step Circular Diagram Template for PowerPoint & Google Slides
Circular
Eight-Stage Gear Diagram Process Template for PowerPoint & Google Slides
Process

Eight-Node Mind Map Infographic Diagram Template for PowerPoint & Google Slides
Mind Maps
Eight-Item Central Idea Diagram Template for PowerPoint & Google Slides
Circular
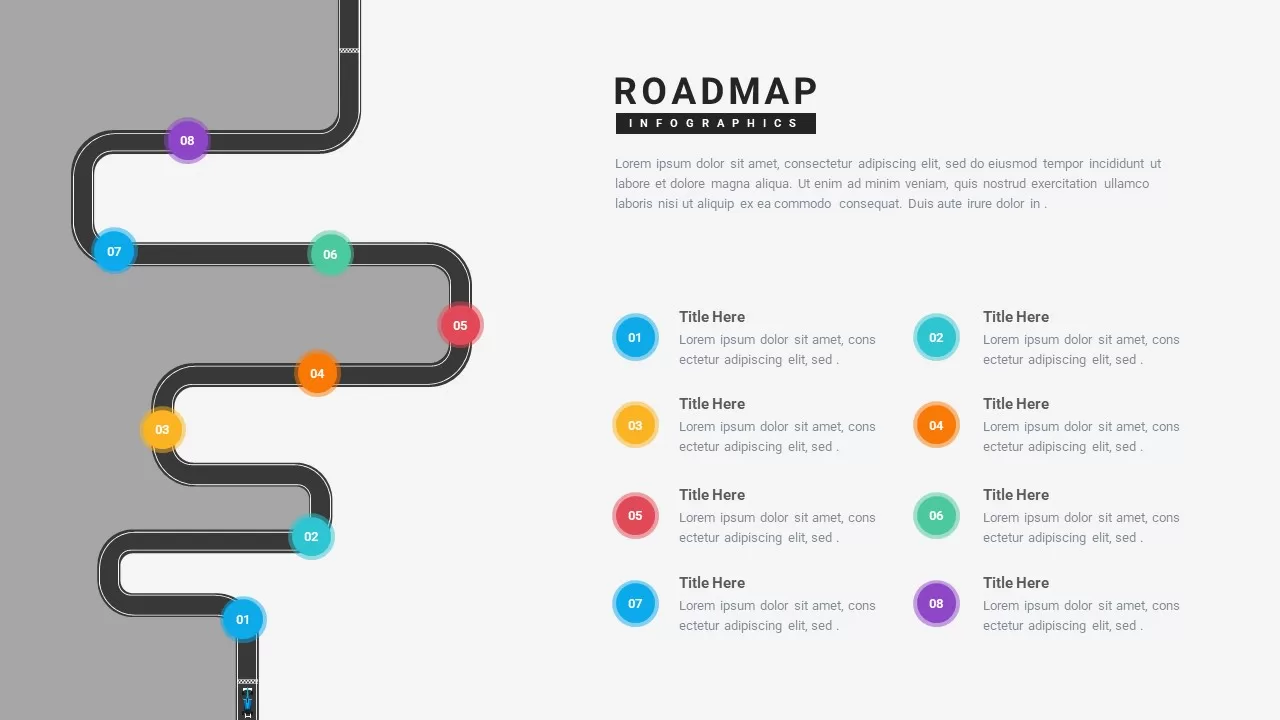
Eight-Step Winding Roadmap Infographic Template for PowerPoint & Google Slides
Roadmap
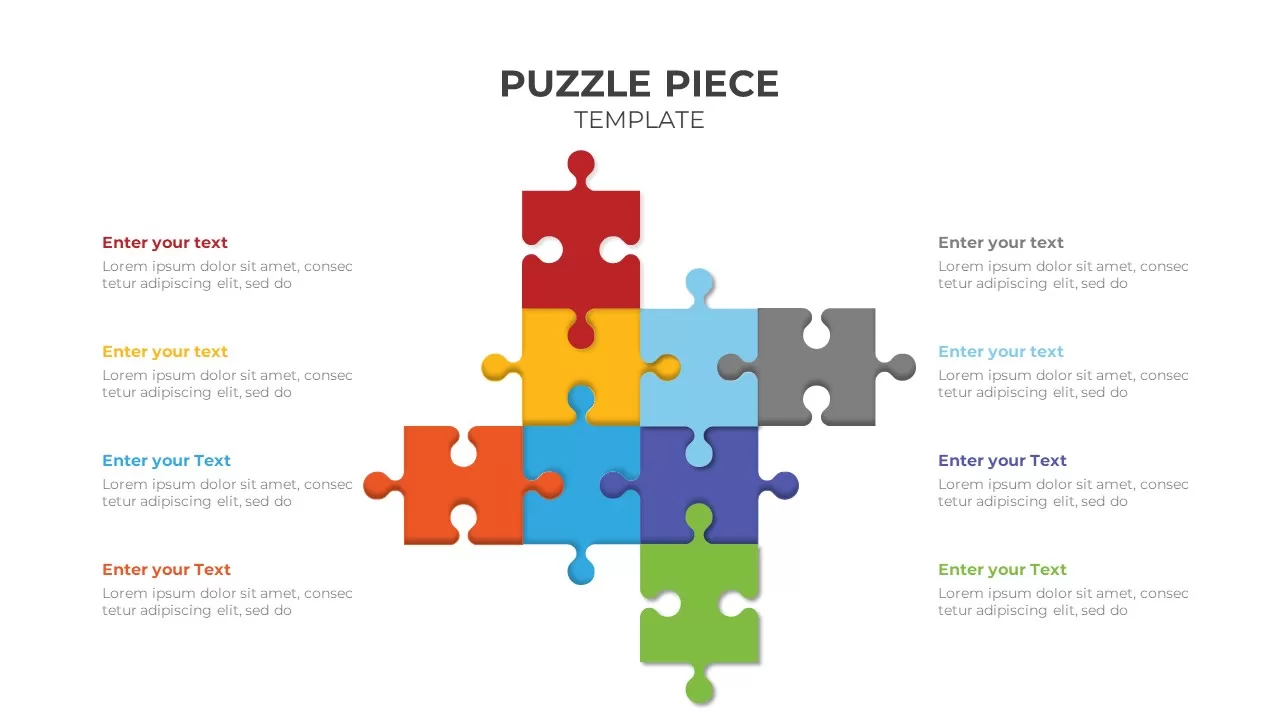
Colorful Eight-Piece Puzzle Diagram Template for PowerPoint & Google Slides
Process
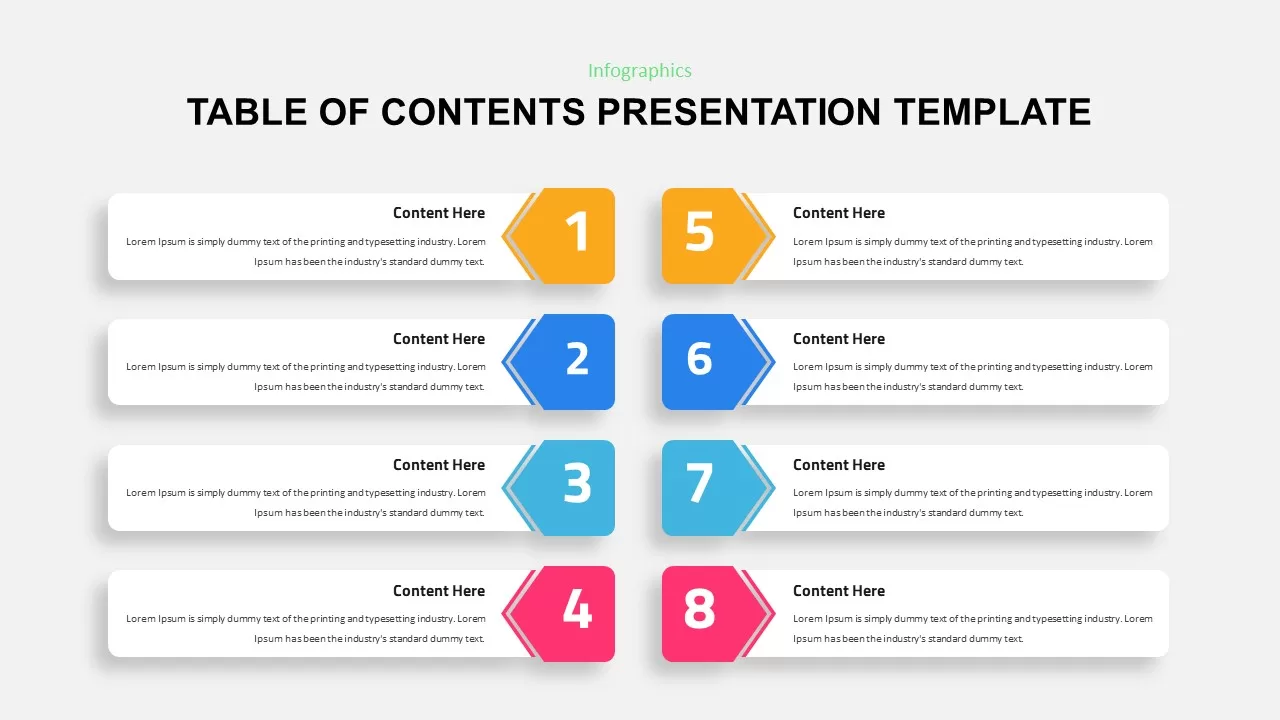
Eight-Step Colorful Table of Contents Template for PowerPoint & Google Slides
Infographics
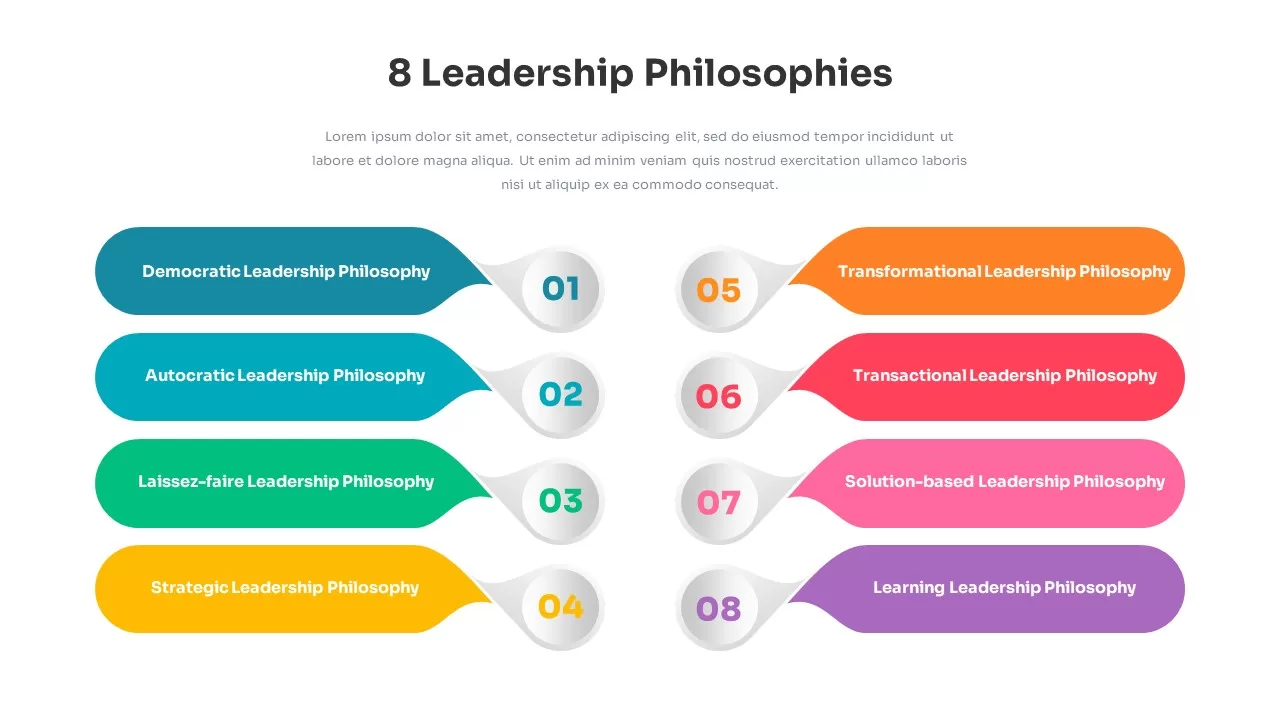
Eight Leadership Philosophies Diagram Template for PowerPoint & Google Slides
Leadership
Modern Custom Eight-Branch Mind Map Template for PowerPoint & Google Slides
Mind Maps
Eight-Step Job Hiring Mind Map Template for PowerPoint & Google Slides
Mind Maps
Zig Zag Eight-Point Timeline Diagram Template for PowerPoint & Google Slides
Timeline
Arrow Infographics template for PowerPoint & Google Slides
Infographics
3D Arrow Infographics Circular Flow Template for PowerPoint & Google Slides
Arrow
3D Four Arrow Infographics Diagram Template for PowerPoint & Google Slides
Arrow
5-Stage Arrow Infographics Process Flow Template for PowerPoint & Google Slides
Arrow
Four Arrow Square Infographics Template for PowerPoint & Google Slides
Arrow
Four Swoosh Arrow Infographics template for PowerPoint & Google Slides
Arrow
Arrow Step Infographics Workflow Template for PowerPoint & Google Slides
Arrow
Five Arrow Infographics Diagram Template for PowerPoint & Google Slides
Arrow
3D Four-Directional Arrow Infographics Template for PowerPoint & Google Slides
Arrow
Five-Stage Arrow Infographics Timeline Template for PowerPoint & Google Slides
Arrow
Timeline Arrow Infographics Diagram Template for PowerPoint & Google Slides
Timeline
Six-Stage Time Arrow Infographics Template for PowerPoint & Google Slides
Arrow
3D Arrow Infographics template for PowerPoint & Google Slides
Arrow
5-Step Growth Arrow Infographics Template for PowerPoint & Google Slides
Arrow
4 Step Arrow Diagram template for PowerPoint & Google Slides
Arrow
5-Step Arrow Diagram template for PowerPoint & Google Slides
Arrow
6-Step Arrow Process Diagram Template for PowerPoint & Google Slides
Process
Colorful Arrow Process Diagram Template for PowerPoint & Google Slides
Arrow
Arrow Process Diagram Template for PowerPoint & Google Slides
Process
Five Up Arrow Infographic Diagram Template for PowerPoint & Google Slides
Arrow
Dynamic Arrow Process Template for PowerPoint & Google Slides
Process
Improvement Growth Arrow Metaphor Template for PowerPoint & Google Slides
Bar/Column
Five-Stage Circle Arrow Diagram Template for PowerPoint & Google Slides
Circular
Six-Stage Arrow Timeline Diagram Template for PowerPoint & Google Slides
Timeline
Major Roadblocks to Success Arrow Template for PowerPoint & Google Slides
Arrow
Goal Arrow and Target Infographic Template for PowerPoint & Google Slides
Goals
Curved Arrow Process Flow Diagram Template for PowerPoint & Google Slides
Arrow
Curved Arrow Flow Diagram template for PowerPoint & Google Slides
Business
Dual-Stage Circular Arrow Cycle Template for PowerPoint & Google Slides
Process
Four-Step Curved Arrow Process Template for PowerPoint & Google Slides
Process
Curved Arrow Process Flow template for PowerPoint & Google Slides
Process
Four-Stage Circle Arrow Infographic Template for PowerPoint & Google Slides
Circular
Hand-Drawn Four-Step Curved Arrow Diagram Template for PowerPoint & Google Slides
Arrow
Pentagon Arrow Process Diagram Template for PowerPoint & Google Slides
Process
Four-Step Arrow Reference Diagram Slide Template for PowerPoint & Google Slides
Arrow
Bow and Arrow Goal Infographic Slide Template for PowerPoint & Google Slides
Goals
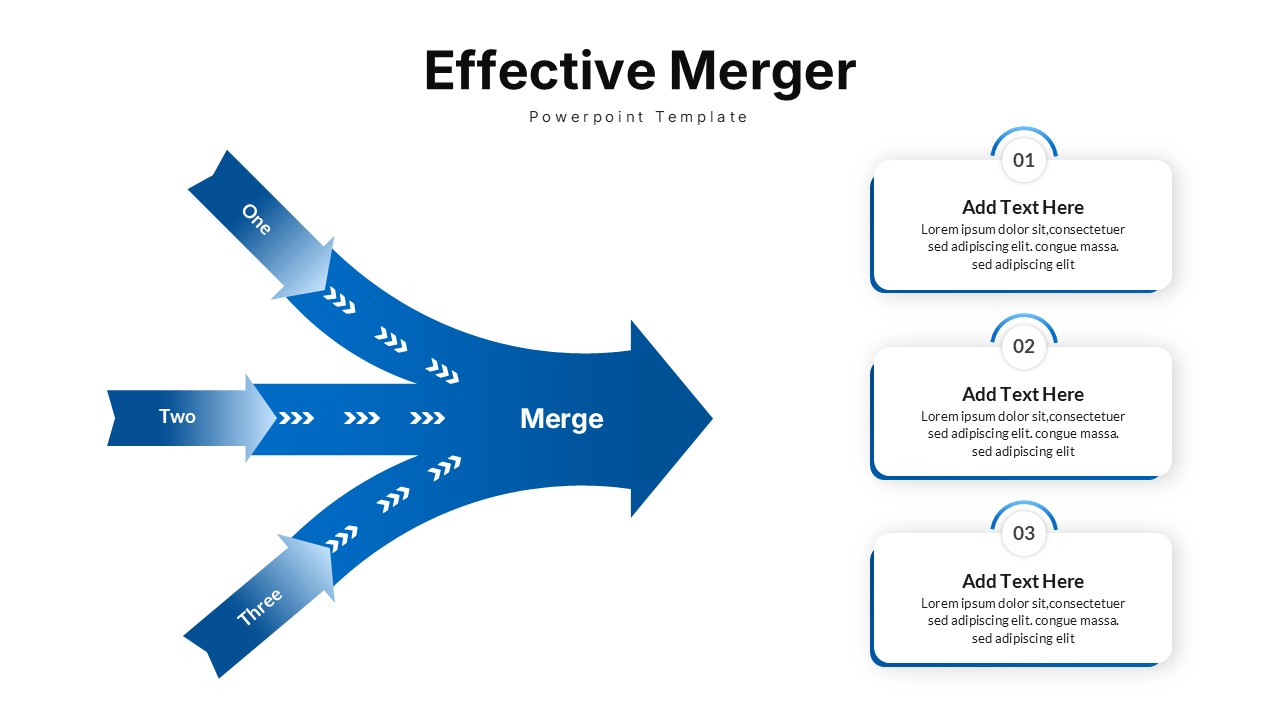
Effective Merger Arrow Diagram Template for PowerPoint & Google Slides
Arrow