Economies of Scale Cost Curve Comparison Template for PowerPoint & Google Slides


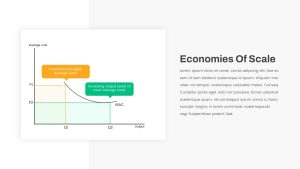
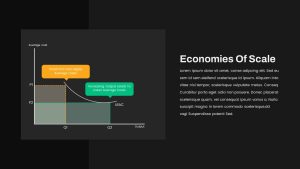
Visualize the long-run average cost dynamics with this clean, two-point comparison slide depicting economies of scale. The slide features a crisp LRAC curve plotted against output, with customizable callouts highlighting higher average costs at low output (Q1, P1) in orange and cost reductions at increased output (Q2, P2) in green. A shaded area under the curve emphasizes cost differentials, while minimalist axes and labels maintain focus on your key message.
Built on fully editable master slides, you can adjust curve shapes, color schemes, and annotation text in seconds—ideal for aligning with corporate branding or academic styling. High-resolution vector graphics ensure flawless scaling across screens and printouts, and drag-and-drop placeholders let you insert additional icons or KPI figures as needed. With consistent typography and ample white space, this slide balances analytical rigor and visual clarity for maximum audience engagement.
Optimized for PowerPoint and Google Slides, the template preserves layout integrity across platforms and devices, eliminating formatting inconsistencies. Whether you’re teaching microeconomics, presenting operational cost analyses, or briefing stakeholders on production scaling strategies, this LRAC cost curve comparison slide streamlines your storytelling and drives home the benefits of scale with precision.
Who is it for
Economists, business analysts, finance professionals, operations managers, and academic instructors will find this slide essential for illustrating cost-output relationships, classroom lectures, investor briefings, or internal strategy sessions.
Other Uses
Beyond economies of scale, repurpose this slide to compare performance metrics, plot learning curves, showcase efficiency gains, or highlight before-and-after KPI analyses. Customize callouts and shading to suit any two-point comparison scenario across business, academic, or technical presentations.
Login to download this file

Item ID
SB04294
Related Templates

Scale Metaphor Metrics Comparison Template for PowerPoint & Google Slides
Charts

Adam’s Equity Theory Scale Comparison Template for PowerPoint & Google Slides
Comparison
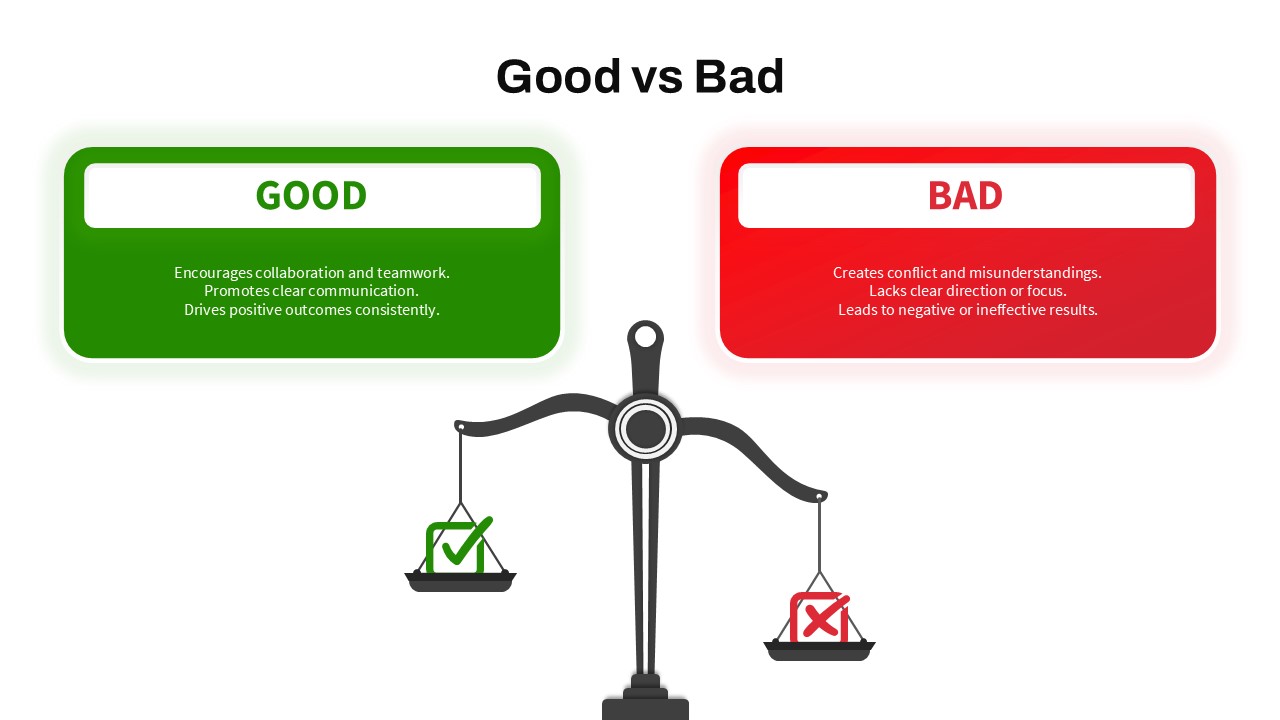
Good vs Bad Comparison with Scale Template for PowerPoint & Google Slides
Comparison
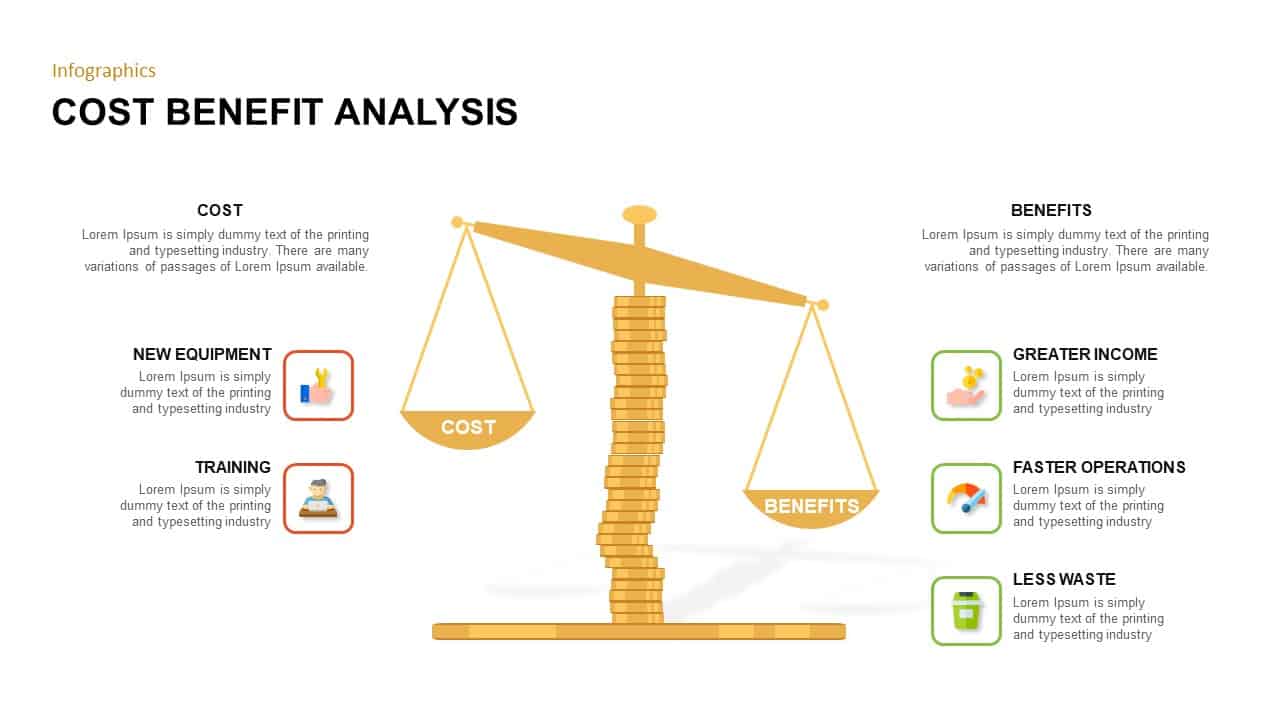
Cost Benefit Analysis Comparison Template for PowerPoint & Google Slides
Comparison
Interactive Multi-Use Cost Comparison Template for PowerPoint & Google Slides
Comparison
Emoji Scale PowerPoint Diagram for PowerPoint & Google Slides
Infographics
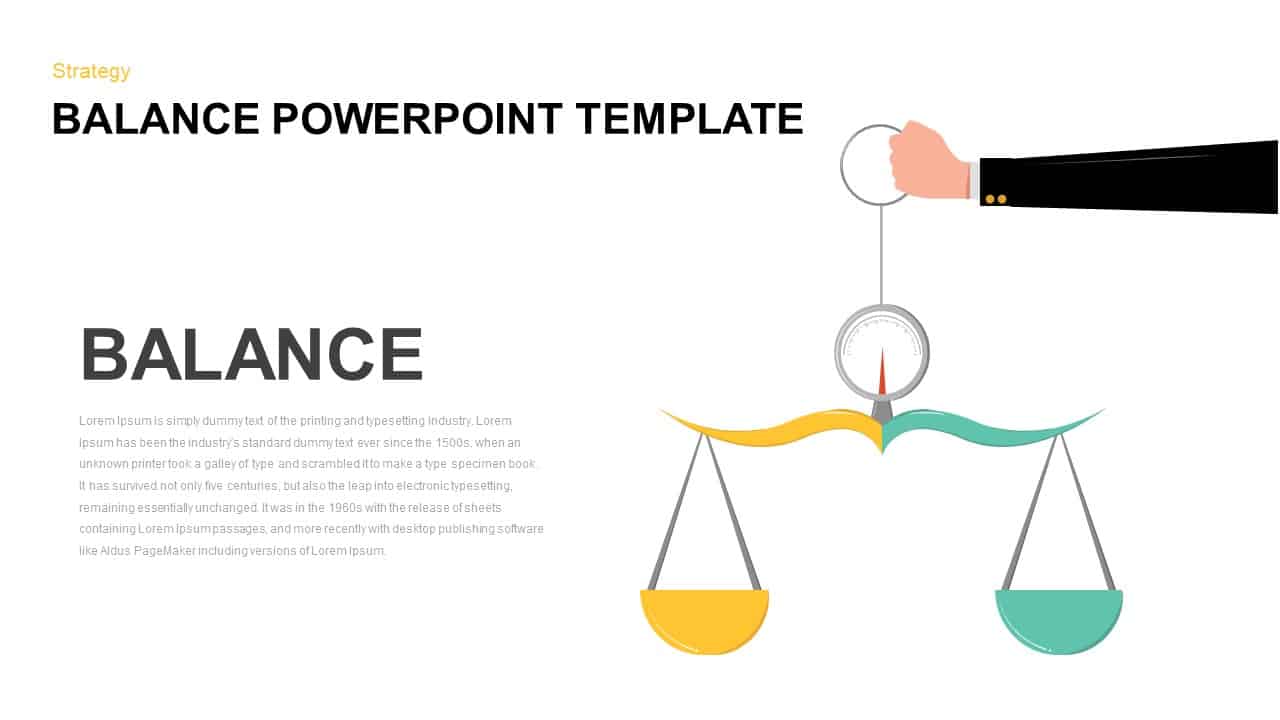
Mustard and Navy Balance Scale Metaphor Template for PowerPoint & Google Slides
Comparison
Balance Scale Visualization Infographic Template for PowerPoint & Google Slides
Comparison
IQ Scale Analysis Diagram template for PowerPoint & Google Slides
Employee Performance
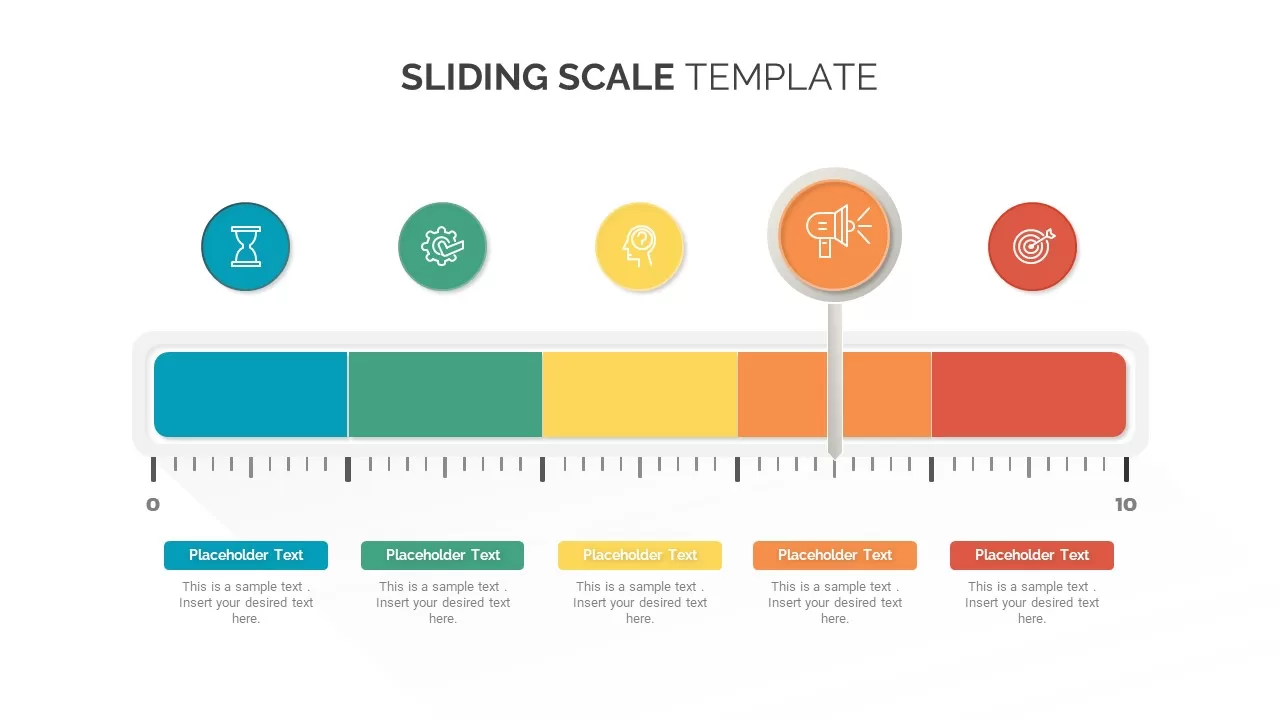
Sliding Scale template for PowerPoint & Google Slides
Business
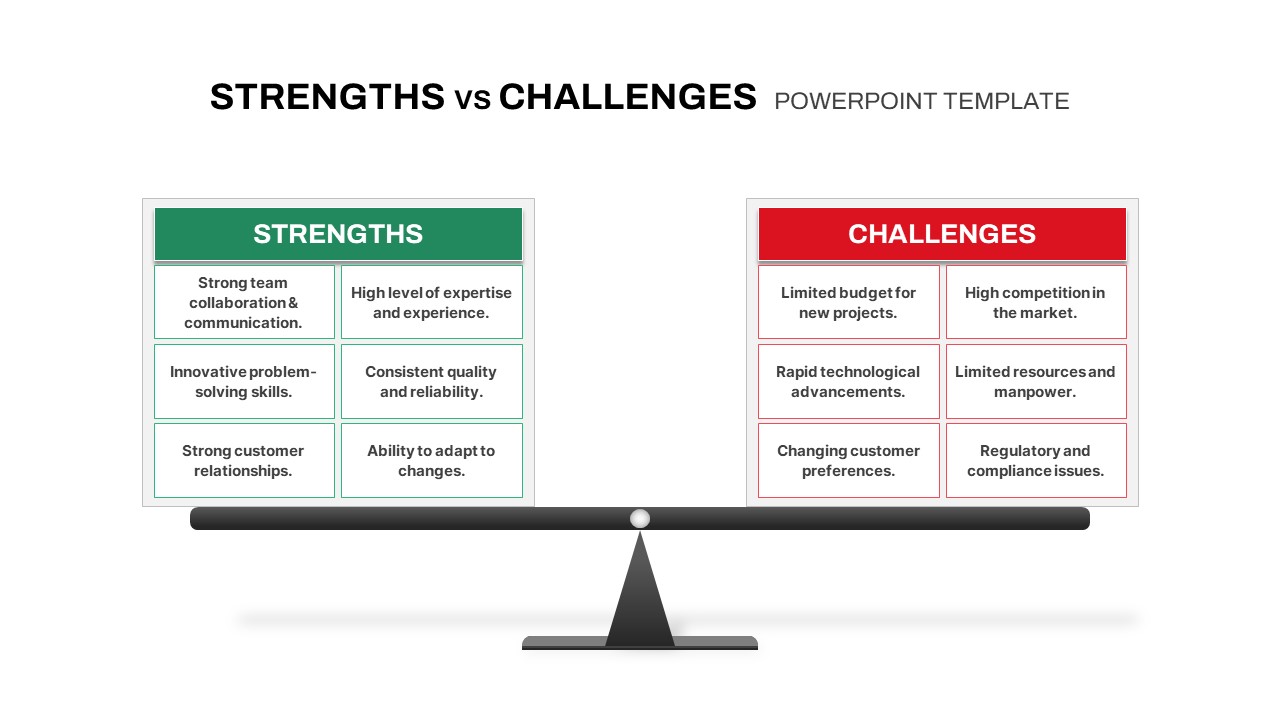
Strengths vs Challenges Weighing Scale Template for PowerPoint & Google Slides
Opportunities Challenges
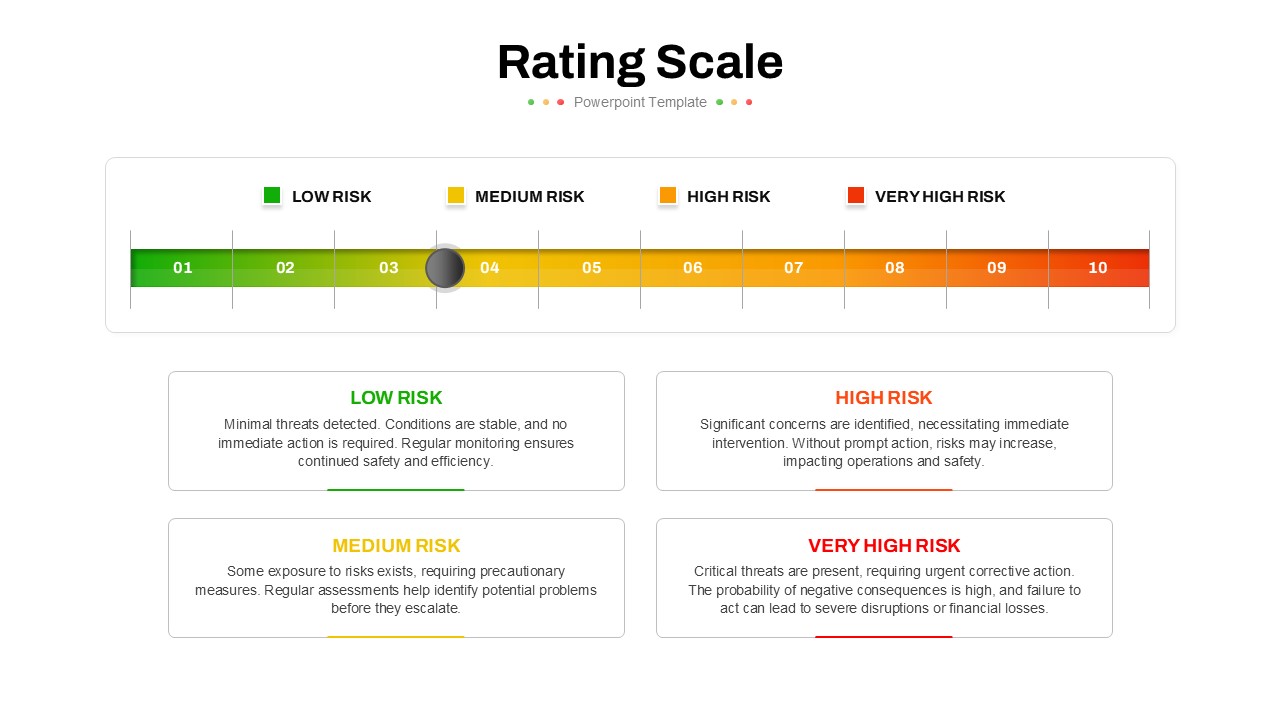
Five-Point Rating Scale Feedback Template for PowerPoint & Google Slides
Employee Performance
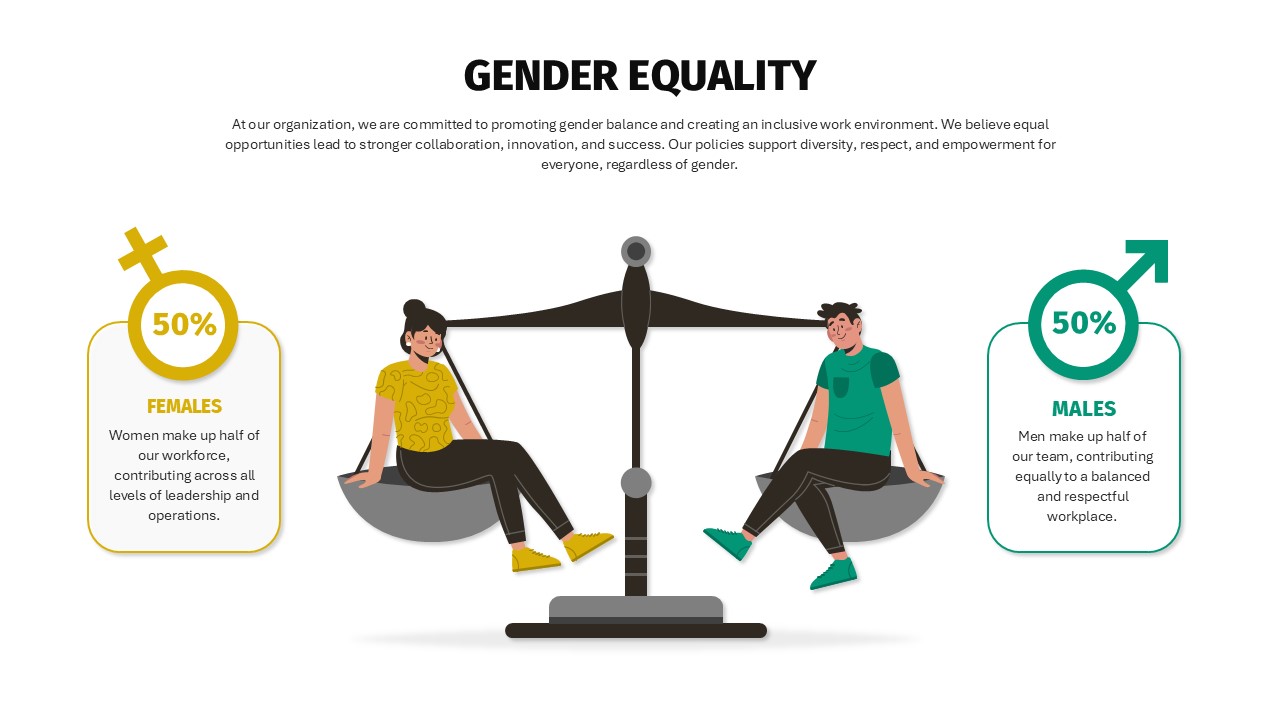
Balanced Gender Equality Scale Infographic Template for PowerPoint & Google Slides
Comparison
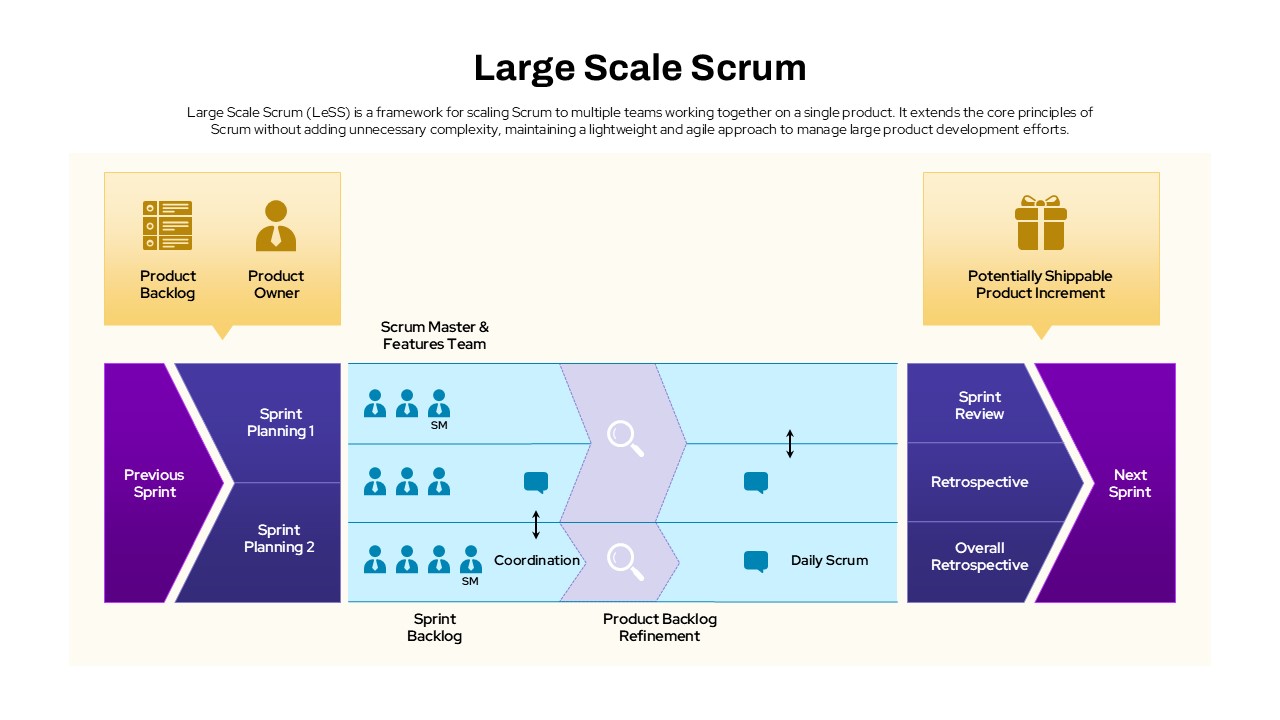
Large Scale Scrum Framework Process Template for PowerPoint & Google Slides
Scrum
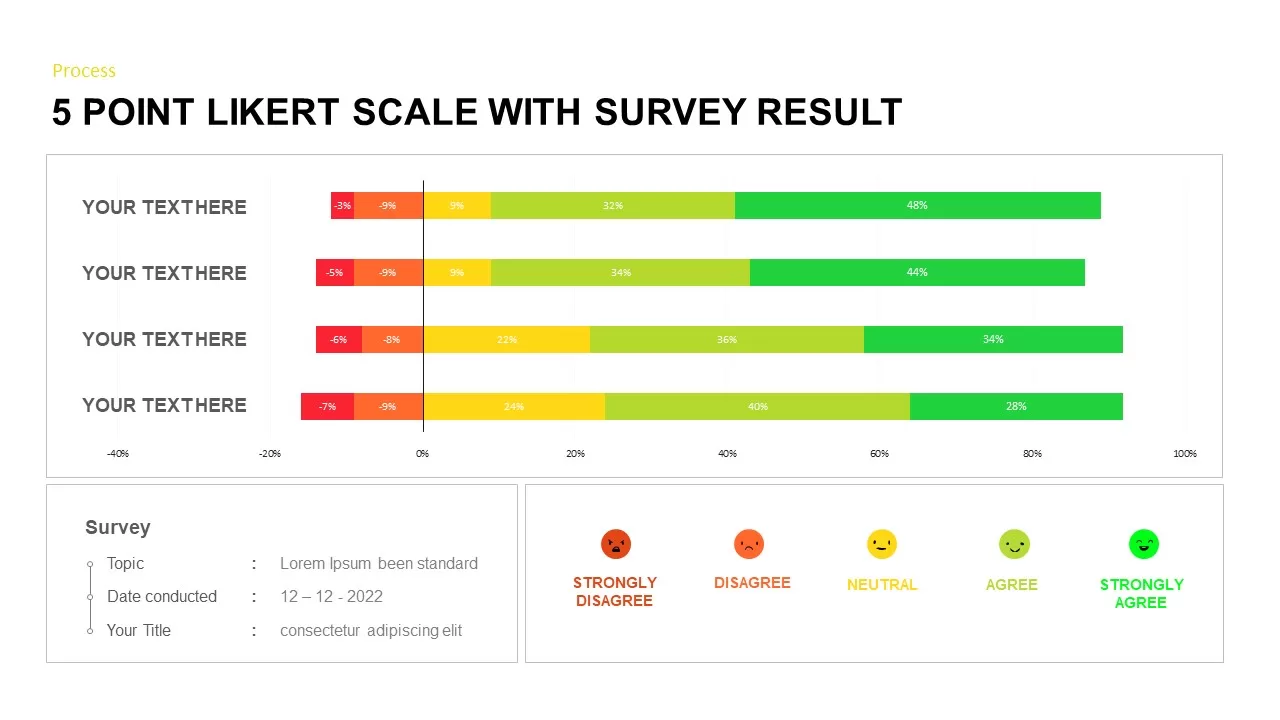
Likert Scale Survey Results infographic pack for PowerPoint & Google Slides
Business
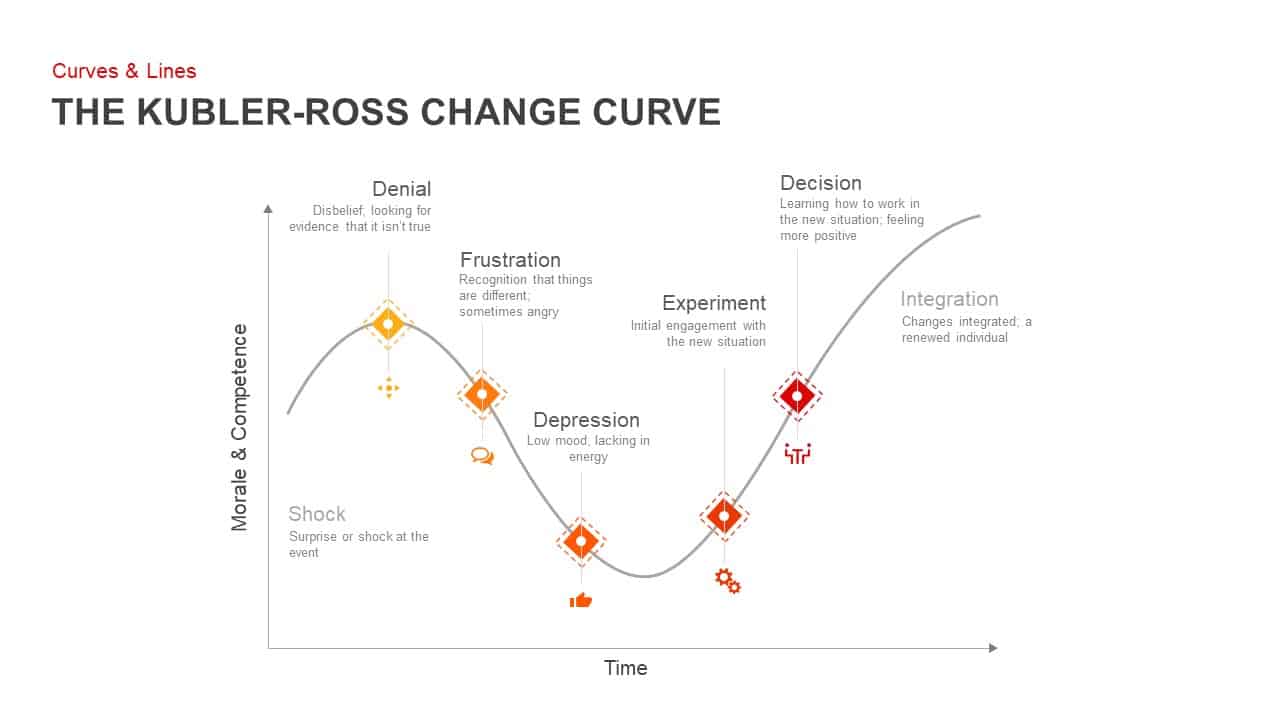
Kubler-Ross Change Curve Diagram Template for PowerPoint & Google Slides
Timeline
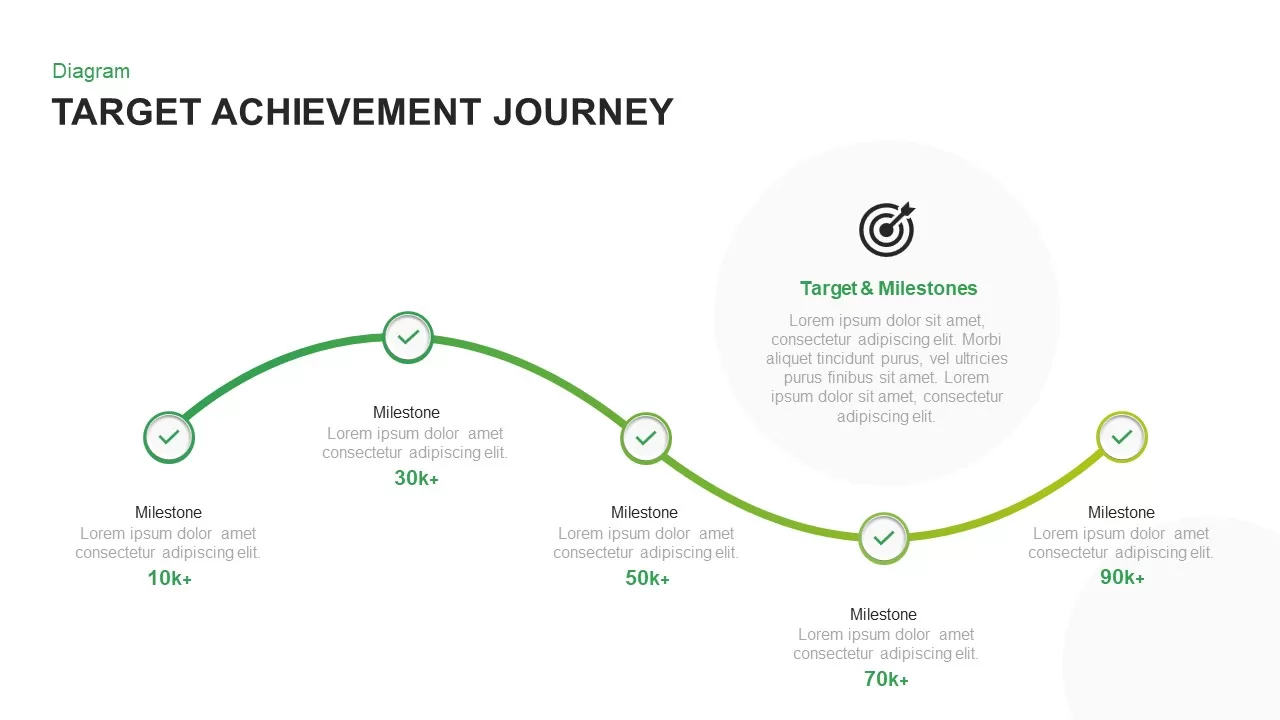
Target Achievement Milestone Curve Template for PowerPoint & Google Slides
Roadmap

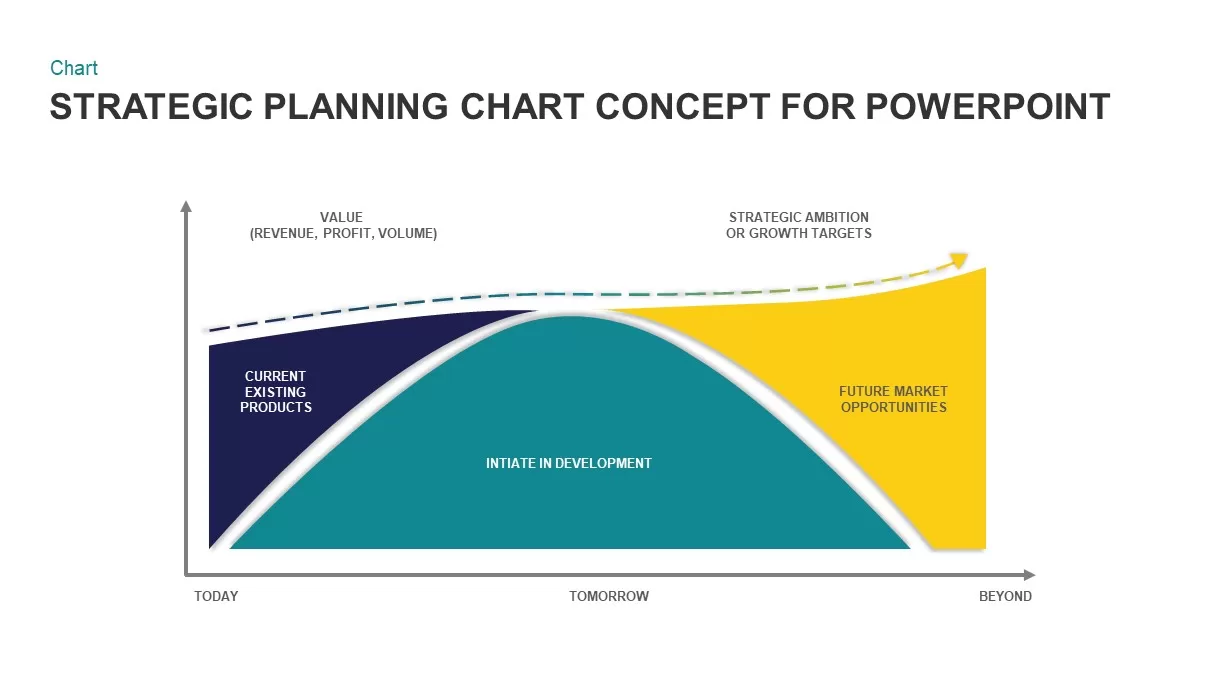
Strategic Planning Curve Diagram Template for PowerPoint & Google Slides
Charts
Greiner’s Growth Model Curve template for PowerPoint & Google Slides
Infographics
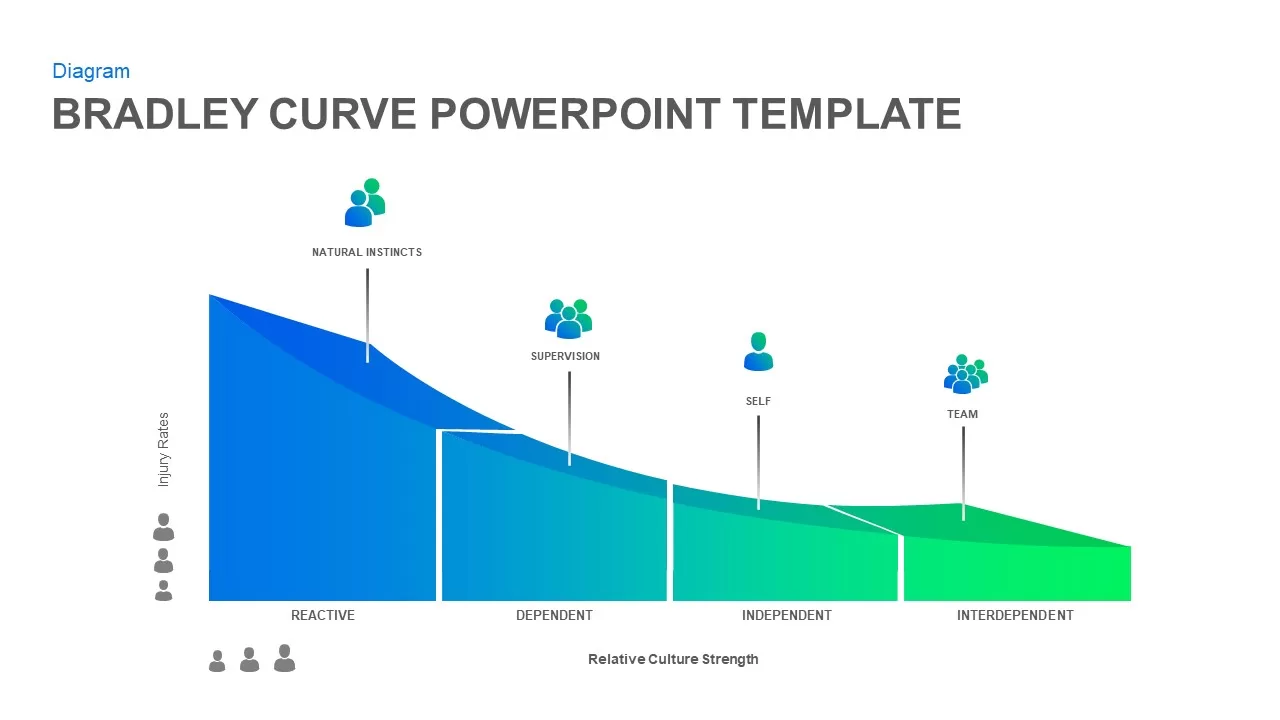
Bradley Curve Infographic Template for PowerPoint & Google Slides
Infographics
Snake Shaped Curve Diagram template for PowerPoint & Google Slides
Business
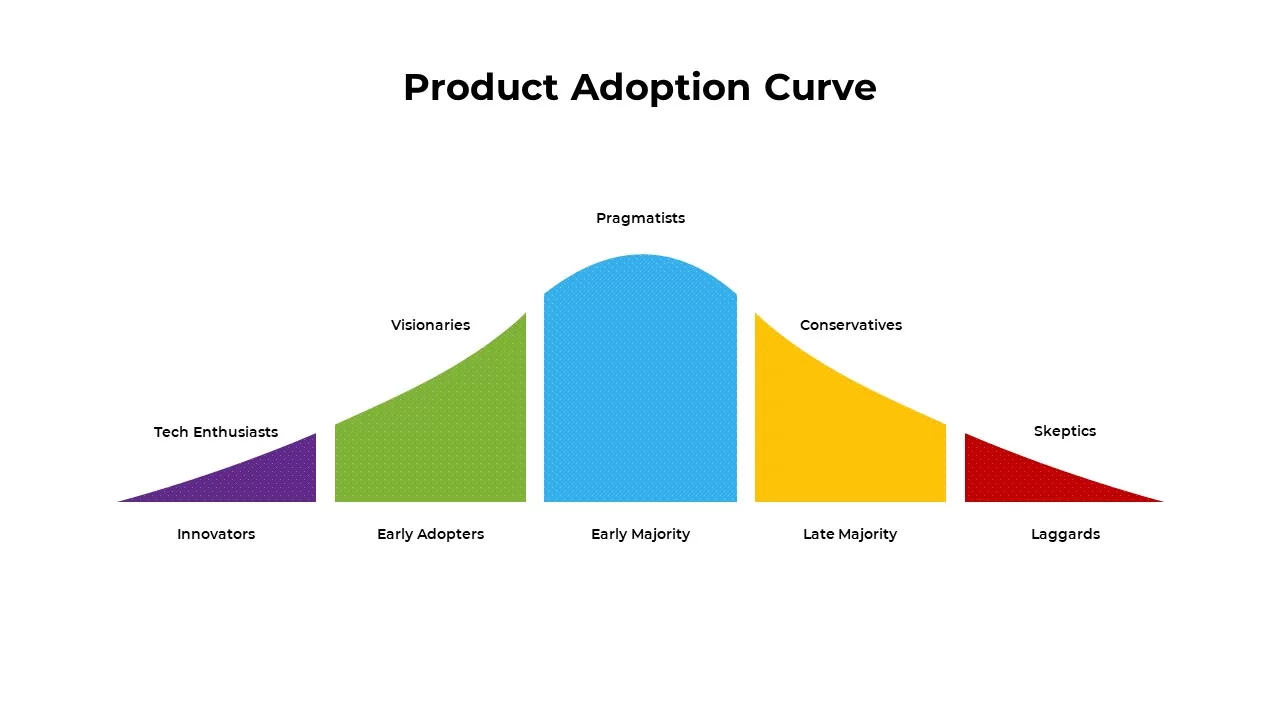
Product Adoption Curve Template for PowerPoint & Google Slides
Process
8-Bell Curve Infographic Slide Template for PowerPoint & Google Slides
Comparison Chart
S-Curve Progression Framework Diagram Template for PowerPoint & Google Slides
Charts
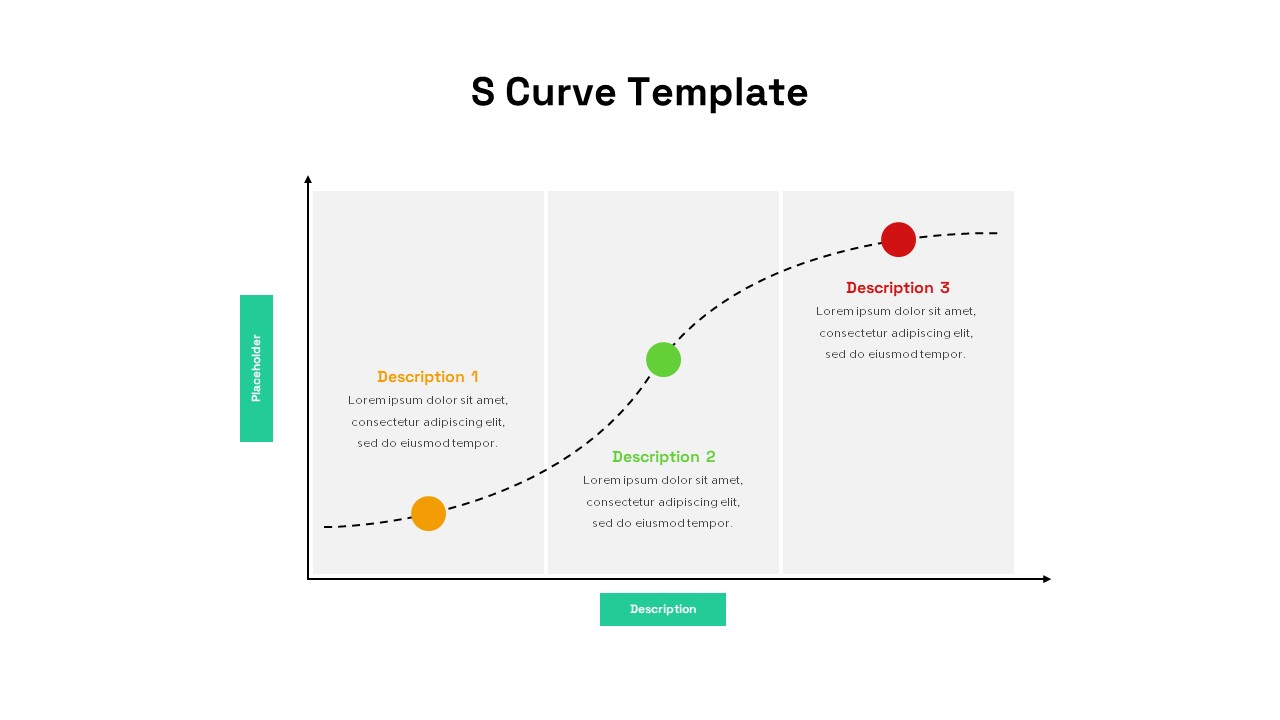
Three-Stage S Curve Growth Diagram Template for PowerPoint & Google Slides
Process
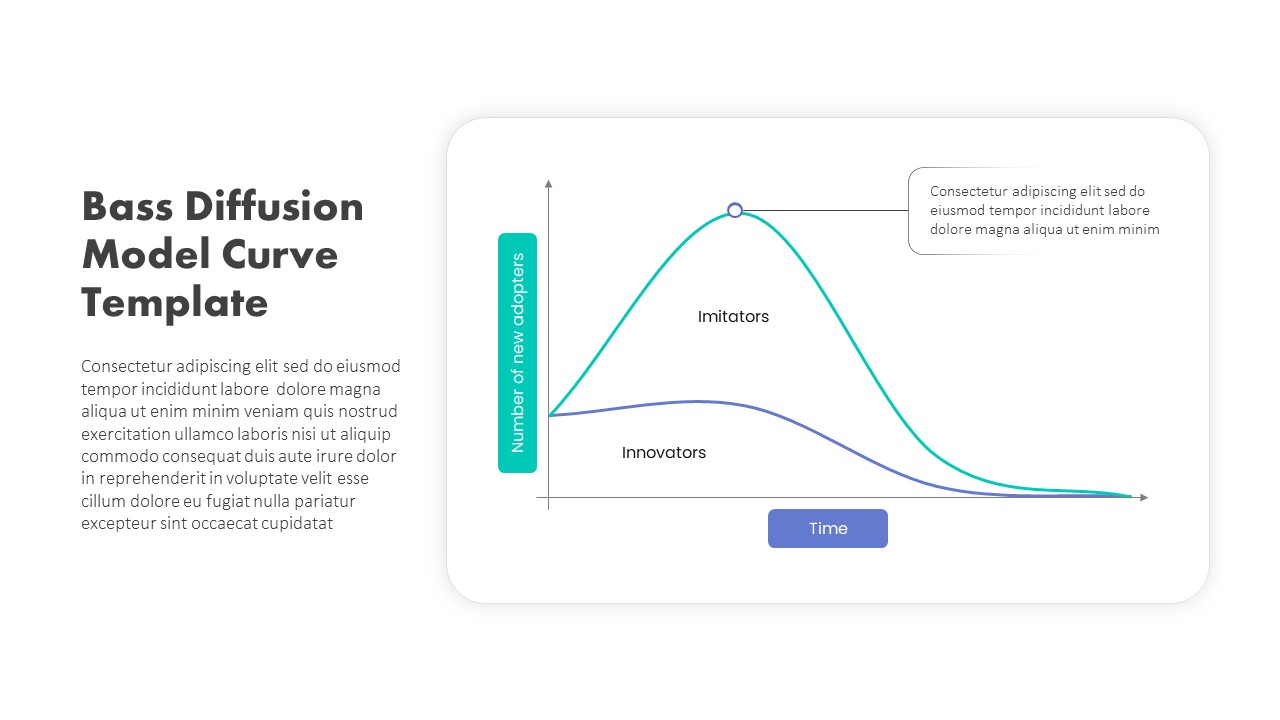
Bass Diffusion Model Curve for Adoption Template for PowerPoint & Google Slides
Comparison Chart
Growth Curve Line Chart Visualization Template for PowerPoint & Google Slides
Charts
Experience Curve Analysis Diagram Template for PowerPoint & Google Slides
Business Strategy
Gartner Hype Cycle Adoption Curve Diagram Template for PowerPoint & Google Slides
Infographics
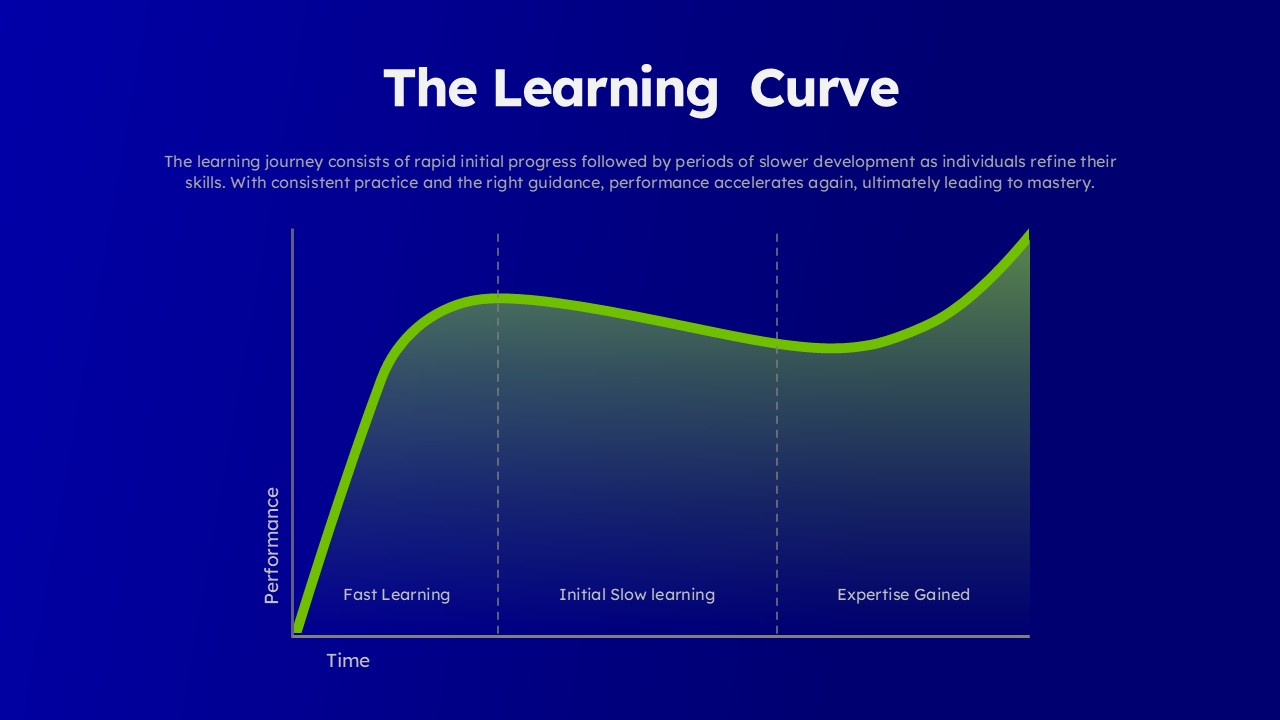
Learning Curve Performance Growth Chart Template for PowerPoint & Google Slides
Employee Performance
Cost Management Process template for PowerPoint & Google Slides
Process
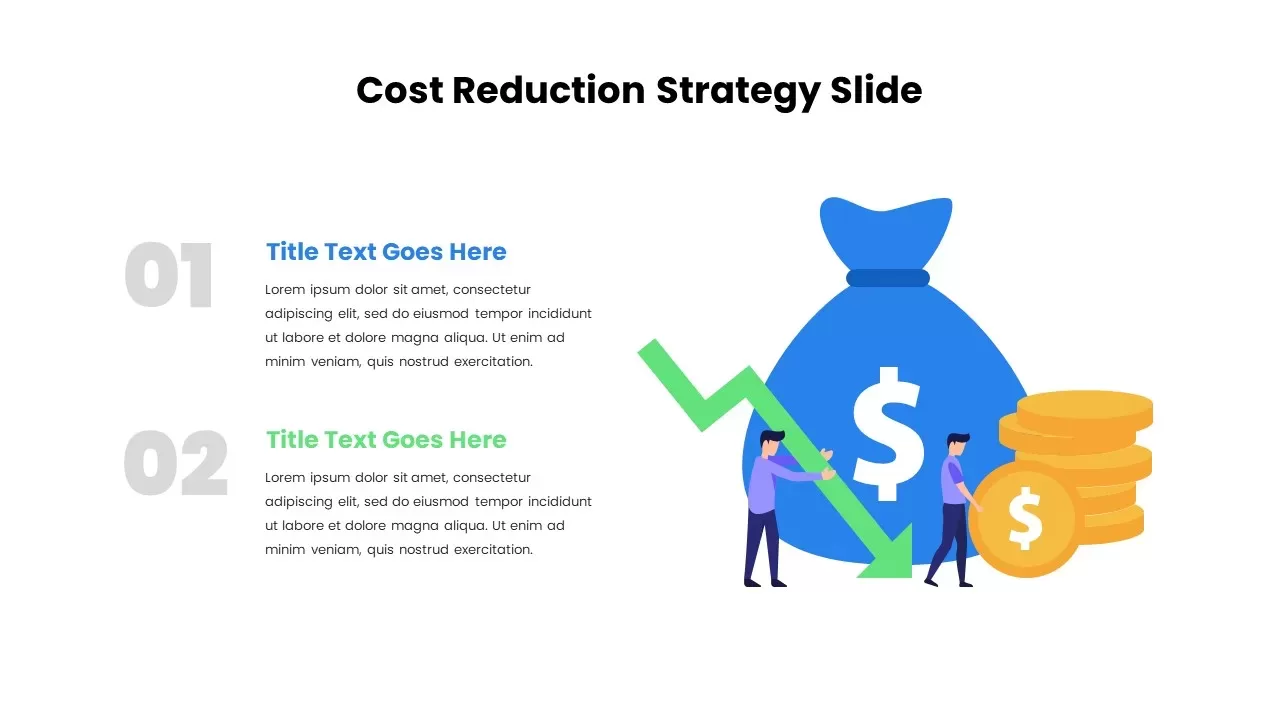
Cost Reduction Strategy template for PowerPoint & Google Slides
Business Strategy
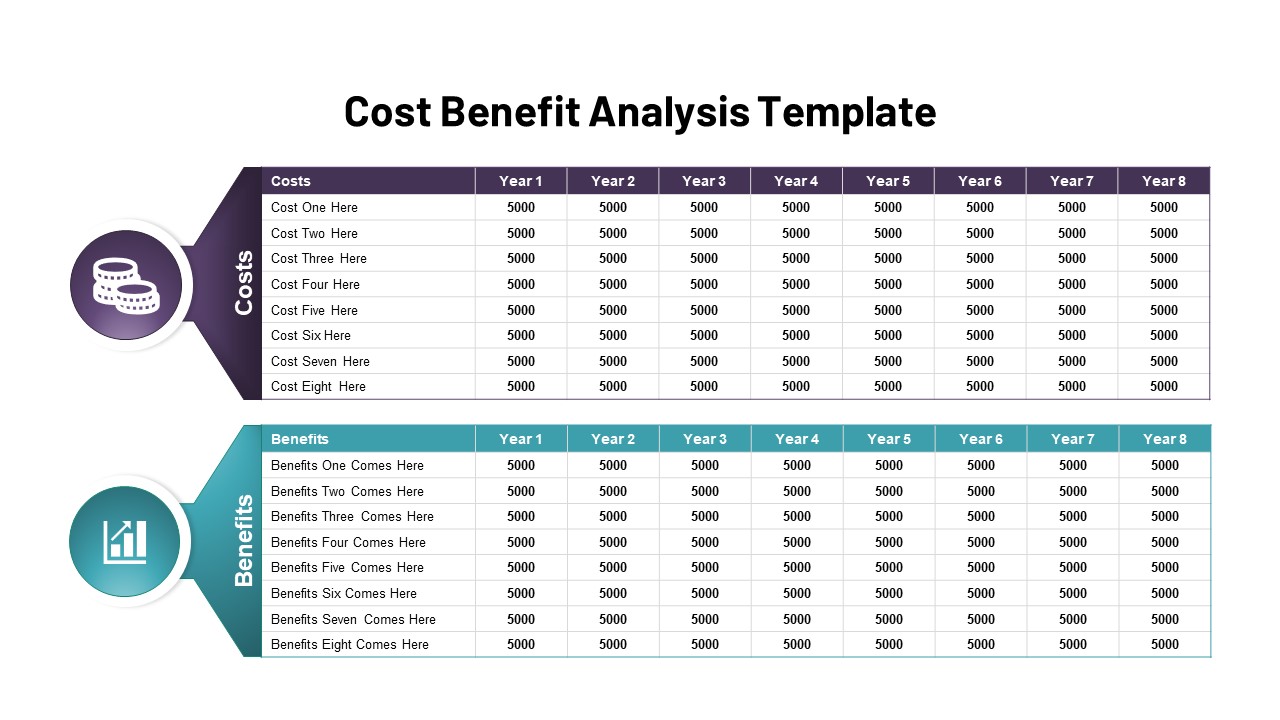
Dual-Color Cost vs Benefit Analysis Template for PowerPoint & Google Slides
Comparison
Four-Step Cost Reduction Strategy Template for PowerPoint & Google Slides
Process
Cost Reduction Strategy Donut Chart Template for PowerPoint & Google Slides
Pie/Donut
Cost Reduction Infographic Template for PowerPoint & Google Slides
Process
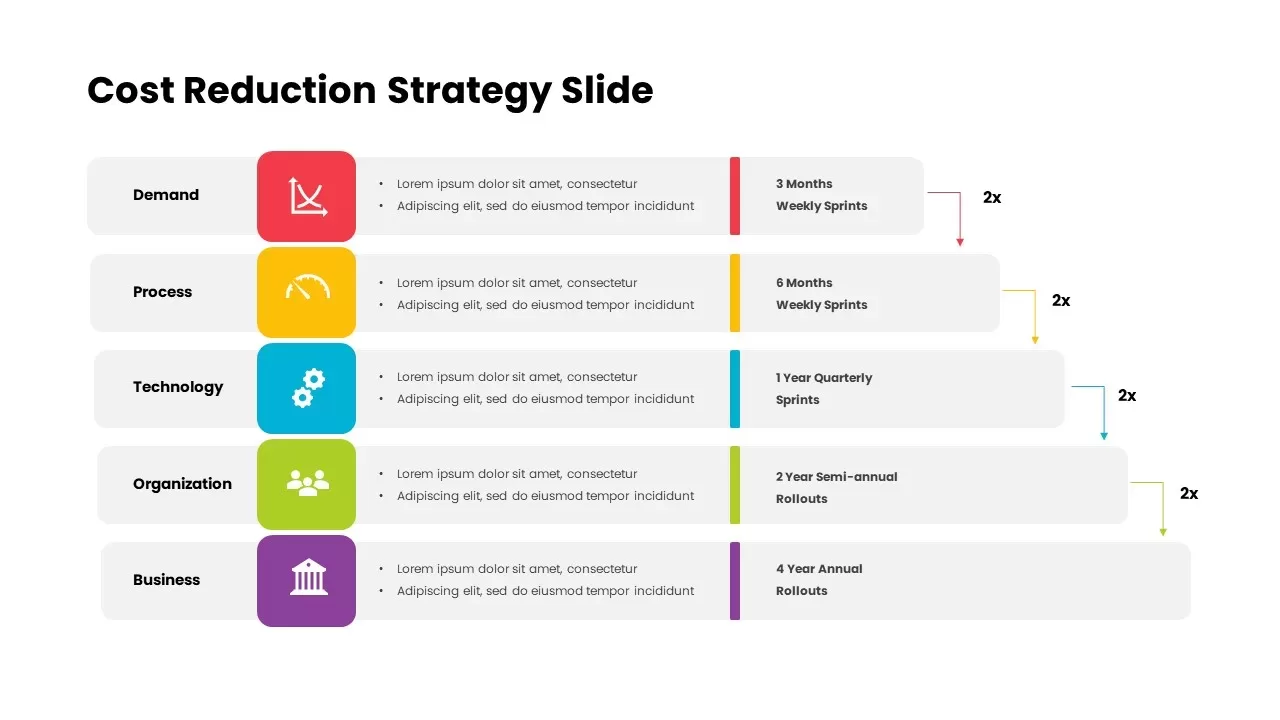
Cost Reduction Strategy Roadmap Template for PowerPoint & Google Slides
Business Strategy
Cost Cutting Savings Dashboard Template for PowerPoint & Google Slides
Pie/Donut
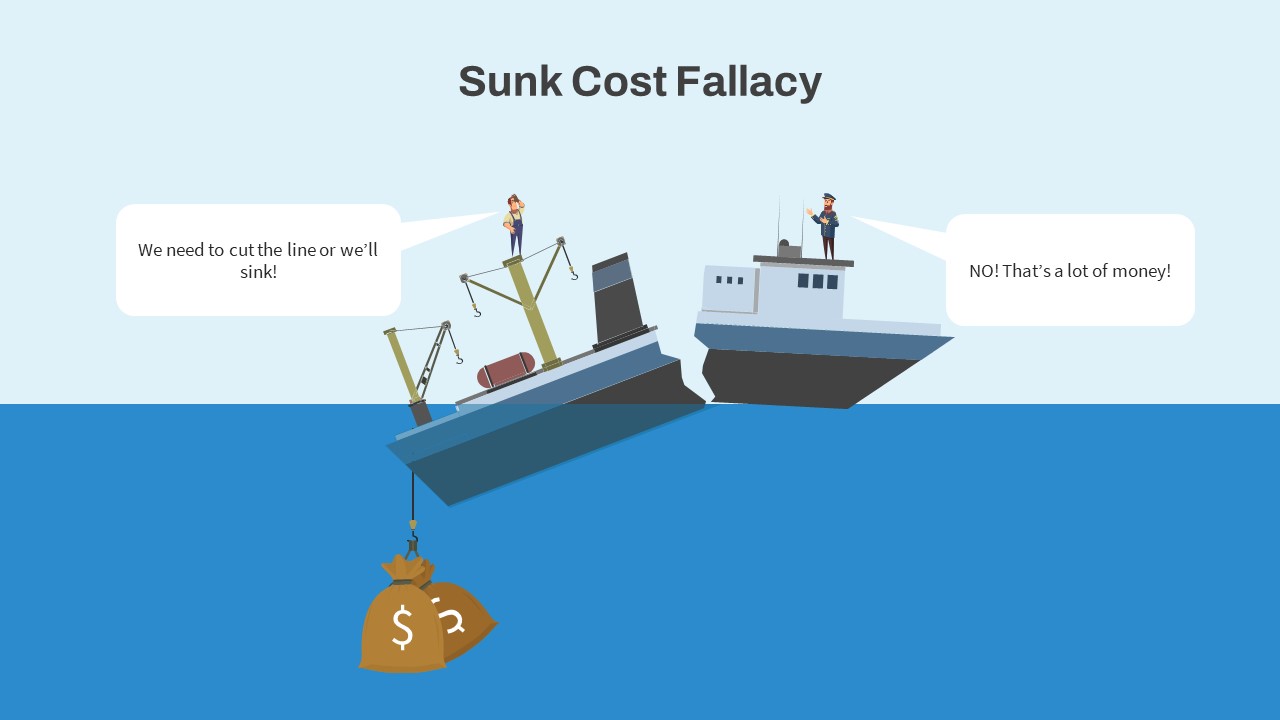
Sunk Cost Fallacy Dragging Anchor Slide Template for PowerPoint & Google Slides
Infographics
Cost-Volume-Profit Analysis Diagram Template for PowerPoint & Google Slides
Finance
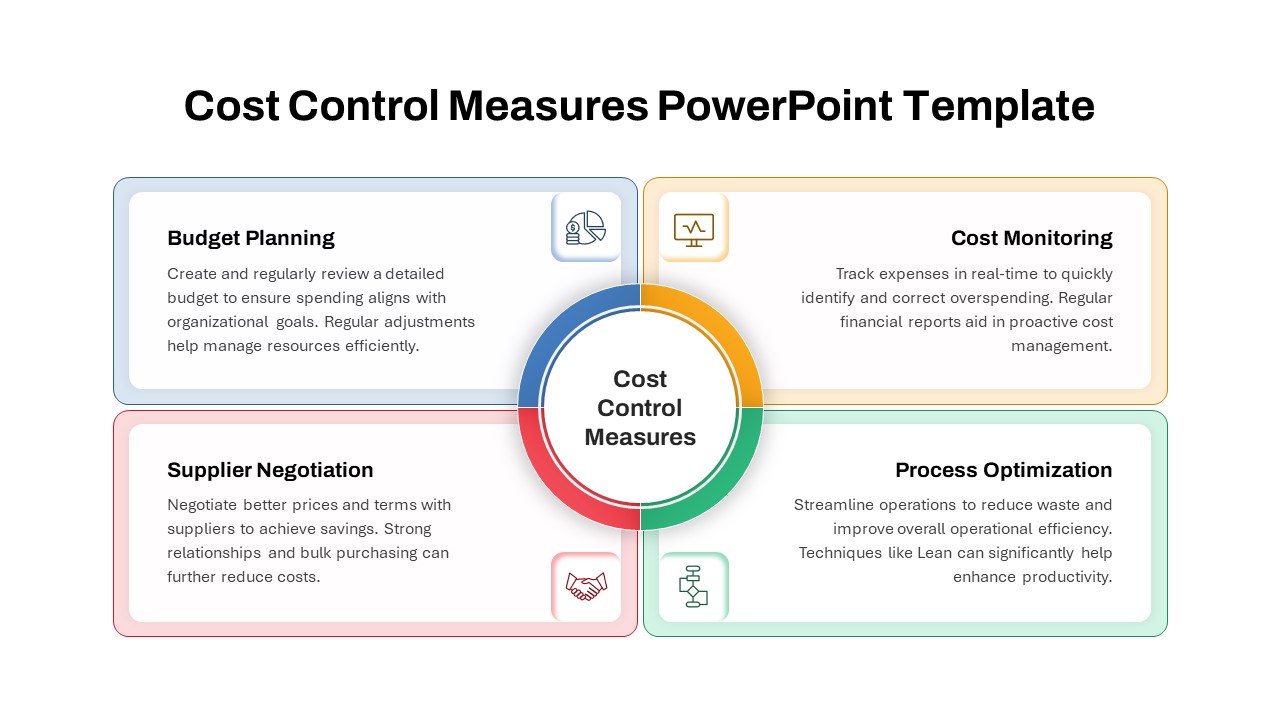
Cost Control Measures Infographic Template for PowerPoint & Google Slides
Circular
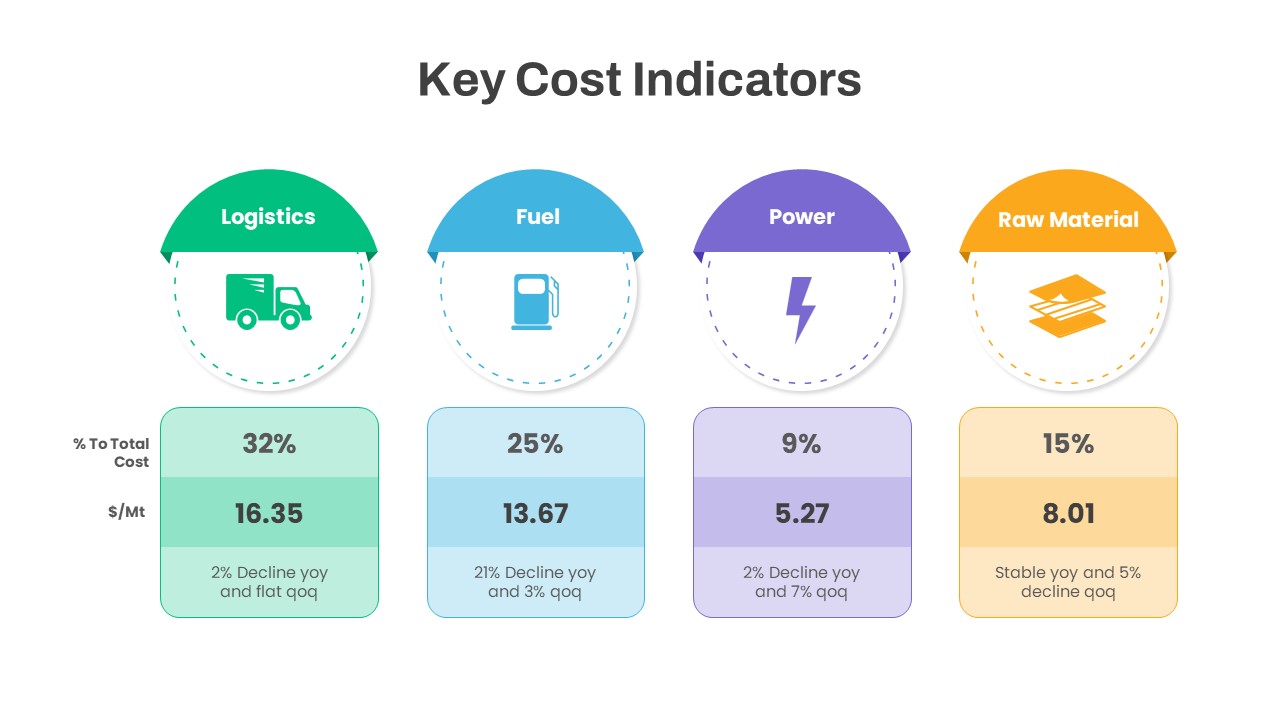
Key Cost Indicators Infographic Template for PowerPoint & Google Slides
Finance
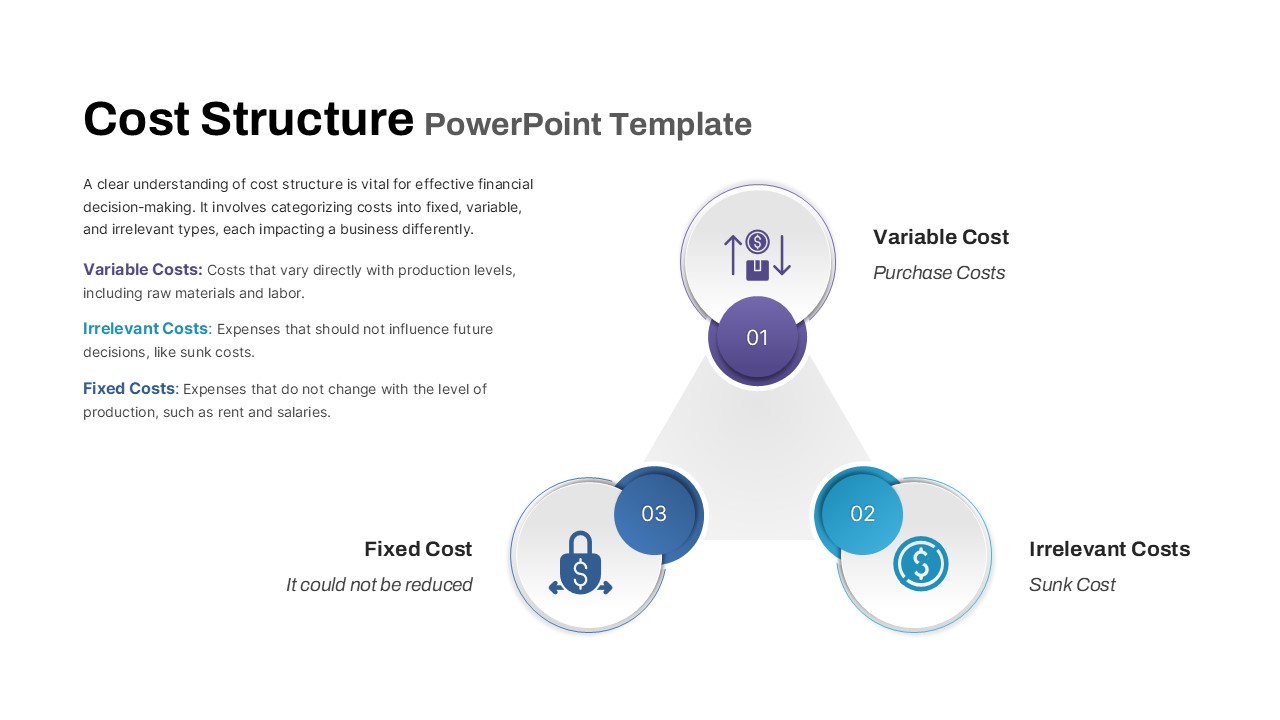
Cost Structure Triangle Diagram Template for PowerPoint & Google Slides
Finance
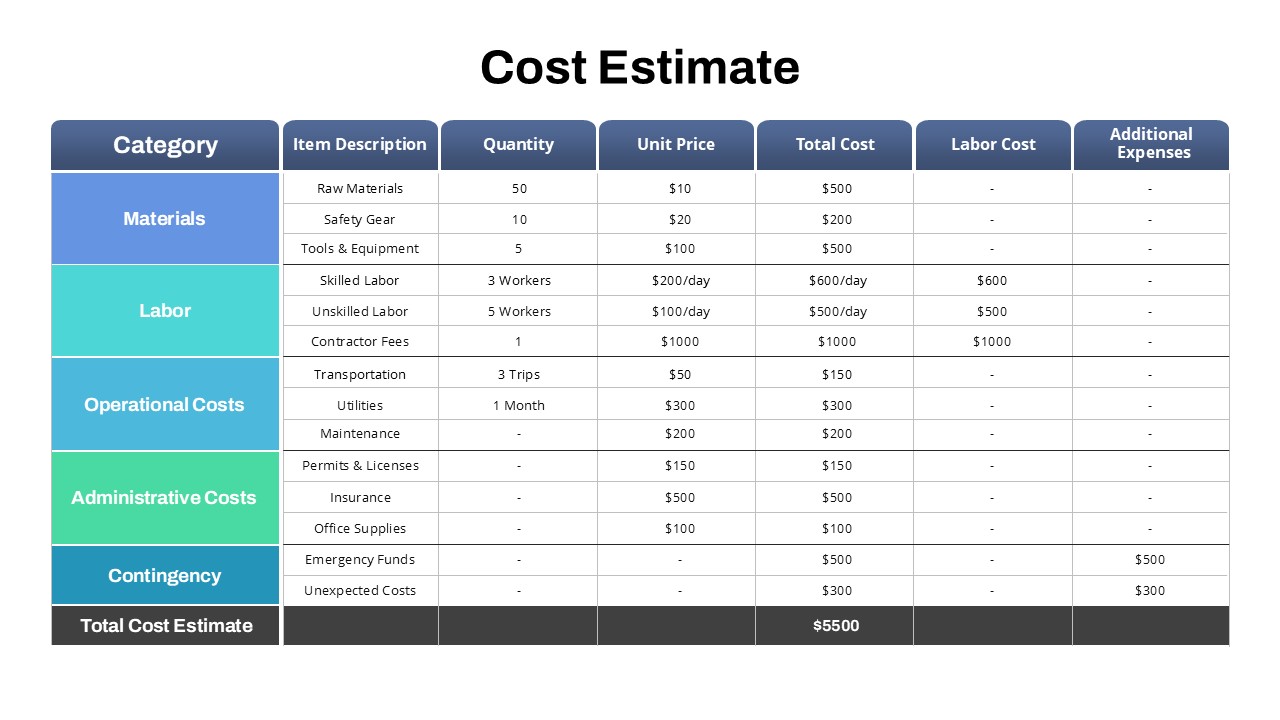
Project Detailed Cost Estimate Table Template for PowerPoint & Google Slides
Project
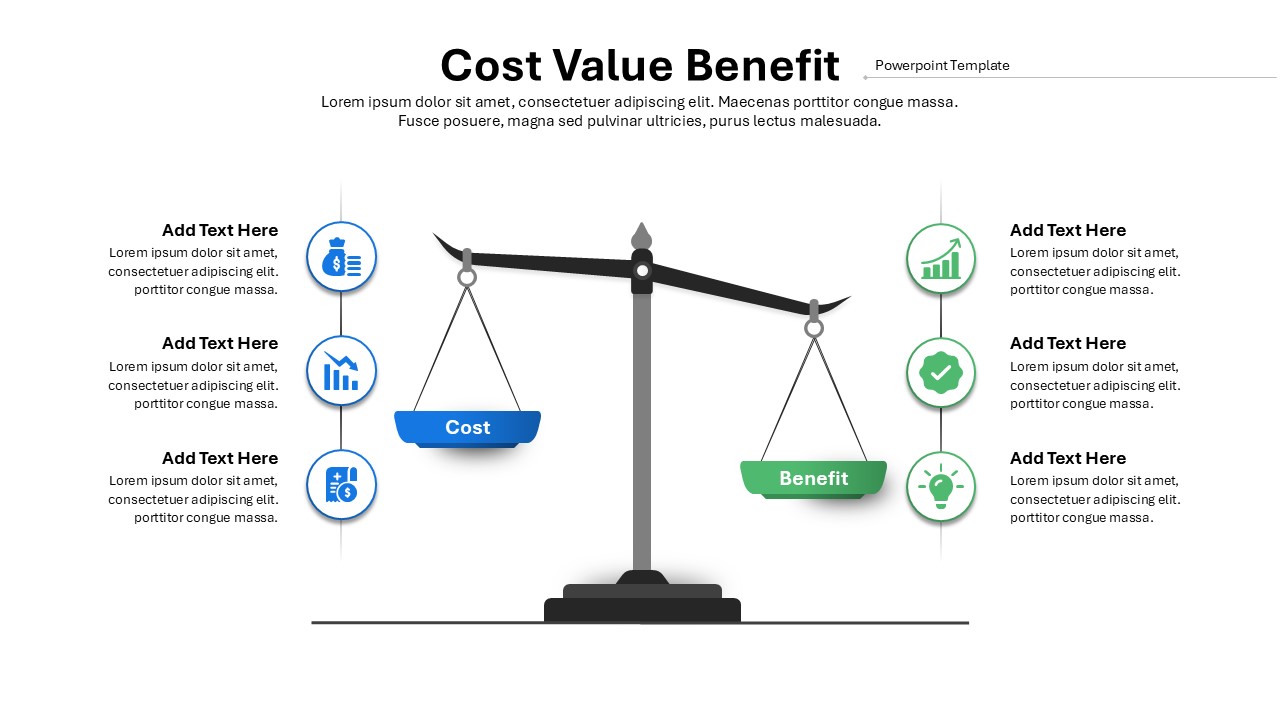
Cost vs Benefit template for PowerPoint & Google Slides
Charts
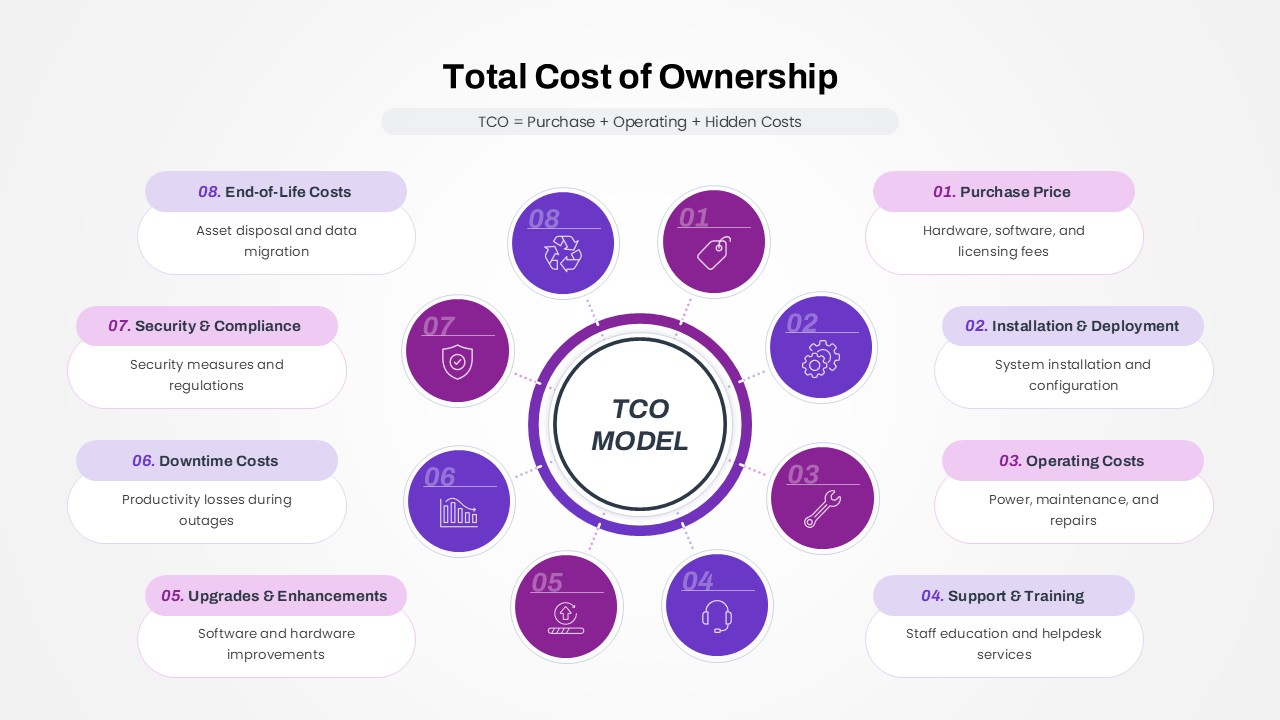
Total Cost of Ownership (TCO) Model template for PowerPoint & Google Slides
Business
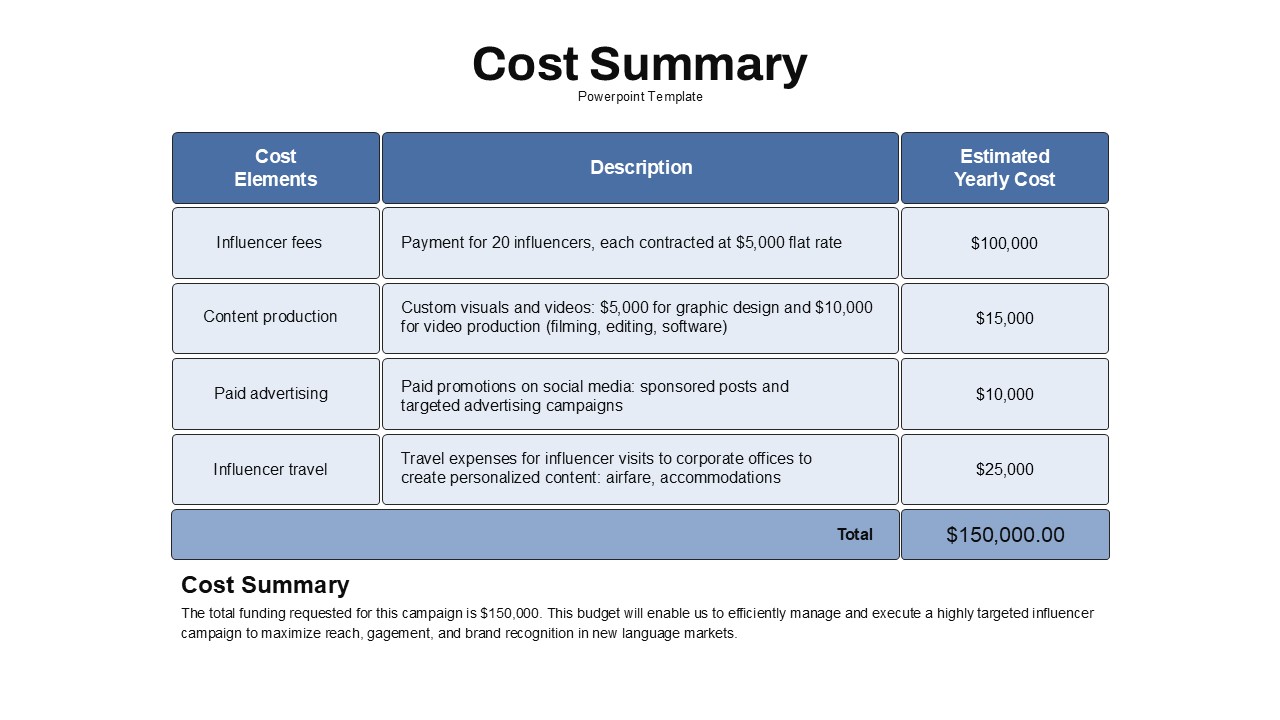
Cost Summary Table Template for PowerPoint & Google Slides
Business Report
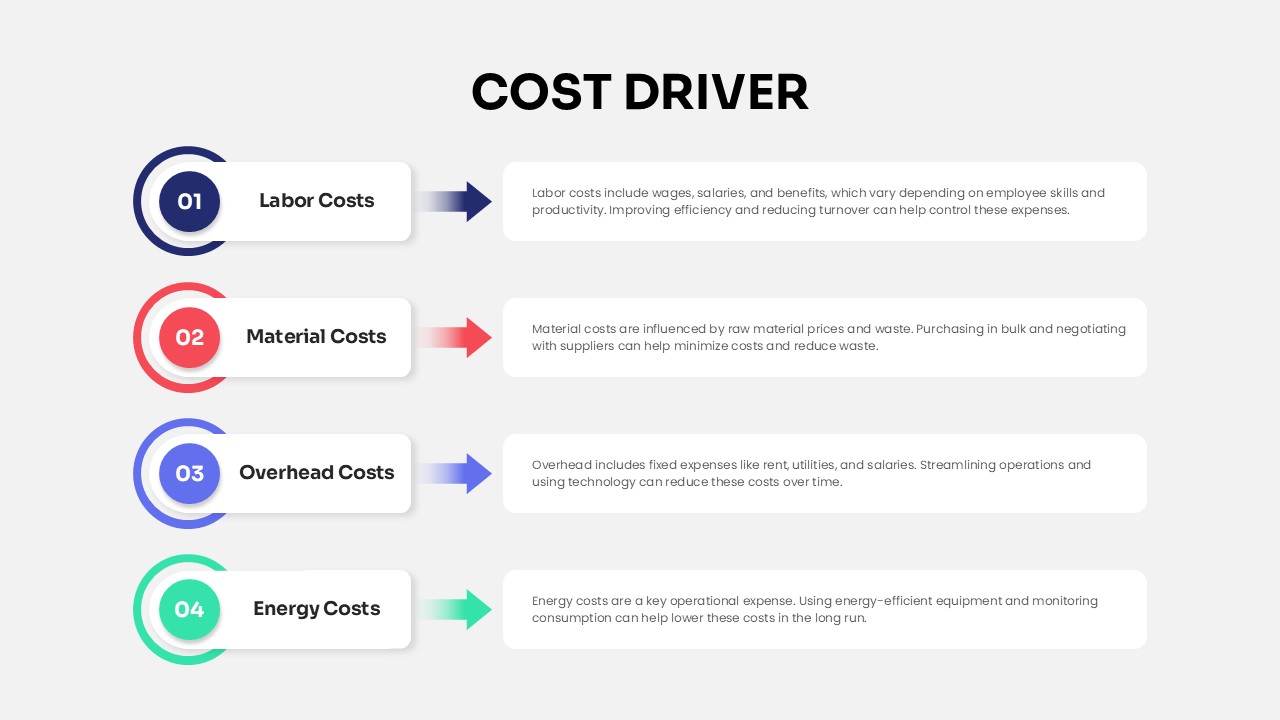
Cost Driver Infographic Slide Pack Template for PowerPoint & Google Slides
Process
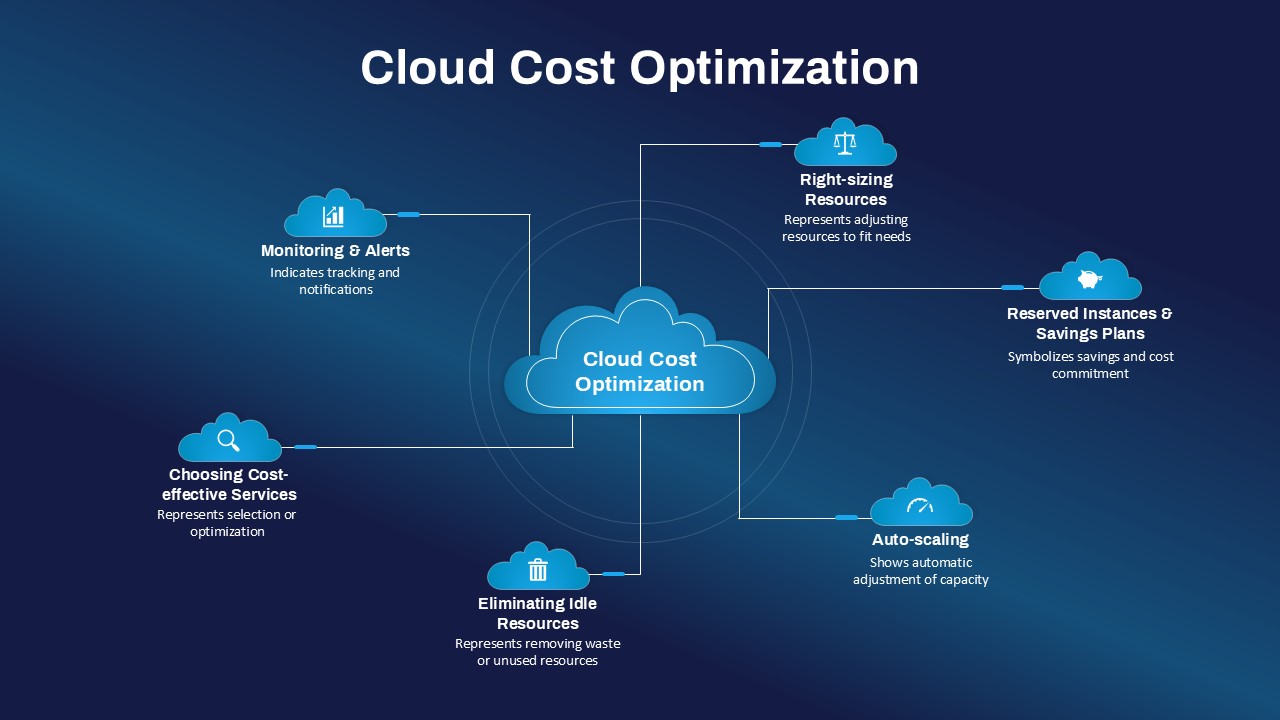
Cloud Cost Optimization Hub-and-Spoke Template for PowerPoint & Google Slides
Cloud Computing
Cost Benefit Analysis infographic for PowerPoint & Google Slides
Comparison
Service Zoom Feature Slides Comparison template for PowerPoint & Google Slides
Process
Simple Comparison Table Template for PowerPoint & Google Slides
Comparison
3-Column Comparison template for PowerPoint & Google Slides
Comparison

Clean Mobile Service Comparison Slide Template for PowerPoint & Google Slides
Comparison
Interactive Product Comparison Bar Chart Template for PowerPoint & Google Slides
Bar/Column

Comparison Pricing Table Infographic Template for PowerPoint & Google Slides
Comparison Chart
Tornado Chart Data Comparison Slide Template for PowerPoint & Google Slides
Bar/Column
Radar Chart Product Comparison Template for PowerPoint & Google Slides
Comparison Chart
Seller Portals Comparison Infographic Template for PowerPoint & Google Slides
Process
Fact and Figures Comparison Slide Template for PowerPoint & Google Slides
Business Report
Generations Comparison Infographic Template for PowerPoint & Google Slides
Timeline
Theory X and Theory Y Comparison Template for PowerPoint & Google Slides
Comparison
Current vs Future State Comparison Slide Template for PowerPoint & Google Slides
Comparison Chart
Dynamic Benchmarking Comparison Chart Template for PowerPoint & Google Slides
Comparison Chart
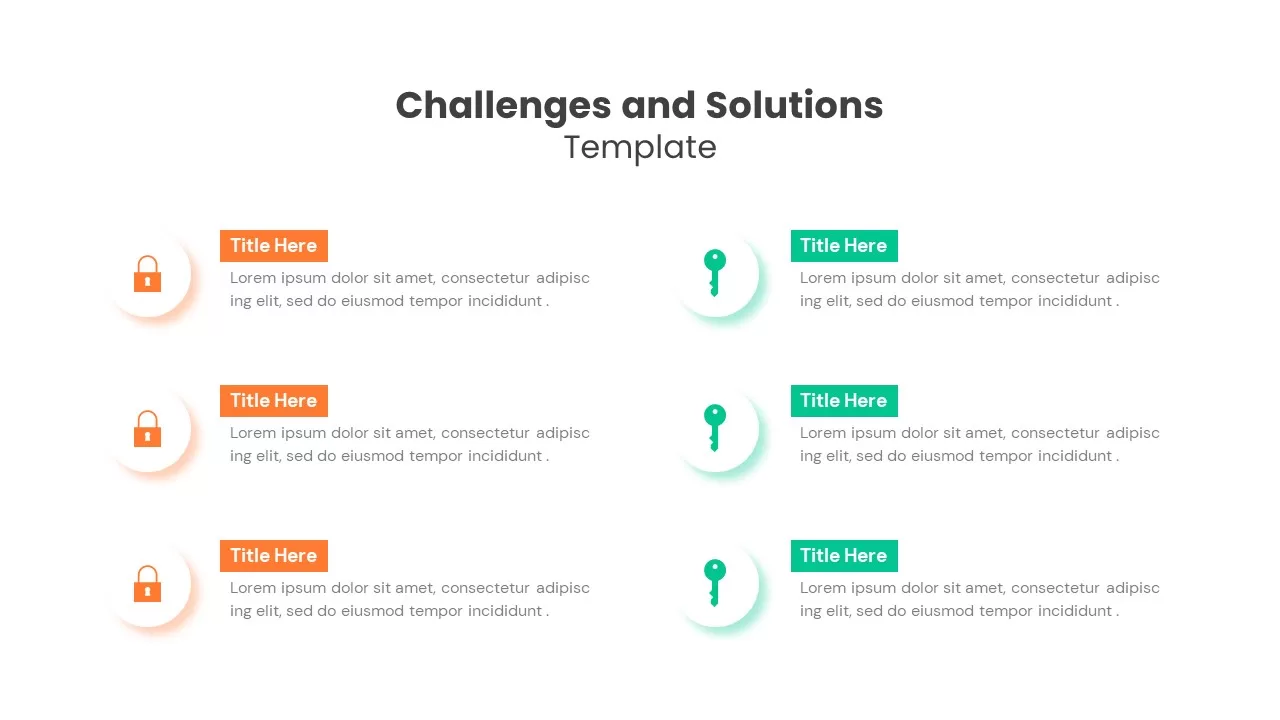
Challenges & Solutions Comparison Template for PowerPoint & Google Slides
Opportunities Challenges
Vendor Comparison Analysis template for PowerPoint & Google Slides
Comparison Chart
Vendor Comparison Matrix with High-Level Requirements template for PowerPoint & Google Slides
Comparison Chart
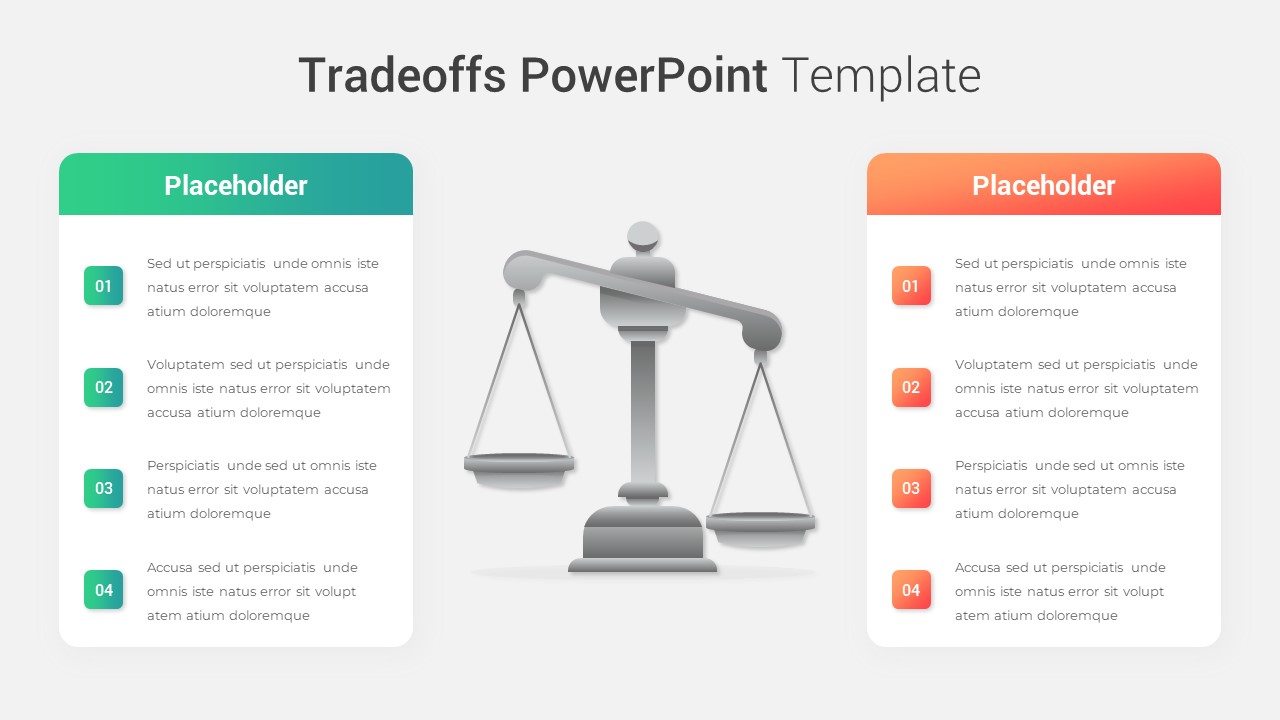
Modern Tradeoffs Comparison Slide Template for PowerPoint & Google Slides
Comparison
Popular Social Media Comparison Grid Template for PowerPoint & Google Slides
Digital Marketing
Hits and Misses Performance Comparison Template for PowerPoint & Google Slides
Comparison
Conflict Infographics Comparison Template for PowerPoint & Google Slides
Infographics
Clustered Bar Chart Comparison Template for PowerPoint & Google Slides
Bar/Column
Business Timeline Comparison Bar Chart Template for PowerPoint & Google Slides
Comparison Chart
Grouped Column Chart Comparison Template for PowerPoint & Google Slides
Bar/Column
Multiple Line Chart Comparison Template for PowerPoint & Google Slides
Comparison Chart
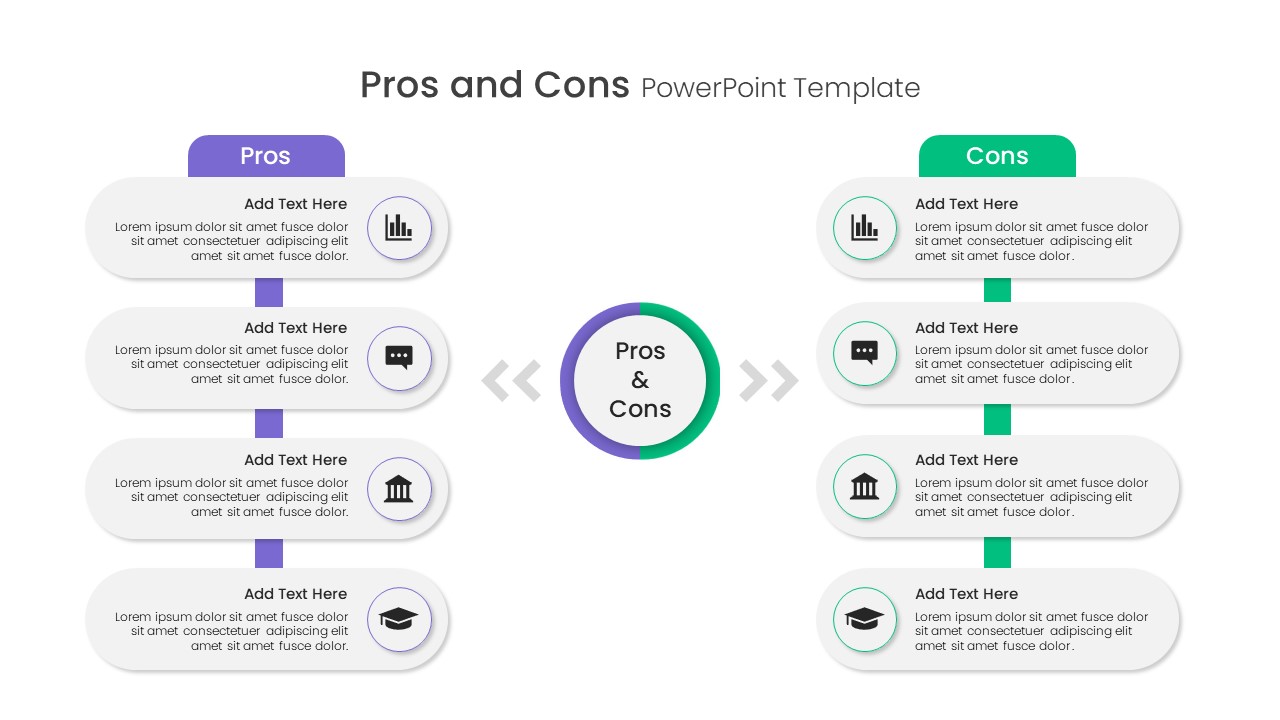
Free Pros and Cons Comparison Template for PowerPoint & Google Slides
Comparison
Free
Free Versatile Product Comparison Chart Template for PowerPoint & Google Slides
Charts
Free
AI vs. Human Intelligence Comparison Template for PowerPoint & Google Slides
Comparison
Quarterly Revenue Comparison Bar Chart Template for PowerPoint & Google Slides
Bar/Column
Project Comparison Timeline Roadmap Template for PowerPoint & Google Slides
Comparison
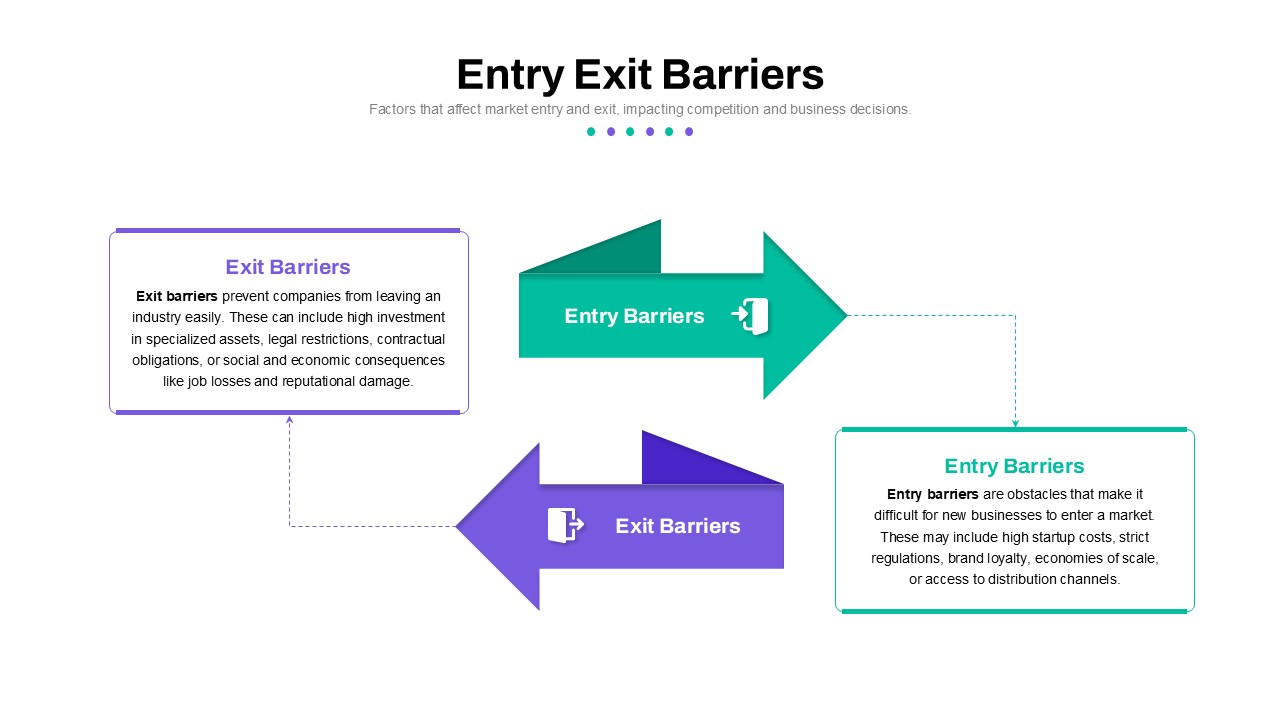
Entry and Exit Barriers Comparison Template for PowerPoint & Google Slides
Comparison
Competitor Comparison Chart Design Template for PowerPoint & Google Slides
Comparison
Two-Option Bar Chart Comparison Table Template for PowerPoint & Google Slides
Comparison
Cross Sell & Up Sell Strategy Comparison template for PowerPoint & Google Slides
Comparison
Product Feature Comparison Table Template for PowerPoint & Google Slides
Comparison Chart
Competitor Profile Matrix Comparison Template for PowerPoint & Google Slides
Comparison Chart
Two-Sided Coin Comparison Diagram Template for PowerPoint & Google Slides
Comparison
Two-Box Analysis & Target Comparison Template for PowerPoint & Google Slides
Comparison
VUCA vs BANI Comparison Infographic Template for PowerPoint & Google Slides
Comparison
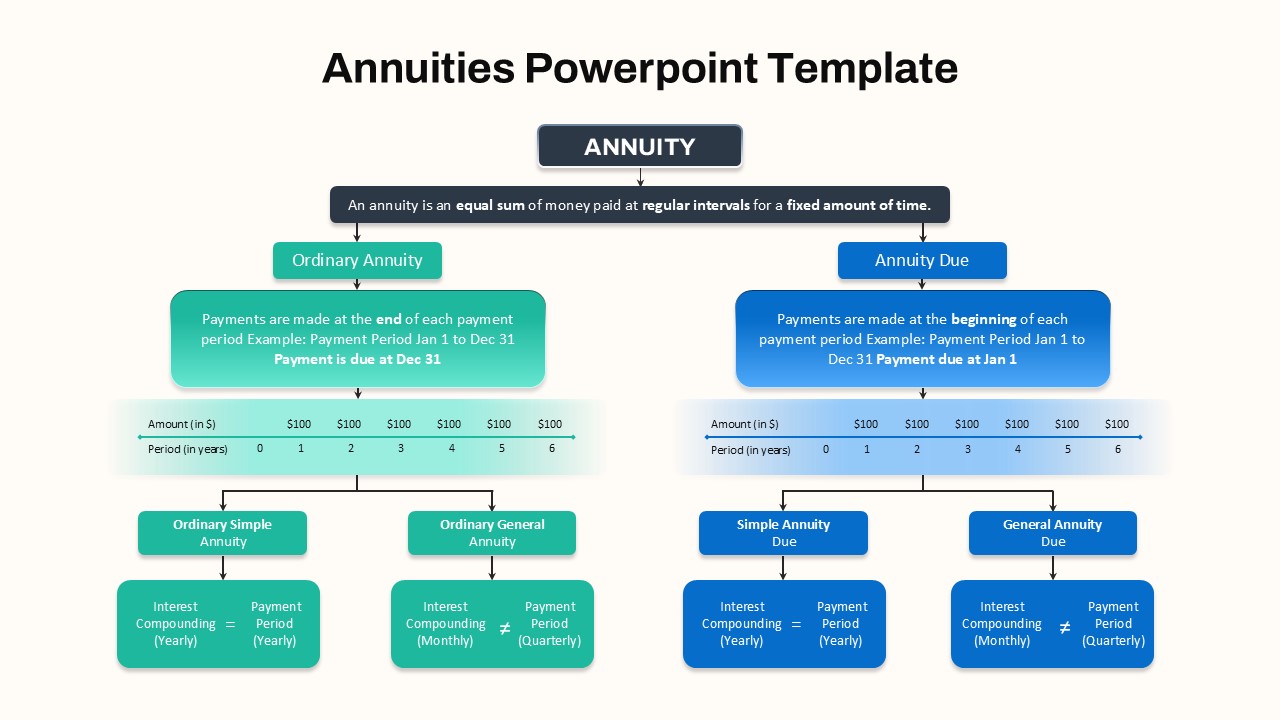
Hierarchical Annuity Comparison Flowchart Template for PowerPoint & Google Slides
Business Report
Funnel and Flywheel Thinking Comparison template for PowerPoint & Google Slides
Infographics
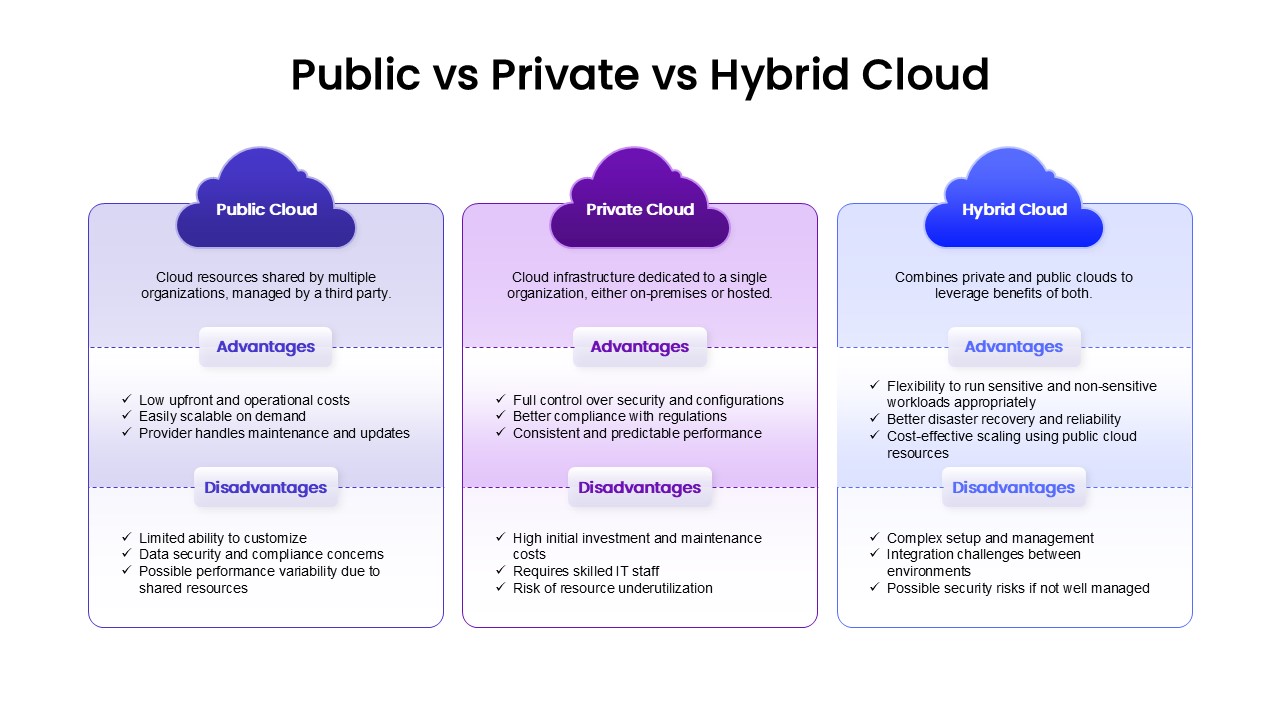
Public, Private & Hybrid Cloud Comparison Template for PowerPoint & Google Slides
Cloud Computing
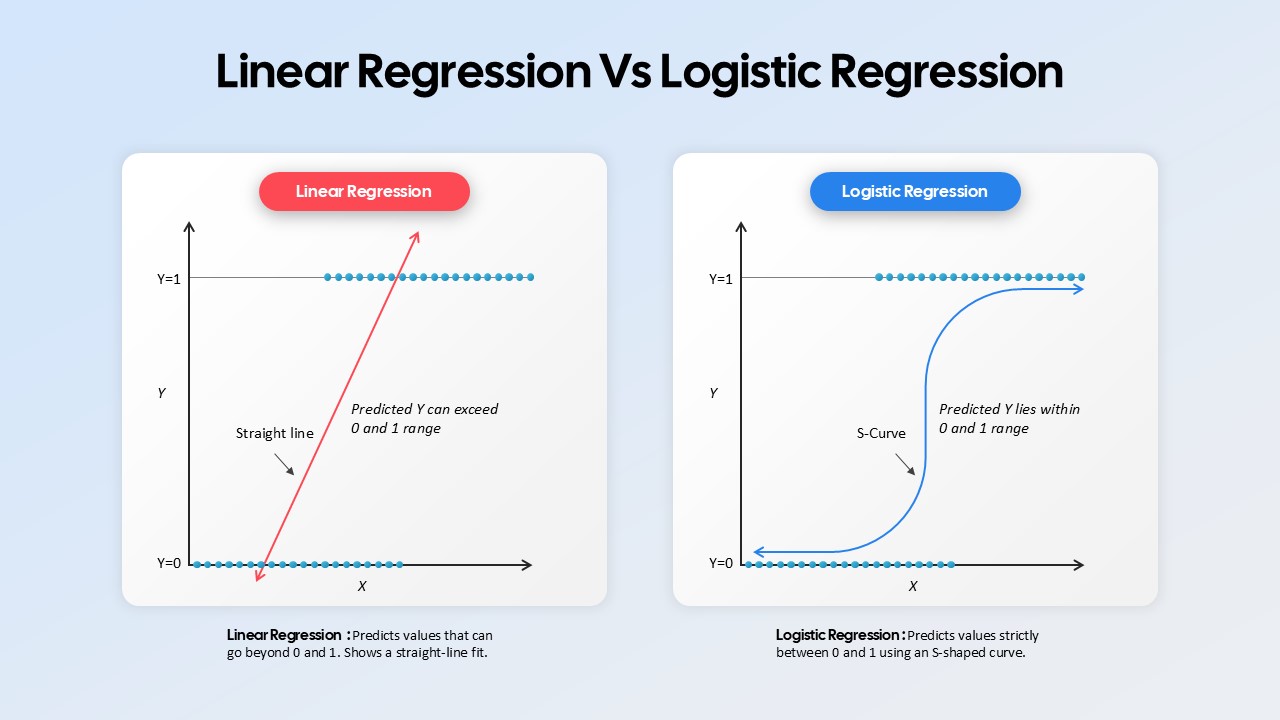
Linear Regression vs Logistic Regression Comparison template for PowerPoint & Google Slides
Comparison
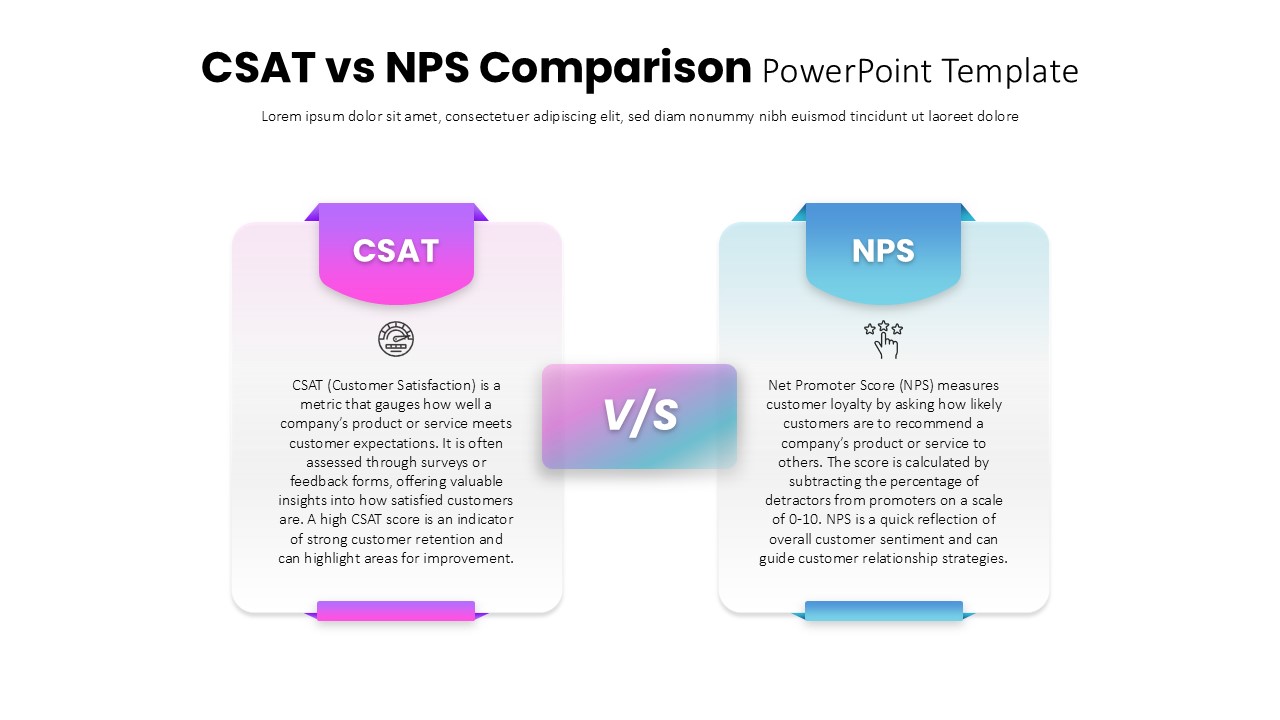
CSAT vs NPS Comparison template for PowerPoint & Google Slides
Business Strategy
Risk vs Reward Comparison Template for PowerPoint & Google Slides
Opportunities Challenges
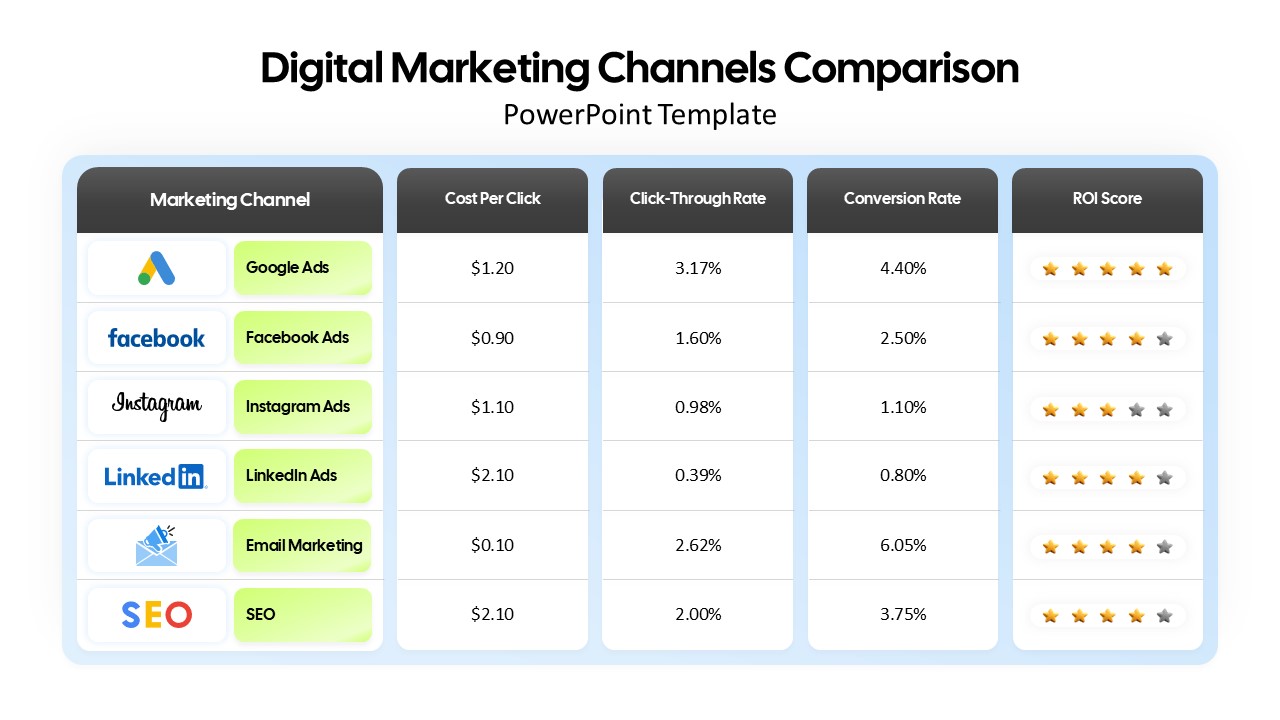
Digital Marketing Channels Comparison template for PowerPoint & Google Slides
Business
Comparison Table Presentation Template for PowerPoint & Google Slides
Table
Colorful Business Data Comparison Table Template for PowerPoint & Google Slides
Table
Operating Channels Comparison Diagram Template for PowerPoint & Google Slides
Business Models
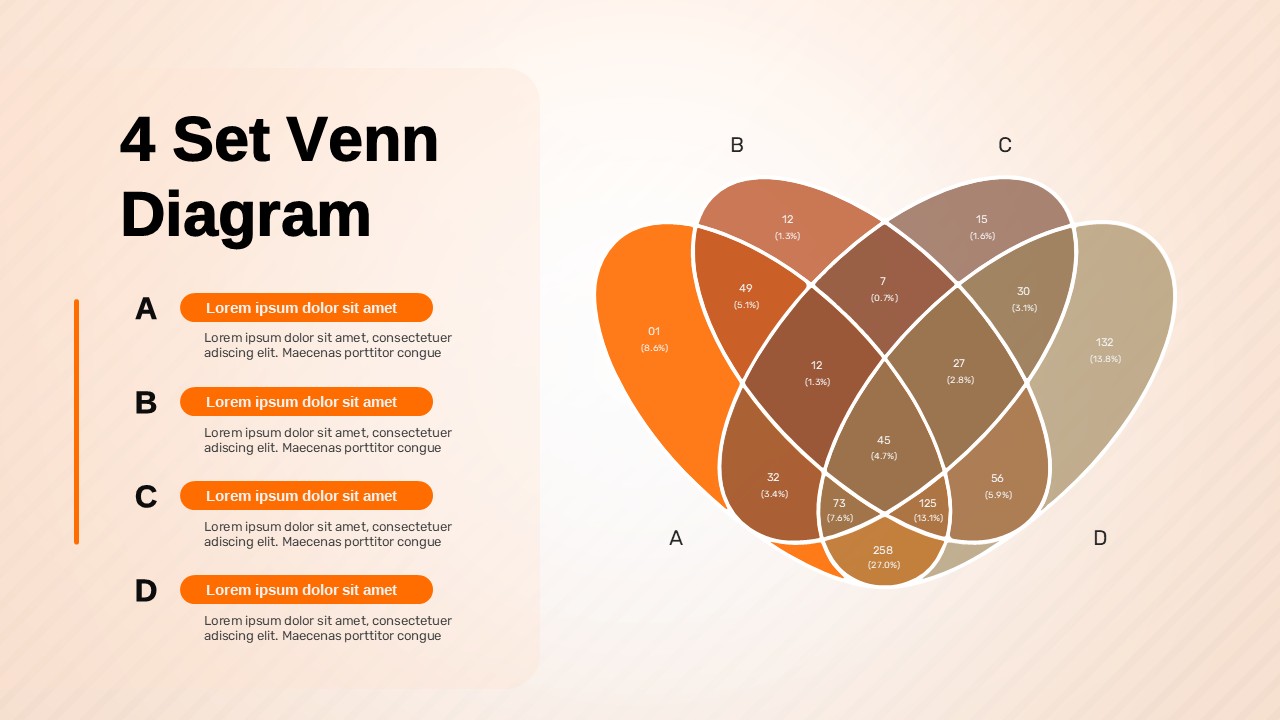
4 Set Venn Diagram Comparison Template for PowerPoint & Google Slides
Comparison