Dual Percentage Comparison Metaphor Template for PowerPoint & Google Slides

Description
Leverage this versatile comparison metaphor slide to highlight side-by-side metrics with clarity and visual impact. Set against a deep navy background, the design features a bold “COMPARISON” title paired with two vectorized hands each holding a percentage icon—one golden and one coral—encircled by a subtle, dark overlay to emphasize focal data points. Each icon rests atop a customizable circular base, supporting clear numeric labels and concise descriptions that can be edited to showcase performance indicators, survey results, or competitive benchmarks. Precision snap-to-grid guides and fully editable vector shapes ensure seamless resizing, repositioning, or color adjustments without loss of fidelity.
Built on robust master slides for both PowerPoint and Google Slides, every element—from text placeholders and typography to iconography—can be modified to align with your brand palette or presentation theme. Swap percentage icons for alternative symbols from the embedded library of over 50 vector assets, adjust contrasting hues for enhanced readability, or extend the layout to compare additional data points. Optional drop shadows add subtle depth, while ample whitespace preserves a clean, uncluttered aesthetic that keeps your audience focused on critical insights.
Engineered for rapid customization and collaborative workflows, this template leverages locked guides and intuitive placeholders to streamline content updates, reducing slide assembly time and ensuring consistency across decks. The minimalist flat design maintains high-definition clarity on any device, making it ideal for executive presentations, board meetings, and virtual webinars. Whether you’re analyzing quarterly KPIs, conducting market research comparisons, or presenting A/B testing results, this comparison metaphor slide transforms complex datasets into an engaging, easily digestible narrative that resonates with diverse audiences.
Who is it for
Marketing managers, financial analysts, business executives, product managers, and researchers will leverage this slide to compare metrics, benchmark performance, or present competitive analyses in reports and presentations.
Other Uses
Repurpose this slide for A/B test result breakdowns, cost comparisons, survey result visualizations, pricing model analyses, feature-to-feature evaluations, or side-by-side KPI dashboards to convey insights with impact.
Login to download this file

Item ID
SB00550
Related Templates

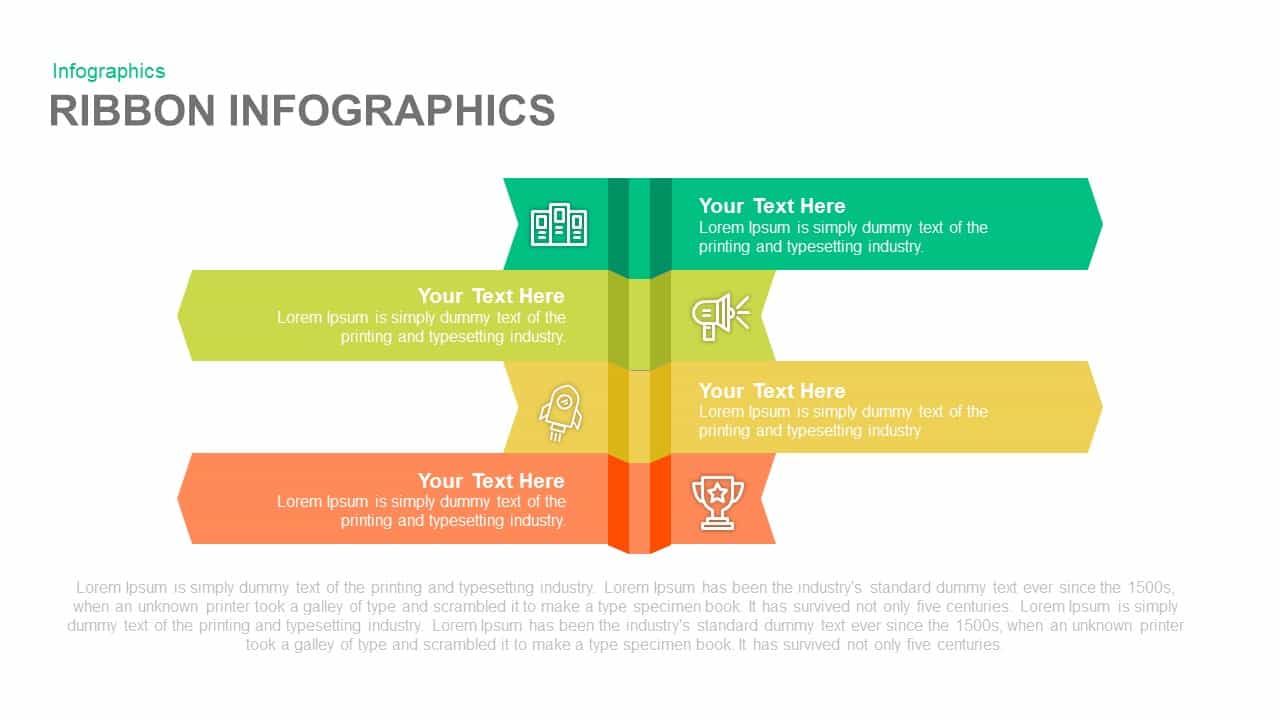
Dual-Side Three-Step Ribbon Infographic Template for PowerPoint & Google Slides
Comparison
Dual Topic Mind Map Infographic Template for PowerPoint & Google Slides
Mind Maps
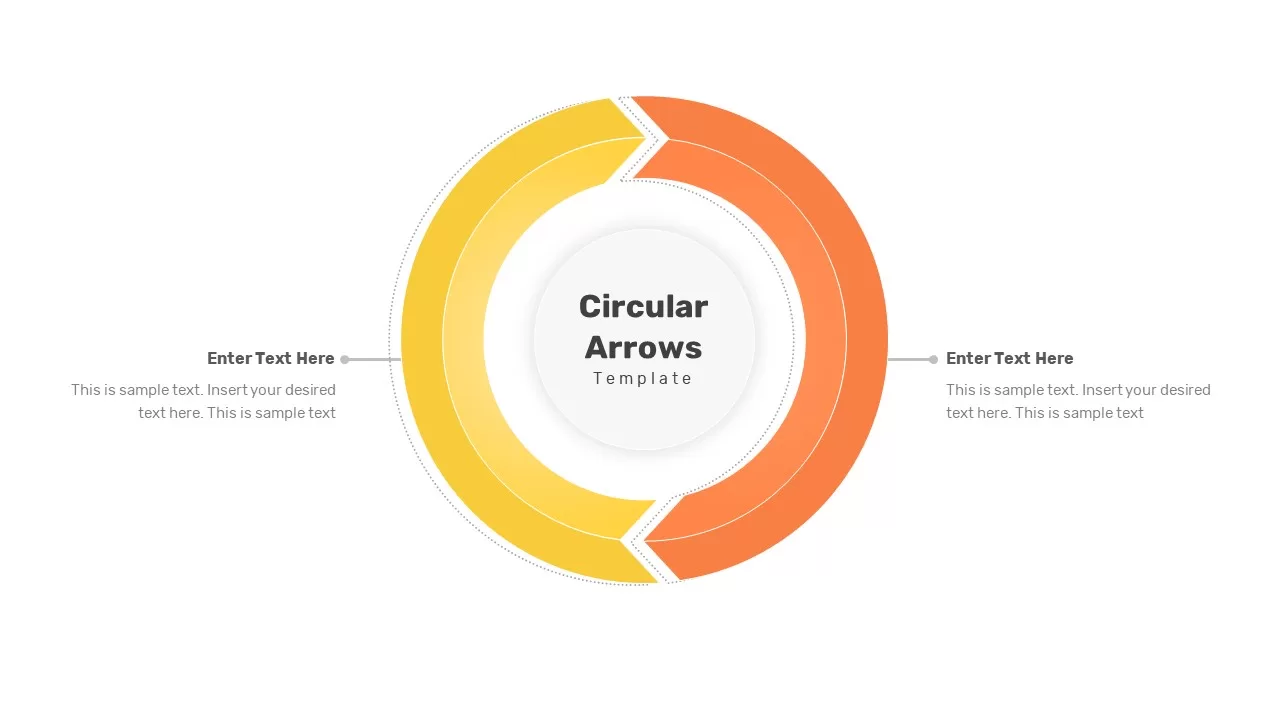
Dual-Stage Circular Arrow Cycle Template for PowerPoint & Google Slides
Process
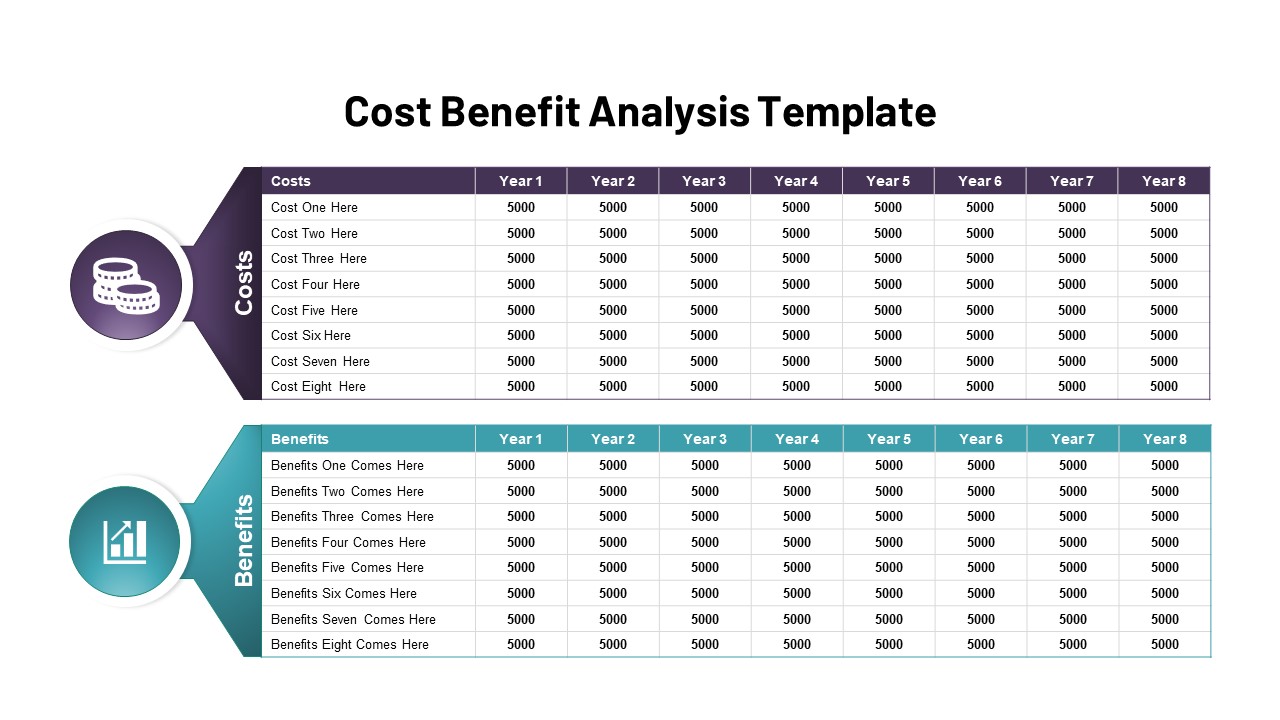
Dual-Color Cost vs Benefit Analysis Template for PowerPoint & Google Slides
Comparison
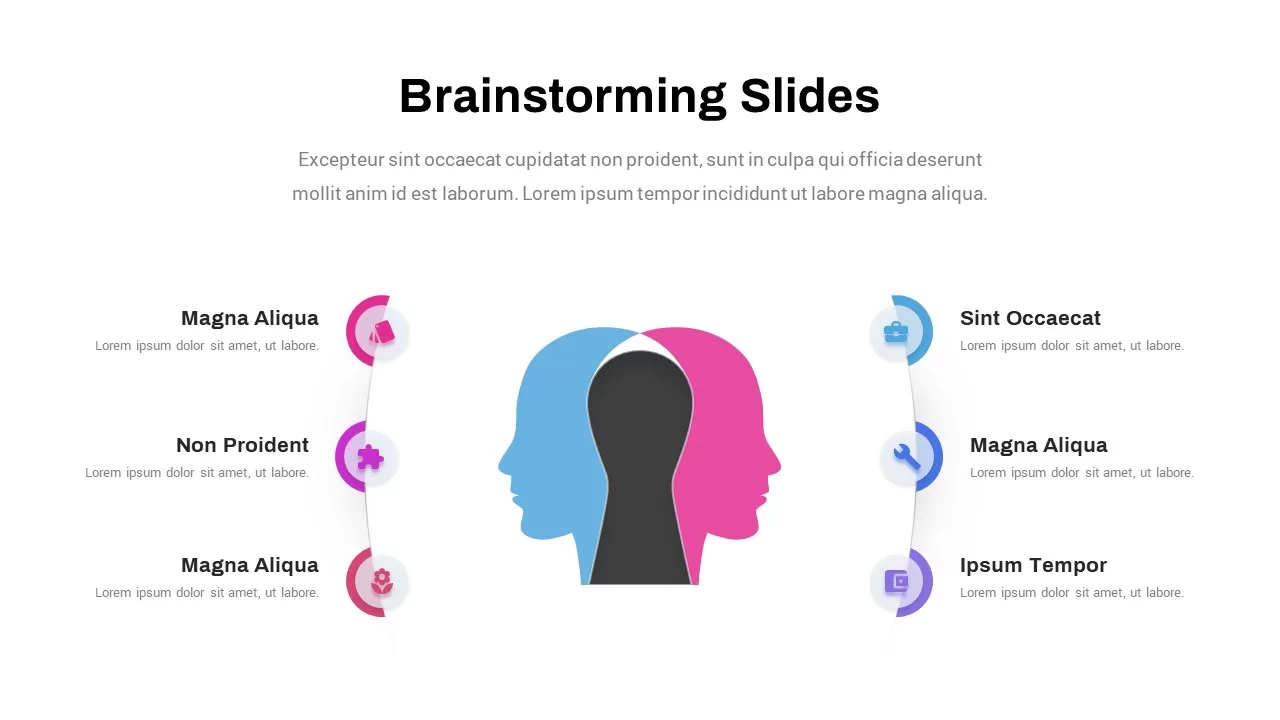
Dual Head Brainstorming Concept Slide for PowerPoint & Google Slides
Process
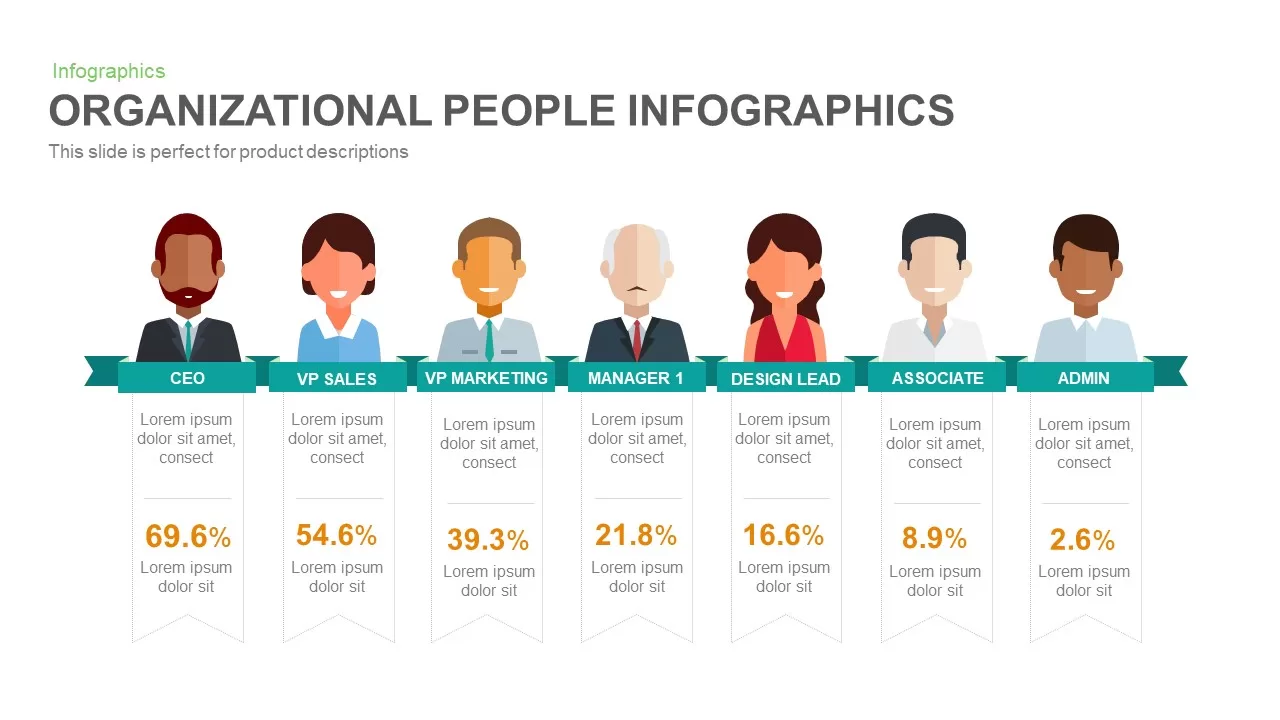
Organizational People Percentage Chart template for PowerPoint & Google Slides
Org Chart
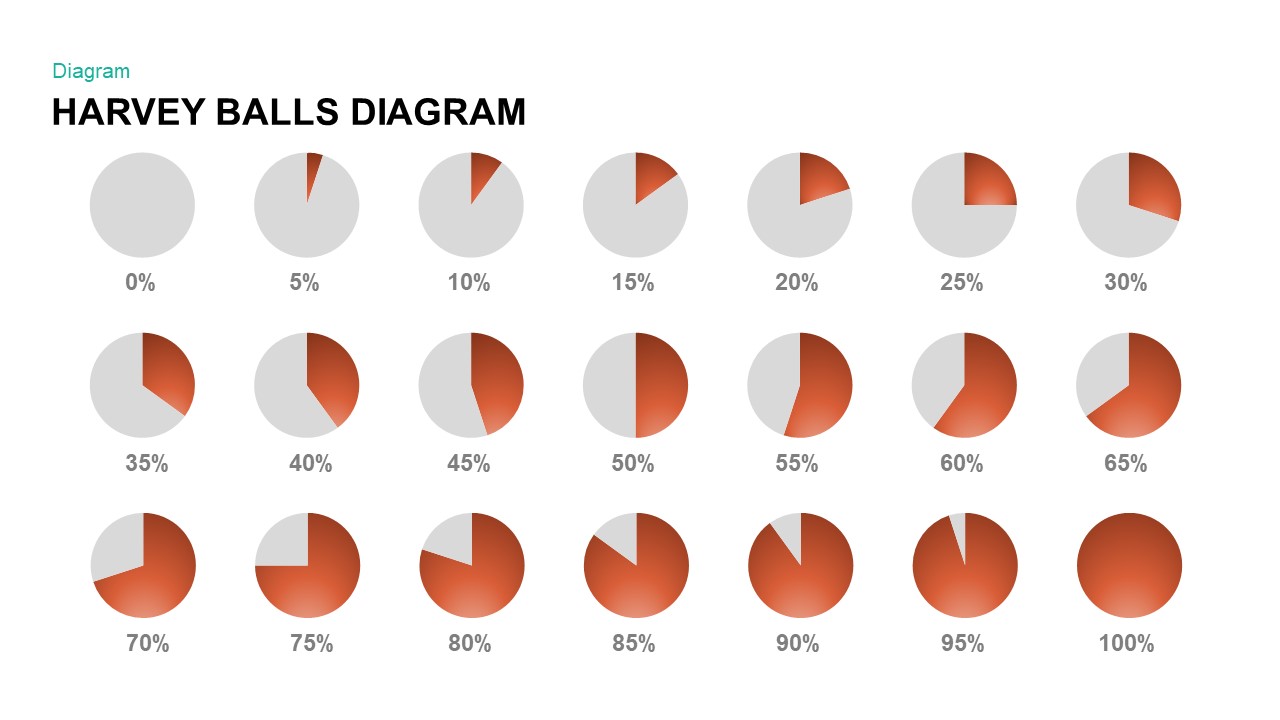
Harvey Balls Percentage Infographic Template for PowerPoint & Google Slides
Harvey Balls
Bottle Data Percentage Infographic Template for PowerPoint & Google Slides
Infographics
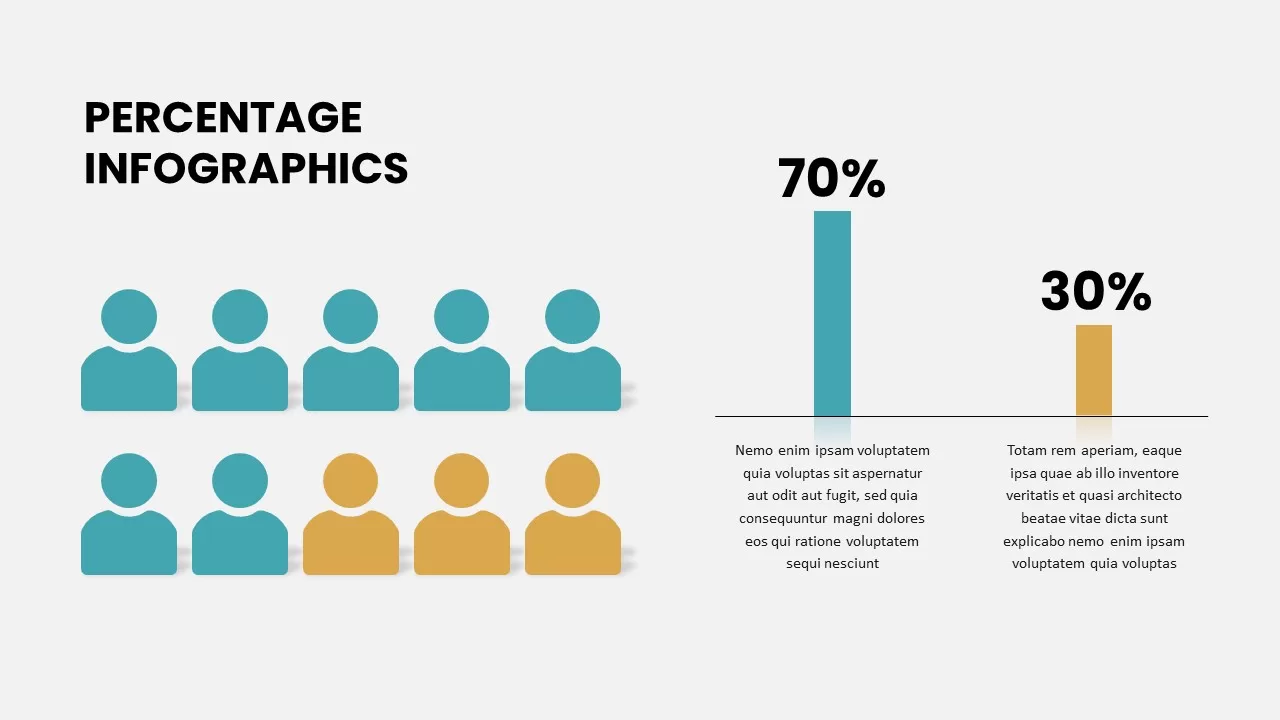
Free Percentage Infographics template for PowerPoint & Google Slides
Comparison
Free
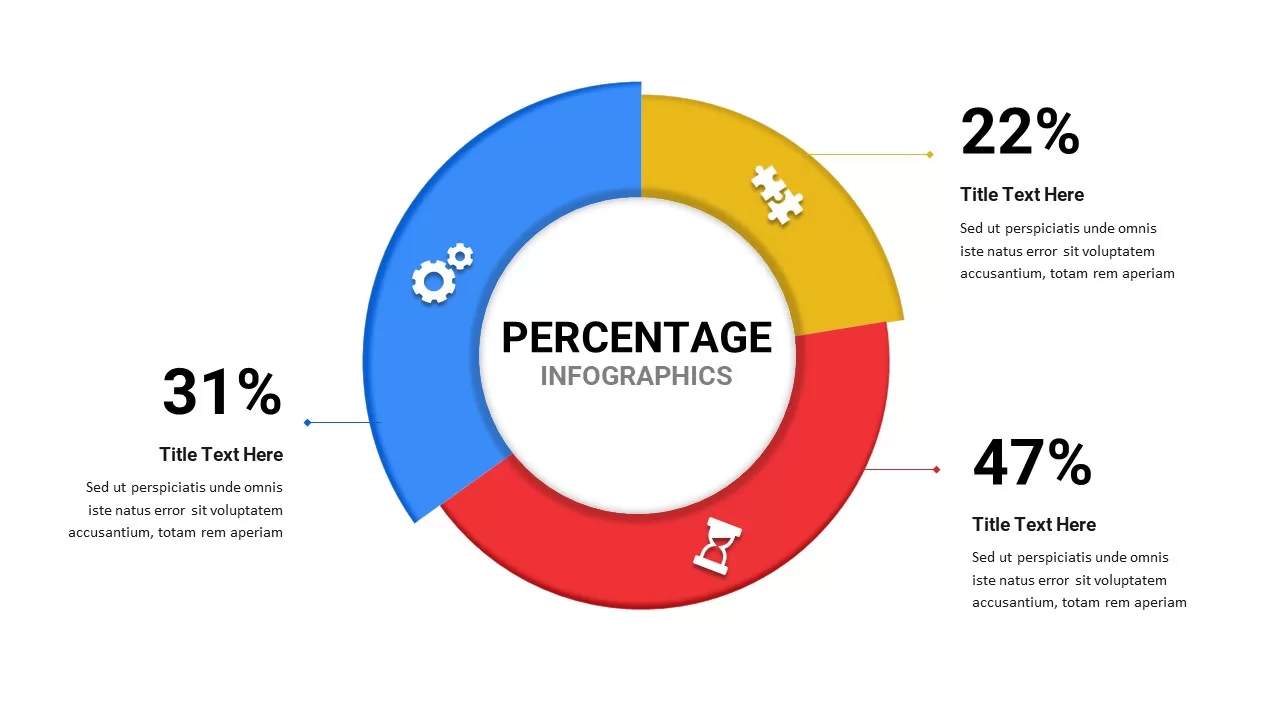
Percentage Infographics template for PowerPoint & Google Slides
Comparison
North America Percentage Map Infographic Template for PowerPoint & Google Slides
World Maps
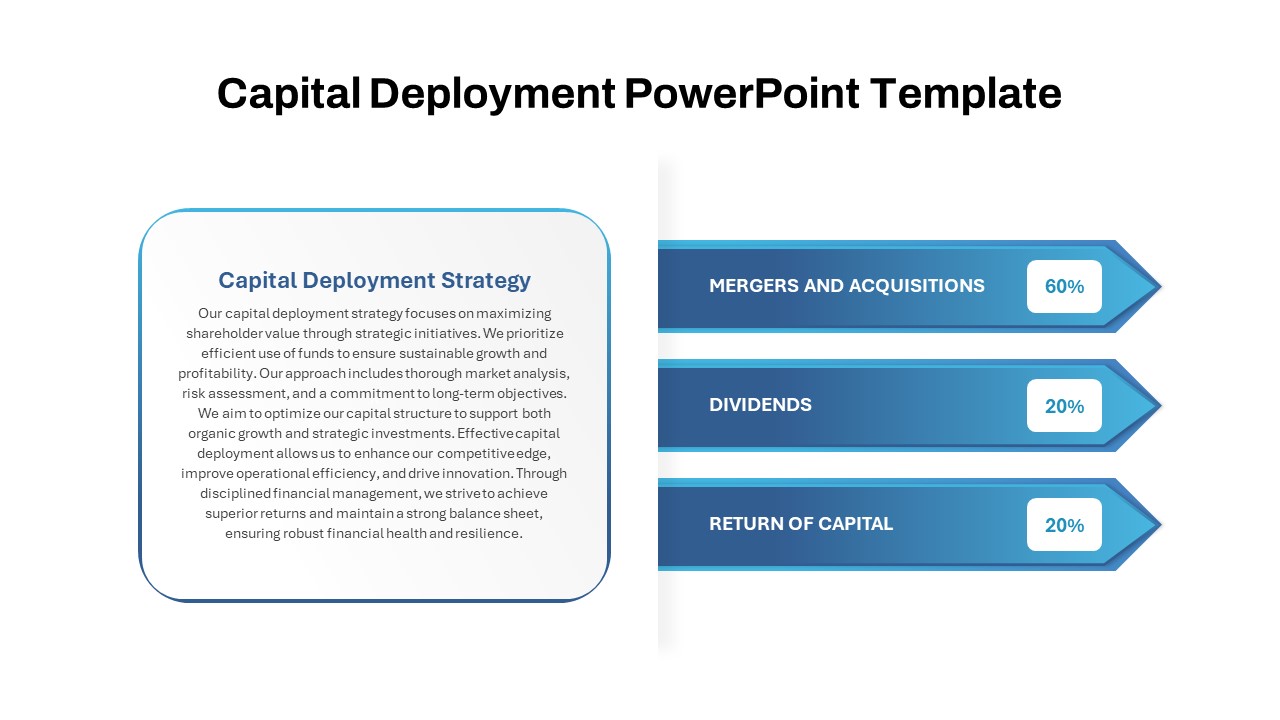
Capital Deployment Percentage Breakdown Template for PowerPoint & Google Slides
Pitch Deck

Scale Metaphor Metrics Comparison Template for PowerPoint & Google Slides
Charts
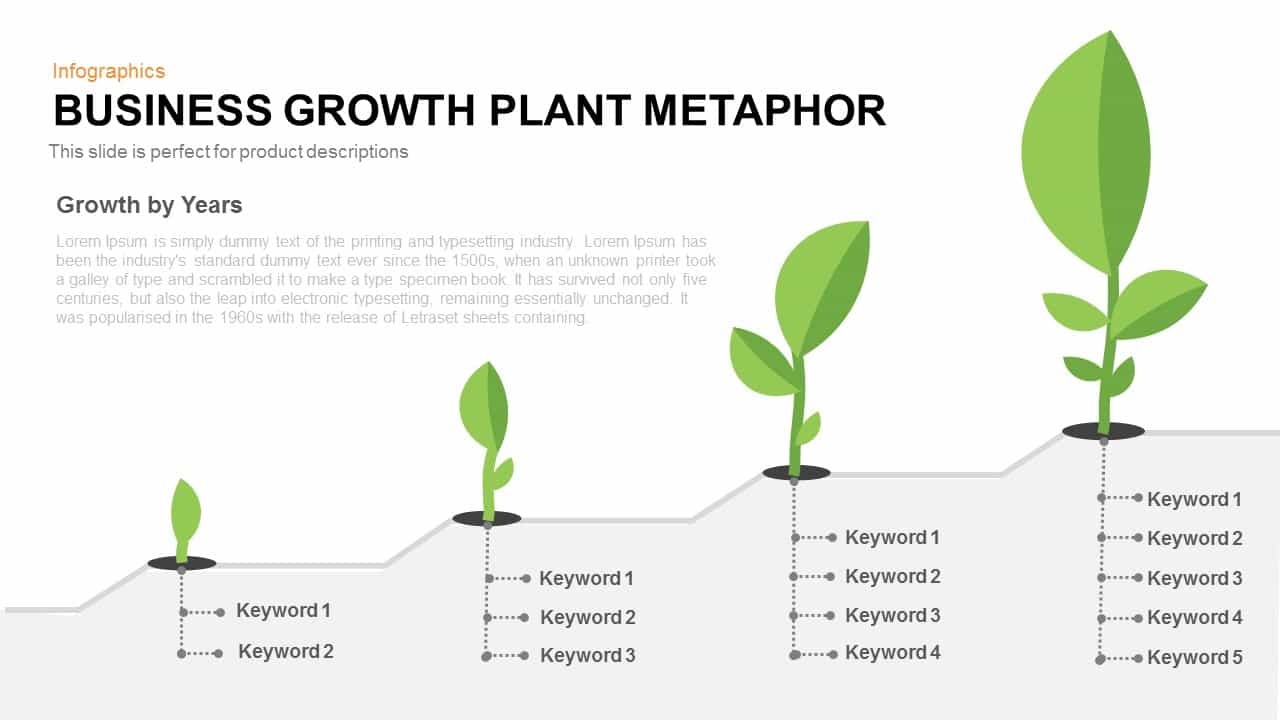
Business Growth Plant Metaphor Timeline Template for PowerPoint & Google Slides
Business Strategy

Discover Metaphor Concept Slide Template for PowerPoint & Google Slides
Infographics
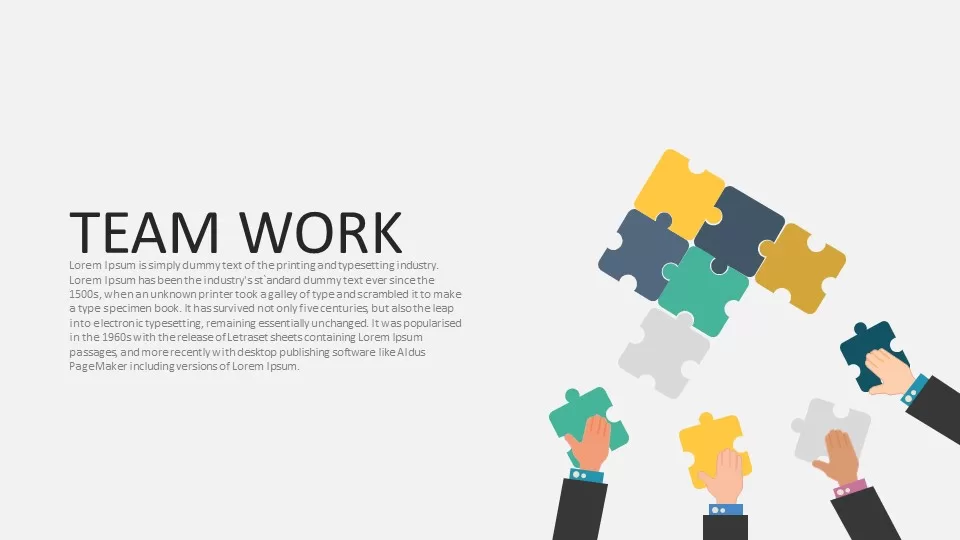
Teamwork Puzzle Metaphor Slide Template for PowerPoint & Google Slides
Our Team
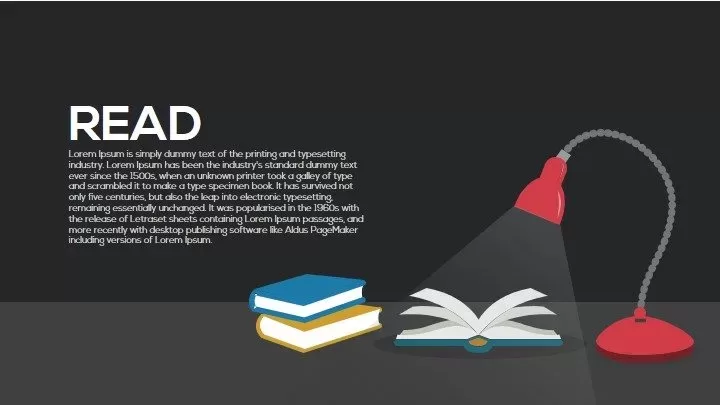
Read Metaphor Concept Illustration Slide Template for PowerPoint & Google Slides
Infographics
Metaphor Light Bulb Idea Concept Template for PowerPoint & Google Slides
Infographics
Leadership Metaphor Presentation Slide Template for PowerPoint & Google Slides
Leadership
Megaphone Communication Metaphor Template for PowerPoint & Google Slides
Advertising
Metaphor Multitasking Illustration Template for PowerPoint & Google Slides
Business
Metaphor Knowledge Illustration Slide Template for PowerPoint & Google Slides
Infographics
Strength Metaphor Dumbbell Diagram Template for PowerPoint & Google Slides
Accomplishment
Rebuild Brick Wall Metaphor Slide Template for PowerPoint & Google Slides
Infographics
Efficiency KPI Dashboard Metaphor Template for PowerPoint & Google Slides
Infographics
Destination Roadmap Pin Metaphor Template for PowerPoint & Google Slides
Roadmap
Metaphor Speed Template for PowerPoint & Google Slides
Process
Key Metaphor Infographic Slide Template for PowerPoint & Google Slides
Process
Mustard and Navy Balance Scale Metaphor Template for PowerPoint & Google Slides
Comparison
Shield Metaphor Security and Protection Template for PowerPoint & Google Slides
Risk Management
Magnifying Glass Research Metaphor Template for PowerPoint & Google Slides
Process
Business Opportunity Metaphor Slide Template for PowerPoint & Google Slides
Opportunities Challenges
Productivity Metaphor Clock Icon Template for PowerPoint & Google Slides
Graphics
Explore Binoculars Metaphor Slide Template for PowerPoint & Google Slides
Process
Guide Metaphor Navigation Infographic Template for PowerPoint & Google Slides
Process
Office Workspace Metaphor Slide Template for PowerPoint & Google Slides
Business Proposal
Operation Process Metaphor Diagram Template for PowerPoint & Google Slides
Process
Professional Security Metaphor Diagram Template for PowerPoint & Google Slides
Information Technology
Navigation Compass Metaphor Slide Template for PowerPoint & Google Slides
Vision and Mission
Deadline Metaphor Timeline & Hourglass Template for PowerPoint & Google Slides
Project
Planning Metaphor Flowchart Slide Template for PowerPoint & Google Slides
Process
Product Shipping Metaphor Diagram Template for PowerPoint & Google Slides
Process
Competition Metaphor Podium Diagram Template for PowerPoint & Google Slides
Business
News Metaphor Media Communication Slide Template for PowerPoint & Google Slides
Business Report
Improvement Growth Arrow Metaphor Template for PowerPoint & Google Slides
Bar/Column
Process Improvement Metaphor Diagram Template for PowerPoint & Google Slides
Process
Money Metaphor Financial Overview Template for PowerPoint & Google Slides
Finance
Accounting Process Metaphor Diagram Template for PowerPoint & Google Slides
Accounting

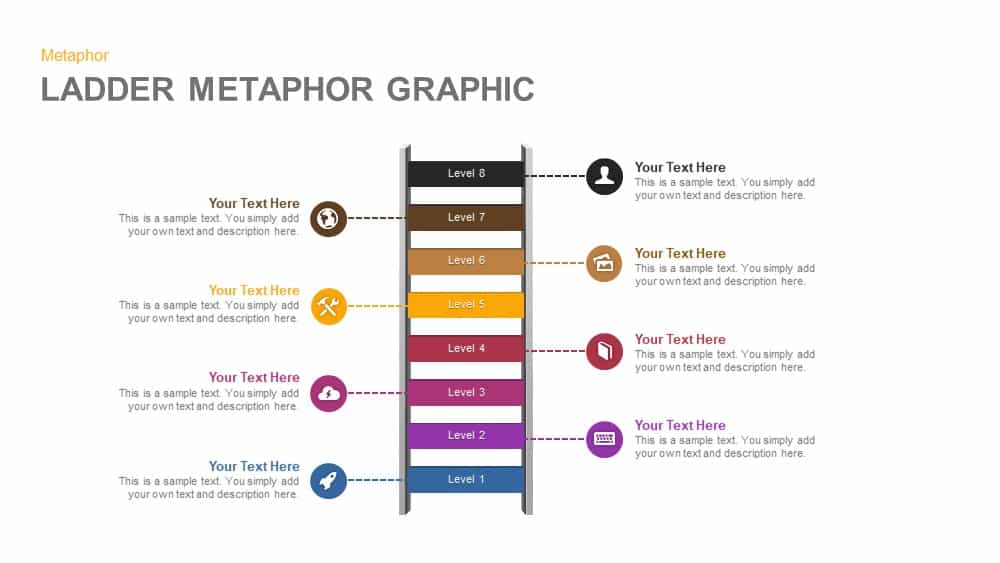
Eight-Level Ladder Metaphor Graphic Template for PowerPoint & Google Slides
Process
Business Decision-Making Metaphor Template for PowerPoint & Google Slides
Leadership
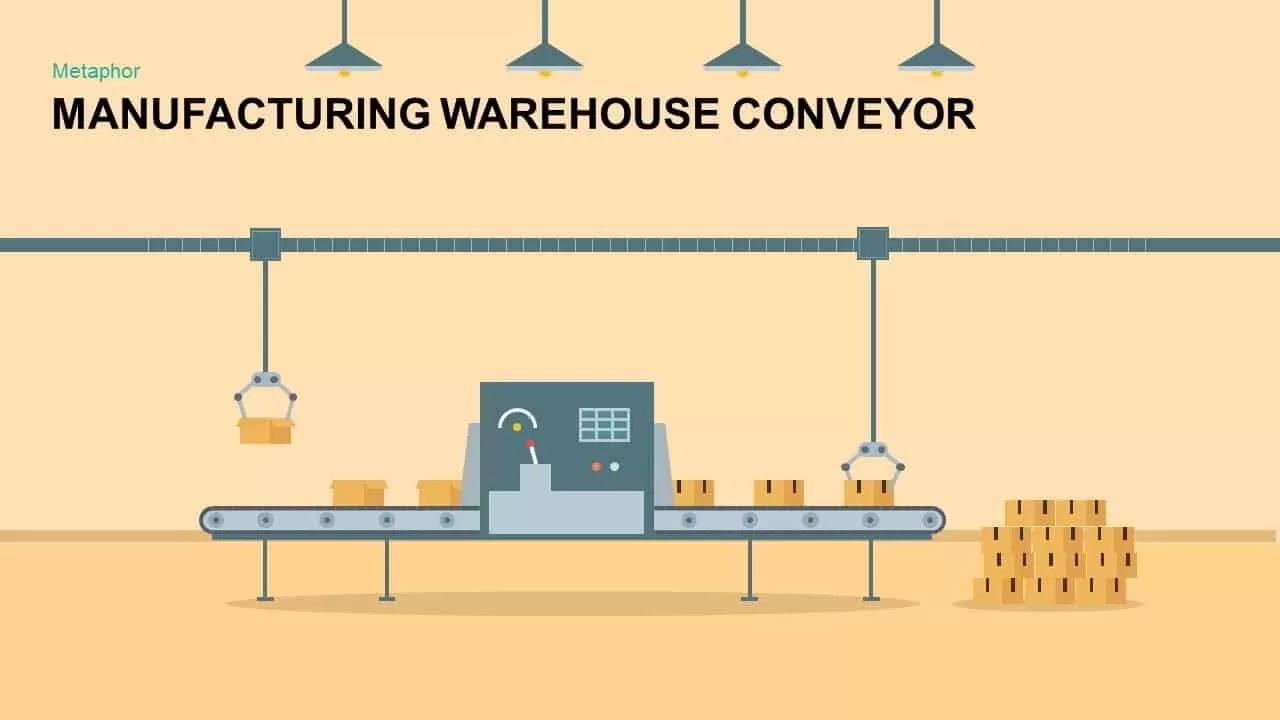
Warehouse Conveyor Process Metaphor Template for PowerPoint & Google Slides
Process
Cyber Security Metaphor Diagram Template for PowerPoint & Google Slides
Risk Management
Developer Icons Metaphor Slide Template for PowerPoint & Google Slides
Software Development
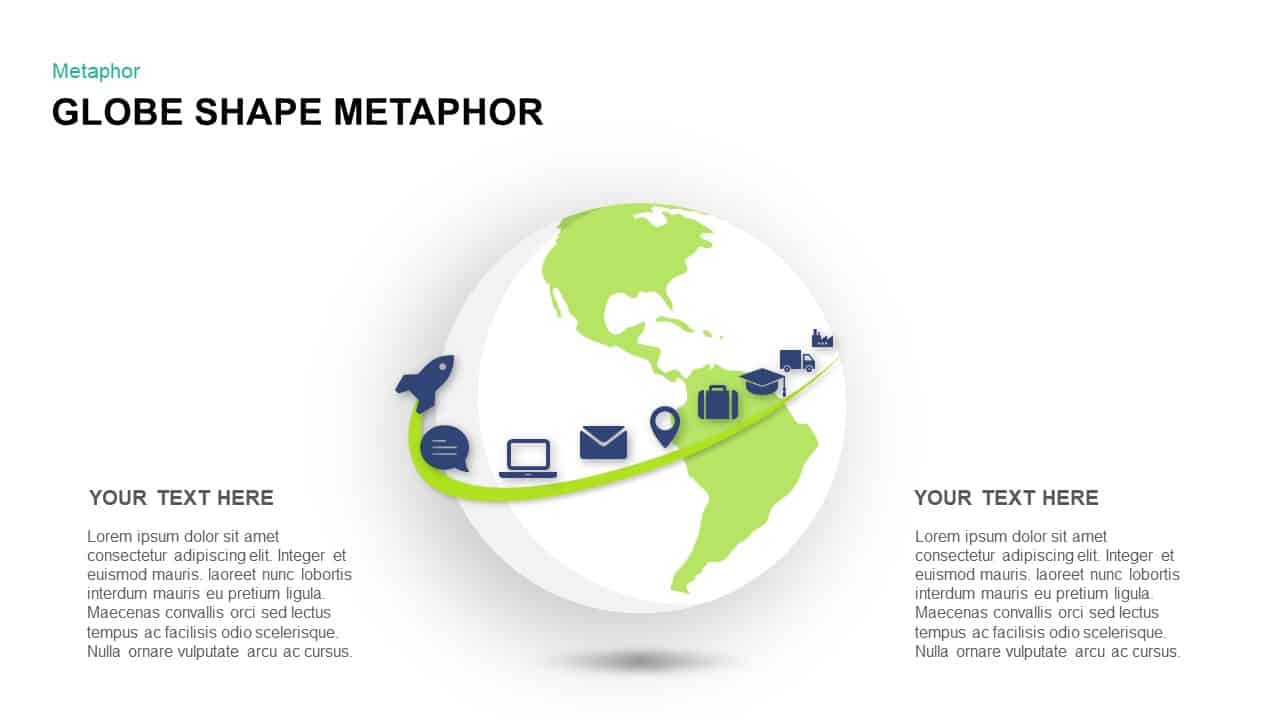
Global Business Pathway Metaphor Template for PowerPoint & Google Slides
Opportunities Challenges

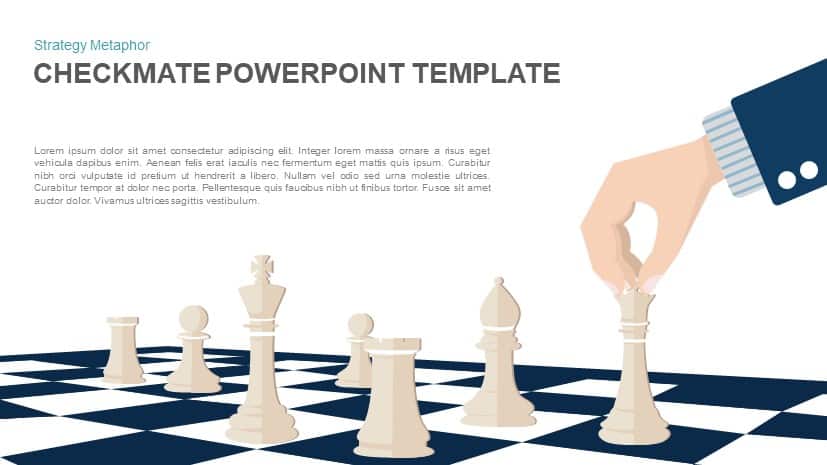
Checkmate Strategy Chess Metaphor Template for PowerPoint & Google Slides
Opportunities Challenges
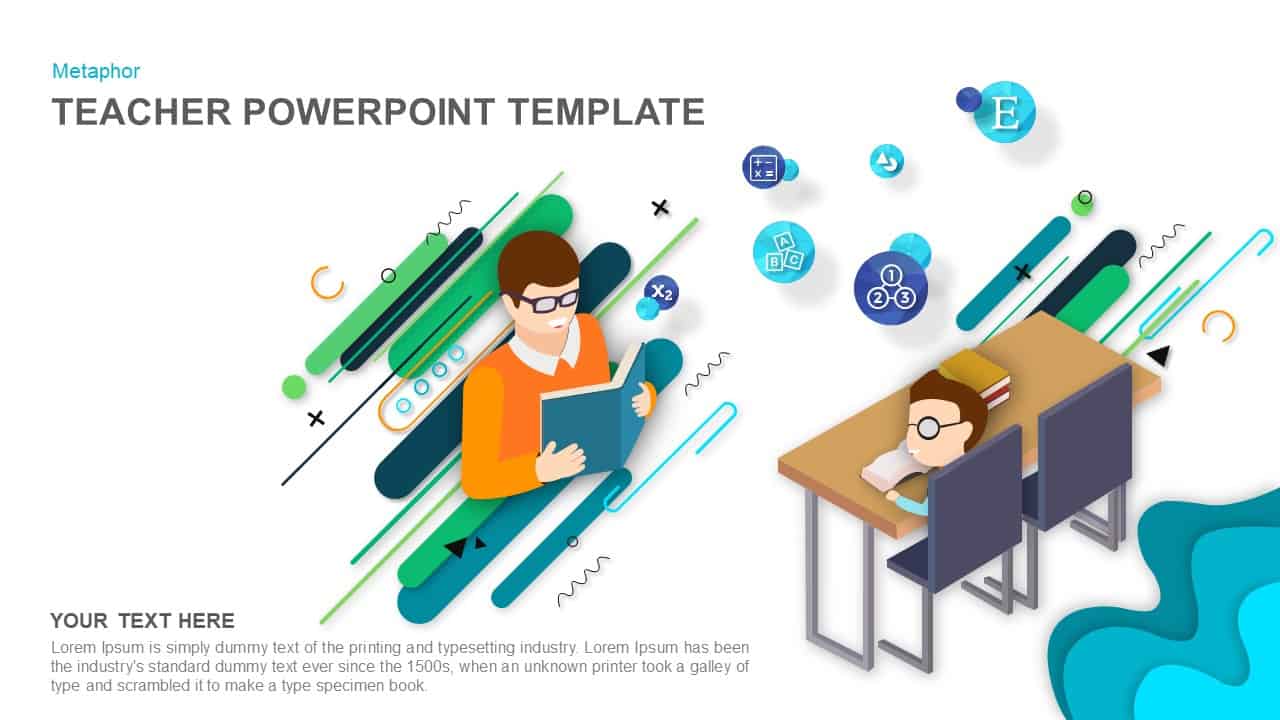
Teacher Illustration Metaphor Slide Template for PowerPoint & Google Slides
Process
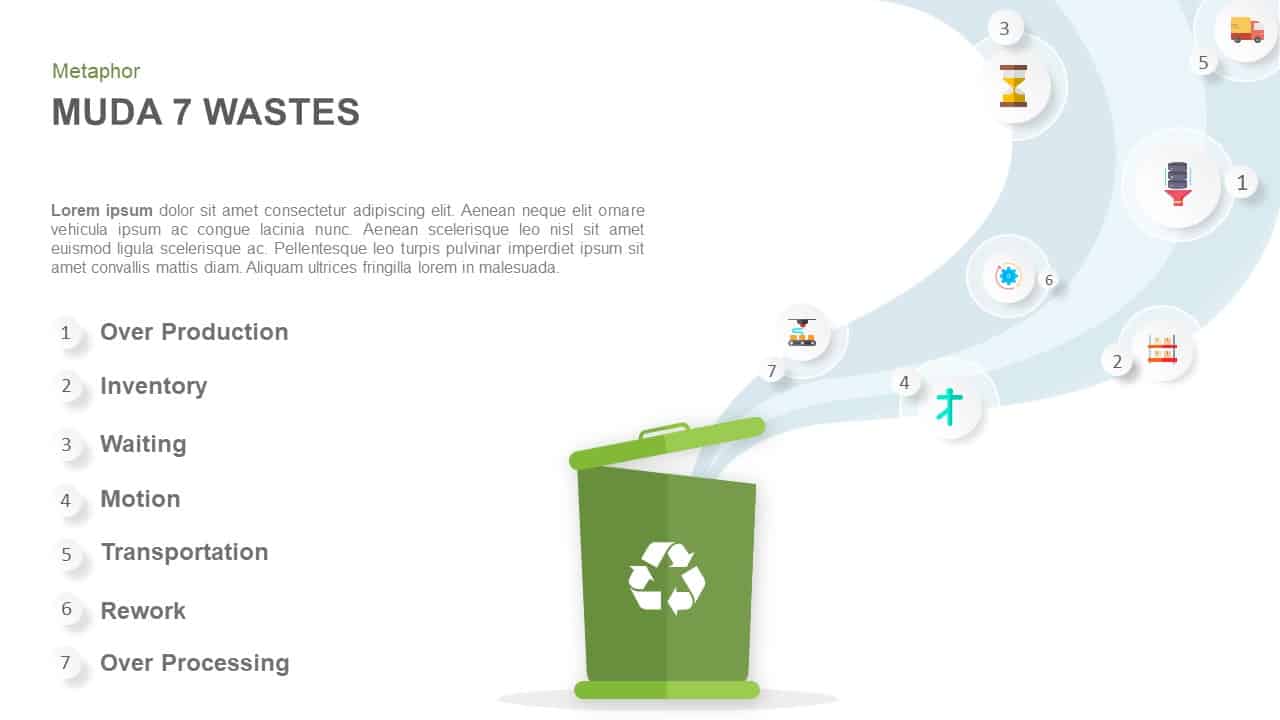
Muda 7 Wastes Recycling Bin Metaphor Template for PowerPoint & Google Slides
Process

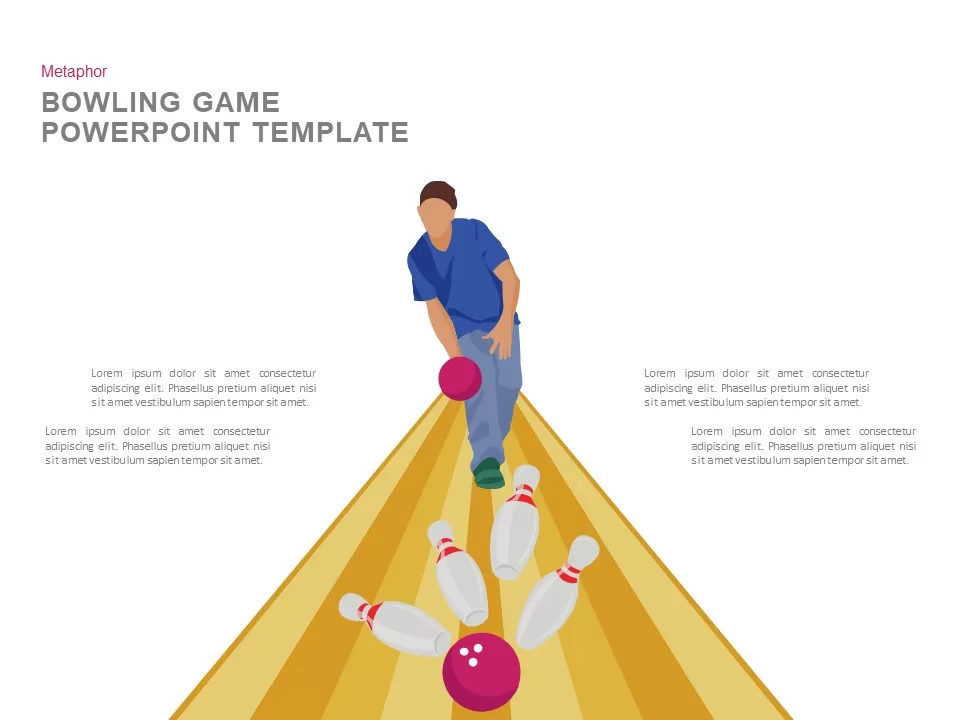
Bowling Game Illustration Metaphor Template for PowerPoint & Google Slides
Process
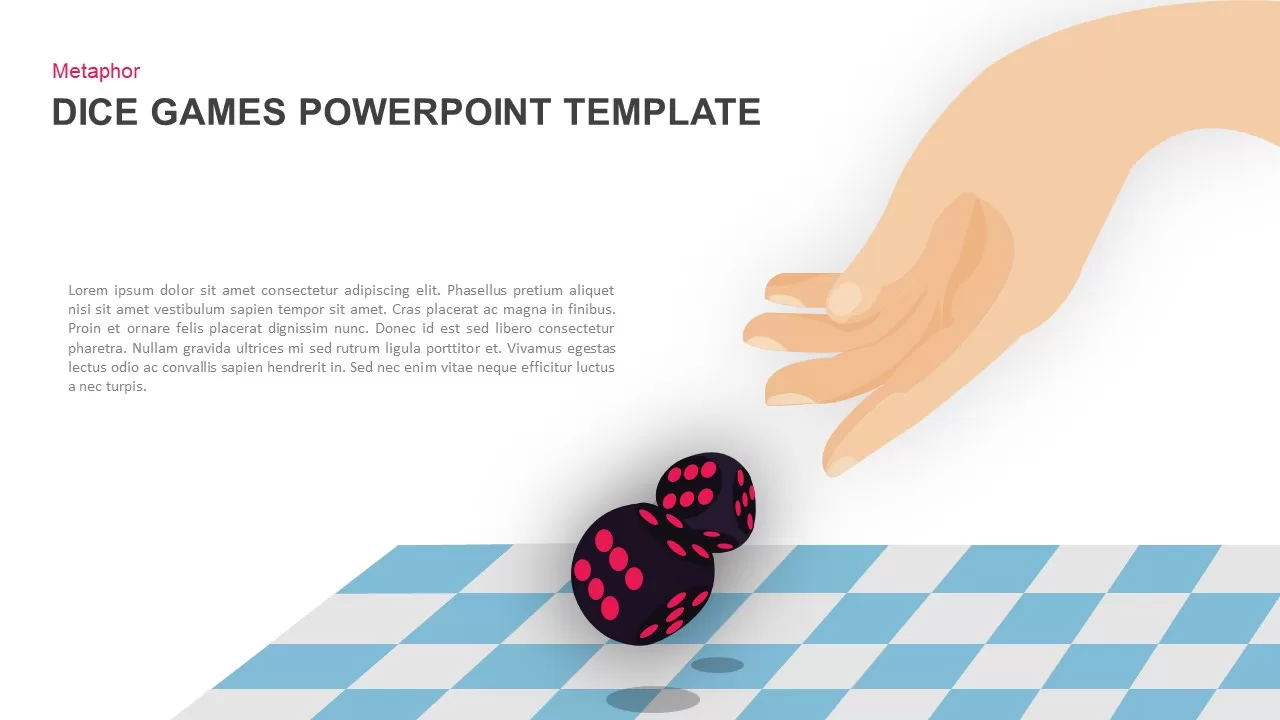
Dice Game Throwing Metaphor Slide Template for PowerPoint & Google Slides
Process
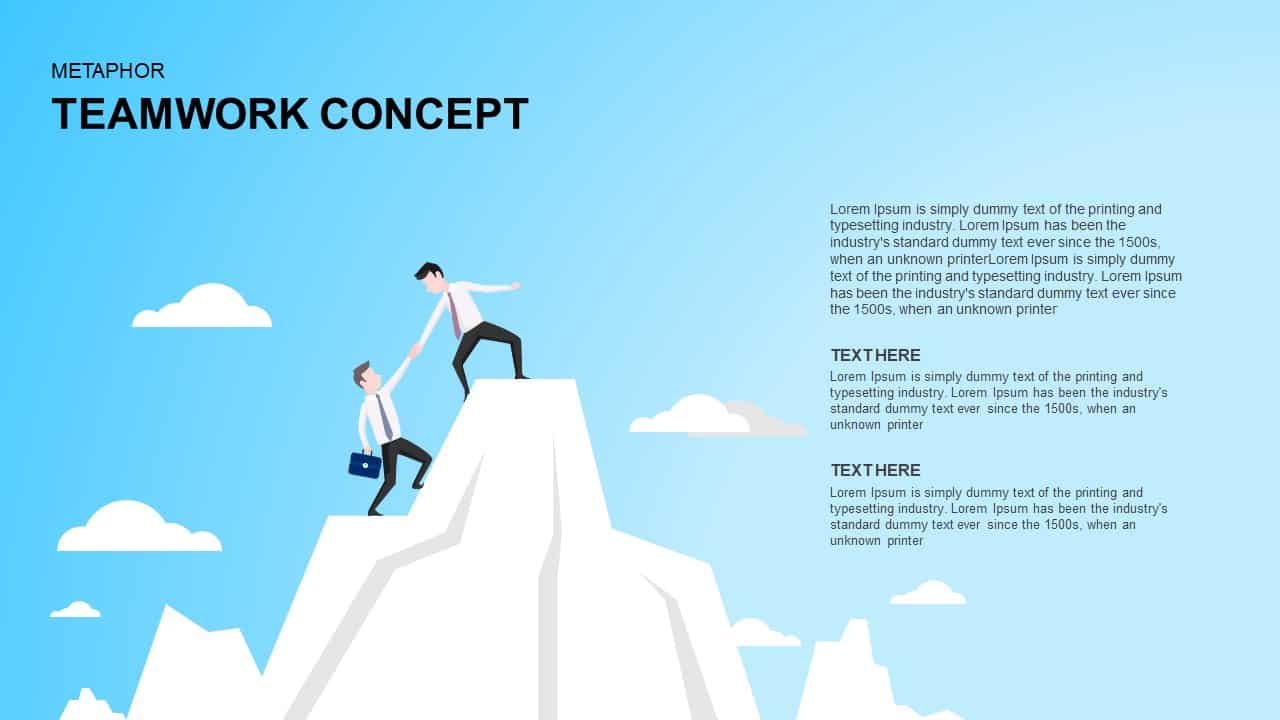
Teamwork Concept Metaphor Template for PowerPoint & Google Slides
Leadership
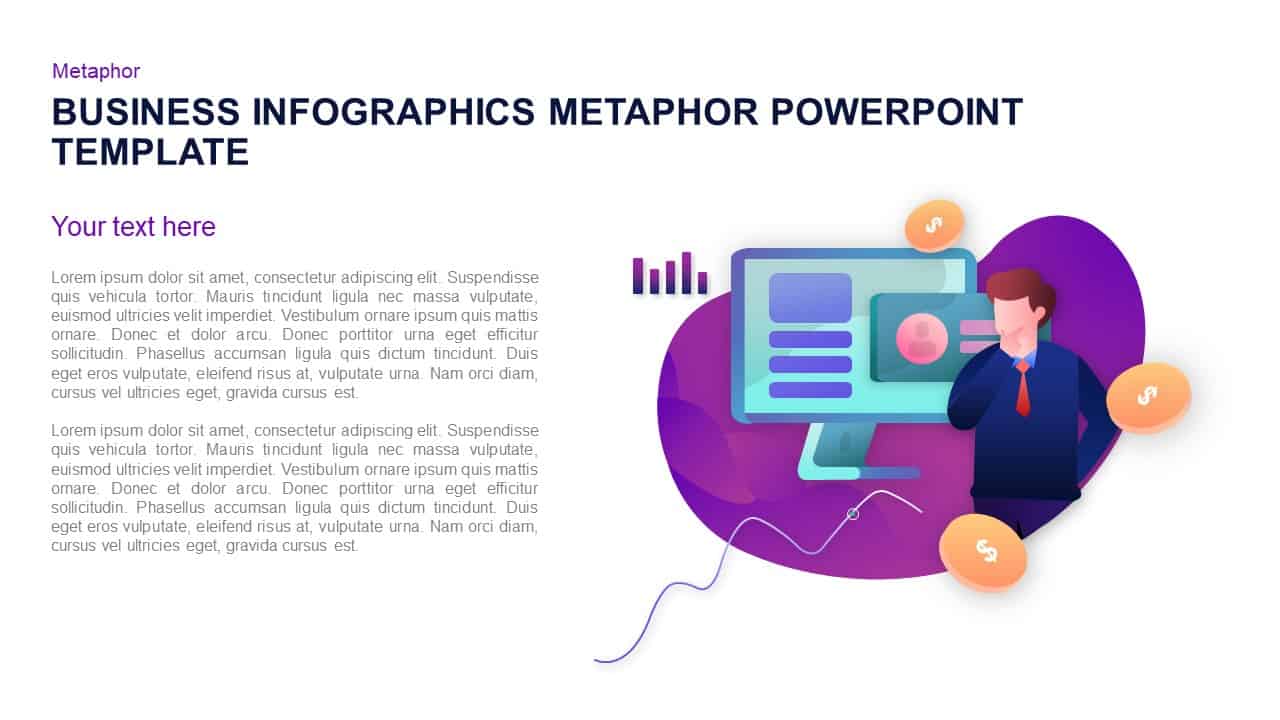
Business Growth Infographic Metaphor Template for PowerPoint & Google Slides
Revenue
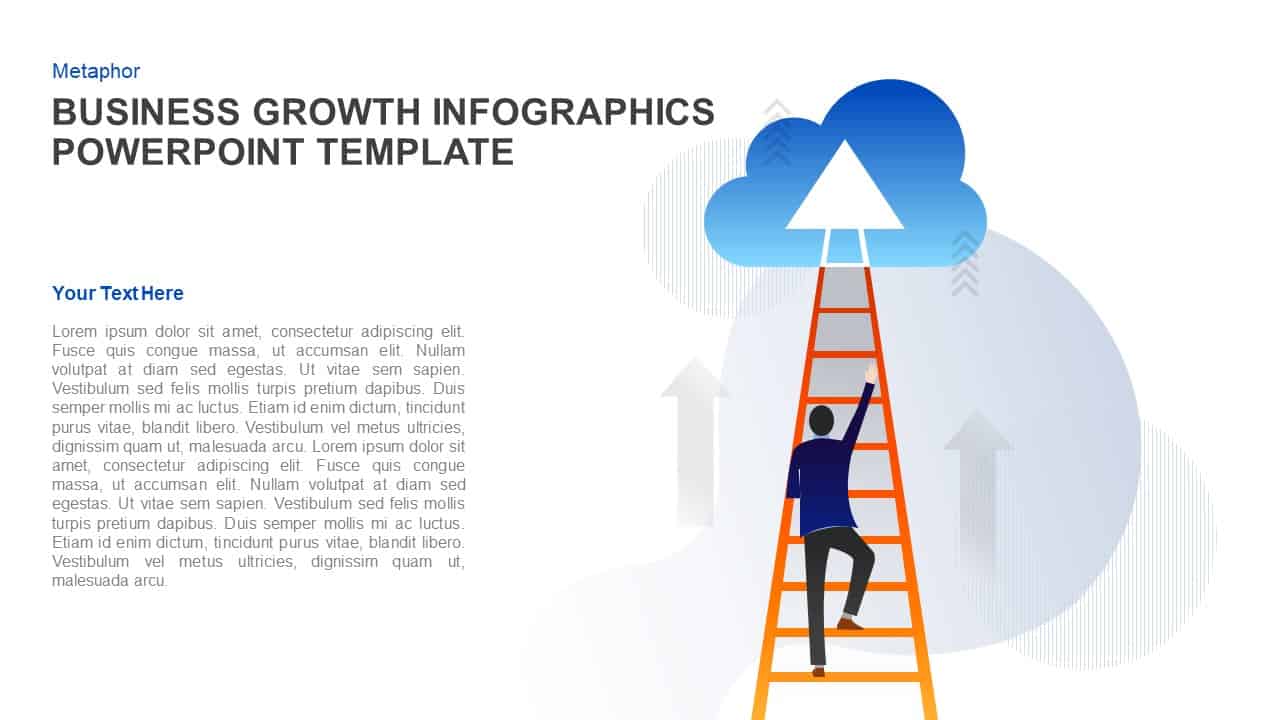
Business Growth Ladder to Cloud Metaphor Template for PowerPoint & Google Slides
Vision and Mission
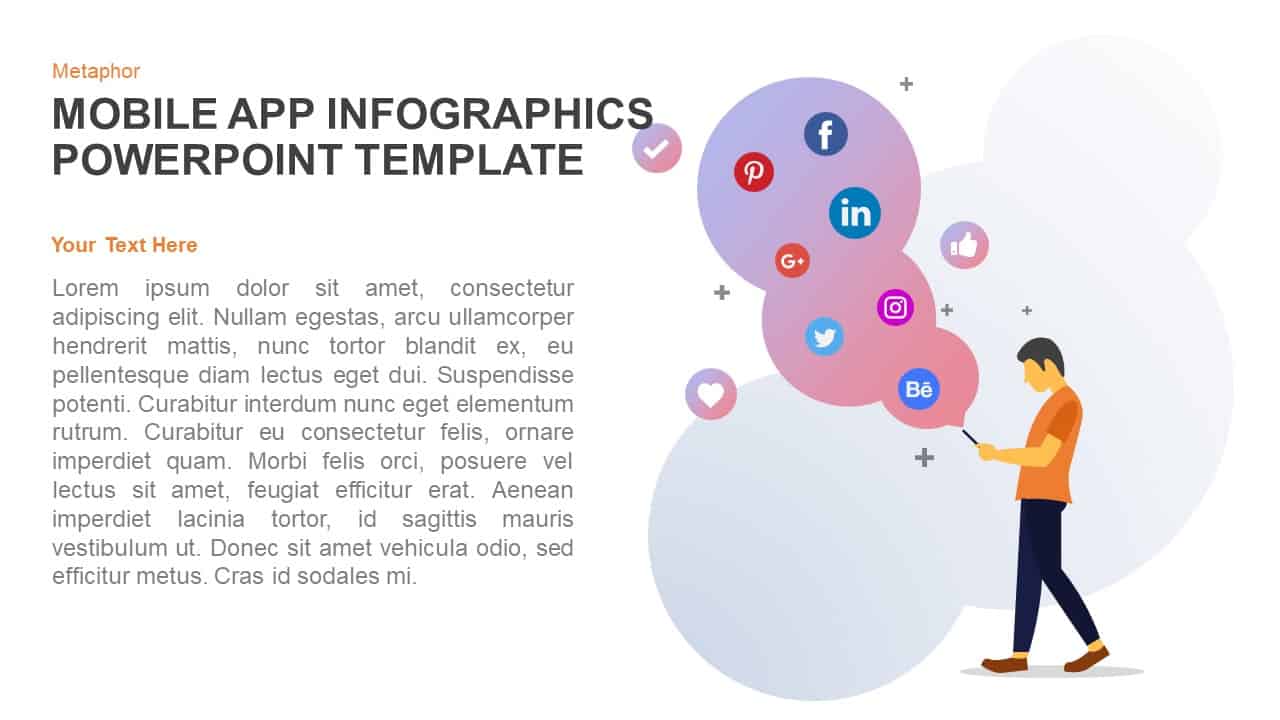
Mobile App Social Media Metaphor Template for PowerPoint & Google Slides
Infographics
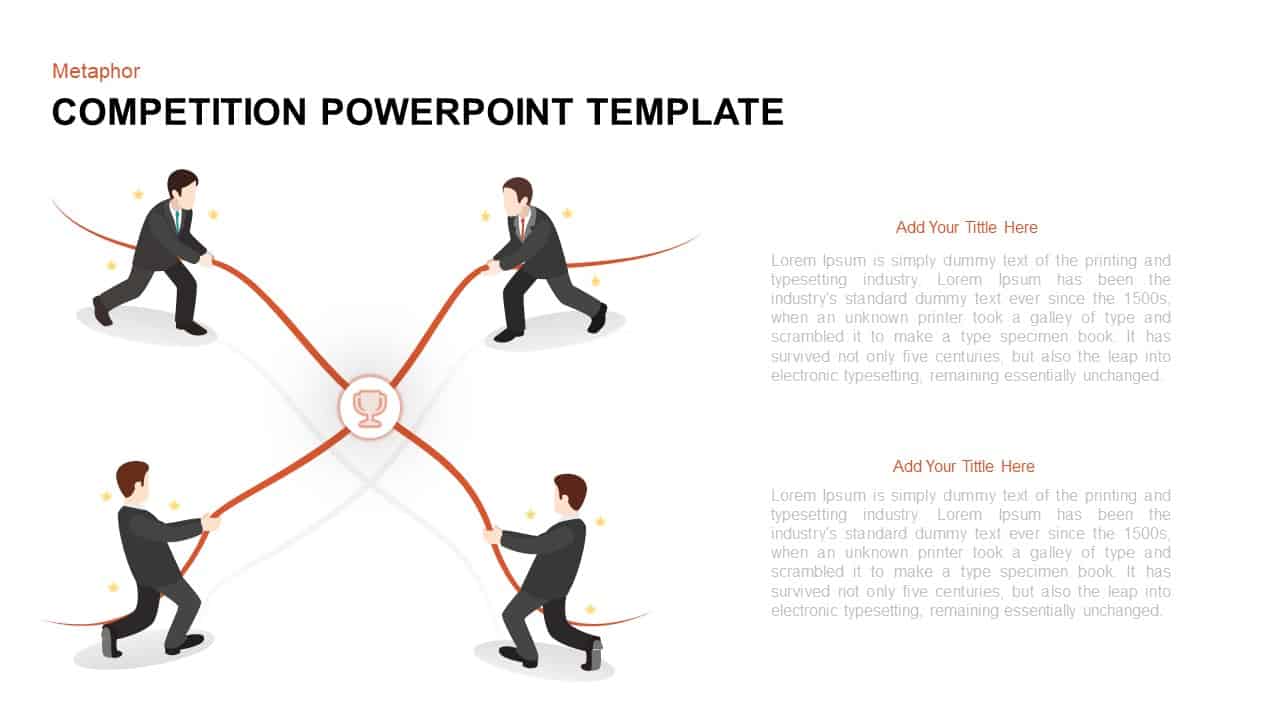
Competitive Tug-of-War Metaphor Template for PowerPoint & Google Slides
Business Strategy
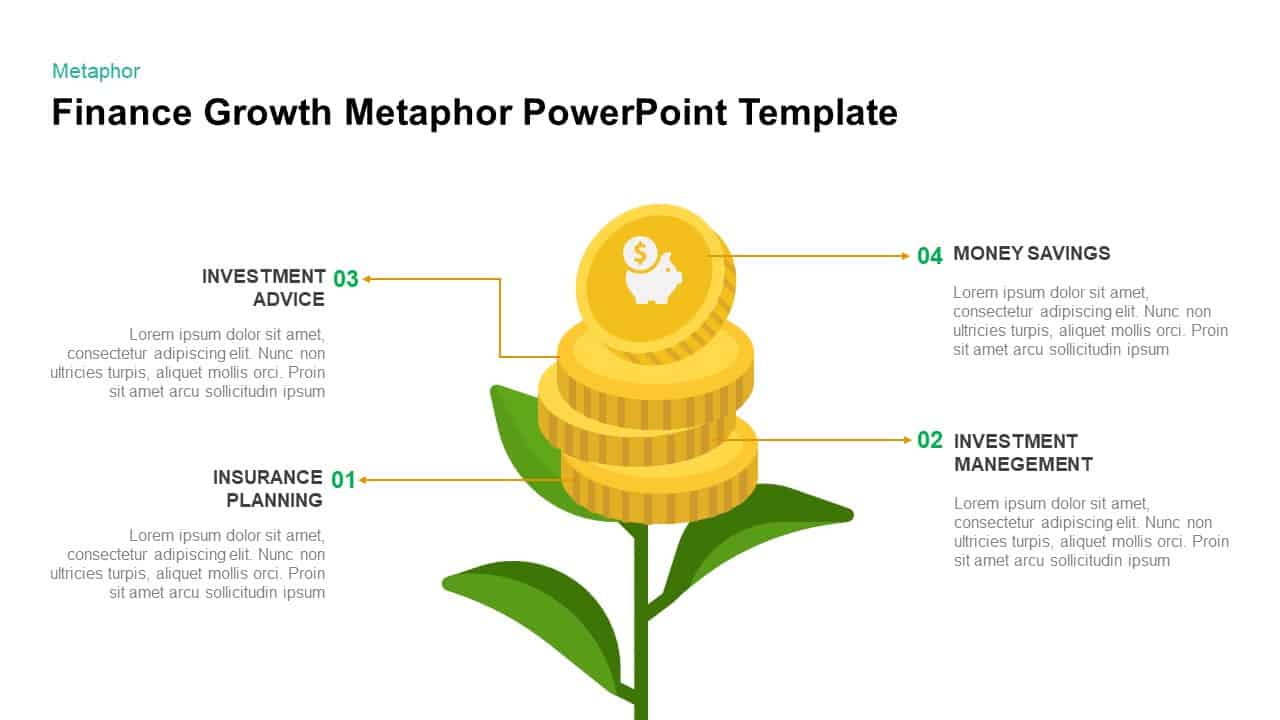
Finance Growth Plant Metaphor Slide Template for PowerPoint & Google Slides
Finance
Collaborative Teamwork Metaphor Illustration Template for PowerPoint & Google Slides
Leadership
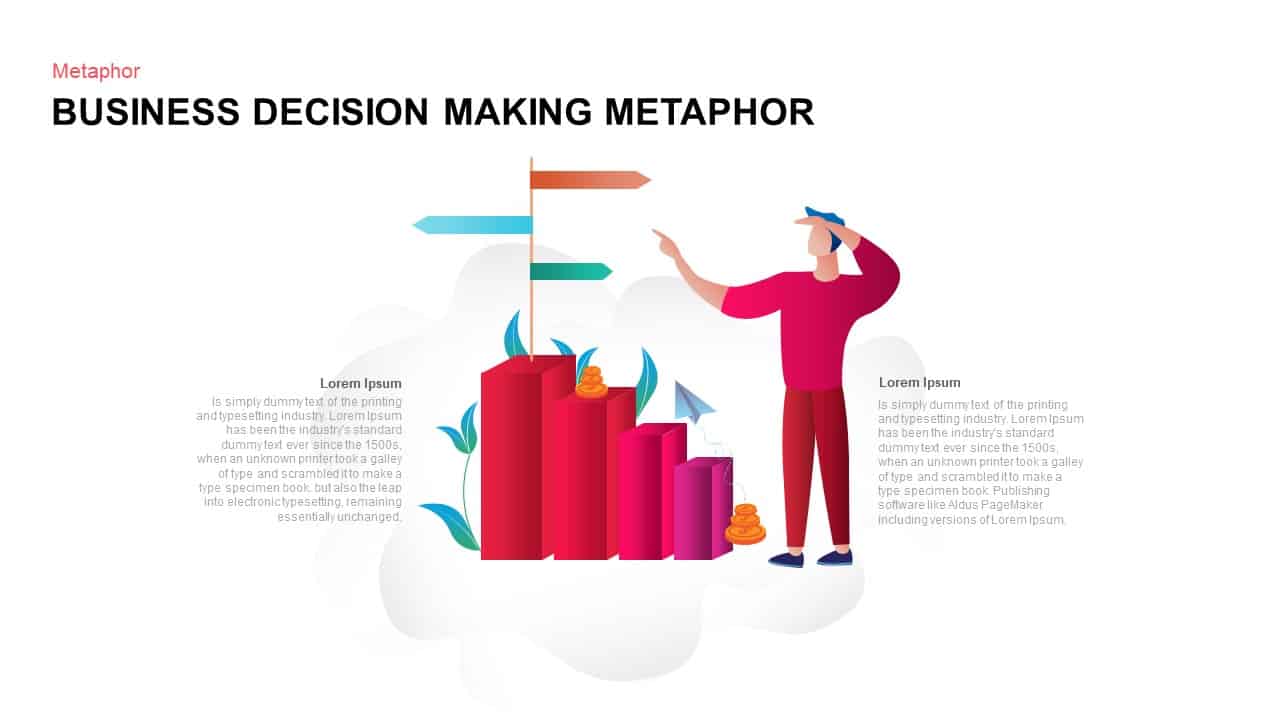
Business Decision Making Metaphor Template for PowerPoint & Google Slides
Arrow
Social Media Metaphor Illustration Template for PowerPoint & Google Slides
Digital Marketing
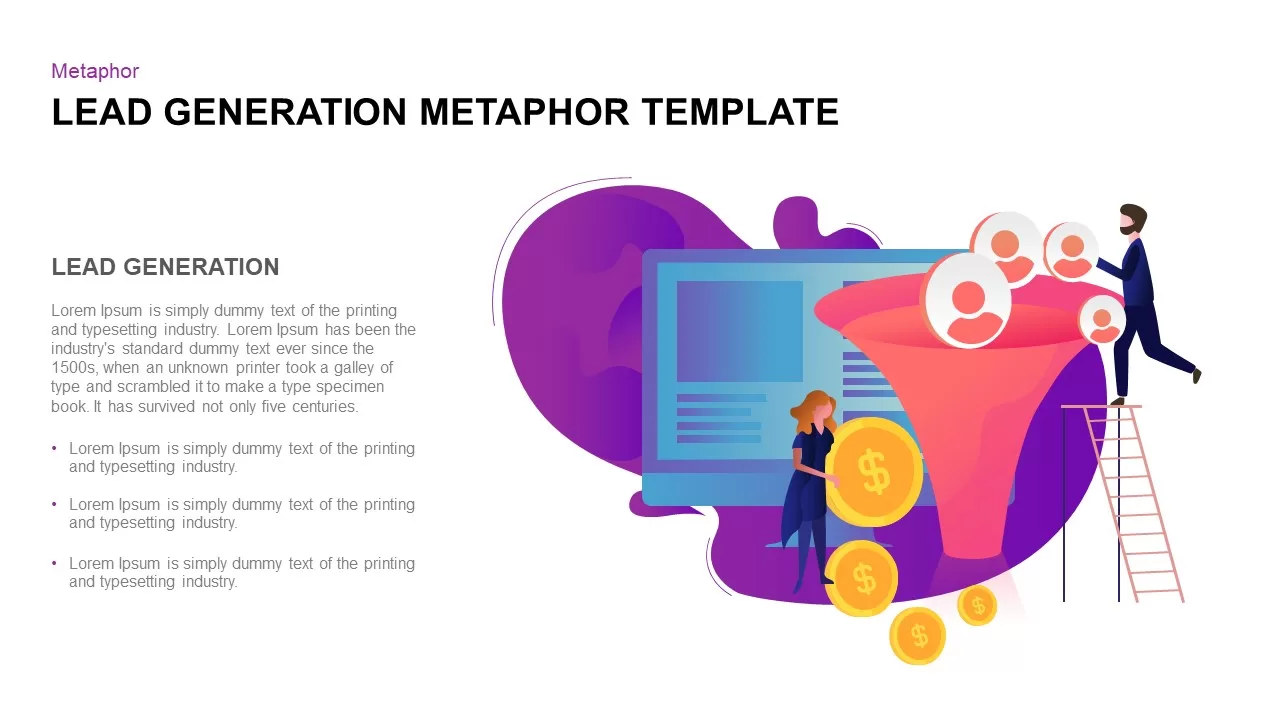
Lead Generation Funnel Metaphor Template for PowerPoint & Google Slides
Marketing Funnel
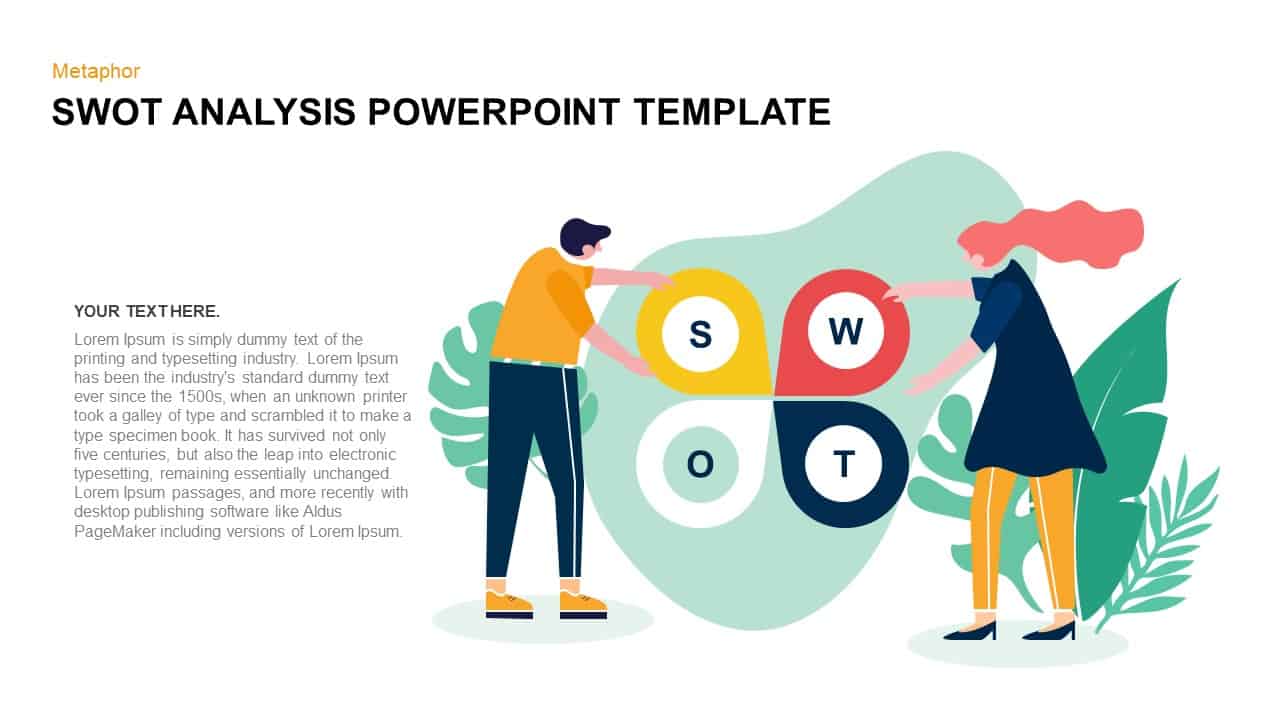
SWOT Analysis Metaphor Illustration Template for PowerPoint & Google Slides
SWOT
Vibrant Digital Marketing Metaphor Template for PowerPoint & Google Slides
Advertising
Collaborative Teamwork Metaphor Slide Template for PowerPoint & Google Slides
Our Team
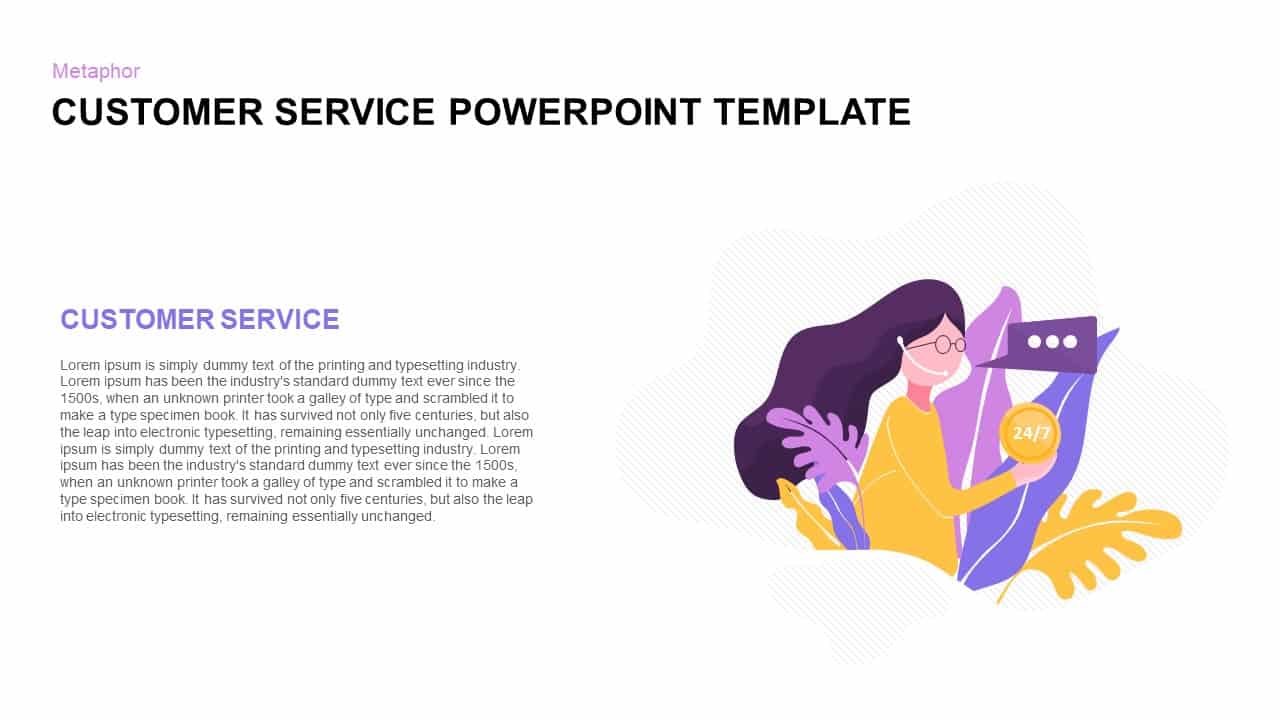
Customer Service Metaphor Infographic Template for PowerPoint & Google Slides
Customer Experience
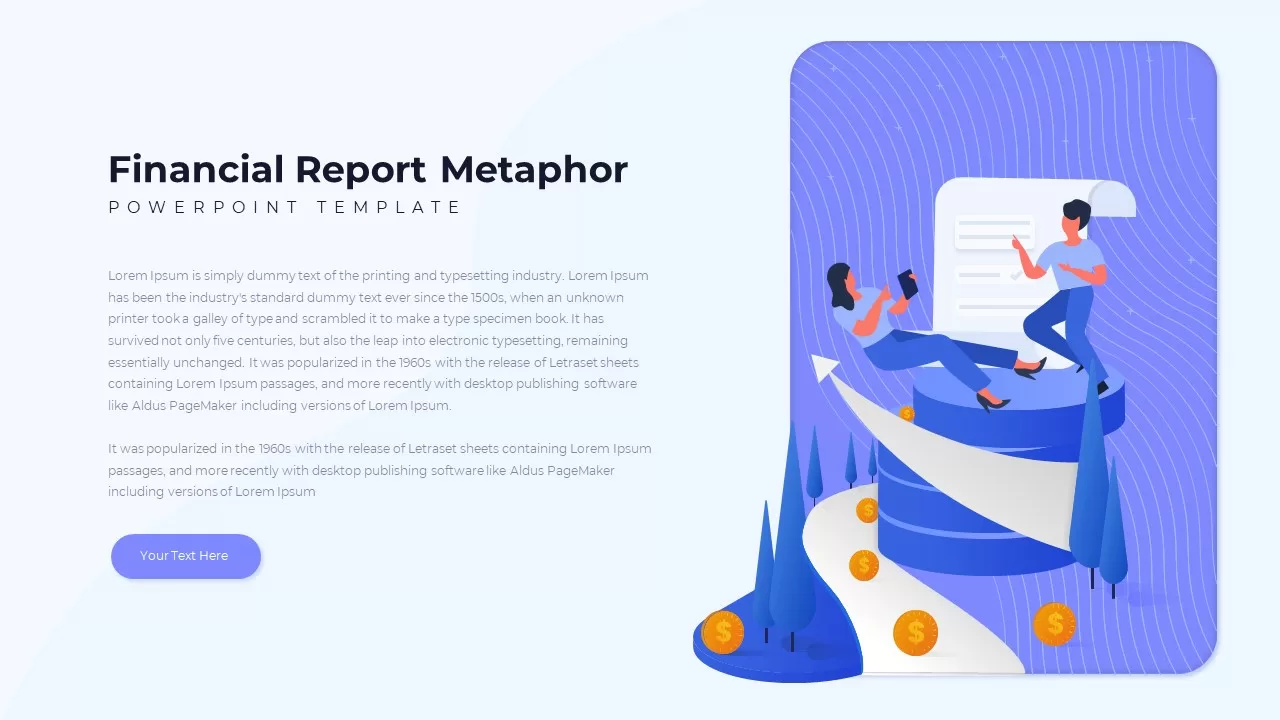
Financial Report Metaphor Illustration Template for PowerPoint & Google Slides
Finance
Business Growth Metaphor Chart Template for PowerPoint & Google Slides
Business
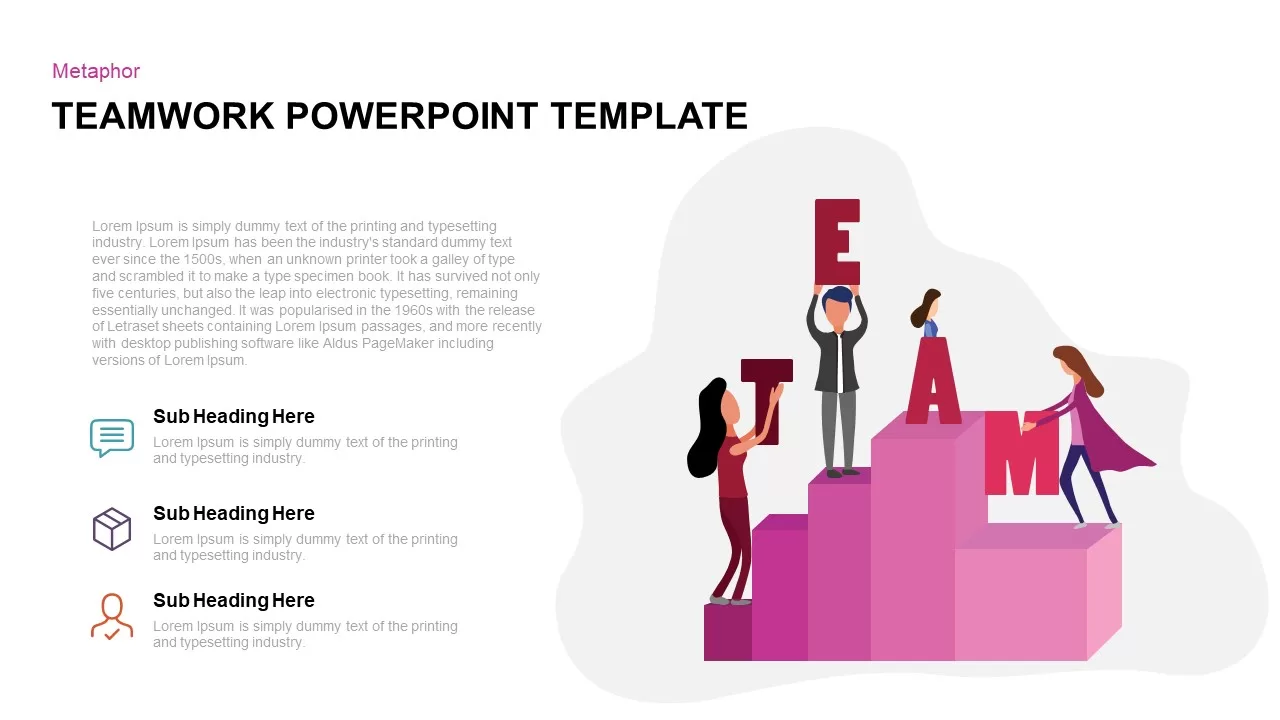
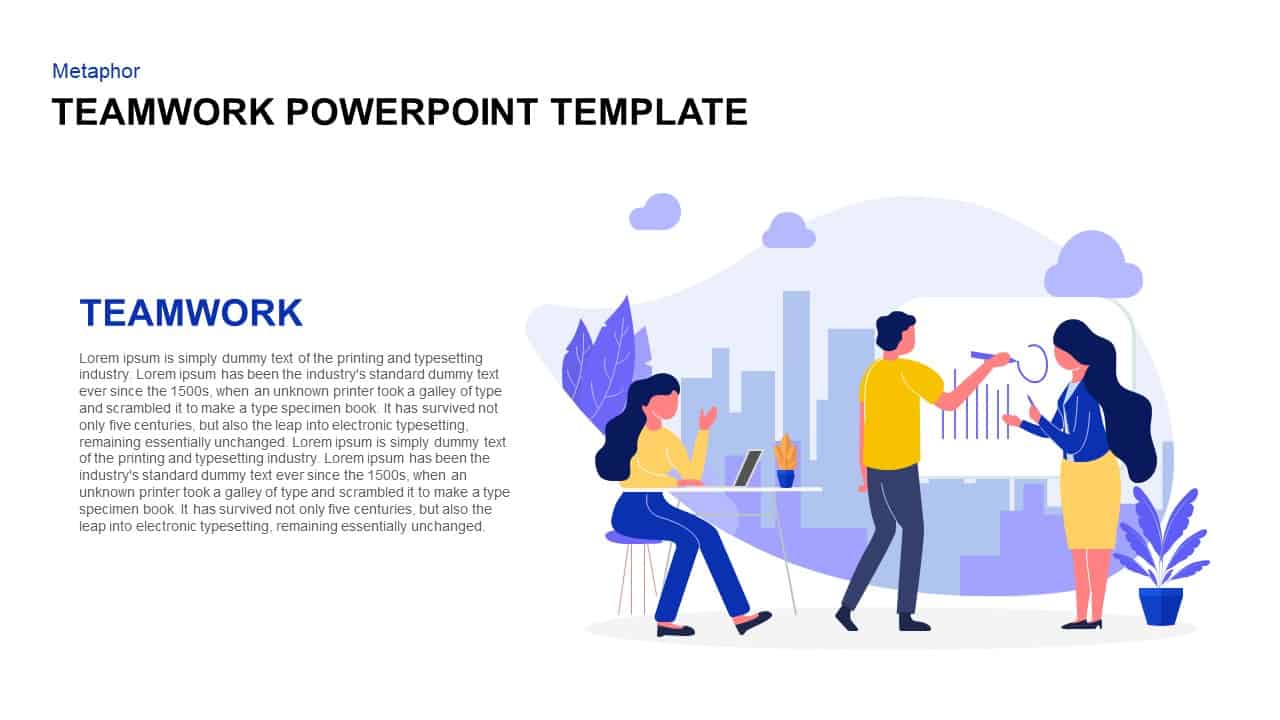
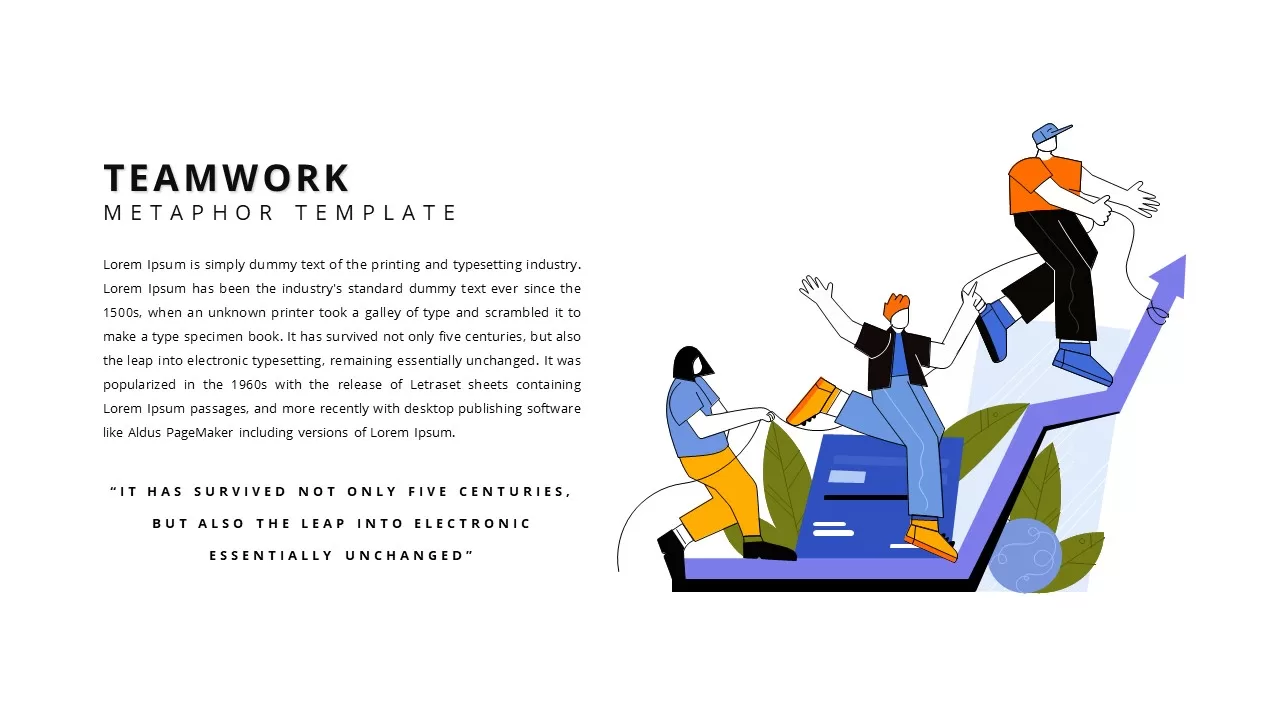
Teamwork Metaphor Illustration Template for PowerPoint & Google Slides
Leadership
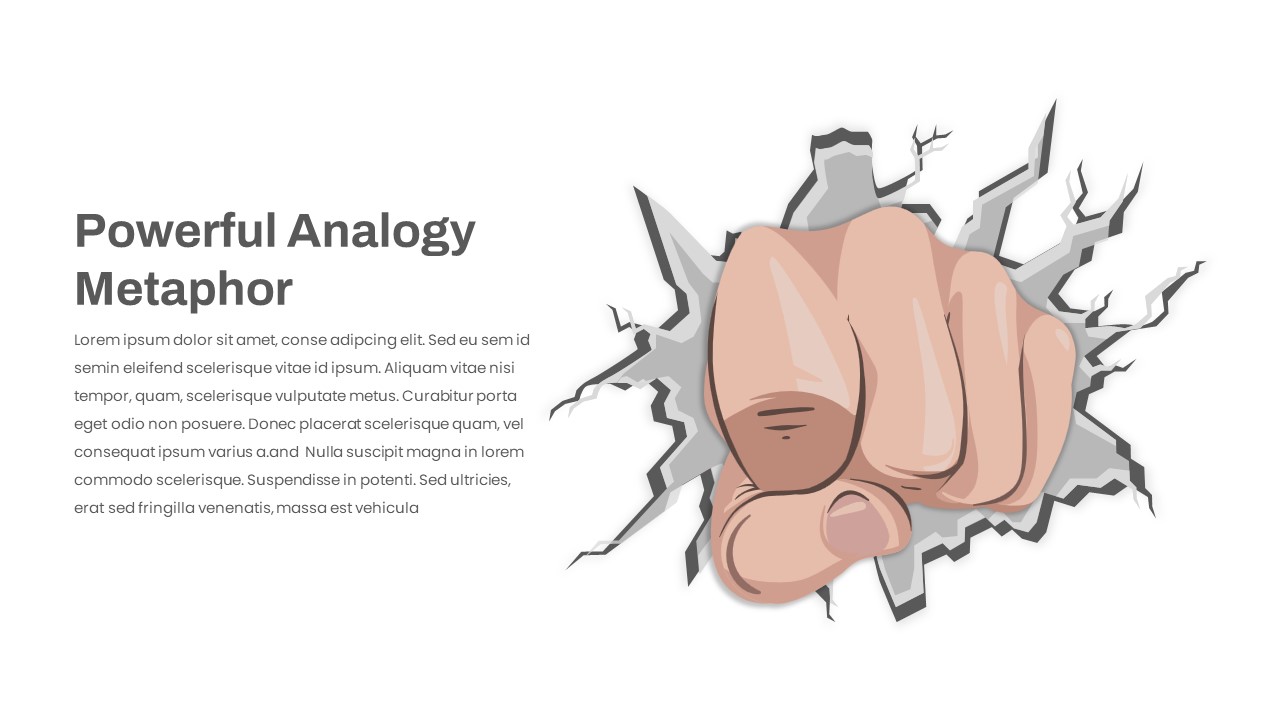
Creative Power Analogy Metaphor Slide Template for PowerPoint & Google Slides
Leadership
Powerful Visual Metaphor Analogy Slide Template for PowerPoint & Google Slides
Opportunities Challenges
Relay Race Metaphor for PowerPoint & Google Slides
Accomplishment
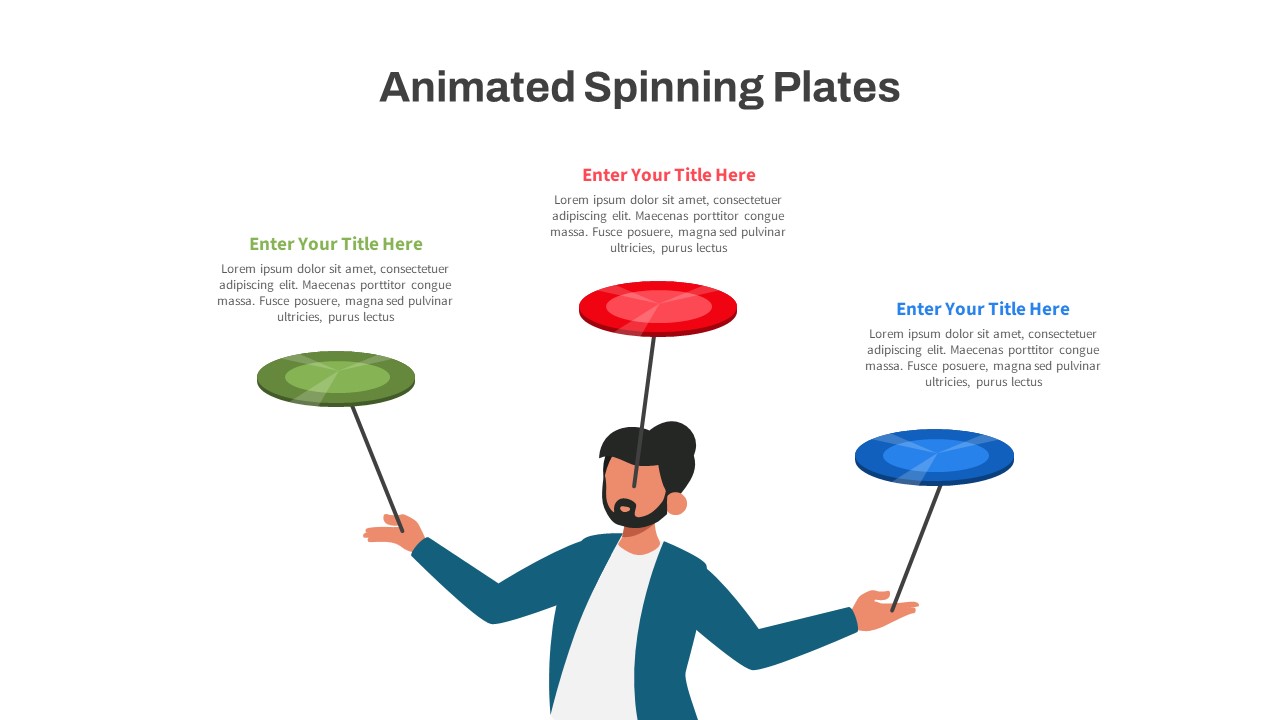
Animated Spinning Plates Metaphor Slide for PowerPoint & Google Slides
Infographics
Service Zoom Feature Slides Comparison template for PowerPoint & Google Slides
Process
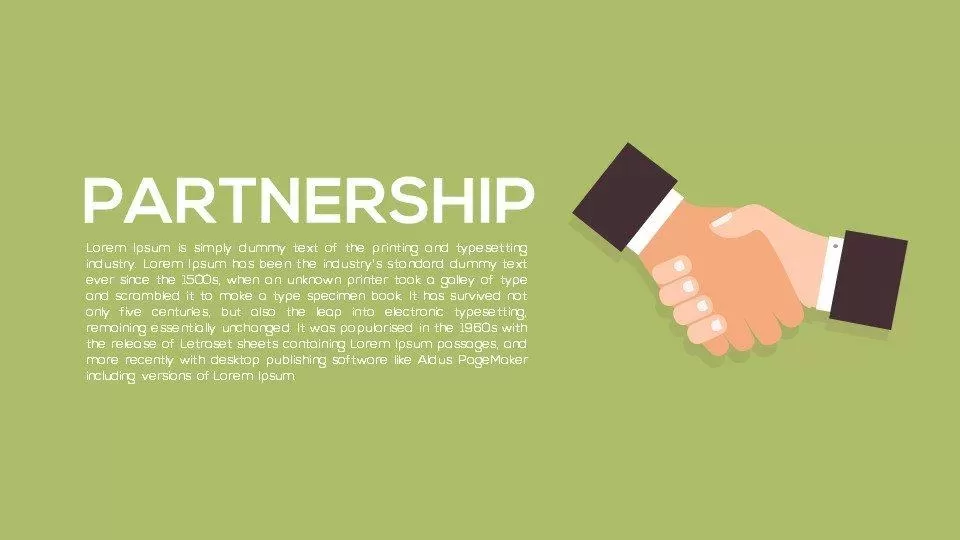
Metaphor Partnership PowerPoint Template and Keynote Template
Opportunities Challenges
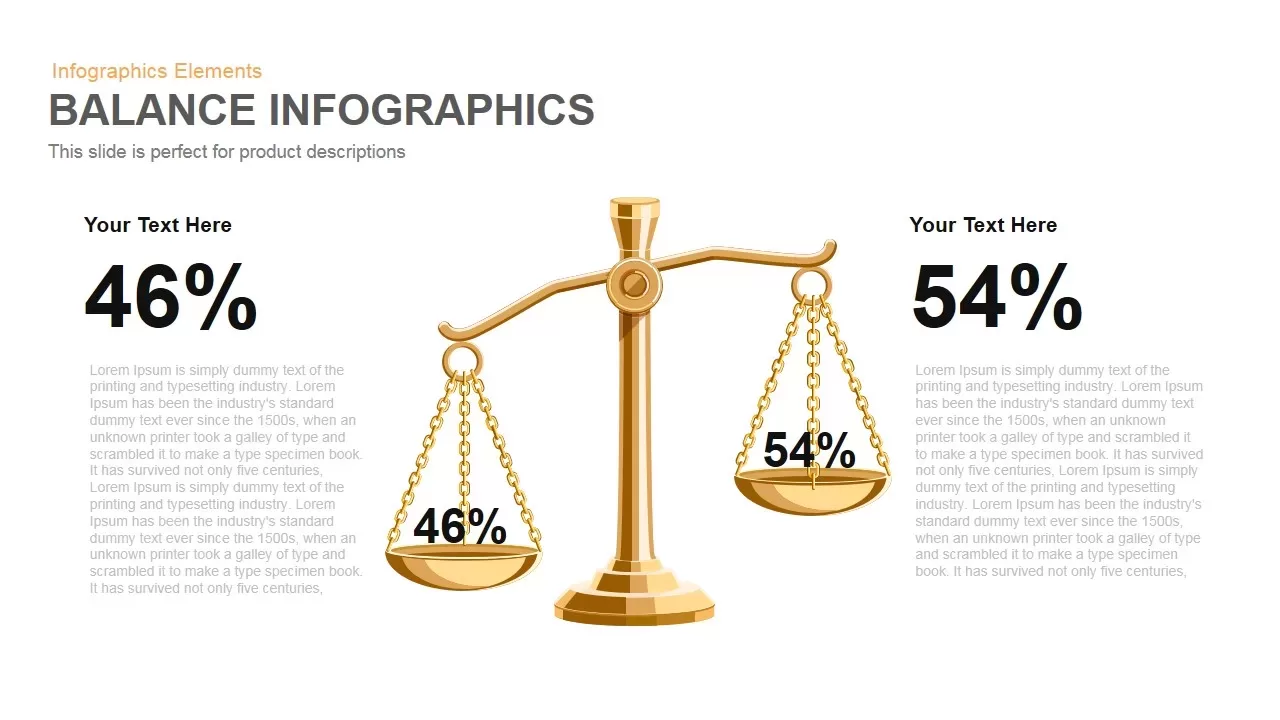
Gold Scales Balance Comparison Template for PowerPoint & Google Slides
Comparison
Comparison Bar Chart template for PowerPoint & Google Slides
Comparison Chart

A/B Testing Comparison Infographic template for PowerPoint & Google Slides
Comparison
Interactive Pricing Plan Comparison Template for PowerPoint & Google Slides
Comparison
Generations Comparison Infographic Template for PowerPoint & Google Slides
Timeline
Dynamic Benchmarking Comparison Chart Template for PowerPoint & Google Slides
Comparison Chart
Conflict Infographics Comparison Template for PowerPoint & Google Slides
Infographics
Clustered Bar Chart Comparison Template for PowerPoint & Google Slides
Bar/Column
Regional Revenue Comparison Overview Template for PowerPoint & Google Slides
Comparison
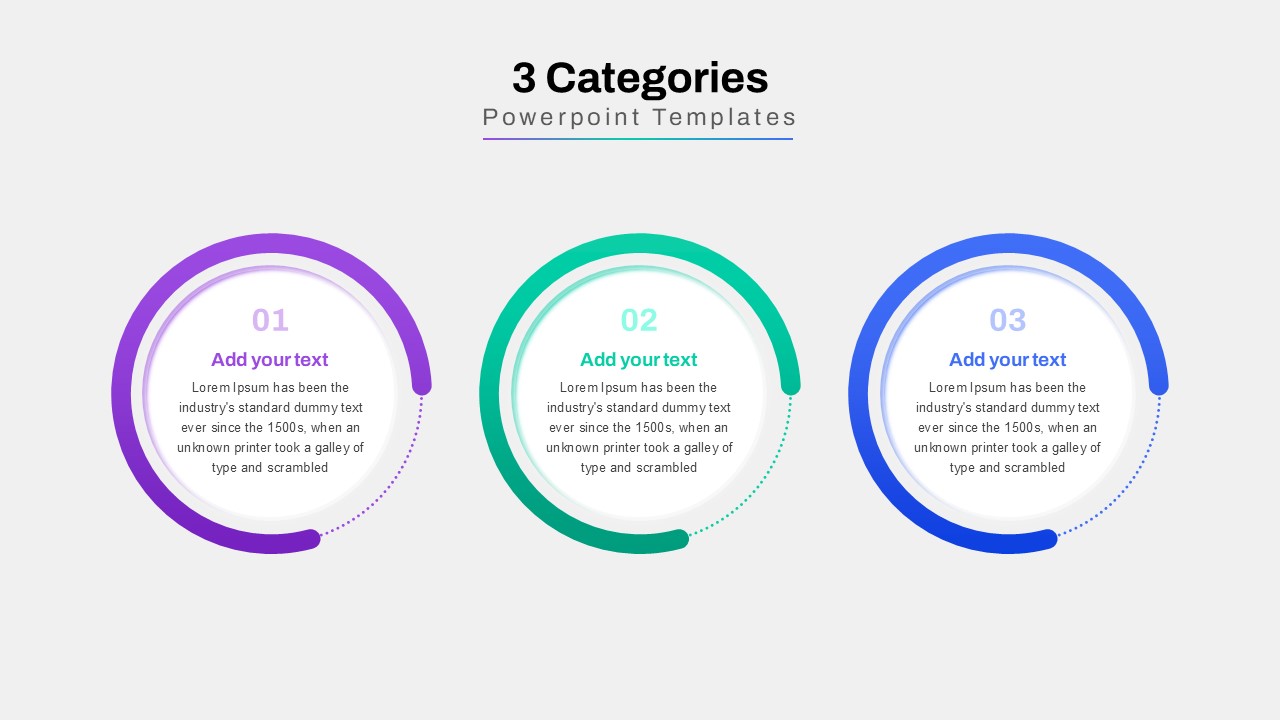
Three-Category Comparison Template for PowerPoint & Google Slides
Comparison
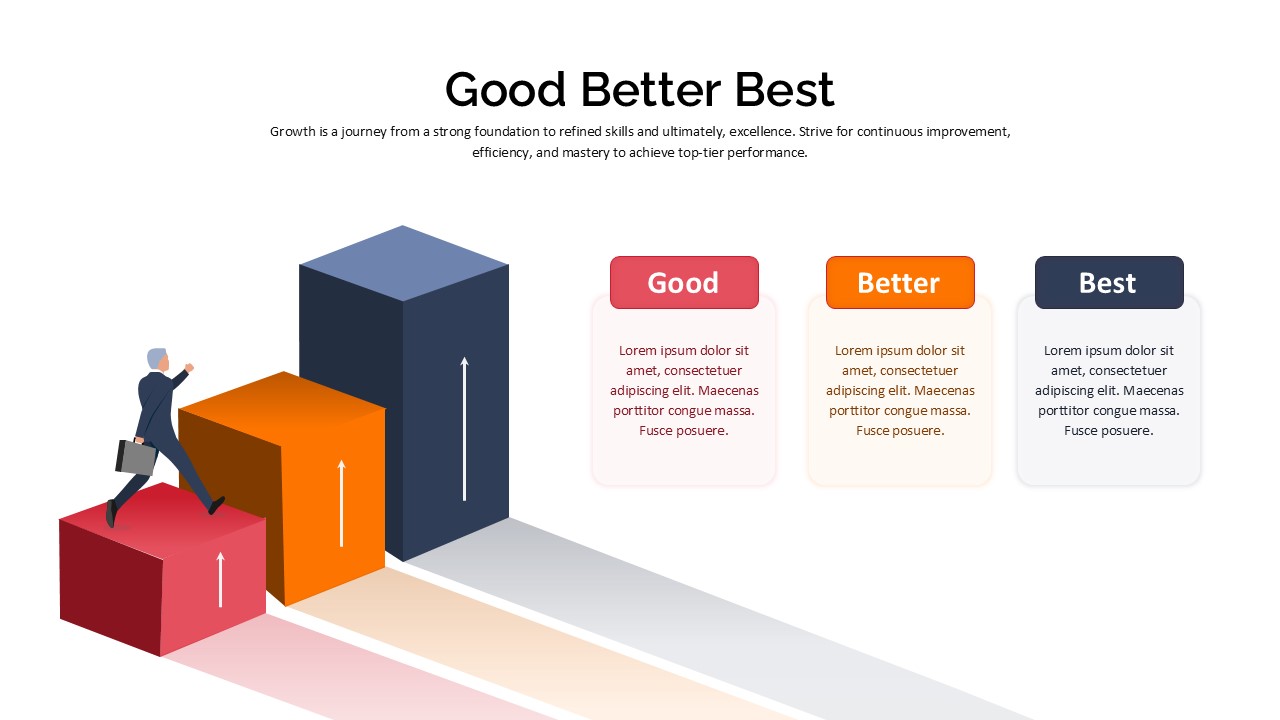
Good Better Best Comparison template for PowerPoint & Google Slides
Comparison
Integrative Thinking Comparison Diagram Template for PowerPoint & Google Slides
Comparison
Market Share Comparison Diagram Template for PowerPoint & Google Slides
Comparison Chart
Sales Growth Comparison Chart & Table Template for PowerPoint & Google Slides
Bar/Column
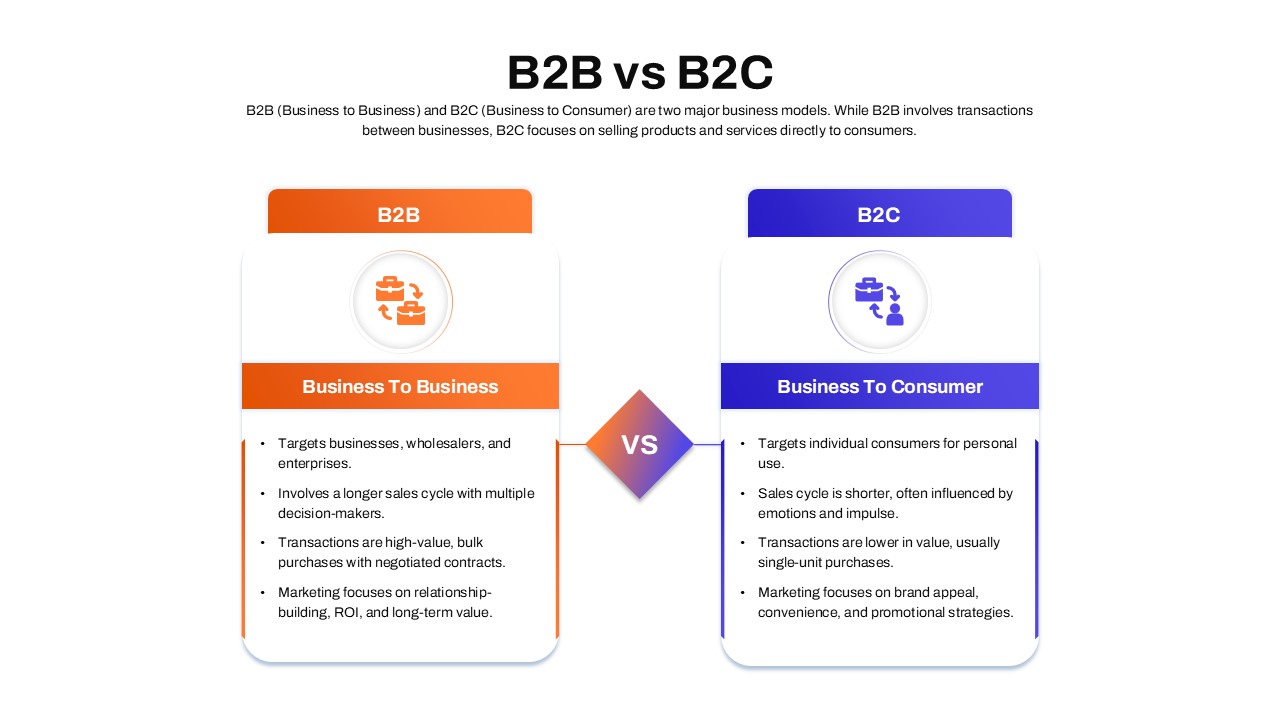
B2B vs B2C Comparison template for PowerPoint & Google Slides
Business Models
Attribution Models Comparison Diagram Template for PowerPoint & Google Slides
Comparison
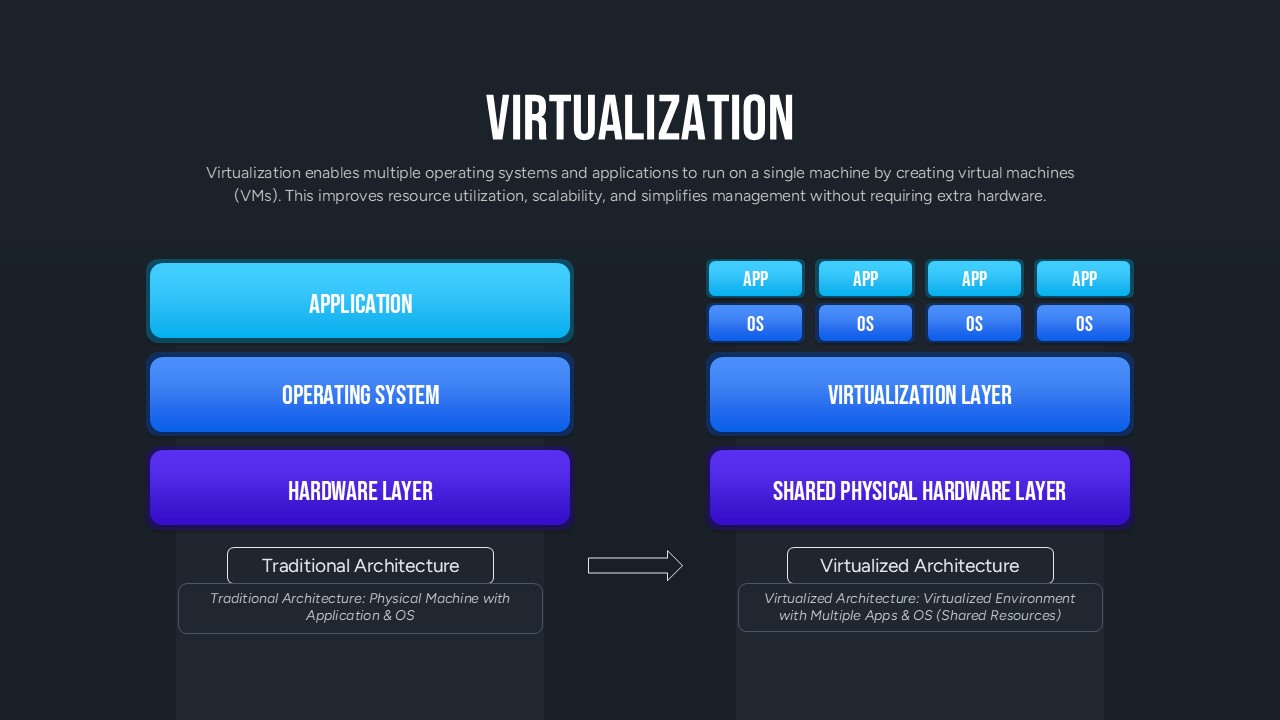
Virtualization Architecture Comparison Template for PowerPoint & Google Slides
Comparison Chart
Year-over-Year Performance Comparison Template for PowerPoint & Google Slides
Comparison Chart